Article

Seismic Soil Characterization to Estimate Site Effects Induced by Near-Fault Earthquakes: The Case Study of Pizzoli (Central Italy) during the Mw 6.7 2 February 1703, Earthquake

1
Department of Civil, Construction-Architectural and Environmental Engineering, University of L’Aquila, Piazzale Ernesto Pontieri 1, Monteluco di Roio, 67100 L’Aquila, Italy
2
Department of Geological Survey of Italy, Institute for Environmental Protection and Research—ISPRA Via Vitaliano Brancati 48, 00144 Rome, Italy
*
Author to whom correspondence should be addressed.
Geosciences 2022, 12(1), 2; https://doi.org/10.3390/geosciences12010002
Submission received: 30 July 2021 / Revised: 7 December 2021 / Accepted: 17 December 2021 / Published: 21 December 2021

Abstract

:
Many of the urban settlements in Central Italy are placed nearby active faults and, consequently, the ground motion evaluation and seismic site effects under near-fault earthquakes are noteworthy issues to be investigated. This paper presents the results of site investigations, the seismic site characterization, and the local seismic response for assessing the effects induced by the Mw 6.7 2 February 1703, near-fault earthquake at the Madonna delle Fornaci site (Pizzoli, Central Italy) in which notable ground failure phenomena were observed, as witnessed by several coeval sources. Even though recent papers described these phenomena, the geological characteristics of the site and the failure mechanism have never been assessed through in-situ investigations and numerical modeling. Within a project concerning the assessment of soil liquefaction potential and co-seismic ground failure, deep and shallow continuous core drilling, geophysical investigations and in-hole tests have been carried out. Subsequently, the geotechnical model has been defined and the numerical quantification of the different hypotheses of failure mechanisms has been evaluated. Analyses showed that liquefaction did not occur, and the excess pore water pressure induced by the shaking was not the source of the ground failure. Therefore, it was hypothesized that the sinkhole was likely caused by earthquake-induced gas eruption.

1. Introduction

Many of the urban settlements in Central Italy are placed nearby active faults and, consequently, the ground motion evaluation and seismic site effects on the environment (among which surface fault rupture, landslide, liquefaction, ground rupture, sinkhole formation, etc.) under near-fault earthquakes are noteworthy issues to be investigated [1,2,3,4,5,6,7,8].
Regarding the ground failure, the widespread sinkholes generated during the recent Mw 6.4 29 December 2020, Petrinja (Croatia) earthquake, highlighted the importance to study the sinkhole formation caused by near-fault earthquakes [9,10,11]. A total of 139 sinkholes surrounding Borojevići and Mečenčani villages (Croatia) were recorded, collapsed approximately during the three months after the main shock, but the mechanism of collapse remains unknown, as well as the role of time and seismic load, hydrology, and seismicity-related pore pressure fluctuations as possible triggers [12].
The sinkhole is a subcircular collapse cavity or surface depression with different origins mainly related to, but not exclusive of, karst areas and often characterized by sudden failure [13,14]. The genesis of sinkhole can be roughly due to anthropic activity (mine or urban settlement), karst processes (rock dissolution or cave collapse), erosion of the river bank caused by turbulence of the river flowing, and deep piping phenomena [15,16,17,18]. Further, another significant triggering factor is the ascent of aggressive geogases, such as CO2, and mineralized fluids through deep and buried faults, which may increase the carbonate dissolution and modify the texture of the bedrock or the sediment cover [19]. This latter factor can be accounted for in many seismic areas, where the sinkholes are quite widespread and show clustering along the main active faults considering that, within the active fault plane, deep-seated fluids can uprise, thus reaching the ground surface or being trapped in shallow zones [20,21,22,23,24,25,26,27]. Above all in Central-Southern Italy, sinkholes are not a rare phenomenon triggered by earthquakes, so they must be taken carefully into account for a correct seismic hazard evaluation and to mitigate the seismic risk with proper urban planning.
This paper presents the results of site investigations, seismic site characterization, and local seismic response for assessing the effects induced by the Mw 6.7 2 February 1703, near-fault earthquake (in the following 1703 earthquake) at the Madonna delle Fornaci site (MDF site) (Pizzoli, Central Italy) in which notable sinkhole formations were observed, as witnessed by several coeval sources [28,29,30,31,32] and in the Database of the Individual Seismogenic Sources (DISS) by INGV (http://diss.rm.ingv.it/dissGM/ (6 December 2021)). Recent papers have described observations at the MDF site without deeply studying the site’s geological characteristics and the mechanism of sinkhole formation through in-situ investigations and numerical modelling [1,20,33,34]. Within a project concerning the assessment of soil liquefaction potential and coseismic ground failure aiming at mapping the seismic hazard for urban planning, the MDF site has been identified as representative of near-fault earthquake-induced site effects and several research activities have been planned.
The first issue was to locate the earthquake-induced sinkhole site through the coeval historical sources and to hypothesize the conceptual mechanism of its formation, considering that several authors suggested different solutions. Studies [1] and [20] located the 1703 earthquake-induced sinkhole site nearby Pizzoli downtown, while [34] was very close to the ancient, but still active, mill placed close to the Aterno River in the alluvial plain. Moreover, study [1] hypothesized that the historical sources described a liquefaction phenomenon, while [20], conversely, described a deep piping sinkhole [21]. The two mechanisms and the related hazard are remarkably different; therefore, the goal of this study was to find the site where it is more probable that the ground failure and sinkhole formation occurred during the 1703 earthquake through careful reading of the historical sources (Section 2). The description reported by the chronicles was compared to the current topography and geomorphology. Subsequently, after the selection of the plausible site (i.e., the MDF site), a geological and hydrogeological study of the surrounding areas was performed (Section 3). To reconstruct the deep geological subsoil model, a campaign of single station microtremor measurements was performed (Section 4.1), also integrated with a 200 m deep borehole drilled nearby the MDF site (Section 4.2). A comprehensive investigation program (Section 4.3) was also performed at the MDF site, including continuous core drilling, surface geophysical investigations (seismic refraction surveys, MASW, microtremor measurements), and in-hole testing (downhole, Standard Penetration Test) to reconstruct the lithostratigraphy and seismo-stratigraphy (Section 4.4). A deep and shallow geotechnical model for the MDF site was defined (Section 5) and used to verify some of the possible failure mechanisms through numerical quantification (Section 6), by adopting approaches with an increasing level of complexity. Critical discussion of the results suggested a conceptual model of the mechanism of sinkhole formation (Section 7), while the main findings of this study are summarized in the conclusions (Section 8).

2. The Mw 6.2 7 February 1703, Earthquake

The Mw 6.7 2 February 1703, earthquake was generated by the active Mt. Marine fault (MMF) (Figure 1). The major seismogenic structures recognized in the area are the Upper Aterno fault system (UAFS), composed by the Mt. Marine fault (MMF) and by the Pettino fault (MPF), in the northern part of the Aterno R. valley, and the Paganica-San Demetrio fault system (PSDFS), in the southern part [35] (Figure 1). These connected fault systems are accountable for several notable earthquakes that occurred in the last 2000 years. Data from paleoseismological trenches across the PSDFS and UAFS show that PSDFS ruptured in 1703 (Mw 6.7), together with UAFS [35,36]. Conversely, the 1461 and 2009 earthquakes were generated only by the PSDFS [36,37]. The highest intensity data-point distribution agrees with the paleoseismology. In fact, the macroseismic intensity data-point distribution of the 1703 overlaps on both the UAFS and PSDFS, while that of 1461 (Mw 6.3) and 2009 (Mw 6.29) earthquakes includes only the PSDFS [38]. The 1703 earthquake was due to a fault length rupture of about 35 km, while those of 1461 and 2009 of about 19 km which confirm the empirical relationship of magnitude versus surface rupture length [39]. For this reason, [39] stated that the 1703 earthquake was caused by the contemporary rupture of the two fault systems (UAFS and PSDFS). A possible ancestor of the 1703 earthquake might be the AD 801 earthquake and, in such case, the return period for an earthquake with Mw > 6.5 on the UAFS and PSDFS would be about 900 years [36].
The seismic sequence of 1703 in Central Italy was one of the most serious seismic disasters of Italian history in terms of both geographic and extent destruction, due to the cumulative effects of numerous and violent earthquakes. Three strong earthquakes can be distinguished, which hit distinct and only partially overlapping areas: the first on 14 January 115 Mw 6.92 with its epicenter in Norcia, the second on16 January Mw 6.0 with its epicenter in Montereale and the third on 2 February Mw 6.7 with its epicenter in Pizzoli [40,41]. The epicenters move from NW to SE along the axis of Central Apennines, which is one of the main seismic areas of Italy [42]. The 1703 earthquake was perceived in a broad area of approximately 52,000 km2 including territories in Northern, Central, and Southern Italy, from Bologna to Naples. Isolated and light resentments were reported even as far as Milan and Venice [40,41].
The 1703 earthquake destroyed 44 villages in an area of approximately 19,000 km2 and the estimated casualties were about 6000 [29]. In L’Aquila, the city closest to the epicenter (about 12 km), an MCS intensity of about 9 was estimated considering that all the buildings in the city suffered damage and at least 35% of these collapsed completely [40,41].
In Rome, following the 1703 earthquake, three arches of the second-order of the Colosseum collapsed, some sections of the Aurelian walls, already in a poor state of conservation, were damaged, and cracks and lesions in the domes and vaults of numerous churches were formed [40,41].
Following the 1703 earthquake, several phenomena also occurred in the environment (among which surface fault rupture, landslide, liquefaction, ground rupture, sinkhole formation, etc.). In this study, the attention is focused on the formation of two sinkholes opened about 175 m apart (“ninety-five steps”) close to the mill at the MDF case study site located in the alluvial plain of the Aterno River, very near to the epicenter of the 1703 earthquake and close to Pizzoli village. Ancient chronicles report that from both these openings sulfurous water of whitish color came out with violence and great noise together with gravels and blocks. One of the two sinkholes, about 3 m wide (“12 spans”) and about 8.5 m deep (“thirty-two palms”), projected the column of water emitted up to a height of about 8.5 m (“four reeds ”) [28,30,31,32,33,34]. The escaped water was collected in a basin, filling the sinkhole itself up to halfway, and lasted for 17 days [20]. Further, considering that the 1703 earthquake happened during wintertime in a rainy and snowy period, the water table of the Aterno River alluvial plain was probably very shallow [43].
Though nowadays there is no trace of the two sinkholes, historical sources indicate that they occurred close to the mill and were 175 m apart. As reported in the old topographic map (Figure 2) the mill is in between the Aterno River and the Madonna delle Fornaci church (MDF). The two buildings are nowadays existing, the mill is functioning, the Madonna delle Fornaci church is a ruin. In the most restrictive hypothesis, if a sinkhole had formed near the mill, placed close to MDF, the other must have been at least 175 m away. Therefore, the selected site for the investigations was chosen within the area of a circle with a radius of 175 m and distant from the current riverbed of the Aterno River to avoid carrying out investigations in post-1703 alluvial deposits because close to the current riverbed (Figure 3). Further, the MDF case study site was chosen also for logistical reasons (accessibility for the borehole machinery, etc.). In the MDF site, the geotechnical and geophysical investigations aimed at analyzing the mechanism of formation of the two above-mentioned sinkholes were performed.

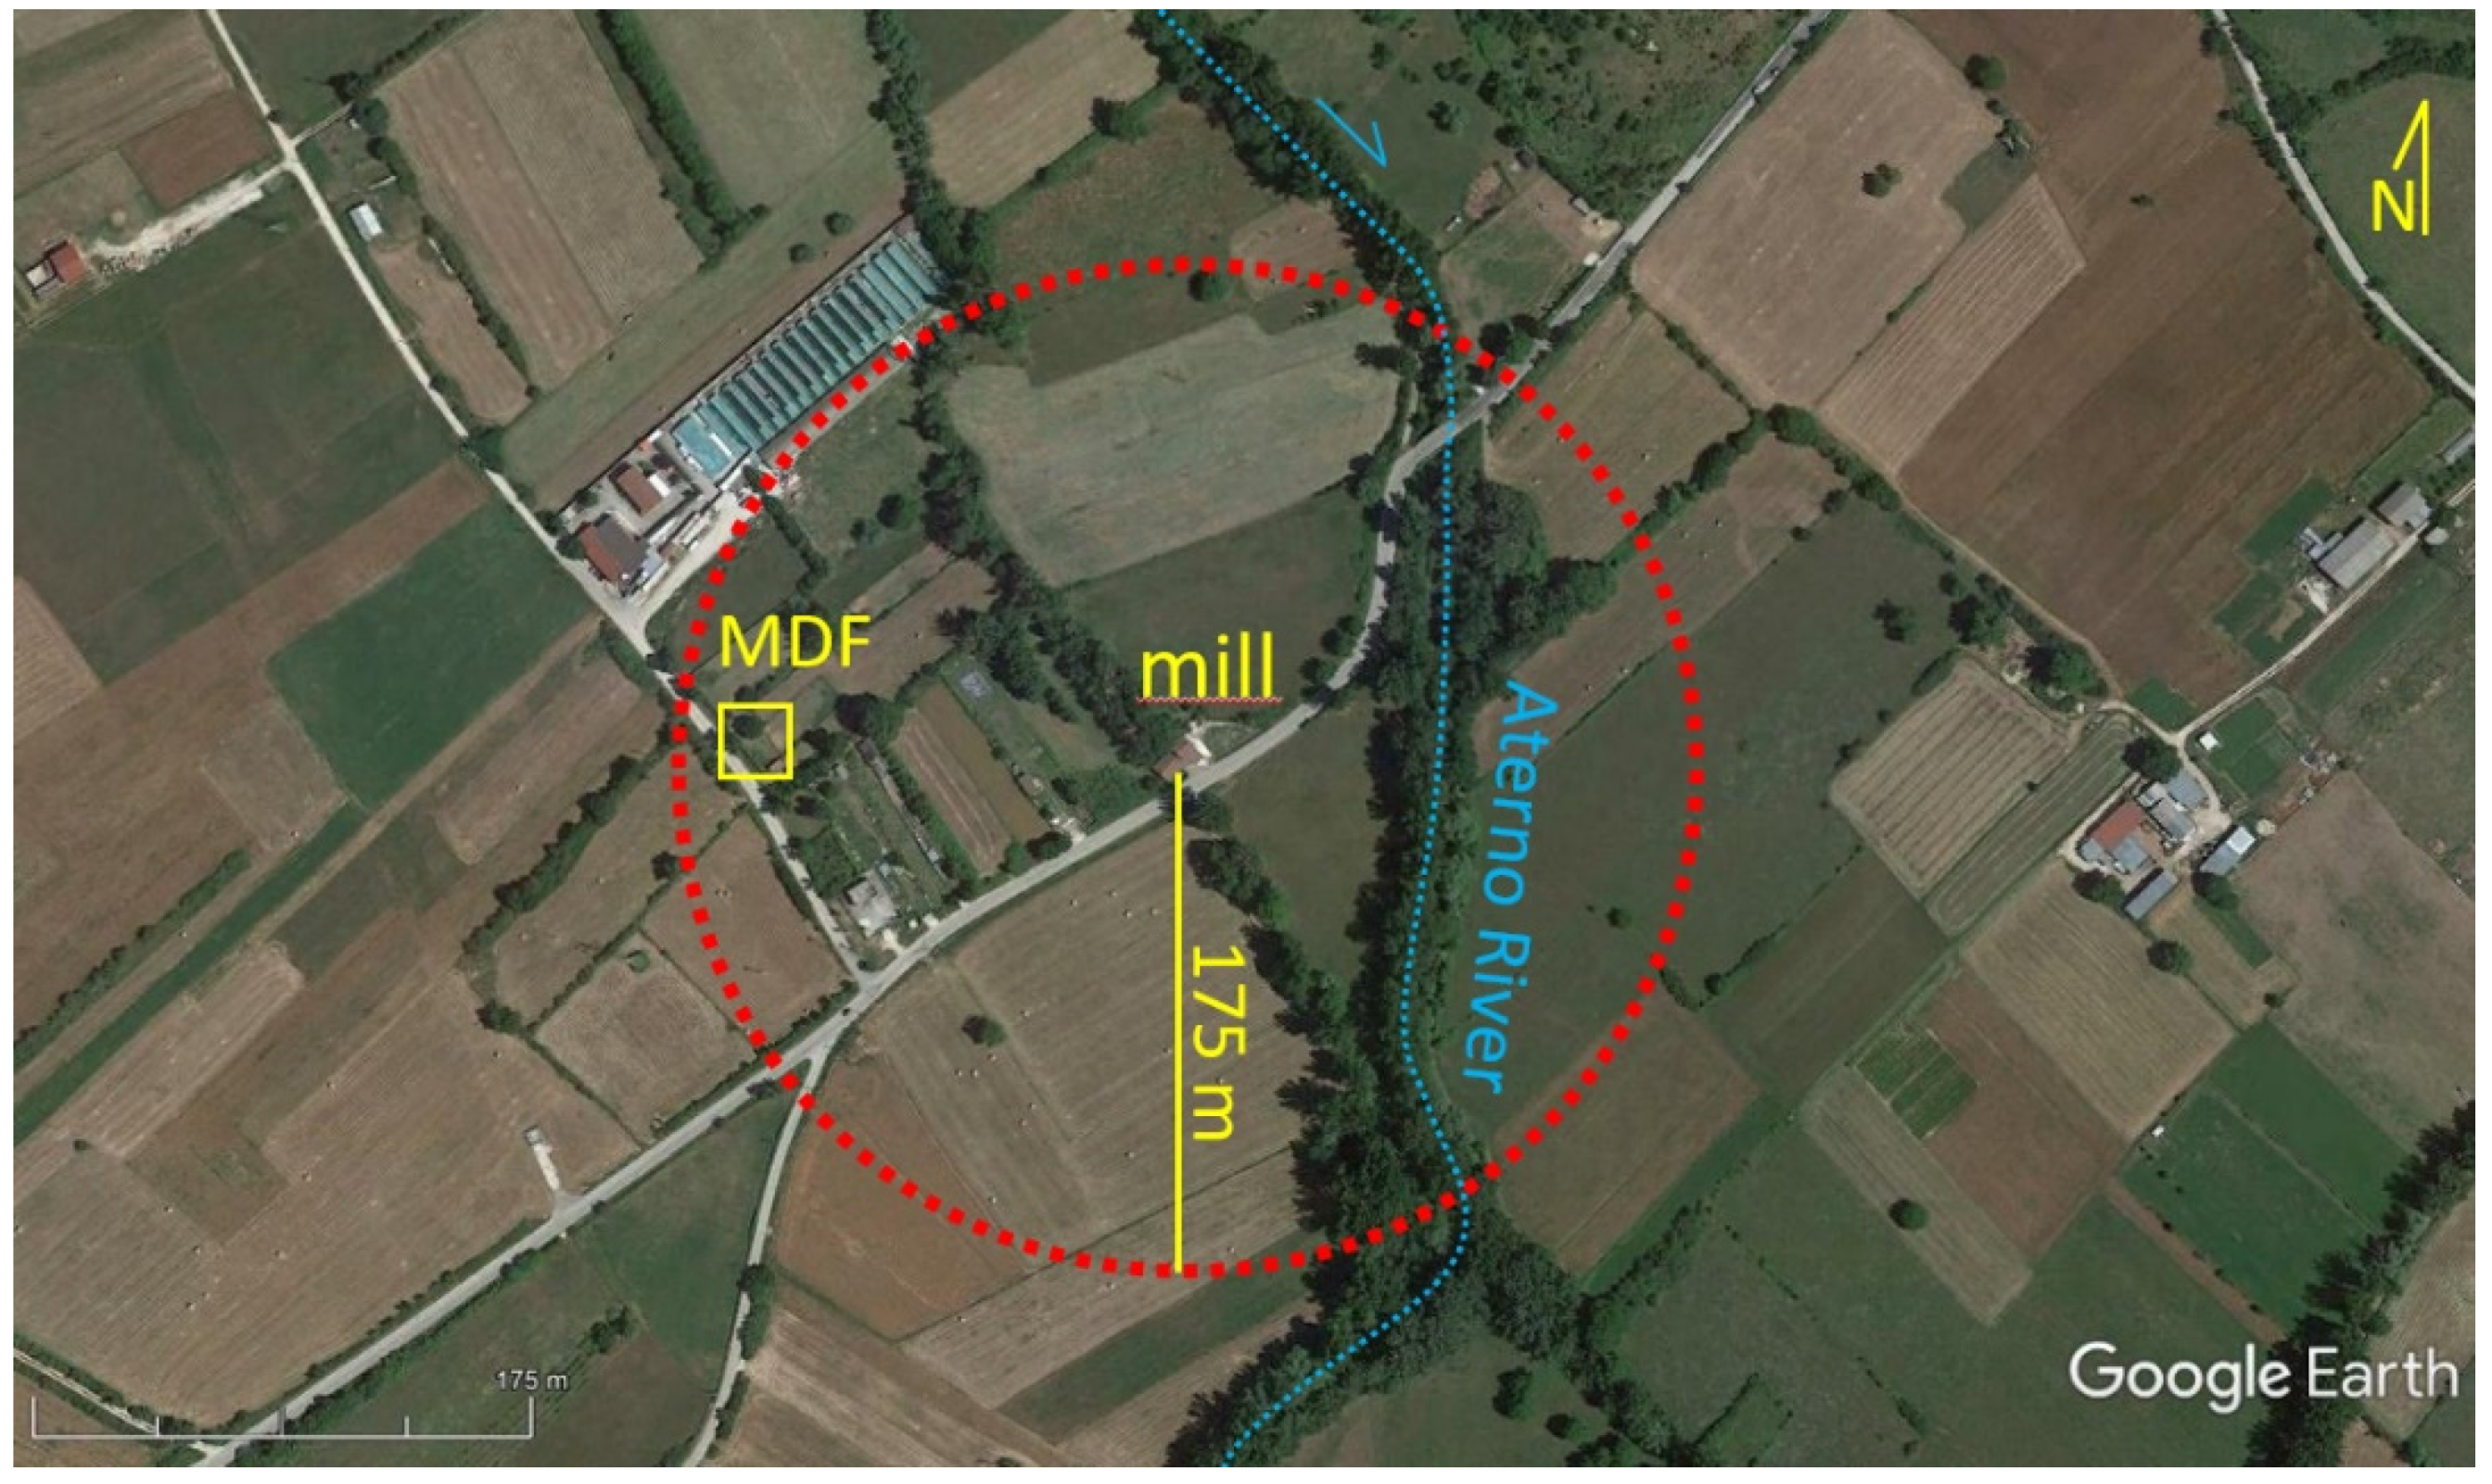
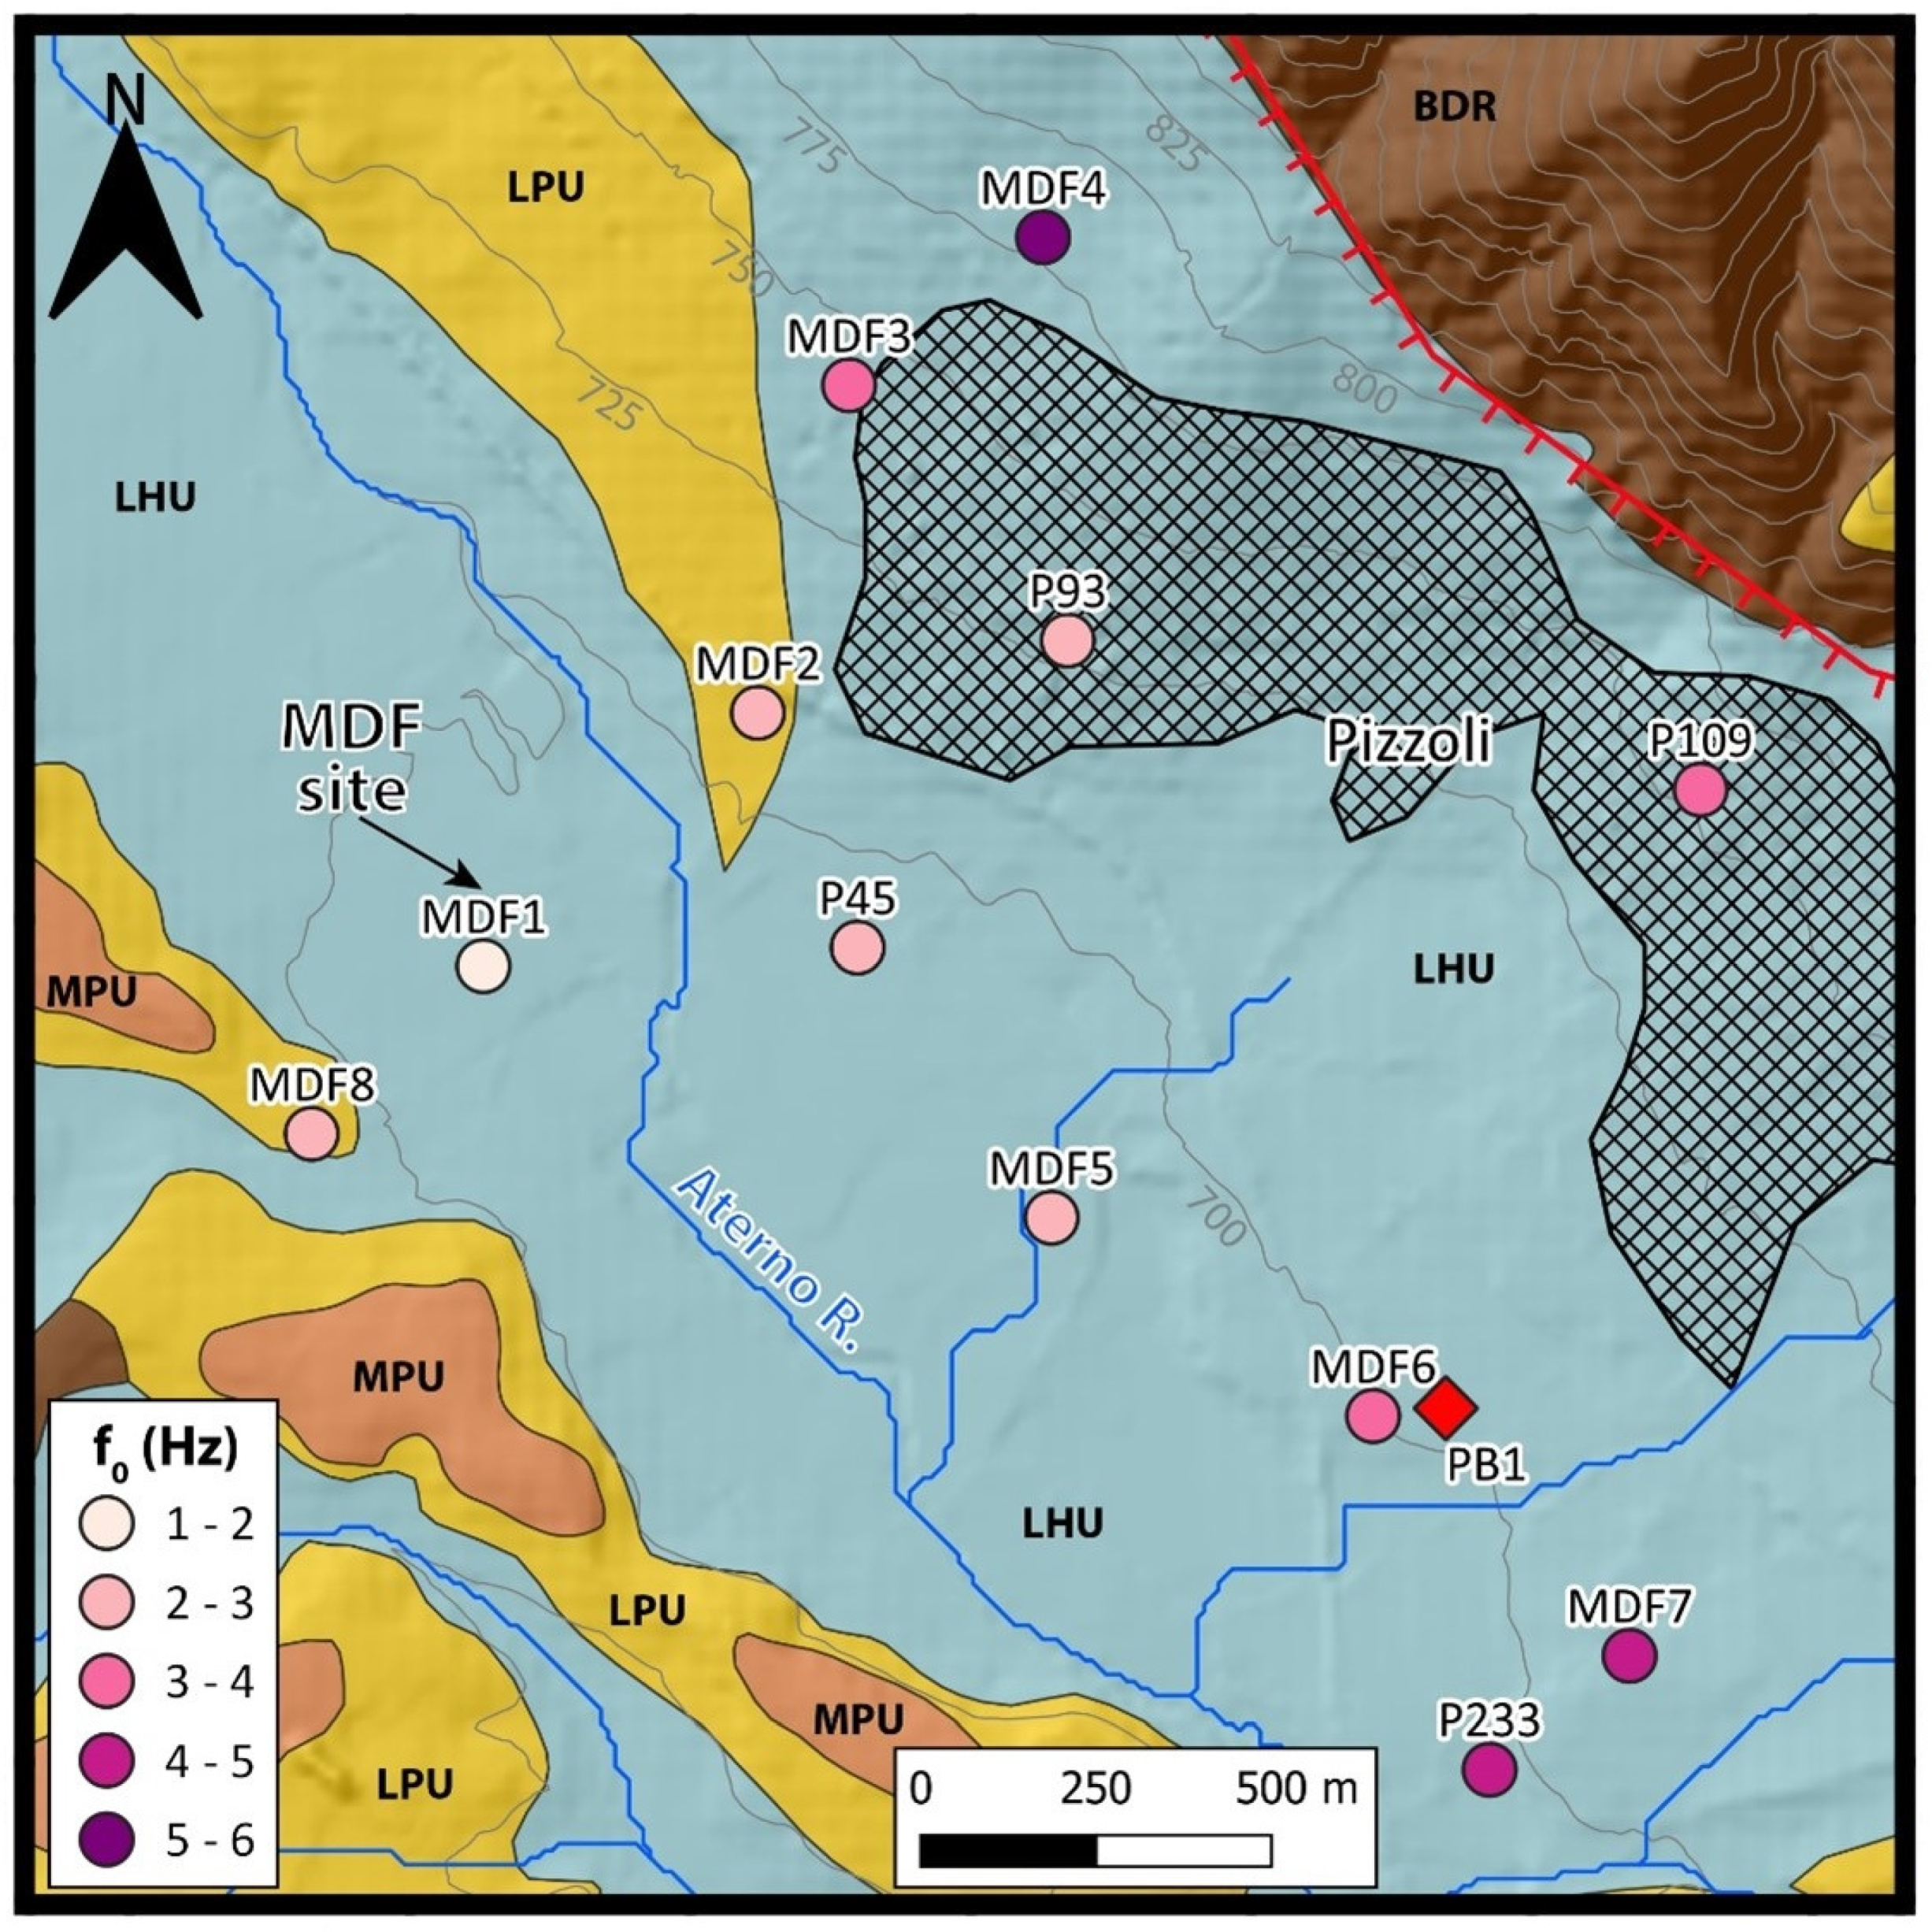
3. Geological Background of the Madonna delle Fornaci Site (Pizzoli, Central Italy)

The Central Apennines chain is the result of convergence between the Eurasian and Africa plates, which led to the formation of a Neogene NE-verging imbricate fold and thrust belt composed of Mesozoic platform limestone locally overlain by syn-tectonic Miocene arenaceous flysch, here designate as geological bedrock (Figure 4) [47,48,49,50,51]. Subsequently, the Central Apennines was affected by extensional deformation, which produced several normal faults. They generated numerous intermontane basins dated using several methods and indicating that extension started at ca. 3–2.5 Ma [42,52]. Some of these hangingwall basins are filled with up to 1000 m of continental deposits (e.g., [53,54]). The considerable variability of the stratigraphy and evolution of filling deposits, spanning from alluvial, fluvial, deltaic, distal lacustrine, and debris flow deposits, do not permit a simple correlation between the different basins [55,56,57].
The Pizzoli area belongs to the intramontane Quaternary basin of Upper Aterno Valley (UAV), whose evolution is controlled by SW-dipping active normal faults, the Mt. Marine fault (MMF). The basin is filled by detrital continental deposits that extensively overlie the Meso-Cenozoic bedrock mainly composed of carbonates lithologies (BDR) (Figure 4).
The continental succession is generally clustered in three large groups of lithological units with the lower continental deposits consisting of a maximum of 100 m thick conglomerates and slope-derived breccias covered by fluvial sandy-silty gravels, with reversed magnetic polarity deposited in the Lower Pleistocene (LPU) [56,58,59].
Later, the UAV experienced aggradation during Middle Pleistocene with sediment that partly covers the previous terraced deposits. This Middle Pleistocene sediment consists mainly of fluvial sand and gravel, with few lacustrine silt and clay (MPU).
The top lithological unit is composed of braided fluvial floodplain deposits of the Aterno river interfingered with slope deposits, mainly gravel beds with a sandy matrix. This lithological unit contains horizontal fluvial gravels and sandy lenses with abundant Upper Pleistocene volcanic material permitting to date these units to the upper part of Late Pleistocene and Holocene (PHU) [56,59].
Since the formation of a sinkhole is strongly influenced by the aquifer, the hydrogeological structure of the studied area is roughly summarized [60]. Here, the Aterno River interacts with the coarse-grained multilayer aquifer of the alluvial plain. North of Barete and South of Cavallari, the Aterno River yields groundwater to the alluvial aquifer. Conversely, among Barete and Cavallari, the Aterno River drains the alluvial aquifer, showing a discharge increase of about 95 L/s. The groundwater supply in this Aterno River’s sector comes from the NE side, where the groundwater of the Mt. Marine carbonate aquifer flows toward the alluvial aquifer through the slope detrital aquifer of the pediment. On the opposite, the SW side is characterized by low permeability units which do not contribute to the groundwater transfer towards the Aterno River (Figure 4) [60].
At a local scale, the hydrogeological setting of the MDF site is characterized by an unconfined multilayer coarse-grained aquifer. The multilayer aquifer is composed of gravel and sand as aquifer with intercalation of silty sand (aquitard), cemented layers, and 1-m thick silty and clay levels as paleosols.

4. Field Investigations

To identify the buried morphology of the seismic bedrock, the Aterno valley close to the MDF site and surrounding areas were investigated with a deep borehole until 200 depth (Section 4.1) and integrated with a non-invasive geophysical survey (Section 4.2).
A detailed site investigation program was carried out at the MDF site with both invasive and non-invasive field tests (Section 4.3), whose results allowed an adequate soil characterization (Section 4.4).

4.1. PB1 Borehole

The 200 m deep PB1 borehole at Scentella site (Figure 5) was performed by the Institute for Environmental Protection and Research (ISPRA), within the CARG Project [61] for the elaboration of the sheet n. 348 Antrodoco of the Italian geological map at 1:50,000 scale. The borehole reached 200 m below ground level without encountering the geological bedrock (Figure 6).
Figure 5. Distribution of resonance frequency (f0) from H/V noise spectral ratios over the MDF area. The colors of the circles are proportional to the f0 values. With the red diamond the location of the PB1 borehole is shown.
Geosciences 12 00002 g005
The 200 m deep PB1 borehole was drilled in 2012, using the wire-line coring technology. Drilling operations took a long time due to the presence in the lithological sequence of strongly cemented and fractured gravelly horizons.
Coarse-grained lithologies prevail in the borehole, although clay, silt, and loose or cemented sand are abundant above all from about 140 to 180 m.
The lithologies encountered during the drilling are described from the bottom to the top. From 200 and 180 m, fine to coarse carbonate gravels with sandy intercalations predominate.
From 180 to 171 m, the gravels pass upward through a sharp boundary to fine-grained lithologies. From 171 to 163 m, the lithological sequence is mainly composed of fine to medium/coarse gravels. From 163 to 141 m, fine-grained deposits again prevail. From 141 to 123 m, carbonate conglomerates predominate. They are karstified and fractured and are also characterized by oxides-rich horizons. From 123 to 105 m, carbonate gravels alternate with silty sand and dark gray/blackish clayey silt. From 105 to 30 m, massive poorly sorted conglomerates and gravels prevail. They are well cemented and sometimes karstified. Fe-Mn patinas and nodules rich and oxidized levels are scattered. At about 40 m, a 1 m-thick pedogenized gravelly horizon was found. The boundary between LPU and MPU can be located at 57 m b.g.l. where high-cemented conglomerates passed upward to sandy gravels with pedogenized features. At 37.10 m, gray-yellowish volcanic sand, evolving upward to reworked volcanic sand and sandy gravels, was found. At about 32 m, a 1 m-thick dark brown silty horizon with oxidized levels also was found. From 30 to 12 m, coarse- and fine-grained gravels, sandy and silty lenses, and weakly developed paleosols sometimes rich in volcanic minerals, were found. From 12 to 0 m, loose gravels with sandy and silty levels prevail. Frequent pedogenized horizons were also found.

4.2. Microtremor Measurements

A campaign of single station microtremor measurements over the Aterno R. valley, close to the MDF site and surrounding areas was carried out to identify peak frequencies potentially associated with impedance contrasts on top of the seismic bedrock. The campaign of microtremor measurements was used to assess the fundamental frequency (f0) of sediments lying over the bedrock according to the horizontal-to-vertical spectral ratio method (HVSR) [62]. HVSR method was applied for the estimation of site f0 and, inverted, for the retrieval of shear-wave velocity profiles (VS) in site characterization studies placed in Quaternary basins [63,64,65,66,67,68,69,70,71].
A three-component seismometer, 2 Hz sensor, SL07 S.A.R.A (http://www.sara.pg.it (6 December 2021)) was used. A recording length of 30 min and sampling frequency of 100 Hz, was adopted for each measurement [72]. The HVSR curve is estimated for each available microtremor measurement using Geopsy code (www.geopsy.org (6 December 2021) [73]. Windows 40 s long were selected for the recorded spatial three components according to the SESAME criteria [72]. Finally, the computed Fourier spectra were smoothed with the Konno–Ohmachi function with a bandwidth coefficient b = 40 [74]. The new 8 measurements (MDF1-8) were coupled with the previous measurements from the seismic microzonation of Pizzoli (P measures in Figure 5).
All investigated sites are characterized by a resonance frequency in the range of 1.23 and 5.38 Hz, showing clear and sharp frequency peaks (Figure 7), whose shape and frequency values agree with the results of microtremor surveys performed in previous studies for the Pizzoli seismic microzonation [75]. Based on preliminary analysis, these fundamental frequencies could be related to an impendence contrast located between 20 and more than 100 m at depth [76,77].
The central part of the studied area, close to the MDF site, shows the lowest values of f0, while toward the reliefs the f0 value increases. None of the boreholes realized for the seismic microzonation of Pizzoli investigated the depth of the geological bedrock, i.e., BDR units [75], under the covers of the continental deposit.

4.3. Site Investigation Program

A comprehensive geotechnical and geophysical investigation campaign was carried out at the MDF site in 2020–2021, aiming to obtain a reliable seismic site characterization and to reconstruct the subsoil model to be used in the numerical analysis for the quantitative estimation of the near-fault ground motion.
The MDF site is located in a flat cultivated area, at an elevation of about 700 m a.s.l. The field investigation included boreholes, geotechnical in situ tests (standard penetration test, piezocone penetration test, flat dilatometer test), piezometer measurements, in-hole, and surface geophysical tests (down-hole test, surface wave tests, seismic refraction surveys). Figure 8 shows the plan view of the field investigation at the MDF site.
The initially planned investigation program was modified and integrated to account for the soil conditions encountered at the test site. In particular, the field investigation at the MDF site was carried out in two phases, as described in detail here below.
  • Phase 1 (July–August 2020)
The first investigation campaign included one continuous core borehole (BH1) to 21 m depth below the ground surface. Two undisturbed samples were recovered at depths 9.00–9.30 m and 14.50–15.00 m, in predominantly sandy layers. An open standpipe piezometer was installed at 11–12 m depth. The initial program also comprised one piezocone (CPTU) and one seismic dilatometer (SDMT) soundings, both to 20 m depth, to be executed at a close mutual distance. However, the CPTU sounding stopped at only 3 m depth due to the presence of a thick gravel layer. Even after pre-boring down to 8 m, the piezocone probe could not penetrate below this depth. Consequently, the planned nearby SDMT sounding, to be carried out using the same push rig, was canceled.
Extensive geophysical testing was carried out in Phase 1. Multichannel surface wave tests MASW (M1, M2) were carried out along two perpendicular 70-m long alignments. Seismic refraction surveys (SR1, SR2, SR3) were performed along perpendicular alignments of length 69–70 m. The characteristics of the Seismic Refraction survey are reported in Table 1.
  • Phase 2 (November 2020–January 2021)
The second campaign, planned to fill the gaps that emerged from the Phase 1 investigation, included two continuous core boreholes (BH2 and BH3) to 15 m depth. Standard penetration tests (SPT) were executed regularly at 1-m depth intervals in borehole BH2. Upon completion, the borehole BH2 was cased for in-hole seismic testing. A down-hole test to 15 m depth was later carried out. In borehole BH3 series of flat dilatometer tests (DMT) were executed from the bottom of the borehole for short depth intervals between 6.80 and 11.20 m, in predominantly sandy layers. An open standpipe piezometer was installed in borehole BH3 at 9 m of depth.
Laboratory tests on undisturbed and disturbed samples recovered from the boreholes in Phases 1 and 2, including cyclic/dynamic tests and grain size distribution, are currently being planned.

4.4. Site Characterization
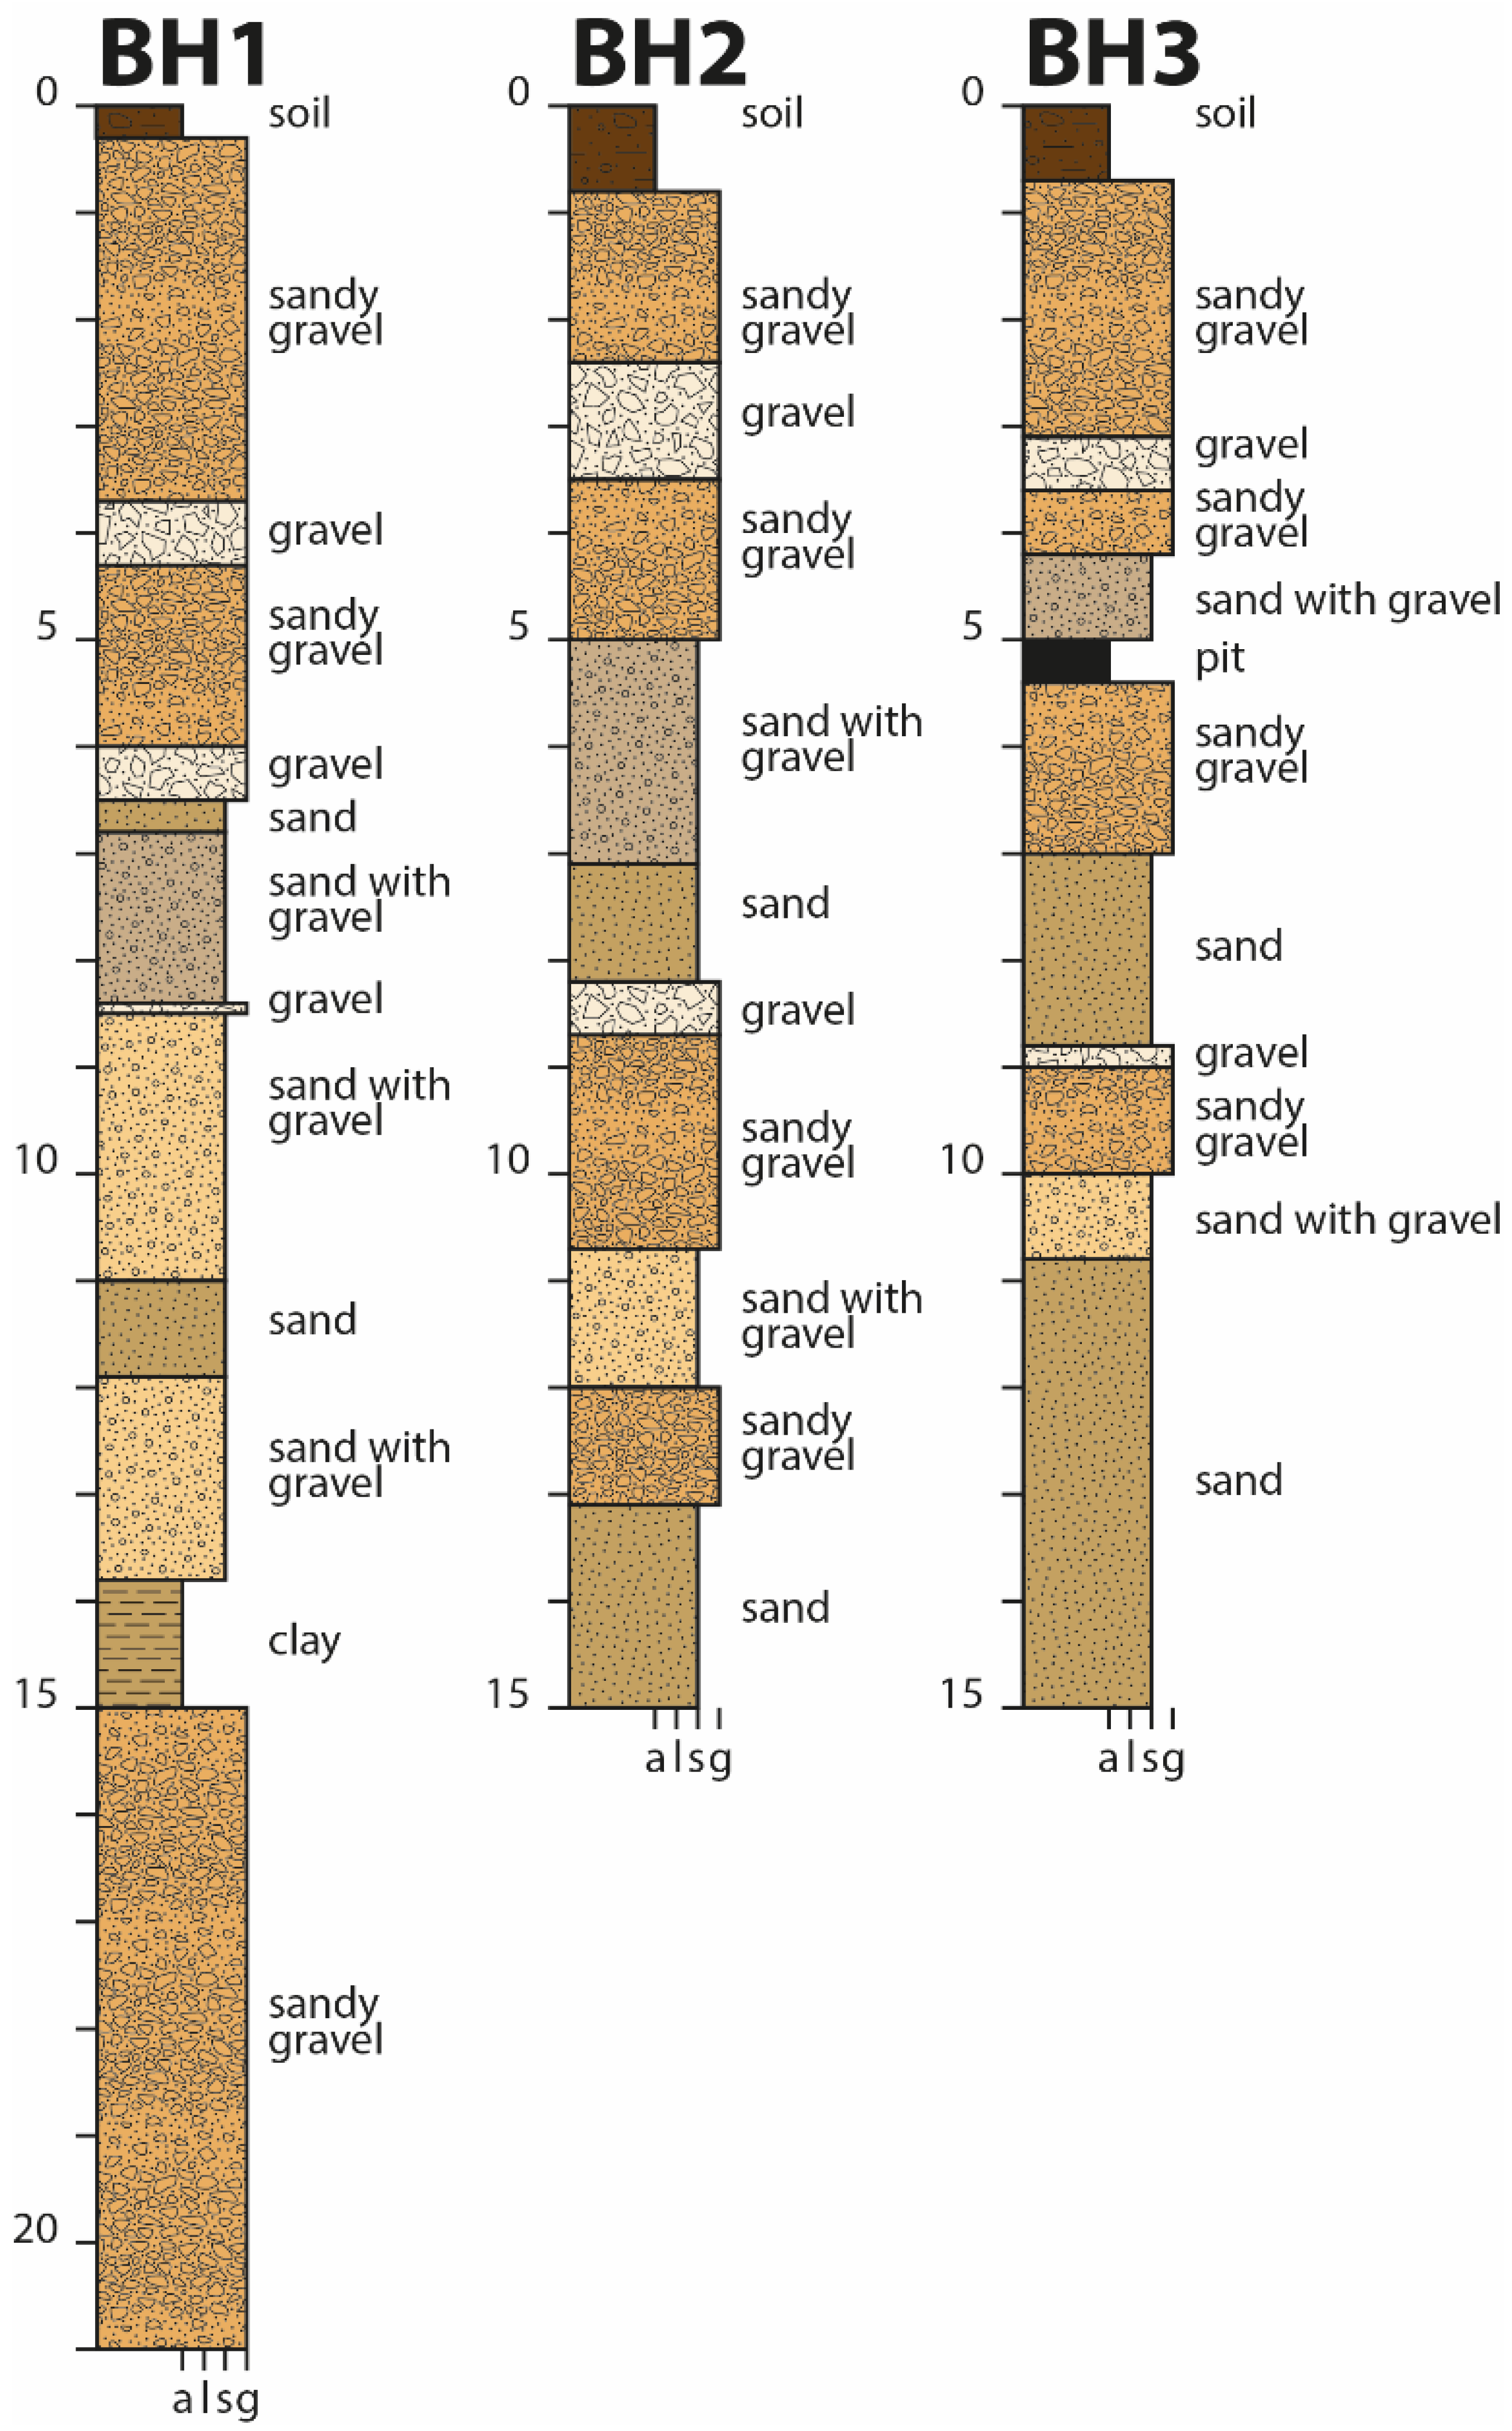
4.4.1. Stratigraphy

The stratigraphic logs of boreholes BH1, BH2, and BH3 (Figure 9) indicate the predominance of coarse-grained materials in the shallowest portion of the soil deposits at the MDF site, down to the maximum investigated the depth of 21 m. The soil profile is mostly composed of alternating layers of dense gravel and sand with gravel, particularly in the upper 6–7 m, while sand layers are also encountered below this depth. A significant lateral variation, typical of alluvial deposits, can be observed from the borehole logs, despite the short mutual distance (about 2–3 m) among the boreholes.

4.4.2. Groundwater Table

Piezometer measurements were carried out in boreholes BH1 and BH3 during the various investigation phases. The groundwater table was found at a depth of 6.4–6.9 m below the ground surface in July–August 2020, about 7.3 m in November 2020, and 1.3–2.6 m in January 2021.

4.4.3. Soil Property Interpretation from In Situ Tests

Figure 10 shows the depth profile of the SPT-N blow counts obtained in borehole BH2 and their interpretation in terms of relative density DR [78] and peak friction angle ϕ‘p, estimated from DR using the [79] relationship. The gravel and gravelly sand layers up to 6–7 m depth are characterized by rather high values of relative density (DR ≈ 60 to 90%) and peak friction angle (ϕ‘p ≈ 40–42°). The predominantly sandy layers from about 6–7 to 15 m of depth are moderately dense (DR ≈ 50–60%, ϕ‘p ≈ 36–37°).
CPTU test results were obtained only in the upper 3 m of soil and therefore provided little information for this study.
DMT measurements carried out in borehole BH3 were considered unreliable, possibly due to soil disturbance at borehole bottom, and therefore were not used in this study.

4.4.4. Interpretation of Geophysical Tests

The PB1 borehole permits to define that the geological bedrock is deeper than 200 m b.g.l. Close to the borehole site, we realized the microtremor measurement MDF6, with an f0 value of 3.16 Hz, which indicates the main impedance contrast between 30–60 m deep [76,77]. Definitively, the impedance contrast highlighted by microtremor measurements is not generated by softcover continental deposits over the geological bedrock but is contained inside the continental deposits. This impedance contrast is probably due to the presence of LPU covered by the softer sediments of MPU and PHU (Figure 4 and Figure 5). Under this assumption, the seismic bedrock at the MDF site is considered deeper than 100 m based on the MDF1 measurement with f0 = 1.23 Hz [76,77]. This hypothesis has been verified, as reported in the subsequent sections.
Figure 11 shows the P-wave and S-wave (VP, VS) velocity profiles obtained from the down-hole (DH) test in borehole BH2, as well as the profile of the small-strain shear modulus G0, obtained from VS using the relation G0 = ρ VS2, where ρ is the soil density. The values of VP ≈ 700–800 m/s in the upper ≈6 m suggest the absence of water up to this depth. This information agrees with piezometer measurements.
The shear wave velocity, VS, generally increases with depth, with higher values at depths between about 6 and 9 m. G0 shows a similar trend.
The interpretation of surface wave tests (MASW), obtained through the software Easy MASW by Geostru (https://www.geostru.eu/shop/software/software-geofisica/prova-sismica-multicanale-masw/ (6 December 2021)), provided an estimate of VS to a depth of about 30 m, greater than the 15 m investigated by the down-hole. Figure 12a shows the comparison of the VS profiles obtained from down-hole and MASW. The VS profiles interpreted from MASW along two perpendicular alignments (M1, M2) are quite similar, indicating a limited influence of local stratigraphic variations across the investigated area. Some difference between VS from DH and MASW is observed in the upper 15 m, where both are available. VS obtained from DH is generally higher than VS from MASW, with remarkable differences especially in the first 4 m and between 6 and 9 m, where the DH interpretation leads to values 40% higher.
The equivalent shear wave velocity estimated according to the Italian building code [80], using VS values obtained from DH in the upper 15 m and from MASW from 15 to 30 m, is VS,eq = 486 m/s (subsoil class B).
Figure 12b shows the dispersion curve obtained from the MASW. Identification of the maximum depth, zmax = 21.6 m (half of the maximum investigated wavelength according to [81]) for which the velocity measurements are reliable, induced to neglect the velocity values deeper than 20 m.
Figure 13 and Figure 14 show the interpretation of the seismic refraction surveys SR1 and SR2 carried out along perpendicular alignments, in terms of contours of the P-wave velocity. The SR1 and SR2 were acquired during summer 2020 when the water table was about 7 m b.g.l. The interpretation of SR1 and SR2 in terms of VP contours was carried out by using the log of BH1 and BH2 boreholes and considering the water table depth at about 7 m b.g.l. VP contours highlight the shallow 2–3 m-thick layer formed by fine-grained deposit and weathered gravel, possible buried channels in the aquifer formed by coarse-grained deposit, and the groundwater table. Below the VP velocity boundary of about 1500 m/s, which is the VP velocity of water, the saturated aquifer is placed. Above the groundwater table, the unsaturated zone of the aquifer is recognized. The SR1 interpretation also shows the plunging of the water table toward the Aterno River, with a hydraulic gradient of 5 ‰, demonstrating that it drains the aquifer (Figure 13).

5. Geotechnical Model

The data obtained from field investigations permitted to elaborate a quite confident 1D litho- and seismo-stratigraphic model for the MDF site. The abundance of experimental data in the first 15–20 m of the soil column allowed the definition of a detailed geotechnical model, while a less detailed one was carried out until the seismic bedrock depth by integrating the seismic noise measurements and the deep borehole (PB1) with data provided in other studies.

5.1. Seismic Bedrock Estimation

Available borehole log (PB1) and Vs from down-hole measurements were used to estimate the shear wave velocity profile of the site. The empirical equation linking velocity and depth was assumed for describing the variation of Vs in the deformable soil until the bedrock [82,83,84,85,86,87,88]:
Vs ( z ) = Vs 0 ( 1 + z z 0 ) x
where z is the depth below the ground, z0 = 1 m, Vs0 is the shear wave velocity at the surface, and x is an exponential term defining the depth dependence of the shear-wave velocity.
In Figure 5, the f0 map highlights an overall decrease of resonant frequency moving toward the MDF site from the east foothill. The observed trend agrees with the thickening of the LPU and MPU lithologies toward the lower part of the UAV. To verify such a hypothesis, a 1D numerical model was defined to simulate the 1D transfer function numerically from the seismic bedrock to the outcropping soil of the PB1 borehole in Figure 6. The 1D soil column was analyzed with the STRATA code [89]. The simulated 1D transfer function was compared with the HVSR curves of the MDF6 microtremor measurements (Figure 7), performed close to the PB1, to estimate the value of Vs0 and x in Equation (1).
The 1D column was made of a homogeneous linear-elastic material corresponding to sandy gravel succession (LHU and MPU) with geological deposits considered homogeneous, with a damping ratio of 5% and a mean unit weight of 20 kN/m3. This uniform layer lays on an elastic half-space representing the seismic bedrock, which corresponds to the LPU succession. The nonlinear behavior of the LHU and MPU successions has been neglected, given the elastic nature of microtremor measurements and the associated small shear strains.
The initial position (Vs0) and shape (x) parameters defining the curve in Equation (1) have been tuned to fall in the range and trend identified by the available experimental Vs profiles from the down-hole in Figure 11. For the LPU, an average shear wave velocity of 800 m/s was assumed. Such a value was defined according to that adopted in 2D numerical models based on in-situ measurements executed on similar lithologies [68]. The seismic input was defined according to the Random Vibration Theory (RVT), and the calculated theoretical transfer function was compared with the experimental H/V curve of MDF6 measurement for validation. The adopted average Vs profile is indicated with the blue curve in Figure 15, whose coefficients are Vs0 = 300 m/s and x = 0.18, which adequately follows the trend of the available experimental Vs profiles of Figure 11 reported in Figure 15. The same coefficient values are used to define the impedance contrast depth fitting the frequency peak in the measurement of MDF1 realized in the MDF study site. With these parameters, the depth of seismic bedrock in the MDF site was estimated at around 130 m depth (Figure 15b).
To furtherly verify and strengthen the adopted small-strain soil model, the shear wave velocity profile was also defined on the results of the down-hole test carried out at the site until 15 m depth (Figure 11), and a laboratory-based relationship between velocity and depth, applied between 15 m and the roof of the seismic bedrock. The relationship between the shear wave velocity, VS, and the depth, z, was defined based on the laboratory tests for L’Aquila and surrounding areas [90]. This latter law has been scaled for the MDF site, to predict the shear wave velocity at 15 m depth. The analytical expression is the following:
Vs = 89.58 z 0.27 + 360.7
Figure 15b summarizes the shear wave velocity profile and the related 1D transfer function. Although based on an independent calibration, both Vs profiles are compatible against the microtremor measurements MDF1 of Figure 7 (see Section 4.2).
The shear wave velocity profile which results from the combination of the results of the down-hole test and the relationship between velocity and depth expressed by Equation (2) was finally assumed in the model (Figure 15b).

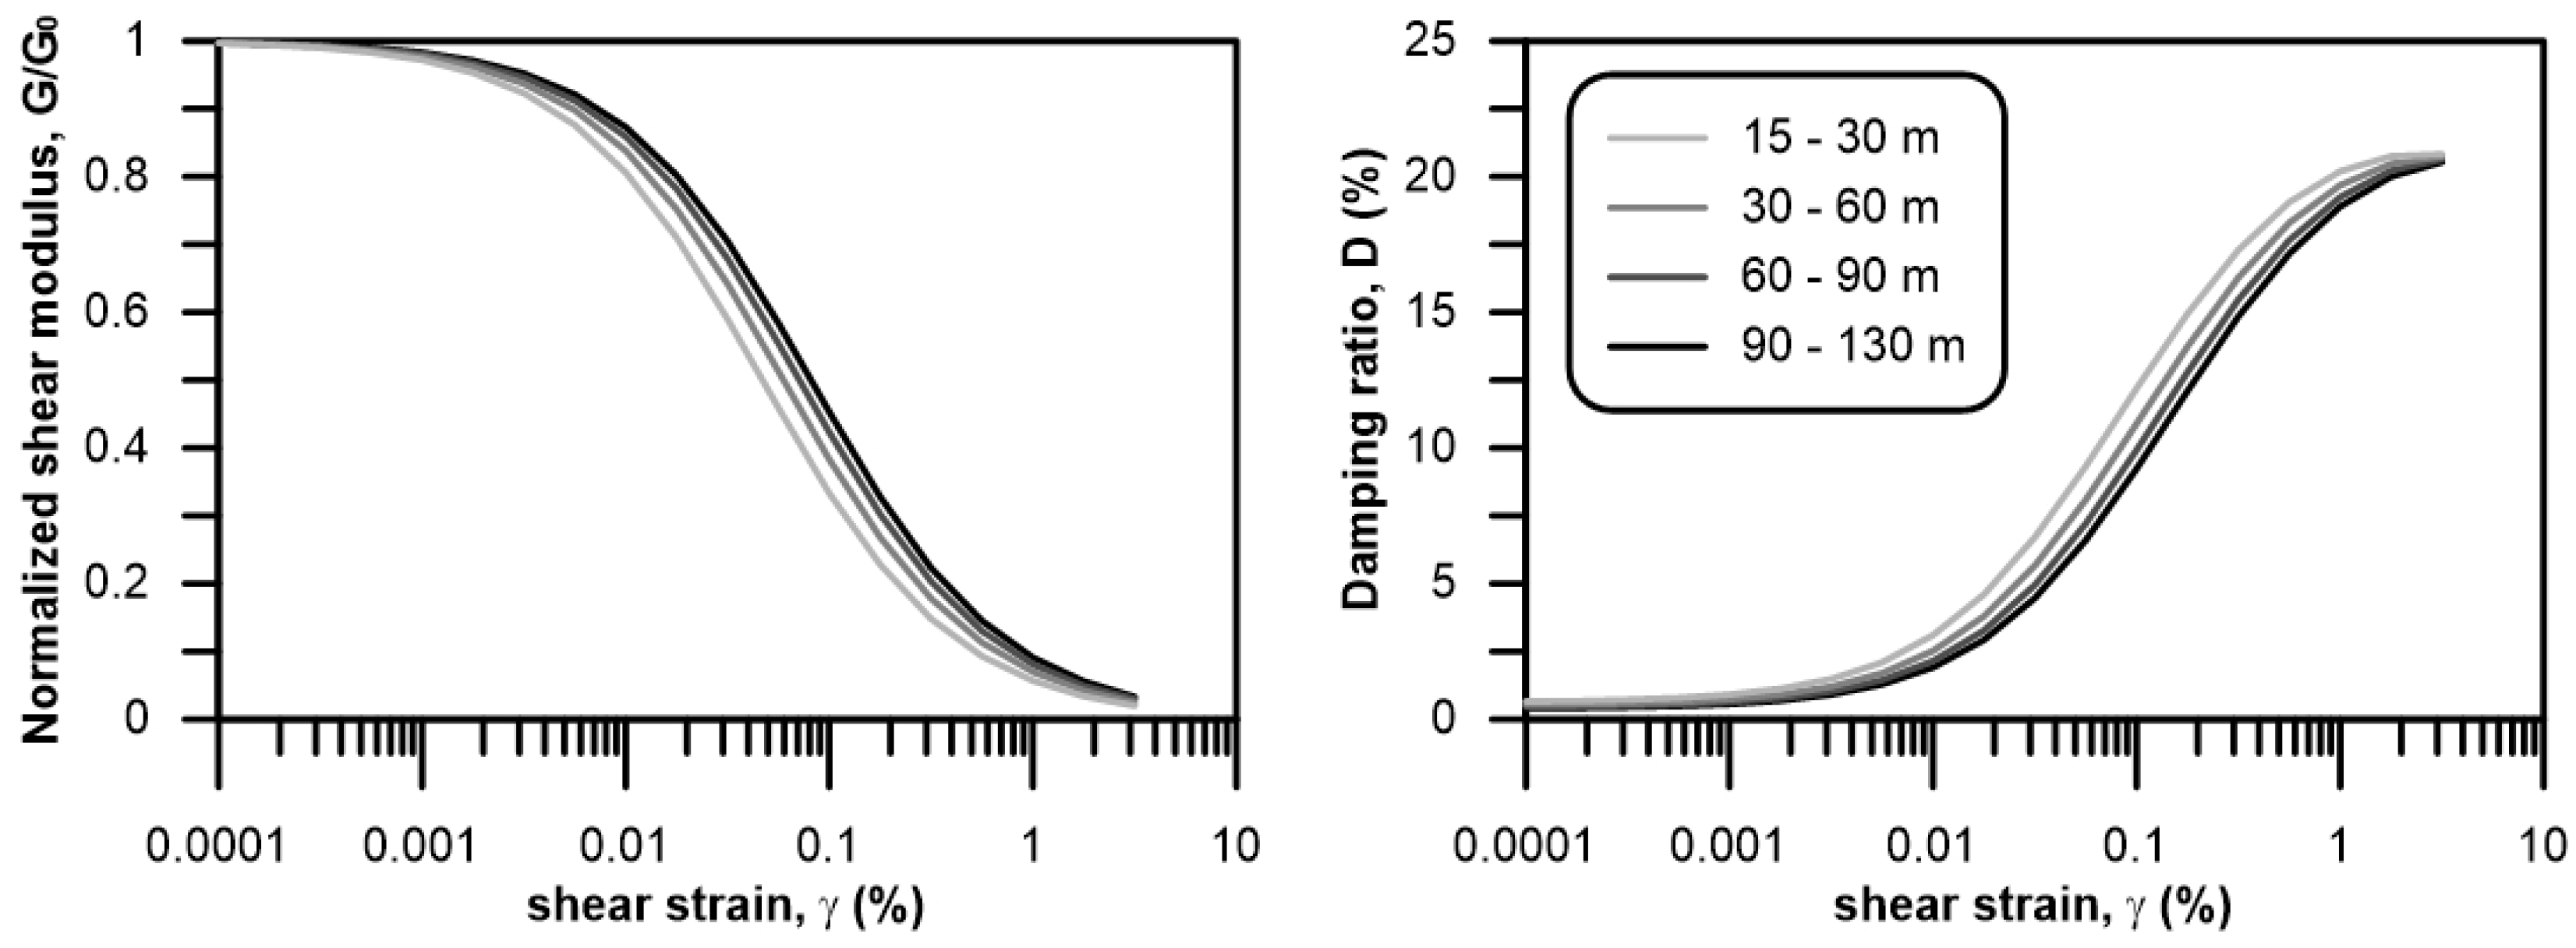
5.2. Dynamic Soil Properties at Large Strains

Since site-specific investigations have not been carried out on soil layers deeper than 15 m from the ground level, the non-linear soil properties—shear modulus reduction and damping curves—of the deeper soil strata have been modeled referring to literature curves, according to the [91] model (Figure 16).
In the first 15 m, since the well-graded grain size distribution and the presence of granular material, the variability of the dynamic soil properties has been taken into account by adopting curves for gravelly soils proposed by several Authors: [92,93,94,95] and the most recent [96]. When the effective overburden stress was required, reference stress of 100 kPa was assumed, while a uniform coefficient of 7 was considered as representative of the grain size distribution of the gravelly/sandy soils.
Figure 17 shows a comparison of the literature curves in terms of normalized shear modulus reduction and damping ratio as a function of the shear strains. The normalized shear moduli show a similar trend except for the lower bound proposed by [92] and the upper bound reported by [95]. More discrepancies are observed in the damping ratio, where the higher values are suggested by [92,94] for strain higher than 0.3%.
The saturated layers of the shallowest 15 m of the soil column can generate pore pressure build-up due to the seismic shaking. This non-linear behavior was modeled according to the pore water pressure (pwp) model proposed by [97]. The main advantage of the adopted model is that it permits to synthetically express the seismic demand relevant to an irregular time-history of shear stress, and to compare it to the cyclic strength of liquefiable soils, as measured in stress-controlled cyclic laboratory tests, thus avoiding the evaluation of the number of equivalent uniform stress cycles. This simplified model is implemented in the 1D non-linear code SCOSSA [98,99] and validated on centrifuge tests and well-instrumented test sites, as detailed in [100,101].
The calibration of the pwp model parameters required the definition of the cyclic resistance curve (Cyclic resistance ratio, CRR vs. the number of cycles at liquefaction, NL) and excess pore water pressure curves (excess pore pressure normalized by the initial effective vertical stress, ru and the normalized number of cycles, N/NL), according to the following expressions:
( CRR CSR t ) ( CSR r CSR t ) = ( 15 N L ) 1 α
r u = a ( N N L ) b + ( 0.95 a ) ( N N L ) d
where CSRt, CSRr, α, a, b, and d are model parameters to be defined on the results of in-situ or laboratory tests.
The model calibration was carried out on the results of the SPT tests, according to the procedure proposed by [102]. Table 2 reports the numerical values of the calibrated parameters for the different soil layers. Because of the high relative density highlighted in Section 4.4.3, the modeled soils are characterized by high values of cyclic resistance.

6. Ground Failure Interpretation

This section aims to quantitatively verify some of the possible failure mechanisms that were considered to interpret the damage observations reported in the historical chronicles (Section 2), with special attention to liquefaction phenomena and piping sinkholes generated by the seismic-induced pore water pressure build-up.

6.1. Simplified Liquefaction Analyses

As a preliminary tentative interpretation of the near-fault surface manifestations triggered by the 2 February 1703, earthquake, liquefaction analyses were carried out using simplified methods based on in-situ testing results. In particular, simplified methods for liquefaction assessment based on SPT N-values [103] and shear wave velocity VS [104,105] were used.
The seismic input data required in the simplified liquefaction analyses were assumed as representative of the 2 February 1703, earthquake, i.e., magnitude Mw = 6.7 and peak ground acceleration PGA = 0.886 g. This PGA value was derived from the relationship recently proposed by [106] as a function of the macroseismic intensity (IMCS = X). The groundwater table was assumed at a depth of 1.3 m below the ground surface, based on piezometer measurements carried out in the winter season. As a first approximation, a mean value of the fines content FC = 15% was assumed down to 15 m depth.
The results of liquefaction analyses based on SPT and VS are summarized in Figure 18a,b, respectively. In both cases, despite the severe seismic demand which determines very high values of the cyclic stress ratio (CSR), the cyclic resistance ratio (CRR) of the MDF soils derived from in-situ testing results was found considerably higher than CSR. Hence, no liquefaction was predicted by using simplified methods.
This preliminary analysis permitted us to screen out liquefaction as the (prevalent) mechanism of the observed phenomena.

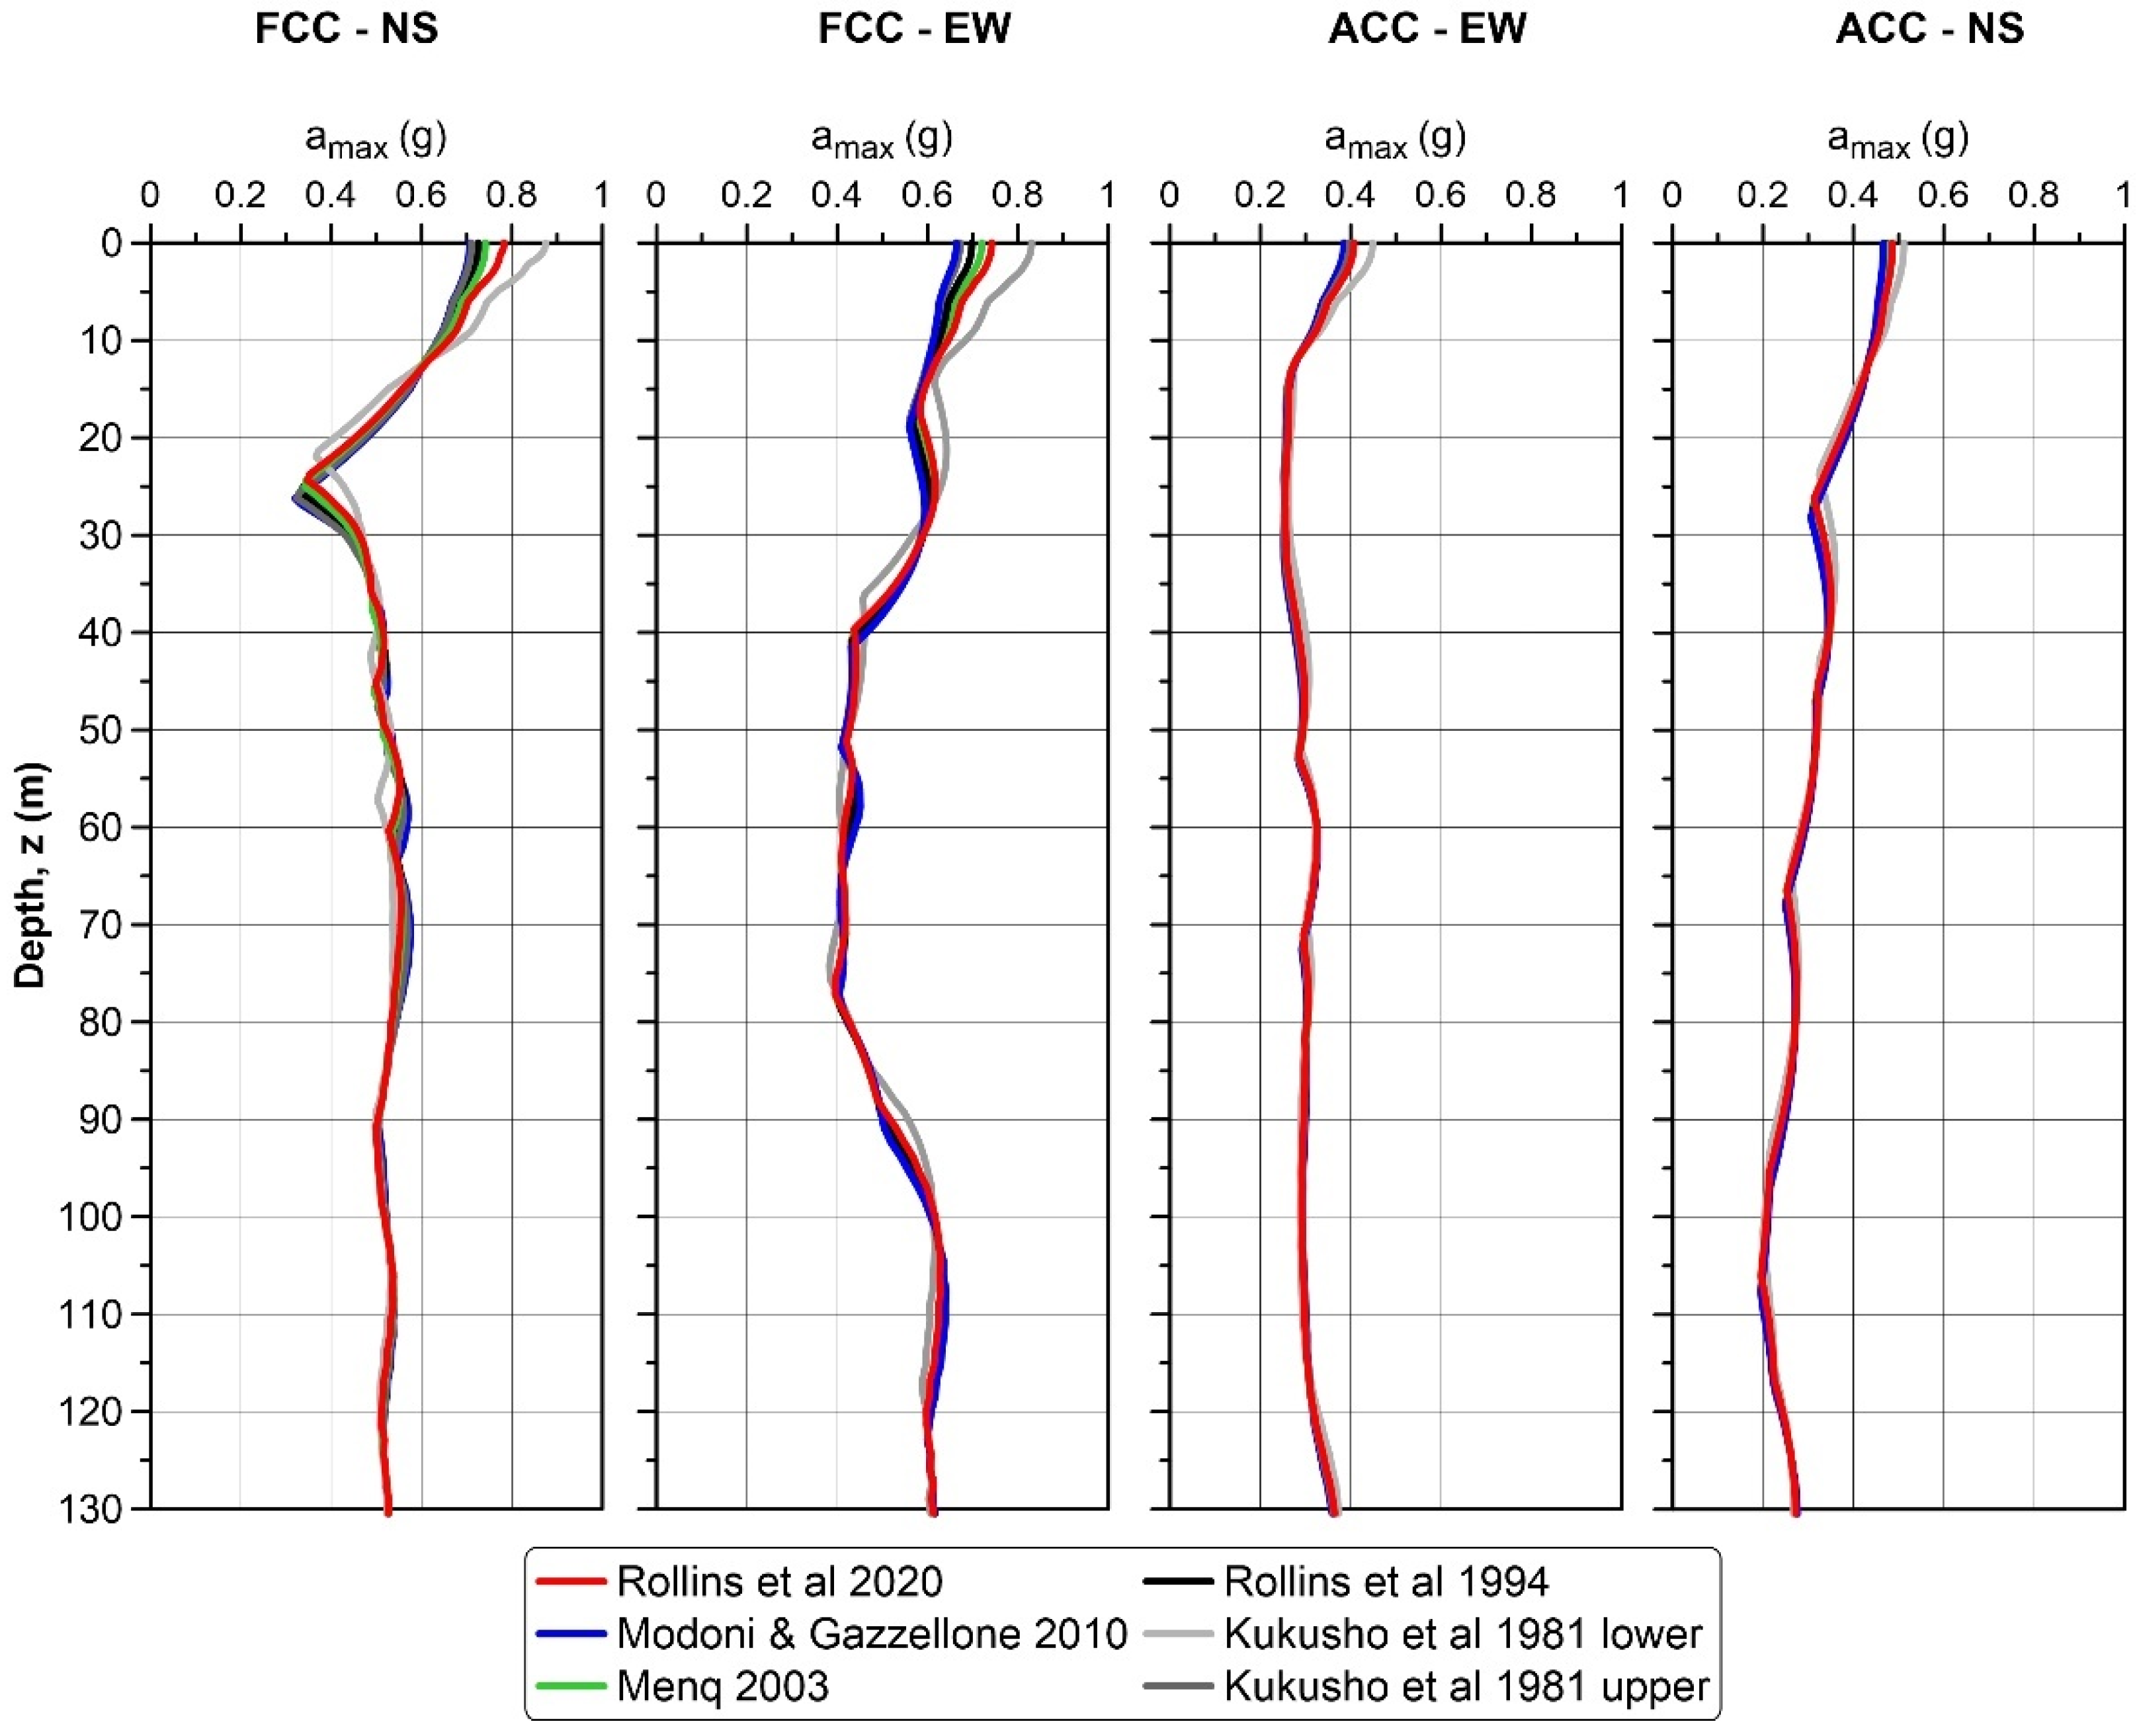
6.2. Equivalent Linear Seismic Response Analyses

Dynamic seismic response analyses according to the equivalent linear approach were performed for the MDF site to identify possible mechanisms of failure.

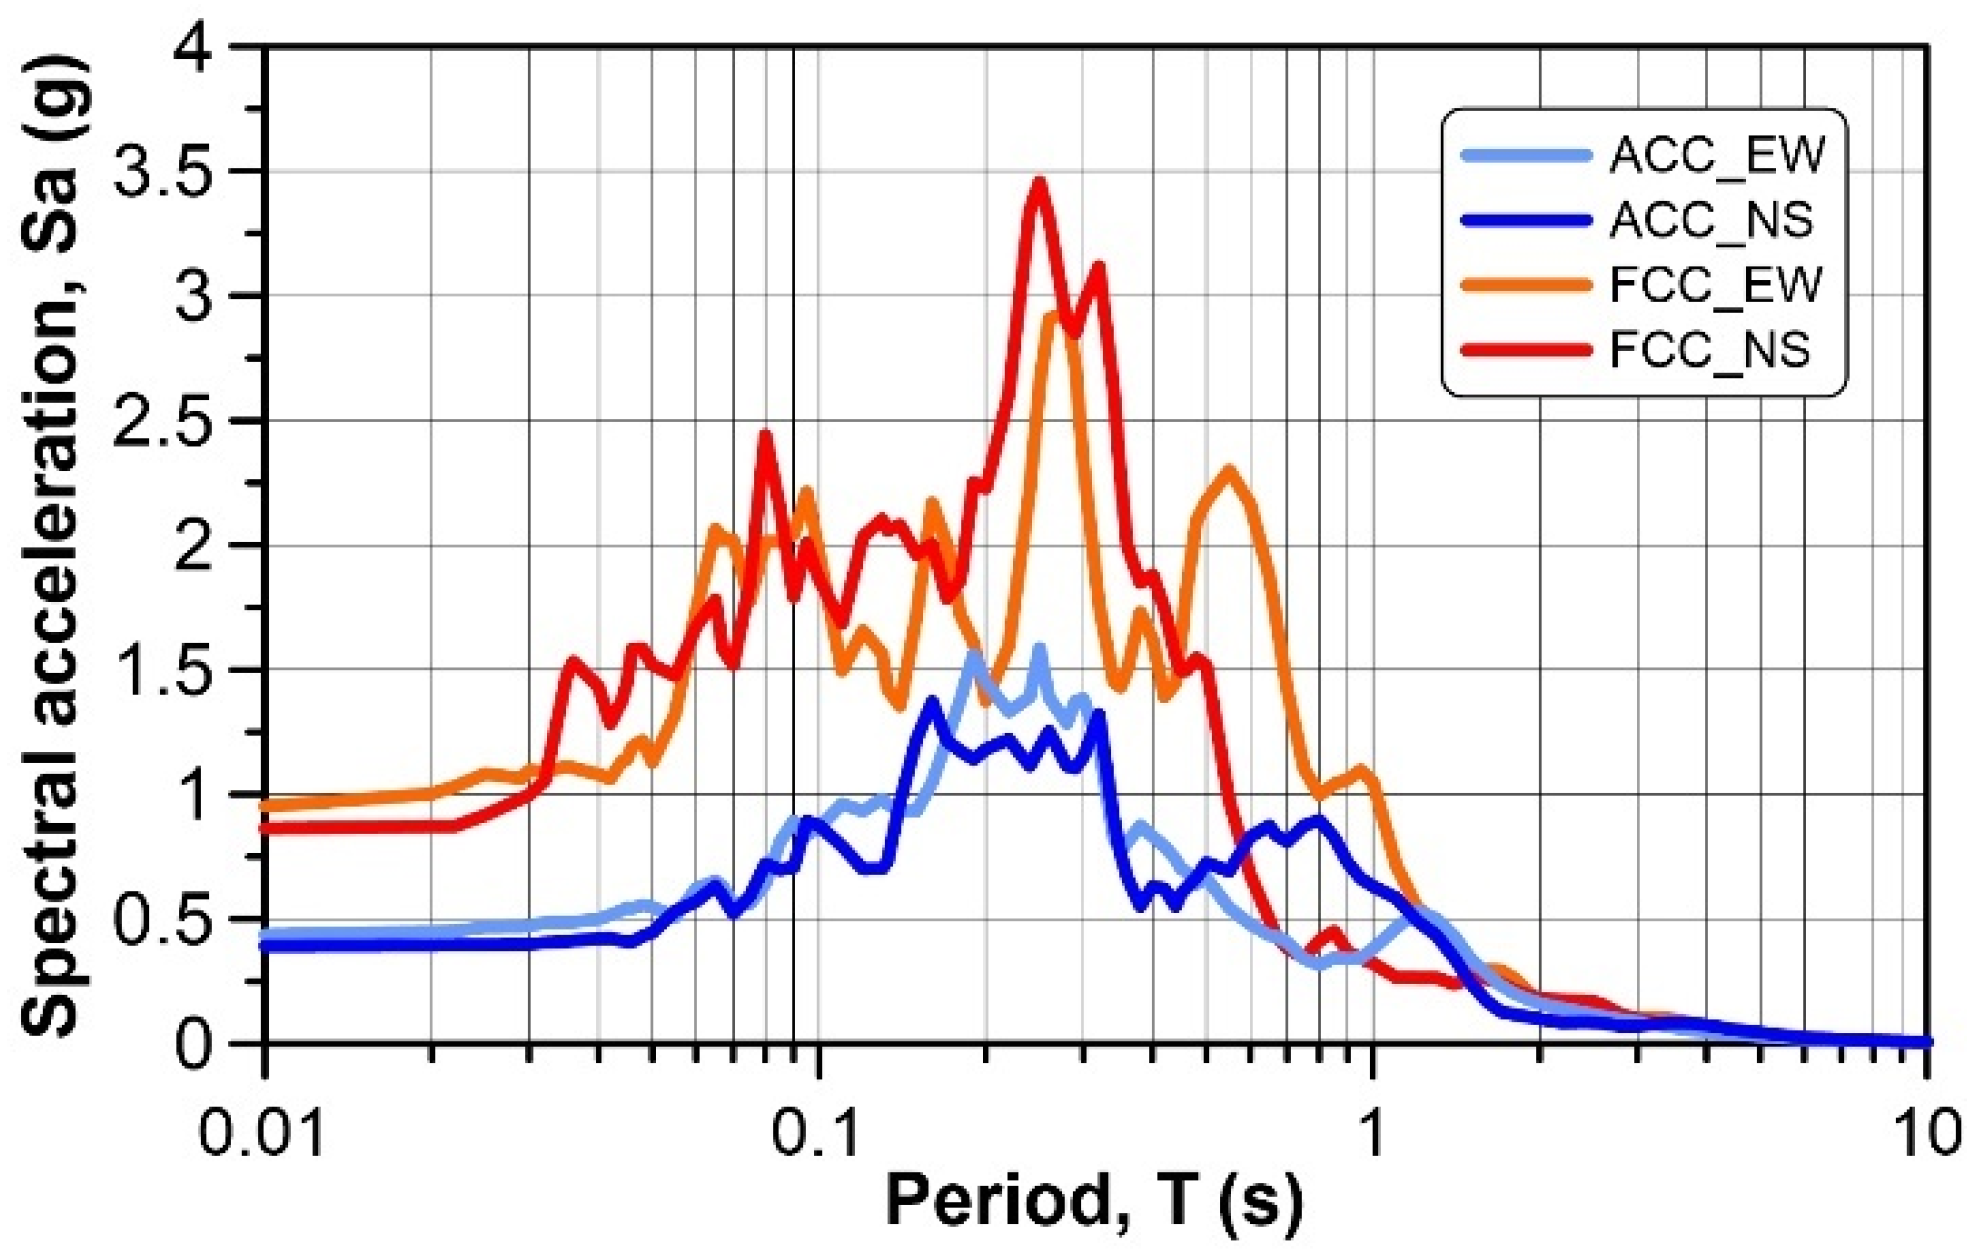
Input Motion Definition

The selection of recorded ground motions was carried out using the Italian strong motion database, i.e., the Italian Accelerometric Archive [107]. The selection criteria consisted of a range of moment magnitude, MW, between 6 and 7, and epicentral distance, Repi, between 1 and 20 km, aimed to reproduce as close as possible the historic seismic event. The range of distance was enlarged after that preliminary research turned no results. The selection provided a set of seven records reported in Table 3 satisfying also additional criteria, such as outcropping rock motions according to the Eurocode 8 [108], no vertical components of the ground motions, and normal fault mechanism.
Table 3 shows that the available records are related to the same seismic event, i.e., the Mw 6.5 30 October 2016, Castelluccio di Norcia earthquake, which is the second mainshock that struck Central Italy between August 2016 and January 2017 (Figure 1). This earthquake can be considered the most similar to the historic one among the available recorded signals, because of the intensity and fault mechanism. Even though the records are reported with an increasing epicentral distance from the top to the bottom of Table 3, the intensity of the motion in terms of Peak Ground Acceleration (PGA) is not decreasing with the distance as expected. For this reason, a deeper study was performed on the subsoil class and topographic category of the selected stations using the datasheets available in the ITACA database (Table 3). Station data showed that only two of the recorded stations, i.e., FCC and ACC, can be considered settled on outcropping seismic bedrock according to the National Building code [80].
With reference to the two-class A stations, the recorded PGA is close to the gravity in FCC (Forca Canapine) station and closer to 0.5 g in ACC (Accumoli). Because of the remarkable uncertainties associated with the intensity of the historic earthquake, both stations, and horizontal components, i.e., North-South (NS) and East-West (EW), were considered as input motions in the seismic response analyses. Figure 19 shows the acceleration response spectra of the EW and NS components of the selected records.
Dynamic analyses according to an equivalent linear approach in the frequency domain were performed with the computer code STRATA [89], in which the selected input motions were applied as outcrop motions at the roof of the seismic bedrock and then propagated up to the ground surface. The model used in the simulations is described in Section 5. The variability of the non-linear and dissipative behavior of the shallowest soil layers (<15 m) was considered by using the six literature curves for gravelly soils introduced in Section 5.2. A total number of 24 equivalent linear analyses (4 input motions × 6 modulus reduction and damping ratio curves) were performed. The effective strain ratio considered in the analyses was 0.65, as generally assumed in the equivalent linear approach.
Figure 20 reports the results of the analyses in terms of vertical profiles of the maximum acceleration for the four selected input motions. Higher variability of the acceleration at the surface is observed for the FCC motions, where a higher or lower range of the shear strains is attained as a function of the non-linearity of the considered curves used in the model.
The peak ground acceleration predicted at the surface is included in the window 0.39–0.88 g. The predicted range of maximum acceleration at the ground level is compatible with the expected values obtained through the Macrointensity vs. PGA functions proposed by [106] and [109], as shown in Figure 21.

6.3. Non-Linear Seismic Response Analyses

The previous dynamic analyses were integrated with further seismic response analyses carried out in the time domain and involved only the first 15 m of the soil column. This set of analyses has the double scope to (i) directly account for the non-linear soil behavior, which more realistically models the soil response under strong motions events; (ii) verify the triggering of a piping sinkhole induced by excess pore water pressure, which is a possible failure mechanism hypothesized for the observed seismic-induced effects.
Concerning this typology of the piping sinkhole, one of the conceivable causes of the failure is some instability associated with seepage that can be induced in the granular composing the roof of existing caves. As a result of pore water pressure build-up due to the shaking of the earthquake, the piezometric head in the sandy/gravelly deposits rose well over the piezometric head in the underlying permeable layers, and a state of critical hydraulic gradient was reached to trigger a type of piping failure. This mechanism was correlated to the excess pore water pressure generated in liquefiable soils after major earthquakes by [110]. Since such a local phenomenon supposedly involved the shallowest part of the soil column, only the first 15 m of the model was considered in the analysis.
To estimate the seismic induced pore water pressure build-up, seismic response analyses were performed in effective stress conditions, i.e., considering the bi-phase nature of the soils.
The acceleration time histories at 15 m depth obtained in the previous equivalent linear dynamic analyses were applied at the base of the 15 m soil column model (Figure 22) as an inside motion, as suggested by [111,112,113].
One-dimensional dynamic analyses in effective stress were carried out by a simplified model, which represents a possible compromise between sophisticated and empirical procedures [97], already described in the previous Section 5.2.
The geotechnical model used in the simulation is the same described in Section 5, where only the [96] curves were adopted. The groundwater table was assumed at 1.3 m depth from the ground level, according to the measures performed during the winter season, while perfect undrained conditions were assumed during the earthquake and, consequently, the dissipation was neglected in the analysis.
Figure 22 shows the results obtained by the non-linear dynamic analyses in effective stress in terms of vertical profiles of the maximum acceleration, shear strain, shear stress, and pore pressure attained. Compared to the hydrostatic distribution of water pressure, the increase of excess pore pressure generated by the seismic shaking is quite limited and not able to justify the damage observed after the earthquake.
The current state of the soil (relative density and effective stress) is incompatible with a failure mechanism involving the excess pore water pressure induced by the shaking (piping sinkhole), which was initially hypothesized based on the description of the historic chronicles.

7. Discussion: The Earthquake-Induced Gas Eruption Hypothesis

The model assessed based on the extensive field survey for the MDF site was used to perform several computations with an increasing level of complexity. The analyses aimed at estimating possible sources of the observed damage hypothesized by several studies. Simplified liquefaction analyses based on both SPT and Vs measurements exclude the attainment of liquefaction in the saturated granular layers. Possible correlations between the failure and the excess pore water pressure induced by the strong shaking in the shallowest layers are furtherly explored through dynamic analyses. Despite the high intensity of the motion expected at the surface, as predicted by equivalent linear and non-linear seismic response analyses, the hydraulic gradient induced by the shaking is not enough to trigger a shallow piping sinkhole, such as described by [110]. The current state of the soil deposits makes unlikely any correlation between the soil failure and the generation of seismic-induced excess pore water pressure.
In summary, the above-described numerical approaches demonstrate that the two sinkholes of the MDF site were not generated by liquefaction of ground failure due to the increase in water overpressures that occurred during the 1703 earthquake.
Therefore, what could be the mechanism of their formation? Here below, a hypothesis considering the involvement of gas upwelling is discussed.
Indeed, historical sources describe a violent emission from the sinkholes of sulfurous whitish water mixed with gravels. The emitted short-lived water column would have reached the height of about 8.5 m [28,30,31,32,33,34]. At this point, all these observations suggest that the formation of the sinkhole was caused by an earthquake-induced gas eruption. The lithological log of PB1 and BH1 boreholes, the hydrogeological setting [60], and the hydrogeochemical versus seismogenesis model in Central Italy triggered by the carbon dioxide degassing can help to elaborate a conceptual model for the gas origin and its eruption at the MDF site during the 1703 earthquake.
The seismogenic background of Central Italy is also based on the upwelling of gas, among which mainly CO2, along the active faults [114,115,116]. In the Apennine area of Central Italy, the CO2 degassing is not complete like in the Tyrrhenian side characterized by widespread volcanic and hydrothermal, and geyser activities [117]. Therefore, in the Apennine area, gas is stored in crustal traps at different scales and depths generating CO2 overpressurized reservoirs, which induce seismicity. In fact, it is well known that fluids reduce the rock’s effective stress and so can trigger fault rupture and generate earthquakes [118]. During the co- and post-seismic stages, the CO2 degassing can cause several documented hydrogeological and hydrochemical changes. In the pre-seismic stage, modifications on hydrogeology and hydrochemistry are debated and this issue is still a work in progress [119,120,121,122]. This seismogenic mechanism was demonstrated for the Mw 6.3 6 April 2009, L’Aquila earthquake and for the 2016–2017 Central Italy seismic sequence [123,124,125].
Coarse-grained lithologies (alternation of calcareous gravel, conglomerate, and breccia) prevail in the 200 m deep PB1 borehole and above all from 57 to 145 m well-cemented conglomerate and breccia and gravels prevail. Moreover, Fe-Mn patinas and nodules rich and oxidized levels are scattered in the sequence above all from 45 to 145 m while karst features occur from 70 to 145 m. The hydrogeological setting at the local scale interpreted from the PB1 well log, refers to an unconfined multilayer coarse-grained aquifer with a shallow groundwater table. The multilayer aquifer is composed of gravel and sand as aquifer with discontinuous intercalation of lenses composed of silty sand (aquitard), cemented conglomerate and fine-grained paleosols. The aquifers correspond to the gravel, the cemented conglomerate and the fine-grained lenses represent local aquicludes sealing the geogas upwelling.
The finding in the PB1 core samples of the Fe/Mn-rich levels and karst features is convincing proof for the CO2 accumulation in local isolated gas pockets. In fact, the mixing with aggressive groundwater characterized by Fe/Mn reduced ions with shallower groundwater favors the oxidation of Fe/Mn ions and so the precipitation of Fe/Mn oxides [126]. Moreover, CO2 makes groundwater aggressive and therefore also promotes the dissolution of karst processes.
Figure 23 illustrates the gas upwelling in the Aterno R. valley during the interseismic period (i.e., before the 1703 earthquake occurrence). Geogas ascended to the top by flowing along the MMF active fault and rising vertically in the MMF hanging wall. So, several overlying geogas pockets are generated at different depths in the multi-layer aquifer of the Aterno R. valley.
Figure 24 shows the conceptual model of the earthquake-induced short-lived gas eruption that presumably occurred in the coseismic stage of the 1703 earthquake at the MDF site. The earthquake shaking produced abruptly the seal cracking and consequently the violent upward gas rise which also involved groundwater. The upward flowing of gas mixed with groundwater also created the piping into the loose aquifer and the gas-induced piping reached the ground level. The turbulent flowing favored the erosion of the fine-grained matrix so making groundwater turbid, as testified by the coeval sources.
Moreover, in the shallow aquifer, the violent piping also produced occasional gravel throwing outside the ground level, as attested by the coeval sources, and the enlargement of the gas-induced sinkhole.
In summary, the two sinkholes that occurred at MDF site during the 1703 earthquake were not generated through liquefaction or ground failure due to the pore water pressure excess induced by the seismic shaking. Therefore, an earthquake-induced gas eruption can explain the sinkholes that originated at MDF site by the violent gas ascent.
Further, it must be noted that the presented conceptual model concerning the geogas uprising along active faults for central-southern Italy is greatly supported by many recent bibliographic references [116,117,127,128,129,130,131,132].

8. Conclusions

The proposed study addressed the ground motion evaluation and seismic site effects caused by near-fault earthquakes. These noteworthy issues deserve special attention in Central Italy, where many urban settlements are placed nearby active faults.
This paper investigated in depth the effects induced by Mw 6.7 2 February 1703, near-fault earthquake at the Madonna delle Fornaci site (Pizzoli, Central Italy), trying to technically interpret the notable ground failure phenomena observed by several coeval sources.
Within a project concerning the assessment of potential liquefaction and co-seismic ground failure, deep and shallow continuous core drilling, geophysical investigations and in-hole tests and extensive field survey have been carried out. They allowed a detailed reconstruction of the geological and geotechnical subsoil, both on a large and local scale. Subsequently, the numerical quantification of the different hypotheses of failure mechanisms was carried out by adopting approaches with an increasing level of complexity. Liquefaction analyses based on empirical charts exclude liquefaction occurrence, while advanced numerical analyses in effective stress showed that the excess pore water pressure induced by the shaking was not the source of the ground failure. Prediction of the expected maximum acceleration at the ground level as obtained by seismic response analyses is compatible with the available relationships based on the macroseismic intensity of the historic earthquakes. Therefore, it has been hypothesized that the sinkhole was likely caused by an earthquake-induced gas eruption with a short-lived duration.
The proposed study is representing an exemplificative workflow to be applied to other case studies and a step forward into the identification of possible co-seismic effects that can be induced by near-fault earthquakes. Moreover, the proposed conceptual model bears significant implications for hazard studies on earthquake- and gas eruption-induced sinkholes.

Author Contributions

Conceptualization, A.C., P.M., M.S. and M.T.; methodology, A.C., P.M., M.S. and M.T.; software, A.C. and M.S.; validation, A.C., P.M., M.S., and M.T.; investigation, P.M., F.P., M.S. and M.T.; writing—original draft preparation, A.C., P.M., F.P., M.S. and M.T.; writing—review and editing, A.C., P.M., M.S. and M.T., project administration, M.T.; funding acquisition, P.M. and M.T. All authors have read and agreed to the published version of the manuscript.

Funding

This work was carried out as part of the Agreement between Regione Abruzzo—DPC029—and UNIVAQ-DICEAA: “Research project on 3rd level seismic microzonation of L’Aquila Municipality pilot areas”. This work was also accomplished as part of WP ‘Site response analysis and liquefaction’ in the framework of the research programme funded by Italian Civil Protection through the ReLUIS Consortium (ReLUIS-DPC 2019–2021). The PB1 borehole was performed by ISPRA within the CARG Project (Italian geological map at 1:50,000 scale—sheet n. 348 Antrodoco).

Data Availability Statement

The data presented in this study are available on request from the corresponding author.

Acknowledgments

The authors are indebted to Gaetano De Luca for the fruitful suggestions on the Seismic Refraction investigations. Moreover, we would like to warmly thank the four reviewers (among which Carla Barnaba) for the valuable comments that improved the final version of the paper. Two of the authors (A.C. and M.S.) were supported by the Italian Ministry of Research through the ‘Attraction and International Mobility’ project.

Conflicts of Interest

The authors declare no conflict of interest.

References

  1. Galli, P. New empirical relationships between magnitude and distance for liquefaction. Tectonophysics 2000, 324, 169–187. [Google Scholar] [CrossRef]
  2. Gruppo di Lavoro, M.S. Indirizzi e criteri per la microzonazione sismica—Guidelines for seismic microzonation. Conferenza Delle Regioni e Delle Provincie Autonome; Dipartimento Della Protezione Civile: Rome, Italy, 2008; Volume 3, Available online: https://www.centromicrozonazionesismica.it/it/download/category/7-indirizzi-e-criteri-per-la-microzonazione-sismica (accessed on 6 December 2021).
  3. Guerrieri, L.; Blumetti, A.M.; Comerci, V.; Di Manna, P.; Michetti, A.M.; Vittori, E.; Serva, L. Surface Faulting Hazard in Italy: Towards a first assessment based on the ITHACA database. In Engineering Geology for Society and Territory; Springer: Berlin/Heidelberg, Germany, 2015; Volume 5, pp. 1021–1025. [Google Scholar]
  4. Storti, F.; Aldega, L.; Balsamo, F.; Corrado, S.; Del Monaco, F.; Di Paolo, L.; Mastalerz, M.; Monaco, P.; Tallini, M. Evidence for strong middle Pleistocene earthquakes in the epicentral area of the 6 April 2009 L’Aquila seismic event from sediment paleofluidization and overconsolidation. J. Geophys. Res. Solid Earth 2013, 118. [Google Scholar] [CrossRef]
  5. Civico, R.; Pucci, S.; Villani, F.; Pizzimenti, L.; De Martini, P.M.; Nappi, R.; Group, O.E.W. Surface ruptures following the 30 October 2016 M w 6.5 Norcia earthquake, central Italy. J. Maps 2018, 14, 151–160. [Google Scholar] [CrossRef] [Green Version]
  6. Berardi, R.; Margottini, C.; Molin, D.; Parisi, A. Soil liquefaction: Case histories in Italy. Tectonophysics 1991, 193, 141–164. [Google Scholar] [CrossRef]
  7. Boncio, P.; Amoroso, S.; Vessia, G.; Francescone, M.; Nardone, M.; Monaco, P.; Famiani, D.; Di Naccio, D.; Mercuri, A.; Manuel, M.R.; et al. Evaluation of liquefaction potential in an intermountain Quaternary lacustrine basin (Fucino basin, central Italy). Bull. Earthq. Eng. 2018, 16, 91–111. [Google Scholar] [CrossRef]
  8. Boncio, P.; Amoroso, S.; Galadini, F.; Galderisi, A.; Iezzi, G.; Liberi, F. Earthquake-induced liquefaction features in a late Quaternary fine-grained lacustrine succession (Fucino Lake, Italy): Implications for microzonation studies. Eng. Geol. 2020, 272, 105621. [Google Scholar] [CrossRef]
  9. Miranda, E.; Brzev, S.; Bijelic, N.; Arbanas, Ž.; Bartolac, M.; Jagodnik, V.; Lazarević, D.; Mihalić Arbanas, S.; Zlatović, S.; Acosta, A.; et al. Petrinja, Croatia December 29, 2020, Mw 6.4: Earthquake Joint Reconnaissance Report (JRR). PRJ-2959, Released: 22 January 2021. DesignSafe 2021, 206. [Google Scholar]
  10. Pollak, D.; Gulam, V.; Novosel, T.; Avanić, R.; Tomljenović, B.; Hećej, N.; Terzić, J.; Stipčević, J.; Bačić, M.; Kurečić, T. The preliminary inventory of coseismic ground failures related to December 2020–January 2021 Petrinja earthquake series. Geol. Croat. 2021, 74, 189–208. [Google Scholar] [CrossRef]
  11. Tondi, E.; Blumetti, A.M.; Čičak, M.; Di Manna, P.; Galli, P.; Invernizzi, C.; Mazzoli, S.; Piccardi, L.; Valentini, G.; Vittori, E. ‘Conjugate’coseismic surface faulting related with the 29 December 2020, Mw 6.4, Petrinja earthquake (Sisak-Moslavina, Croatia). Sci. Rep. 2021, 11, 1–15. [Google Scholar]
  12. Tomac, I.; Zlatović, S.; Zekkos, A.; Bleiziffer, J.; Domitrović, D.; Frangen, T.; Zelić, B.K.; Matoš, B.; Matešić, D.; Miha, I.; et al. Geotechnical Reconnaissance and Engineering Effects of the December 29, 2020, M6.4 Petrinja, Croatia Earthquake, and Associated Seismic Sequence; Report GEER-072, 2021. Available online: http://www.geerassociation.org/index.php/component/geer_reports/?view=geerreports&layout=build&id=99 (accessed on 20 December 2021).
  13. Ford, D.C.; Williams, P.W. Karst Geomorphology and Hydrology; Unwin Hyman: London, UK, 1989; Volume 601. [Google Scholar]
  14. Parise, M. Sinkholes. Encyclopedia of Caves; Elsevier: Amsterdam, The Netherlands, 2019; pp. 934–942. [Google Scholar]
  15. Rose, M.D.; Federico, A.; Parise, M. Sinkhole genesis and evolution in Apulia, and their interrelations with the anthropogenic environment. Nat. Hazards Earth Syst. Sci. 2004, 4, 747–755. [Google Scholar] [CrossRef] [Green Version]
  16. Gutiérrez, F.; Galve, J.P.; Guerrero, J.; Lucha, P.; Cendrero, A.; Remondo, J.; Bonachea, J.; Gutiérrez, M.; Sánchez, J.A. The origin, typology, spatial distribution and detrimental effects of the sinkholes developed in the alluvial evaporite karst of the Ebro River valley downstream of Zaragoza city (NE Spain). Earth Surf. Process. Landf. J. Br. Geomorphol. Res. Gr. 2007, 32, 912–928. [Google Scholar] [CrossRef]
  17. Jia, L.; Meng, Y.; Li, L.; Yin, R. A multidisciplinary approach in cover-collapse sinkhole analyses in the mantle karst from Guangzhou City (SE China). Nat. Hazards 2021, 108, 1389–1410. [Google Scholar] [CrossRef]
  18. Zumpano, V.; Pisano, L.; Parise, M. An integrated framework to identify and analyze karst sinkholes. Geomorphology 2019, 332, 213–225. [Google Scholar] [CrossRef]
  19. Del Prete, S.; Iovine, G.; Parise, M.; Santo, A. Origin and distribution of different types of sinkholes in the plain areas of Southern Italy. Geodin. Acta 2010, 23, 113–127. [Google Scholar] [CrossRef]
  20. Caramanna, G.; Ciotoli, G.; Nisio, S. A review of natural sinkhole phenomena in Italian plain areas. Nat. Hazards 2008, 45, 145–172. [Google Scholar] [CrossRef]
  21. Santo, A.; Ascione, A.; Del Prete, S.; Di Crescenzo, G.; Santangelo, N. Collapse sinkholes in the carbonate massifs of Central and Southern Apennines. Acta Carsologica 2011, 40. [Google Scholar] [CrossRef]
  22. Abelson, M.; Baer, G.; Shtivelman, V.; Wachs, D.; Raz, E.; Crouvi, O.; Kurzon, I.; Yechieli, Y. Collapse-sinkholes and radar interferometry reveal neotectonics concealed within the Dead Sea basin. Geophys. Res. Lett. 2003, 30. [Google Scholar] [CrossRef]
  23. Broughton, P.L. Breccia pipe and sinkhole linked fluidized beds and debris flows in the Athabasca Oil Sands: Dynamics of evaporite karst collapse-induced fault block collisions. Bull. Can. Pet. Geol. 2017, 65, 200–234. [Google Scholar] [CrossRef]
  24. Chiaro, G.; Kiyota, T.; Pokhrel, R.M.; Goda, K.; Katagiri, T.; Sharma, K. Reconnaissance report on geotechnical and structural damage caused by the 2015 Gorkha Earthquake, Nepal. Soils Found. 2015, 55, 1030–1043. [Google Scholar] [CrossRef] [Green Version]
  25. Comerci, V.; Vittori, E.; Blumetti, A.M.; Brustia, E.; Di Manna, P.; Guerrieri, L.; Lucarini, M.; Serva, L. Environmental effects of the December 28, 1908, Southern Calabria–Messina (Southern Italy) earthquake. Nat. Hazards 2015, 76, 1849–1891. [Google Scholar] [CrossRef]
  26. Lunina, O.; Andreev, A.; Gladkov, A. The 1950 M w = 6.9 Mondy earthquake in southern East Siberia and associated deformations: Facts and uncertainties. J. Seismol. 2015, 19, 171–189. [Google Scholar] [CrossRef]
  27. Santo, A.; Santangelo, N.; De Falco, M.; Forte, G.; Valente, E. Cover collapse sinkhole over a deep buried carbonate bedrock: The case study of Fossa San Vito (Sarno-Southern Italy). Geomorphology 2019, 345, 106838. [Google Scholar] [CrossRef]
  28. Anonymous. Relazione Distinta de’ Danni Cagionati da’ Passati Tremuoti nel Regno di Napoli e Nello Stato di Santa Chiesa in Quest’anno 1703; Napoli and Bologna. 1703. [Google Scholar]
  29. Antinori, A.L. Annali Degli Abruzzi Dalle Origini All’anno 1777; (edizione in facsimile); Arnaldo Forni Editore: Sala Bolognese, Italy, 1971; Volume 24. [Google Scholar]
  30. Baglivi, G.; Santorini, G.D.; Pellegrini, R. Opere Complete Medico-Pratiche ed Anatomiche; S. Coen: Florence, Italy, 1842. [Google Scholar]
  31. Quinzi, A.; Cherubini, G.F.; Ciampella, C.; Galle, S. Relazione su L’essere Della Città dell’Aquila, e Delle Cose più Notabili Succedute Nella Medema, e Nelli Luoghi Della sua Pro-Vincia per li Terremoti Occorsi nel Mese di Gennaro e di Febbraro 1703 Anno Corrente [Con Emendazioni di C.Garofalo], in V.Zannet. “Bollettino della Società di Storia Patria Anton Ludovico Antinori negli Abruzzi”. L’Aquila. Available online: http://storing.ingv.it/cfti/cfti4/quakes/01285.html#bibliography (accessed on 20 December 2021).
  32. Uria De Llanos, A. Relazione, Overo Itinerario Fatto Dall’auditore D.Alfonso Uria De Llanos per Riconoscere li Danni Causati Dalli Passati Terre-moti Seguiti li 14 Gennaro, e 2 Febraro MDCCIII con il Numero de’ Morti, e Feriti Nella Provincia dell’Aquila, e Tutti li Luoghi; Stamperia Gaetano Zenobi, Roma, 1703. Available online: https://gallica.bnf.fr/ark:/12148/bpt6k3100317/f1.item (accessed on 20 December 2021).
  33. Blumetti, A.M. Neotectonic investigations and evidence of paleoseismicity in the epicentral area of the January–February 1703, Central Italy, earthquakes. Perspect. Paleoseismol. 1995, 6, 83–100. [Google Scholar]
  34. Galadini, F. I terremoti in Abruzzo e la cultura sismologica tra la fine dell’Ottocento ei primi del Novecento. In Pareva Quel Giorno dell’Universal Giuditio; Edizioni Kirke: Avezzano, Italy, 2013; 256p. [Google Scholar]
  35. Galli, P.A.C.; Giaccio, B.; Messina, P.; Peronace, E.; Zuppi, G.M. Palaeoseismology of the L’Aquila faults (central Italy, 2009, Mw6.3 earthquake): Implications for active fault linkage. Geophys. J. Int. 2011, 187, 1119–1134. [Google Scholar] [CrossRef] [Green Version]
  36. Galli, P.; Giaccio, B.; Messina, P. The 2009 central Italy earthquake seen through 0.5 Myr-long tectonic history of the L’Aquila faults system. Quat. Sci. Rev. 2010, 29, 3768–3789. [Google Scholar] [CrossRef]
  37. Moro, M.; Bosi, V.; Galadini, F.; Galli, P.; Giaccio, B.; Messina, P.; Sposato, A. Analisi paleosismologiche lungo la faglia del M. Marine (alta valle dell’Aterno): Risultati preliminari. Quaternario 2002, 15, 267–278. [Google Scholar]
  38. Cello, G.; Mazzoli, S.; Tondi, E. The crustal fault structure responsible for the 1703 earthquake sequence of central Italy. J. Geodyn. 1998, 26, 443–460. [Google Scholar] [CrossRef]
  39. Galli, P.; Galadini, F.; Pantosti, D. Twenty years of paleoseismology in Italy. Earth-Sci. Rev. 2008, 88, 89–117. [Google Scholar] [CrossRef]
  40. Rovida, A.; Mario, L.; Romano, C.; Lolli, B.; Gasperini, P. The Italian earthquake catalogue CPTI15. Bull. Earthq. Eng. 2020, 18, 2953–2984. [Google Scholar] [CrossRef]
  41. Rovida, A.; Locati, M.; Camassi, R.; Lolli, B.; Gasperini, P.; Antonucci, A. The Italian Earthquake Catalogue CPTI15—Version 3.0; Istituto Nazionale di Geofisica e Vulcanologia: Rome, Italy, 2021. [Google Scholar]
  42. Galadini, F.; Galli, P. Active tectonics in the central Apennines (Italy)–input data for seismic hazard assessment. Nat. Hazards 2000, 22, 225–268. [Google Scholar] [CrossRef]
  43. Giraudi, C. Middle to Late Holocene glacial variations, periglacial processes and alluvial sedimentation on the higher Apennine massifs (Italy). Quat. Res. 2005, 64, 176–184. [Google Scholar] [CrossRef]
  44. Meletti, C.; Montaldo, V. Stime di Pericolosità Sismica per Diverse Probabilità di Superamento in 50 anni: Valori di ag. Progetto INGV-DPC S1, Deliverable D2; Istituto Nazionale di Geofisica e Vulcanologia: Rome, Italy, 2007. [Google Scholar]
  45. Guidoboni, E.; Ferrari, G.; Mariotti, D.; Comastri, A.; Tarabusi, G.; Sgattoni, G.; Valensise, G. CFTI5Med, Catalogo dei Forti Terremoti in Italia (461 aC-1997) e nell’Area Mediterranea (760 aC–1500); Istituto Nazionaledi Geofisicae Vulcanologia: Rome, Italy, 2018. [Google Scholar]
  46. Cinti, F.R.; Civico, R.; Blumetti, A.M.; Chiarini, E.; La Posta, E.; Pantosti, D.; Papasodaro, F.; Smedile, A.; De Martini, P.M.; Villani, F. Evidence for surface faulting earthquakes on the Montereale fault system (Abruzzi Apennines, central Italy). Tectonics 2018, 37, 2758–2776. [Google Scholar] [CrossRef]
  47. Patacca, E.; Sartori, R.; Scandone, P. Tyrrhenian basin and Apenninic arcs: Kinematic relations since late Tortonian times. Mem. della Soc. Geol. Ital. 1990, 45, 425–451. [Google Scholar]
  48. Royden, L.H. Evolution of retreating subduction boundaries formed during continental collision. Tectonics 1993, 12, 629–638. [Google Scholar] [CrossRef]
  49. Cosentino, D.; Cipollari, P.; Marsili, P.; Scrocca, D. Geology of the central Apennines: A regional review. J. Virtual Explor. 2010, 36. [Google Scholar] [CrossRef]
  50. Pierantoni, P.P.; Chicco, J.; Costa, M.; Invernizzi, C. Plio-Quaternary transpressive tectonics: A key factor in the structural evolution of the outer Apennine–Adriatic system, Italy. J. Geol. Soc. 2019, 176, 1273–1283. [Google Scholar] [CrossRef]
  51. Vezzani, L.; Ghisetti, F.; Bigozzi, A.; Follador, U.; Casnedi, R. Carta Geologica dell’Abruzzo: Scala 1: 100,000; SELCA: Florence, Italy, 1998. [Google Scholar]
  52. Cosentino, D.; Asti, R.; Nocentini, M.; Gliozzi, E.; Kotsakis, T.; Mattei, M.; Esu, D.; Spadi, M.; Tallini, M.; Cifelli, F. New insights into the onset and evolution of the central Apennine extensional intermontane basins based on the tectonically active L’Aquila Basin (central Italy). Bulletin 2017, 129, 1314–1336. [Google Scholar] [CrossRef] [Green Version]
  53. Cavinato, G.P.; Carusi, C.; Dall’Asta, M.; Miccadei, E.; Piacentini, T. Sedimentary and tectonic evolution of Plio-Pleistocene alluvial and lacustrine deposits of Fucino Basin (central Italy). Sediment. Geol. 2002, 148, 29–59. [Google Scholar] [CrossRef]
  54. Tallini, M.; Spadi, M.; Cosentino, D.; Nocentini, M.; Cavuoto, G.; Di Fiore, V. High-resolution seismic reflection exploration for evaluating the seismic hazard in a Plio-Quaternary intermontane basin (L’Aquila downtown, central Italy). Quat. Int. 2019, 532, 34–47. [Google Scholar] [CrossRef]
  55. Antonielli, B.; Della Seta, M.; Esposito, C.; Mugnozza, G.S.; Schilirò, L.; Spadi, M.; Tallini, M. Quaternary rock avalanches in the Apennines: New data and interpretation of the huge clastic deposit of the L’Aquila Basin (central Italy). Geomorphology 2020, 361, 107194. [Google Scholar] [CrossRef]
  56. Messina, P.; Bosi, C.; Moro, M. Sedimenti e forme quaternari nell’alta valle dell’Aterno (L’Aquila). Quaternario 2003, 16, 231–239. [Google Scholar]
  57. Tallini, M.; Cavuoto, G.; Del Monaco, F.; Di Fiore, V.; Mancini, M.; Caielli, G.; Cavinato, G.P.; De Franco, R.; Pelosi, N.; Rapolla, A. Seismic surveys integrated with geological data for in-depth investigation of Mt. Pettino active Fault area (Western L’Aquila Basin). Ital. J. Geosci. 2012, 131, 389–402. [Google Scholar] [CrossRef]
  58. Messina, P.; Moro, M.; Speranza, F. Primi risultati di stratigrafia magnetica su alcune formazioni continentali dell’alta valle dell’Aterno (Italia centrale). Quaternario 2001, 14, 167–172. [Google Scholar]
  59. Bosi, C.; Galadini, F.; Giaccio, B.; Messina, P.; Sposato, A. Plio-Quaternary continental deposits in the Latium-Abruzzi Apennines: The correlation of geological events across different intermontane basins. Quaternario 2003, 16, 55–76. [Google Scholar]
  60. Conte, G.; Martarelli, L.; Monti, G.M.; Motteran, G.; Scalise, A.R.; Serafini, R.; Silvi, A. Caratteristiche idrogeologiche del foglio n. 348 “Antrodoco della carta Geologica d’Italia alla scala 1: 50.000 “Hydrogeological features of the sheet n. 348 ‘Antrodoco’ area, Geological Map of Italy, 1: 50.000 scale. Mem. Descr. Cart. Geol. d’It 2018, 103, 7–60. [Google Scholar]
  61. Berti, D.; Blumetti, A.; Capotorti, F.; Chiarini, E.; D’Ambrogi, C.; Di Stefano, R.; Fiorentino, A.; Guerrieri, L.; La Posta, E.; Marino, M. La geologia del Foglio n. 348 Antrodoco. Mem. Descr. Cart. Geol. d’Italia 2009, 88, 134. [Google Scholar]
  62. Nakamura, Y. A method for dynamic characteristics estimation of subsurface using microtremor on the ground surface. Railw. Tech. Res. Inst. Q. Rep. 1989, 30, 25–33. [Google Scholar]
  63. Del Monaco, F.; Tallini, M.; De Rose, C.; Durante, F. HVNSR survey in historical downtown L’Aquila (central Italy): Site resonance properties vs. subsoil model. Eng. Geol. 2013, 158, 34–47. [Google Scholar] [CrossRef]
  64. Di Giulio, G.; Ercoli, M.; Vassallo, M.; Porreca, M. Investigation of the Norcia basin (Central Italy) through ambient vibration measurements and geological surveys. Eng. Geol. 2020, 267, 105501. [Google Scholar] [CrossRef]
  65. Durante, F.; Di Giulio, G.; Tallini, M.; Milana, G.; Macerola, L. A multidisciplinary approach to the seismic characterization of a mountain top (Monteluco, central Italy). Phys. Chem. Earth 2017, 98, 119–135. [Google Scholar] [CrossRef]
  66. Macerola, L.; Tallini, M.; Di Giulio, G.; Nocentini, M.; Milana, G. The 1-D and 2-D Seismic Modeling of Deep Quaternary Basin (Downtown L’Aquila, Central Italy). Earthq. Spectra 2019, 35, 1689–1710. [Google Scholar] [CrossRef]
  67. Gosar, A.; Lenart, A. Mapping the thickness of sediments in the Ljubljana Moor basin (Slovenia) using microtremors. Bull. Earthq. Eng. 2010, 8, 501–518. [Google Scholar] [CrossRef]
  68. Lanzo, G.; Tallini, M.; Milana, G.; Di Capua, G.; Del Monaco, F.; Pagliaroli, A.; Peppoloni, S. The Aterno valley strong-motion array: Seismic characterization and determination of subsoil model. Bull. Earthq. Eng. 2011, 9, 1855–1875. [Google Scholar] [CrossRef] [Green Version]
  69. Saroli, M.; Albano, M.; Modoni, G.; Moro, M.; Milana, G.; Spacagna, R.-L.; Falcucci, E.; Gori, S.; Mugnozza, G.S. Insights into bedrock paleomorphology and linear dynamic soil properties of the Cassino intermontane basin (Central Italy). Eng. Geol. 2020, 264, 105333. [Google Scholar] [CrossRef]
  70. Tallini, M.; Lo Sardo, L.; Spadi, M. Seismic site characterisation of Red Soil and soil-building resonance effects in L’Aquila downtown (Central Italy). Bull. Int. Assoc. Eng. Geol. 2020, 79, 4021–4034. [Google Scholar] [CrossRef]
  71. Spadi, M.; Tallini, M.; Albano, M.; Cosentino, D.; Nocentini, M.; Saroli, M. New insights on bedrock morphology and local seismic amplification of the Castelnuovo village (L’Aquila Basin, central Italy). In press.
  72. Acerra, C.; Havenith, H.B.; Zacharopoulos, S. SESAME Guidelines for the Implementation of the H/V Spectral Ratio Technique on Ambient Vibrations-Measurements, Processing and Interpretations; European Commission: Brussels, Belgium, 2004. [Google Scholar]
  73. Wathelet, M.; Chatelain, J.; Cornou, C.; Di Giulio, G.; Guillier, B.; Ohrnberger, M.; Savvaidis, A. Geopsy: A user-friendly open-source tool set for ambient vibration processing. Seismol. Res. Lett. 2020, 91, 1878–1889. [Google Scholar] [CrossRef]
  74. Konno, K.; Ohmachi, T. Ground-motion characteristics estimated from spectral ratio between horizontal and vertical components of microtremor. Bull. Seismol. Soc. Am. 1998, 88, 228–241. [Google Scholar] [CrossRef]
  75. Tatoni, S.; D’Onofrio, K.; Presciutti, A. Microzonazione Sismica di Livello 3—Comune di Pizzoli (AQ) Relazione Illustrativa; Comune di Pizzoli (L’Aquila), Italy, 2018. Available online: https://www.comune.pizzoli.aq.it/c066072/zf/index.php/servizi-aggiuntivi/index/index/idtesto/57 (accessed on 20 December 2021).
  76. Albarello, D.; Castellaro, S. Tecniche sismiche passive: Indagini a stazione singola. Ing. Sismica 2011, 38, 32–49. [Google Scholar]
  77. Martelli, L. Assessment of Seismic Bedrock in Deep Alluvial Plains. Case Studies from the Emilia-Romagna Plain. Geosciences 2021, 11, 297. [Google Scholar] [CrossRef]
  78. Cubrinovski, M.; Ishihara, K. Empirical correlation between SPT N-value and relative density for sandy soils. Soils Found. 1999, 39, 61–71. [Google Scholar] [CrossRef] [Green Version]
  79. Bolton, M.D. The strength and dilatancy of sands. Geotechnique 1986, 36, 65–78. [Google Scholar] [CrossRef] [Green Version]
  80. NTC, D.M. 17.01.2018 Aggiornamento delle Norme Tecniche per le Costruzioni—Italian Building Code, Rome, 2018. Available online: chrome-extension://efaidnbmnnnibpcajpcglclefindmkaj/viewer.html?pdfurl=https%3A%2F%2Fwww.gazzettaufficiale.it%2Feli%2Fgu%2F2018%2F02%2F20%2F42%2Fso%2F8%2Fsg%2Fpdf&clen=9888288 (accessed on 20 December 2021).
  81. Foti, S.; Hollender, F.; Garofalo, F.; Albarello, D.; Asten, M.; Bard, P.Y.; Comina, C.; Cornou, C.; Cox, B.; Di Giulio, G.; et al. Guidelines for the Good Practice of Surface Wave Analysis: A Product of the InterPACIFIC Project. Bull. Earthq. Eng. 2018, 16, 2367–2420. [Google Scholar] [CrossRef]
  82. Ibs-von Seht, M.; Wohlenberg, J. Microtremor measurements used to map thickness of soft sediments. Bull. Seismol. Soc. Am. 1999, 89, 250–259. [Google Scholar] [CrossRef]
  83. D’Amico, V.; Picozzi, M.; Baliva, F.; Albarello, D. Ambient noise measurements for preliminary site-effects characterization in the urban area of Florence, Italy. Bull. Seismol. Soc. Am. 2008, 98, 1373–1388. [Google Scholar] [CrossRef]
  84. Parolai, S.; Picozzi, M.; Richwalski, S.M.; Milkereit, C. Joint inversion of phase velocity dispersion and H/V ratio curves from seismic noise recordings using a genetic algorithm, considering higher modes. Geophys. Res. Lett. 2005, 32. [Google Scholar] [CrossRef] [Green Version]
  85. Picozzi, M.; Parolai, S.; Albarello, D. Statistical analysis of noise horizontal-to-vertical spectral ratios (HVSR). Bull. Seismol. Soc. Am. 2005, 95, 1779–1786. [Google Scholar] [CrossRef]
  86. Picozzi, M.; Albarello, D. Combining genetic and linearized algorithms for a two-step joint inversion of Rayleigh wave dispersion and H/V spectral ratio curves. Geophys. J. Int. 2007, 169, 189–200. [Google Scholar] [CrossRef] [Green Version]
  87. Albarello, D.; Cesi, C.; Eulilli, V.; Guerrini, F.; Lunedei, E.; Paolucci, E.; Pileggi, D.; Puzzilli, L.M. The contribution of the ambient vibration prospecting in seismic microzoning: An example from the area damaged by the April 6, 2009 L’Aquila (Italy) earthquake. Boll. Geof. Teor. Appl. 2011, 52, 513–538. [Google Scholar]
  88. Foti, S.; Parolai, S.; Albarello, D.; Picozzi, M. Application of surface-wave methods for seismic site characterization. Surv. Geophys. 2011, 32, 777–825. [Google Scholar] [CrossRef] [Green Version]
  89. Kottke, A.R.; Wang, X.; Rathje, E.M. Strata Technical Manual. 2018. Available online: https://github.com/arkottke/strata/blob/master/manual/manual.pdf (accessed on 6 December 2021).
  90. Cococcia, S. Analisi della risposta sismica locale e dei fenomeni di liquefazione indotti dal sisma del 6 aprile 2009 nel sito di Ponte Rasarolo (L’Aquila). Master’s Thesis, University of L’Aquila, L’Aquila, Italy, 2017. [Google Scholar]
  91. Darendeli, D.M. Development of a New Family of Normalized Modulus Reduction and Material Damping Curves; The University of Texas at Austin: Austin, TX, USA, 2001. [Google Scholar]
  92. Kokusho, T.; Esashi, Y. Cyclic triaxial test on sands and coarse materials. In Proceedings of the 10th International Conference on Soil Mechanics and Foundation Engineering, Stockholm, Sweden, 15–19 June 1981; 1981; Volume 1, pp. 673–679. [Google Scholar]
  93. Rollins, K.M.; Evans, M.D.; Diehl, N.B.; Daily, W.D., III. Shear modulus and damping relationships for gravels. J. Geotech. Geoenvironmental Eng. 1998, 124, 396–405. [Google Scholar] [CrossRef]
  94. Menq, F.-Y. Dynamic Properties of Sandy and Gravelly Soils; The Univeristy of Texas at Austin: Austin, TX, USA, 2003; Volume 310. [Google Scholar]
  95. Modoni, G.; Gazzellone, A. Simplified theoretical analysis of the seismic response of artificially compacted gravels. In Proceedings of the International Conferences on Recent Advances in Geotechnical Earthquake Engineering and Soil Dynamics, San Diego, CA, USA, 24–29 May 2010. [Google Scholar]
  96. Rollins, K.M.; Singh, M.; Roy, J. Simplified Equations for Shear-Modulus Degradation and Damping of Gravels. J. Geotech. Geoenvironmental Eng. 2020, 146, 04020076. [Google Scholar] [CrossRef]
  97. Chiaradonna, A.; Tropeano, G.; D’Onofrio, A.; Silvestri, F. Development of a simplified model for pore water pressure build-up induced by cyclic loading. Bull. Earthq. Eng. 2018. [Google Scholar] [CrossRef]
  98. Tropeano, G.; Chiaradonna, A.; d’Onofrio, A.; Silvestri, F. An innovative computer code for 1D seismic response analysis including shear strength of soils. Geotechnique 2016, 66, 95–105. [Google Scholar] [CrossRef]
  99. Chiaradonna, A.; Tropeano, G.; d’Onofrio, A.; Silvestri, F. A Simplified Method for Pore Pressure Buildup Prediction: From Laboratory Cyclic Tests to the 1D Soil Response Analysis in Effective Stress Conditions. Procedia Eng. 2016, 158, 302–307. [Google Scholar] [CrossRef]
  100. Tropeano, G.; Chiaradonna, A.; d’Onofrio, A.; Silvestri, F. A numerical model for non-linear coupled analysis of the seismic response of liquefiable soils. Comput. Geotech. 2019, 105. [Google Scholar] [CrossRef]
  101. Chiaradonna, A.; D’onofrio, A.; Silvestri, F.; Tropeano, G. Prediction of non-linear soil behaviour in saturated sand: A loosely coupled approach for 1d effective stress analysis. In Earthquake Geotechnical Engineering for Protection and Development of Environment and Constructions; CRC Press/Balkema: Leiden, The Netherlands, 2019; pp. 1746–1753. [Google Scholar]
  102. Chiaradonna, A.; Flora, A.; d’Onofrio, A.; Bilotta, E. A pore water pressure model calibration based on in-situ test results. Soils Found. 2020, 60, 327–341. [Google Scholar] [CrossRef]
  103. Boulanger, R.W.; Idriss, I.M. CPT and SPT based liquefaction triggering procedures. Cent. Geotech. Model. Report N. UCD/ CGM-14/01. 2014, 134. [Google Scholar]
  104. Andrus, R.D.; Stokoe, K.H., II. Liquefaction resistance of soils from shear-wave velocity. J. Geotech. Geoenvironmental Eng. 2000, 126, 1015–1025. [Google Scholar] [CrossRef]
  105. Kayen, R.; Moss, R.E.S.; Thompson, E.M.; Seed, R.B.; Cetin, K.O.; Der Kiureghian, A.; Tanaka, Y.; Tokimatsu, K. Shear-wave velocity–based probabilistic and deterministic assessment of seismic soil liquefaction potential. J. Geotech. Geoenvironmental Eng. 2013, 139, 407–419. [Google Scholar] [CrossRef] [Green Version]
  106. Gomez-Capera, A.A.; D’Amico, M.; Lanzano, G.; Locati, M.; Santulin, M. Relationships between ground motion parameters and macroseismic intensity for Italy. Bull. Earthq. Eng. 2020, 18, 5143–5164. [Google Scholar] [CrossRef]
  107. Luzi, L.; Pacor, F.; Puglia, R. Italian Accelerometric Archive v 2.3. Istituto Nazionale di Geofisica e Vulcanologia. Dipartimento Protezione Civile Nazionale. 2017. Available online: http://itaca.mi.ingv.it/ItacaNet_31/#/home (accessed on 6 December 2021).
  108. JRC European Commission. Eurocode 8: Seismic Design of Buildings Worked Examples; JRC European Commission: Bruxelles, Belgium, 2004; Volume 1. [Google Scholar]
  109. Masi, A.; Chiauzzi, L.; Nicodemo, G.; Manfredi, V. Correlations between macroseismic intensity estimations and ground motion measures of seismic events. Bull. Earthq. Eng. 2020, 18, 1899–1932. [Google Scholar] [CrossRef]
  110. Ishihara, K.; Perlea, V. Liquefaction-Associated Ground Damage During the Vrancea Earthquake of March 4, 1977. Soils Found. 1984, 24, 90–112. [Google Scholar] [CrossRef] [Green Version]
  111. Régnier, J.; Bonilla, L.F.; Bard, P.Y.; Bertrand, E.; Hollender, F.; Kawase, H.; Sicilia, D.; Arduino, P.; Amorosi, A.; Asimaki, D.; et al. International benchmark on numerical simulations for 1D, nonlinear site response (Prenolin): Verification phase based on canonical cases. Bull. Seismol. Soc. Am. 2016, 106, 2112–2135. [Google Scholar] [CrossRef]
  112. Régnier, J.; Bonilla, L.; Bard, P.; Bertrand, E.; Hollender, F.; Kawase, H.; Sicilia, D.; Arduino, P.; Amorosi, A.; Asimaki, D.; et al. PRENOLIN: International Benchmark on 1D Nonlinear Site-Response Analysis—Validation Phase Exercise. Bull. Seismol. Soc. Am. 2018. [Google Scholar] [CrossRef]
  113. Chiaradonna, A.; Lirer, S.; Flora, A. A liquefaction potential integral index based on pore pressure build-up. Eng. Geol. 2020, 272, 105620. [Google Scholar] [CrossRef]
  114. Chiodini, G.; Cardellini, C.; Amato, A.; Bosch, E.; Caliro, S.; Frondini, F.; Ventura, G. Carbon dioxide Earth degassing and seismogenesis in central and southern Italy. Geophys. Res. Lett. 2004, 31. [Google Scholar] [CrossRef]
  115. Miller, S.A.; Collettini, C.; Chiaraluce, L.; Cocco, M.; Barchi, M.; Kaus, B.J.P. Aftershocks driven by a high-pressure CO 2 source at depth. Nature 2004, 427, 724–727. [Google Scholar] [CrossRef] [PubMed]
  116. Chiodini, G.; Caliro, S.; Cardellini, C.; Frondini, F.; Inguaggiato, S.; Matteucci, F. Geochemical evidence for and characterization of CO2 rich gas sources in the epicentral area of the Abruzzo 2009 earthquakes. Earth Planet. Sci. Lett. 2011, 304, 389–398. [Google Scholar] [CrossRef]
  117. Giordano, G.; Carapezza, M.L.; Della Monica, G.; Todesco, M.; Tuccimei, P.; Carlucci, G.; De Benedetti, A.A.; Gattuso, A.; Lucchetti, C.; Piersanti, M. Conditions for long-lasting gas eruptions: The 2013 event at Fiumicino International Airport (Rome, Italy). J. Volcanol. Geotherm. Res. 2016, 325, 119–134. [Google Scholar] [CrossRef]
  118. Doglioni, C.; Barba, S.; Carminati, E.; Riguzzi, F. Fault on–off versus coseismic fluids reaction. Geosci. Front. 2014, 5, 767–780. [Google Scholar] [CrossRef] [Green Version]
  119. Boschetti, T.; Barbieri, M.; Barberio, M.D.; Billi, A.; Franchini, S.; Petitta, M. CO2 inflow and elements desorption prior to a seismic sequence, Amatrice-Norcia 2016, Italy. Geochem. Geophys. Geosyst. 2019, 20, 2303–2317. [Google Scholar]
  120. De Luca, G.; Di Carlo, G.; Tallini, M. Hydraulic pressure variations of groundwater in the Gran Sasso underground laboratory during Amatrice earthquake of August 24th, 2016. Ann. Geophys. 2016, 59. [Google Scholar] [CrossRef]
  121. De Luca, G.; Di Carlo, G.; Tallini, M. A record of changes in the Gran Sasso groundwater before, during and after the 2016 Amatrice earthquake, central Italy. Sci. Rep. 2018, 8, 1–16. [Google Scholar] [CrossRef] [PubMed]
  122. Petitta, M.; Mastrorillo, L.; Preziosi, E.; Banzato, F.; Barberio, M.D.; Billi, A.; Cambi, C.; De Luca, G.; Di Carlo, G.; Di Curzio, D. Water-table and discharge changes associated with the 2016–2017 seismic sequence in central Italy: Hydrogeological data and a conceptual model for fractured carbonate aquifers. Hydrogeol. J. 2018, 26, 1009–1026. [Google Scholar] [CrossRef] [Green Version]
  123. Chiarabba, C.; Buttinelli, M.; Cattaneo, M.; De Gori, P. Large earthquakes driven by fluid overpressure: The Apennines normal faulting system case. Tectonics 2020, 39, e2019TC006014. [Google Scholar] [CrossRef]
  124. Pio Lucente, F.; De Gori, P.; Margheriti, L.; Piccinini, D.; Di Bona, M.; Chiarabba, C.; Piana Agostinetti, N. Temporal variation of seismic velocity and anisotropy before the 2009 MW 6.3 L’Aquila earthquake, Italy. Geology 2010, 38, 1015–1018. [Google Scholar] [CrossRef]
  125. Terakawa, T.; Zoporowski, A.; Galvan, B.; Miller, S.A. High-pressure fluid at hypocentral depths in the L’Aquila region inferred from earthquake focal mechanisms. Geology 2010, 38, 995–998. [Google Scholar] [CrossRef]
  126. Freeze, R.A.; Cherry, J. Groundwater; Prenctice Hall. Inc.: Hoboken, NJ, USA, 1979. [Google Scholar]
  127. Ciotoli, G.; Bigi, S.; Tartarello, C.; Sacco, P.; Lombardi, S.; Ascione, A.; Mazzoli, S. Soil gas distribution in the main coseismic surface rupture zone of the 1980, Ms = 6.9, Irpinia earthquake (southern Italy). J. Geophys. Res. Solid Earth 2014, 119, 2440–2461. [Google Scholar] [CrossRef]
  128. Rosen, M.R.; Binda, G.; Archer, C.; Pozzi, A.; Michetti, A.M.; Noble, P.J. Mechanisms of earthquake-induced chemical and fluid transport to carbonate groundwater springs after earthquakes. Water Resour. Res. 2018, 54, 5225–5244. [Google Scholar] [CrossRef]
  129. Roberts, J.J.; Wilkinson, M.; Naylor, M.; Shipton, Z.K.; Wood, R.A.; Haszeldine, R.S. Natural CO2 sites in Italy show the importance of overburden geopressure, fractures and faults for CO2 storage performance and risk management. Geol. Soc. London, Spec. Publ. 2017, 458, 181–211. [Google Scholar] [CrossRef]
  130. Barberio, M.D.; Gori, F.; Barbieri, M.; Boschetti, T.; Caracausi, A.; Cardello, G.L.; Petitta, M. Understanding the Origin and Mixing of Deep Fluids in Shallow Aquifers and Possible Implications for Crustal Deformation Studies: San Vittorino Plain, Central Apennines. Appl. Sci. 2021, 11, 1353. [Google Scholar] [CrossRef]
  131. Fluid conduits in carbonate-hosted seismogenic normal faults of central Italy. J. Geophys. Res. Solid Earth 2003, 108. [CrossRef]
  132. Smeraglia, L.; Aldega, L.; Bernasconi, S.M.; Billi, A.; Boschi, C.; Caracausi, A.; Carminati, E.; Franchini, S.; Rizzo, A.L.; Rossetti, F. The role of trapped fluids during the development and deformation of a carbonate/shale intra-wedge tectonic mélange (Mt. Massico, Southern Apennines, Italy). J. Struct. Geol. 2020, 138, 104086. [Google Scholar] [CrossRef]
Figure 1. Map of the M ≥ 5 mainshocks of the 2016–2017 Central Italy (magenta stars) and 2009 L’Aquila (light blue stars) seismic sequences. The upper-right inset shows the Italian seismic hazard map, with peak ground accelerations (g) with a 10% chance of being exceeded in 50 years [44]. Date and location of the macroseismic epicenters of the moderate-large historical earthquakes [45] are reported with the yellow squares. The major active normal faults in the area (modified after [35,42,46] are traced with red lines). MVFS = Mt. Vettore fault system; NFS = Norcia fault system; LMFS = Laga Mts. fault system; CF = Capitignano fault; MMF = Mt. Marine fault; MPF = Mt. Pettino fault; AFS = Assergi fault system; PSDFS = Paganica-San Demetrio fault system.
Geosciences 12 00002 g001
Figure 2. Topographic map (period: February 1884; original scale 1:20,000) of the Madonna delle Fornaci (MDF) site in which the mill (m), the Madonna delle Fornaci church (c) and the investigated site (red square, MDF) are located.
Geosciences 12 00002 g002
Figure 3. Map identifying the red circle with the radius of 175 m where the two sinkholes occurred during the 1703 earthquake are likely located. The ancient mill and the Aterno River are also highlighted. Within this area, the selected MDF site is located. In the most restrictive hypothesis, if a sinkhole had formed near the mill, the other must have been at least 175 m away. Therefore, the selected site for the investigations was chosen (i) within the area of a circle with a radius of 175 m; (ii) distant from the current riverbed of the Aterno River to avoid carrying out investigations in post-1703 alluvial deposits because close to the current riverbed, and (iii) for logistical reasons (accessibility for the borehole machinery, etc.).
Geosciences 12 00002 g003
Figure 4. (a). Geological and hydrogeological map of the UAV modified after [52,56,60]. Legend: PHU = Late Pleistocene and Holocene deposits, MPU = Middle Pleistocene deposits, LPU = Lower Pleistocene deposits, BDR = Meso-Cenozoic bedrock, 1: box of Figure 5, 2: normal fault, 3: epicentral area of 2 February 1703, earthquake, 4: PB1 borehole, 5: section trace, 6: main underground hydrological flow direction, 7: inflow of Aterno R., 8: outflow of Aterno R. In the lower box (b), geological section crossing the UAV and reporting the hydrogeological setting modified from [60].
Geosciences 12 00002 g004
Figure 6. Stratigraphic log of the PB1 borehole (b.g.l.: below ground level).
Geosciences 12 00002 g006
Figure 7. Mean noise HVSRs (thick lines) and standard deviation curves (dashed lines) at the MDF1-8 sites. It must be noted that the MDF1 measurement was acquired in the MDF site which is the location with the lowest resonance frequency (around 1.2 Hz) obtained. For the location of the measurements, please check Figure 5.
Geosciences 12 00002 g007
Figure 8. Plan view of the field investigation at the MDF site. BH = borehole; M = MASW; CPTU = cone penetration test; SR = Seismic refraction.
Geosciences 12 00002 g008
Figure 9. Borehole logs (the ground elevation was about 700 m a.s.l. for all).
Geosciences 12 00002 g009
Figure 10. SPT-N blow counts and interpretation (borehole BH2).
Geosciences 12 00002 g010
Figure 11. P-wave and S-wave velocities obtained from down-hole test (borehole BH2); SG: sandy gravel; GS: gravel and sand; S: sand.
Geosciences 12 00002 g011
Figure 12. (a) Comparison of VS obtained from down-hole (borehole BH2) and MASW (M1, M2); (b) dispersion curve with identification of the maximum depth, zmax, for which the MASW measurements are reliable.
Geosciences 12 00002 g012
Figure 13. P-wave velocity, VP, contours of the SR1 seismic refraction survey and its geological interpretation. For the location see Figure 8, gwt: groundwater table; BH1 and BH2 refer to the boreholes.
Geosciences 12 00002 g013
Figure 14. P-wave velocity, VP, contours of the SR2 seismic refraction survey and its geological interpretation. For the location see Figure 8, gwt: groundwater table; BH2 refers to the borehole.
Geosciences 12 00002 g014
Figure 15. 1D numerical model schemes adopted for the computation of the elastic transfer functions at PB1 boreholes (a) and the MDF site (b) and comparison with the HVSR curve obtained from adjacent microtremor measurements (MDF6 in a and MDF1 in b) GS: gravel and sand; GCS: gravel, conglomerate and sand; B: breccia (seismic bedrock).
Geosciences 12 00002 g015
Figure 16. Normalized shear modulus and damping ratio curves adopted for deeper (>15 m) soil layers [91].
Geosciences 12 00002 g016
Figure 17. Normalized shear modulus and damping ratio curves adopted for the shallowest 15 m of the soil column. Rollins et al. (2020) [96]; Modoni & Gazellone (2010) [95]; Menq (2003) [94]; Rollins et al. (1994) [93]; Kukusho et al. (1981) [92].
Geosciences 12 00002 g017
Figure 18. Results of liquefaction assessment using simplified methods based on SPT (a) and VS (b). Boulanger & ldriss 2014 [103]; Andrus & Stokoe 2000 [104]; Kayen et al. (2013) [105].
Geosciences 12 00002 g018
Figure 19. Acceleration response spectra (5% damping) vs. the period for the selected input motions.
Geosciences 12 00002 g019
Figure 20. Vertical profiles of maximum acceleration obtained from the equivalent linear analyses. Rollins et al. (2020) [96]; Modoni & Gazellone (2010) [95]; Menq (2003) [94]; Rollins et al. (1994) [93]; Kukusho et al. (1981) [92].
Geosciences 12 00002 g020
Figure 21. Comparison of the predicted range of PGA with the relationships proposed by (a) [106] and (b) [109]. Gomez-Capera et al. (2020) [106]; Masi et al. (2020) [109].
Geosciences 12 00002 g021
Figure 22. Vertical profiles of the maximum acceleration, shear strain, shear stress and pore water pressure; SG: sandy gravel; GS: gravel and sand; S: sand.
Geosciences 12 00002 g022
Figure 23. Unscaled hydrogeological sketch illustrating the gas upwelling hypothesis. BDR: Bedrock; MDF: Madonna delle Fornaci; PHU: Upper Pleistocene and Holocene Unit; MPU: Middle Pleistocene Unit; LPU: Lower Pleistocene Unit.
Geosciences 12 00002 g023
Figure 24. Unscaled sketch of the earthquake-induced gas eruption hypothesis at the MDF site.
Geosciences 12 00002 g024
Table 1. Characteristics of the Seismic Refraction survey.
Layout of the SurveyTechnical Specifications
array: length and type69.0 m, linear array
geophone typefrequency: 4.5 Hz vertical component
impedance: 430 Ώ
geophone: spacing and number3.0 m, 24
energizing source type P waves10 kg sledge hammer, aluminum plate, 9 shots
seismographMAE mod. X820S, 24 channels at 16-24 bit per channel (https://www.mae-srl.it/it (6 December 2021)
sample interval0.0005 s
acquisition time window0.55 s
Table 2. Parameters of the pwp model used in the effective stress analyses.
LayerCSRtαCSRrabd
0 ÷ 4 m0.0018.4913.740.7840.3499.327
4 ÷ 6 m0.00131.9266.330.7750.287.913
6 ÷ 9 m0.0014.033.780.7840.39310.21
9 ÷ 15 m0.00116.2623.810.7810.3158.638
Table 3. Recorded ground motion obtained from the selection on ITACA database.
EventMLMWStation CodeRepi (km)PGA (g)VS,30 1 (m/s) (Subsoil Class)Topographic Class 1
30.X.2016 06:40:186.16.5CLO7.80.58425 (B)T1
30.X.2016 06:40:186.16.5T121210.50.28537 (B)T1
30.X.2016 06:40:186.16.5FCC11.00.95917 (A)T1
30.X.2016 06:40:186.16.5T121312.00.87576 (B)T1
30.X.2016 06:40:186.16.5ACC18.60.43828 (A)T1
30.X.2016 06:40:186.16.5MMO19.20.19787 (B)T1
24.VIII.2016 01:36:326.06.5MTR19.40.08767 (B)T1
1 Reported in the ‘station detail’ of each station. Database accessed on 28 July 2021.
Publisher’s Note: MDPI stays neutral with regard to jurisdictional claims in published maps and institutional affiliations.

