
An Attempt to Study Natural H2 Resources across an Oceanic Ridge Penetrating a Continent: The Asal–Ghoubbet Rift (Republic of Djibouti)

 ,
, 
Abstract
:1. Introduction
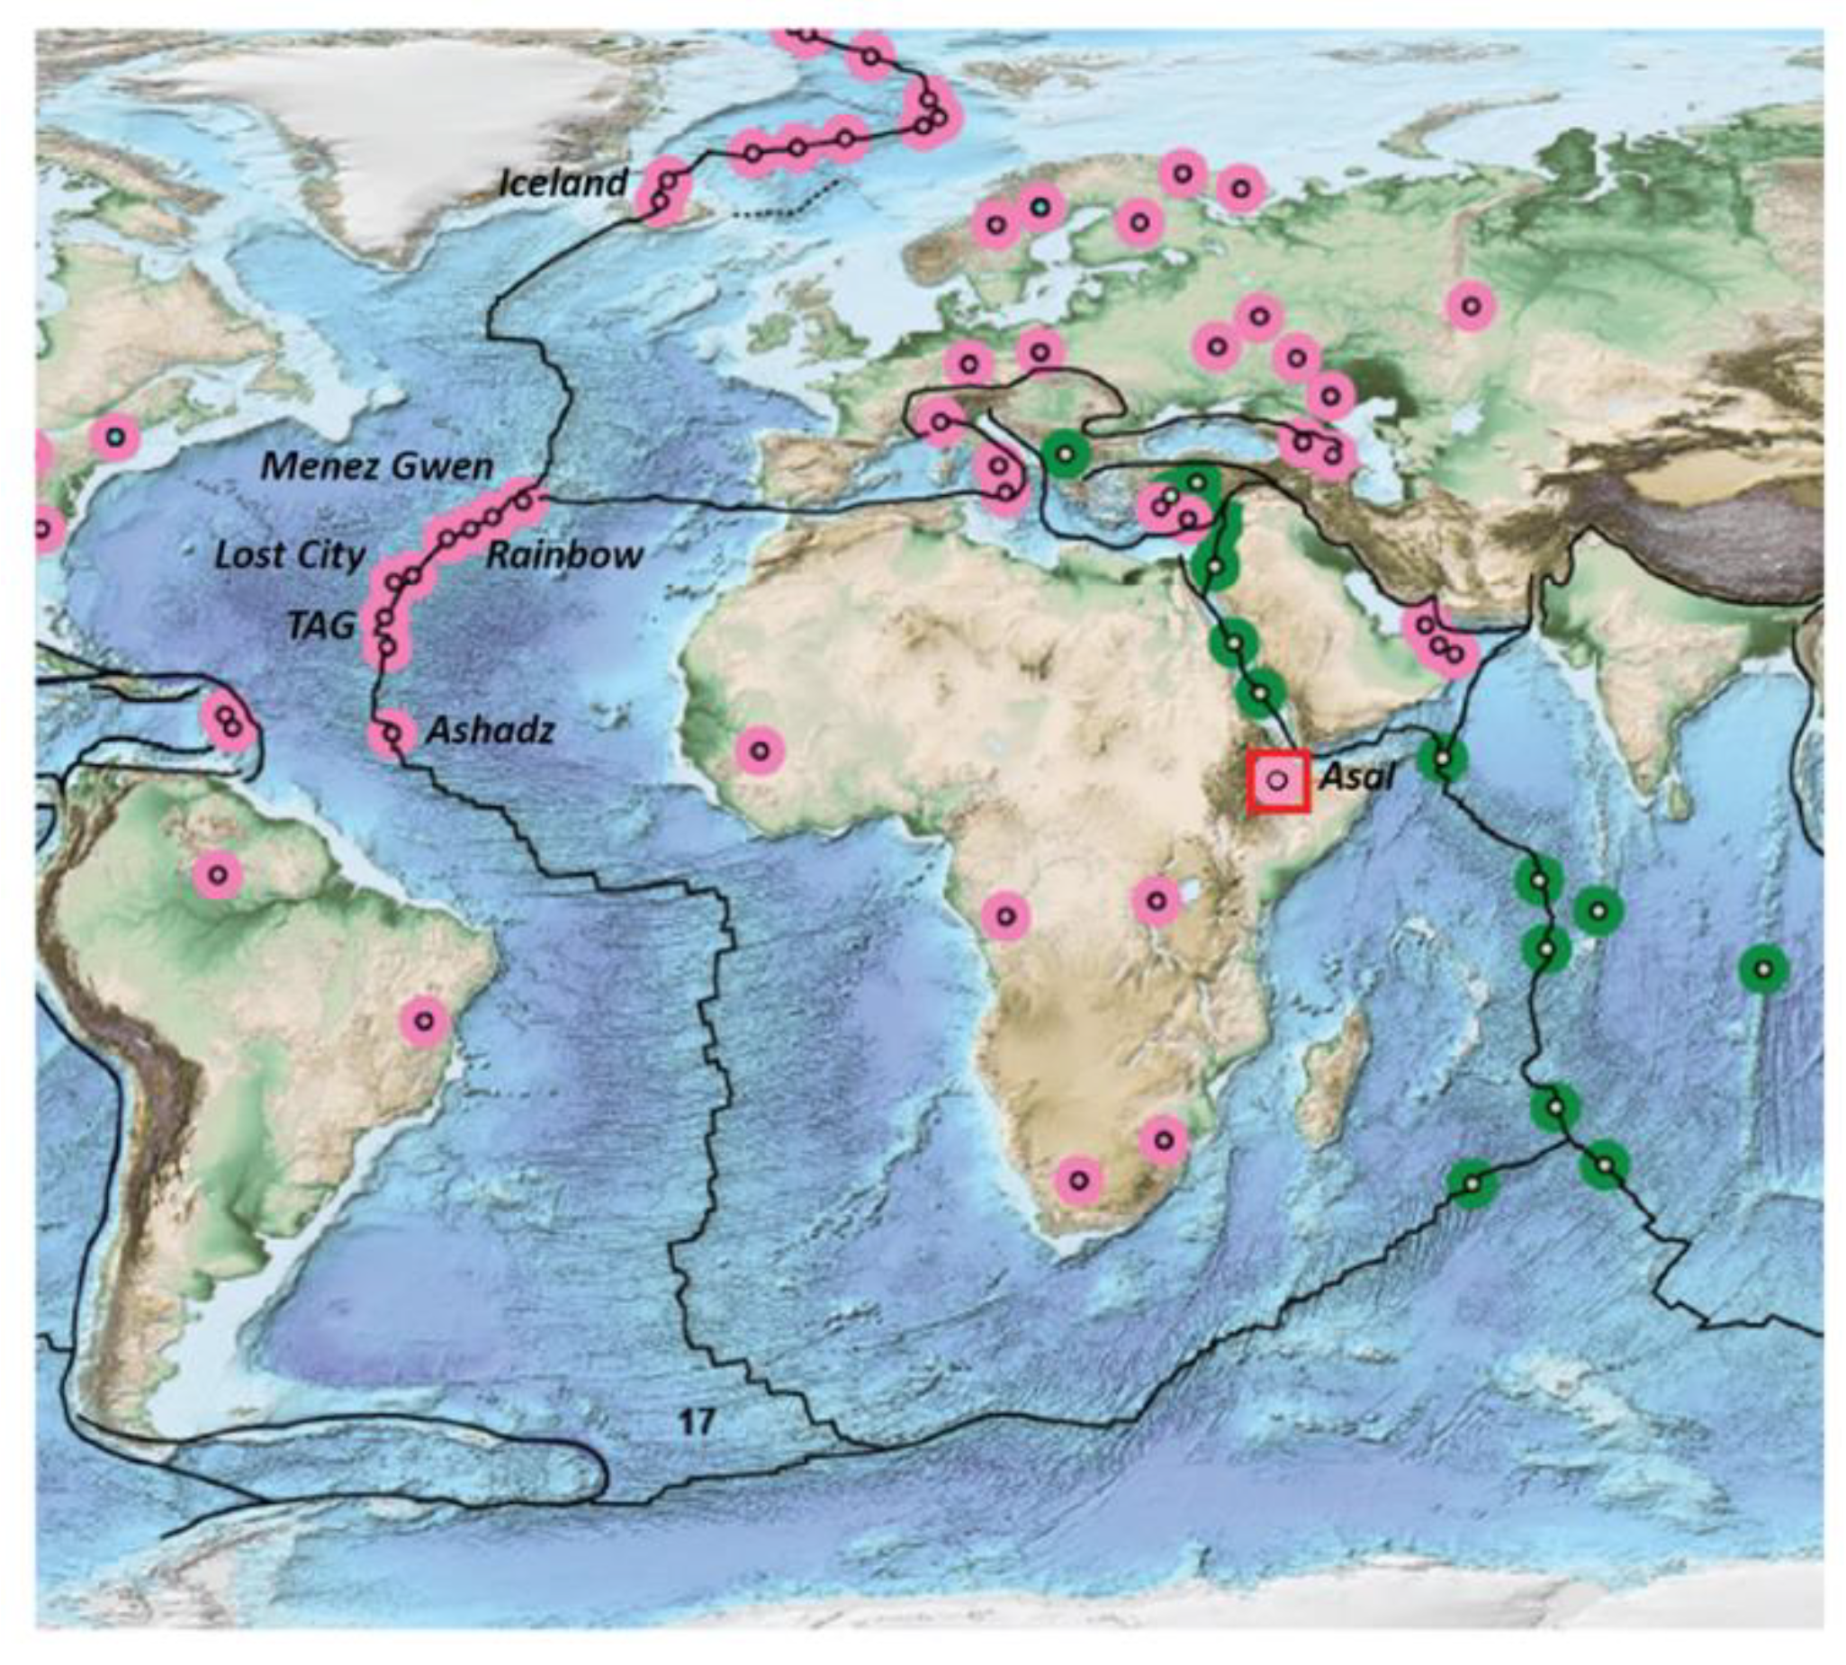
1.1. H2 in MOR Settings
1.2. Geological Context
1.2.1. Large-Scale/Geodynamic Context
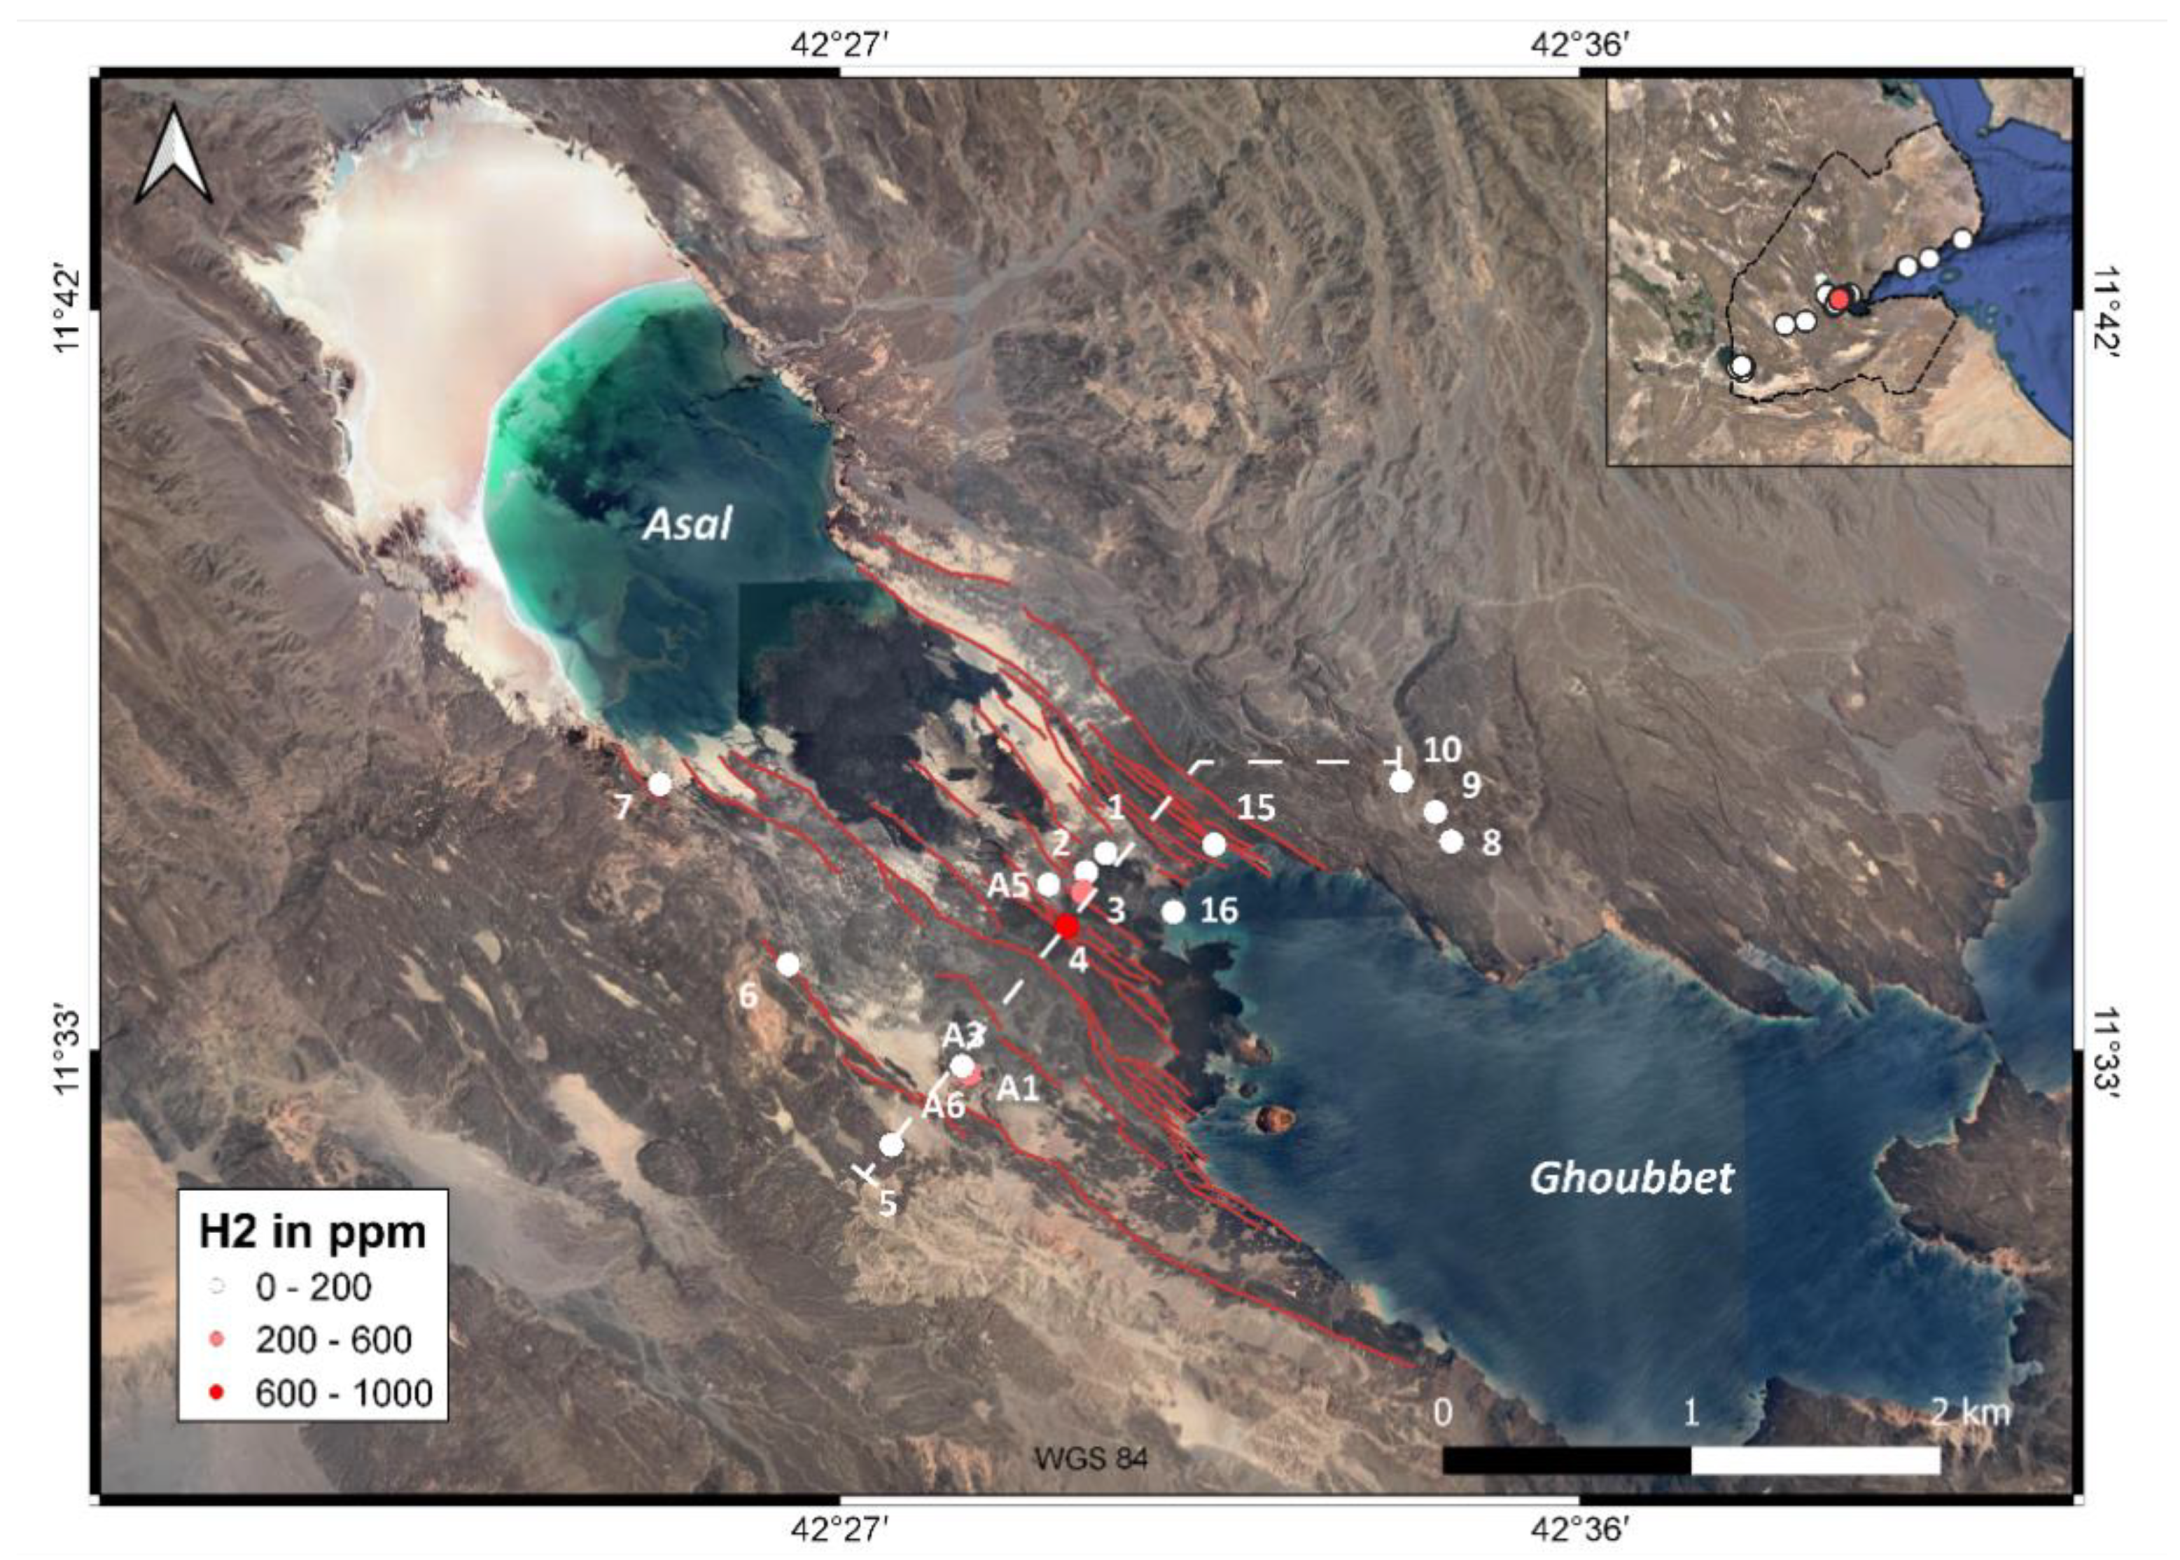
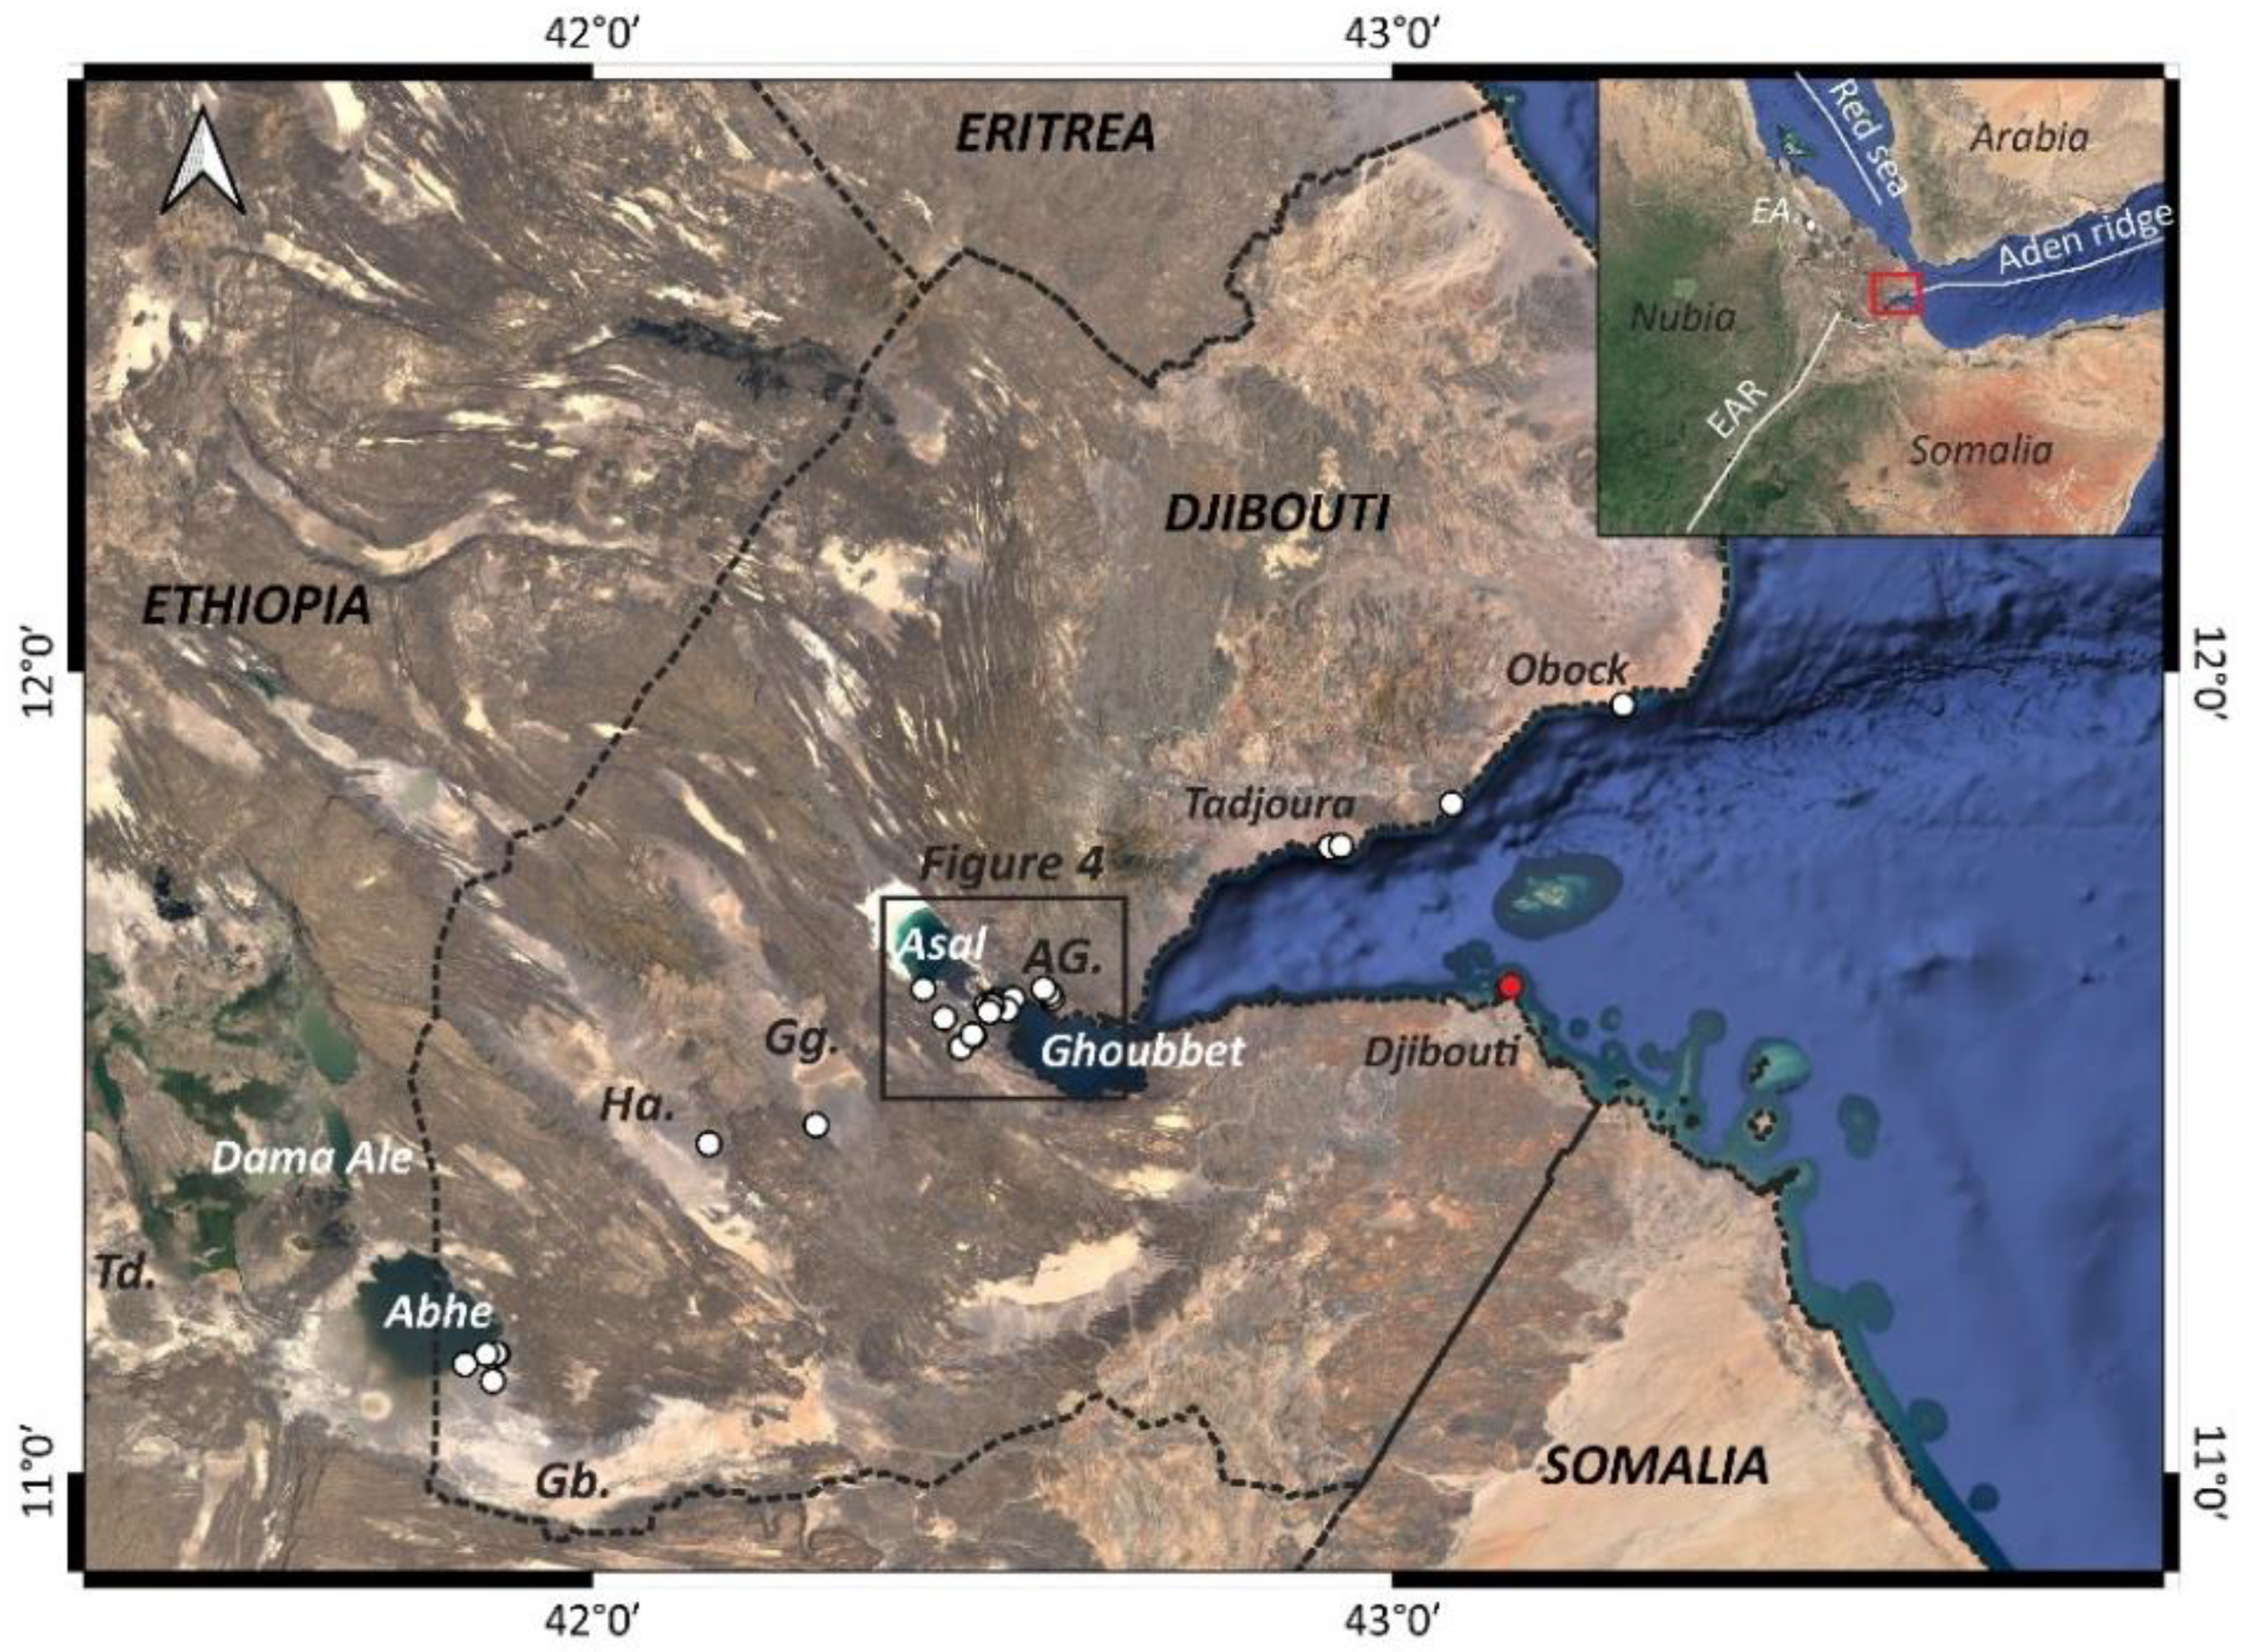
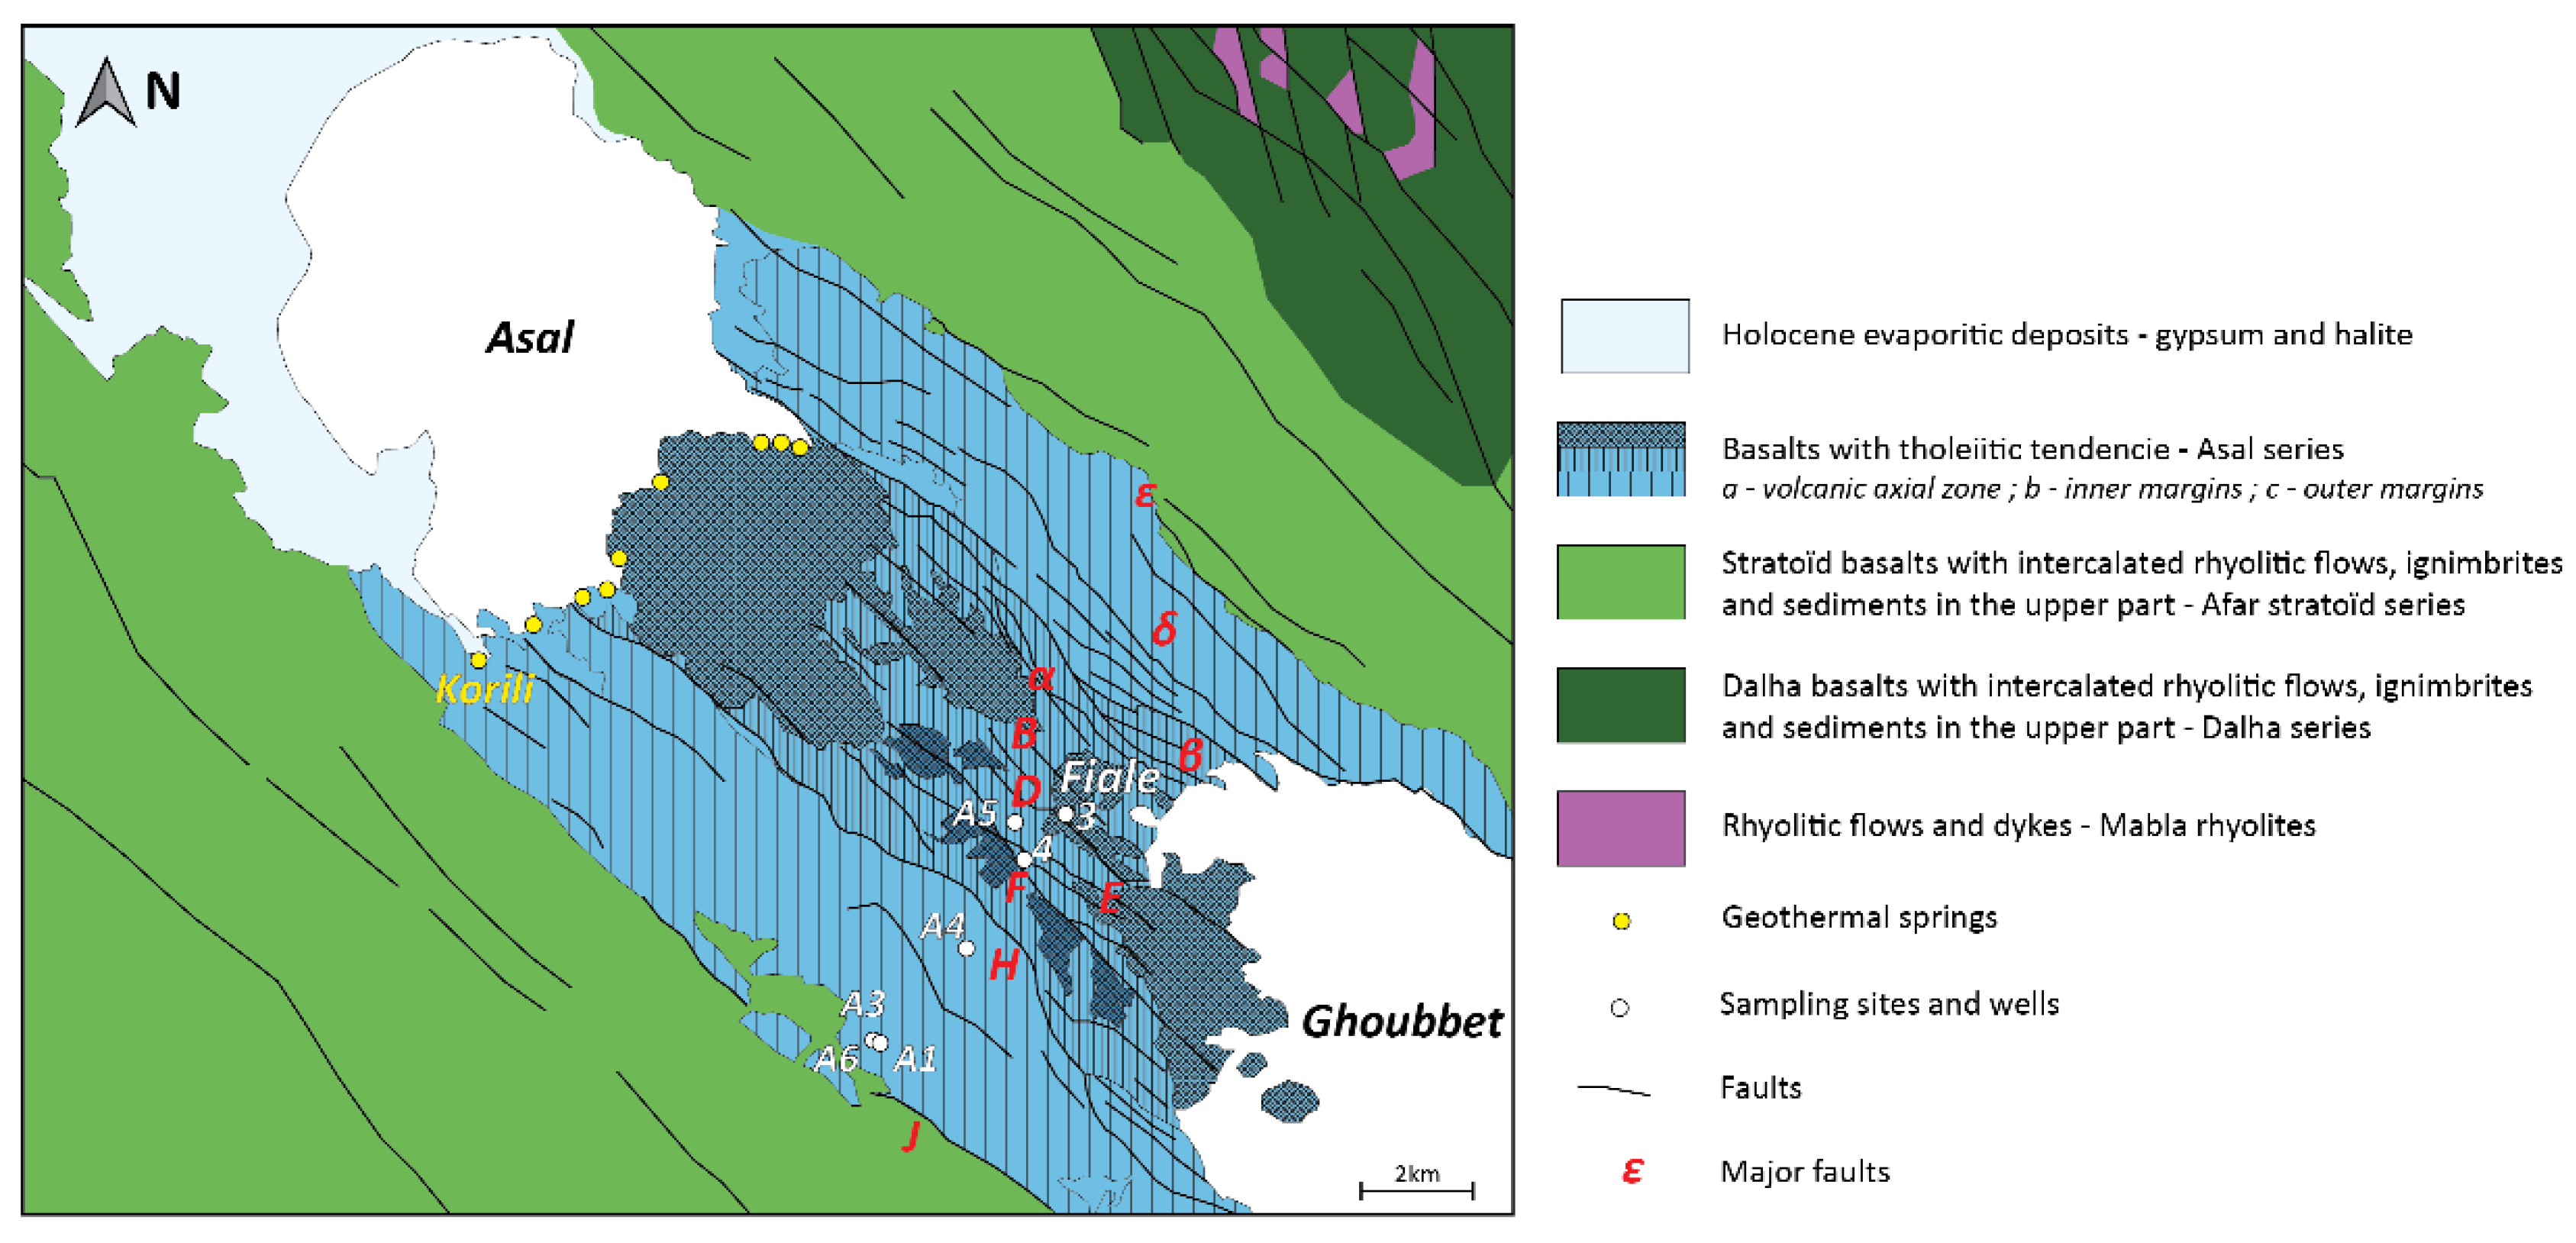
1.2.2. The Asal/Ghoubbet Area
1.2.3. Available Subsurface Data
1.2.4. Available Gas Analysis Data
1.2.5. Available Water Analysis Data
2. Materials and Methods
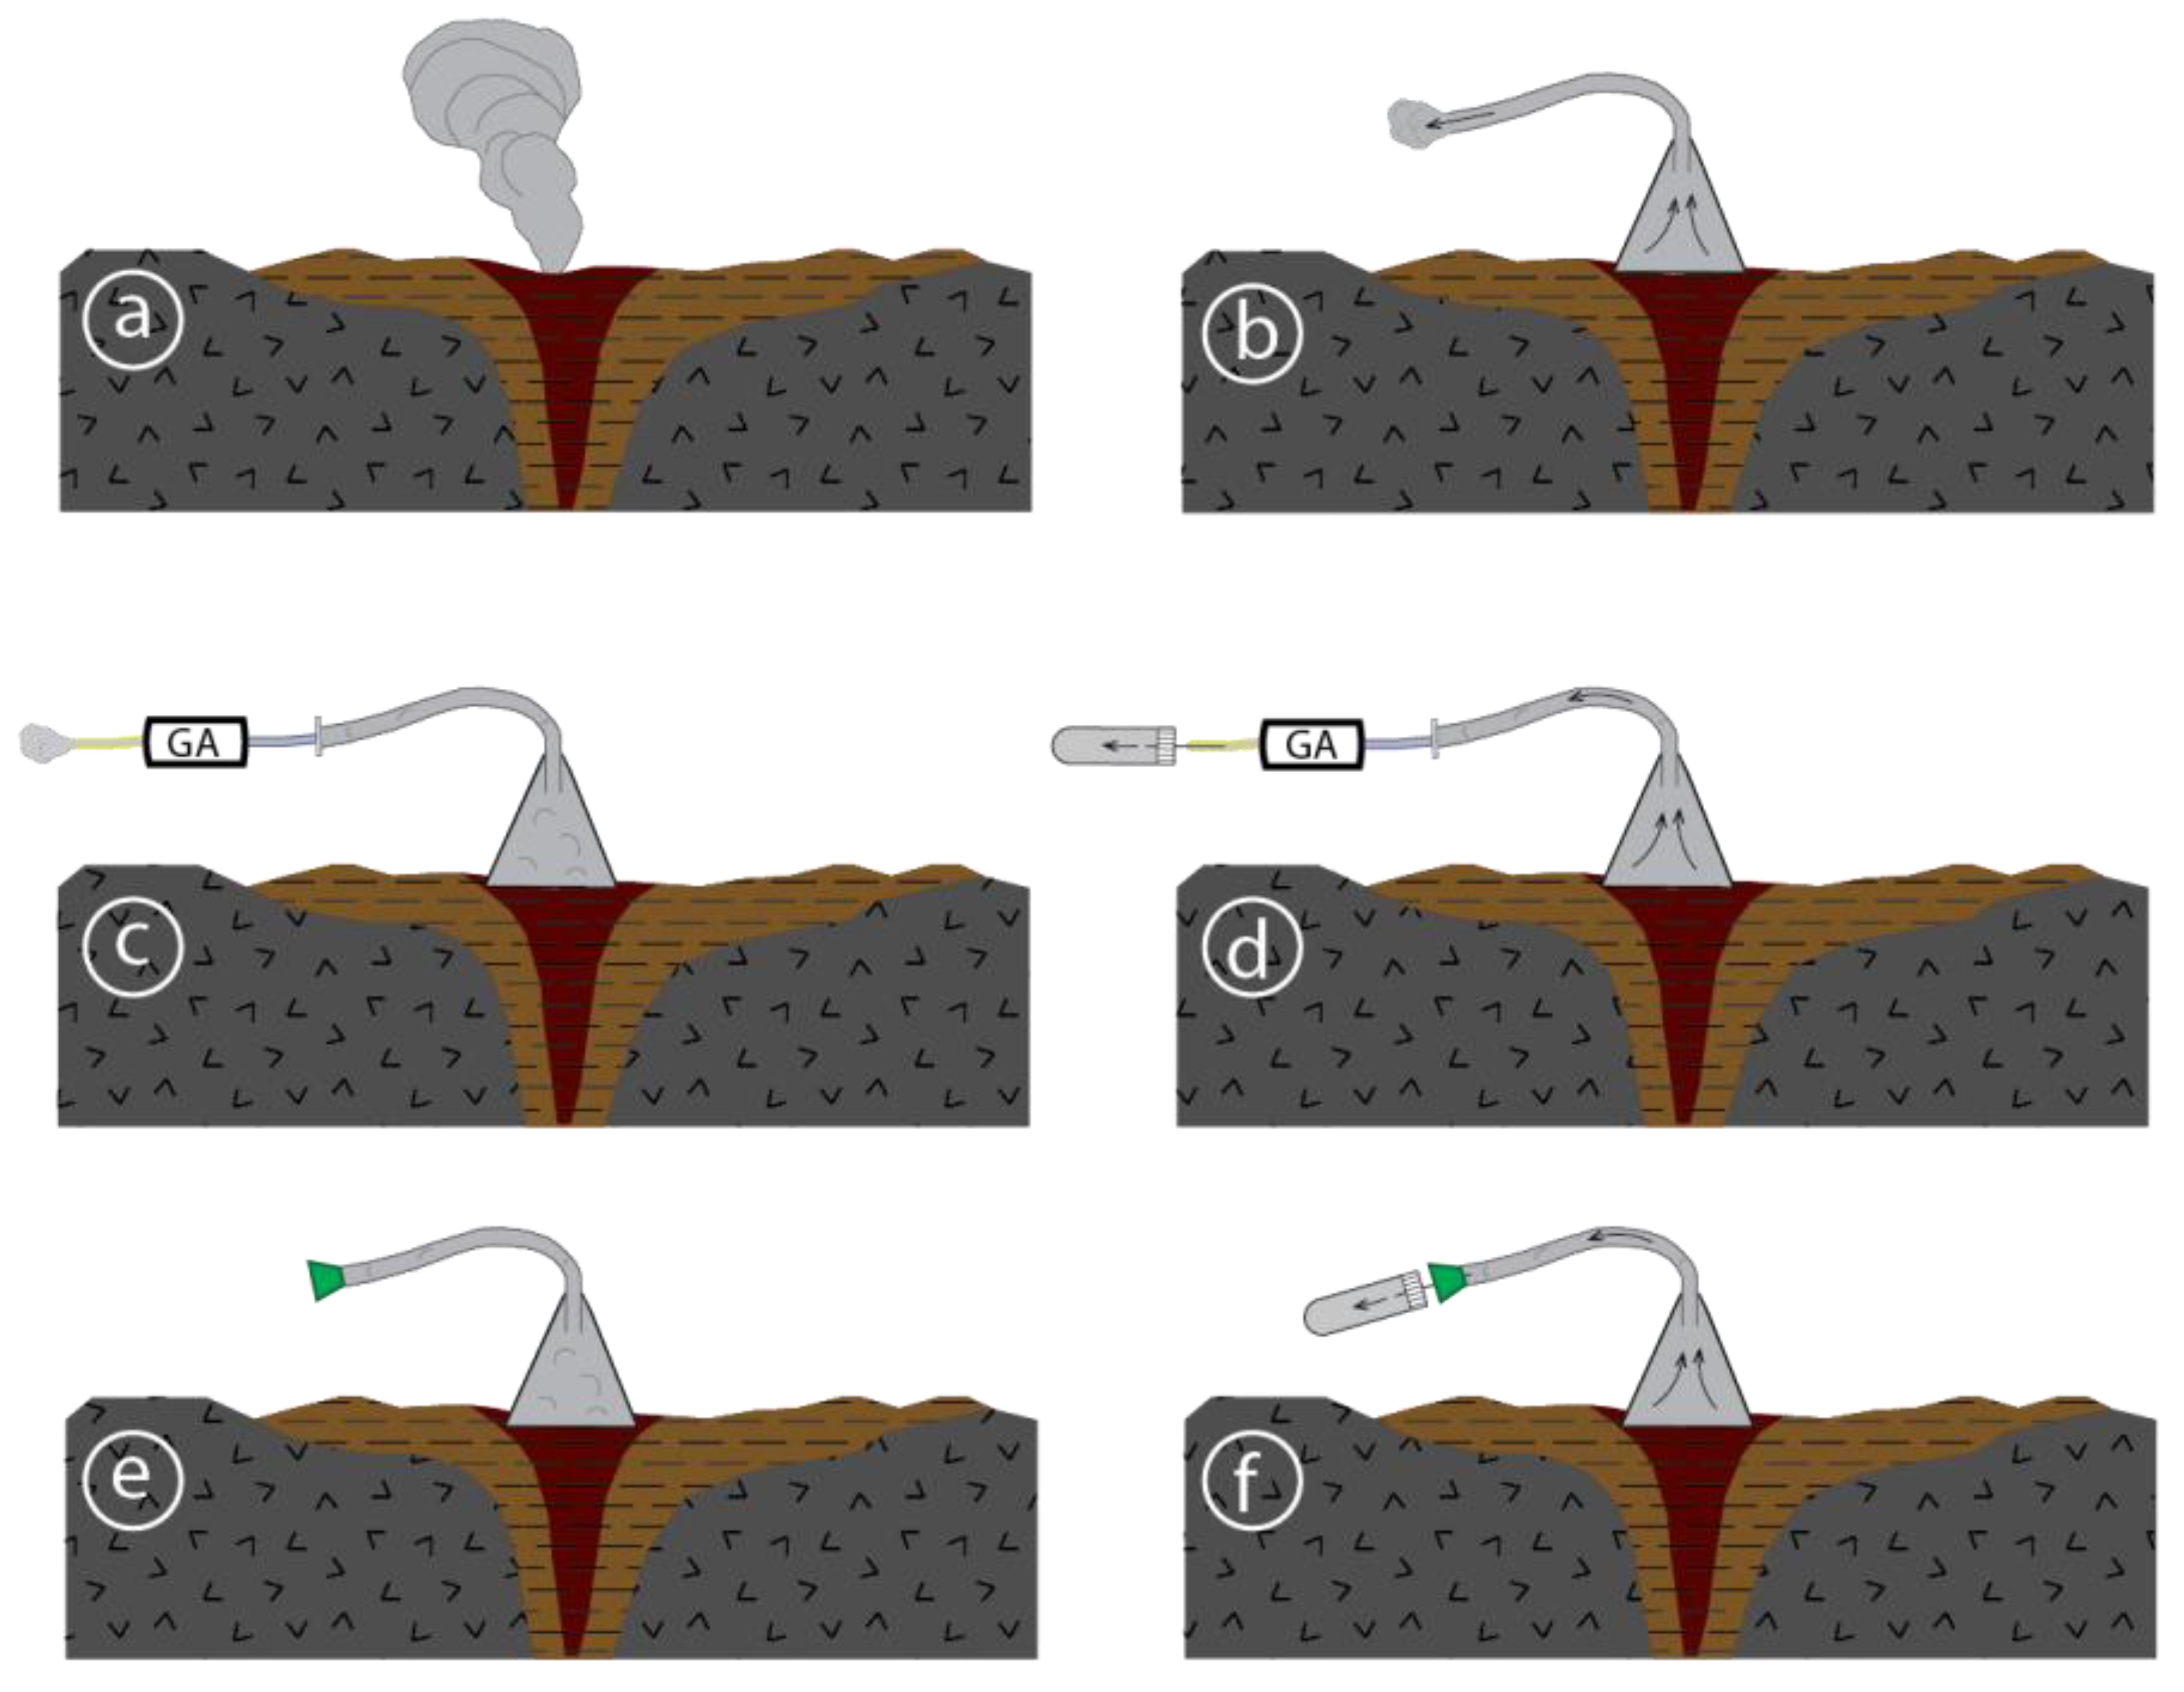
2.1. In the Field
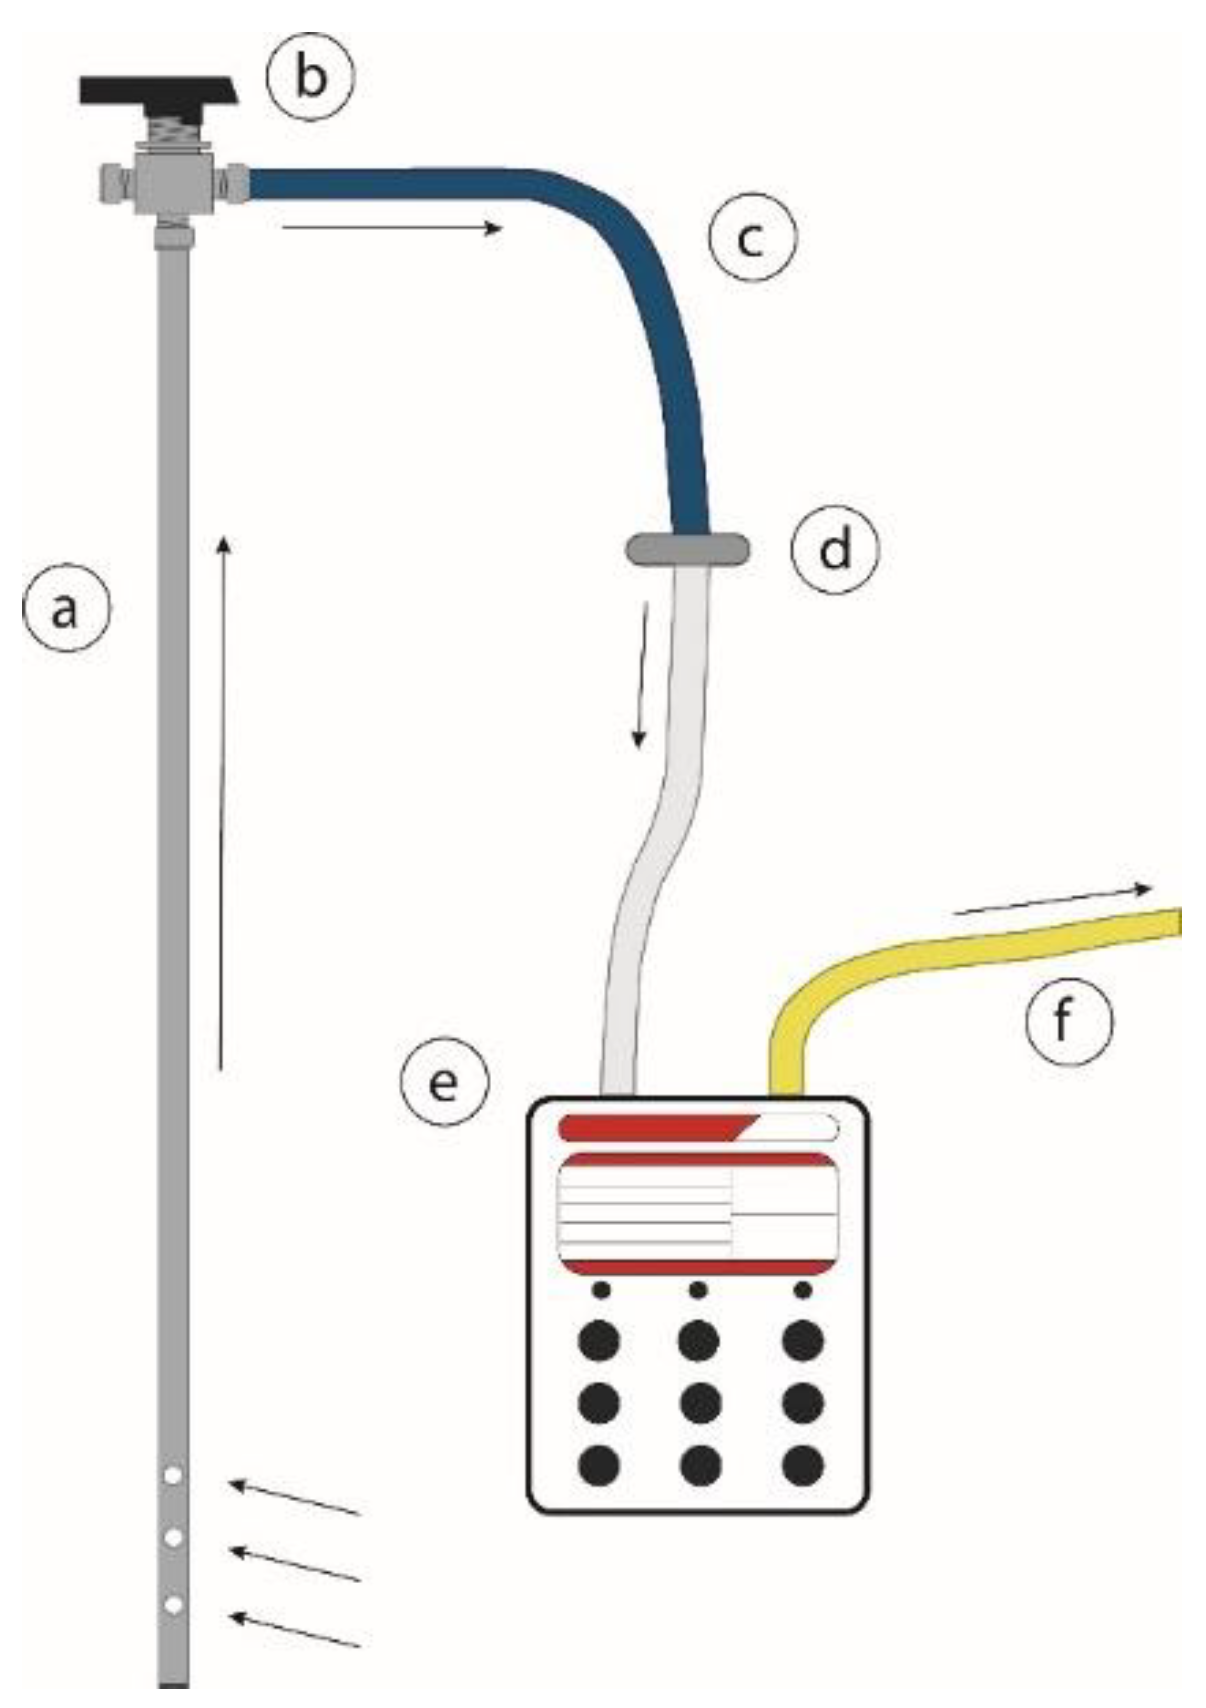
2.1.1. Gas Sampling
2.1.2. Field Gas Analysis
2.2. In the Laboratory
2.2.1. Laboratory Gas Analysis
2.2.2. Rock and Alteration Mineral Sample Analysis
- d(hkl): inter-reticular distance (in Å)
- θ: Bragg angle or half angle of deviation
- n: diffraction order
- λ: X-ray wavelength (1.54184 Å)
3. Results
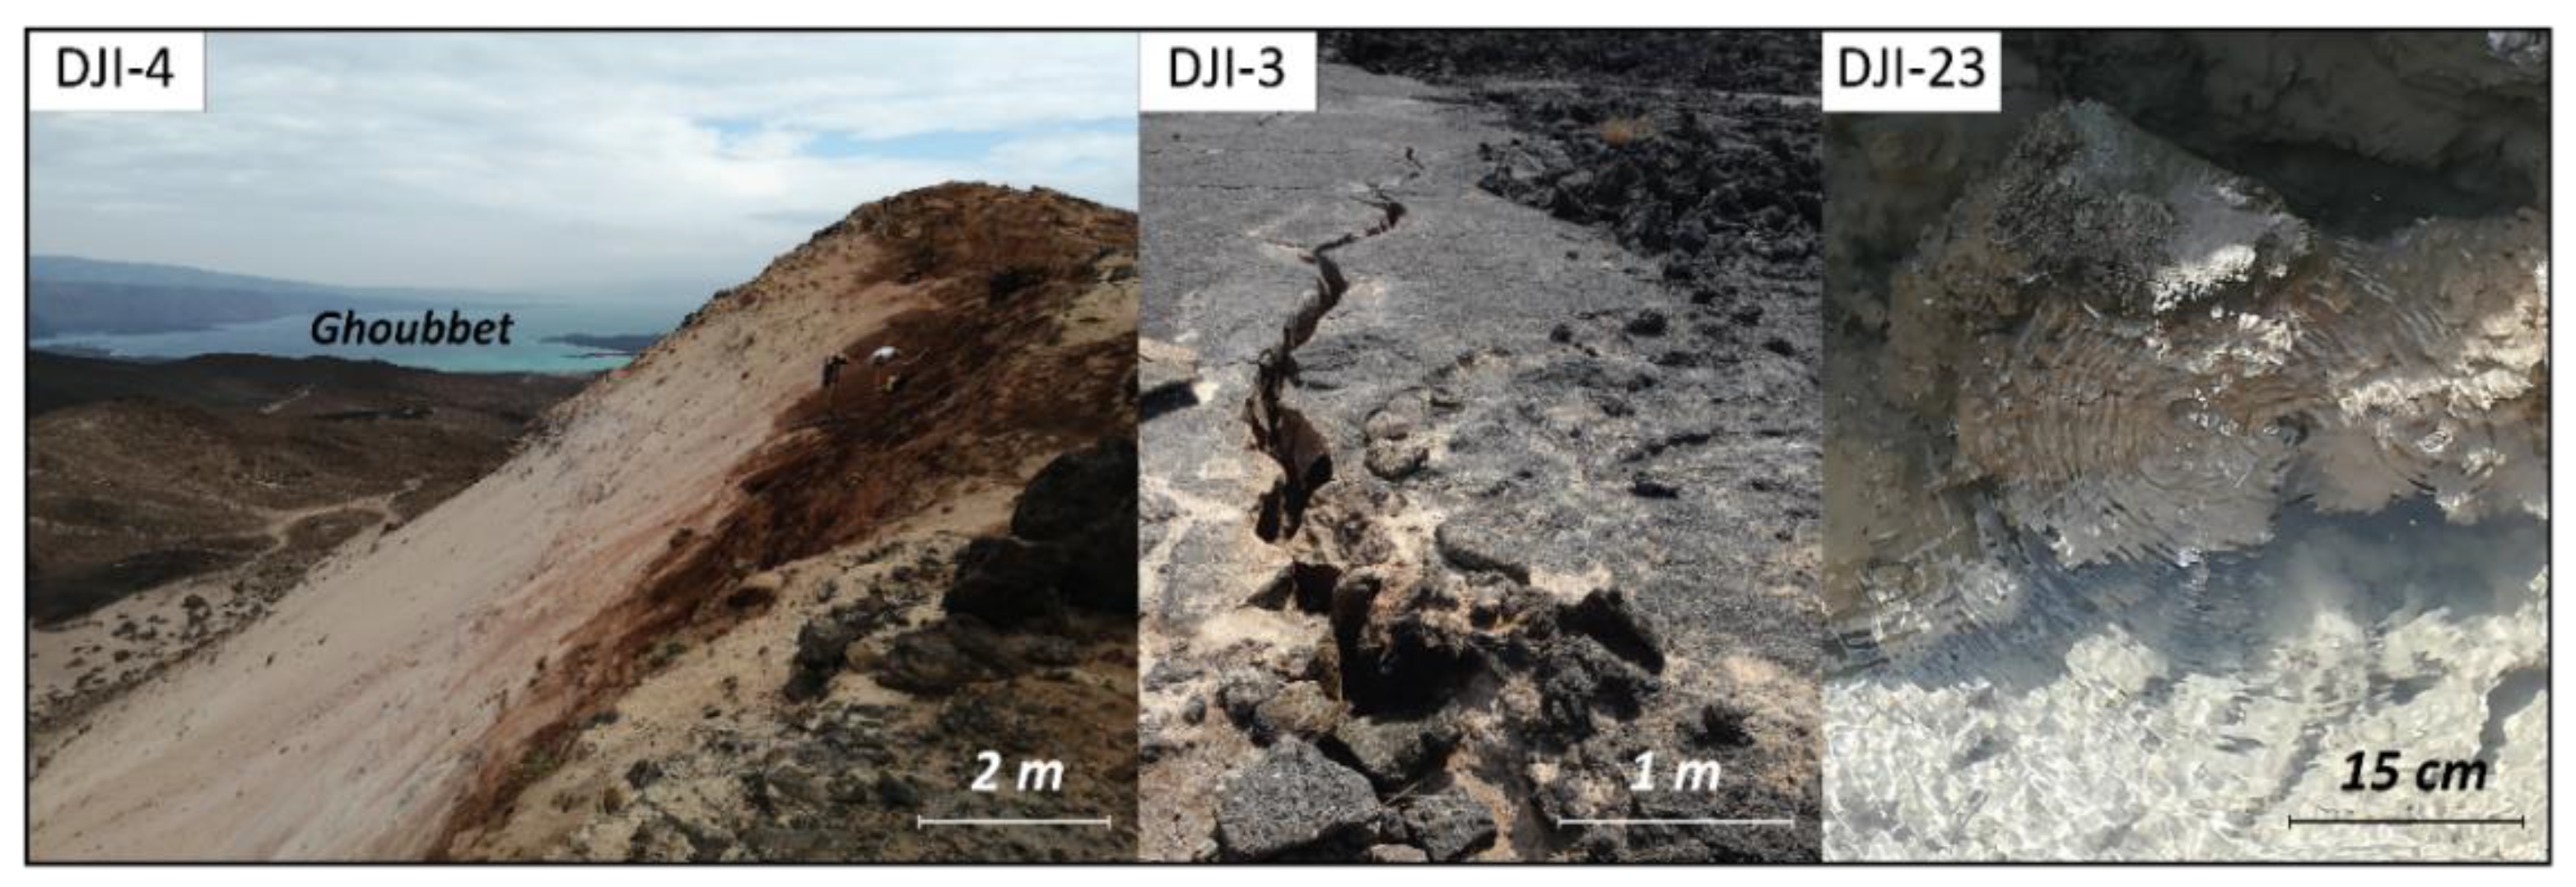
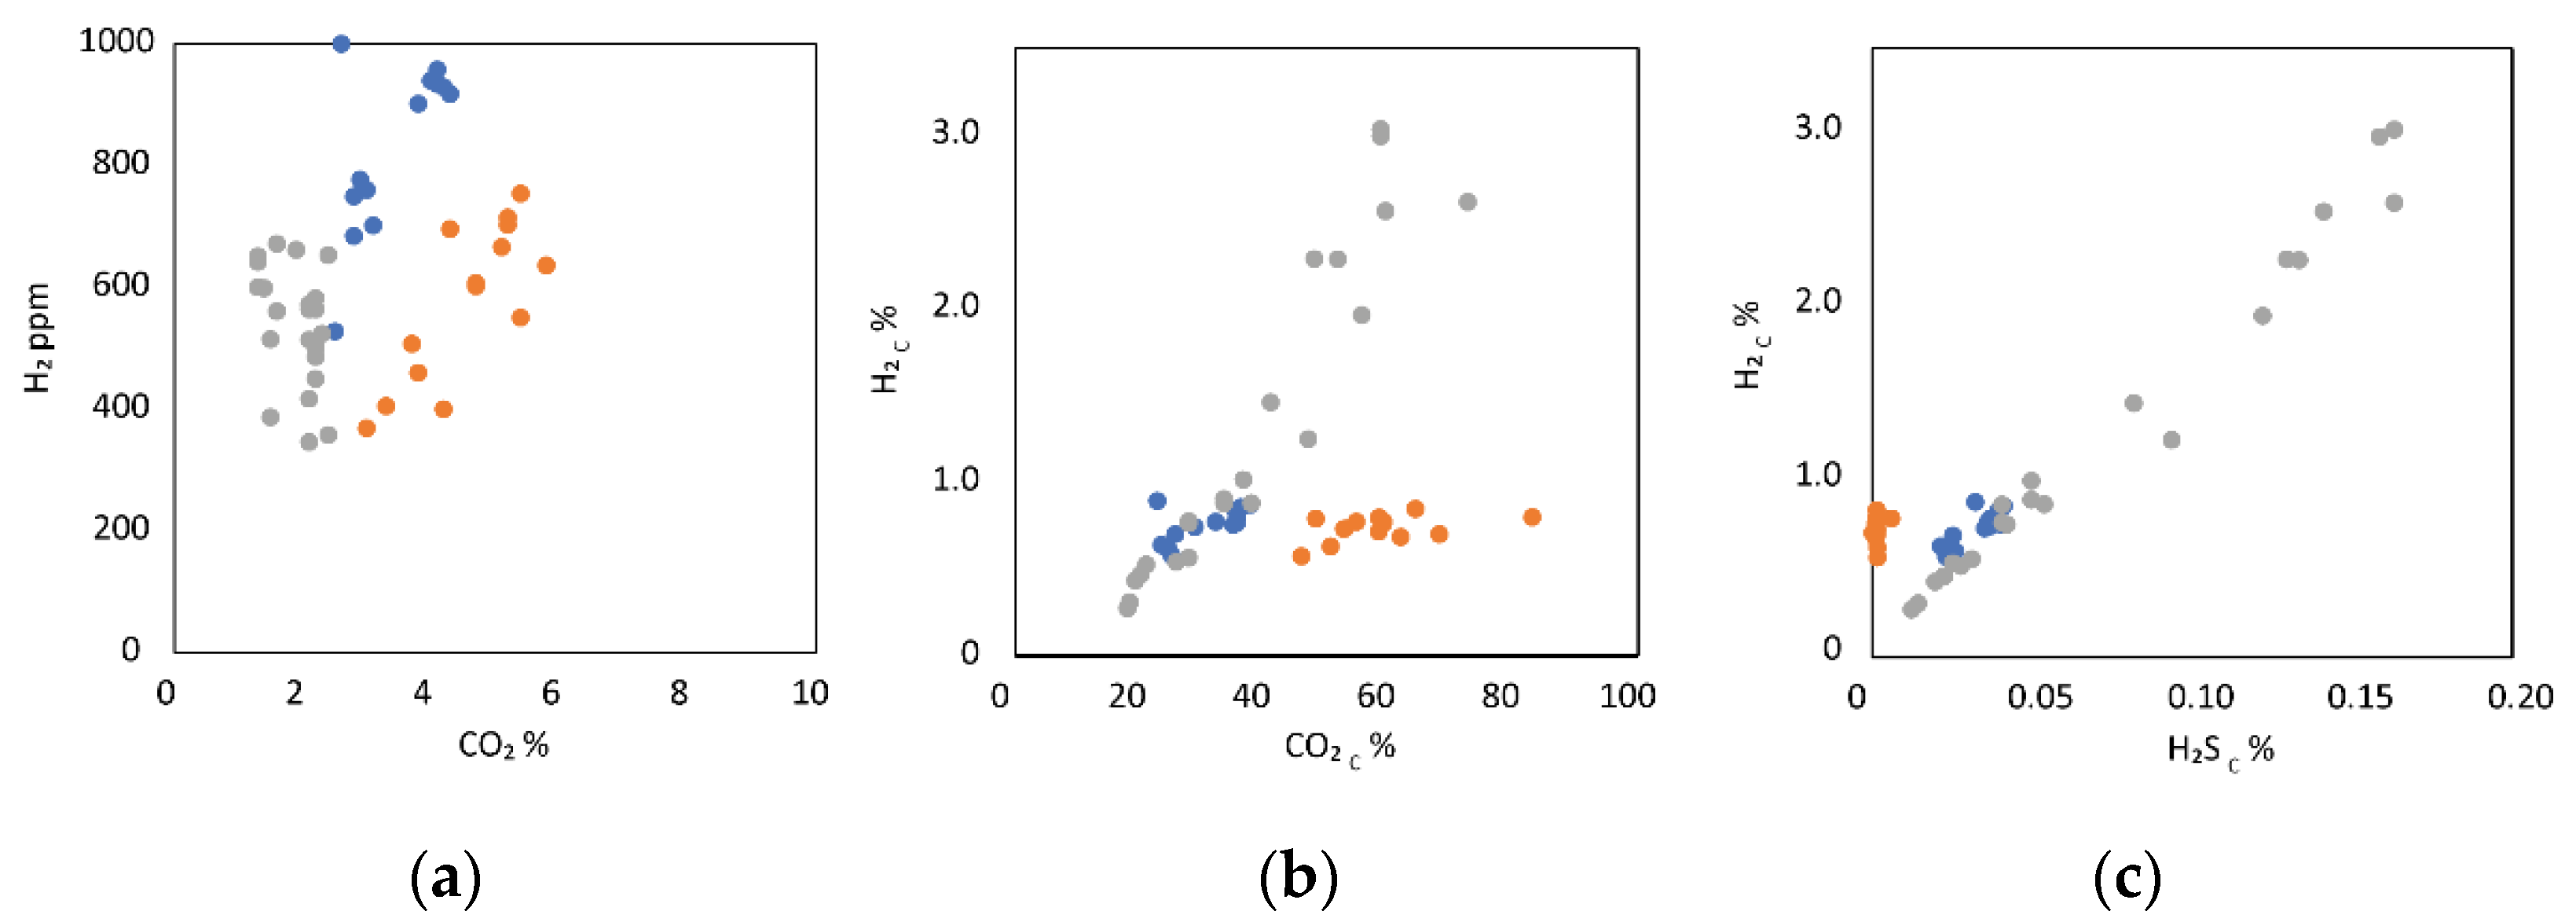
3.1. Surface H2 Emanations
3.2. Site 4
3.2.1. Gas
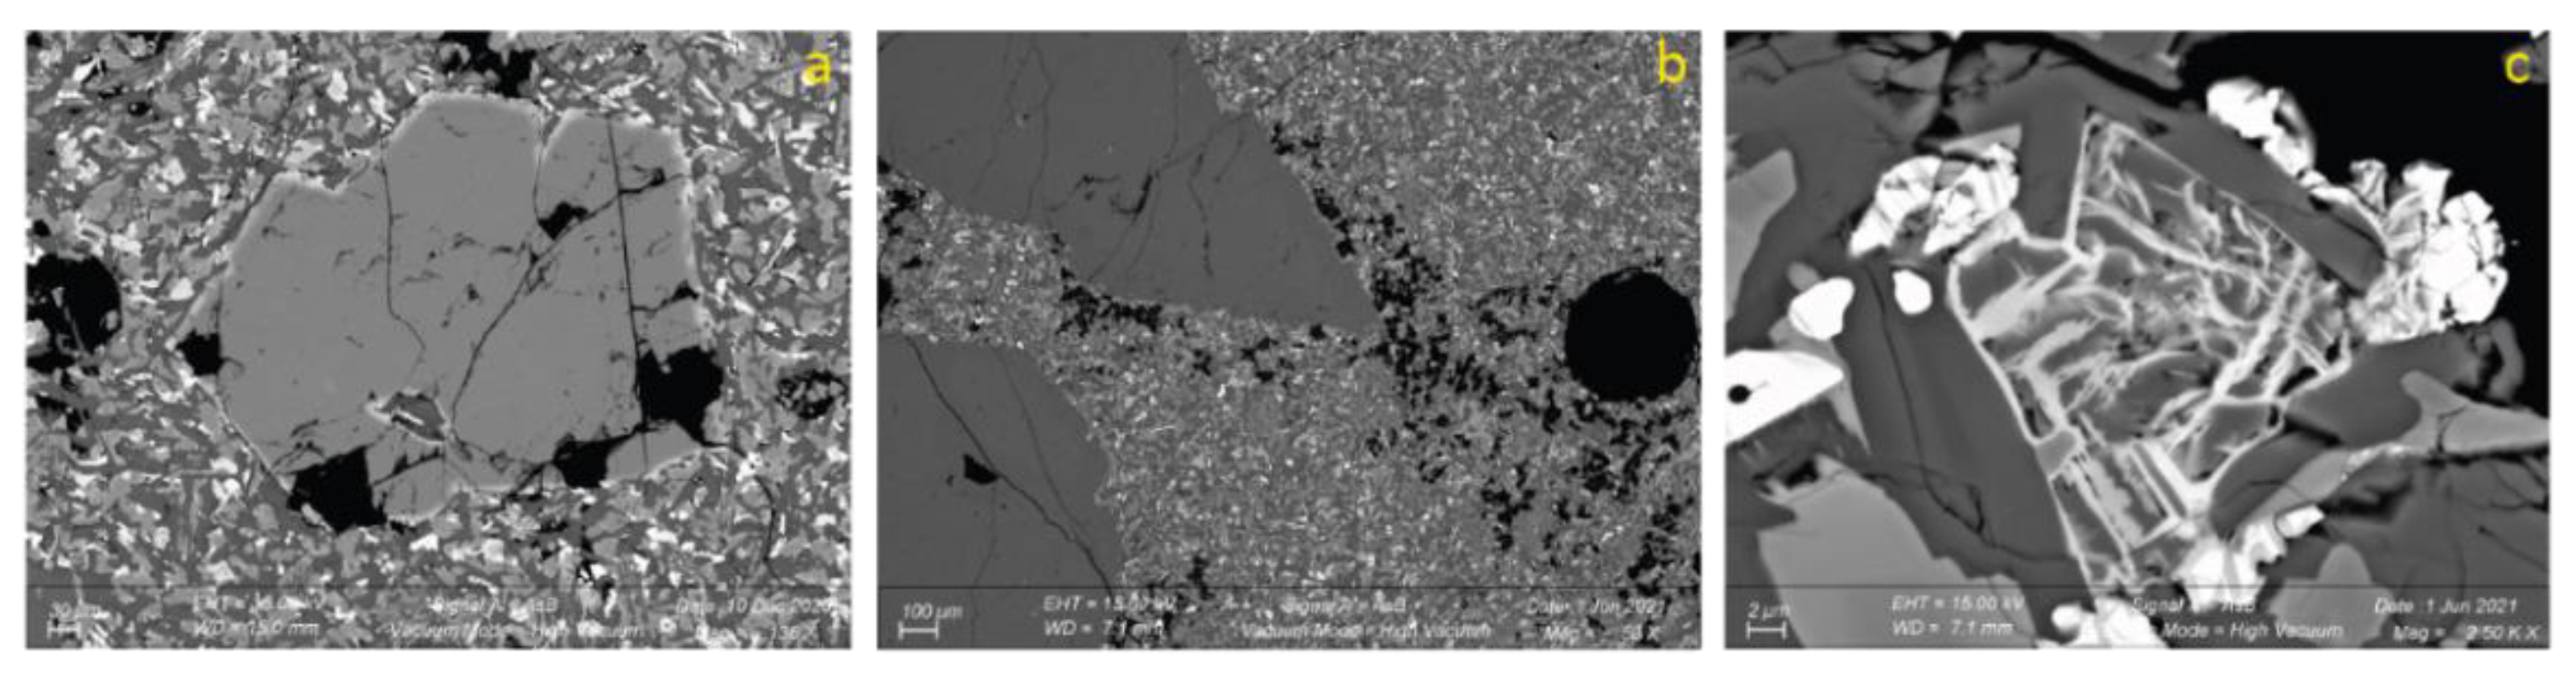
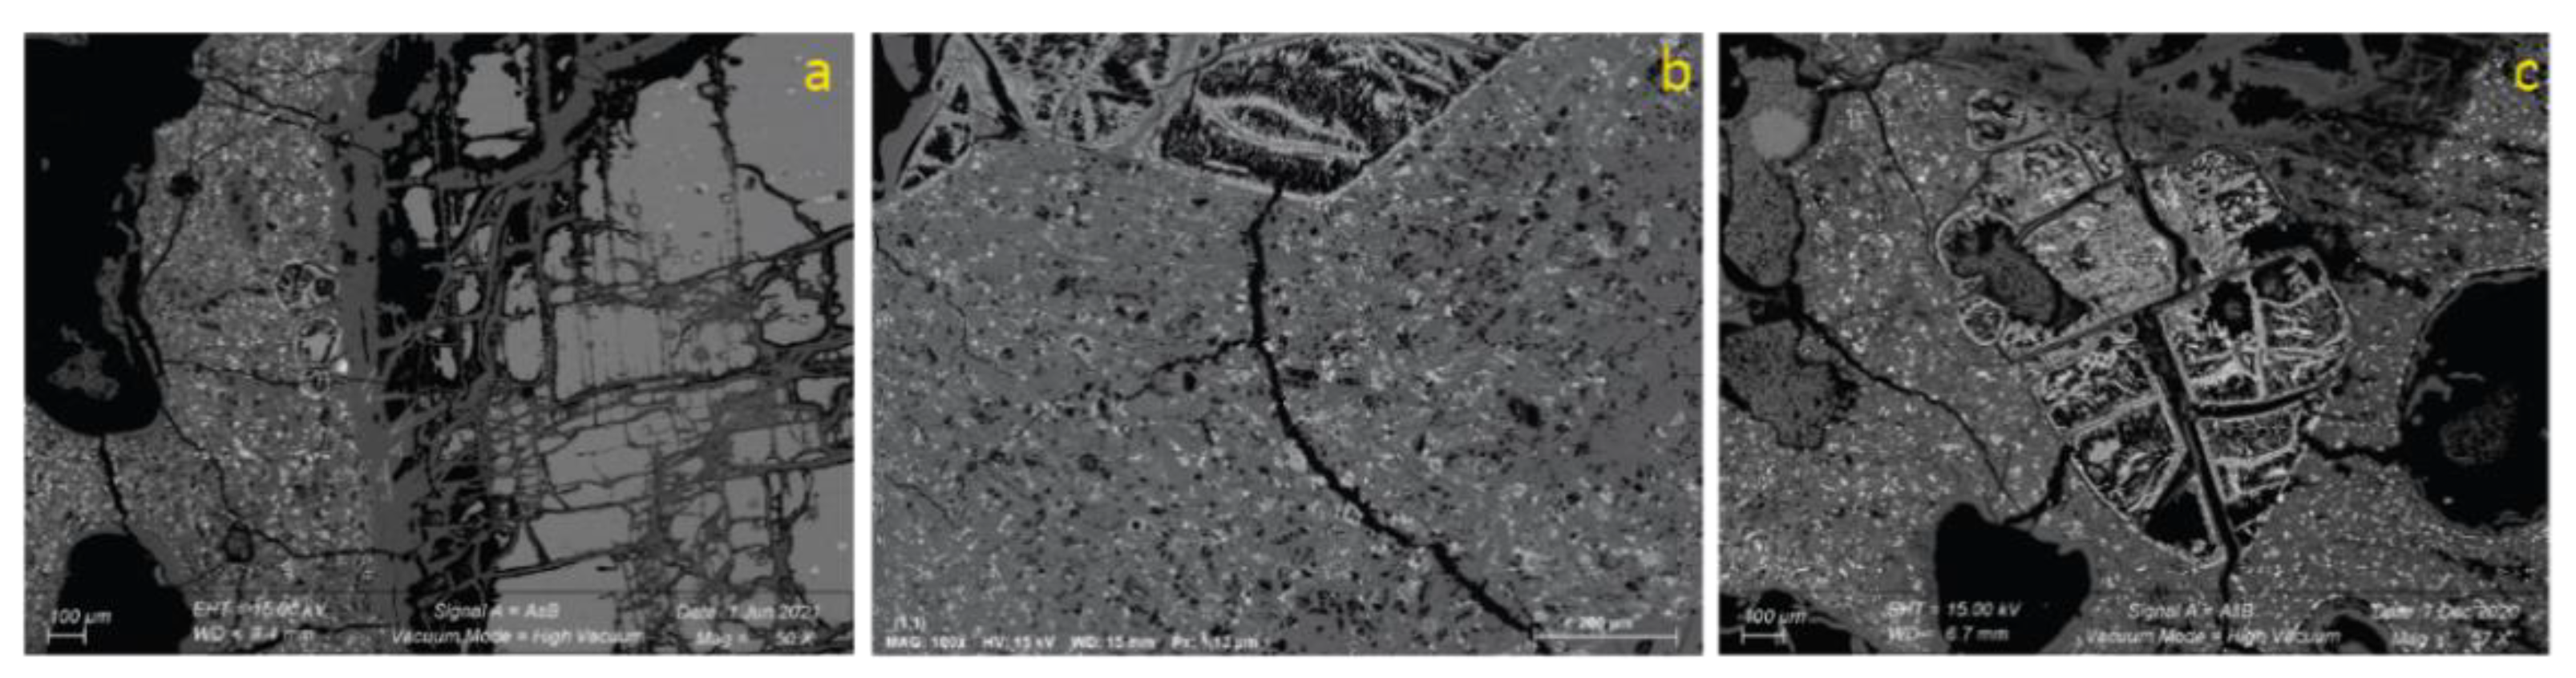
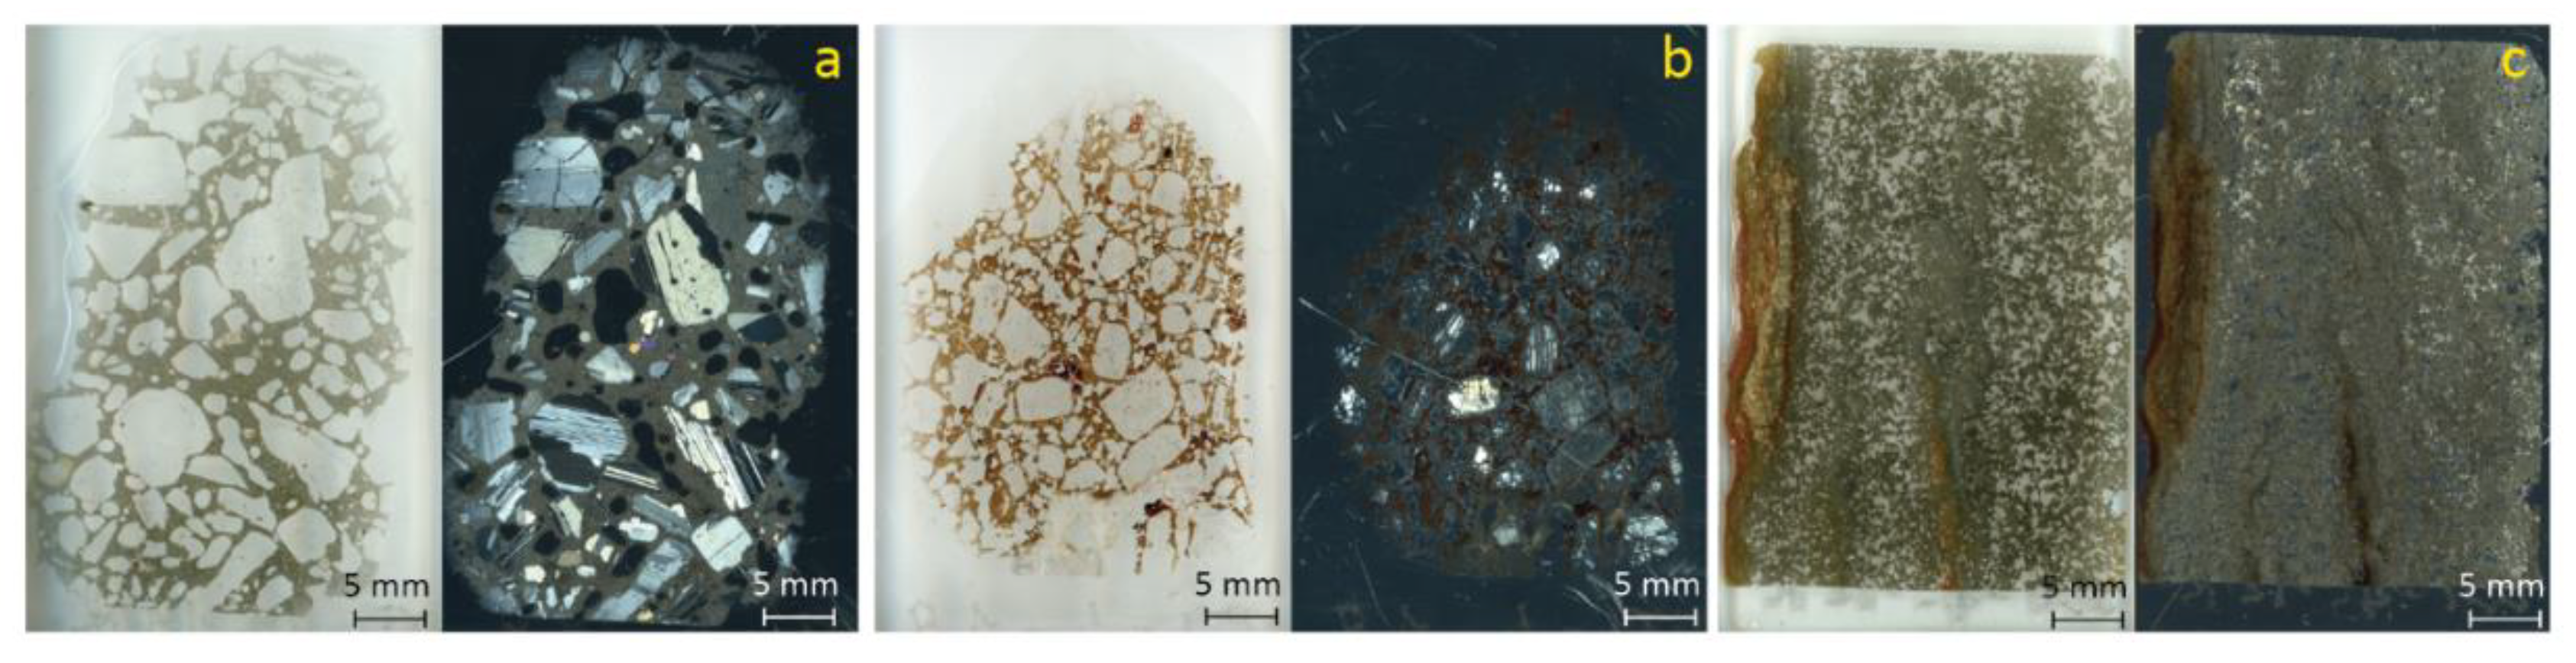
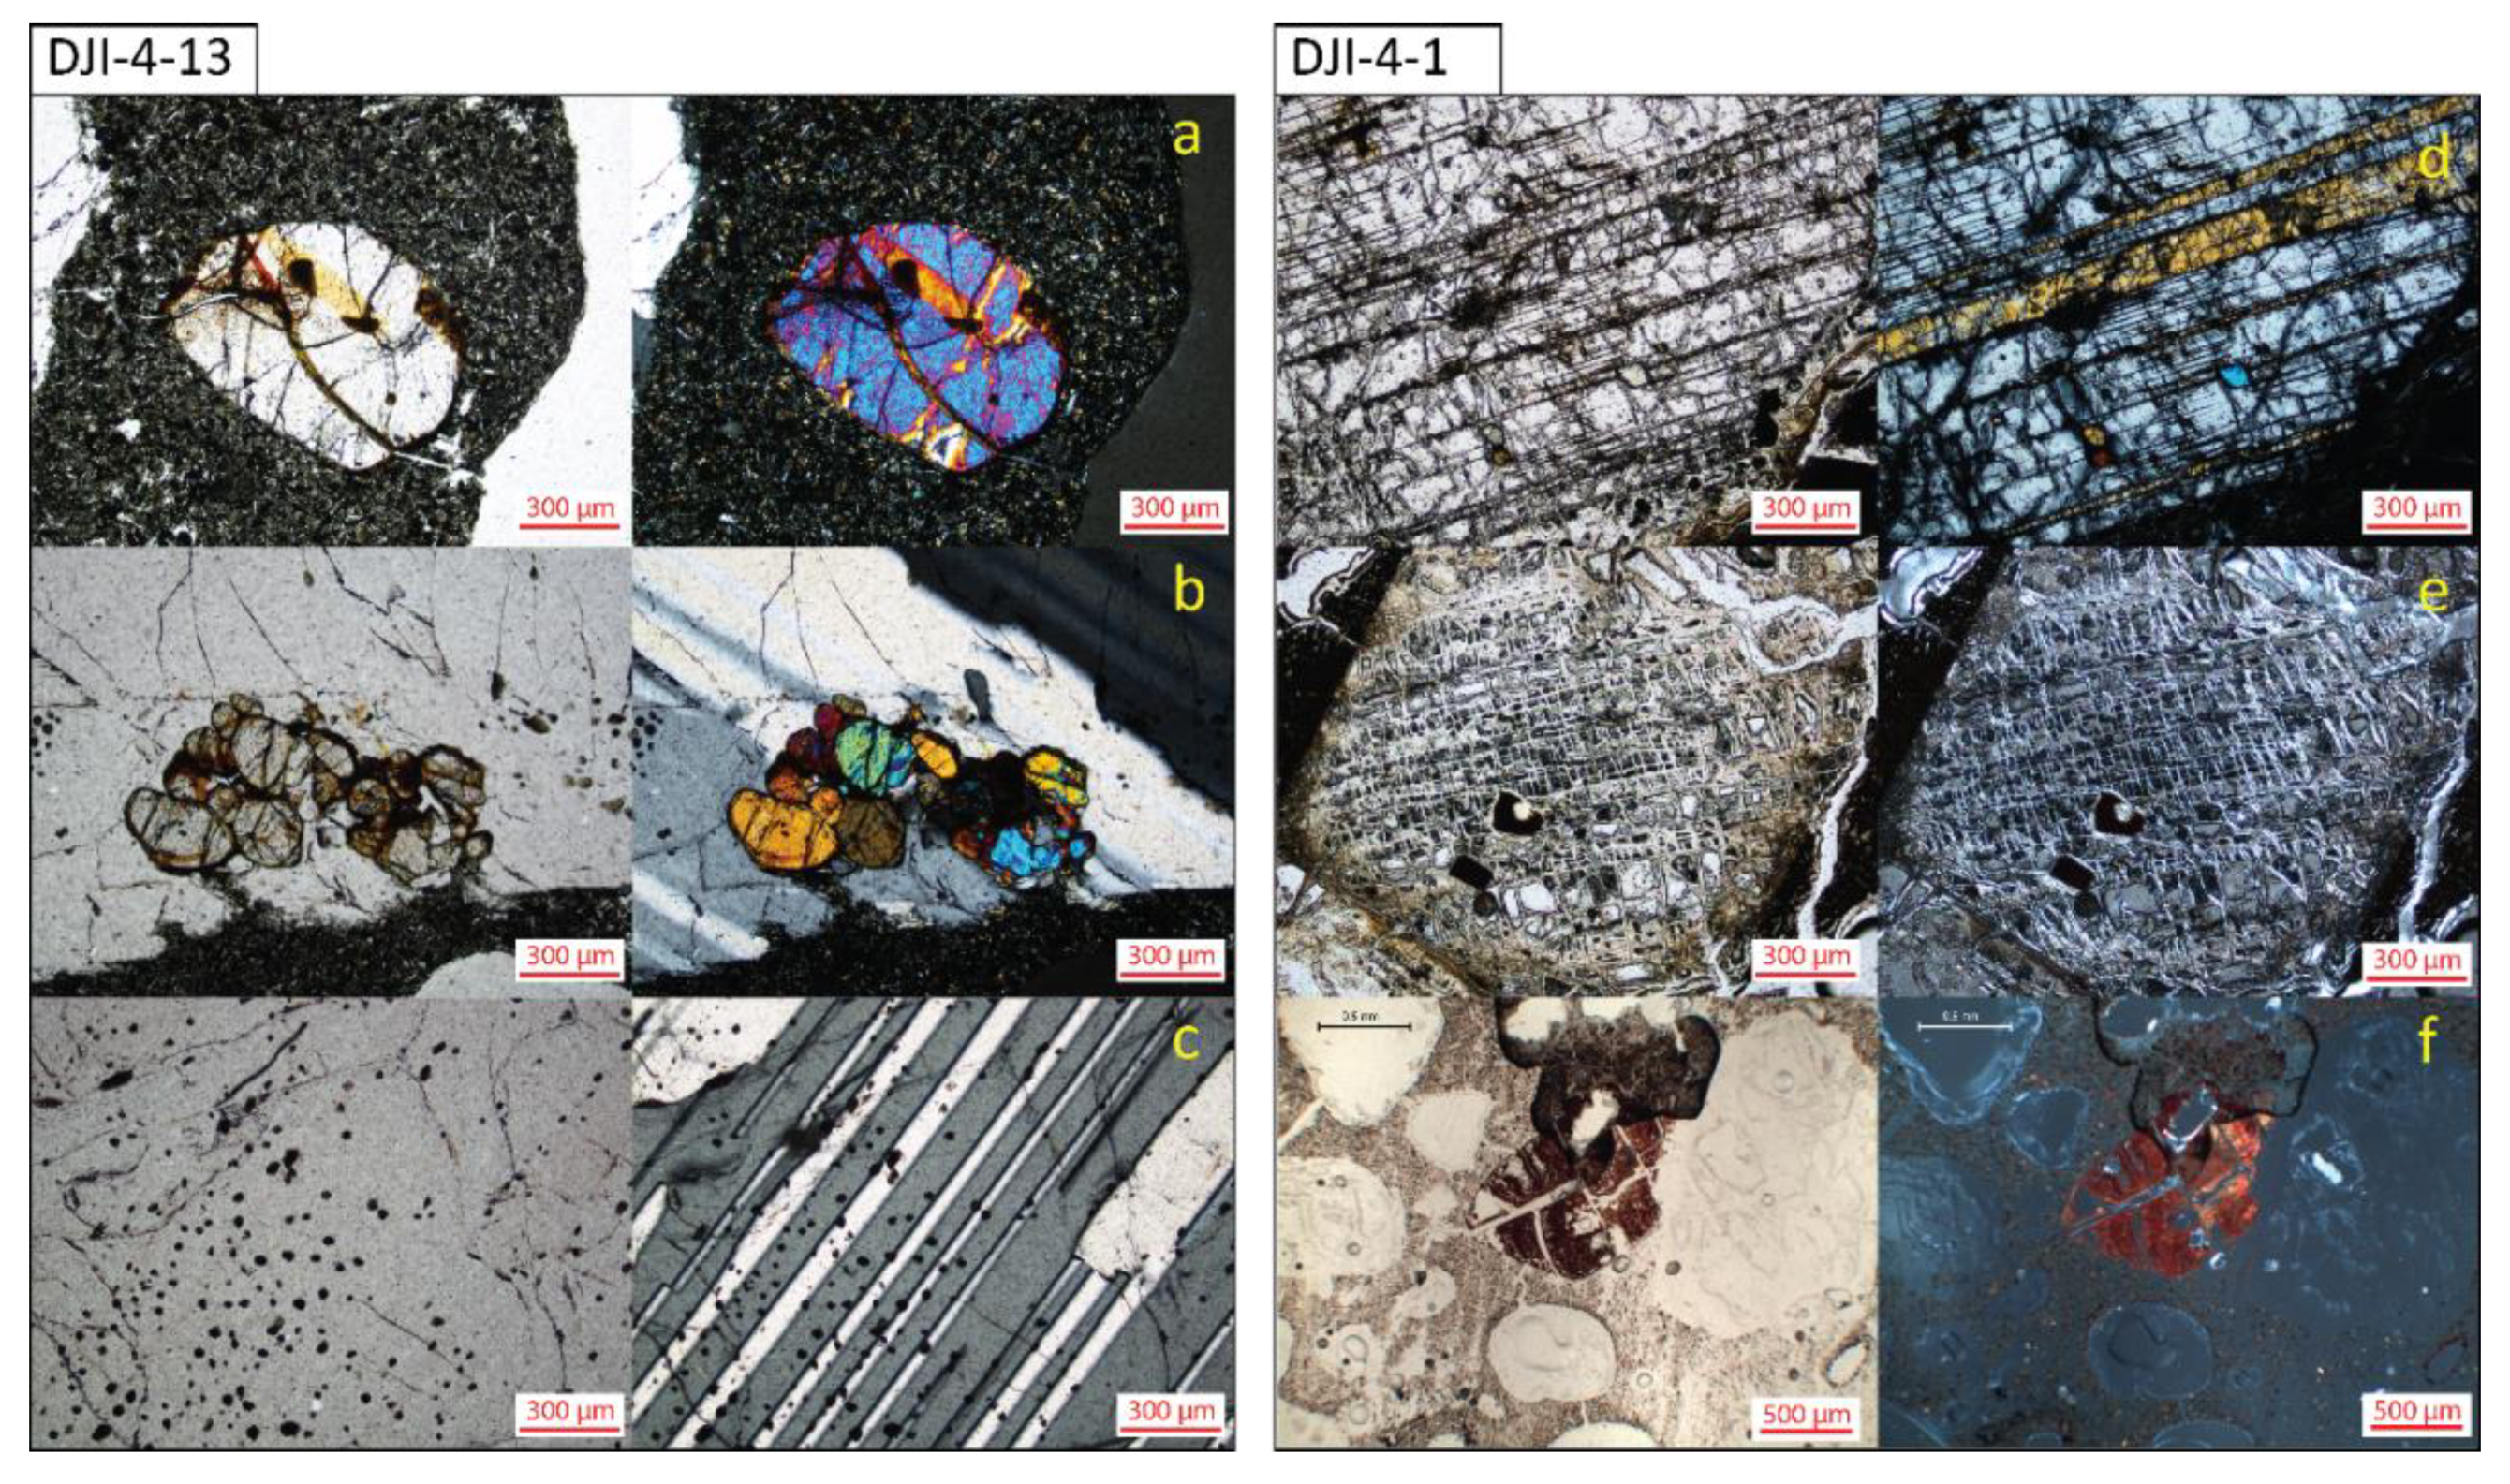
3.2.2. Microscopy
3.2.3. SEM
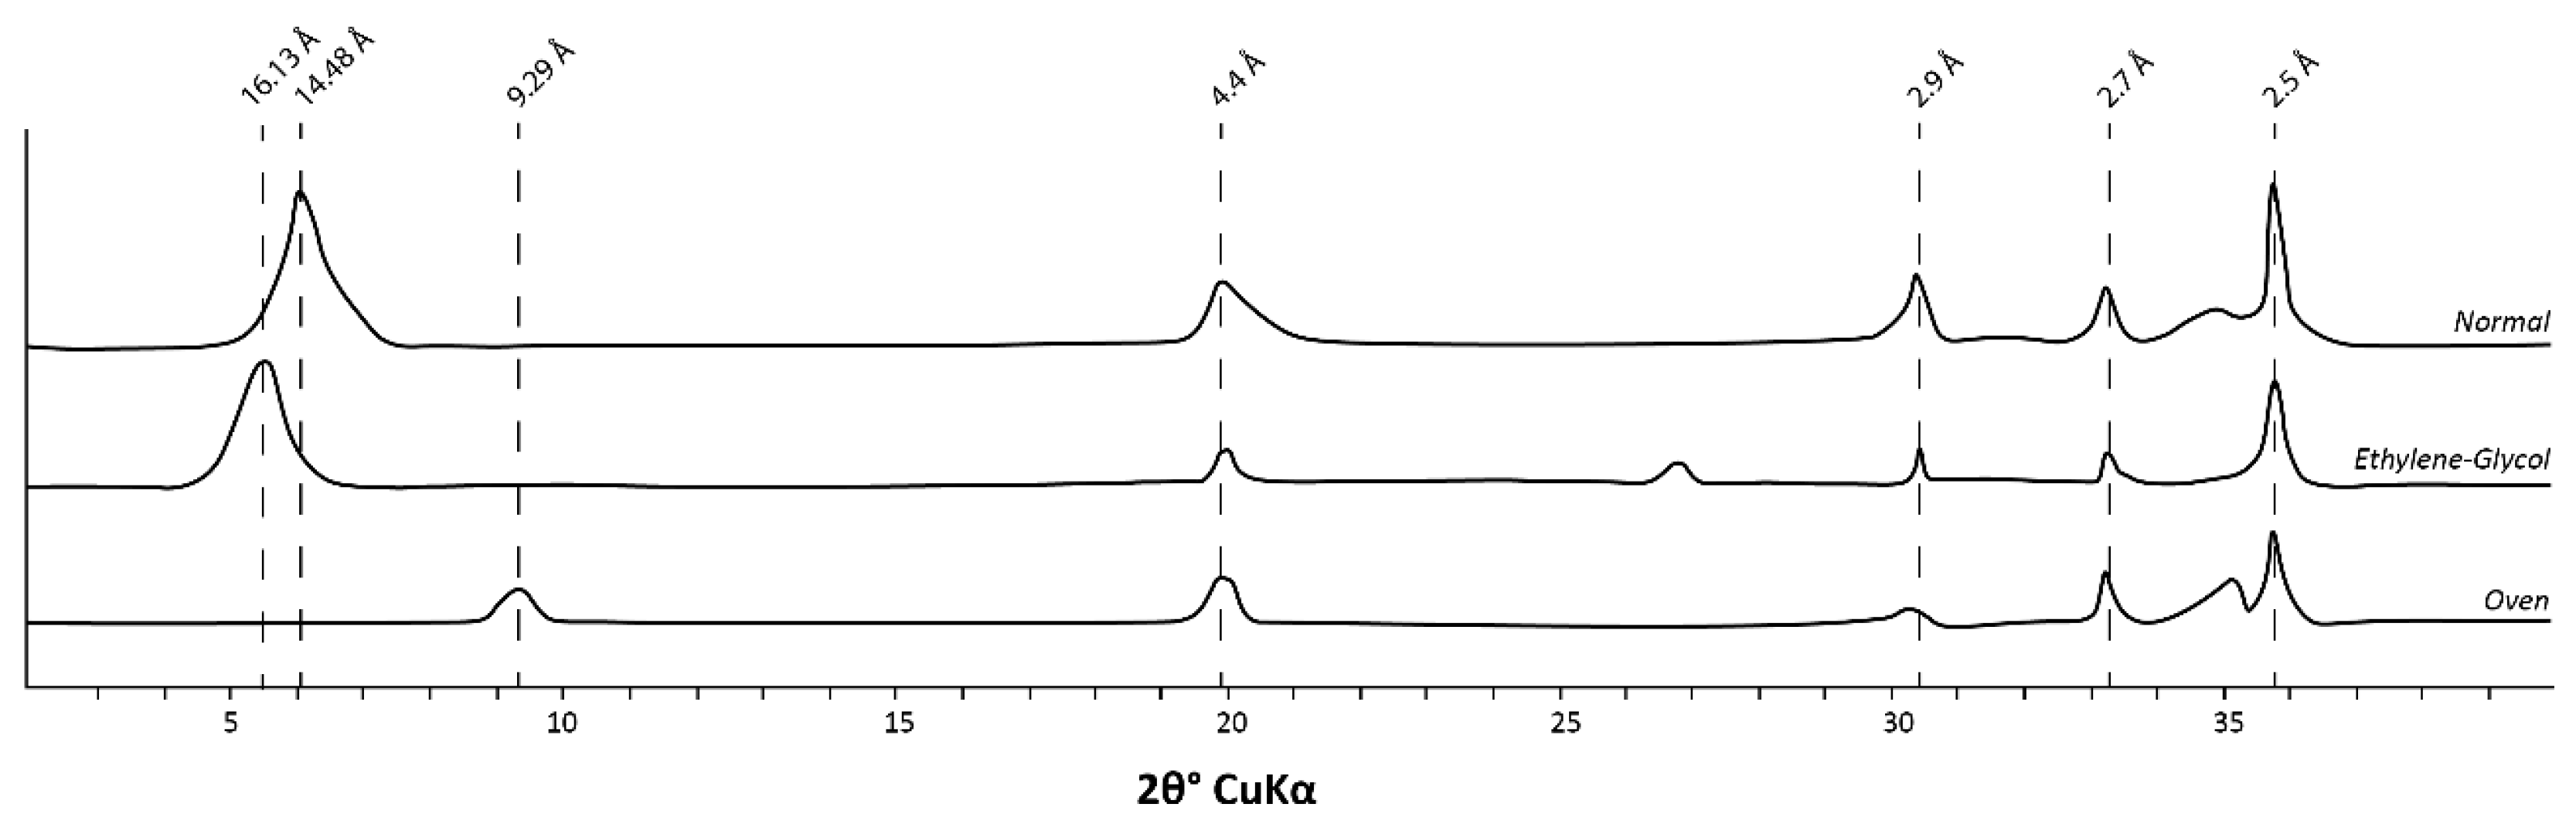
3.2.4. XRD
3.2.5. Mössbauer Spectroscopy 57Fe
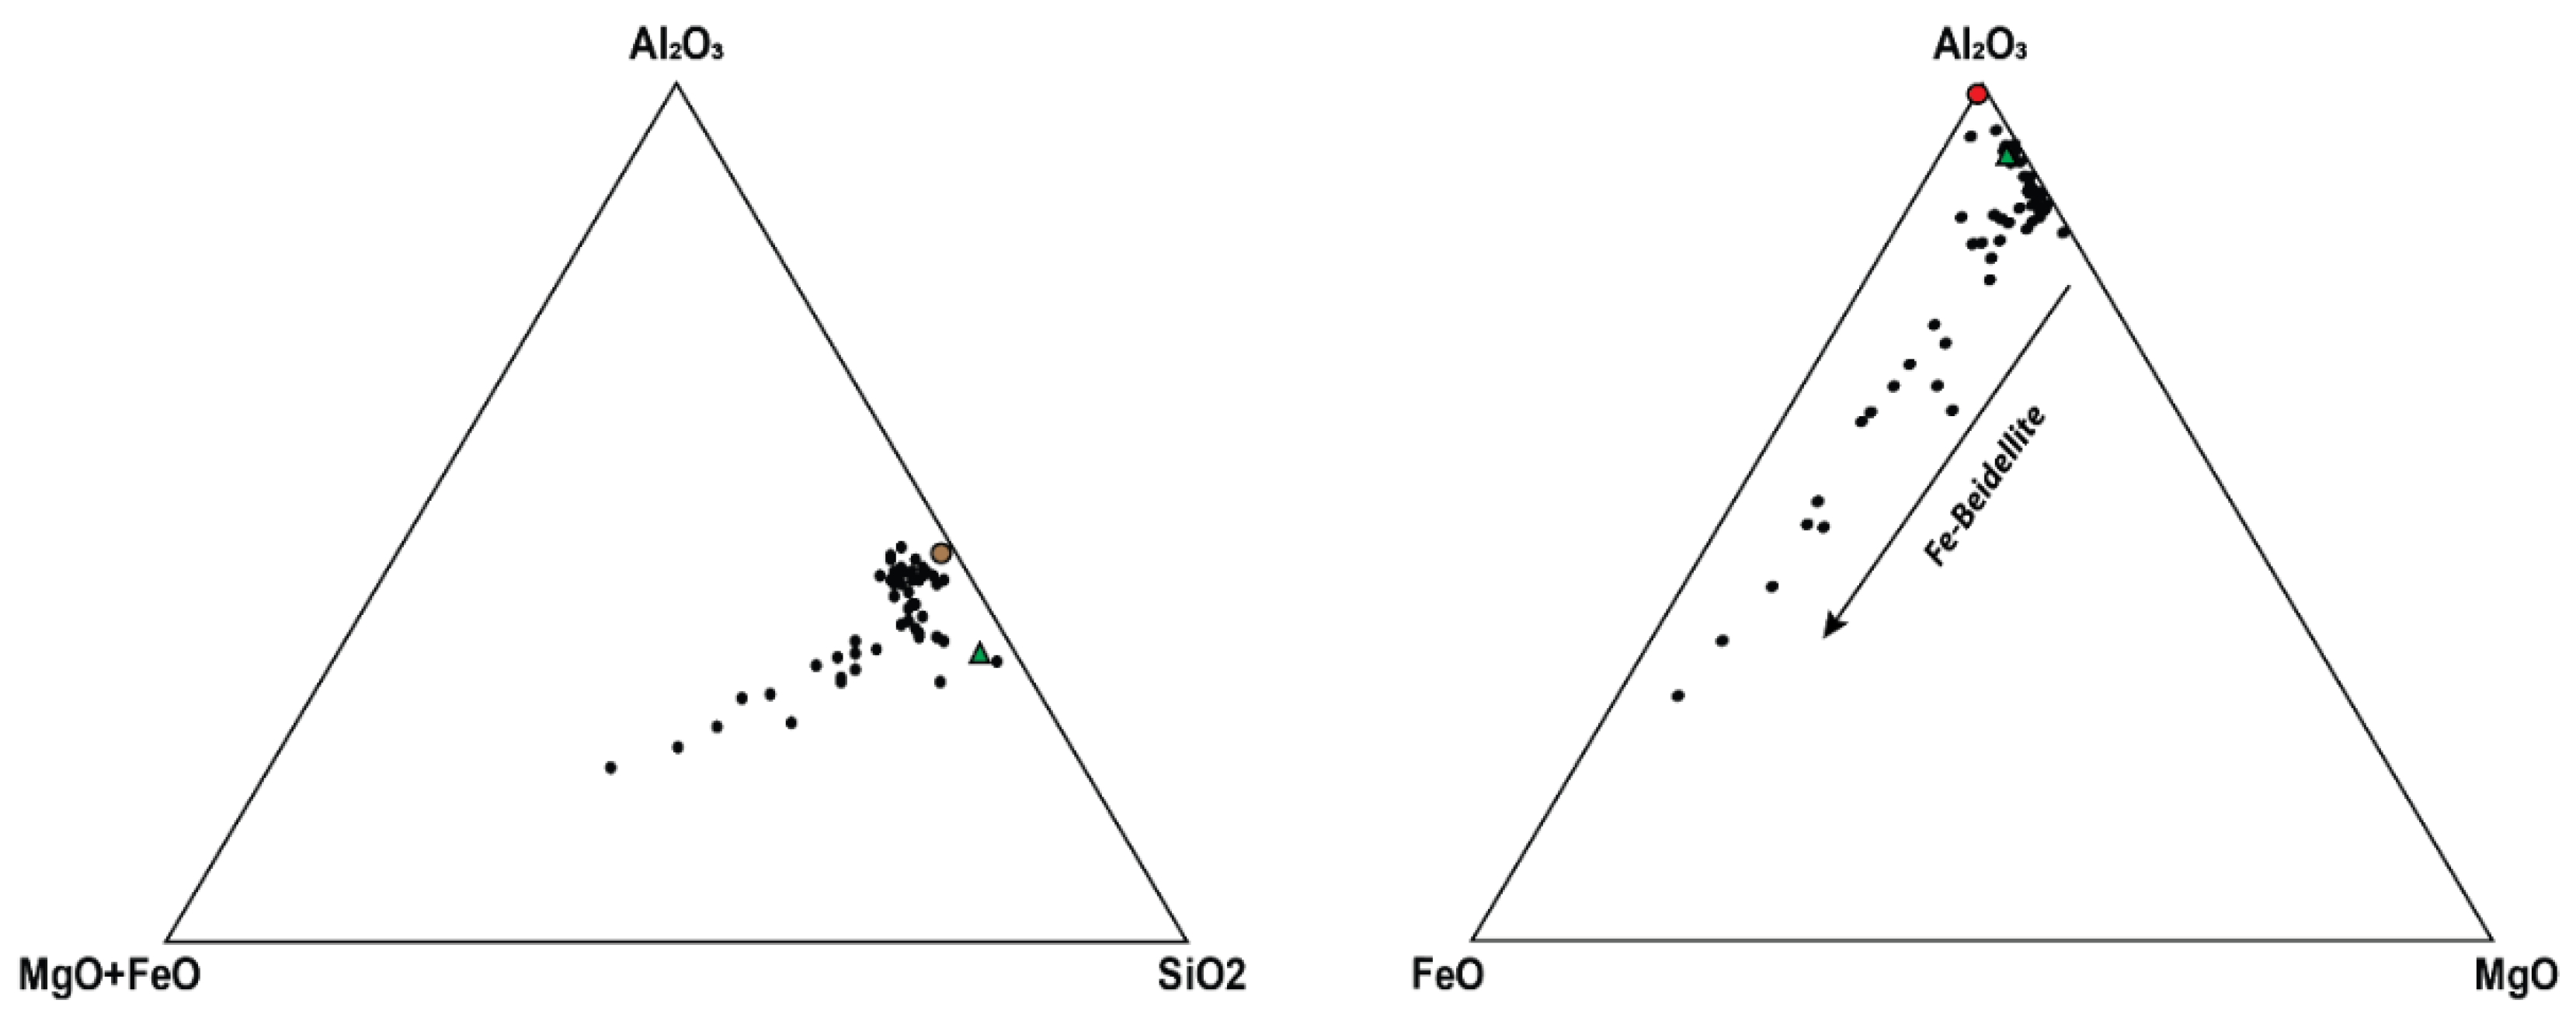
3.2.6. Microprobe
4. Discussion
4.1. Isotope Geothermometers
4.2. Mantle Influence on the Gas Mixture
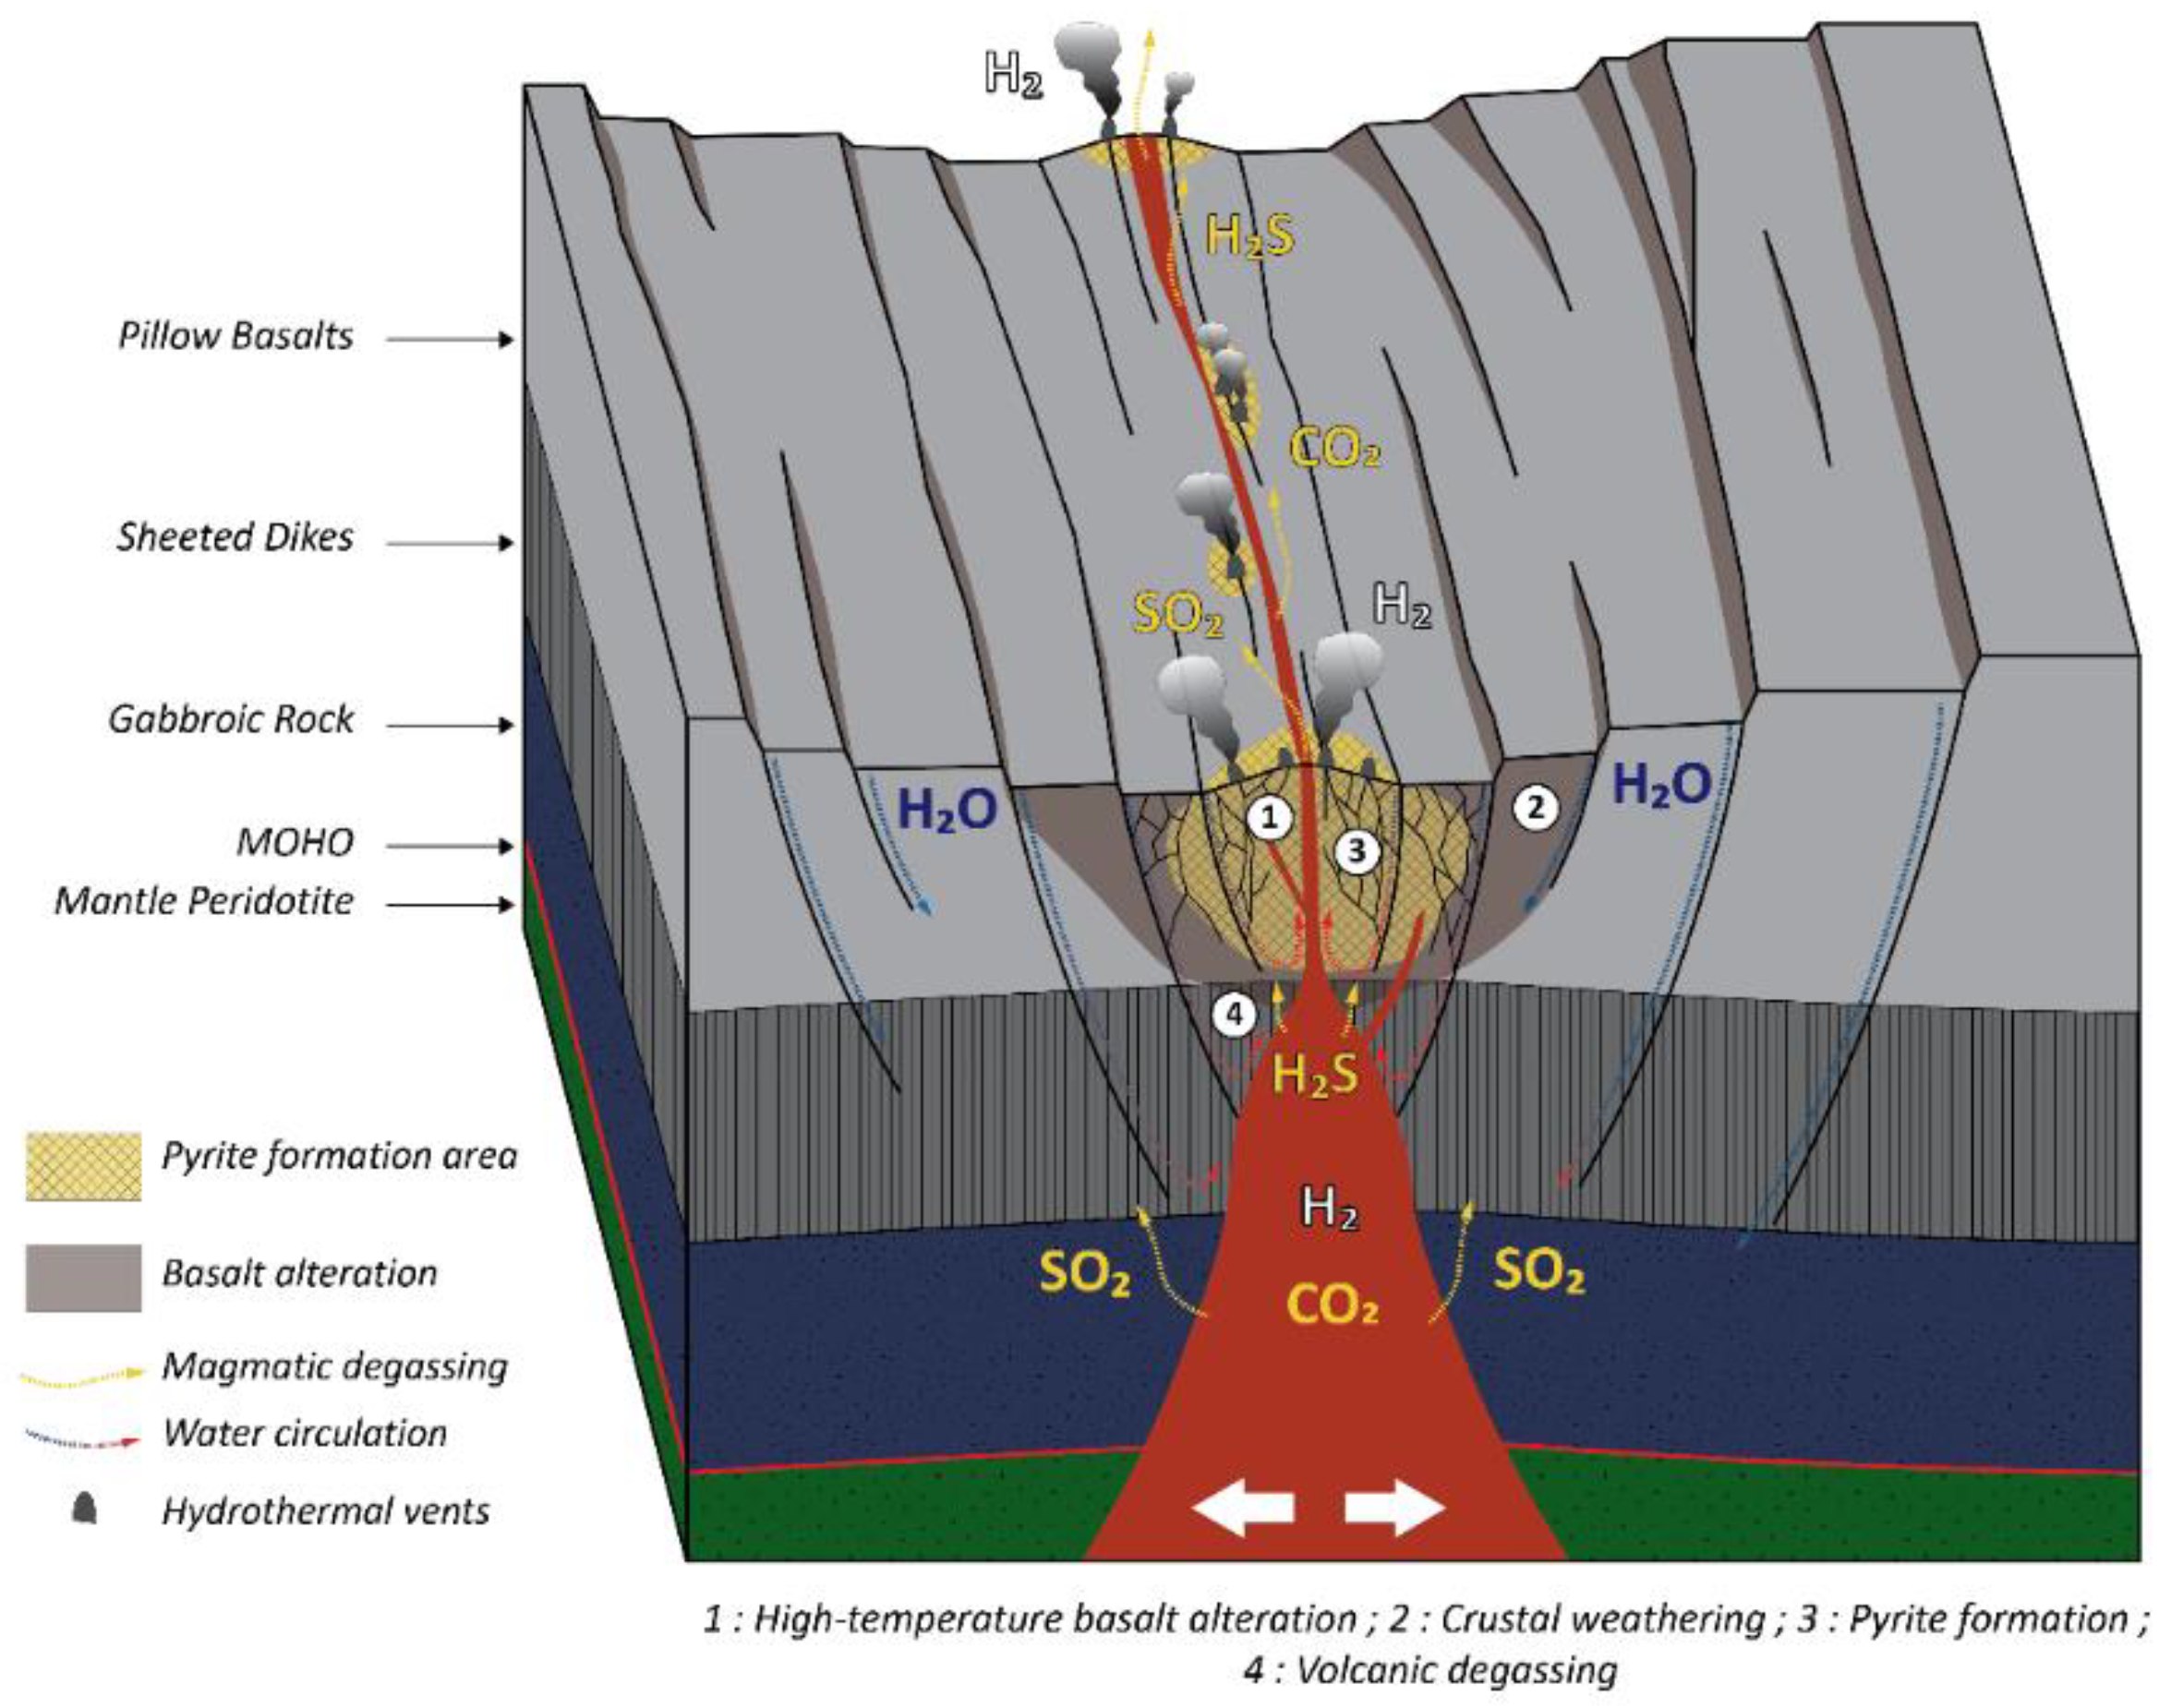
4.3. Basalt Hydrothermal Alteration Processes
4.4. H2 Origins
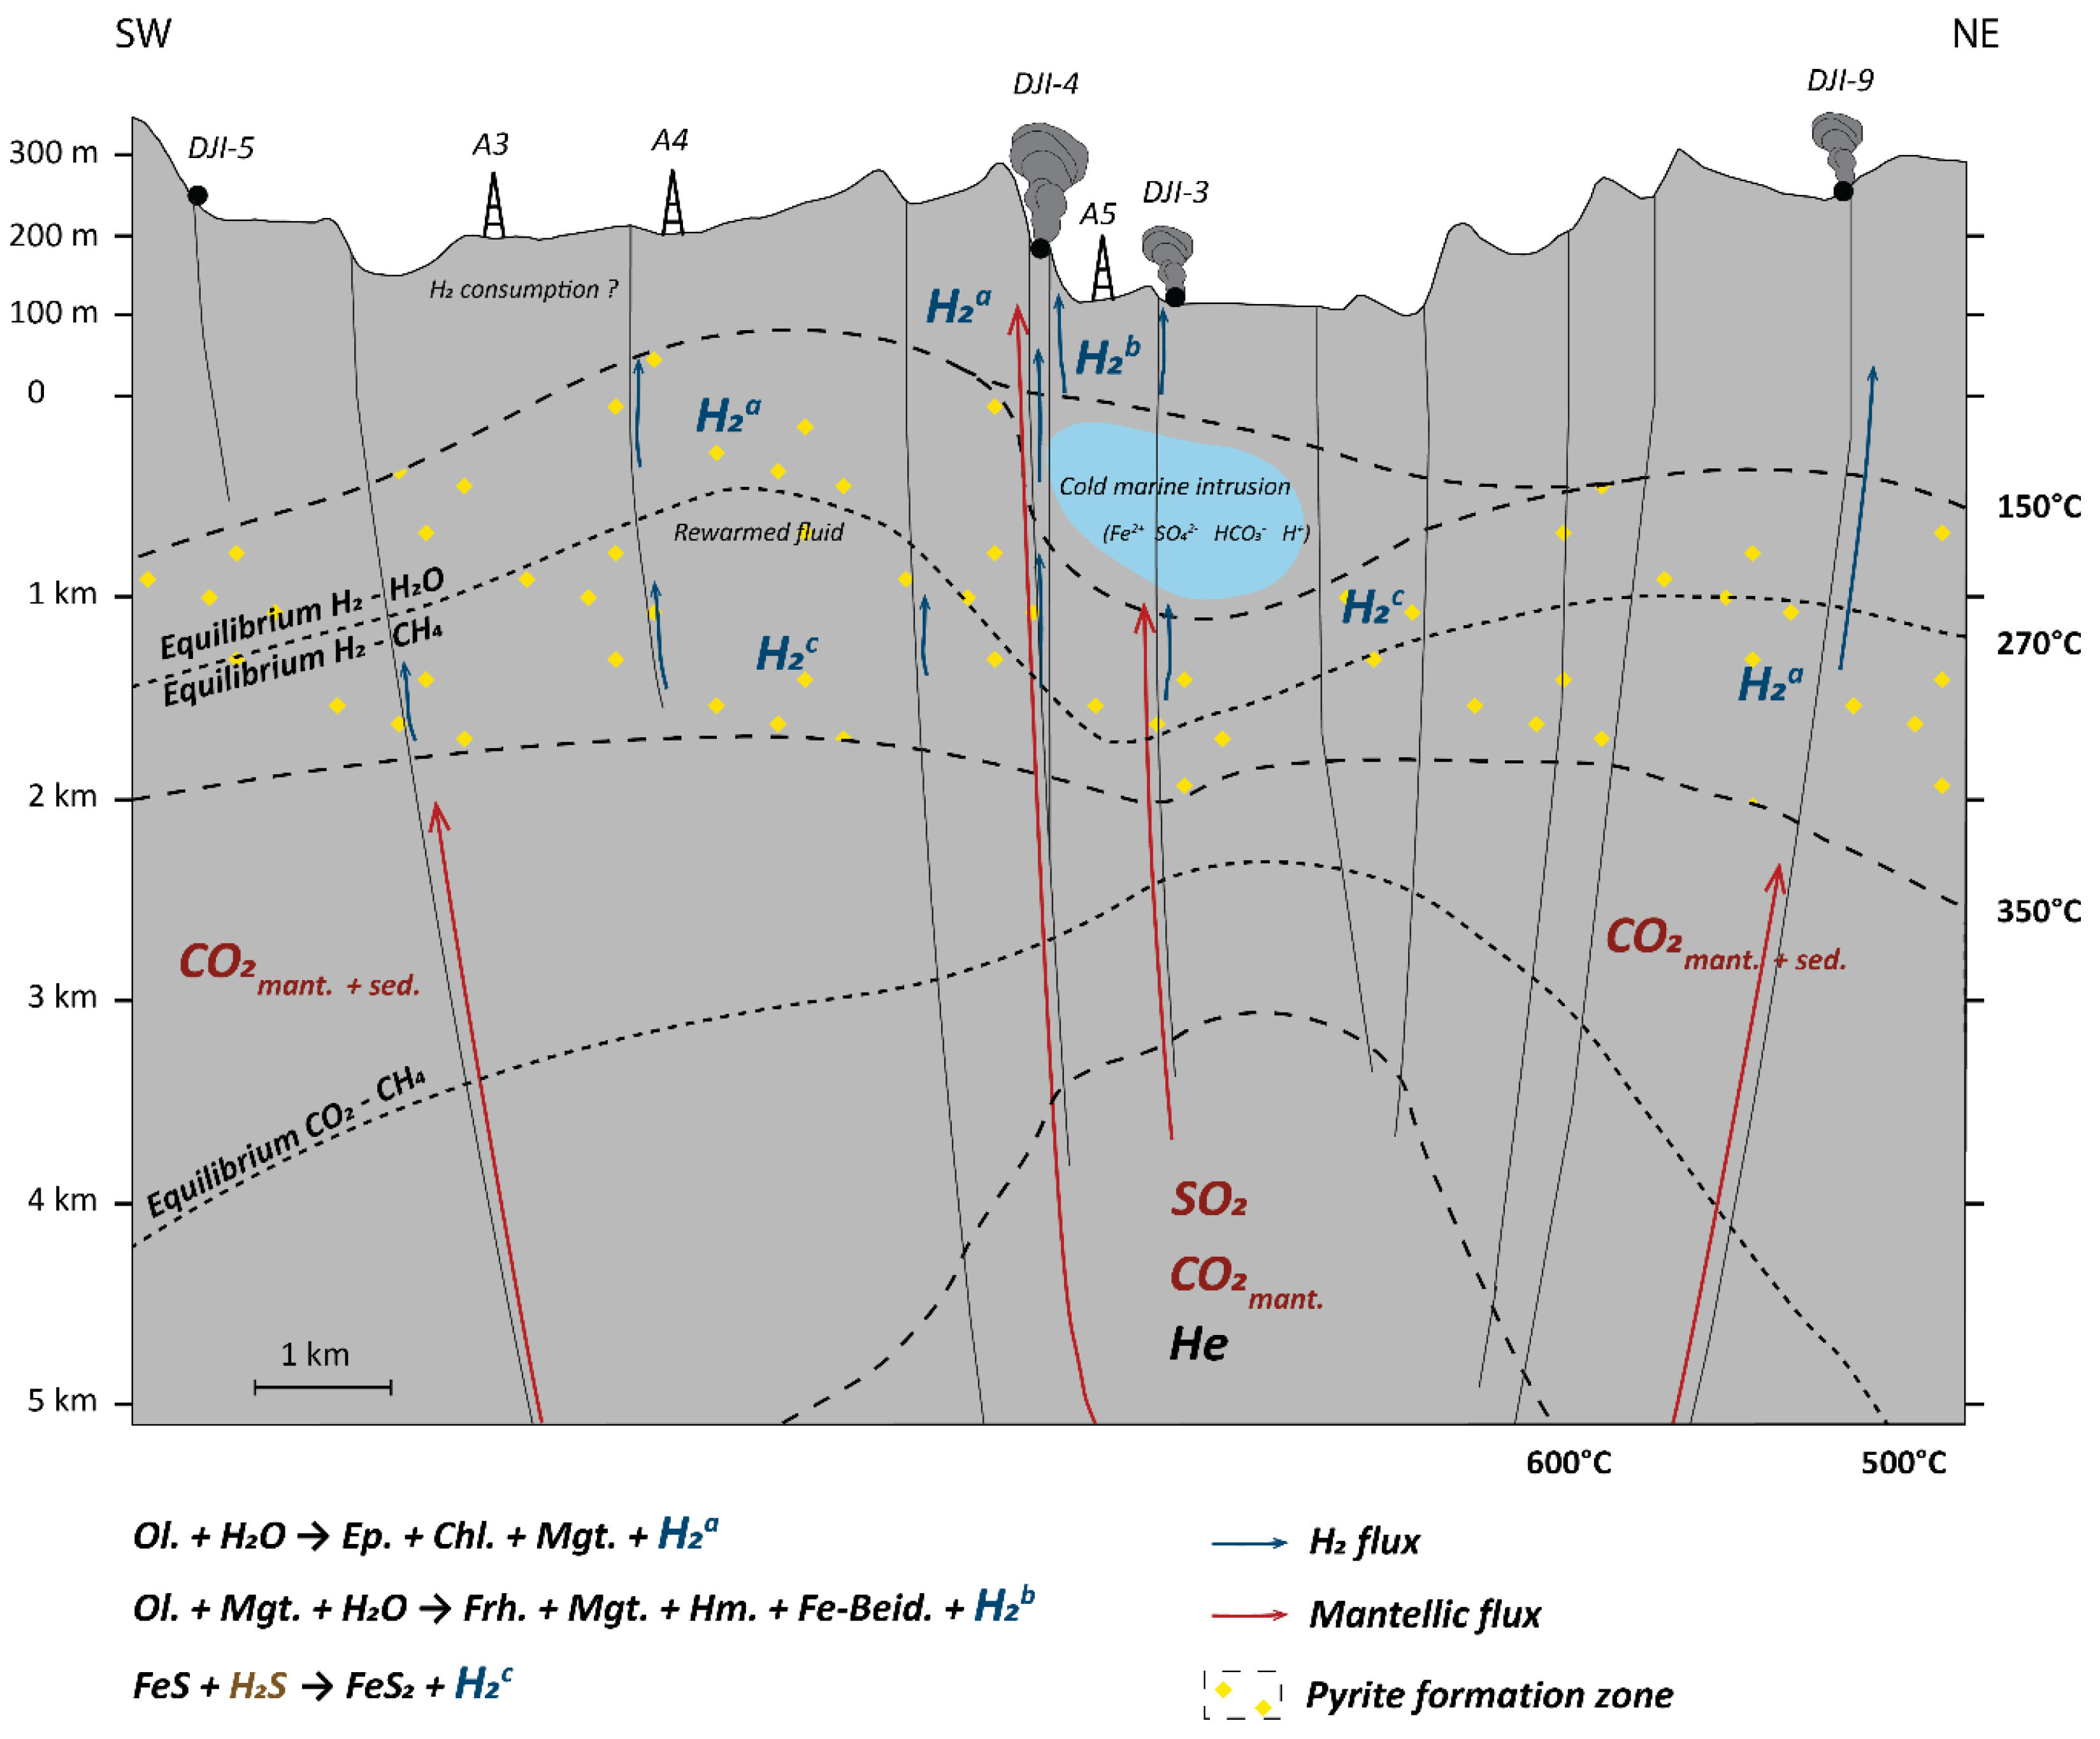
4.5. Model of Gas Formation and Circulation in the Asal-Ghoubbet Rift
5. Conclusions
Author Contributions
Funding
Data Availability Statement
Acknowledgments
Conflicts of Interest
References
- Moretti, I. H2: Energy Vector or Source? L’Actualité Chim. 2019, 3, 442. [Google Scholar]
- Moretti, I.; Webber, M.E. Natural Hydrogen: A Geological Curiosity or the Primary Energy Source for a Low-Carbon Future? 2021; Volume 6, Available online: https://www.renewablematter.eu/articles/article/natural-hydrogen-a-geological-curiosity-or-the-primary-energy-source-for-a-low-carbon-future (accessed on 28 December 2021).
- Smith, J.; Smith, P.; Wattenbach, M.; Zaehle, S.; Hiederer, R.; Jones, R.J.A.; Montanarella, L.; Rounsevell, M.D.A.; Reginster, I.; Ewert, F. Projected Changes in Mineral Soil Carbon of European Croplands and Grasslands, 1990–2080. Glob. Chang. Biol. 2005, 11, 2141–2152. [Google Scholar] [CrossRef]
- Prinzhofer, A.; Tahara Cissé, C.S.; Diallo, A.B. Discovery of a Large Accumulation of Natural Hydrogen in Bourakebougou (Mali). Int. J. Hydrogen Energy 2018, 43, 19315–19326. [Google Scholar] [CrossRef]
- Gaucher, E.C. New Perspectives in the Industrial Exploration for Native Hydrogen. Elements 2020, 16, 8–9. [Google Scholar] [CrossRef] [Green Version]
- Truche, L.; McCollom, T.M.; Martinez, I. Hydrogen and Abiotic Hydrocarbons: Molecules That Change the World. Elements 2020, 16, 13–18. [Google Scholar] [CrossRef]
- Deville, E.; Prinzhofer, A. The Origin of N2-H2-CH4-Rich Natural Gas Seepages in Ophiolitic Context: A Major and Noble Gases Study of Fluid Seepages in New Caledonia. Chem. Geol. 2016, 440, 139–147. [Google Scholar] [CrossRef]
- Vacquand, C.; Deville, E.; Beaumont, V.; Guyot, F.; Sissmann, O.; Pillot, D.; Arcilla, C.; Prinzhofer, A. Reduced Gas Seepages in Ophiolitic Complexes: Evidences for Multiple Origins of the H2-CH4-N2 Gas Mixtures. Geochim. Cosmochim. Acta 2018, 223, 437–461. [Google Scholar] [CrossRef]
- Larin, N.; Zgonnik, V.; Rodina, S.; Deville, E.; Prinzhofer, A.; Larin, V.N. Natural Molecular Hydrogen Seepage Associated with Surficial, Rounded Depressions on the European Craton in Russia. Nat. Resour. Res. 2015, 24, 369–383. [Google Scholar] [CrossRef]
- Zgonnik, V.; Beaumont, V.; Deville, E.; Larin, N.; Pillot, D.; Farrell, K.M. Evidence for Natural Molecular Hydrogen Seepage Associated with Carolina Bays (Surficial, Ovoid Depressions on the Atlantic Coastal Plain, Province of the USA). Prog. Earth Planet. Sci. 2015, 2, 31. [Google Scholar] [CrossRef] [Green Version]
- Moretti, I.; Prinzhofer, A.; Françolin, J.; Pacheco, C.; Rosanne, M.; Rupin, F.; Mertens, J. Long-Term Monitoring of Natural Hydrogen Superficial Emissions in a Brazilian Cratonic Environment. Sporadic Large Pulses versus Daily Periodic Emissions. Int. J. Hydrogen Energy 2021, 46, 3615–3628. [Google Scholar] [CrossRef]
- Prinzhofer, A.; Moretti, I.; Françolin, J.; Pacheco, C.; D’Agostino, A.; Werly, J.; Rupin, F. Natural Hydrogen Continuous Emission from Sedimentary Basins: The Example of a Brazilian H2-Emitting Structure. Int. J. Hydrogen Energy 2019, 44, 5676–5685. [Google Scholar] [CrossRef]
- Boreham, C.J.; Sohn, J.H.; Cox, N.; Williams, J.; Hong, Z.; Kendrick, M.A. Hydrogen and Hydrocarbons Associated with the Neoarchean Frog’s Leg Gold Camp, Yilgarn Craton, Western Australia. Chem. Geol. 2021, 575, 120098. [Google Scholar] [CrossRef]
- Moretti, I.; Brouilly, E.; Loiseau, K.; Prinzhofer, A.; Deville, E. Hydrogen Emanations in Intracratonic Areas: New Guide Lines for Early Exploration Basin Screening. Geosciences 2021, 11, 145. [Google Scholar] [CrossRef]
- Charlou, J.L.; Donval, J.P.; Fouquet, Y.; Jean-Baptiste, P.; Holm, N. Geochemistry of High H2 and CH4 Vent Fluids Issuing from Ultramafic Rocks at the Rainbow Hydrothermal Field (36j14VN, MAR). Chem. Geol. 2002, 191, 345–359. [Google Scholar] [CrossRef]
- Charlou, J.L.; Fouquet, Y.; Bougault, H.; Donval, J.P.; Etoubleau, J.; Jean-Baptiste, P.; Dapoigny, A.; Appriou, P.; Rona, P.A. Intense CH4 Plumes Generated by Serpentinization of Ultramafic Rocks at the Intersection of the 15°20′ N Fracture Zone and the Mid-Atlantic Ridge. Geochim. Cosmochim. Acta 1998, 62, 2323–2333. [Google Scholar] [CrossRef]
- Kelley, D.S. A Serpentinite-Hosted Ecosystem: The Lost City Hydrothermal Field. Science 2005, 307, 1428–1434. [Google Scholar] [CrossRef] [PubMed]
- Kelley, D.S.; Karson, J.A.; Blackman, D.K.; Olson, E.J.; Schrenk, M.O.; Roe, K.K. An Off-Axis Hydrothermal Vent ®eld near the Mid-Atlantic Ridge at 30°N. Nature 2001, 412, 145–149. [Google Scholar] [CrossRef] [PubMed]
- Kelley, D.S.; Baross, J.A.; Delaney, J.R. Volcanoes, Fluids, and Life at Mid-Ocean Ridge Spreading Centers. Annu. Rev. Earth Planet. Sci. 2002, 30, 385–491. [Google Scholar] [CrossRef] [Green Version]
- Baross, J.A.; Hoffman, S.E. Submarine Hydrothermal Vents and Associated Gradient Environments as Sites for the Origin and Evolution of Life. Orig. Life Evol. Biosph. 1985, 15, 327–345. [Google Scholar] [CrossRef]
- Edmond, J.M.; Campbell, A.C.; Palmer, M.R.; Klinkhammer, G.P.; German, C.R.; Edmonds, H.N.; Elderfield, H.; Thompson, G.; Rona, P. Time Series Studies of Vent Fluids from the TAG and MARK Sites (1986, 1990) Mid-Atlantic Ridge: A New Solution Chemistry Model and a Mechanism for Cu/Zn Zonation in Massive Sulphide Orebodies. Geol. Soc. Lond. Spec. Publ. 1995, 87, 77–86. [Google Scholar] [CrossRef]
- Tivey, M.K.; Humphris, S.E.; Thompson, G.; Hannington, M.D.; Rona, P.A. Deducing Patterns of Fluid Flow and Mixing within the TAG Active Hydrothermal Mound Using Mineralogical and Geochemical Data. J. Geophys. Res. 1995, 100, 12527–12555. [Google Scholar] [CrossRef]
- Von Damm, K.L.; Lilley, M.D.; Iii, W.C.S.; Brockington, M.; Bray, A.M.; O’Grady, K.M.; Olson, E.; Graham, A.; Proskurowski, G. Extraordinary Phase Separation and Segregation in Vent Fluids from the Southern East Pacific Rise. Earth Planet. Sci. Lett. 2003, 206, 365–378. [Google Scholar] [CrossRef]
- Douville, E.; Charlou, J.L.; Oelkers, E.H.; Bienvenu, P.; Colon, C.F.J.; Donval, J.P.; Fouquet, Y.; Prieur, D.; Appriou, P. The Rainbow Vent Fluids (36°14′N, MAR): The Influence of Ultramafic Rocks and Phase Separation on Trace Metal Content in Mid-Atlantic Ridge Hydrothermal f Luids. Chem. Geol. 2002, 12. [Google Scholar] [CrossRef]
- Früh-Green, G.L. 30,000 Years of Hydrothermal Activity at the Lost City Vent Field. Science 2003, 301, 495–498. [Google Scholar] [CrossRef] [Green Version]
- Mével, C. Serpentinization of abyssal peridotites at mid-ocean ridges. Comptes Rendus Geosci. 2003, 335, 825–852. [Google Scholar] [CrossRef]
- Kelemen, P.B.; Matter, J. In Situ Carbonation of Peridotite for CO2 Storage. Proc. Natl. Acad. Sci. USA 2008, 105, 17295–17300. [Google Scholar] [CrossRef] [Green Version]
- Andreani, M.; Mével, C.; Boullier, A.-M.; Escartín, J. Dynamic Control on Serpentine Crystallization in Veins: Constraints on Hydration Processes in Oceanic Peridotites: Serpentine Crystallization. Geochem. Geophys. Geosyst. 2007, 8, n/a. [Google Scholar] [CrossRef]
- Blackman, D.K.; Karson, J.A.; Kelley, D.S.; Cann, J.R.; Früh-Green, G.L.; Gee, J.S.; Hurst, S.D.; John, B.E.; Morgan, J.; Nooner, S.L.; et al. Geology of the Atlantis Massif (Mid-Atlantic Ridge, 30° N): Implications for the Evolution of an Ultramafic Oceanic Core Complex. Mar. Geophys. Res. 2002, 23, 443–469. [Google Scholar] [CrossRef]
- Cannat, M.; Rommevaux-Jestin, C.; Fujimoto, H. Melt Supply Variations to a Magma-Poor Ultra-Slow Spreading Ridge (Southwest Indian Ridge 61° to 69°E): Melt Supply Variations. Geochem. Geophys. Geosyst. 2003, 4. [Google Scholar] [CrossRef]
- Combaudon, V. Evolution des gaz associes à l’ouverture des rides océaniques: Cas de l’hydrogène naturel en Islande. 2020, 42. [Google Scholar]
- Charlou, J.L.; Donval, J.P.; Konn, C.; Ondréas, H.; Fouquet, Y.; Jean-Baptiste, P.; Fourré, E. High Production and Fluxes of H2 and CH4 and Evidence of Abiotic Hydrocarbon Synthesis by Serpentinization in Ultramafic-Hosted Hydrothermal Systems on the Mid-Atlantic Ridge. In Diversity of Hydrothermal Systems on Slow Spreading Ocean Ridges; Geophysical Monograph Series; Rona, P.A., Devey, C.W., Dyment, J., Murton, B.J., Eds.; American Geophysical Union: Washington, DC, USA, 2010; Volume 188, pp. 265–296. ISBN 978-0-87590-478-8. [Google Scholar]
- Kularatne, K.; Sissmann, O.; Kohler, E.; Chardin, M.; Noirez, S.; Martinez, I. Simultaneous Ex-Situ CO2 Mineral Sequestration and Hydrogen Production from Olivine-Bearing Mine Tailings. Appl. Geochem. 2018, 95, 195–205. [Google Scholar] [CrossRef]
- Sissmann, O.; Brunet, F.; Martinez, I.; Guyot, F.; Verlaguet, A.; Pinquier, Y.; Daval, D. Enhanced Olivine Carbonation within a Basalt as Compared to Single-Phase Experiments: Reevaluating the Potential of CO2 Mineral Sequestration. Environ. Sci. Technol. 2014, 48, 5512–5519. [Google Scholar] [CrossRef] [PubMed]
- Stevens, T.O.; McKinley, J.P. Abiotic Controls on H2 Production from Basalt−Water Reactions and Implications for Aquifer Biogeochemistry. Environ. Sci. Technol. 2000, 34, 826–831. [Google Scholar] [CrossRef]
- McCollom, T.M.; Bach, W. Thermodynamic Constraints on Hydrogen Generation during Serpentinization of Ultramafic Rocks. Geochim. Cosmochim. Acta 2009, 73, 856–875. [Google Scholar] [CrossRef]
- Seyfried, W.E.; Foustoukos, D.I.; Fu, Q. Redox Evolution and Mass Transfer during Serpentinization: An Experimental and Theoretical Study at 200 °C, 500bar with Implications for Ultramafic-Hosted Hydrothermal Systems at Mid-Ocean Ridges. Geochim. Cosmochim. Acta 2007, 71, 3872–3886. [Google Scholar] [CrossRef]
- Honnorez, J.J.; Alt, J.C.; Humphris, S.E. (Eds.) Vivisection and Autopsy of Active and Fossil Hydrothermal Alterations of Basalt beneath and within the TAG Hydrothermal Mound. In Proceedings of the Ocean Drilling Program; IODP Publication Services, Texas A&M University: College Station, TX, USA, 1998; Volume 158. [Google Scholar]
- Seewald, J.S.; Seyfried, W.E. The Effect of Temperature on Metal Mobility in Subseafloor Hydrothermal Systems: Constraints from Basalt Alteration Experiments. Earth Planet. Sci. Lett. 1990, 101, 388–403. [Google Scholar] [CrossRef]
- Seyfried, W.; Bischoff, J.L. Hydrothermal Transport of Heavy Metals by Seawater: The Role of Seawater/Basalt Ratio. Earth Planet. Sci. Lett. 1977, 34, 71–77. [Google Scholar] [CrossRef]
- Reed, M.H.; Palandri, J. Hydrogen Produced by Reduction of H2O in Rock Reaction: Peridotite vs. Basalt. In AIP Conference Proceedings; AIP: Sendai, Japan, 2008; Volume 987, pp. 100–104. [Google Scholar]
- Ménez, B. Abiotic Hydrogen and Methane: Fuels for Life. Elements 2020, 16, 39–46. [Google Scholar] [CrossRef]
- Prieur, D.; Erauso, G.; Jeanthon, C. Hyperthermophilic Life at Deep-Sea Hydrothermal Vents. Planet. Space Sci. 1995, 43, 115–122. [Google Scholar] [CrossRef]
- Nonn, C.; Leroy, S.; Khanbari, K.; Ahmed, A. Tectono-Sedimentary Evolution of the Eastern Gulf of Aden Conjugate Passive Margins: Narrowness and Asymmetry in Oblique Rifting Context. Tectonophysics 2017, 721, 322–348. [Google Scholar] [CrossRef]
- Arnórsson, S.; Gunnlaugsson, E. New Gas Geothermometers for Geothermal Exploration—Calibration and Application. Geochim. Cosmochim. Acta 1985, 49, 1307–1325. [Google Scholar] [CrossRef]
- Stefánsson, A. Gas Chemistry of Icelandic Thermal Fluids. J. Volcanol. Geotherm. Res. 2017, 346, 81–94. [Google Scholar] [CrossRef]
- Arnórsson, S. Gas Pressures in Geothermal Systems. Chem. Geol. 1985, 49, 319–328. [Google Scholar] [CrossRef]
- D’Amore, F.; Panichi, C. Evaluation of Deep Temperatures of Hydrothermal Systems by a New Gas Geothermometer. Geochim. Cosmochim. Acta 1980, 44, 549–556. [Google Scholar] [CrossRef]
- D’Amore, F.; Truesdell, A.H. Calculation of Geothermal Reservoir Temperatures and Steam Fractions from Gas Compositions. Trans. Geotherm. 1985, 9, 305–310. [Google Scholar]
- Giggenbach, W.F. Geothermal Gas Equilibria. Geochim. Cosmochim. Acta 1980, 44, 2021–2032. [Google Scholar] [CrossRef]
- Barberi, F.; Ferrara, G.; Santacroce, R.; Treuil, M.; Varet, J. A Transitional Basalt-Pantellerite Sequence of Fractional Crystallization, the Boina Centre (Afar Rift, Ethiopia). J. Petrol. 1975, 16, 22–56. [Google Scholar] [CrossRef]
- Tazieff, H.; Varet, J.; Barberi, F.; Giglia, G. Tectonic Significance of the Afar (or Danakil) Depression. Nature 1972, 235, 144–147. [Google Scholar] [CrossRef]
- Craig, T.J.; Jackson, J.A.; Priestley, K.; McKenzie, D. Earthquake Distribution Patterns in Africa: Their Relationship to Variations in Lithospheric and Geological Structure, and Their Rheological Implications: Earthquake Distribution Patterns in Africa. Geophys. J. Int. 2011, 185, 403–434. [Google Scholar] [CrossRef]
- Chorowicz, J. The East African Rift System. J. Afr. Earth Sci. 2005, 43, 379–410. [Google Scholar] [CrossRef]
- Chorowicz, J.; Fournier, J.L.; Vidal, G. A Model for Rift Development in Eastern Africa. Geol. J. 1987, 22, 495–513. [Google Scholar] [CrossRef]
- Bosworth, W.; Huchon, P.; McClay, K. The Red Sea and Gulf of Aden Basins. J. Afr. Earth Sci. 2005, 43, 334–378. [Google Scholar] [CrossRef]
- Purcell, P.G. Re-Imagining and Re-Imaging the Development of the East African Rift. Pet. Geosci. 2018, 24, 21–40. [Google Scholar] [CrossRef]
- Mohr, P. Ethiopian Flood Basalt Province. Nature 1983, 303, 577–584. [Google Scholar] [CrossRef]
- Nonn, C.; Leroy, S.; Lescanne, M.; Castilla, R. Central Gulf of Aden Conjugate Margins (Yemen-Somalia): Tectono-Sedimentary and Magmatism Evolution in Hybrid-Type Margins. Mar. Pet. Geol. 2019, 105, 100–123. [Google Scholar] [CrossRef]
- Moretti, I.; Colletta, B. Spatial and Temporal Evolution of the Suez Rift Subsidence. J. Geodyn. 1987, 7, 151–168. [Google Scholar] [CrossRef]
- Barberi, F.; Borsi, S.; Ferrara, G.; Marinelli, G.; Santacroce, R.; Tazieff, H.; Varet, J. Evolution of the Danakil Depression (Afar, Ethiopia) in Light of Radiometric Age Determinations. J. Geol. 1972, 80, 720–729. [Google Scholar] [CrossRef]
- Barberi, F.; Varet, J. Volcanism of Afar: Small-Scale Plate Tectonics Implications. GSA Bull. 1977, 88, 1251–1266. [Google Scholar] [CrossRef]
- Barberi, F.; Varet, J. The Erta Ale Volcanic Range (Danakil Depression, Northern Afar, Ethiopia). Bull. Volcanol. 1970, 34, 848–917. [Google Scholar] [CrossRef]
- Stieltjes, L.; Joron, J.L.; Treuil, M.; Varet, J. Le rift d’Asal, segment de dorsale emerge; discussion petrologique et geochimique. Bull. Société Géologique Fr. 1976, S7-XVIII, 851–862. [Google Scholar] [CrossRef]
- Stab, M.; Bellahsen, N.; Pik, R.; Quidelleur, X.; Ayalew, D.; Leroy, S. Modes of Rifting in Magma-Rich Settings: Tectono-Magmatic Evolution of Central Afar: Modes of Rifting in Magma-Rich Settings. Tectonics 2016, 35, 2–38. [Google Scholar] [CrossRef] [Green Version]
- Varet, J. Carte Géologique de l’Afar Central et Méridional (Éthiopie et T.F.A.I.) =: Geological Map of Central and Southern Afar (Ethiopia and F.T.A.I.); CNRS: Paris, France, 1978.
- Doubre, C.; Déprez, A.; Masson, F.; Socquet, A.; Lewi, E.; Grandin, R.; Nercessian, A.; Ulrich, P.; De Chabalier, J.-B.; Saad, I.; et al. Current Deformation in Central Afar and Triple Junction Kinematics Deduced from GPS and InSAR Measurements. Geophys. J. Int. 2017, 208, 936–953. [Google Scholar] [CrossRef]
- Saria, E.; Calais, E.; Altamimi, Z.; Willis, P.; Farah, H. A New Velocity Field for Africa from Combined GPS and DORIS Space Geodetic Solutions: Contribution to the Definition of the African Reference Frame (AFREF): An African Geodetic Reference Frame. J. Geophys. Res. Solid Earth 2013, 118, 1677–1697. [Google Scholar] [CrossRef]
- Stamps, D.S.; Calais, E.; Saria, E.; Hartnady, C.; Nocquet, J.-M.; Ebinger, C.J.; Fernandes, R.M. A Kinematic Model for the East African Rift. Geophys. Res. Lett. 2008, 35, L05304. [Google Scholar] [CrossRef] [Green Version]
- Agostini, A.; Bonini, M.; Corti, G.; Sani, F.; Mazzarini, F. Fault Architecture in the Main Ethiopian Rift and Comparison with Experimental Models: Implications for Rift Evolution and Nubia–Somalia Kinematics. Earth Planet. Sci. Lett. 2011, 301, 479–492. [Google Scholar] [CrossRef]
- Mohr, P.A. The Afar Triple Junction and Sea-Floor Spreading. J. Geophys. Res. 1970, 75, 7340–7352. [Google Scholar] [CrossRef]
- Le Dain, A.Y.; Robineau, B.; Tapponier, P. Les Effets Tectoniques de l’évenement Sismique et Volcanique de Novembre 1978 Dans Le Rift d’Asal-Ghoubbet. Palaeogeogr. Palaeoclimatol. Palaeoecol. 1978, 24, 279–325. [Google Scholar] [CrossRef]
- Tapponier, P.; Varet, J. La Zone de Mak’arrasou En Afar: Un Équivalent Émergé Des “Failles Transformantes” Océaniques. Comptes Rendus Acad. Sci. 1974, 278, 317–329. [Google Scholar]
- Doubre, C.; Manighetti, I.; Dorbath, C.; Dorbath, L.; Jacques, E.; Delmond, J.C. Crustal Structure and Magmato-Tectonic Processes in an Active Rift (Asal-Ghoubbet, Afar, East Africa): 1. Insights from a 5-Month Seismological Experiment. J. Geophys. Res. 2007, 112, B05405. [Google Scholar] [CrossRef] [Green Version]
- Doubre, C.; Peltzer, G. Fluid-Controlled Faulting Process in the Asal Rift, Djibouti, from 8 Yr of Radar Interferometry Observations. Geology 2007, 35, 69. [Google Scholar] [CrossRef]
- Varet, J. Asal-Fialé Geothermal Field (Djibouti Republic): A New Interpretation for a Geothermal Reservoir in an Actively Spreading Rift Segment. In Proceedings of the 5th African Rift geothermal Conference, Arusha, Tanzania, 29–31 October 2014; p. 9. [Google Scholar]
- Bosch, B.; Deschamps, J.; Leleu, M.; Lopoukhine, M.; Marce, A.; Vilbert, C. The Geothermal Zone of Lake Assal (F.T.A.I.), Geochemical and Experimental Studies. Geothermics 1977, 5, 165–175. [Google Scholar] [CrossRef]
- Fouillac, A.M.; Fouillac, C.; Cesbron, F.; Pillard, F.; Legendre, O. Water-Rock Interaction between Basalt and High-Salinity Fluids in the Asal Rift, Republic of Djibouti. Chem. Geol. 1989, 76, 271–289. [Google Scholar] [CrossRef]
- Mlynarski, M.; Zlotnicki, J. Fluid Circulation in the Active Emerged Asal Rift (East Africa, Djibouti) Inferred from Self-Potential and Telluric–Telluric Prospecting. Tectonophysics 2001, 339, 455–472. [Google Scholar] [CrossRef]
- Sanjuan, B.; Michard, G.; Michard, A. Origine des substances dissoutes dans les eaux des sources thermales et des forages de la région Asal-Ghoubbet (République de Djibouti). J. Volcanol. Geotherm. Res. 1990, 43, 333–352. [Google Scholar] [CrossRef]
- Delibrias, G.; Marinelli, G.; Stieltjes, L. Spreading Rate of the Asal Rift: A Geological Approach; Schweizerbart: Stuttgart, Germany, 1975; Volume 1, ISBN 3-510-65069-7. [Google Scholar]
- Vigny, C.; de Chabalier, J.-B.; Ruegg, J.-C.; Huchon, P.; Feigl, K.L.; Cattin, R.; Asfaw, L.; Kanbari, K. Twenty-Five Years of Geodetic Measurements along the Tadjoura-Asal Rift System, Djibouti, East Africa. J. Geophys. Res. 2007, 112, B06410. [Google Scholar] [CrossRef] [Green Version]
- Fournier, M.; Gasse, F.; Lépine, J.-C.; ORSTOM (France). Institut Supérieur d’études et de Recherches Scientifiques et Techniques (Djibouti) Carte Géologique de la République de Djibouti. [NC-38-XIX-4], [NC-38-XIX-4], 1984. Available online: https://www.sudoc.fr/124662544 (accessed on 28 December 2021).
- Boudouma, O. Etude Pétrologique Des Laves Basaltiques Du Rift d’Asal (DJIBOUTI). Ph.D. Thesis, Université Pierre et Marie Curie (Paris VI), Paris, France, 1997. [Google Scholar]
- Demange, J.; Stieltjes, L.; Varet, J. L’Eruption d’Asal de novembre 1978. Bull. Société Géologique Fr. 1980, S7-XXII, 837–843. [Google Scholar] [CrossRef]
- Houssein, D.E.; Axelsson, G. Geothermal Resources in the Asal Region, Republic of Djibouti: An Update with Emphasis on Reservoir Engineering Studies. Geothermics 2010, 39, 220–227. [Google Scholar] [CrossRef]
- Zan, L.; Gianelli, G.; Troisi, C.; Haga, A.O. Geothermal exploration in the republic of djibouti: Thermal and geological data of the hanlt and asal areas. Geothermics 1990, 19, 561–582. [Google Scholar] [CrossRef]
- D’Amore, F.; Giusti, D.; Abdallah, A. Geochemistry of the High-Salinity Geothermal Field of Asal, Republic of Djibouti, Africa. Geothermics 1998, 27, 197–210. [Google Scholar] [CrossRef]
- Bottinga, Y. Calculated Fractionation Factors for Carbon and Hydrogen Isotope Exchange in the System Calcite-Carbon Dioxide-Graphite-Methane-Hydrogen-Water Vapor. Geochim. Cosmochim. Acta 1969, 33, 49–64. [Google Scholar] [CrossRef]
- Horibe, Y.; Craig, H. Fractionation in the System Methane-Hydrogen-Water. Geochim. Cosmochim. Acta 1995, 59, 5209–5217. [Google Scholar] [CrossRef]
- Darling, W.G. The Geochemistry of Fluid Processes in the Eastern Branch of the East African Rift System; Open University: Milton Keynes, UK, 1996. [Google Scholar] [CrossRef]
- Allard, P.; Tazieff, H.; Dajlevic, D. Observations of Seafloor Spreading in Afar during the November 1978 Fissure Eruption. Nature 1979, 279, 30–33. [Google Scholar] [CrossRef]
- Dekov, V.M.; Egueh, N.M.; Kamenov, G.D.; Bayon, G.; Lalonde, S.V.; Schmidt, M.; Liebetrau, V.; Munnik, F.; Fouquet, Y.; Tanimizu, M.; et al. Hydrothermal Carbonate Chimneys from a Continental Rift (Afar Rift): Mineralogy, Geochemistry, and Mode of Formation. Chem. Geol. 2014, 387, 87–100. [Google Scholar] [CrossRef] [Green Version]
- Haggerty, S.E.; Baker, I. The Alteration of Olivine in Basaltic and Associated Lavas. Contrib. Mineral. Petrol. 1967, 16, 233–257. [Google Scholar] [CrossRef]
- Meunier, A. Clays; Springer: Berlin/Heidelberg, Germany; New York, NY, USA, 2005; ISBN 978-3-540-21667-4. [Google Scholar]
- Miglierini, M.; Petridis, D. (Eds.) Mössbauer Spectroscopy in Materials Science; Springer: Dordrecht, The Netherlands, 1999; ISBN 978-0-7923-5641-7. [Google Scholar]
- Stevens, J.G.; Khasanov, A.M.; Miller, J.W.; Pollak, H.; Li, Z. Mössbauer Mineral Handbook; Medc: Dalian, China, 2005; p. 636. [Google Scholar]
- Sassi, M.; Rosso, K.M. Roles of Hydration and Magnetism on the Structure of Ferrihydrite from First Principles. ACS Earth Space Chem. 2019, 3, 70–78. [Google Scholar] [CrossRef]
- Alt, J.C.; Honnorez, J. Alteration of the Upper Oceanic Crust, DSDP Site 417: Mineralogy and Chemistry. Contrib. Mineral. Petrol. 1984, 87, 149–169. [Google Scholar] [CrossRef]
- Deer, W.A.; Howie, R.A.; Zussman, J. An Introduction to the Rock-Forming Minerals, 3rd ed.; The Minerological Society: London, UK, 2013; ISBN 978-0-903056-33-5. [Google Scholar]
- Haas, J.L. The Effect of Salinity on the Maximum Thermal Gradient of a Hydrothermal System at Hydrostatic Pressure. Econ. Geol. 1971, 66, 940–946. [Google Scholar] [CrossRef]
- Oskarsson, N. Monitoring of Fumarole Discharge during the 1975–1982 Rifting in Krafla Volcanic Center, North Iceland. J. Volcanol. Geotherm. Res. 1984, 22, 97–121. [Google Scholar] [CrossRef]
- Correia, H.; Fouillac, C.; Gerard, A.; Varet, J. The Asal Geothermal Field (Republic of Djibouti). 1985, Volume 8, pp. 513–519. Available online: publications.mygeoenergynow.org/grc/1001487.pdf (accessed on 28 December 2021).
- Etiope, G. Abiotic Methane in Continental Serpentinization Sites: An Overview. Procedia Earth Planet. Sci. 2017, 17, 9–12. [Google Scholar] [CrossRef]
- Etiope, G.; Sherwood Lollar, B. Abiotic methane on earth: Abiotic methane on earth. Rev. Geophys. 2013, 51, 276–299. [Google Scholar] [CrossRef]
- Helgeson, H.C. Thermodynamics of Hydrothermal Systems at Elevated Temperatures and Pressures. Am. J. Sci. 1969, 267, 729–804. [Google Scholar] [CrossRef]
- Lemaitre, O.; Brousse, R.; Goñi, J.C.; Remond, G. Sur l’importance de l’apport de fer dans la transformation de l’olivine en iddingsite. Bulmi 1966, 89, 477–483. [Google Scholar] [CrossRef]
- Edwards, A.B. The formation of iddingsite. Am. Mineral.: J. Earth Planet. Mater. 1938, 23, 277–281. [Google Scholar]
- Ross, C.S.; Shannon, E.V. The Origin, Occurrence, Composition, and Physical Properties of the Mineral Iddingsite. Proc. U. S. Natl. Mus. 1925, 67, 1–19. [Google Scholar] [CrossRef]
- Wang, X.; Zhu, M.; Lan, S.; Ginder-Vogel, M.; Liu, F.; Feng, X. Formation and Secondary Mineralization of Ferrihydrite in the Presence of Silicate and Mn(II). Chem. Geol. 2015, 415, 37–46. [Google Scholar] [CrossRef]
- Ármannsson, H.; Gíslason, G.; Hauksson, T. Magmatic Gases in Well Fluids Aid the Mapping of the Flow Pattern in a Geothermal System. Geochim. Cosmochim. Acta 1982, 46, 167–177. [Google Scholar] [CrossRef]
- Arrouvel, C.; Prinzhofer, A. Genesis of Natural Hydrogen: New Insights from Thermodynamic Simulations. Int. J. Hydrogen Energy 2021, 46, 18780–18794. [Google Scholar] [CrossRef]
- Klein, F.; Tarnas, J.D.; Bach, W. Abiotic Sources of Molecular Hydrogen on Earth. Elements 2020, 16, 19–24. [Google Scholar] [CrossRef]
- Bass, M.N. Variable Abyssal Basalt Populations and Their Relation to Sea-Floor Spreading Rates. Earth Planet. Sci. Lett. 1971, 11, 18–22. [Google Scholar] [CrossRef]
- Ármannsson, H.; Benjamínsson, J.; Jeffrey, A.W.A. Gas Changes in the Krafla Geothermal System, Iceland. Chem. Geol. 1989, 76, 175–196. [Google Scholar] [CrossRef]
- Sano, Y.; Urabe, A.; Wakita, H.; Chiba, H.; Sakai, H. Chemical and Isotopic Compositions of Gases in Geothermal Fluids in Iceland. Geochem. J. 1985, 19, 14. [Google Scholar] [CrossRef] [Green Version]
- Scott, S.; Gunnarsson, I.; Arnórsson, S.; Stefánsson, A. Gas Chemistry, Boiling and Phase Segregation in a Geothermal System, Hellisheidi, Iceland. Geochim. Cosmochim. Acta 2014, 124, 170–189. [Google Scholar] [CrossRef]
- Leila, M.; Levy, D.; Battani, A.; Piccardi, L.; Segvic, B.; Badurina, L.; Pasquet, G.; Combaudon, V.; Moretti, I. Origin of Continuous Hydrogen Flux in Gas Manifestations at the Larderello Geothermal Field, Central Italy. Chem. Geol. 2021, 585, 120564. [Google Scholar] [CrossRef]


| A3 (GW) (1) | A3 (GW) (2) | A6 (GW) (1) | A5 (F) (2) | Ardoukoba 1978 (F) (3) | N Ghoubbet (F) (2) | |
|---|---|---|---|---|---|---|
| CO2 (mol%) | 97.9 | 99.1 | 97.5 | 9.1 | 16.925 | 16.5 |
| H2S (mol%) | 0.23 | 0.23 | 0.18 | 0.003 | 0.0076 | 0.061 |
| H2 (mol%) | 0.22 | 0.25 | 0.16 | 0.037 | 0.145 | 0.1 |
| SO2 (mol%) | - | - | - | - | 82.525 | - |
| CH4 (mol%) | 0.09 | 0.16 | 0.09 | 0.0009 | - | 0.023 |
| N2 (mol%) | 1.6 | 0.29 | 2 | 70.8 | - | 65 |
| O2 + Ar (mol%) | - | 0.04 | - | 20.1 | - | 18.4 |
| He (mol%) | 0.0014 | - | 0.0018 | - | - | - |
| CO (mol%) | - | - | 0.00012 | - | 0.365 | - |
| R/RA | 12.3 | - | - | - | - | 11 |
| δ13C-CO2 PDB ‰ | −3.11 | −3 | −2.62 | −5.7 | −5.3 | −3.1 |
| δ13C-CH4 PDB ‰ | −17 | −25.9 | −27 | −32.1 | - | −17 |
| δ2H-H2 SMOW ‰ | - | −436 | - | - | - | |
| δ2H-CH4 SMOW ‰ | - | −169 | - | - | - | |
| δ34S-SO2 CD ‰ | - | - | - | −2.775 | - |
| Site | pH | Na | K | Ca | Mg | HCO3 | Cl | SO4 | SiO2 | Li | B | F | NH3 |
|---|---|---|---|---|---|---|---|---|---|---|---|---|---|
| Deep Reservoir Water | |||||||||||||
| A3 (4) | 5.2 | 24,900 | 4830 | 15,900 | 24.6 | - | 70,100 | 19.1 | - | 7.7 | 2.3 | - | |
| A3 (2) | - | 29,200 | 5030 | 17,035 | 22.9 | 335 | 78,425 | 11 | 15.3 | 10.1 | 9.8 | - | |
| A1 (4) | - | 28,520 | 4888 | 16,389 | 24.3 | - | 78,100 | 21.1 | 13.2 | 6.5 | - | - | |
| A6 (1) | 5.0 | 25,822 | 4052 | 13,375 | 21.7 | - | 66,776 | 7.9 | 510 | - | 8.7 | 2.7 | 5.8 |
| A4 (4) | 5.1 | 32,200 | 5318 | 17,511 | 2.4 | - | 85,200 | 26.9 | - | 15.2 | 7 | - | - |
| Lake Asal (1) | 7.1 | 101,200 | 5161 | 2677 | 12500 | 184 | 199,155 | 4320 | - | 6 | - | - | - |
| Site | Cat. | n | CH4 % | CO2 % | O2 % | H2 ppm | CO ppm | H2S ppm | Bal. % | |
|---|---|---|---|---|---|---|---|---|---|---|
| Asal–Ghoubbet | DJI-1 | S/W | 1 | 0.0 (0) | 0.1 (0.0) | 19.4 (0.0) | 68 (0) | 2 (0) | 1 (0) | 80.5 (0) |
| DJI-2 | S/W | 1 | 0.0 (0.0) | 0.0 (0.0) | 19.0 (0.0) | 20 (0) | 0 (0) | 1 (0) | 81.0 (0) | |
| DJI-3 | F | 10 | 0.0 (0.0) | 2.6 (1.5) | 19.3 (0.4) | 77 (60) | 2 (0) | 1 (0) | 78.2 (1.2) | |
| DJI-3 | F | 5 | 0.0 (0.0) | 2.5 (1.4) | 18.7 (0.6) | 107 (77) | 2 (0) | 7 (1) | 78.8 (1.2) | |
| DJI-4 | F | 14 | 0.0 (0.0) | 4.4 (0.8) | 19.3 (0.3) | 540 (125) | 2 (2) | 1 (1) | 76.3 (0.7) | |
| DJI-4 | F | 13 | 0.0 (0.0) | 3.4 (0.7) | 18.6 (0.3) | 829 (134) | 4 (3) | 36 (8) | 77.9 (0.6) | |
| DJI-4 | F | 22 | 0.0 (0.0) | 1.9 (0.4) | 19.7 (0.7) | 537 (96) | 3 (2) | 29 (6) | 78.4 (0.5) | |
| DJI-5 | S | 4 | 0.0 (0.0) | 0.6 (0.3) | 19.9 (0.1) | 2 (2) | 0 (0) | 1 (0) | 79.5 (0.3) | |
| DJI-6 | F | 2 | 0.0 (0.0) | 0.1 (0.1) | 20.0 (0.0) | 0 (0) | 0 (0) | 1 (1) | 80.0 (0.1) | |
| DJI-8 | S | 3 | 0.0 (0.0) | 0.2 (0.2) | 19.7 (0.2) | 15 (9) | 0 (0) | 1 (0) | 80.1 (0.2) | |
| DJI-9 | F | 3 | 0.0 (0.0) | 0.6 (0.4) | 19.9 (0.1) | 4 (0) | 0 (0) | 1 (0) | 79.7 (0.3) | |
| DJI-10 | S | 3 | 0.0 (0.0) | 0.4 (0.3) | 19.9 (0.1) | 2 (1) | 0 (0) | 1 (0) | 79.6 (0.2) | |
| DJI-15 | S | 4 | 0.0 (0.0) | 0.0 (0.0) | 20.0 (0.0) | 2 (1) | 0 (0) | 1 (0) | 80.0 (0.0) | |
| Asal 3 | S/W | 4 | 0.0 (0.0) | 0.1 (0.1) | 20.1 (0.4) | 35 (22) | 6 (5) | 2 (2) | 79.9 (0.4) | |
| Asal 1 | S/W | 6 | 0.0 (0.0) | 0.2 (0.2) | 20.0 (0.6) | 138 (85) | 8 (4) | 1 (1) | 79.9 (0.5) | |
| Asal 6 | S/W | 3 | 0.0 (0.0) | 0.2 (0.1) | 19.7 (0.1) | 83 (48) | 4 (1) | 1 (0) | 80.1 (0.1) | |
| Asal 5 | S/W | 2 | 0.0 (0.0) | 0.1 (0.0) | 20.7 (0.1) | 0 (0) | 0 (0) | 0 (0) | 79.0 (0.1) | |
| DJI-13 | S | 1 | 0.0 (0.0) | 0.1 (0.0) | 19.9 (0.0) | 1 (0) | 0 (0) | 1 (0) | 80.0 (0.0) | |
| DJI-14 | S | 1 | 0.0 (0.0) | 0.1 (0.0) | 19.8 (0.0) | 1 (0) | 0 (0) | 1 (0) | 80.1 (0.0) | |
| DJI-19 | F | 1 | 0.0 (0.0) | 0.1 (0.0) | 19.6 (0.0) | 52 (0) | 0 (0) | 1 (0) | 80.3 (0.0) | |
| DJI-21 | S | 5 | 0.0 (0.0) | 0.0 (0.0) | 19.2 (0.4) | 43 (52) | 5 (1) | 1 (0) | 80.7 (0.4) | |
| DJI-22 | S | 3 | 0.0 (0.0) | 0.2 (0.2) | 19.2 (0.5) | 5 (2) | 3 (0) | 1 (0) | 80.6 (0.3) |
| Site | Cat. | Date | n | CH4 C % | CO2 C % | H2 C % | CO C % | H2S C % | Bal. C % |
|---|---|---|---|---|---|---|---|---|---|
| DJI-4 | F | 21 November 2019 | 14 | 0.0 (0) | 56.0 (9.0) | 0.7 (0.07) | 0.009 (0.002) | 0.002 (0.001) | 43.3 (9.1) |
| DJI-4 | F | 12 August 2020 | 13 | 0.0 (0) | 30.6 (5.4) | 0.8 (0.1) | 0.002 (0.005) | 0.03 (0.01) | 68.6 (5.5) |
| DJI-4 | F | 13 August 2020 | 22 | 0.0 (0) | 38.2 (15.7) | 1.3 (0.9) | 0.02 (0.02) | 0.07 (0.05) | 60.4 (16.7) |
| Site | Cat. | He % | CH4 % | CO2 % | H2 % | O2 % | N2 % | Unknown % |
|---|---|---|---|---|---|---|---|---|
| DJI-4 | F | - | 0.002 | 5.2 | 0.06 | 20.8 | 75 | 0.005 |
| DJI-4 c | F | - | 0.04 | 84.9 | 0.9 | - | 14.1 | 0.08 |
| Sample | A1 | δ (mm/s) | Δ (mm/s) | Bhf (T) | Γ (mm/s) | Area (%) | Attribution | Minerals |
|---|---|---|---|---|---|---|---|---|
| Fresh Basalt (DJI-4-13) | DQ1 | 0.37 | 0.71 | - | 0.30 | 10 | Fe3+ oct. | Olivine/Iddingsite |
| DQ2 | 0.94 | 0.84 | - | 0.60 | 10 | Fe2+ tet. | Ilmenite | |
| DQ3 | 1.14 | 1.99 | - | 0.44 | 35 | Fe2+ oct. | Clinopyroxene | |
| DQ4 | 1.14 | 2.89 | - | 0.32 | 21 | Fe2+ oct. | Olivine | |
| S1 | 0.36 | -0.23 | 50.4 | 0.60 | 10 | Fe3+ | Maghemite/Hematite | |
| S2 | 0.29 | -0.09 | 49.3 | 0.70 | 7 | Fe3+ tet. | Magnetite | |
| S3 | 0.61 | -0.02 | 45.5 | 0.70 | 7 | Fe2+/3+ oct. | Magnetite | |
| Altered Basalt (DJI-4-1) | DQ1 | 0.36 | 0.74 | - | 0.48 | 48 | Fe3+ oct. | Ferrihydrite/Smectite |
| DQ2 | 0.95 | 1.04 | - | 0.53 | 6 | Fe2+ tet. | Ilmenite | |
| DQ3 | 1.14 | 2.76 | - | 0.50 | 2 | Fe2+ oct. | Olivine/Smectite | |
| S1 | 0.36 | -0.14 | 50.7 | 0.46 | 27 | Fe3+ | Maghemite/Hematite | |
| S2 | 0.27 | -0.03 | 48.5 | 0.53 | 11 | Fe3+ tet. | Magnetite | |
| S3 | 0.61 | -0.02 | 44.9 | 0.54 | 7 | Fe2+/3+ oct. | Magnetite | |
| Aphyric Basalt (DJI-4-12) | DQ1 | 0.39 | 0.75 | - | 0.36 | 10 | Fe3+ oct. | Olivine/Ferrihydrite |
| DQ2 | 0.99 | 0.85 | - | 0.50 | 11 | Fe2+ tet. | Ilmenite | |
| DQ3 | 1.16 | 1.98 | - | 0.43 | 29 | Fe2+ oct. | Clinopyroxene | |
| DQ4 | 1.17 | 2.90 | - | 0.36 | 35 | Fe2+ oct. | Olivine | |
| S1 | 0.36 | -0.22 | 51.2 | 0.30 | 2 | Fe3+ | Hematite | |
| S2 | 0.27 | -0.01 | 49.0 | 0.66 | 8 | Fe3+ tet. | Magnetite | |
| S3 | 0.68 | -0.13 | 45.8 | 0.66 | 6 | Fe2+/3+ oct. | Magnetite |
Publisher’s Note: MDPI stays neutral with regard to jurisdictional claims in published maps and institutional affiliations. |
© 2021 by the authors. Licensee MDPI, Basel, Switzerland. This article is an open access article distributed under the terms and conditions of the Creative Commons Attribution (CC BY) license (https://creativecommons.org/licenses/by/4.0/).
Share and Cite
Pasquet, G.; Houssein Hassan, R.; Sissmann, O.; Varet, J.; Moretti, I. An Attempt to Study Natural H2 Resources across an Oceanic Ridge Penetrating a Continent: The Asal–Ghoubbet Rift (Republic of Djibouti). Geosciences 2022, 12, 16. https://doi.org/10.3390/geosciences12010016
Pasquet G, Houssein Hassan R, Sissmann O, Varet J, Moretti I. An Attempt to Study Natural H2 Resources across an Oceanic Ridge Penetrating a Continent: The Asal–Ghoubbet Rift (Republic of Djibouti). Geosciences. 2022; 12(1):16. https://doi.org/10.3390/geosciences12010016
Chicago/Turabian StylePasquet, Gabriel, Rokiya Houssein Hassan, Olivier Sissmann, Jacques Varet, and Isabelle Moretti. 2022. "An Attempt to Study Natural H2 Resources across an Oceanic Ridge Penetrating a Continent: The Asal–Ghoubbet Rift (Republic of Djibouti)" Geosciences 12, no. 1: 16. https://doi.org/10.3390/geosciences12010016
APA StylePasquet, G., Houssein Hassan, R., Sissmann, O., Varet, J., & Moretti, I. (2022). An Attempt to Study Natural H2 Resources across an Oceanic Ridge Penetrating a Continent: The Asal–Ghoubbet Rift (Republic of Djibouti). Geosciences, 12(1), 16. https://doi.org/10.3390/geosciences12010016