Abstract
The geoPebble system is a network of wirelessly interconnected seismic and GPS sensor nodes with geophysical sensing capabilities for the study of ice sheets in Antarctica and Greenland, as well as mountain glaciers. We describe our design methodology, which has enabled us to develop these state-of-the art units using commercial-off-the-shelf hardware combined with custom-designed hardware and software. Each geoPebble node is a self-contained, wirelessly connected sensor for collecting seismic activity and position information. Each node is built around a three-component seismic recorder, which includes an amplifier, filter, and 24-bit analog-to-digital converter that can sample incoming seismic signals up to 10 kHz. The timing for each node is available from GPS measurements and a local precision oscillator that is conditioned by the GPS timing pulses. In addition, we record the carrier-phase measurement of the L1 GPS signal in order to determine location at sub-decimeter accuracy (relative to other geoPebble nodes within a radius of a few kilometers). Each geoPebble includes 32 GB of solid-state storage, wireless communications capability to a central supervisory unit, and auxiliary measurements capability (including tilt from accelerometers, absolute orientation from magnetometers, and temperature). The geoPebble system has been successfully validated in the field in Antarctica and Greenland.
1. Introduction
The ice sheets of Antarctica and Greenland contain nearly 33-million cubic kilometers of ice. If all this ice were to melt, global sea level would rise by nearly 70 m [1]. On millennial time scales, the West Antarctic Ice Sheet (WAIS) has the potential to raise sea level by approximately 3 m, with current estimates of sea-level-rise rates of 1 mm/year [2,3]. Measurements of gravity over the Greenland Ice Sheet from the GRACE satellite instrument suggest an increase in mass loss [4] in the presence of an increase in precipitation [5,6]. The large mass losses contribute to sea-level rise, which is expected to continue or increase in the future [7] if the current warming trend and the dynamic changes of the outlet glaciers continue. In addition, the variability of West Antarctic ice flow and Greenland ice flow on much shorter time scales is well documented [8,9,10,11].
The large uncertainties in sea-level-rise estimates over the next century are cause for concern for policymakers and the public. Projections of sea-level rise for the next century implicate the large polar ice sheets (in particular, marginal melt of the Greenland Ice Sheet and of the Antarctic Peninsula and the Amundsen Sea sector of West Antarctica) as the major contributors, but with significant uncertainty on the magnitude and timing of those contributions. Obtaining better constraints on those uncertainties requires better ice-sheet models and better inputs to those models. Some of the critical variables that are poorly known but are essential for improving flow models and predictions of sea-level change are: ice-shelf fracture processes; basal roughness; subglacial sedimentary and hydrologic conditions; and the 4D (four-dimensional, i.e., time and space) variability of the ice-sheet flow field. These parameters can be determined by (1) seismic reflection and refraction imaging; (2) monitoring of naturally occurring seismicity; and (3) by dense arrays of continuously operating GPS receivers. These are the types of measurements that the geoPebble system, a network of wirelessly interconnected geophysical sensors, can carry out to enable cutting-edge glaciology research.
The geoPebble sensor mesh provides an entirely new way of imaging ice sheets that is not possible with current instruments. These interlocking position and seismic data sets will provide new perspectives on conditions and processes within the ice sheet that have the potential to bring about a paradigm shift in glaciology. The geoPebble sensor web not only extends the operation of existing instruments from two-dimensional (2D) to three-dimensional (3D) and from low resolution to high resolution, but, more importantly, all the geophysical measurements can be conducted synchronously. Indeed, geoPebble nodes can be deployed in any number of geometrical patterns depending on iceflow, strain fields, etc., as these patterns are not limited by cabling.
The geoPebble system could be combined with other innovative glaciological instruments such as GNSS interferometry. Those instruments depend on measuring multipath off the surface and interpreting the phase difference between the two. Our instruments are at the surface, so combining phases between our instruments and instruments with raised antennas would be possible for better analysis of surface properties. In addition, radar systems that measure strain changes in the subsurface (e.g., ApRES [12]) could be combined with geoPebble measurements if those strain changes lead to seismic radiation, such as during a slip event or fracture.
The new paradigm of which geoPebble is a contributor is of interest beyond glaciology, and covers fields such as earthquake early warning, landslide monitoring, and mineral resources surveying. Makama et al. [13] present an excellent recent survey of wireless geophone networks for seismic data acquisition. The reader is referred to their paper for background information on this emerging field.
The footprint of a geoPebble mesh is of order kilometers. There are two main advantages to the mesh: these instruments can be easily deployed in a 2D pattern, leading to a 3D image of a patch of the ice sheet. In addition, the spatial resolution of the instruments can be appropriately set for the expected conditions by densifying the network as needed.
This paper presents an overview of the geoPebble design with reference to its utility in changing the data collection paradigm within seismic glaciology.
2. geoPebble Concept of Operations
When deployed in the field, the geoPebble nodes form a wireless sensor mesh-network covering up to a 10-km radius from the base station, which is the central Supervisory and Quality Control (SQC) site. Figure 1 shows the concept of operations for a sample distribution of geoPebble nodes on the ice surface. The overall geoPebble system has five main components: (1) base station, which is the control center; (2) seismic source, which generates seismic energy; (3) geoPebble nodes, which record seismic data; (4) access points, which extend the range of the base station to control geoPebbles that are located far away; and (5) GPS signals that are needed to synchronize all geoPebbles. A detailed description of these five main components is provided in Section 4.
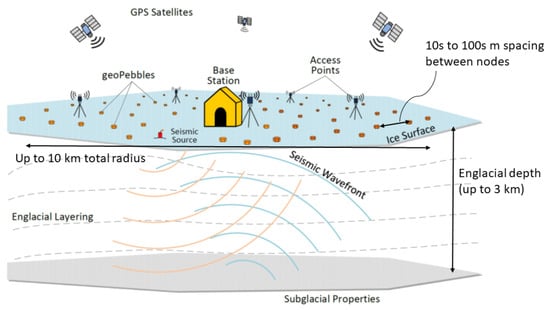
Figure 1.
Virtual experiment with geoPebble nodes scattered on the surface of an ice sheet. Over 100 wireless geoPebble nodes can be distributed on the surface. Each node contains an L1 (survey quality) GPS device, which eliminates the need to survey node locations and a seismic data-logger for simultaneous seismic measurements. The entire geoPebble mesh can be reconfigured easily and quickly to conduct a variety of seismic experiments.
3. Science Enabled
Climate change poses a significant threat to coastal and inland communities, ocean and land biomes, Polar environments, and water resources with large uncertainties that arise from the response of the natural system to CO emissions. Warming air and oceans in the Arctic and Antarctic will lead to widespread ice loss, which will, in turn, lead to global sea-level rise. Changes in precipitation and melt in mountainous regions will lead to greater hazards from floods and landslides, as well as threats to agriculture and industry. However, there are great uncertainties in the rate of sea-level rise and the rate of mountain glacier shrinkage due to imperfectly modeled ice-sheet processes [14,15]. Thus, an improved understanding of glacier and ice-sheet dynamics is of critical importance for determining and mitigating the risks of a warming climate.
The Greenland Ice Sheet is the largest contributor to sea level rise [16], mainly from increases in surface melting and iceberg calving [10,17,18,19], both of which are expected to increase with continued warming. Iceberg calving is a poorly understood process, but likely initiates with fracture propagation at the surface and the base of the glacier. Monitoring this process through seismic detection and recording can lead to a better understanding of the mechanisms and to better models mass loss [20,21].
With respect to the concept of operations described in Section 2 above, the significant science questions in glaciology that can be addressed by the geoPebble system include:
3.1. 3D Geophysical Imaging of Ice Sheets and the Subsurface
An array of 150–200 geoPebble nodes can be transported easily and distributed over the surface of a glacier or ice sheet, i.e., over approximately a few square kilometers, depending on the required resolution. By initiating seismic sources, i.e., shooting, within/near the deployed mesh, it is possible to image a 3D volume of the ice sheet or glacier. Planar beam-forming can be performed on the reflected seismic returns, as the returns will be in the far field [22,23]. By virtue of the small size of each node, and the absence of interconnecting cables, the whole sensor mesh can be quickly repositioned and/or reconfigured after each shot.
3.2. 4D Imaging of the Ice Flow Field
The geoPebble mesh can be deployed over a larger area, covering an area with radius of about 10 km (with approximately 1-km spacing) and for a long time period (weeks or even months). In addition, the GPS L1 carrier-phase measurements can be recorded and post-processed to determine sub-centimeter relative position between the nodes. These data can be used to measure temporally-variable and spatially-variable flow-speed patterns. The single-frequency GPS receiver is appropriate for the scale of the deployment (i.e., all nodes view the same GPS satellites) and, as the geoPebbles are inexpensive compared to dual-frequency receivers, the network can be much denser.
3.3. Monitoring the Natural Seismicity of Ice Sheets
The flow of glaciers and ice sheets, as well as the drainage of surpa-glacial lakes and the calving of tidewater glaciers, are associated with natural seismicity [24,25,26,27,28]. Measuring these events (which generally occur in areas that are difficult to access) at high spatial and temporal resolution requires a dense network of stations that can record data at high sampling rates. The geoPebble nodes are capable of recording events that can have frequencies on the order of 102 Hz. Each geoPebble node is an integrated sensor that can measure three of the most important geophysical parameters needed to improve our knowledge of glacier and ice-sheet flow: a seismic image, a position image, and a seismicity image. Although these can each be measured with existing devices, they are done so more coarsely, without 3D information, and at great expense and logistical effort. Measuring these parameters concurrently, which is rarely done (even at coarse resolution), will result in a fundamentally new view of the ice sheet—the whole is greater than a sum of the parts.
4. geoPebble Sensor Network
The geoPebble system, developed at The Pennsylvania State University, builds on past experience and results from previous involvement of Penn State with the Center for Remote Sensing of Ice Sheets (CReSIS), a National Science Foundation–sponsored Science and Technology Center based at the University of Kansas. The geoPebble nodes have been designed utilizing the latest digital technology and open-source tools, which enables full control of the firmware. Having complete control over the circuit board layout and design and the firmware have afforded us the freedom during their design to incorporate additional features not anticipated in early versions of the geoPebble.
4.1. Seismic Source
In order to determine glacier thickness, subglacial rock (or water) properties, and englacial ice properties, we detect, store, and analyze the waveforms of seismic energy traveling through the ice. To best image a section of ice or bed, we use artificial sources—generally chemical explosives—initiated at a known time and known location. These “shots” are usually placed 10 s of meters below the surface of the ice in shotholes so that they detonate in relatively higher-density ice (the ice near the surface is recently fallen snow and is porous and friable). These shots then illuminate the ice and bed and reflections from within and at/beneath the bed are received and stored by the geoPebble nodes. As the locations of the geoPebble nodes are known (via GPS), the travel paths from source to receivers, as well as changes in seismic energy along the paths, can be used to estimate the geometry and properties of the glacier and its bed. These data are critical for accurate models of glacier flow and for projections of future changes in glacier mass.
4.2. Base Station and Access Points
The base station is the central Supervisory and Quality Control (SQC) site for the geoPebble network and should be located roughly in the center of the planned deployment, although this is not strictly necessary as the access points (APs) can be used to extend range. Indeed, one of the paradigm shifts that geoPebble provides is the ability to redeploy sensor nodes without the need to move and reconfigure cabling. The number of APs required for a given deployment of geoPebbles depends largely on two metrics: distance of farthest geoPebbles from the base station and total number of geoPebbles deployed. The APs collect data from individual geoPebble nodes and aggregate the data for a backhaul link to the base station using a higher bandwidth protocol. A small deployment might not require APs as each node could directly communicate with the base station.
The central SQC site allows the operator to monitor the performance of the overall system as well as each node. Data are to be streamed back via several modes. Lower-resolution quick-look data for each shot are returned to ensure that the shot was successfully recorded on the distributed nodes before relocating them. If desired, full-resolution data can be requested from individual, a subset, or all nodes. Finally, housekeeping data are returned to monitor the health and status of the nodes and network.
4.3. GPS Signals
Acquisition of GPS signals is critical for the proper functioning of the geoPebble nodes. Each node contains a GPS receiver, a u-blox LEA-6T Module with Precision Timing [29]. The GPS-disciplined oscillator (GPSDO) within each node employs the module’s 1-pulse-per-second output timing. The GPS receiver is also used for carrier-phase measurement of the L1 GPS signal, which enables post-processing of positions to better than 10 cm for shorter than 10-km baselines.
4.4. geoPebble Nodes
The geoPebble node has three important features: (1) precision GPS for centimeter-level positioning accuracy for measuring surface strain and velocity; (2) ability to work as either an active-source recorder (short record, high sample rate, triggered start time) or as passive seismic recorders (continuous record at a lower sampling rate); and (3) wireless connectivity for command and control, with local storage of full resolution data for deployment on, e.g., crevassed glaciers.
The geoPebble node hardware consists of a three-axis geophone, four channels of 24-bit digitizer, low-power microprocessor, computer-on-module, GPS receiver, 32-GB local data storage, power unit, wireless transceiver, and two antennas (for GPS and WiFi). A block diagram of the geoPebble is shown in Figure 2, and the final board layout is shown in Figure 3. The three-axis geophone measures the reflected seismic wave and outputs an analog signal that is fed into the 24-bit sigma–delta analog-to-digital converter (ADC, with crosstalk of dB at 10 kHz) that converts the analog signal into digital data that can be stored and later processed and analyzed. The GPS receiver gathers time and geoPebble node location data. The digital data along with the GPS data are stored in the geoPebble node’s non-volatile memory and are also transmitted via the wireless transceiver to the base station. Each geoPebble node has sensors to measure temperature, pressure, and other environmental parameters. An external port enables extensibility of the geoPebble node by enabling the connection of external sensors and battery packs. Future extension for an inductive-charging capability (e.g., using the Qi standard) is provided (early versions of the standard were unable to provide significant power to rapidly charge the nodes, only 5 W; the current Qi version 1.3 can transfer up to 30 W). Each node within the geoPebble system costs about US$3000, not including the non-recurring engineering.
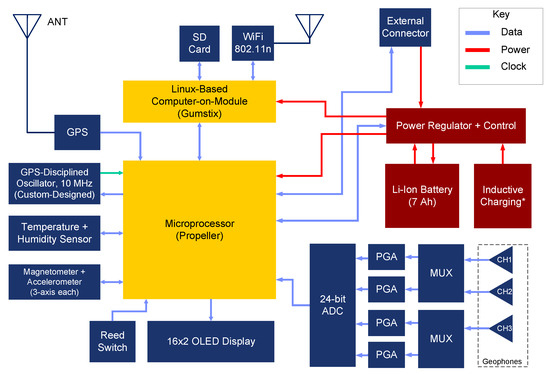
Figure 2.
Block diagram of the geoPebble board, including all the relevant circuits, such as microprocessor, GPS, seismic digitizer, WiFi, etc.
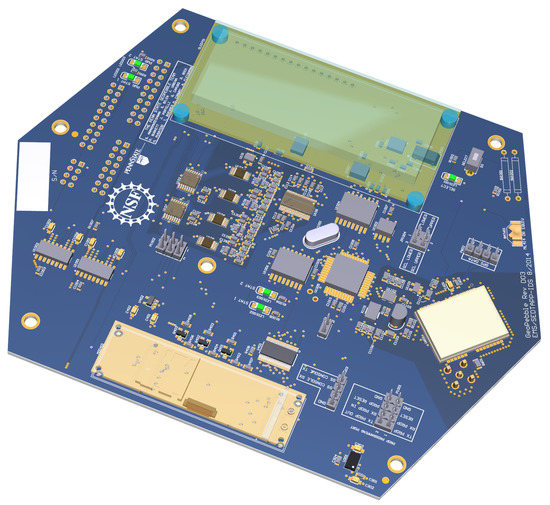
Figure 3.
Primary electronics board for geoPebble node.
4.4.1. Antennas
The geoPebble node uses two physically compact antennas with low gain and a very wide field of view, both of which are located internal to the geoPebble node under its lid and looking upwards. We initially sought to identify a dual-frequency antenna for GPS (1.575 GHz) and WiFi (2.4-GHz band), also known as a dual-resonant or dual-band antenna, but found that we needed to specify separate antennas. The reason for this is that the GPS antenna needs to have a view of the sky with a directivity that falls off down to the horizon. The WiFi antenna needed to have maximum gain in a doughnut pattern a few degrees above the horizon to connect to the APs and Base Station. In addition, given the strong multipath environment caused by the ice sheet, these unwanted signals needed to be eliminated as much as possible. As such, the geoPebble nodes house a custom antenna (see Figure 4) that meets these two requirements.
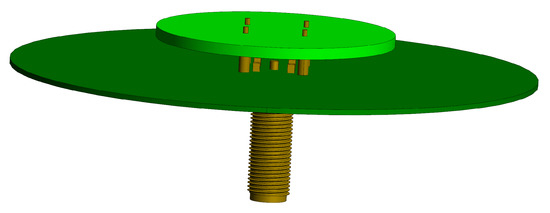
Figure 4.
Custom 2.4-GHz antenna.
4.4.2. Control
The nodes are controlled by a microcontroller that collects data from the digitizer as well as from the GPS receiver. The data are stored to a memory card for future retrieval or for transmission via WiFi radio. The microcontroller also interfaces with the buttons and display. A magnetically-activated reed switch located internal to the geoPebble node enables it to remain hermetically sealed.
4.4.3. Operational Modes
The geoPebble system can be utilized in both active seismics and passive seismics modes. Active seismics require an energy source and is captured within a few minutes of the shot, whereas passive seismics can last several days or weeks and capture natural seismic events without the need for a shot. Coupling these two methods with a 2D array and precise GPS positioning and timing, geoscientists are able to better understand the missing variables required to develop more accurate ice-flow models.
In order to be utilized in both active and passive seismic modes, the geoPebble nodes features two main operational modes: burst and continuous. The geoPebble nodes also feature a sleep mode to be used when it is deployed but not in either of the two main modes. Burst mode is intended to be used with active seismics. This mode features four channels of high-resolution data acquisition (10-kHz sampling) for 60 s. Continuous mode is intended to be used with passive seismics. In this mode, the geoPebble nodes continuously acquire four-channel low temporal resolution data, sampled at 625 Hz, for a period of days or weeks.
A GPS-disciplined oscillator (GPSDO) was designed to provide the necessary timing accuracy using low power. The principle behind this GPSDO employs a temperature-compensated crystal oscillator with a duty-cycled GPS receiver to intermittently correct the oscillator for drift. Our GPSDO design achieves an accuracy of 5 s rms in its operational environment, while consuming only 45 mW of average power. Full details of this subsystem are provided in [30].
The needs of each operational mode generate functional and performance requirements in terms of data storage, power consumption, network bandwidth, etc. These requirements are grouped into four categories: (1) System Level, (2) Burst Mode, (3) Continuous Mode, and (4) Sleep Mode.
At the System Level, the geoPebble network has a network-wide clock accurate to 1 s. Each geoPebble has four 24-bit ADCs and must record GPS data that when post processed yield position accuracy within 10 cm. In addition, each geoPebble node has to transmit housekeeping data (battery life, signal strength, available storage, etc.) back to the base station upon request from the base station.
In Burst Mode, each geoPebble node needs to have sufficient battery life to record seismic data for a period of 30 s, with a sampling frequency of 10 kHz, for 60–30-s records per day for 7 days. Each geoPebble node needs to maintain the system clock to within 1% of 10 kHz over the 30-second record period and transmit a subset of the seismic data back to the base station within 30 s after the record period ends.
In Continuous Mode, each geoPebble node must have sufficient battery life to collect seismic data continuously, with a sampling frequency up to 1 kHz, for 48 h of continuous recording. Each geoPebble node has to maintain the system clock to within 1% of 1 kHz over a duration of 20 min.
Finally, in Sleep Mode, each geoPebble node must have sufficient battery life for 10 days of continuous sleep operation.
4.4.4. Power Module
A straightforward power regulation circuit was designed both to allow the 7-Ah Li–Ion battery to charge and to condition and distribute the required power to the geoPebble node’s subsystems. With all systems operating, the geoPebble node uses about 2 W of power. As mentioned above, future geoPebble versions may include inductive-charging capability. We have demonstrated this capability using an earlier version of the Qi standard that could provide only 5 W, but which charged the geoPebble node too slowly for use in the field.
4.4.5. Housing
The housing for the geoPebble nodes was designed to meet several functional requirements as well as to survive the conditions found in the Antarctic. Requirements and design considerations included:
- Light weight as nodes need to be transported to the field (typically by aircraft);
- Smooth outer surface with no crevasses to trap snow and/or ice;
- Mass-producible due to quantity needed (10 s to 100 s);
- Display located inside the housing must be visible to the operator;
- Accommodate a hermetic seal of the lid and the housing but also easily removable in the field with common tools;
- Support wireless charging (at least some part of the case needs to allow magnetic fields to penetrate for charging, which also defines a maximum wall thickness);
- Accommodate electronics mounting including power board, seismic sensors, and radio communication. Use custom features to mount electronics inside the box using standoffs produced with injection molding;
- Provide a backup electrical connector for wired electrical needs and expansion; and
- Anchor the housing to the ice or snowpack with metal spikes.
To address these requirements, the design shown in Figure 5 was selected. The housing was shaped as a symmetric hexagon stretched in the x-direction to provide strength and to maximize volume allowable in the injection mold. A custom injection mold was manufactured and several hundred housings were manufactured using Acetal Homopolymer Delrin® 127UV material. Once manufactured, several small secondary machining operations were required to install threaded inserts for the three anchoring spikes and a “D”-shaped hole for the electrical connector. The lids were machined from clear polycarbonate sheets and a silcone gasket was used to seal the lid to the housing. In addition, 10-cm metal spikes were connected to the bottom via the threaded inserts.
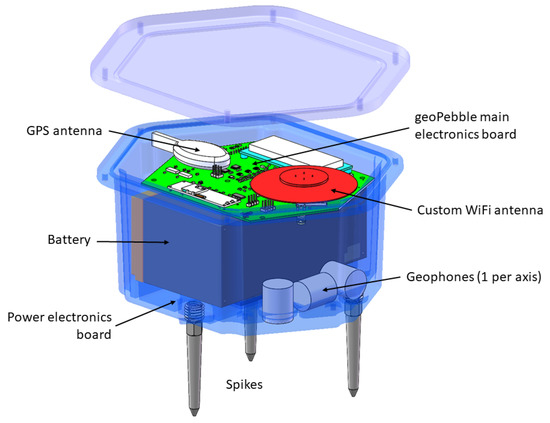
Figure 5.
Housing for geoPebble node with installed components. Note that the WiFi antenna of Figure 4 and the GPS antenna both look vertically through lid, which is optically and electrically transparent.
5. geoPebble Field Validation
We deployed a subset of our network on the Whillans Ice Stream, West Antarctica (83°40 S 145°00 W) in order to test the capabilities of the sensors, to compare the geoPebble system to existing instruments, and to provide valuable feedback on the operation of the overall system (see Figure 6 for how a geoPebble node is installed in the field). These field tests have provided important input for their continued development. A set of eight geoPebble nodes was deployed for a week-long test to determine sensor sensitivity and noise, radio range, and power consumption. Each node can be deployed relatively quickly, in only minutes. The sensors’ signal detection and sensitivity compare well to wired sensors (at significantly lower effort—the km-long cables used for the wired sensors are logstically problematic as they can be buried by snowfall and drift and made difficult to retrieve). The radio range for our geoPebble nodes was lower than expected, likely due to the thickness of the ice sheet and lack of a ground plane. While we had anticipated that this would occur, the results were poorer than our propagation models suggested, likely because our base station antenna heights were only 3–5 m rather than 10–20 m (due to field limitations of equipment and personnel). The network is not affected if one or multiple nodes go offline. Redundancy of the data is ensured by local storage of them on an SD card in addition to those data transmitted in real time. The power consumption of the units was as expected, with a week-long experiment conducted without recharging. As the internal power dissipation is small, internal temperatures within each node are close to ambient. During Antarctic summer, these temperatures average lows of °C.
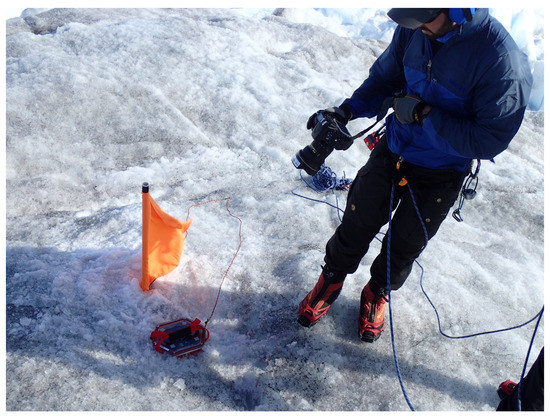
Figure 6.
Field installation of a geoPebble node in the Antarctic. The node is anchored in the snow via bottom spikes, and a flag helps locate the node should it become covered in snow.
The data we collected at the Whillans Ice Stream demonstrate that the geoPebble data match closely those of a commercially-available Nanometrics Geode. A representative example of this collected data is provided in Figure 7. The horizontal axis is time, and the vertical axis is ground velocity (in counts; conversion to velocity depends on site characteristics and was not attempted; note that, in much seismic work, relative amplitudes and absolute time are the most important). This correlation demonstrates that the geoPebble system collects data equivalently to existing wired systems, but with much lower logistical complexity.
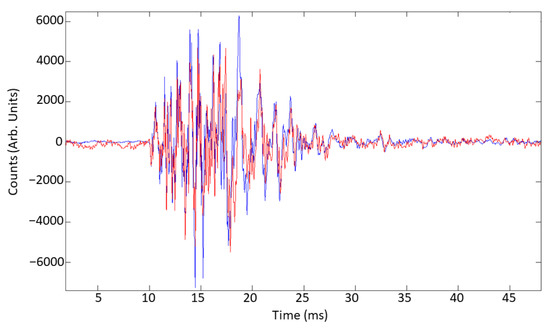
Figure 7.
Raw seismic data from Whillans Ice Stream comparing geoPebble (red) with COTS Nanometrics Geode (blue).
6. Discussion
The geoPebble system’s network of wirelessly interconnected seismic and GPS sensor nodes with geophysical sensing capabilities is well positioned to support the new paradigm necessary for the study of ice sheets in Antarctica and Greenland, as well as mountain glaciers. Indeed, future papers will report on research findings employing the geoPebble network in Antarctica and Greenland, as well as other locations where the long-term morphology of glaciers and ice sheets must be understood.
That each geoPebble node is a self-contained, wirelessly connected sensor allows for rapid deployment and redeployment in the field. The geoPebble system is undergoing validation in the field in Antarctica and Greenland. With the geoPebble system, the cost of doing today’s experiments (low-resolution, 2D) is significantly reduced, and the cost and feasibility of doing tomorrow’s experiments (integrated seismic, positioning, 3D, etc.) is very reasonable.
geoPebble Deployment in Greenland
Our current efforts have shifted to investigating the processes behind ice-sheet break up on the Helheim Glacier located on the eastern side of the Greenland ice sheet. For this research, the geoPebbles have been modified to support long-term passive data collection, which requires significantly more battery capacity such that the nodes can last approximately one month. To address this need, we have developed a bolt-on extension to accommodate larger battery using 3D-printed chlorinated polyethylene (CPE). Rather than employing APs and a base station, the data from the deployed geoPebbles will be stored locally and also collected with a custom drone. Figure 8 shows the base camp, the Helheim Glacier, and the data collection drone that will support these measurements.
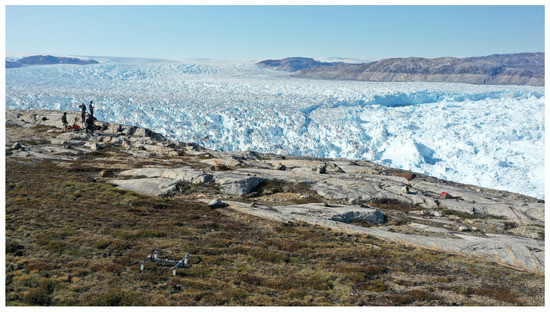
Figure 8.
Base camp at the Helheim Glacier with the data-collection drone in the foreground.
Author Contributions
Conceptualization, S.A. and S.G.B.; methodology, S.A.; design, S.A., S.G.B., R.G.B., P.G.B. and J.P.P.; software, S.A. and P.G.B.; validation, S.A.; resources, S.A. and S.G.B.; data curation, S.A.; writing—original draft preparation, S.G.B., J.V.U. and S.A.; writing—review and editing, S.G.B.; visualization, S.A.; supervision, S.A. and S.G.B.; project administration, S.A.; funding acquisition, S.A., S.G.B. and J.V.U. All authors have read and agreed to the published version of the manuscript.
Funding
This work was supported by U.S. National Science Foundation grants 0427714, 0424589, and NSF award number 1039982: MRI: Development of a Wirelessly-Connected Network of Seismometers and GPS Instruments for Polar and Geophysical Research. The Heising–Simons Foundation is currently funding the Greenland investigations.
Institutional Review Board Statement
Not applicable.
Informed Consent Statement
Not applicable.
Data Availability Statement
The data presented in this study are available on request from the corresponding author.
Acknowledgments
The authors wish to thank the entire geoPebble team for their efforts to realize and test this system.
Conflicts of Interest
The authors declare no conflict of interest.
Abbreviations
The following abbreviations are used in this manuscript:
| 2D | Two-dimensional |
| 3D | Three-dimensional |
| 4D | Four-dimensional |
| ADC | Analog-to-digital converter |
| AP | Access point |
| GPS | Global Positioning System |
| GPSDO | GPS-disciplined oscillator |
| SQC | Supervisory and Quality Control |
References
- Rignot, E.; Thomas, R.H. Mass balance of polar ice sheets. Science 2002, 297, 1502–1506. [Google Scholar] [CrossRef]
- Bindschadler, R.A. Future of the West Antarctic ice sheet. Science 1998, 282, 428–429. [Google Scholar] [CrossRef]
- Conway, H.; Hall, B.L.; Denton, G.H. Past and future grounding-line retreat of the West Antarctic Ice Sheet. Science 1999, 286, 280–283. [Google Scholar] [CrossRef] [PubMed]
- Velicogna, I.; Wahr, J. Acceleration of Greenland ice mass loss in spring 2004. Nature 2006, 443, 329–331. [Google Scholar] [CrossRef]
- Hanna, E.; Huybrechts, P.; Steffen, K.; Cappelen, J.; Huff, R.; Shuman, C.; Irvine-Fynn, T.; Wise, S.; Griffiths, M. Increased runoff from melt from the Greenland Ice Sheet: A response to global warming. J. Clim. 2008, 21, 331–341. [Google Scholar] [CrossRef]
- Rignot, E.; Box, J.E.; Burgess, E.; Hanna, E. Mass balance of the Greenland Ice Sheet from 1958 to 2007. Geophys. Res. Lett. 2008, 35, L20502. [Google Scholar] [CrossRef]
- Alley, R.B.; Anandakrishnan, S.; Dupont, T.K.; Parizek, B.R. Ice streams: Fast and faster. C. R. Phys. 2004, 5, 723–734. [Google Scholar] [CrossRef]
- Alley, R.B.; Bindschadler, R.A. The West Antarctic Ice Sheet: Behavior and Environment; Antarctic Research Series; AGU: Washington, DC, USA, 2001; Volume 77. [Google Scholar]
- Harrison, W.D.; Echelmeyer, K.A.; Larsen, C.F. Measurements of temperatures within a margin of ice stream B, Antarctica: Implications for margin migration and lateral drag. J. Glaciol. 1998, 44, 615–625. [Google Scholar] [CrossRef][Green Version]
- Zwally, H.J.; Abdalati, W.; Herring, T.; Larson, K.; Saba, J.; Steffen, K. Surface melt induced acceleration of Greenland ice-sheet flow. Science 2002, 297, 218–222. [Google Scholar] [CrossRef]
- Wingham, D.J.; Ridout, A.J.; Scharroo, R.; Arthern, R.J.; Schum, C.K. Antarctic elevation change from 1992 to 1996. Science 1998, 282, 456–458. [Google Scholar] [CrossRef]
- British Antarctic Survey. Instrument: Phase-Sensitive Radar (ApRES). Available online: https://www.bas.ac.uk/polar-operations/sites-and-facilities/facility/phase-sensitive-radar-apres/ (accessed on 20 December 2021).
- Makama, A.; Kuladinithi, K.; Timm-Giel, A. Wireless geophone networks for land seismic data acquisition: A survey, tutorial and performance evaluation. Sensors 2021, 21, 5171. [Google Scholar] [CrossRef]
- Oppenheimer, M.; Glavovic, B.C.; Hinkel, J.; Wal, R.; Magnan, A.K.; Abd-Elgawad, A.; Cai, R.; Cifuentes-Jara, M.; DeConto, R.M.; Ghosh, T.; et al. Sea level rise and implications for low-lying islands, coasts and communities. In IPCC Special Report on the Ocean and Cryosphere in a Changing Climate; Pörtner, H.-O., Roberts, D.C., Masson-Delmotte, V., Zhai, P., Tignor, M., Poloczanska, E., Mintenbeck, K., Alegría, A., Nicolai, M., Okem, A., et al., Eds.; The Intergovernmental Panel on Climate Change: Geneva, Switzerland, 2019. [Google Scholar]
- Siegert, M.; Alley, R.B.; Rignot, E.; Englander, J.; Corell, R. Twenty-first century sea-level rise could exceed IPCC projections for strong-warming futures. One Earth 2020, 3, 691–703. [Google Scholar] [CrossRef]
- Khan, S.A.; Bjørk, A.A.; Bamber, J.L.; Morlighem, M.; Bevis, M.; Kjær, K.H.; Mouginot, J.; Løkkegaard, A.; Holland, D.M.; Aschwanden, A.; et al. Centennial response of Greenland’s three largest outlet glaciers. Nat. Commun. 2020, 11, 1–9. [Google Scholar] [CrossRef]
- Doake, C.S.M. Ice-shelf stability. Encycl. Ocean. Sci. 2001, 1282–1290. [Google Scholar] [CrossRef]
- Wang, S.; Alexander, P.; Wu, Q.; Tedesco, M.; Shu, S. Characterization of ice shelf fracture features using ICESat-2—A case study over the Amery Ice Shelf. Remote Sens. Environ. 2021, 255, 112266. [Google Scholar] [CrossRef]
- Murray, T.; Selmes, N.; James, T.D.; Edwards, S.; Martin, I.; O’Farrell, T.; Aspey, R.; Rutt, I.; Nettles, M.; Baugé, T. Dynamics of glacier calving at the ungrounded margin of Helheim Glacier, southeast Greenland. J. Geophys. Res. Earth Surf. 2015, 120, 964–982. [Google Scholar] [CrossRef] [PubMed]
- Robel, A.A.; Seroussi, H.; Roe, G.H. Marine ice sheet instability amplifies and skews uncertainty in projections of future sea-level rise. Proc. Natl. Acad. Sci. USA 2019, 116, 14887–14892. [Google Scholar] [CrossRef]
- Bassis, J.N.; Ma, Y. Evolution of basal crevasses links ice shelf stability to ocean forcing. Earth Planet. Sci. Lett. 2015, 409, 203–211. [Google Scholar] [CrossRef]
- Sheriff, R.E.; Geldart, L.P. Exploraion Seismology, 2nd ed.; Cambridge University Press: Cambridge, UK, 1995. [Google Scholar]
- Mailloux, R.J. Phased Array Antenna Handbook; Artech House: Boston, MA, USA, 1994. [Google Scholar]
- Winberry, J.P.; Anandakrishnan, S.; Alley, R.B. Seismic observations of transient subglacial water-flow beneath MacAyeal Ice Stream, West Antarctica. Geophys. Res. Lett. 2009, 36, 1–5. [Google Scholar] [CrossRef]
- Wiens, D.A.; Anandakrishnan, S.; Winberry, J.P.; King, M.A. Simultaneous teleseismic and geodetic observations of the stick-slip motion of an Antarctic ice stream. Nature 2008, 453, 770–774. [Google Scholar] [CrossRef]
- Anandakrishnan, S.; Alley, R.B. Tidal forcing of basal seismicity of ice stream C, West Antarctica, observed far inland. J. Geophys. Res. 1997, 102, 15183–15196. [Google Scholar] [CrossRef]
- Das, S.; Joughin, I.; Behn, M.; Howat, I.; King, M.; Lizarralde, D.; Bhatia, M. Fracture propagation to the base of the Greenland ice sheet during supraglacial lake drainage. Science 2008, 320, 778. [Google Scholar] [CrossRef] [PubMed]
- Ekström, G.; Nettles, M.; Tsai, V.C. Seasonality and increasing frequency of Greenland glacial earthquakes. Science 2006, 311, 1756–1758. [Google Scholar] [CrossRef]
- u-blox. LEA-6T Module with Precision Timing. Available online: https://www.u-blox.com/en/product/neolea-6t (accessed on 17 March 2021).
- Boehmer, T.J.; Bilén, S.G. Low-power GPS-disciplined oscillator module for distributed wireless sensor nodes. Electronics 2021, 10, 716. [Google Scholar] [CrossRef]
Publisher’s Note: MDPI stays neutral with regard to jurisdictional claims in published maps and institutional affiliations. |
© 2021 by the authors. Licensee MDPI, Basel, Switzerland. This article is an open access article distributed under the terms and conditions of the Creative Commons Attribution (CC BY) license (https://creativecommons.org/licenses/by/4.0/).