
Influence of Sediment Cycling on the Rare-Earth Element Geochemistry of Fluvial Deposits (Caculuvar–Mucope, Cunene River Basin, Angola)


Abstract
:1. Introduction
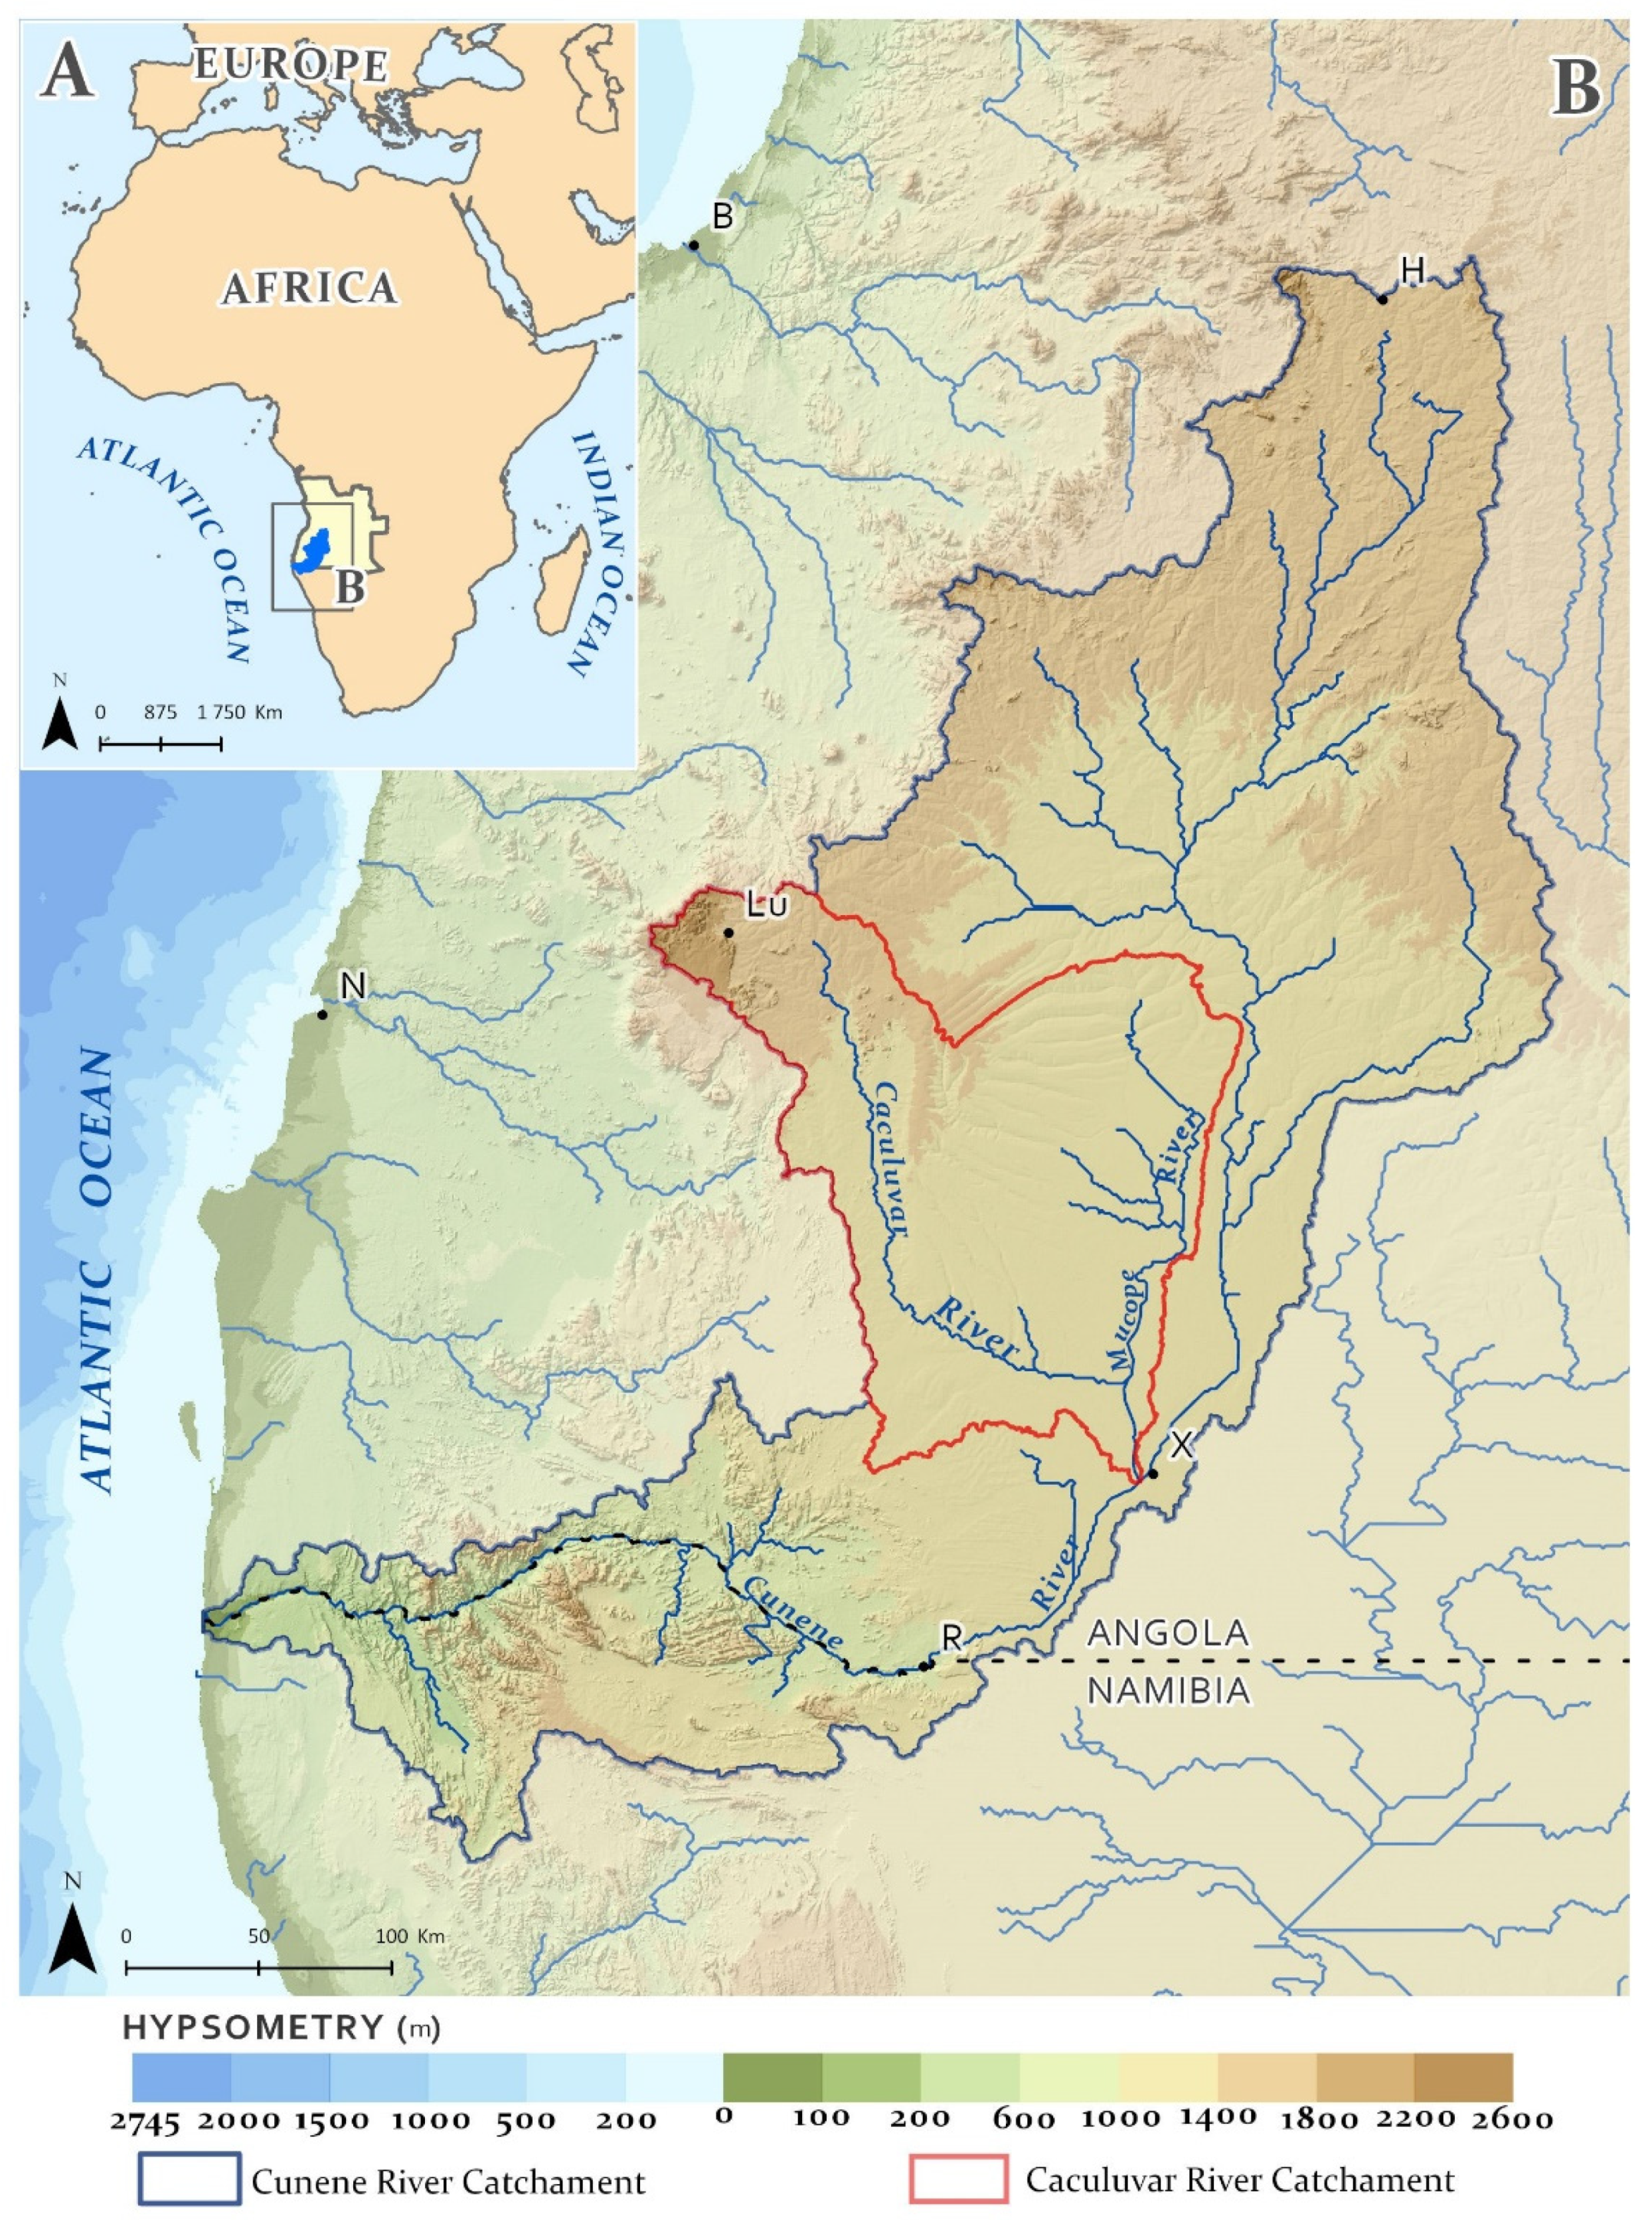
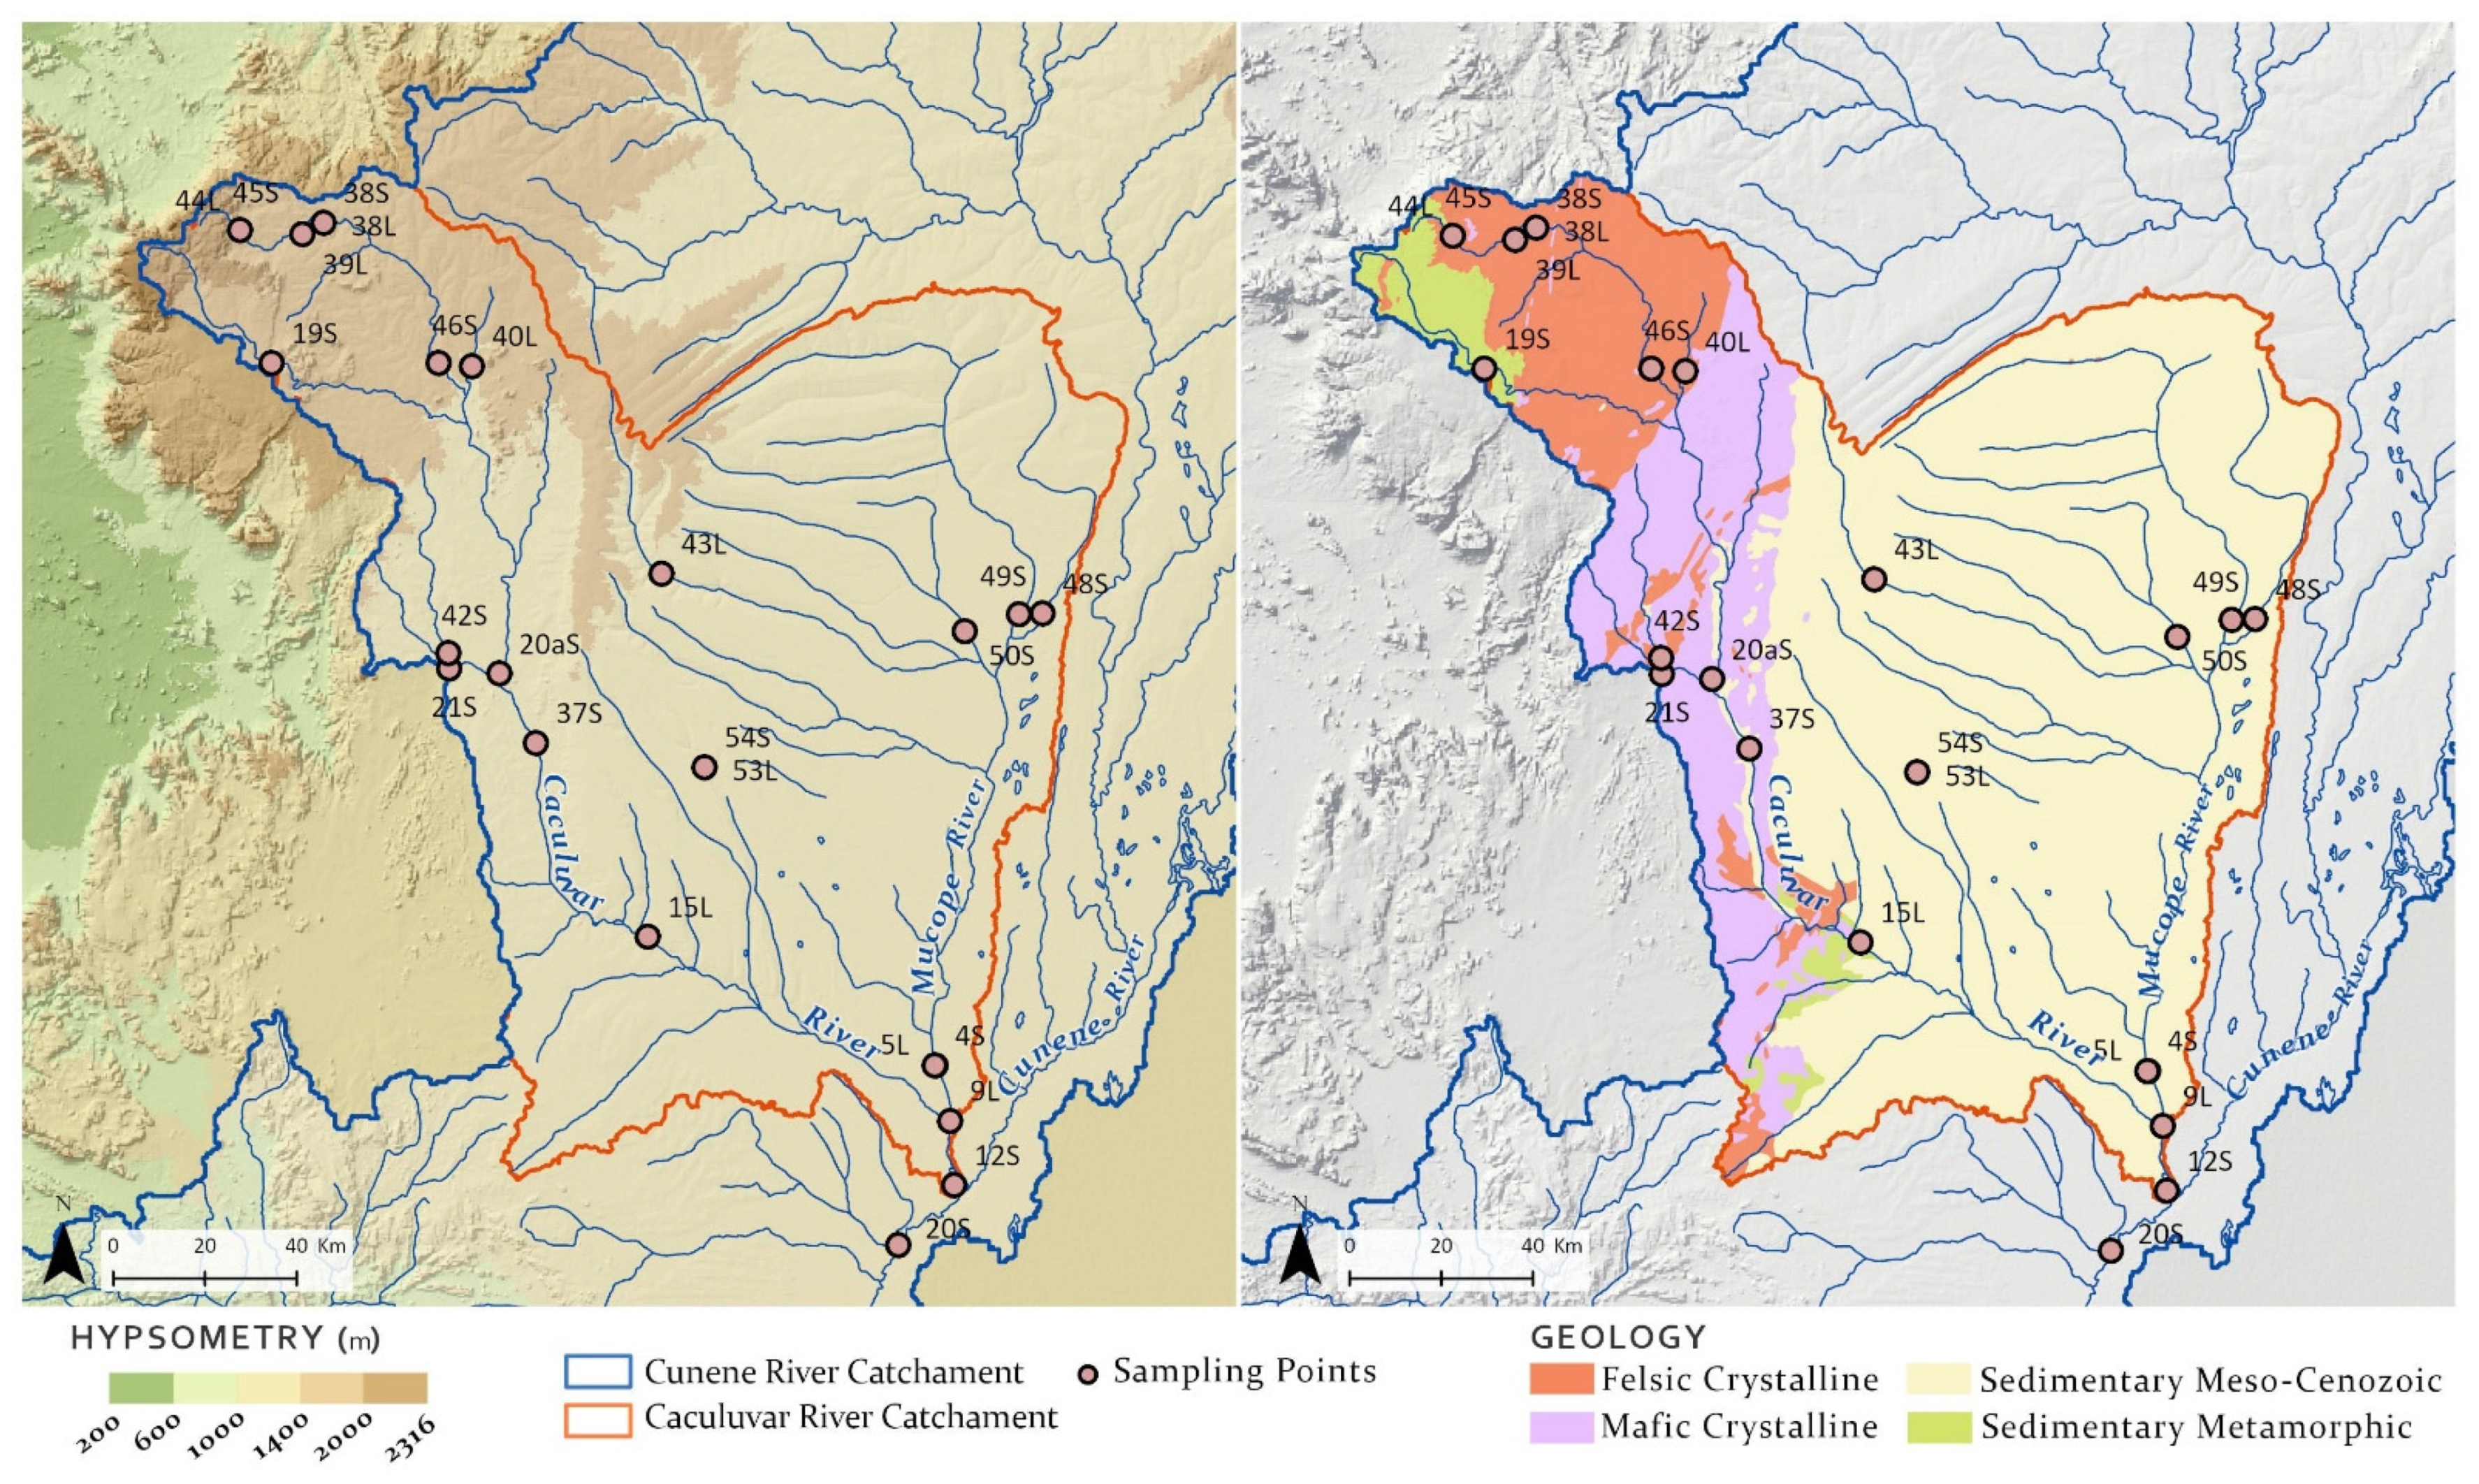
2. Regional Setting
2.1. Geology
2.2. Climate
3. Methods
4. Results
4.1. Sediment Classification Based on Source Geology
4.2. Mineralogy
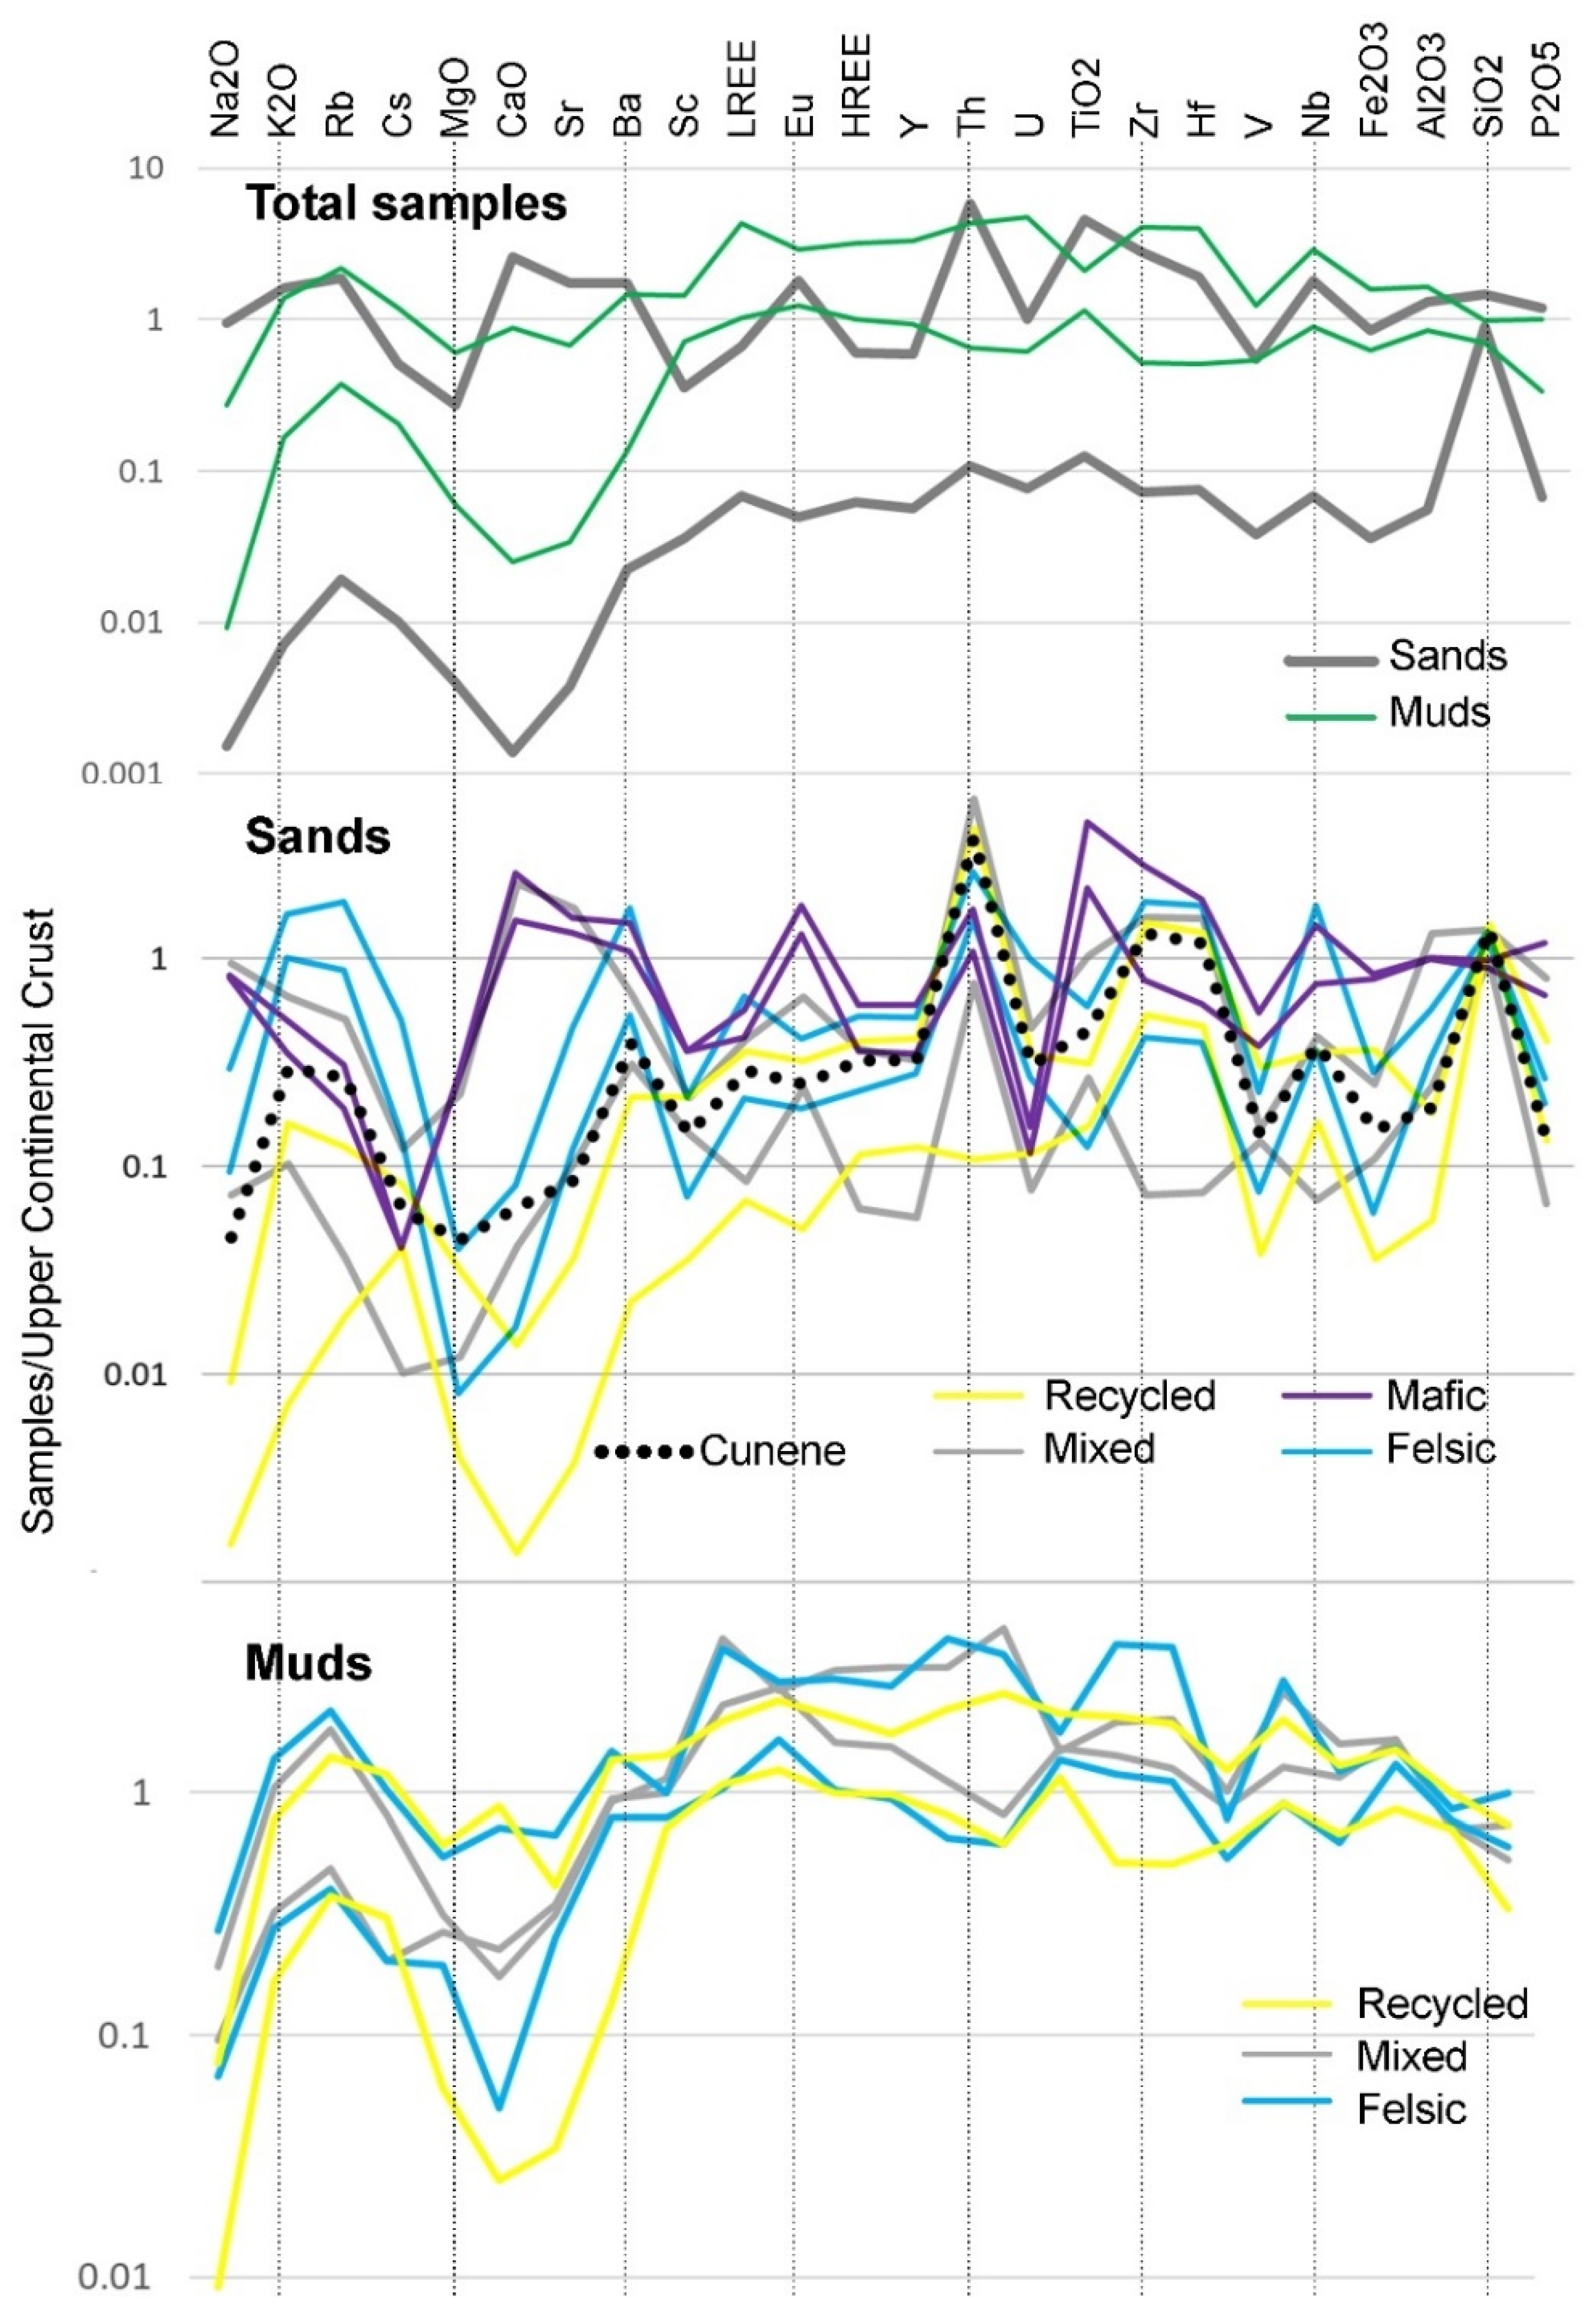
4.3. Overall Geochemistry
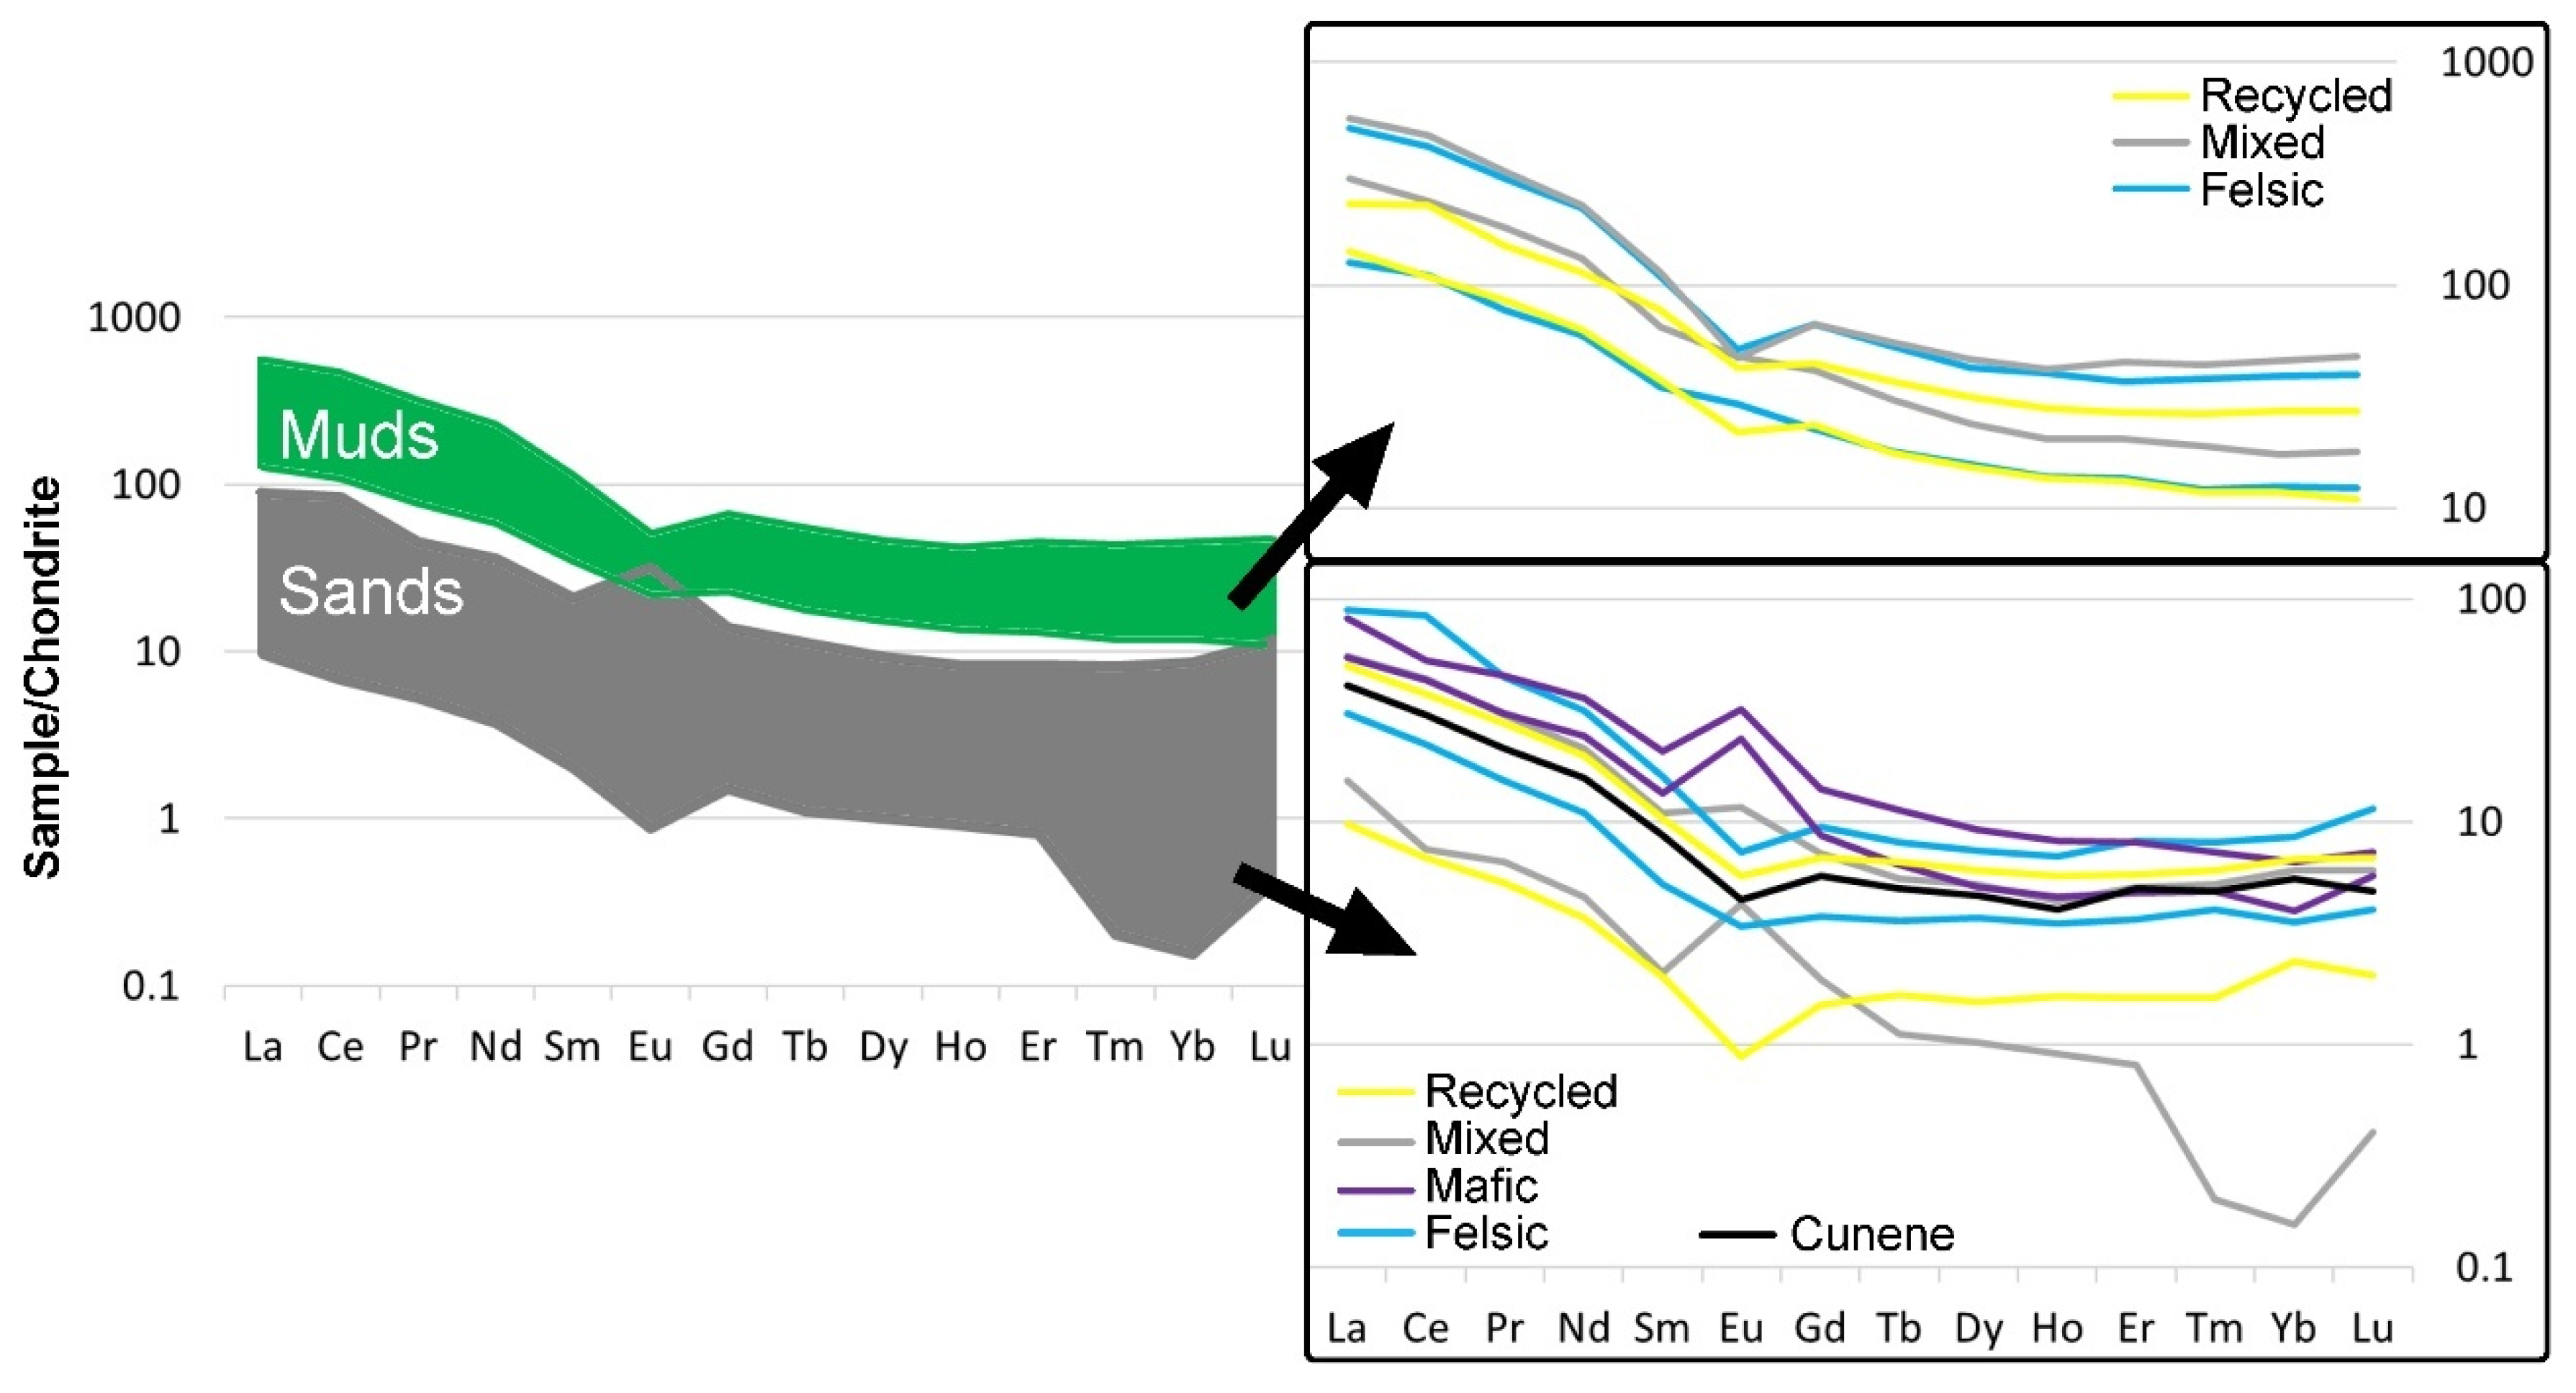
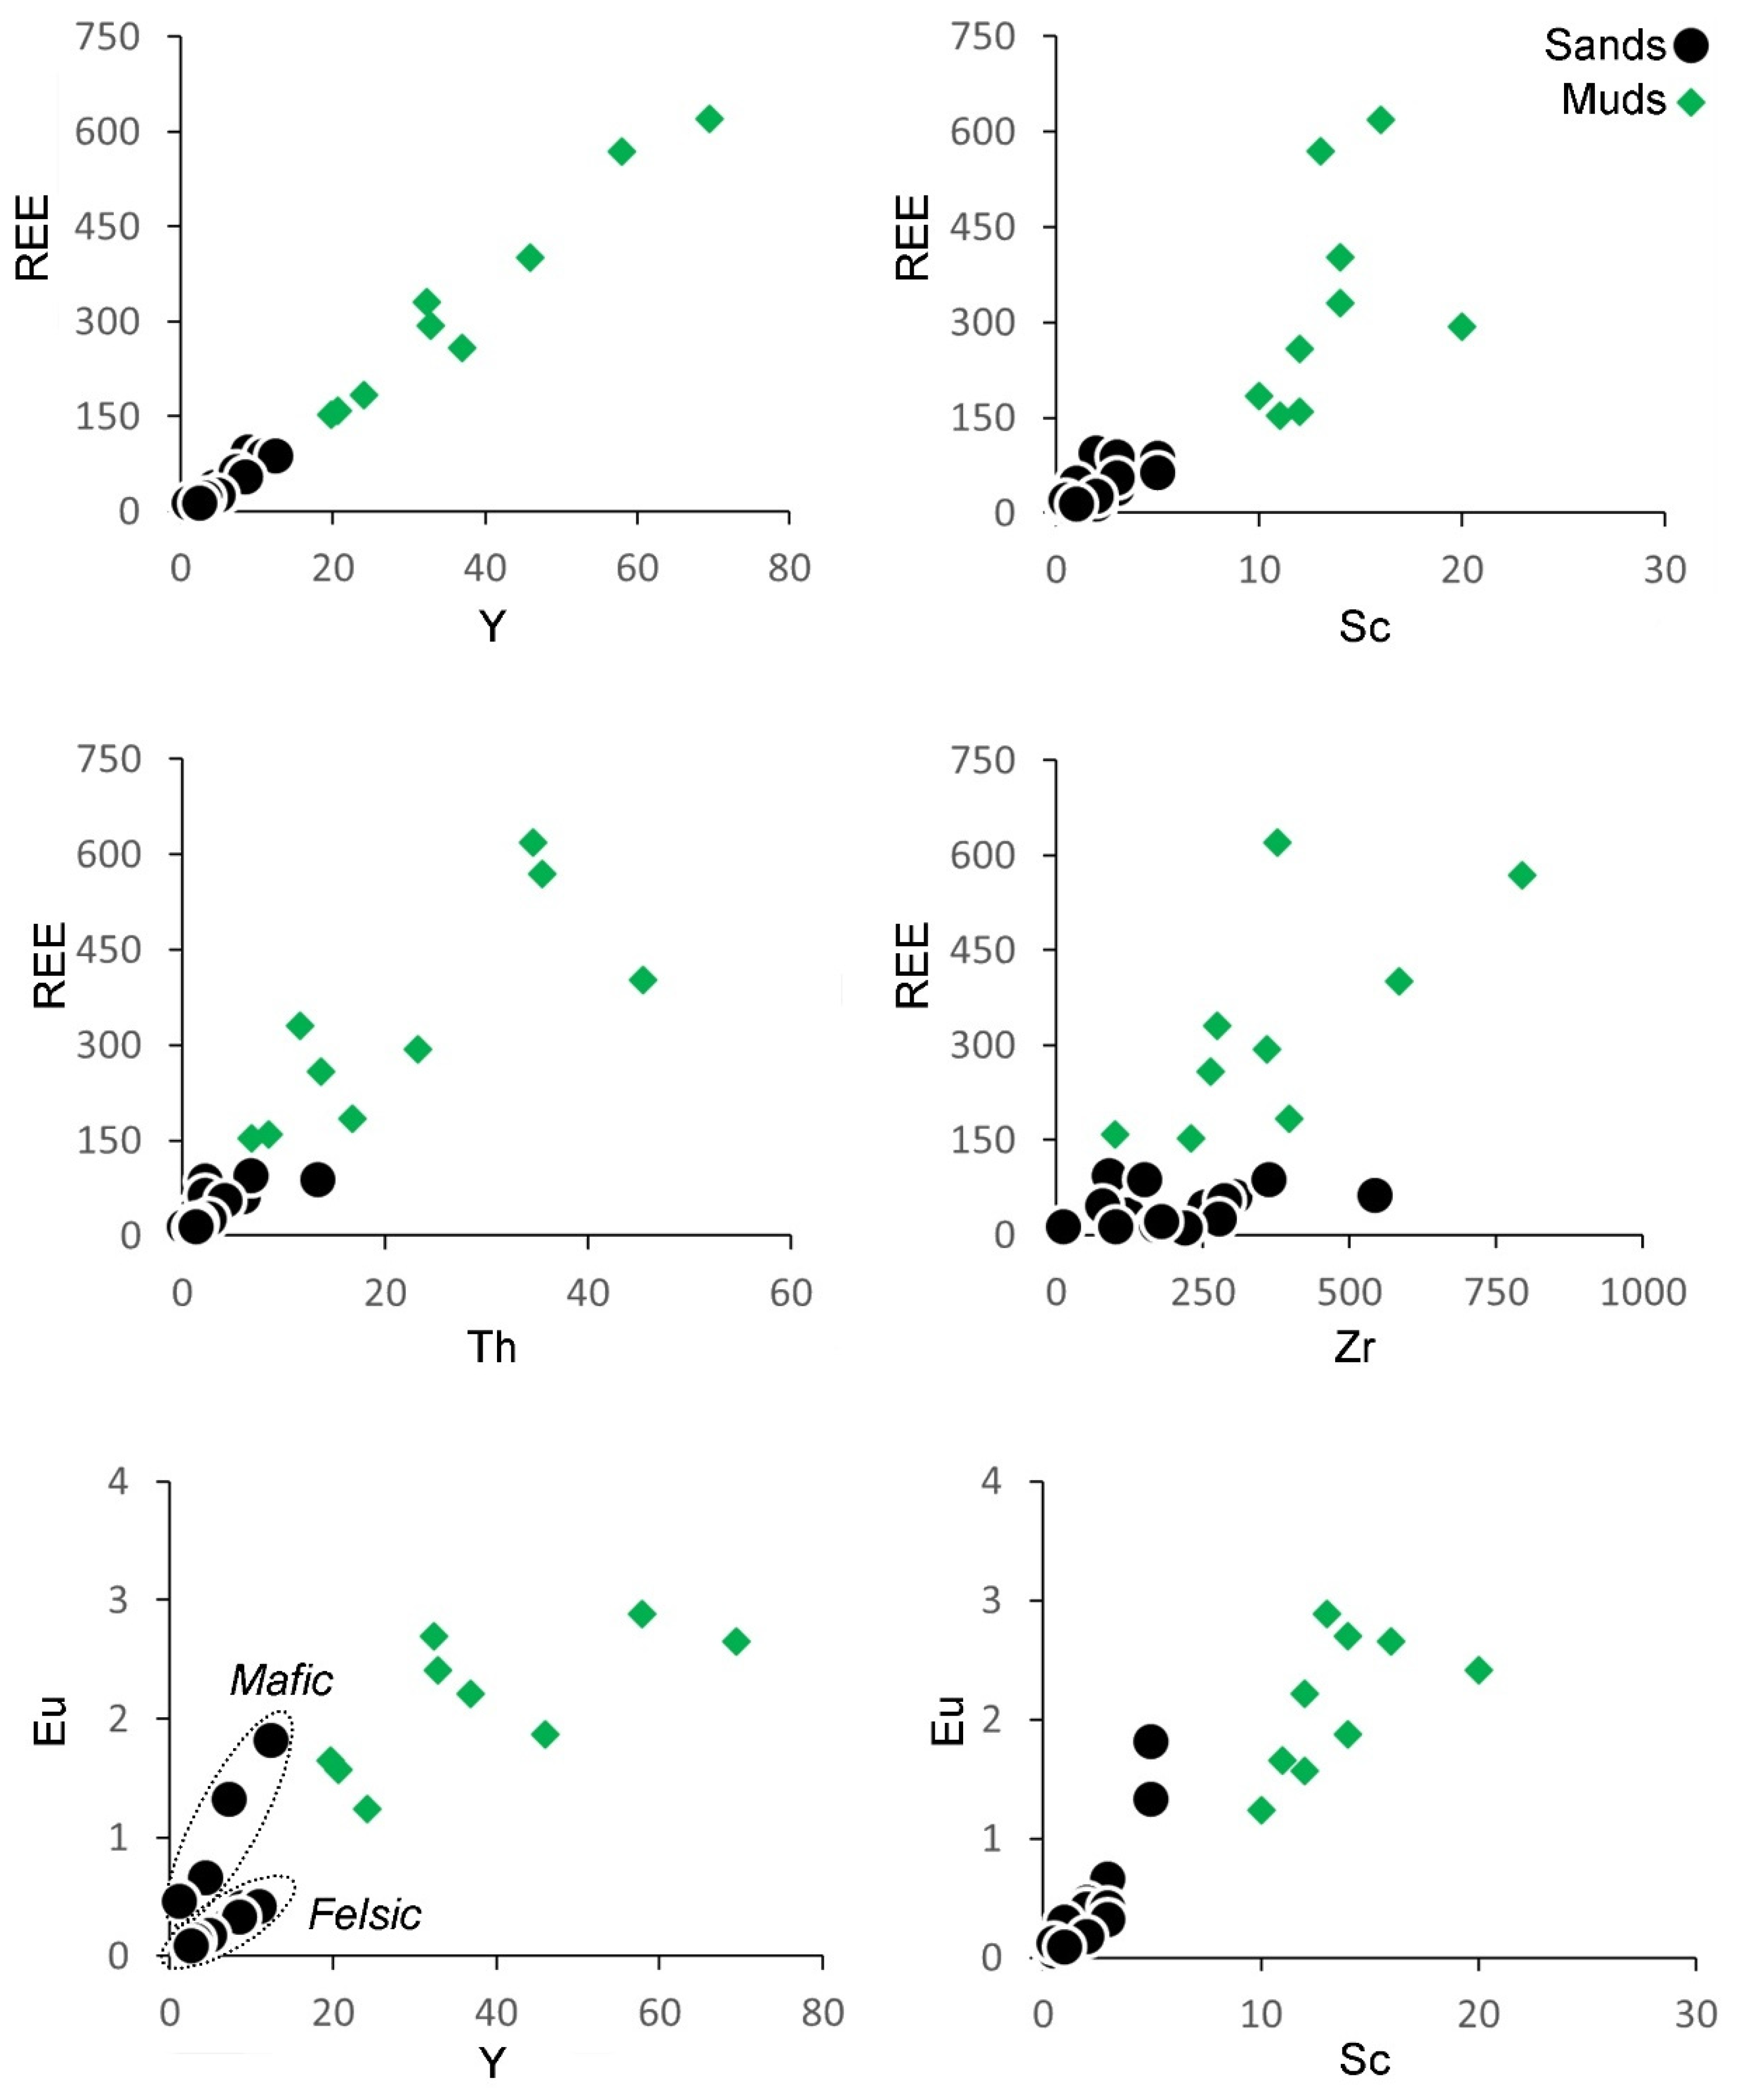
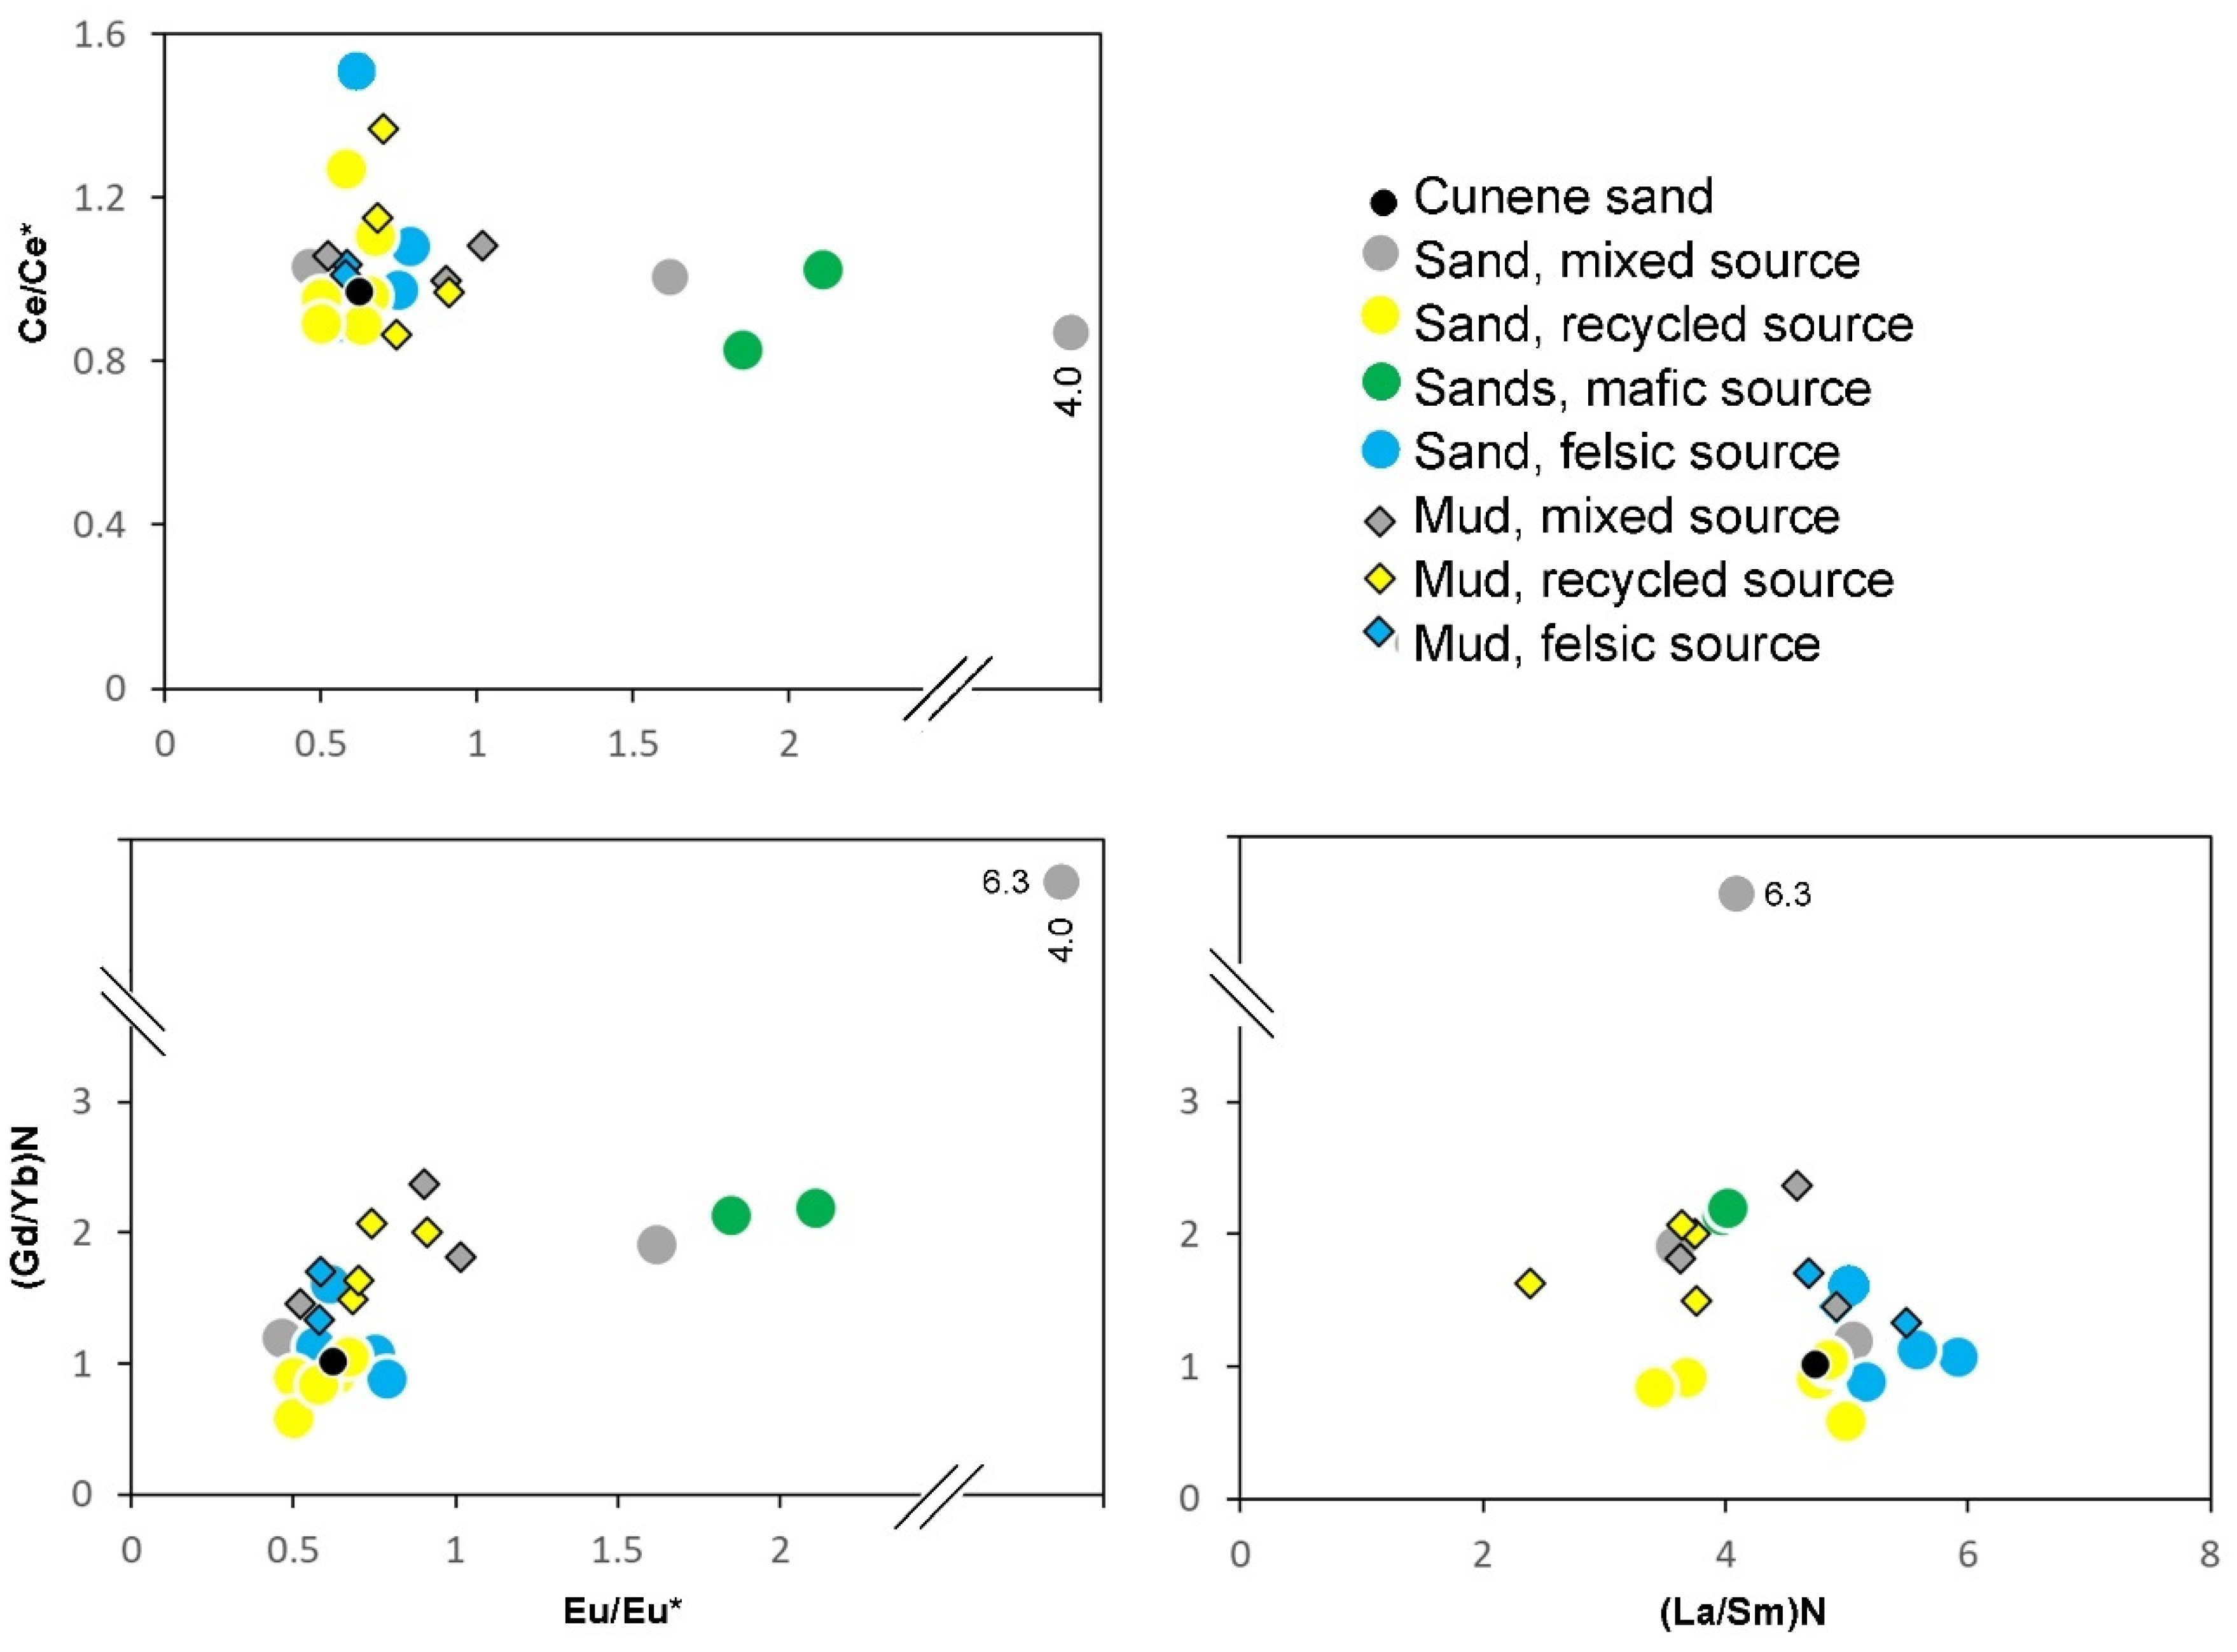
4.4. REE Grades and Patterns
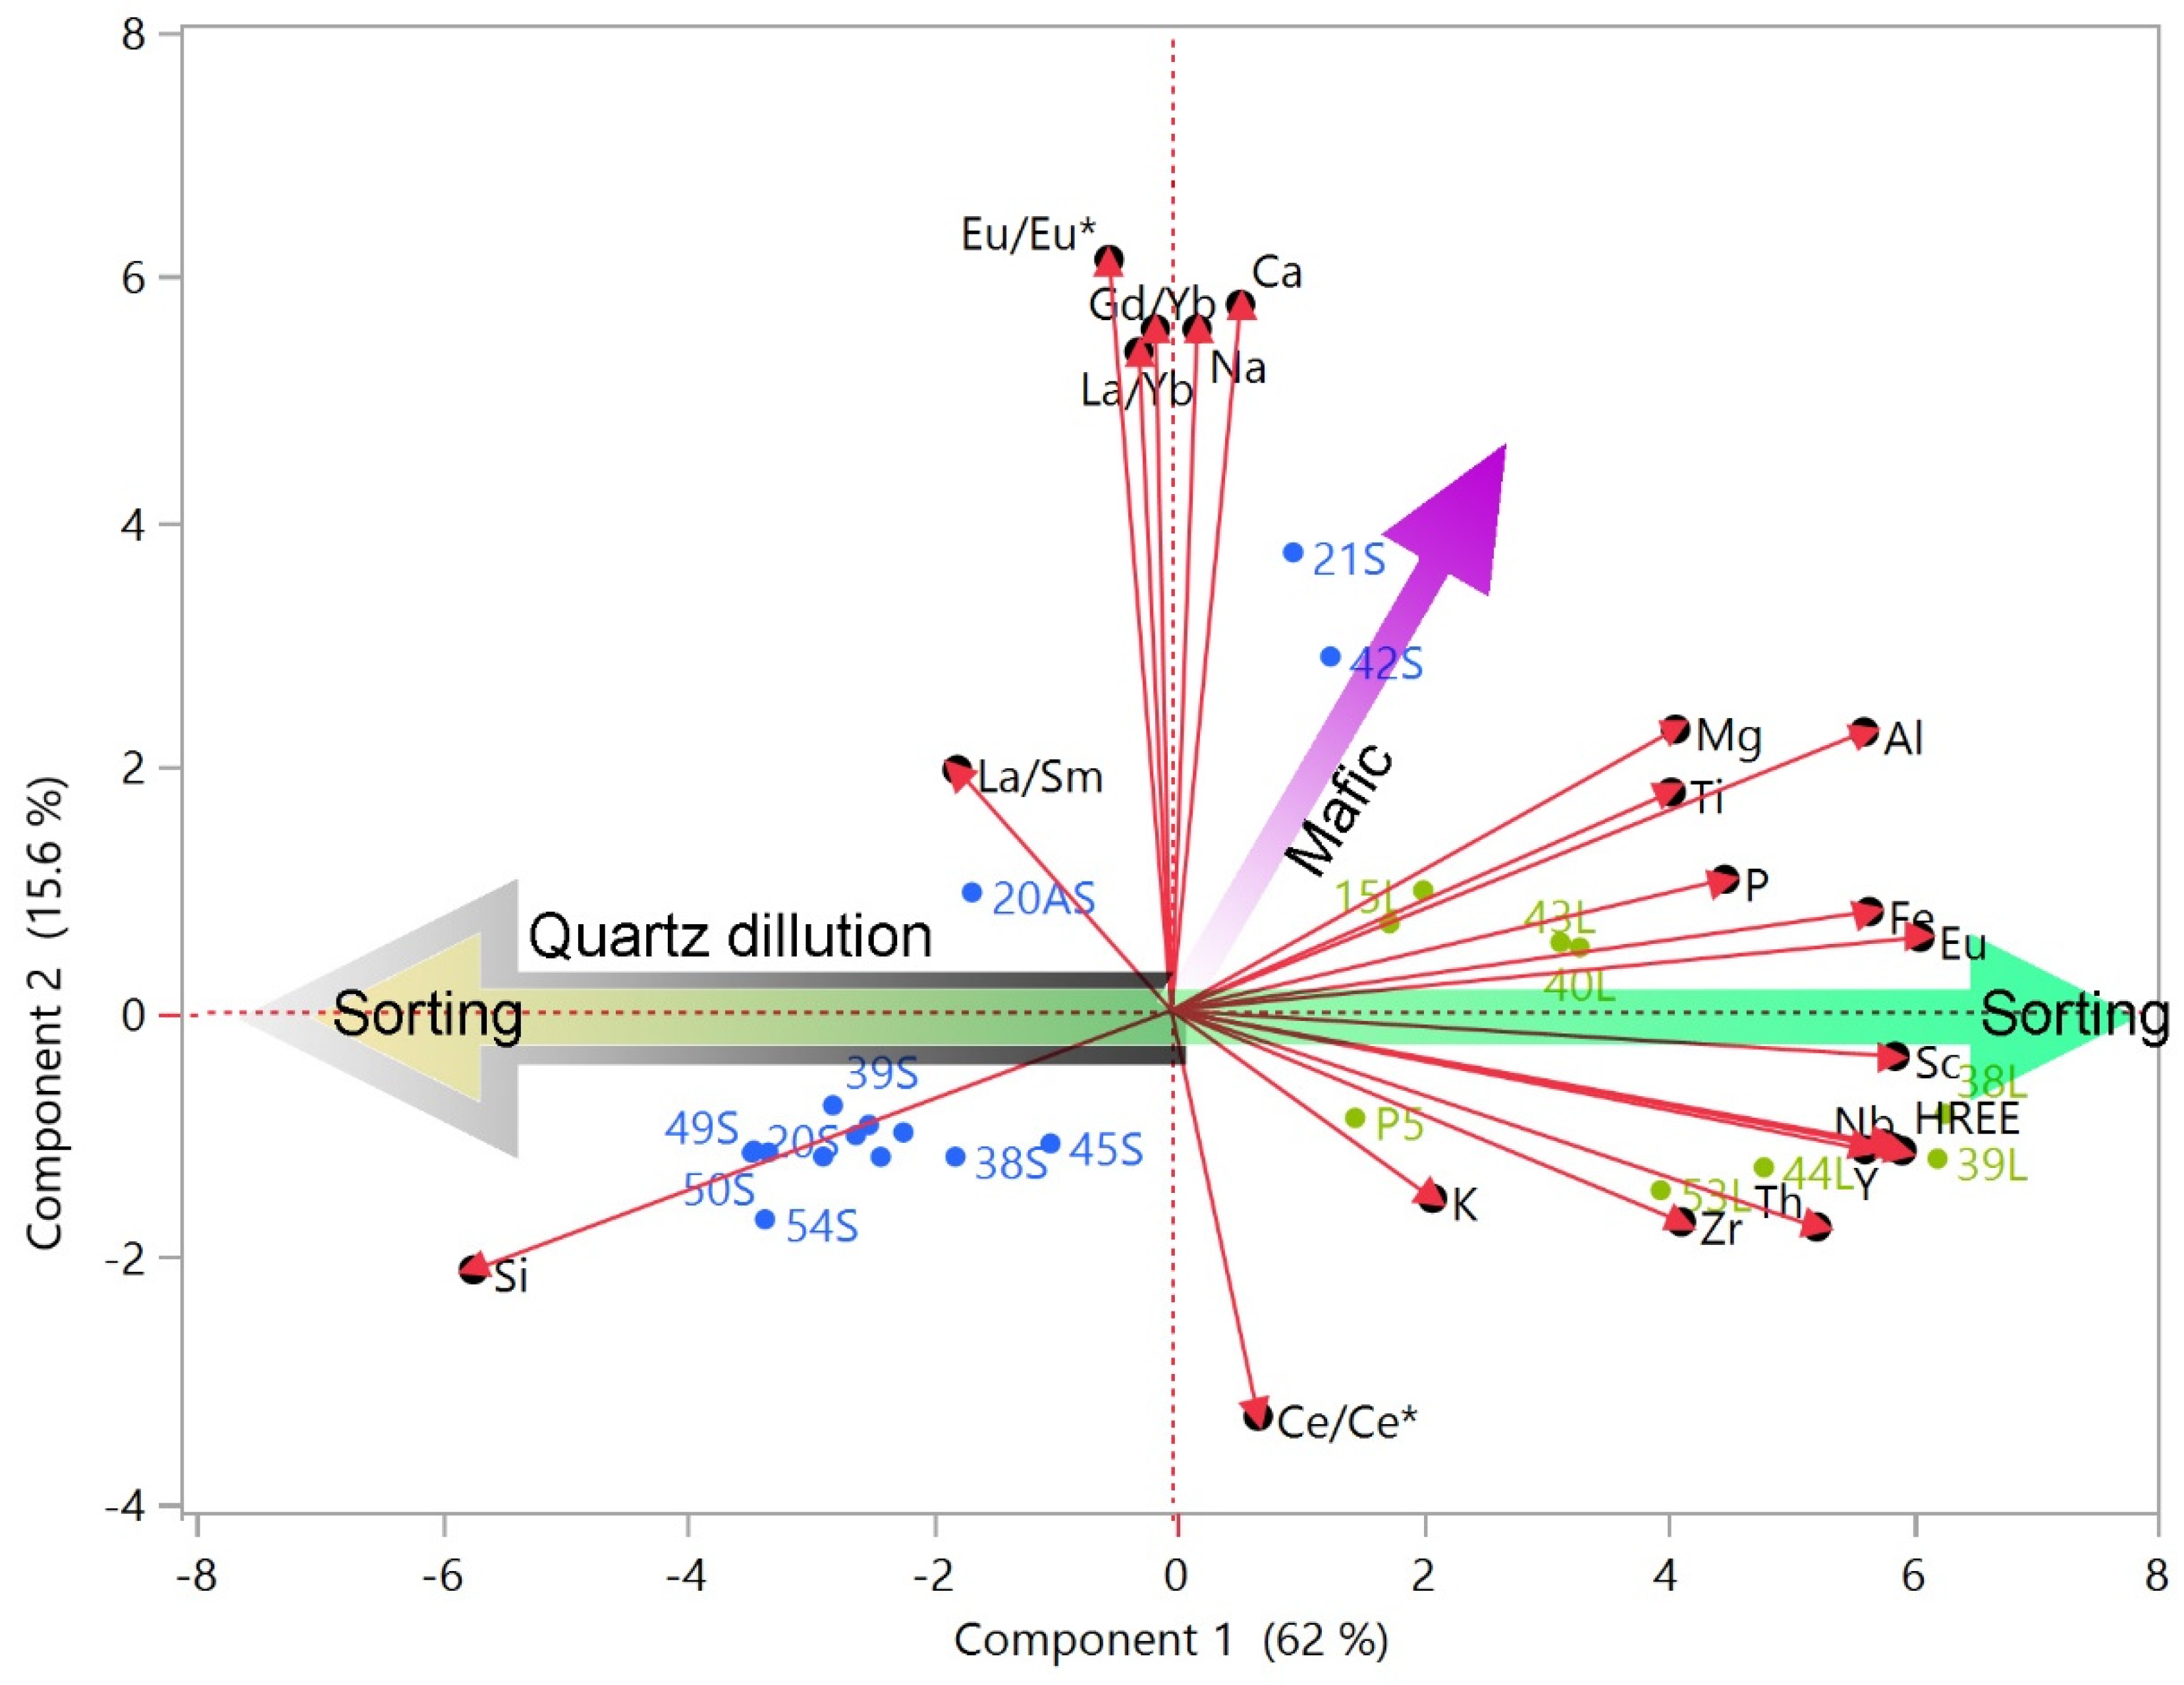
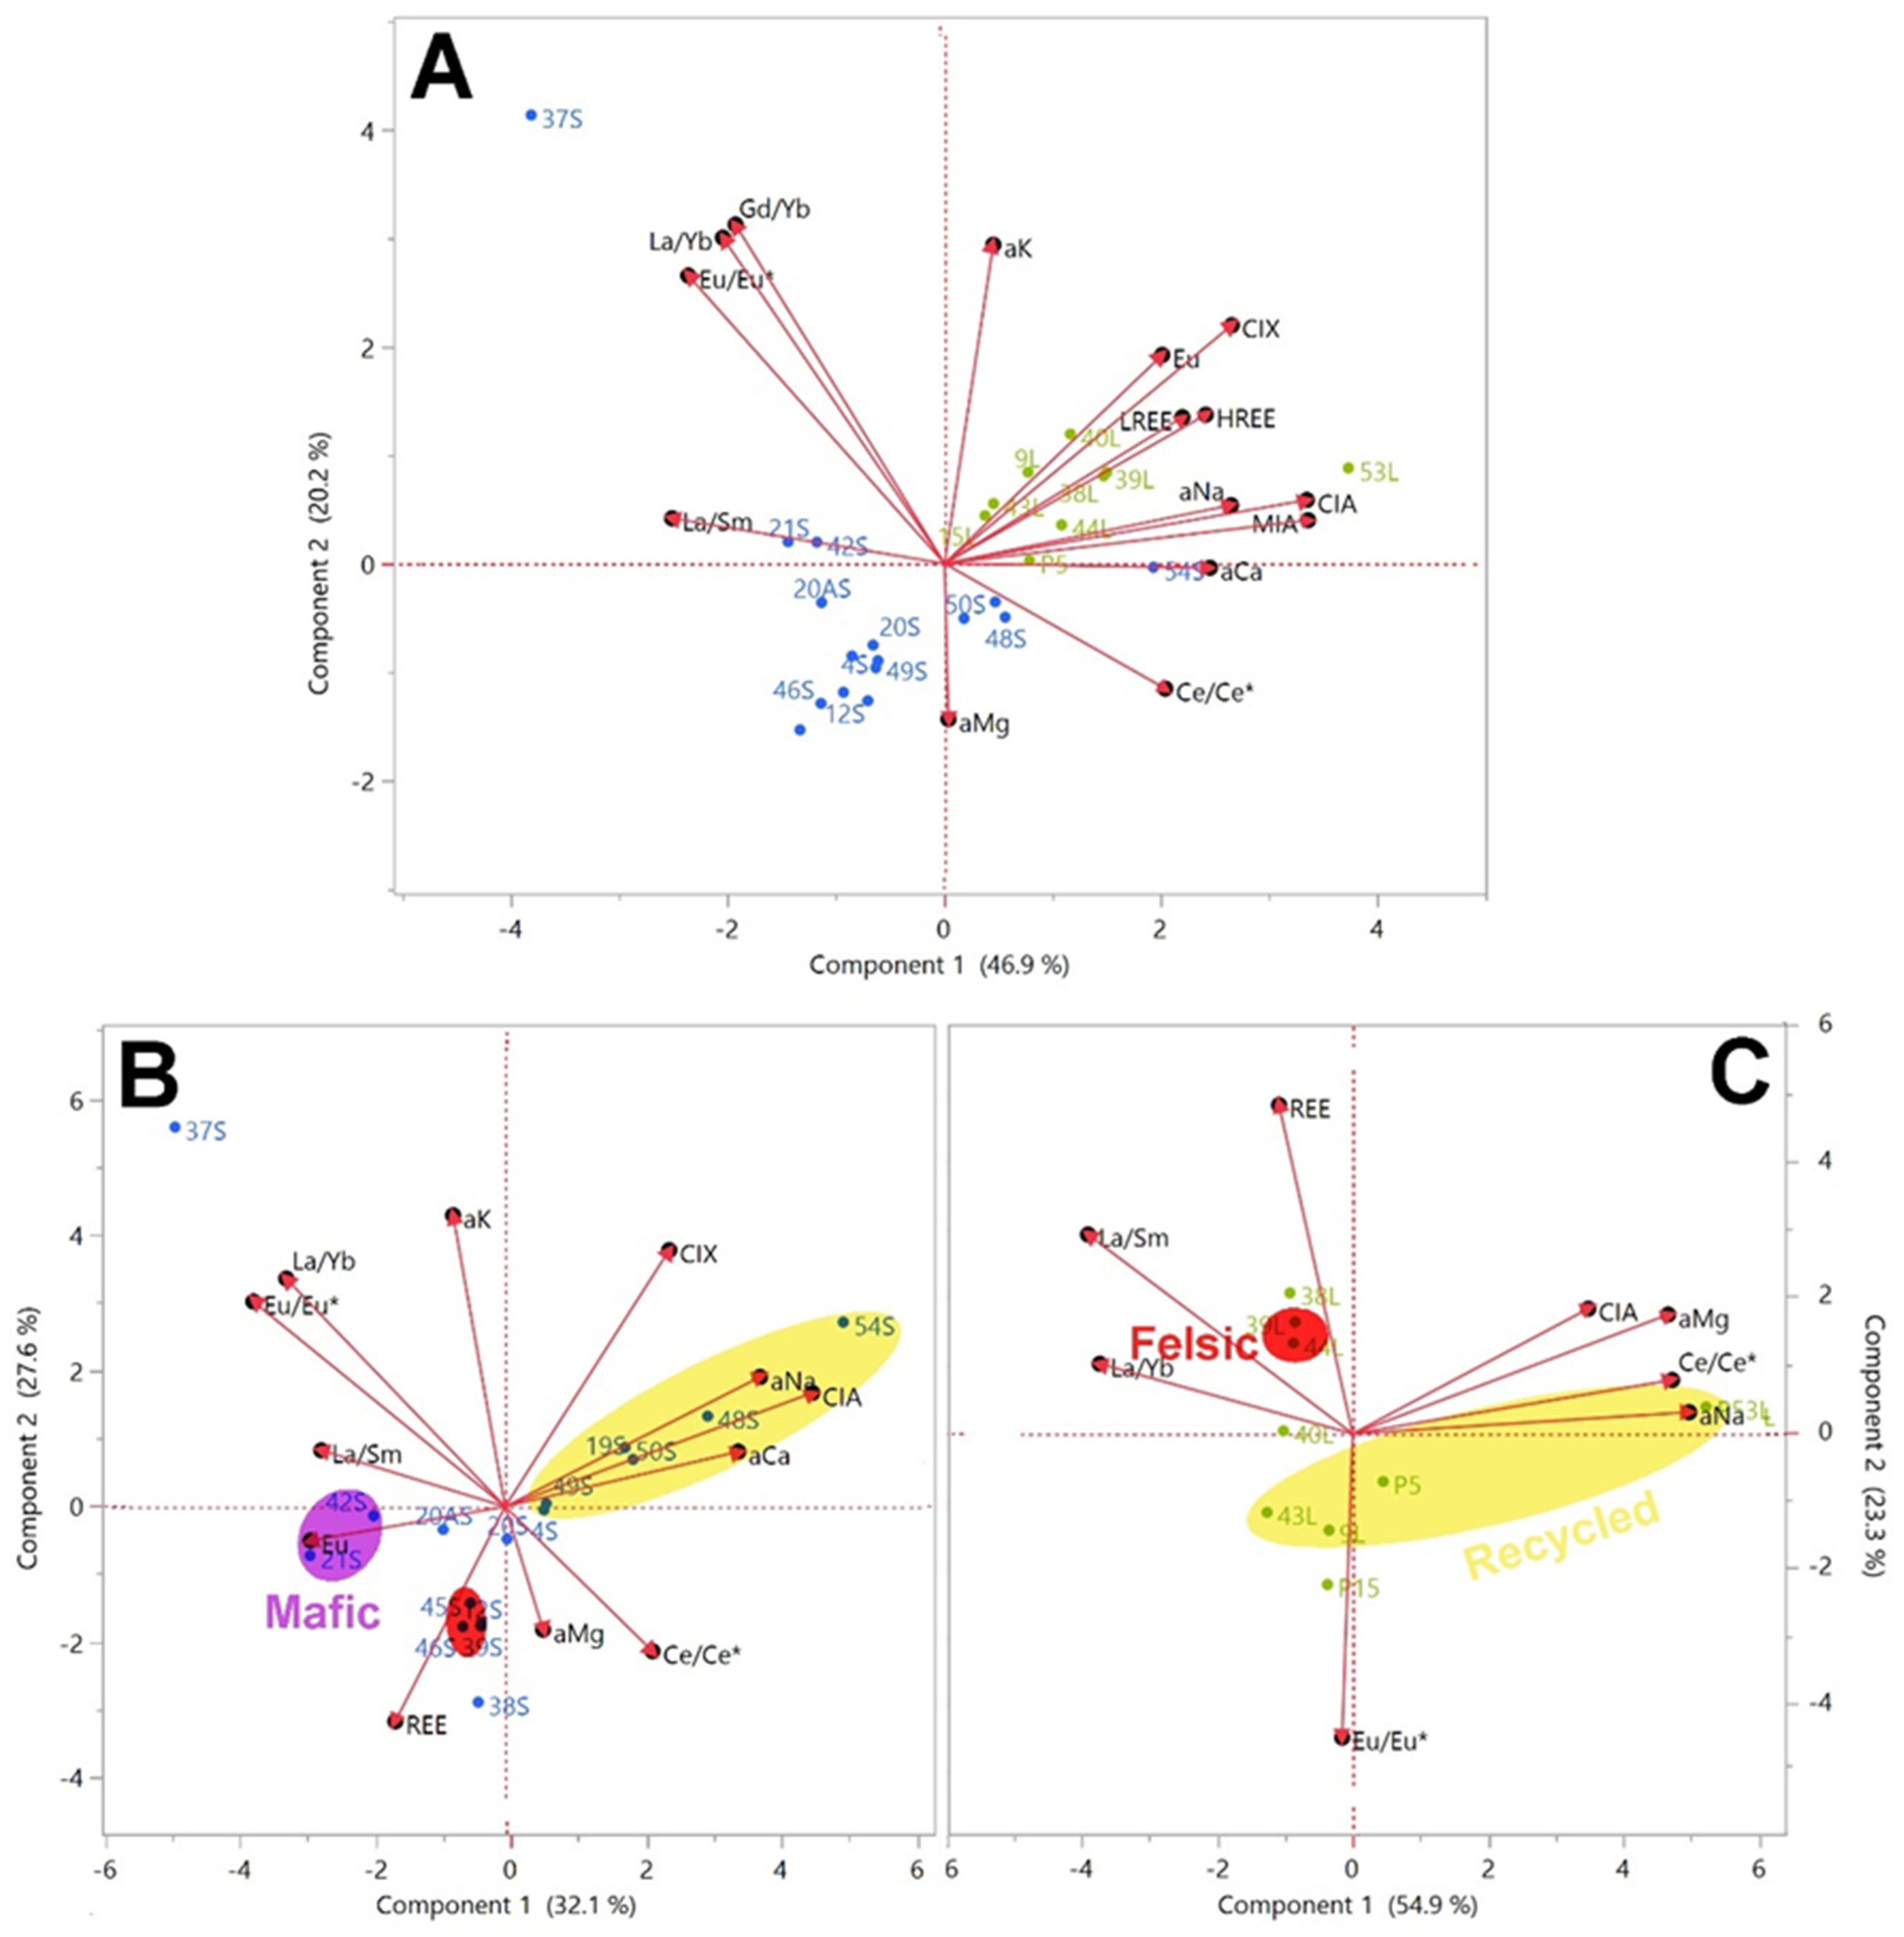
5. Discussion
5.1. Fingerprints of Primary Sources
5.2. Influence of Sediment Cycling on REE Geochemistry
5.2.1. Weathering
5.2.2. Sorting
5.2.3. Effect of Multiple Depositional Cycles
6. Conclusions
Supplementary Materials
Author Contributions
Funding
Data Availability Statement
Acknowledgments
Conflicts of Interest
References
- Balaram, V. Rare earth elements: A review of applications, occurrence, exploration, analysis, recycling, and environmental impact. Geosci. Front. 2019, 10, 1285–1303. [Google Scholar] [CrossRef]
- Dushyantha, N.; Batapola, N.; Ilankoon, I.M.S.K.; Rohitha, S.; Premasiri, R.; Abeysinghe, B.; Dissanayake, K. The story of rare earth elements (REEs): Occurrences, global distribution, genesis, geology, mineralogy and global production. Ore Geol. Rev. 2020, 122, 103521. [Google Scholar] [CrossRef]
- Zhou, B. Global potential of rare earth resources and rare earth demand from clean technologies. Minerals 2017, 7, 203. [Google Scholar] [CrossRef] [Green Version]
- McLennan, S.M. Rare Earth Elements in Sedimentary Rocks: Influence of Provenance and Sedimentary Processes. In Geochemistry and Mineralogy of Rare Earth Elements; Lipinand, B.R., McKay, G.A., Eds.; Mineralogical Society of America: Chantilly, VA, USA, 1989; pp. 169–200. [Google Scholar]
- Singh, P.; Rajamani, V. REE geochemistry of recent clastic sediments from the Kaveri floodplains, southern India: Implication to source area weathering and sedimentary processes. Geochim. Cosmochim. Acta. 2001, 65, 3093–3108. [Google Scholar] [CrossRef]
- Munksgaard, N.C.; Lim, K.; Parry, D.L. Rare earth elements as provenance indicators in North Australian estuarine and coastal marine sediments. Estuar. Coast. Shelf Sci. 2003, 57, 399–409. [Google Scholar] [CrossRef]
- Ferrat, M.; Weiss, D.J.; Strekopytov, S.; Dong, S.; Chen, H.; Najorka, J.; Sinha, R. Improved provenance tracing of Asian dust sources using rare earth elements and selected trace elements for palaeomonsoon studies on the eastern Tibetan Plateau. Geochim. Cosmochim. Acta 2011, 75, 6374–6399. [Google Scholar] [CrossRef]
- Blake, J.M.; Peters, S.C.; Johannesson, K.H. Application of REE geochemical signatures for Mesozoic sediment provenance to the Gettysburg Basin, Pennsylvania. Sediment. Geol. 2017, 349, 103–111. [Google Scholar] [CrossRef]
- Wang, L.; Han, X.; Ding, S.; Liang, T.; Zhang, Y.; Xiao, J.; Zhang, H. Combining multiple methods for provenance discrimination based on rare earth element geochemistry in lake sediment. Sci. Total Environ. 2019, 672, 264–274. [Google Scholar] [CrossRef]
- Condie, K.C.; Dengate, J.; Cullers, R.L. Behavior of rare earth elements in a paleoweathering profile on granodiorite in the Front Range, Colorado, USA. Geochim. Cosmochim. Acta 1995, 59, 279–294. [Google Scholar] [CrossRef]
- Morey, G.B.; Setterholm, D.R. Rare earth elements in weathering profiles and sediments of Minnesota; Implications for provenance studies. Sediment. Res. 1997, 67, 105–115. [Google Scholar]
- Ahmad, M.Z.; Singh, P. Implication of weathering and mineral sorting on rare earth element geochemistry of Pleistocene–Holocene sediments from Cauvery delta, south India. Earth Syst. Sci. 2020, 129, 1–22. [Google Scholar] [CrossRef]
- Aubert, D.; Stille, P.; Probst, A.A. REE fractionation during granite weathering and removal by waters and suspended loads: Sr and Nd isotopic evidence. Geochim. Cosmochim. Acta 2021, 65, 387–406. [Google Scholar] [CrossRef] [Green Version]
- Su, N.; Yang, S.; Guo, Y.; Yue, W.; Wang, X.; Yin, P.; Huang, X. Revisit of rare earth element fractionation during chemical weathering and river sediment transport. Geochem. Geophys. Geosyst. 2017, 18, 935–955. [Google Scholar] [CrossRef]
- Ma, J.L.; Wei, G.J.; Xu, Y.F.; Long, W.G.; Sun, W.D. Mobilization and re-distribution of major and trace elements during extreme weathering of basalt in Hainan Island, South China. Geochim. Cosmochim. Acta 2007, 71, 3223–3237. [Google Scholar] [CrossRef]
- Yusoff, Z.M.; Ngwenya, B.T.; Parson, I. Mobility and fractionation of REEs during deep weathering of geochemically contrasting granites in a tropical setting, Malaysia. Chem. Geol. 2013, 349–350, 71–86. [Google Scholar] [CrossRef]
- Wu, K.; Liu, S.; Kandasamy, S.; Jin, A.; Lou, Z.; Li, J.; Shi, X. Grain-size effect on rare earth elements in Pahang River and Kelantan River, Peninsular Malaysia: Implications for sediment provenance in the southern South China Sea. Conti. Shelf Res. 2019, 189, 103977. [Google Scholar] [CrossRef]
- Dinis, P.; Garzanti, E.; Vermeesch, P.; Huvi, J. Climatic zonation and weathering control on sediment composition. Angola Chem. Geol. 2017, 467, 110–121. [Google Scholar] [CrossRef] [Green Version]
- Guo, Y.; Yang, S.; Su, N.; Li, C.; Yin, P.; Wang, Z. Revisiting the effects of hydrodynamic sorting and sedimentary recycling on chemical weathering indices. Geoch. Cosmoch. Acta 2018, 227, 48–63. [Google Scholar] [CrossRef]
- Xu, Z.; Lim, D.; Choi, J.; Yang, S.; Jung, H. Rare earth elements in bottom sediments of major rivers around the Yellow Sea: Implications for sediment provenance. Geo-Mar. Lett. 2009, 29, 291–300. [Google Scholar] [CrossRef]
- Xu, F.; Hu, B.; Dou, Y.; Liu, X.; Wan, S.; Xu, Z.; Li, A. Sediment provenance and paleoenvironmental changes in the northwestern shelf mud area of the South China Sea since the mid-Holocene. Contin. Shelf Res. 2017, 144, 21–30. [Google Scholar] [CrossRef]
- Araújo, A.G.; Guimarâes, F.; Perevalov, O.V.; Voinovsky, A.S.; Tselikovosky, A.F.; Agueev, Y.L.; Polskoi, F.R.; Khodirev, V.L.; Kondrátiev, A.I. Geologia de Angola—Notícia Explicativa da Carta Geológica de Angola à escala de 1:1,000,000. Serv. Geológ. Ang. 1992. Available online: https://www.worldcat.org/title/geologia-de-angola-noticia-explicativa-da-carta-geologica-a-escala-11000000/oclc/71310190 (accessed on 26 March 2021). (In Portuguese).
- Correia, H. O Grupo da Chela e Formação da Leba como novas unidades litoestratigráficas resultantes da redefinição da Formação da Chela na região do Planalto da Humpata. Sudoeste de Angola. Bol. Soc. Geol. Port. 1976, 20, 65–130. [Google Scholar]
- Pereira, E.; Tassinari, C.C.; Rodrigues, J.F.; Van-Dúnem, M.V. New data on the deposition age of the volcano-sedimentary Chela Group and its Eburnean basement: Implications to post-Eburnean crustal evolution of the SW of Angola. Comun.Geol. 2011, 98, 29–40. [Google Scholar]
- Ernest, R.E.; Pereira, E.; Hamilton, M.A.; Pisarevsky, S.A.; Rodriques, J.; Tassinari, C.C.; Van-Dunem, V. Mesoproterozoic intraplate magmatic ‘barcode’ record of the Angola portion of the Congo Craton: Newly dated magmatic events at 1505 and 1110 Ma and implications for Nuna (Columbia) supercontinent reconstructions. Precamb. Res. 2013, 230, 103–118. [Google Scholar] [CrossRef] [Green Version]
- Carvalho, H. Estratigrafia do Precâmbrico de Angola. Garcia Orta 1984, 7, 1–66. [Google Scholar]
- Carvalho, H.; Tassinari, C.; Alves, P.; Guimarães, F.; Simões, M. Geochronological review of the Precambrian in Western Angola: Links with Brazil. Afr. Earth Sc. 2000, 31, 383–402. [Google Scholar] [CrossRef]
- Morais, E.; Sinigoi, S.; Mayer, A.; Mucana, A.; Rufino Neto, J. The Kunene gabbroanorthosite complex: Preliminary results based on the new field and chemical data. Afr. Geosc. Rev. 1998, 5, 485–498. [Google Scholar]
- Mayer, A.; Hofmann, A.W.; Sinigoi, S.; Morais, E. Mesoproterozoic Sm–Nd and U–Pb ages for the Kunene anorthosite complex of SW Angola. Precamb. Res. 2004, 133, 187–206. [Google Scholar] [CrossRef]
- Drüppel, K.; Littmann, S.; Romer, R.L.; Okrusch, M. Petrology and isotopic geochemistry of the Mesoproterozoic anorthosite and related rocks of the Kunene Intrusive Complex, NW Namibia. Precamb. Res. 2007, 156, 1–31. [Google Scholar] [CrossRef] [Green Version]
- Haddon, I.G.; McCarthy, T.S. The mesozoic–cenozoic interior sag basins of central Africa: The late-cretaceous–cenozoic Kalahari and okavango basins. J. Afr. Earth Sci. 2005, 43, 316–333. [Google Scholar] [CrossRef]
- Huntley, B.J. Angola in Outline: Physiography, Climate and Patterns of Biodiversity. In Biodiversity of Angola; Huntley, B., Russo, V., Lages, F., Ferrand, N., Eds.; Springer: Cham, Switzerland, 2019; pp. 15–42. [Google Scholar]
- Dieppois, B.; Rouault, M.; New, M. The impact of ENSO on Southern African rainfall in CMIP5 ocean atmosphere coupled climate models. Clim. Dynam. 2015, 45, 2425–2442. [Google Scholar] [CrossRef] [Green Version]
- Crétat, J.; Pohl, B.; Dieppois, B.; Berthou, S.; Pergaud, J. The Angola Low: Relationship with southern African rainfall and ENSO. Clim. Dynam. 2019, 52, 1783–1803. [Google Scholar] [CrossRef]
- Cook, C.; Reason, J.C.; Hewitson, B.C. Wet and dry spells within particularly wet and dry summers in the South African summer rainfall region. Clim. Res. 2004, 26, 17–31. [Google Scholar] [CrossRef] [Green Version]
- Rudnick, R.L.; Gao, S. Composition of the Continental Crust. In Treatise on Geochemistry: The Crust; Rudnick, R.L., Holland, H.D., Turekian, K.K., Eds.; Elsevier: Oxford, UK, 2003; pp. 1–64. [Google Scholar]
- Hu, Z.; Gao, S. Upper crustal abundances of trace elements: A revision and update. Chem. Geol. 2008, 253, 205–221. [Google Scholar] [CrossRef]
- McDonough, W.F.; Sun, S.S. The composition of the Earth. Chem. Geol. 1995, 120, 223–253. [Google Scholar] [CrossRef]
- Roser, B.P.; Korsch, R.J. Provenance signatures of sandstone-mudstone suites determined using discriminant function analysis of major-element data. Chem. Geol. 1988, 67, 119–139. [Google Scholar] [CrossRef]
- McLennan, S.M.; Hemming, S.; McDaniel, D.K.; Hanson, G.N. Geochemical approaches to sedimentation, provenance, and tectonics. Spec.Papers-Geol. Soc. Am. 1993, 21. [Google Scholar] [CrossRef]
- Dinis, P.A.; Oliveira, Á.; Rocha, F.; Vieira, M.; Cunha, P.P. Evolution in the provenance of a tectonically controlled Plio–Pleistocene alluvial system between the Variscan Iberian Massif and the Atlantic margin. Portugal. Chem. Erde-Geochem. 2011, 71, 267–278. [Google Scholar] [CrossRef]
- Bayon, G.; Toucanne, S.; Skonieczny, C.; André, L.; Bermell, S.; Cheron, S.; Barrat, J.A. Rare earth elements and neodymium isotopes in world river sediments revisited. Geochim. Cosmochim. Acta 2015, 170, 17–38. [Google Scholar] [CrossRef] [Green Version]
- Perri, F.; Caracciolo, L.; Cavalcante, F.; Corrado, S.; Critelli, S.; Muto, F.; Dominici, R. Sedimentary and thermal evolution of the Eocene-Oligocene mudrocks from the southwestern Thrace Basin (NE Greece). Basin Res. 2016, 28, 319–339. [Google Scholar] [CrossRef]
- Dinis, P.; Oliveira, Á. Provenance of Pliocene clay deposits from the Iberian Atlantic Margin and compositional changes during recycling. Sediment. Geol. 2016, 336, 171–182. [Google Scholar] [CrossRef]
- Kumar, M.; Goswami, R.; Awasthi, N.; Das, R. Provenance and fate of trace and rare earth elements in the sediment-aquifers systems of Majuli River Island, India. Chemosphere 2019, 237, 124477. [Google Scholar] [CrossRef]
- Nesbitt, H.W. Mobility and fractionation of rare earth elements during weathering of a granodiorite. Nature 1979, 279, 206–210. [Google Scholar] [CrossRef]
- Duddy, L.R. Redistribution and fractionation of rare-earth and other elements in a weathering profile. Chem. Geol. 1980, 30, 363–381. [Google Scholar] [CrossRef]
- Duzgoren-Aydin, N.S.; Aydin, A.; Malpas, J. Re-assessment of chemical weathering indices: Case study on pyroclastic rocks of Hong Kong. Eng. Geol. 2002, 63, 99–119. [Google Scholar] [CrossRef]
- Price, J.R.; Velbel, M.A. Chemical weathering indices applied to weathering profiles developed on heterogeneous felsic metamorphic parent rocks. Chem. Geol. 2003, 202, 397–416. [Google Scholar] [CrossRef]
- Dinis, P.A.; Garzanti, E.; Hahn, A.; Vermeesch, P.; Pinto, M.C. Weathering indices as climate proxies. A step forward based on Congo and SW African river muds. Earth Sci. Rev. 2020, 201, 103039. [Google Scholar] [CrossRef]
- Nesbitt, H.W.; Young, G.M. Early Proterozoic climates and plate motions inferred from major element chemistry of lutites. Nature 1982, 299, 715–717. [Google Scholar] [CrossRef]
- Garzanti, E.; Padoan, M.; Setti, M.; L’opez-Galindo, A.; Villa, I.M. Provenance versus weathering control on the composition of tropical river mud (Southern Africa). Chem. Geol. 2014, 366, 61–74. [Google Scholar] [CrossRef]
- Babechuk, M.G.; Widdowson, M.; Kamber, B.S. Quantifying chemical weathering intensity and trace element release from two contrasting basalt profiles, Deccan Traps, India. Chem. Geol. 2014, 363, 56–75. [Google Scholar] [CrossRef]
- Garzanti, E.; Padoan, M.; Setti, M.; Peruta, L.; Najman, Y.; Villa, I.M. Weathering geochemistry and Sr-Nd isotope fingerprints of equatorial upper Nile and Congo muds. Geochem. Geophys. Geosyst. 2013, 14, 292–316. [Google Scholar] [CrossRef] [Green Version]
- Parker, A. An index of weathering for silicate rocks. Geol. Mag. 1970, 107, 501–504. [Google Scholar] [CrossRef]
- Garzanti, E.; Resentini, A. Provenance control on chemical indices of weathering (Taiwan river sands). Sediment. Geol. 2016, 336, 81–95. [Google Scholar] [CrossRef]
- Laveuf, C.; Cornu, S. A review on the potentiality of rare earth elements to trace pedogenetic processes. Geoderma 2009, 154, 1–12. [Google Scholar] [CrossRef]
- Davranche, M.; Pourret, O.; Gruau, G.; Dia, A.; Jin, D.; Gaertner, D. Competitive binding of REE to humic acid and manganese oxide: Impact of reaction kinetics on development of cerium anomaly and REE adsorption. Chem. Geol. 2008, 247, 154–170. [Google Scholar] [CrossRef]
- Li, M.Y.H.; Zhou, M.F.; Williams-Jones, A.E. Controls on the dynamics of Rare Earth Elements during subtropical hillslope processes and formation of regolith-hosted deposits. Econ. Geol. 2020, 115, 1097–1118. [Google Scholar] [CrossRef]
- Gao, S.; Wedepohl, K.H. The negative Eu anomaly in Archean sedimentary rocks: Implications for decomposition age and importance of their granitic sources. Earth Planet. Sci. Lett. 1995, 133, 81–94. [Google Scholar] [CrossRef]
- González-Álvarez, I.; Kerrich, R. Weathering intensity in the Mesoproterozoic and modern large-river systems: A comparative study in the Belt-Purcell Supergroup. Canada and USA. Precamb. Res. 2012, 208–211, 174–196. [Google Scholar] [CrossRef]
- Garzanti, E.; Andò, S.; France-Lanord, C.; Vezzoli, G.; Censi, P.; Galy, V.; Najman, Y. Mineralogical and chemical variability of fluvial sediments: 1. Bedload sand (Ganga–Brahmaputra, Bangladesh). Earth Planet. Sci. Lett. 2010, 299, 368–381. [Google Scholar] [CrossRef]
- Garzanti, E.; Andó, S.; France-Lanord, C.; Censi, P.; Vignola, P.; Galy, V.; Lupker, M. Mineralogical and chemical variability of fluvial sediments 2. Suspended-load silt (Ganga–Brahmaputra, Bangladesh). Earth Planet. Sci. Lett. 2011, 302, 107–120. [Google Scholar] [CrossRef]
- Vital, H.; Stattegger, K. Major and trace elements of stream sediments from the lowermost Amazon River. Chem. Geol. 2000, 168, 151–168. [Google Scholar] [CrossRef]
- Yang, S.Y.; Jung, H.S.; Choi, M.S.; Li, C.X. The rare earth element compositions of the Changjiang (Yangtze) and Huanghe (Yellow) river sediments. Earth Planet. Sci. Lett. 2002, 201, 407–419. [Google Scholar] [CrossRef]
- He, M.; Zheng, H.; Clift, P.D.; Tada, R.; Wu, W.; Luo, C. Geochemistry of fine-grained sediments in the Yangtze River and the implications for provenance and chemical weathering in East Asia. Prog. Earth Planet. Sci. 2015, 2, 1–20. [Google Scholar] [CrossRef] [Green Version]
- Cullers, R.L.; Chaudhuri, S.; Arnold, B.; Lee, M.; Wolf, C.W., Jr. Rare earth distributions in clay minerals and the clay-sized fraction of the Lower Permian Havensville and Eskridge shales of Kansas and Oklahoma. Geochim. Cosmochim. Acta 1975, 39, 1691–1703. [Google Scholar] [CrossRef]
- Condie, K.C. Another look at rare earth elements in shales. Geochim. Cosmochim. Acta 1991, 55, 2527–2531. [Google Scholar] [CrossRef]
- Turowski, J.M.; Rickenmann, D.; Dadson, S.J. The partitioning of the total sediment load of a river into suspended load and bedload: A review of empirical data. Sedimentology 2019, 57, 1126–1146. [Google Scholar] [CrossRef]
- Garzanti, E.; Vermeesch, P.; Vezzoli, G.; Andò, S.; Botti, E.; Limonta, M.; Dinis, P.; Hahn, A.; Baudet, D.; De Grave, J.; et al. Congo River sand and the equatorial quartz factory. Earth Sci. Rev. 2019, 197, 102918. [Google Scholar] [CrossRef] [Green Version]
- He, J.; Garzanti, E.; Dinis, P.; Yang, S.; Wang, H. Provenance versus weathering control on sediment composition in tropical monsoonal climate (South China)-1. Geochemistry and clay mineralogy. Chem. Geol. 2020, 558, 119860. [Google Scholar] [CrossRef]


| Sample | Source Type | Felsic | Mafic | Sedim. | Meta-Sed | Quartz | KF | Plagioc | Phyllos | Others |
|---|---|---|---|---|---|---|---|---|---|---|
| Sands | ||||||||||
| 38S | Felsic | 78.4 | 1.6 | 20.0 | 40 | 42 | 9 | 6 | 2 | |
| 39S | Felsic | 64.8 | 0.8 | 34.4 | 89 | 0 | 6 | 4 | 1 | |
| 45S | Felsic | 77.5 | 22.5 | 91 | 0 | 0 | 7 | 2 | ||
| 46S | Felsic | 89.5 | 1.1 | 9.4 | 63 | 17 | 6 | 8 | 6 | |
| 21S | Mafic | 13.2 | 86.8 | 47 | 23 | 21 | 0 | 10 | ||
| 42S | Mafic | 32.7 | 66.5 | 0.2 | 0.7 | 34 | 16 | 47 | 1 | 3 |
| 20S | Cunene | 14 | 4 | 63 | 18 | 84 | 0 | 5 | 0 | 11 |
| 12S | Mixed | 13.1 | 15.0 | 68.3 | 3.7 | 77 | 15 | 2 | 3 | 3 |
| 20aS | Mixed | 47.5 | 31.9 | 7.7 | 12.9 | 56 | 31 | 7 | 4 | 2 |
| 37S | Mixed | 41.7 | 40.3 | 7.8 | 10.2 | 14 | 26 | 51 | 7 | 2 |
| 4S | Recycled | 100 | 100 | 0 | 0 | 0 | 0 | |||
| 19S | Recycled | 4.5 | 99.5 | 96 | 0 | 0 | 3 | 2 | ||
| 48S | Recycled | 100.0 | 93 | 0 | 4 | 3 | 0 | |||
| 49S | Recycled | 100.0 | 96 | 3 | 0 | 0 | 1 | |||
| 50S | Recycled | 100.0 | 92 | 0 | 0 | 5 | 3 | |||
| 54S | Recycled | 100.0 | 97 | 0 | 0 | 2 | 1 | |||
| Muds | ||||||||||
| 38L | Felsic | 78.4 | 1.6 | 20.0 | 19 | 18 | 15 | 45 | 4 | |
| 39L | Felsic | 64.8 | 0.8 | 34.4 | 34 | 24 | 5 | 29 | 7 | |
| 44L | Felsic | 77.5 | 22.5 | 31 | 39 | 5 | 23 | 1 | ||
| 15L | Mixed | 36.0 | 41.2 | 13.9 | 8.9 | 38 | 0 | 36 | 26 | 0 |
| 40L | Mixed | 30.1 | 39.9 | 35 | 24 | 5 | 29 | 7 | ||
| 5L | Recycled | 100.0 | 43 | 0 | 0 | 57 | 0 | |||
| 9L | Recycled | 100.0 | 33 | 19 | 13 | 33 | 2 | |||
| 43L | Recycled | 100.0 | 35 | 14 | 0 | 38 | 14 | |||
| 53L | Recycled | 100.0 | 73 | 2 | 0 | 24 | 0 | |||
| Source | SiO2 | Al2O3 | MgO | CaO | Na2O | K2O | La | Ce | Pr | Nd | Sm | Eu | Gd | Tb | Dy | Ho | Er | Tm | Yb | Lu | |
|---|---|---|---|---|---|---|---|---|---|---|---|---|---|---|---|---|---|---|---|---|---|
| Muds | |||||||||||||||||||||
| 39L | Fels | 52.5 | 23.57 | 0.56 | 0.39 | 0.44 | 3.39 | 120.5 | 257.9 | 28.07 | 101 | 16.06 | 2.88 | 13.27 | 1.9 | 10.48 | 2.19 | 5.94 | 0.94 | 6.31 | 0.97 |
| 44L | Fels | 57.3 | 21.79 | 0.48 | 0.18 | 0.22 | 3.87 | 92.1 | 183.1 | 18.63 | 64.5 | 10.47 | 1.87 | 8.82 | 1.27 | 7.32 | 1.58 | 4.83 | 0.77 | 5.35 | 0.91 |
| P15 | Mix | 51.47 | 20.27 | 1.35 | 2.57 | 0.89 | 0.78 | 30.1 | 67.8 | 7.15 | 27 | 5.18 | 1.65 | 4.52 | 0.65 | 3.88 | 0.75 | 2.17 | 0.3 | 2.02 | 0.3 |
| 38L | Fels | 48.16 | 25.47 | 0.78 | 0.63 | 0.63 | 2.93 | 133 | 286.5 | 29.96 | 104.7 | 16.91 | 2.65 | 13.32 | 2.01 | 11.42 | 2.31 | 7.25 | 1.09 | 7.4 | 1.17 |
| 40L | Mix | 47.06 | 25.43 | 0.66 | 0.81 | 0.31 | 0.91 | 70.9 | 147.1 | 16.91 | 60.2 | 9.66 | 2.7 | 8.2 | 1.1 | 5.86 | 1.11 | 3.26 | 0.47 | 2.8 | 0.44 |
| P5 | Rec | 65.92 | 13.14 | 0.89 | 0.63 | 0.11 | 1.46 | 35.4 | 85.1 | 8.54 | 30.1 | 5.88 | 1.24 | 4.98 | 0.76 | 4.36 | 0.89 | 2.68 | 0.41 | 2.7 | 0.42 |
| 9L | Rec | 47.41 | 23.06 | 1.24 | 1.38 | 0.25 | 0.61 | 33.4 | 67.2 | 7.94 | 28.9 | 5.56 | 1.57 | 4.71 | 0.64 | 3.73 | 0.74 | 2.1 | 0.29 | 1.9 | 0.27 |
| 43L | Rec | 50.48 | 18.48 | 1.5 | 3.18 | 0.12 | 2.18 | 55.1 | 101.6 | 13.95 | 51.1 | 9.46 | 2.21 | 8.33 | 1.22 | 6.8 | 1.35 | 3.86 | 0.53 | 3.25 | 0.53 |
| P53L | Rec | 52.1 | 22.96 | 0.15 | 0.09 | 0.03 | 0.47 | 44 | 139.8 | 13.7 | 52.4 | 11.48 | 2.41 | 8.88 | 1.34 | 7.73 | 1.52 | 4.32 | 0.65 | 4.4 | 0.67 |
| Sands | |||||||||||||||||||||
| 20S | Cun | 92.62 | 2.95 | 0.11 | 0.23 | 0.15 | 0.84 | 9.7 | 18.6 | 1.99 | 7.2 | 1.28 | 0.25 | 1.14 | 0.18 | 1.14 | 0.22 | 0.8 | 0.12 | 0.9 | 0.12 |
| 12S | Mix | 91.62 | 3.74 | 0.03 | 0.15 | 0.24 | 1.84 | 13.2 | 27.1 | 2.8 | 9.8 | 1.63 | 0.24 | 1.44 | 0.2 | 1.29 | 0.24 | 0.81 | 0.13 | 0.98 | 0.15 |
| 20aS | Mix | 83.81 | 7.81 | 0.15 | 2.48 | 1.33 | 0.88 | 7.6 | 15.8 | 1.78 | 7.1 | 1.32 | 0.65 | 1.06 | 0.15 | 0.88 | 0.16 | 0.47 | 0.06 | 0.45 | 0.07 |
| 37S | Mix | 64.62 | 20.26 | 0.55 | 8.29 | 3.12 | 0.29 | 3.6 | 4.6 | 0.61 | 2.1 | 0.31 | 0.46 | 0.39 | 0.04 | 0.25 | 0.05 | 0.13 | 0.005 | 0.025 | 0.01 |
| 38S | Mix | 82.27 | 8.68 | 0.1 | 0.29 | 0.97 | 4.56 | 16.8 | 51.5 | 3.77 | 13.2 | 2.09 | 0.4 | 1.78 | 0.24 | 1.42 | 0.32 | 1 | 0.15 | 0.9 | 0.16 |
| 39S | Fels | 89.48 | 5.11 | 0.02 | 0.06 | 0.36 | 3.44 | 7.3 | 13.7 | 1.41 | 5 | 0.77 | 0.19 | 0.75 | 0.13 | 0.91 | 0.19 | 0.58 | 0.1 | 0.57 | 0.1 |
| 45S | Fels | 84.59 | 7.42 | 0.1 | 0.08 | 0.31 | 3.84 | 21.1 | 36.7 | 4.15 | 14.4 | 2.36 | 0.41 | 1.9 | 0.29 | 1.82 | 0.38 | 1.32 | 0.2 | 1.37 | 0.28 |
| 46S | Fels | 89.25 | 5.15 | 0.04 | 0.21 | 0.54 | 2.81 | 9.6 | 20.6 | 2.01 | 7.2 | 1.16 | 0.29 | 1.04 | 0.2 | 1.38 | 0.33 | 1.04 | 0.15 | 0.96 | 0.15 |
| 21S | Mafic | 60.06 | 15.48 | 0.68 | 9.25 | 2.73 | 1.42 | 19.5 | 32.3 | 4.2 | 16.3 | 3.06 | 1.81 | 2.79 | 0.41 | 2.27 | 0.45 | 1.29 | 0.18 | 1.06 | 0.18 |
| 42S | Mafic | 65.42 | 15.35 | 0.65 | 5.45 | 2.65 | 0.99 | 12.9 | 26.7 | 2.86 | 11.1 | 2 | 1.32 | 1.73 | 0.23 | 1.26 | 0.25 | 0.77 | 0.12 | 0.64 | 0.14 |
| 4S | Rec | 97.25 | 0.85 | 0.03 | 0.04 | 0.03 | 0.28 | 3.2 | 5.7 | 0.56 | 2.1 | 0.42 | 0.07 | 0.42 | 0.06 | 0.42 | 0.09 | 0.28 | 0.04 | 0.38 | 0.05 |
| 19S | Fels | 92.38 | 2.79 | 0.08 | 0.03 | 0.02 | 0.45 | 11.9 | 22.9 | 2.58 | 9.1 | 1.53 | 0.32 | 1.38 | 0.24 | 1.49 | 0.31 | 0.93 | 0.15 | 1.1 | 0.17 |
| 48S | Rec | 94.94 | 1.74 | 0.03 | 0.04 | 0.005 | 0.31 | 5.2 | 9.5 | 1.21 | 4.4 | 0.88 | 0.17 | 0.72 | 0.12 | 0.82 | 0.17 | 0.57 | 0.08 | 0.64 | 0.11 |
| 49S | Rec | 97.36 | 0.86 | 0.02 | 0.03 | 0.02 | 0.31 | 2.4 | 4.2 | 0.49 | 1.7 | 0.3 | 0.05 | 0.3 | 0.06 | 0.38 | 0.09 | 0.26 | 0.05 | 0.42 | 0.07 |
| 50S | Rec | 96.16 | 1.13 | 0.04 | 0.05 | 0.01 | 0.16 | 4.2 | 9 | 0.82 | 3.1 | 0.54 | 0.12 | 0.53 | 0.07 | 0.52 | 0.11 | 0.35 | 0.05 | 0.41 | 0.07 |
| Parameter | Formula (Where Necessary); Response to Weathering | Reference |
|---|---|---|
| WIP (Weathering Index of Parker) | (CaO*/0.7 + 2Na2O/0.35 + 2K2O/0.25 + MgO/0.9) × 100 (1) | [55] |
| CIA (Chemical Index of Alteration) | Al2O3/(Al2O3 + K2O + CaO* + Na2O) × 100 (1) | [51] |
| αAlE | (Al/E)sample/(Al/E)UCC, with E a mobile element | [54] |
| MIA(o) (Mafic Index of Alteration, oxidative conditions) | (Al2O3 + Fe2O3) × 100/(Al2O3 + K2O + CaO* + Na2O + MgO) (1) | [53] |
| CIX (modified CIA) | Al2O3/(Al2O3 + K2O + Na2O) × 100 (1) | [52] |
Publisher’s Note: MDPI stays neutral with regard to jurisdictional claims in published maps and institutional affiliations. |
© 2021 by the authors. Licensee MDPI, Basel, Switzerland. This article is an open access article distributed under the terms and conditions of the Creative Commons Attribution (CC BY) license (https://creativecommons.org/licenses/by/4.0/).
Share and Cite
Cruz, A.; Dinis, P.A.; Gomes, A.; Leite, P. Influence of Sediment Cycling on the Rare-Earth Element Geochemistry of Fluvial Deposits (Caculuvar–Mucope, Cunene River Basin, Angola). Geosciences 2021, 11, 384. https://doi.org/10.3390/geosciences11090384
Cruz A, Dinis PA, Gomes A, Leite P. Influence of Sediment Cycling on the Rare-Earth Element Geochemistry of Fluvial Deposits (Caculuvar–Mucope, Cunene River Basin, Angola). Geosciences. 2021; 11(9):384. https://doi.org/10.3390/geosciences11090384
Chicago/Turabian StyleCruz, Armanda, Pedro A. Dinis, Alberto Gomes, and Paula Leite. 2021. "Influence of Sediment Cycling on the Rare-Earth Element Geochemistry of Fluvial Deposits (Caculuvar–Mucope, Cunene River Basin, Angola)" Geosciences 11, no. 9: 384. https://doi.org/10.3390/geosciences11090384
APA StyleCruz, A., Dinis, P. A., Gomes, A., & Leite, P. (2021). Influence of Sediment Cycling on the Rare-Earth Element Geochemistry of Fluvial Deposits (Caculuvar–Mucope, Cunene River Basin, Angola). Geosciences, 11(9), 384. https://doi.org/10.3390/geosciences11090384