Article

Subsurface Geological Characterization of the Late Neogene–Quaternary Argive Basin, Peloponnese, Greece Using Transient Electromagnetic Data and Vintage Stratigraphic Logs

by
Hector R. Hinojosa-Prieto
1,*,†,
Pantelis Soupios
2 and
Pavel Barsukov
3
1
Bensberg Seismological Station, Institute for Geology and Mineralogy, University of Cologne, Vinzenz-Pallotti-Str. 26, D-51429 Bergisch Gladbach, Germany
2
Department of Geosciences, College of Petroleum Engineering & Geosciences, King Fahd University of Petroleum and Minerals-KFUPM, Bldg. 76, Office 2245, KFUPM Box 5070, Dhahran 31261, Saudi Arabia
3
Geoelectromagnetic Research Institute, Russian Academy of Sciences, P.O. Box 30, Troitsk, 142090 Moscow, Russia
*
Author to whom correspondence should be addressed.
Now at Cordillera Geo-Services LLC, 1723 Warwick Way, Cedar Park, TX 78613, USA.
Geosciences 2021, 11(8), 317; https://doi.org/10.3390/geosciences11080317
Submission received: 20 May 2021 / Revised: 15 July 2021 / Accepted: 21 July 2021 / Published: 28 July 2021
(This article belongs to the Special Issue Applications of EM Methods for Subsurface Exploration)

Abstract

:
The onshore and offshore clastic deposits of the Argive Basin and the Argolic Gulf, respectively, in Peloponnese, Greece, form a Late Neogene–Quaternary half-graben that connects with the Aegean Sea. The onshore Late Neogene–Quaternary sequence, comprised of chaotically intercalated cohesive and granular clastic deposits, is in angular unconformity with bedrock comprised of Triassic–Upper Cretaceous strongly-weathered, highly-fractured karstic limestones thrusted against Paleogene flysch deposits. While the surface geology of the Argive Basin is well-known, the subsurface geology remains both poorly mapped and understood. We utilized transient electromagnetic (TEM) soundings coupled with 185 vintage stratigraphic logs, current surface geology knowledge, and insights from available geophysical surveys to characterize the subsurface conditions of this sedimentary basin. We estimated the thickness of the young deposits (the depth to bedrock) and detected potential subsurface tectonic structures. The TEM-FAST 48HPC data acquisition system with integrated inversion and visualization software package was used with a single-loop dimension of 50 m × 50 m to collect a total of 329 TEM soundings at 151 stations scattered throughout the basin. The TEM station spacing varied from 200 to 750 m allowing the mapping of 80 km2. The total depth of investigation with the inverted TEM data and the lithology logs was 130 m and 183 m, respectively. The joint interpretation produced several quasi-two-dimensional electrical resistivity profiles that traverse the sedimentary basin in various azimuths and depth slices of average electrical resistivity covering the basin. The depth slices and the vintage stratigraphic logs revealed an uneven bedrock topography overlain by an irregularly thick (over 180 m) Late Neogene–Quaternary heterolithic sediment cover.

1. Introduction

Transient electromagnetic (TEM) surveys have effectively mapped the electrical resistivity structure of various Late Neogene–Quaternary sedimentary basins of distinct depositional environments (Soupios et al. [1,2]; Vallianatos [3]; Koutsios et al. [4]; Kanta et al. [5]; Mollidor et al. [6]; von Papen et al. [7]; Yogeshwar et al. [8]; Kourgialas et al. [9]; Autio et al. [10]; Demirci et al. [11]; Kalisperi et al. [12]; Rani et al. [13].) TEM data can also be used to correct static shifts in magnetotelluric data surveys (Ruiz-Aguilar et al. [14]). In a sedimentary basin, the interpretation of drillhole lithologic data provides an approximate three-dimensional (3D) stratigraphic framework (Amorosi et al. [15]; Sweetkind et al. [16]; Taylor and Sweetkind [17]; Sweetkind and Drake [18]). The Argive Basin (AB), located in the Argolis peninsula of the Peloponnese, southern Greece, has been an essential agricultural spot for millennia. Its beaches and world heritage archaeological sites attract international tourism and researchers.
Although the surficial geology of the AB is well-understood (Papastamatiou et al. [19]; Tataris et al. [20]), its subsurface geology remains poorly known. Most of the current knowledge comes directly from shallow drill holes (Zangger [21]), a detailed geotechnical engineering soil assessment (Apostolidis and Koutsouveli [22]), and shallow geophysical surveys (i.e., gravity and seismic) within confined areas (Karastathis et al. [23,24]; Hinojosa-Prieto and Hinzen [25]; Hinzen et al. [26,27].) While this information comes from areas along the coastline and the greater area of Nafplion City, information is scarce for more inland locations. For example, the shallow drill holes describe the Upper Pliocene-to-Quaternary geomorphology with high-resolution but do not reach the hard-rock bedrock formation. The engineering soil study reveals eighteen different engineering geological soil types, but the descriptions do not apply to other soils within the sedimentary basin. The land gravity and multi-method seismic surveys are restricted to areas within the urban and suburban regions of Nafplion City.
The goals of this study are (i) to estimate the depth to bedrock, and (ii) to identify both significant potential structural discontinuities that might influence seismic site effects. Instrumental to the present work was the combination of 185 available upfront vintage stratigraphic logs and the known surface geological conditions with over 142 (out of 151) TEM soundings dispersed around the AB (Figure 1). The outcome provides a first-order geometric characterization of the sedimentary basin fill. Consequently, the results benefit the work of professional engineers, water management authorities, and research geologists. For instance, the results provide pivotal input information including depth of the bedrock, sedimentary basin thickness and geometry, and subsurface structural discontinuities, all of which are commonly advantageous to engineers for site characterization, estimation of the soil-structure interaction, or seismic microzonation proposed before urbanization. For water management authorities, the results provide information for developing a basin-scale conceptual understanding of the aquifer’s environmental conditions, geometry, and hydraulic properties (hydraulic conductivity and transmissivity) (Soupios et al. [28]). Hydraulic properties can be extracted from electrical resistivity logs using the Kozeny-Carman-Bear equation of Domenico and Schwartz [29]. The output also provides research geologists with the knowledge to constrain the geologic history or conduct a sedimentary basin analysis of the AB. The latter to better understand sediment provenance, basin subsidence, paleogeography, depositional environments, and how this peripheral young basin compares to nearby similar basins, some of which are seismically active.

2. Geological Background

This section discusses the local geologic setting of the Argive Basin, referring to the faults, the young sedimentary package, and the local bedrock formation. In addition, the vintage stratigraphic logs used in the study are introduced and described.

2.1. Geological Setting

The AB is a topographically opened drainage basin and marks the onshore continuation of the Upper Pliocene-to-Quaternary sediment wedge of the Argolic Gulf (AG) (Figure 1). The AB and the AG form a south-widening, fault-bounded Late Neogene–Quaternary half-graben, low-relief topography, sedimentary basin. Numerous north-striking, east-dipping, down-to-the-east normal faults of Late Cenozoic age occur in the AB; though other normal faults nearly perpendicular with different dip directions exist (van Andel et al. [31,32]; Piper and Perissoratis [33]; Anastasakis et al. [34]). In addition, observed and inferred normal faults, some traditionally considered as active and others as probably active faults, occur in the AB.
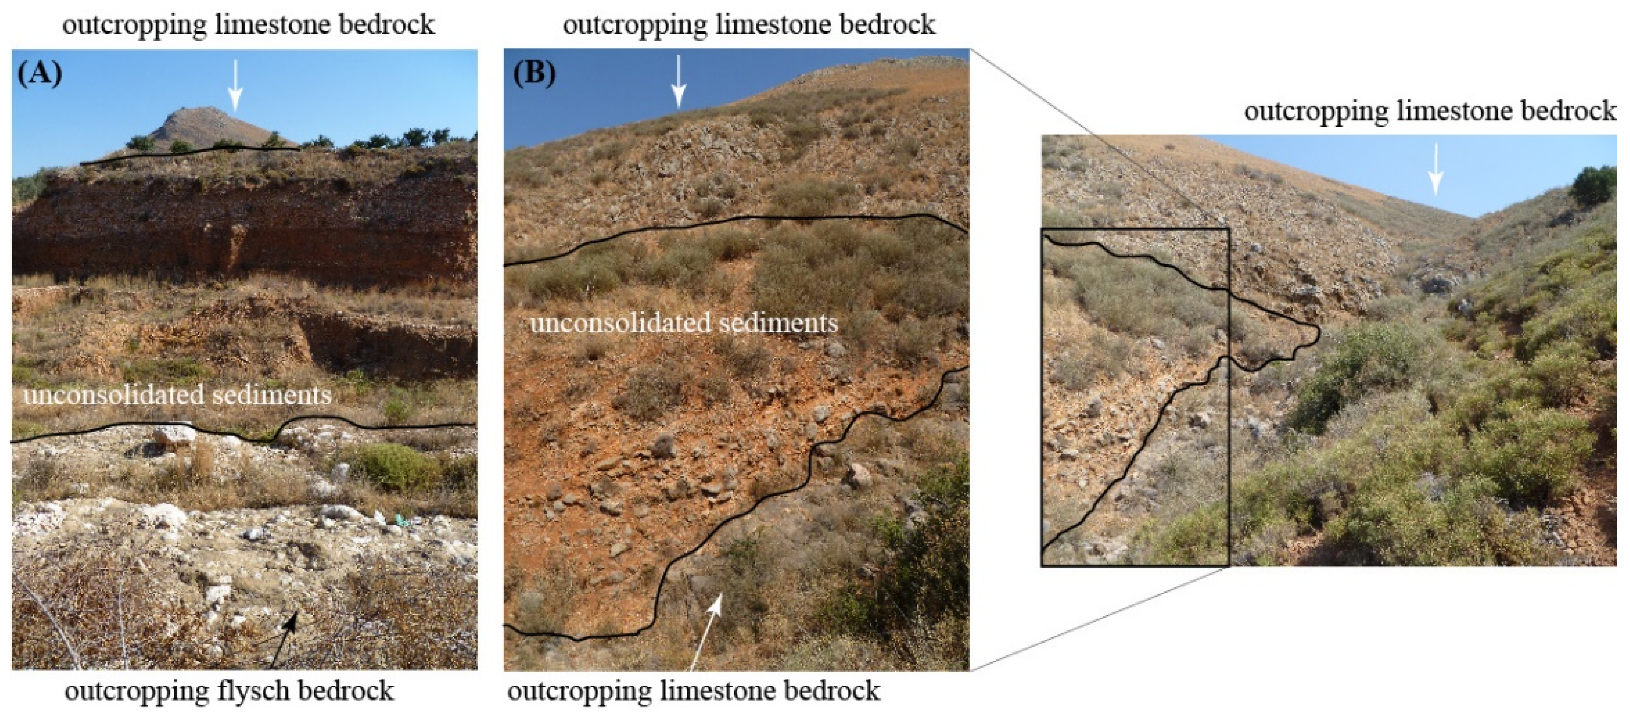
The Late Neogene–Quaternary clastic sequence of the AB is heterogeneous (Papastamatiou et al. [19]; Tataris et al. [20]; Zangger [21]; Apostolidis and Koutsouveli [22]; van Andel et al. [31,32]). Consolidated Upper Pliocene marls, sandy marls, sandstones, and conglomerates of lacustrine and terrestrial origin in the north dominate the basin’s peripheral strata. Quaternary coarse-grained alluvial and colluvial deposits in the west and east transition into fine-grained clastic materials basinward. These fine-grained materials are comprised of a chaotic mixture of clays, silty clays, muds, clayey silt, fine sands, sandy gravels, and coastal dunes. According to Zangger [21], the Quaternary sequence changes from a well-consolidated, >20 m thick sequence of clays, sands, silts, and gravels of transgressive/regressive origin followed by terrestrial alluvial terraces of Pleistocene age into the unconsolidated marsh to fluviotorrential-alluvial surface deposits of Holocene age. The fluviotorrential-alluvial deposits are composed of chaotically interbedded clays, silts, sandy-silts, sandy-clays, sandy-gravels, subordinate pebbly gravel-silts, and lesser silty-sands of coastal and terrestrial origins. The transition from cohesive (fine-grained) to granular (coarse-grained) Quaternary soils is abrupt (Figure 1). The surface soils of the AB are in angular unconformity with the bedrock (Hinojosa-Prieto and Hinzen [25]). Triassic–Upper Cretaceous strongly-weathered, highly-fractured karstic limestones thrusted against Paleogene flysch deposits during the Alpine orogeny comprise the bedrock (Papastamatiou et al. [19]; Tataris et al. [20]). An example of the geological contact between the Holocene fluviotorrential-alluvial surface deposits and the Triassic–Upper Cretaceous bedrock, mainly karstic limestone, is shown in Figure 2. Engineering seismology insights suggest that the AB’s uppermost soils are prone to seismic site effects (Hinojosa-Prieto [30]; Hinzen et al. [26,27]) and soil-liquefaction during dynamic-loading by local earthquakes (Karastathis et al. [23,24].)

2.2. Stratigraphic Logs

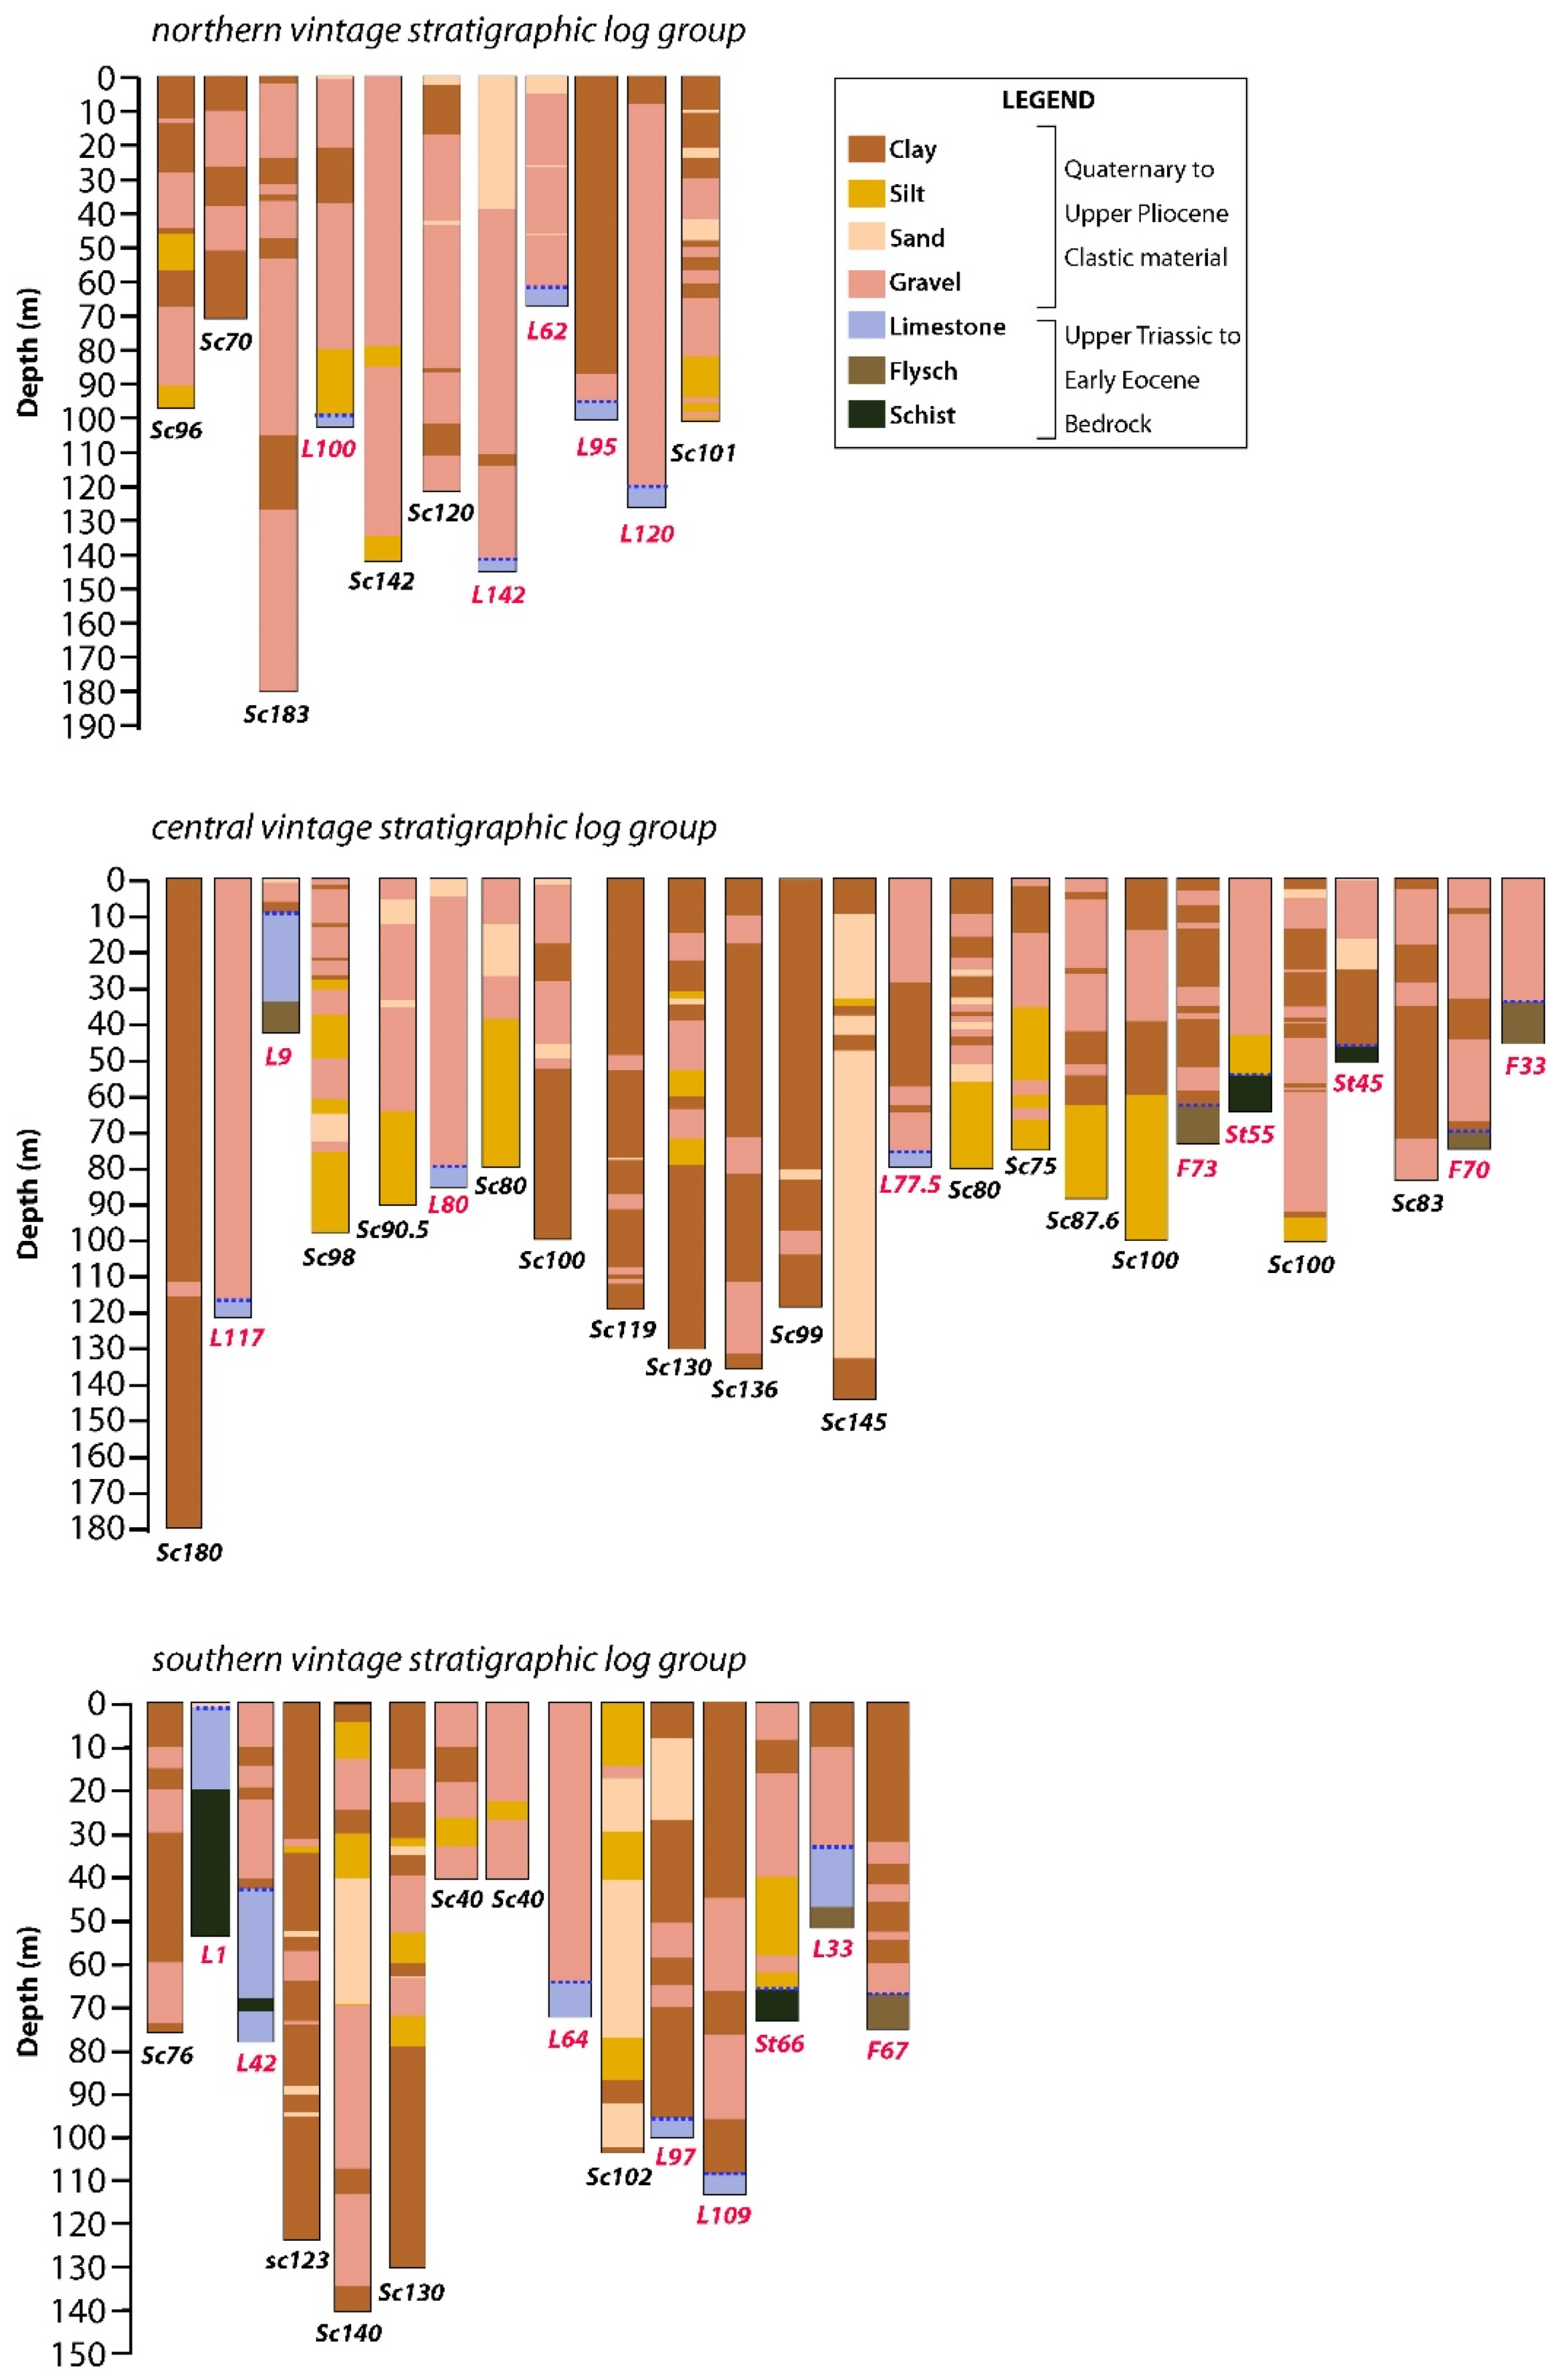
The subsurface stratigraphy of the AB is known from both very shallow (≤30 m) (Zangger [21]; Ntageretzis [35]), and shallow stratigraphic logs (30 to 183 m) from the GSLI, unpublished data; Giannoulopoulos [36]; Karastathis et al. [23,24]). Detailed examination of the stratigraphic logs indicates that the chaotic intercalation of clastic materials mainly dominates the subsurface conditions with various textures. The clastic sequence rests unconformably over weathered bedrock comprised of three types of sedimentary rocks. Hence, the stratigraphic logs are simplified into seven lithologies: clay, silt, sand, conglomerate, limestone, flysch, and schist. The shallow stratigraphic logs indicate an irregularly thick clastic sequence with heterogeneous texture deposited on uneven shallow to deep bedrock, as shown in Figure 3. An intricate interbedding pattern from the textural point of view supports heterolithic facies for the unconsolidated Late Neogene–Quaternary deposits. The general sedimentary pattern suggested by Figure 3 points towards a two-layer stratigraphy: a heterolithic soft clastic sequence deposited over weathered bedrock.

3. Geophysical Background

Several independent onshore (Karastathis et al. [23,24]; Hinzen et al. [26,27]; Mitropoulos and Zananiri [37]; Photiades [38]; Karmis et al. [39]; Hübner and Giese [40]; Zananiri et al. [41]) and offshore (van Andel et al. [31,32]) geophysical surveys of limited coverage have been carried out in the AB and AG, respectively, for various research targets. Although these previous works shed light on its subsurface stratigraphy, they sampled a smaller area than the present TEM deployment. Collectively, the results of these previous geophysical surveys support a two-layer stratigraphy consistent with soft clastic deposits deposited over the weathered-to-fresh bedrock of irregular topography.
A nearly 100 km2 two-dimensional (2D) marine seismic reflection survey in the western AG reveals multiple reflecting surfaces and soft sedimentary beds of Pliocene–Quaternary age, several north-south trending normal and reverse faults, and uplifted limestone blocks at 300 to 500 m depth (van Andel et al. [31,32]). A smaller (13.5 km2) 2D marine seismic reflection survey offshore Nafplion also reveals reflectors (Mitropoulos and Zananiri [37]) (Figure 1). Conclusively, the spatially distributed onshore and more widely distributed offshore geophysical surveys suggest an undulating bedrock topography likely due to either the opening of the AG in the Late Neogene or to older tectonic events (Photiades [38]).
Several onshore multi-method geophysical campaigns were deployed in the broader study area. Previous TEM soundings (total of 70; 50 × 50 m single loop configuration) and electrical resistivity imaging (Karmis et al. [39]), conducted around the city of Nafplion, indicate a heterolithic clay-rich sedimentary package overlying an uneven karstic and fracture limestone bedrock topography varying from 40 to 145 m depth under a shallow groundwater table. The multi-method geophysical campaign of Karasthatis et al. [23,24] deployed within the suburban area of Nafplion provides information about the soil–bedrock depth and morphology, the depth of the groundwater table, and the minimum sediment thickness of the Pliocene–Quaternary soft sedimentary cover. The geophysical campaign was tailored to understand the geotechnical engineering and hydrologic conditions for a liquefaction hazard study. The campaign consisted of a Multichannel Analysis of Surface Waves (MASW), seismic reflection, both Vp (compressional P-wave) and Vs. (horizontally polarized shear-wave) seismic refraction, and three-dimensional (3D) gravity on Pliocene–Quaternary alluvium. The MASW results show Vs from 100–500 m/s and 500–1000 m/s for the Pliocene–Quaternary fine-to-coarse grained soils and limestone bedrock. The refraction survey yields Vp between 320–740 m/s and Vs between 120–320 m/s for the soft clay-rich soils; and Vp between 1600–3000 m/s and Vs of 600 m/s for the bedrock. North of Nafplion City, low Vp values, and high Poisson ratios were detected beyond a 5.0 m depth within a Quaternary sandy-silt/silty layer interpreted as saturated soils due to a shallow groundwater table. Both the seismic reflection profiles and the 3D gravity survey of Karastathis et al. [23,24] suggest an undulating limestone bedrock topography varying from 60 to 200 m depth within the greater area of Nafplion, likely affected by two parallel (NW-SE), buried south-dipping inactive low-angle normal faults. The minimum sediment thickness of the Pliocene–Quaternary cover was also resolved. The gravity survey by Hinzen et al. [27], encompassing the archaeological excavation site of Tiryns and its periphery, supports a two-layer stratigraphy with a clastic sedimentary cover overlying a weathered-to-fresh limestone bedrock of irregular topography.
The uppermost 5 m depth of the fine-grained Holocene alluvium flanking the western and northern sides of the archaeological site of Tiryns was reached with several one-dimensional (1D) vertical electrical soundings (Hübner and Giese [40]). A pseudo-3D magnetic survey (i.e., total field and gradient) was performed in the archaeological site of Argos City (Zananiri et al. [41]) without constraining the soil-bedrock interface. Hinzen et al. [26] performed passive seismic measurements on the alluvial plain using ambient noise and earthquake data recorded with the passive seismic measurements. They concluded that the depth of the local hard-rock increases coastward when moving away from the limestone knoll of Tiryns (e.g., the Pliocene‒Quaternary sediment thickness increases towards the coastline).

4. Materials and Methods

This subsection deals with the use of the transient electromagnetic (TEM) method. In particular, it explains how the TEM survey was deployed, how the data were acquired, processed, and inverted into 1D resistivity models, and how they were used to create quasi-2D electrical resistivity sections and combined into a quasi-3D model. Finally, the value of the vintage stratigraphic logs is discussed.

4.1. TEM Survey and Data Acquisition

The present TEM survey was part of the HERACLES project of archaeoseismological context, led by seismologist Klaus G. Hinzen at the University of Cologne (see Hinzen et al. [27]). The TEM deployment was mainly designed along with profiles with different azimuths to capture potential subsurface tectonic lineaments, complex subsurface geology, and to be compared with other geophysical measurements done in parallel by the same research group (Hinojosa-Prieto [30]). Additionally, it was impossible to deploy a grid or mesh of TEM stations due to limited access to private properties. The portable TEM-FAST 48HPC instrument (version 8) (AEMR [42]) was used to collect TEM soundings throughout the basin with a spatial station spacing varying from 200 to 750 m (Figure 1) covering an area of 80 km2. The TEM-FAST 48HPC instrument is manufactured by Applied Electromagnetic Research Ltd. (AEMR) located in Troitsk, Moscow, Russia. It provided a fast and low-cost way of collecting TEM data, including noisy areas within most of the valley. In total, one hundred and fifty-one (151) TEM sounding stations were selected at different locations for the deployment of single Transmitter-Receiver antennas 50 × 50 m. Transient responses were recorded in the time range 4–2048 μs, to be able to image possibly complex subsurface conditions. The measurements were repeated (applying different acquisition parameters assigned as A and B measurements for the same location, i.e., 101A and 102B) two or three times at each sounding location to check the repeatability and to enhance the signal to noise ratio (S/N) of the raw TEM data. Simultaneously, with the subsurface response measurements at each time lag, the electromagnetic noise was also measured and used for data filtering and inversion. To further increase the S/N and reduce the influence of cultural noise sources, the sounding locations were chosen away from exposed power lines, telephone lines, pipelines, operating or abandoned wells, roads, and metallic fences.
From the 151 TEM sites, TEM raw data from nine (9) sites were rejected due to natural or cultural noise. Thus, TEM raw data from a total of 142 TEM sites were consistently pre-processed (e.g., filtered, edited, and smoothed) before the unconstrained 1D inversion. Moreover, induced polarization (IP) effects (negative polarity at late times) and superparamagnetic (SPM) effects (mainly caused by the nearby metallic borehole casings) were found in the TEM soundings. So, the data (late transient times with IP effect) were not used to avoid instability and non-uniqueness during the 1D inversion procedure. Finally, because the TEM measurement was repeated three times at each TEM station, the best minimum root mean square (RMS) error measurement from each TEM station was chosen for modeling and inversion.

4.2. TEM 1D Data Processing and Inversion

A quantitative interpretation of the TEM measurements is required. The interpretation is based on the inversion of the measured data regarding the spatial distribution of the true electrical resistivity within the Earth. In the case of a 1D Earth, it is represented by a piecewise resistivity distribution with increasing depth, which is obtained here by applying the Levenberg-Marquardt inversion scheme. For the latter, a proper choice of an initial geoelectric model is pivotal. Several methods exist for processing and inverting 1D TEM data. The Occam inversion method introduced by Constable et al. [43] is the most known and widely used. The Occam inversion scheme seeks and produces the smoothest or minimum structure model subject to a constraint on the misfit (Constable et al. [43]). 1D Occam smooth models are independent of arbitrary starting guesses and hence yield results that provide the simplest possible geoelectrical model by eliminating the appearance of unnecessary layers in a multi-layered subsurface medium. In our case, we used the TEM-FAST 1D processing and inversion scheme, which utilizes the TEM-RESEARCH (TEM-RES) software package, also made by AEMR. The choice of this 1D inversion approach was dictated by technical reasons, including the immediate availability of the TEM-FAST 48HPC data acquisition system that includes the integrated Windows-based TEM-RES software package for fast inverse problem solution. The TEM-FAST 1D inversion scheme allows us to obtain information about the near-surface inhomogeneities in a multi-layered subsurface medium, and the main features of the 1D geoelectric model appear in the initial phase of the transformation. The transformation does not require a priori information about the medium, and it works well for unconstrained inversions in subsurface conditions with complex and uneven bedrock topography (Barsukov and Fainberg [44]). Our tectonic understanding of the area, coupled with our available vintage stratigraphic logs, indicates a geologically complex and heterogeneous layered medium linked to the tectonic and geologic history of the area.
When using the technology of TEM-FAST soundings to model the 1D data, the data processing of each TEM sounding station requires three steps (Barsukov and Fainberg [44]) before the 1D inversion. The processing steps are as follows (Rani et al. [13]) and are explained in-depth: (1) measurement of the transient response Er(t) with the TEM-FAST 48HPC data acquisition system; (2) estimation of the apparent resistivity ρa(t) for a homogeneous half-space; (3) transformation of the measured transients directly to the ρ(h) dependence, i.e., how the apparent resistivity changes with depth ρ(h); and finally, (4) the 1D inversion performed numerically using the Levenberg-Marquardt method (Strack [45].)
At the first step of the TEM-FAST 1D inversion scheme, the observed transient responses, as a superposition of different components exponentially decaying with time (Svetov and Barsukov [46]), are calculated by minimizing the following functional (Equation (1)) (Barsukov and Fainberg [47]),
Q = i = 0 N [ f o b s ( t i ) f ( t i ) f o b s ( t i )   1 δ ( t i ) ] 2
where δ(t) is the relative uncertainty of measurement fobs(t) and f(t) is the function that Svetov and Barsukov introduced [46], representing the transient responses as a superposition of different components decaying exponentially with time (Equation (2)),
f ( t ) = k = 1 N A k exp ( t τ k )
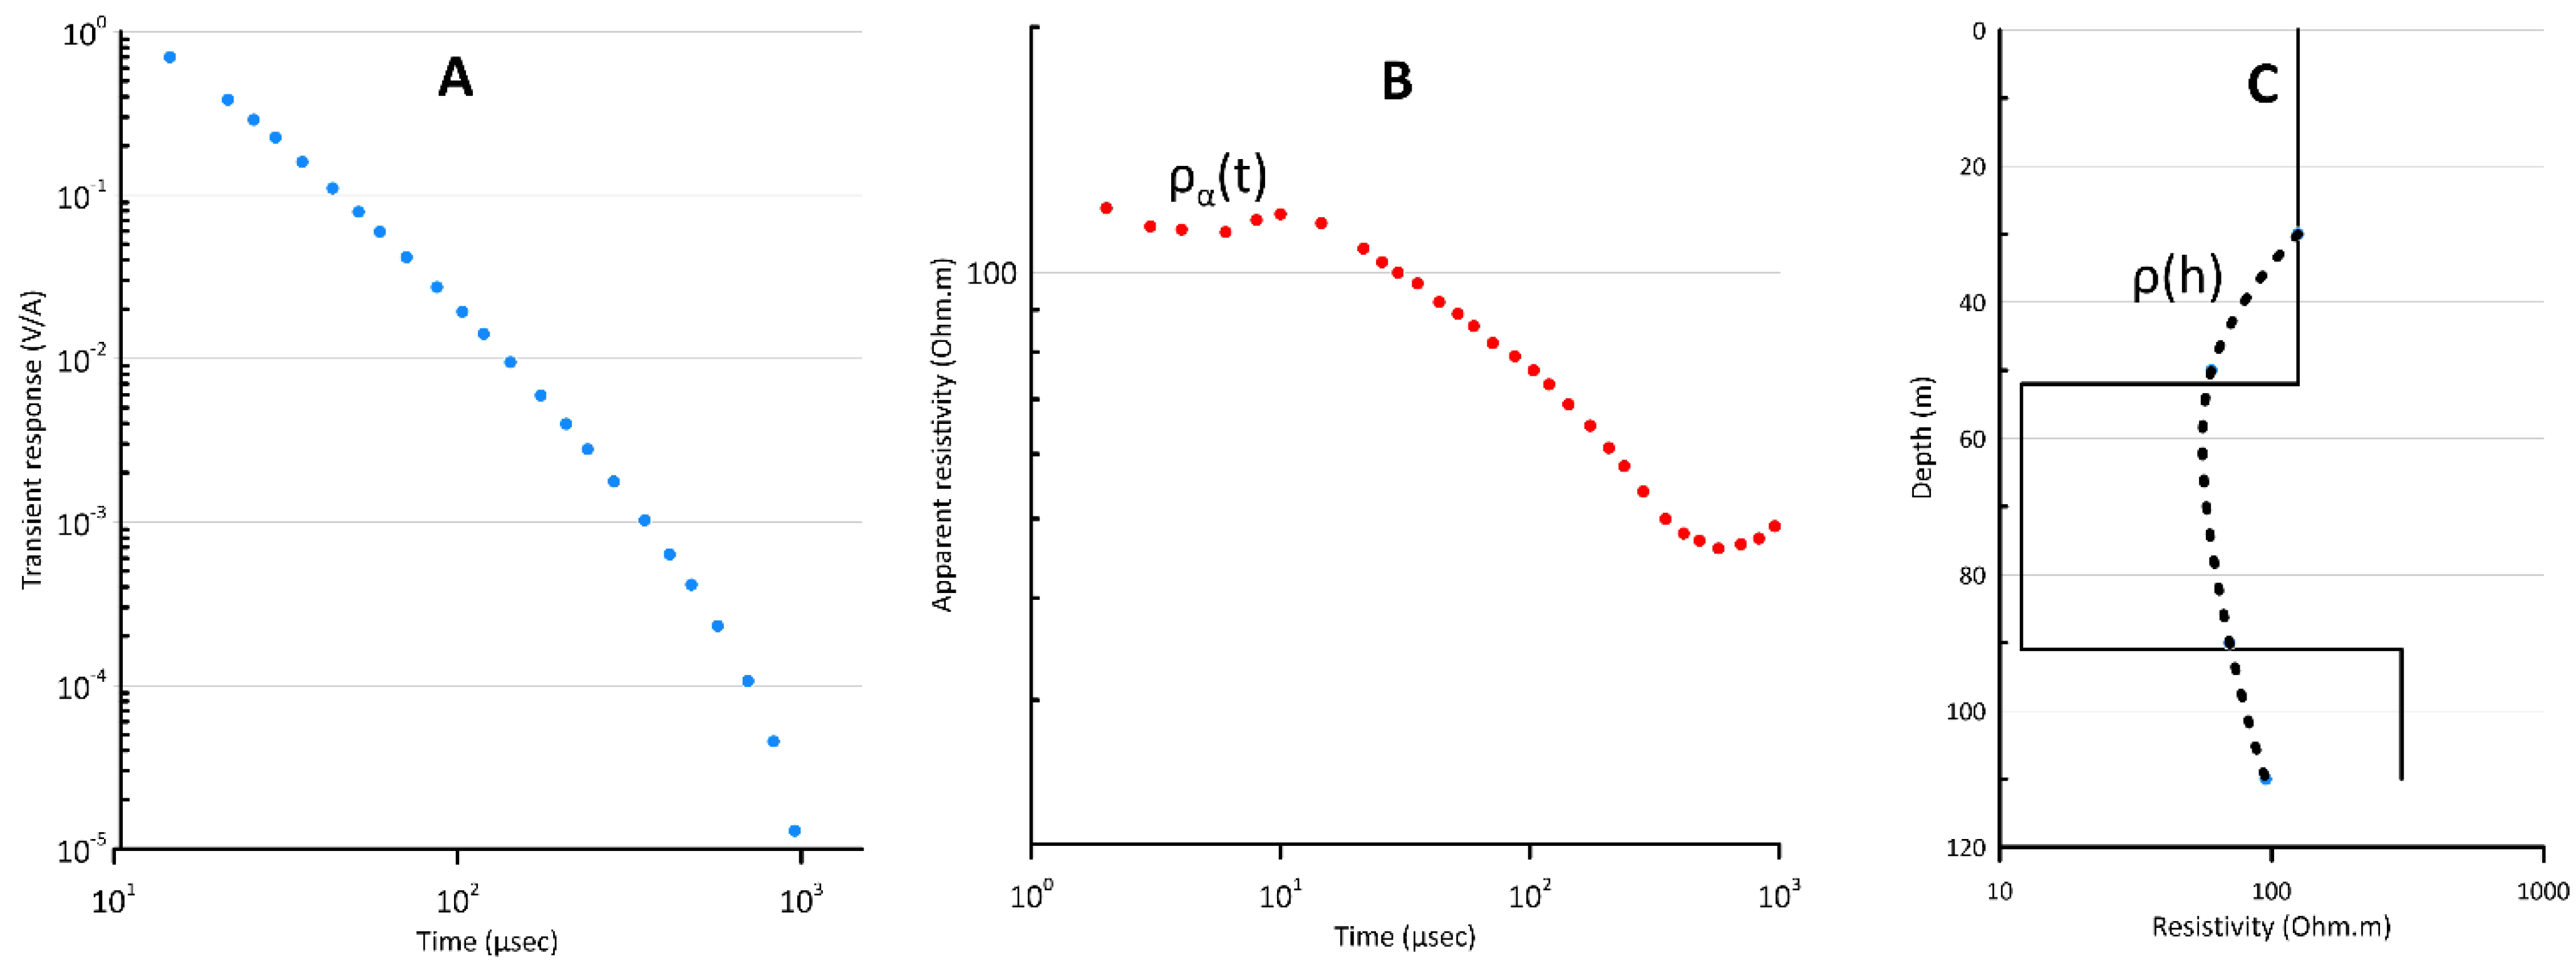
where τk is the time constant, and Ak is the amplitude. Ak ≥ 0 for a combined transmitter-receiver antenna (single-loop setup) (Gubatenko and Tikshaev [48].) For this first step, Figure 4A shows an example of the observed transient responses (blue circles) from TEM station 058A.
The second step is the calculation of the apparent resistivity, ρa(t) (Figure 4B), for a homogeneous half-space, which creates a response that is equal to the response f(t) (Equation (1)) at each time t (Kaufman and Keller [49]) as shown below by the asymptotic formula (Equation (3)),
ρ a ( t ) = [   μ 0   3 2 L 4 20 π 3 2   1 t 5 2 f ( t ) / I ] 2 / 3
where f(t)/I (V/A) is the normalized measured transient response in loop L × L size and μ0 = 4π10−7 (H/m).
If we assume that Half_Space (L, ρ, t) is an operator that estimates the transient response in loop L × L of a half-space of the resistivity ρ at time t, one can determine the function ρ(t) by solving the following equation (Equation (4)) (Barsukov et al. [50]),
f(t) = Half_Space (L, ρ, t)
for ρ in each time t.
The apparent resistivity, ρa(t) (Equation (3), (Figure 4B), can be calculated by using the asymptotic formula for late times, under certain conditions, t ρ a ( t ) / μ 0 L, and by the complete formula (ρ(t), Equation (4) valid at any time stage in the near, middle, and far-field (Equations (3) and (4), respectively, Barsukov et al. [50]). The complete formula is neither used nor shown in our work. Thus, the interpretation scheme presented here includes two operations: one for estimating the best-fit parameters of the exponential series approximation of the acquired TEM data, and another one is the traditional inversion to reconstruct the geoelectric parameters (Equations (1) and (2), respectively).
The third step is the transformation, i.e., how the apparent resistivity changes with increasing depth ρ(h) following Berdichevsky and Dmitriev [51]. The advantage of the transformation model is that no additional information is needed, and it is carried out automatically. Figure 4C (smoothed dashed line) illustrates an example of the transformation from TEM station 058A. More details about this can be found in Barsukov and Fainberg ([47] (Equations (6) and (7)). We emphasized that traditional electromagnetic data inversions use the well-known Occam inversion scheme to derive a starting model for the Marquardt inversion.
The final step is the 1D inversion of the TEM data performed numerically by using the well-known Levenberg-Marquardt method (Strack [45]) for minimizing the functional of Equation (1), where f(t) is the transient response of multilayer half-space. An initial resistivity model is always needed. The transformation results ρ(h) (e.g., Figure 4C, dashed line) or any available insight from geological or geophysical knowledge (i.e., lithology/resistivity, number of layers, and their thicknesses) can be used in the initial model. In this research, the number of layers and their resistivities estimated by transformation was used as the initial model for the inversion process (Figure 4C, continuous black line). Insights from the stratigraphic logs corroborated the layer thickness. We adopted an unconstrained 1D inversion of the TEM data because of the known complex and uneven basin’s bedrock topography (i.e., the non-uniform thickness of the sedimentary cover throughout the basin).
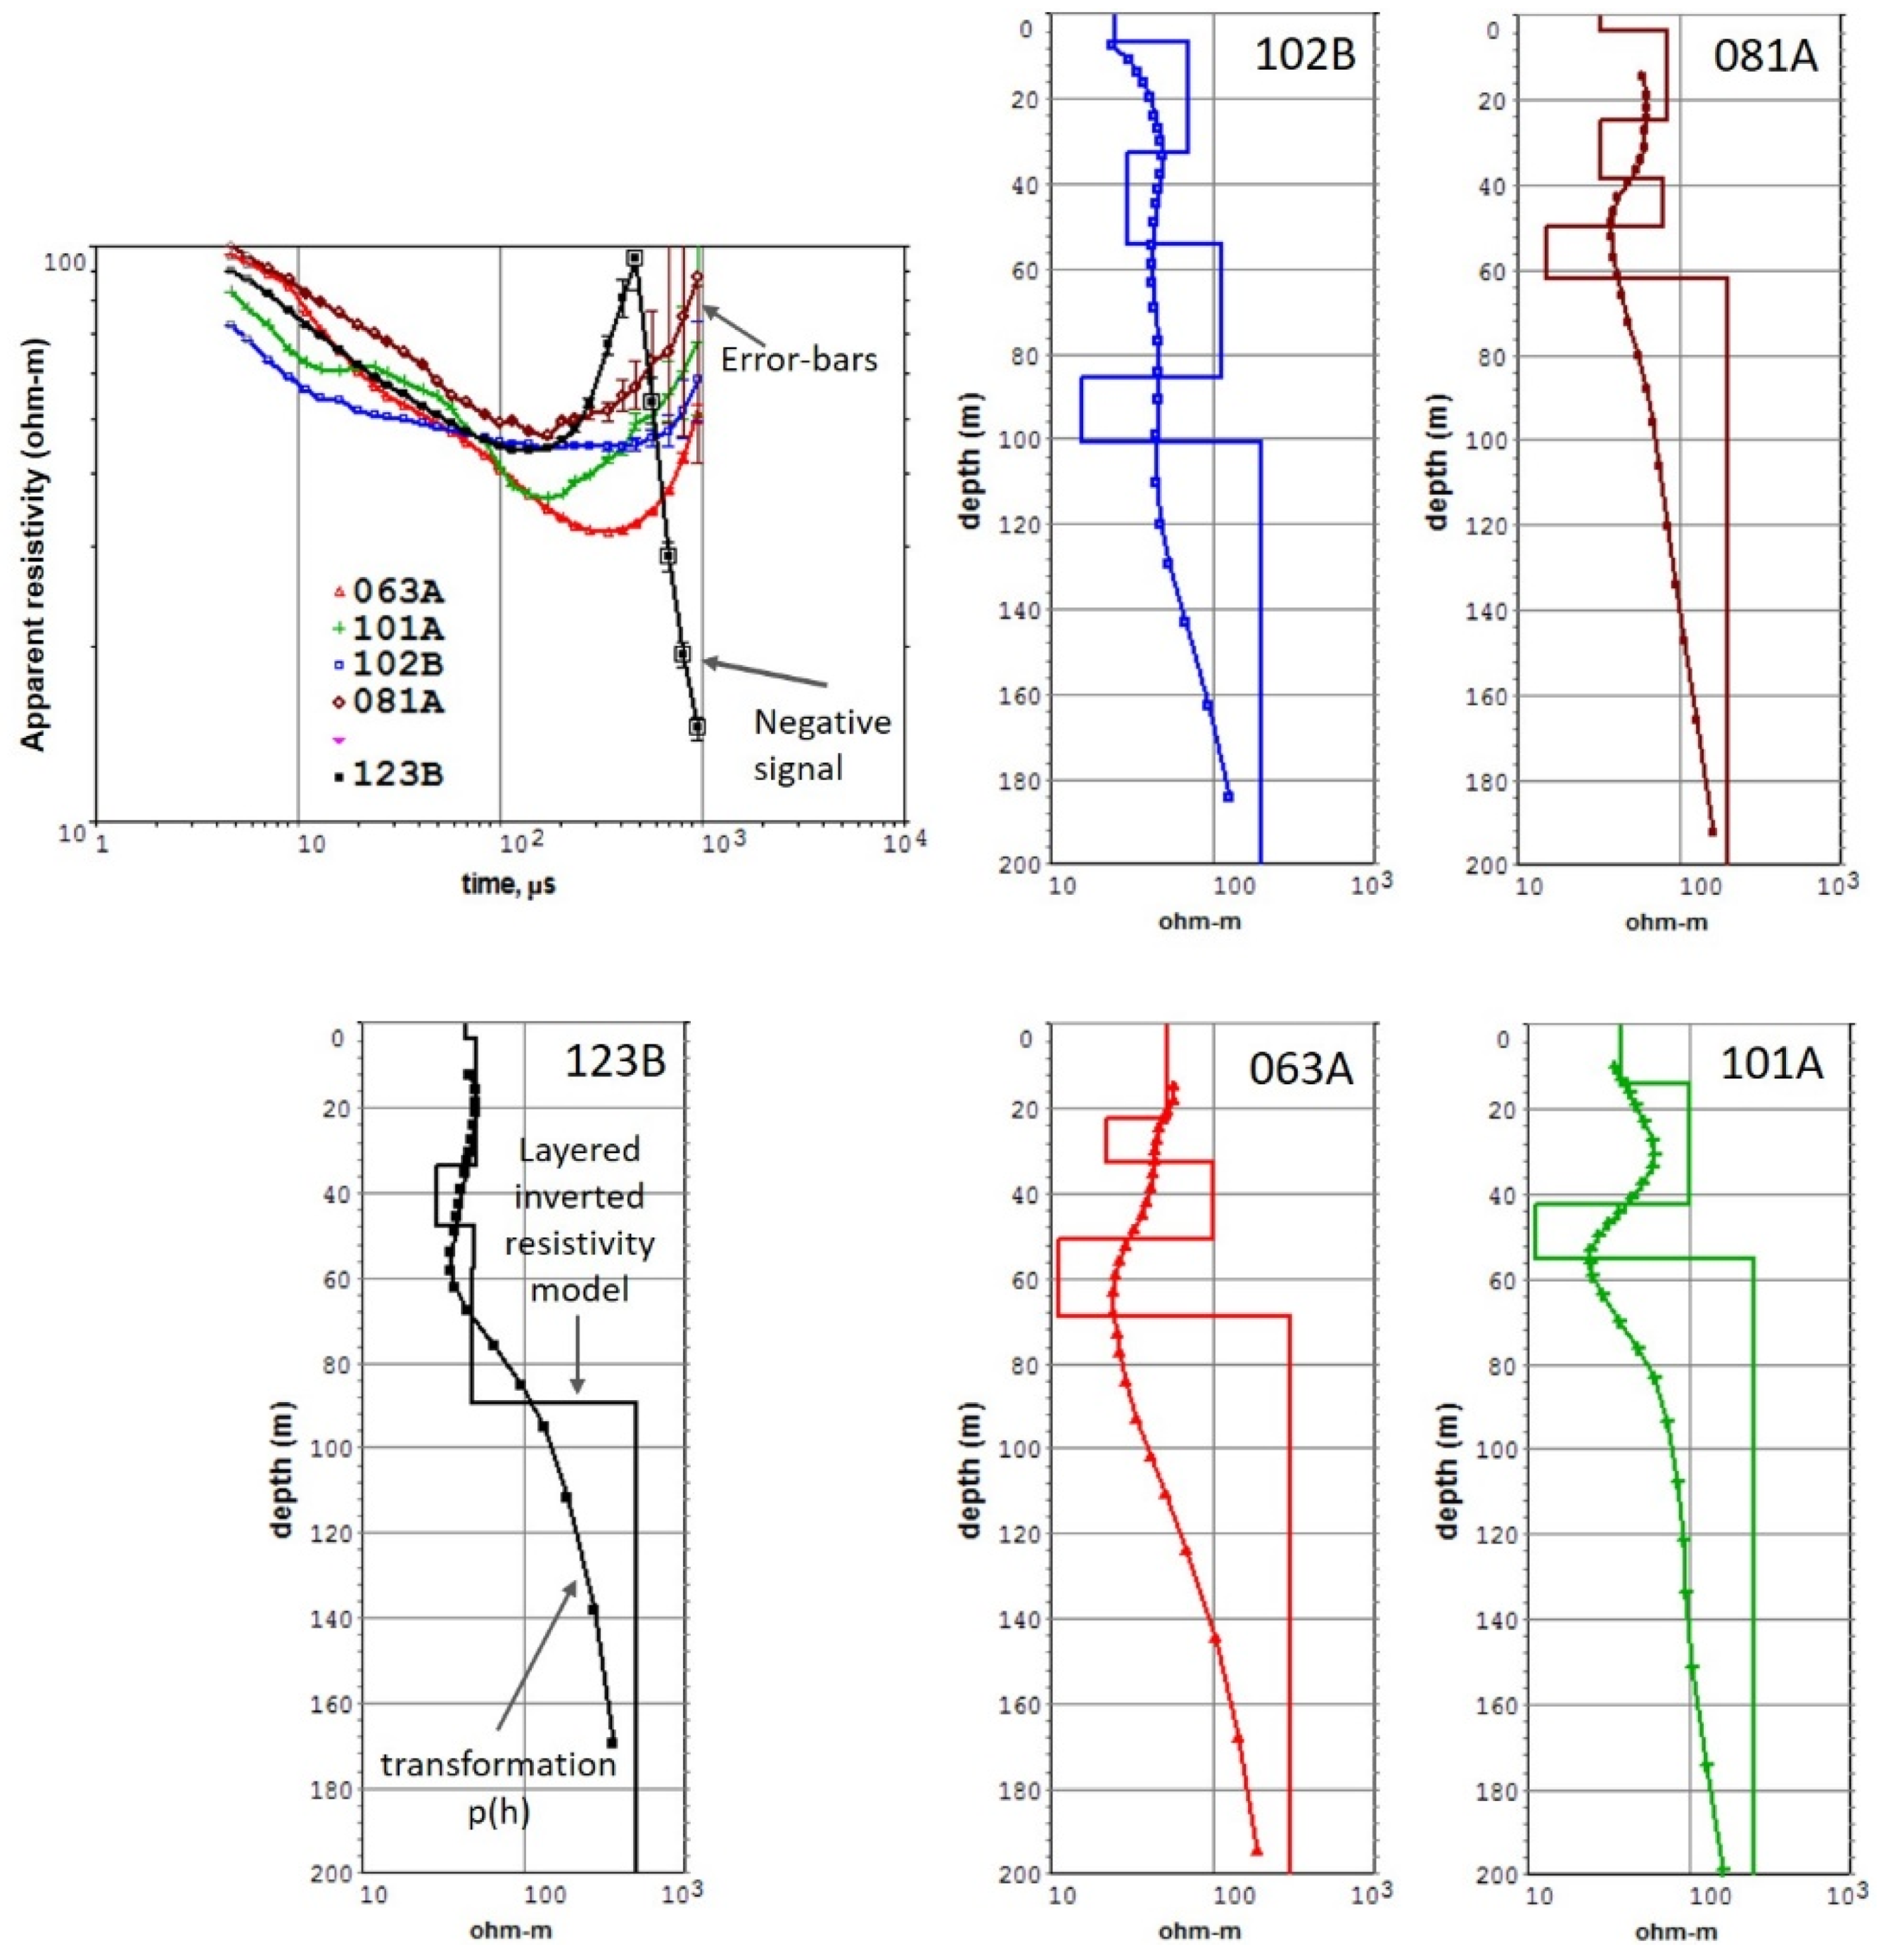
Conversely, adopting a constrained 1D inversion would require fixing the thickness of the sediment layer (e.g., conductive layer) to an arbitrary known value or values chosen from all the 185 vintage stratigraphic logs. We emphasize that the stratigraphic logs alone strongly indicate an uneven bedrock (half-space) topography. Hence this would introduce a bias in the estimation of the electrical resistivity structure. Also, it could result in either an overestimation or underestimation of the electrical resistivity structure. For this reason, the current upfront geological information was only used to visually confirm that the unconstrained inversion agrees with the known sediment thickness or depth to bedrock where the TEM station is near a stratigraphic drill hole (i.e., within an interstation-distance of ≤750 m). The unconstrained 1D inversion incorporates the estimation of the resistivity and layer thickness for a class of layered models minimizing the misfit between the calculated and the experimental data using proper regularization (mainly smoothing) parameters. More details about this TEM data inversion style are found in Barsukov et al. [50]. The final misfit is estimated using the RMS, which determines the difference between the observed and the calculated/smoothed data. The final misfit of the 1D inversion process is ~5%. Figure 5 shows examples of different quality (good and bad) raw data (change of apparent resistivity with time) from five different TEM station sites (upper-left plot). The resulting resistivity models after transformation (smooth change of resistivity with depth) and their corresponding Levenberg-Marquardt 1D inversion (final layered resistivity model) are also presented. Specially, some data yield a sign reversal in the observed transient. These data were not considered in the 1D inversion. In some other cases, the data recorded after 400 μs were extremely noisy (high error bars; i.e., sounding 081A) and were not considered in the inversion process.
The resulting 1D inverted resistivity models from the 142 TEM sites were finally stitched and interpolated with the TEM-RES software to create several quasi-2D electrical resistivity sections with lengths spanning from ~5 to ~17 km long and combined into a quasi-3D model, from which resistivity values were extracted from four depth intervals, namely 0–10 m, 20–50 m, 50–100 m, and 100–130 m. The output was then gridded in Surfer (by Golden Software, LLC in Golden, CO, USA) using the kriging interpolation method to create spatial distribution maps of average electrical resistivity. From here on, we refer to maps of average electrical resistivity as depth slices of electrical resistivity. Hence, the four computed depth slices provide the average electrical resistivity of each point in space within that horizontal plane. This step provides a basin-scale quasi-3D perspective of the thickness and geometry of the Late Neogene‒Quaternary sedimentary fill, the depth to bedrock, and potential structural discontinuities in the bedrock.

5. TEM Survey Results and Interpretation

The interpretation is based on the 1D inverted resistivity models. The 1D inversion can be justified due to the large distance between the acquired TEM stations. The resulting depth-resistivity structure varies noticeably from station to station. The available geological information (Figure 1 and Figure 2) was used to corroborate that the results of the unconstrained 1D TEM inversion agree with the known thickness of the sedimentary cover. Also, insights from previous geophysical studies assisted in the interpretation. Figure 6 illustrates an example of how the two-layer stratigraphy (e.g., uneven, and unconsolidated heterolithic clastic sequence overlying weathered bedrock) is successfully determined with the 1D inversion of the TEM data. In particular, Figure 6 shows how a 1D TEM inversion detects a conductive layer over a resistive layer and agrees with two nearby boreholes whose drilling reveals a thick conductive layer (thick sediment cover) over a resistive layer (limestone bedrock). The data processing and unconstrained inversion of the TEM soundings yield an electrical resistivity range from <1 to 300 Ωm. Although this resistivity range seems relatively narrow and low, we argue that the composition of the young sedimentary fill (e.g., a chaotic mixture of saturated cohesive and granular clastic materials and hydraulic conditions) overlying strongly-weathered and highly-fractured bedrock (e.g., mainly limestones of various ages, flysch, and lesser schist) and a shallow (~15 m) water table (Karastathis et al. [23,24]) can explain the narrow electrical resistivity range.

5.1. Quasi-2D Electrical Resistivity Profiles

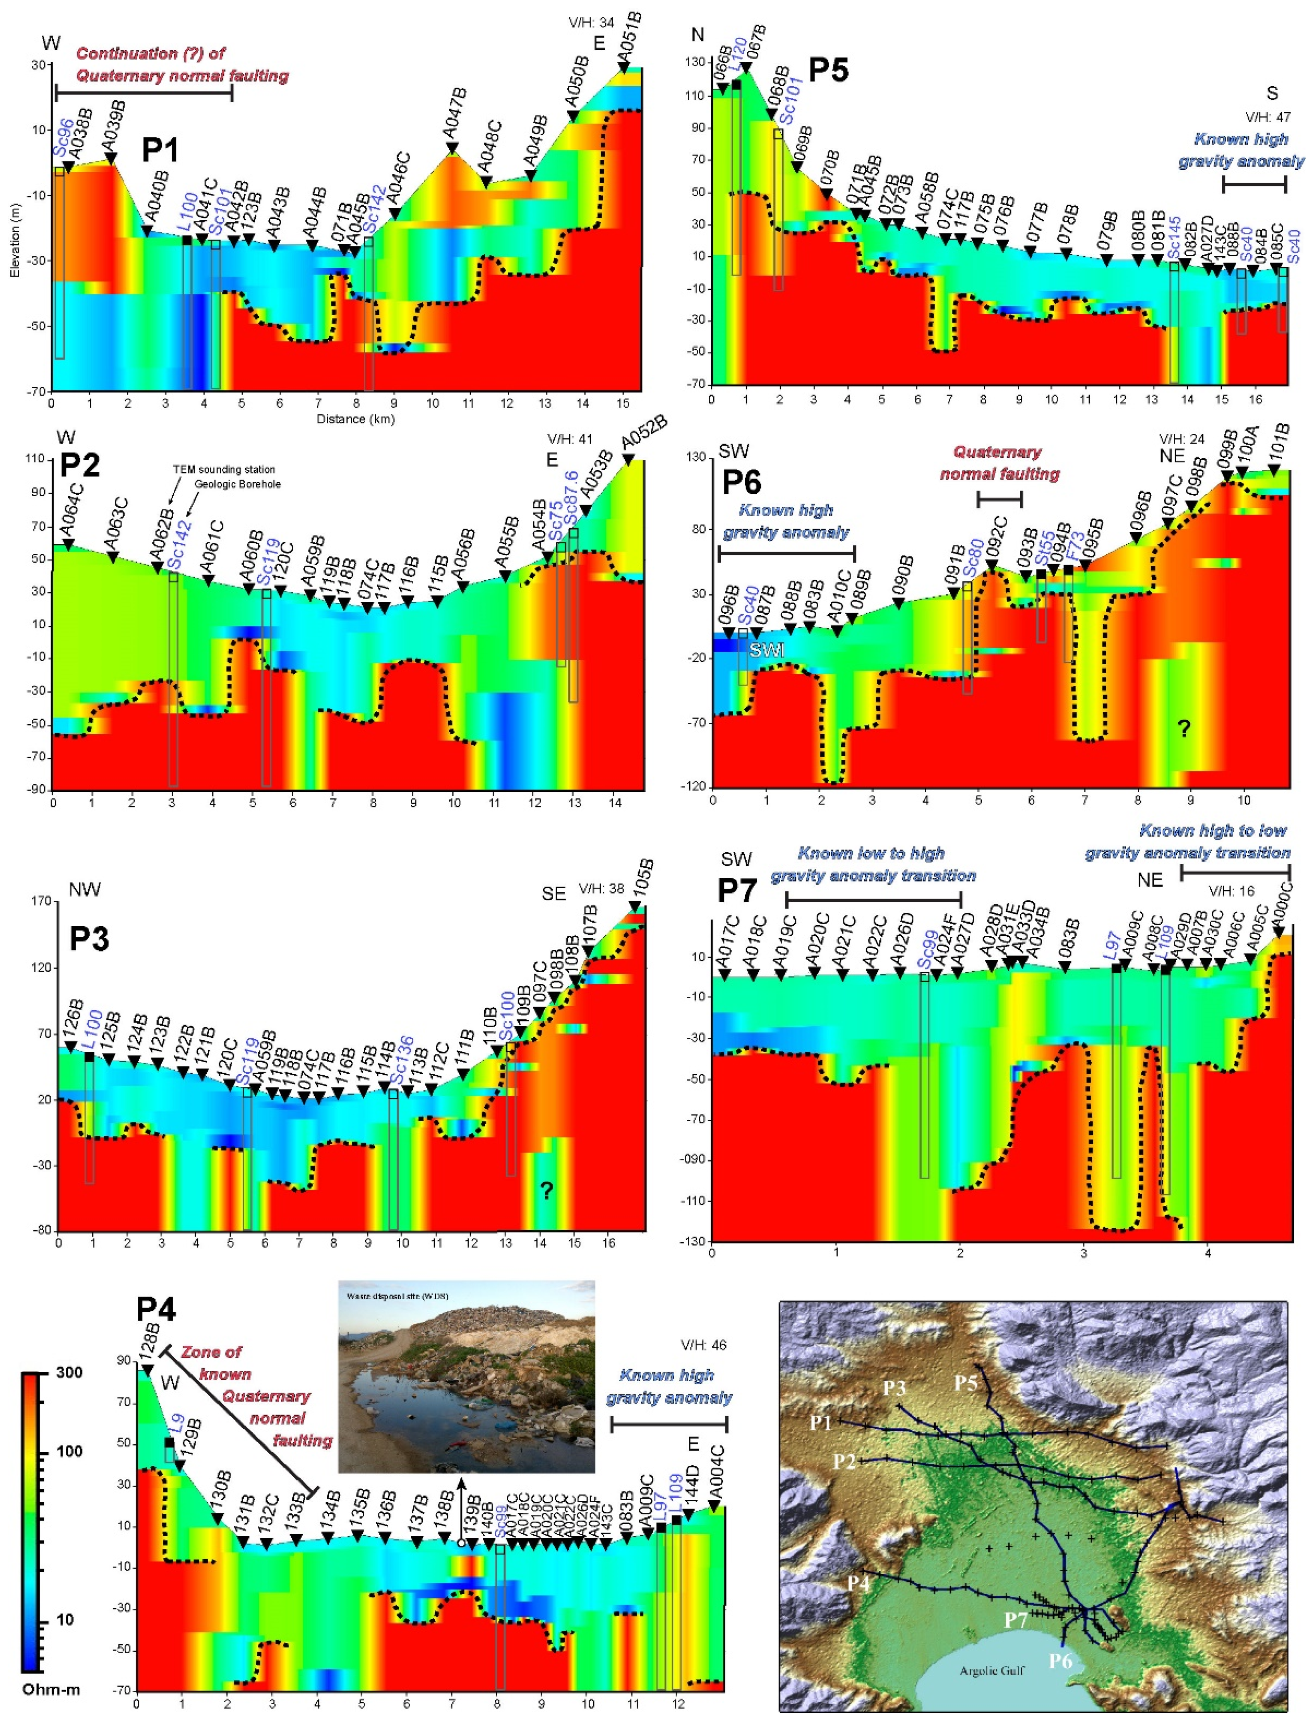
All TEM stations used to construct quasi-2D electrical resistivity profiles were deployed within the flat sedimentary plain composed of Quaternary fined-grained and coarse-grained alluvium. Figure 7 depicts seven quasi-2D resistivity profiles (P1–P7) with different azimuths across the sedimentary basin. Profiles P1, P2, P3, P4, and P7 strike roughly west-east; P5 and P6 strike NW-SE and NE-SW, respectively. Resistivity values <300 Ωm are interpreted as the entire Late Neogene–Quaternary clastic heterogeneous sequence with different degrees of water-saturation and grain sizes (e.g., clays, silts, sands, and conglomerates) over a resistive half-space (bedrock). The resistivity value of 300 Ωm is interpreted as the highly-weathered and fractured local bedrock formation composed of karstic limestones of various ages thrusted against flysch deposits and lesser schist. However, the dominant rock across the region is karstic limestone (see Figure 1).
All quasi-2D resistivity profiles detect abrupt lateral changes or discontinuities in an upward position within the interpreted bedrock. These features are interpreted as buried conductive zones, likely tectonic origin, in fracture zones affecting the resistive bedrock. Profiles P1, P2, P3, and P5 also detect sub-vertical conductive zones across the bedrock that coincide with basin-scale fractures or fault zones proposed by hydrogeological modeling (Giannoulopoulos [36]). Profiles P4, P6, and P7 detect lateral discontinuities, interpreted as conductive zones, across the resistive bedrock that agree with the occurrence of a known zone of normal faulting (see Figure 2 and Figure 6). The electrical resistivity structure of the Late Neogene–Quaternary clastic heterogeneous sequence is well-constrained across the basin. The geologic interface between this young heterolithic clastic wedge and the weathered and fractured bedrock is consistent across the sedimentary basin. Very low resistivity (highly conductive) anomalies are detected near the coastline in P4, P5, and P6 (Figure 7). The highly conductive anomaly in the center of P4 is likely related to the infiltration of leachates leaking from an open local waste disposal site (WDS). The highly conductive anomalies in the southern end of P5 and P6 suggest a saltwater intrusion (SWI) since these measurements were collected very close to the coastline (Figure 7).

5.2. Depth Slices of Average Electrical Resistivity

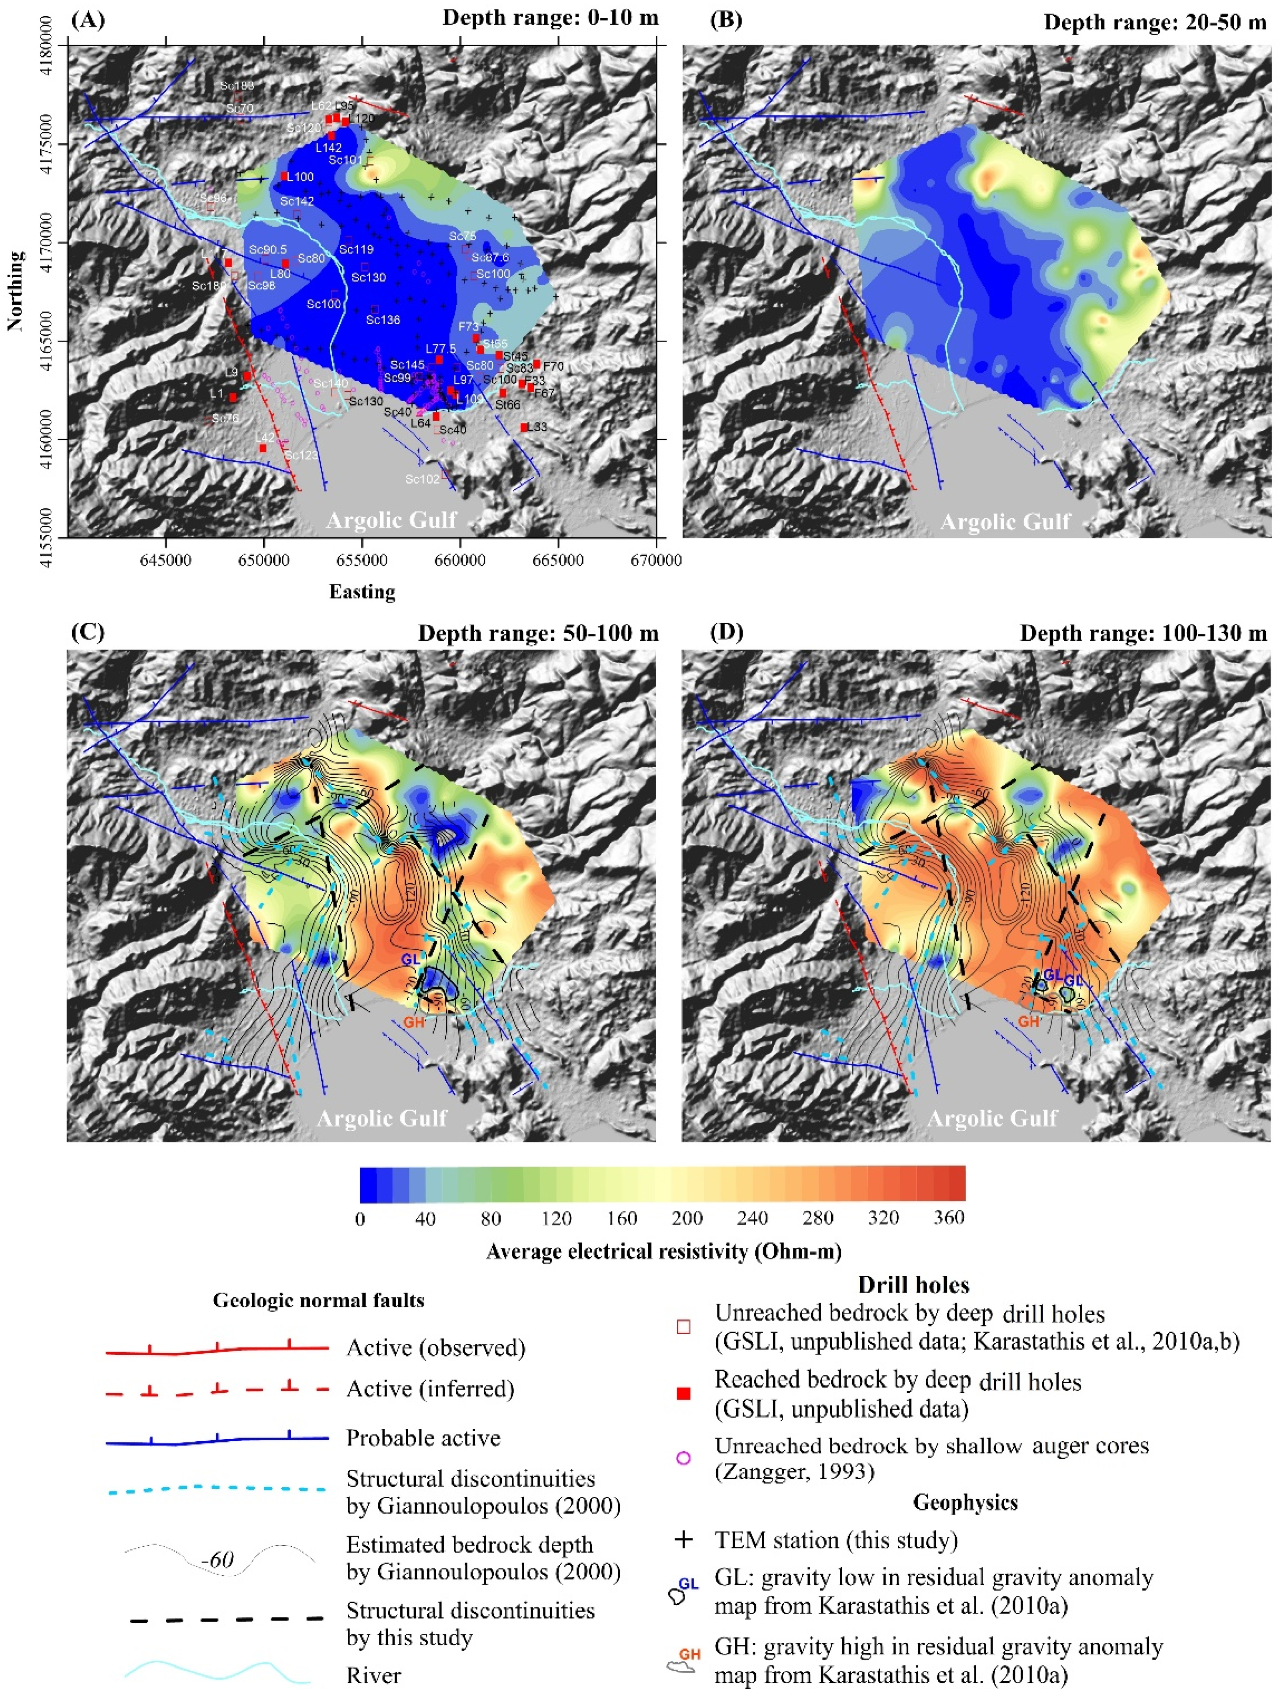
Figure 8 shows the resulting depth slices of average electrical resistivity at 0–10 m, 20–50 m, 50–100 m, and 100–130 m depth intervals overlain by known geologic structures, drill holes, and rivers. The available stratigraphic logs, the surficial geologic map, previous geophysical studies, and the hydrogeological model of the AB by Giannoulopoulos [36] provide insights that assisted in interpreting the average electrical resistivity depth slices. In general, the surficial geologic map and the stratigraphic logs provide spatially constrained lithological information and depth to bedrock. A synthesis of the geophysical studies suggests an undulating bedrock topography within the AB. In addition, the hydrogeological model suggests long sub-vertical electrically conductive features within an uneven bedrock.
The average electrical resistivity depth slices from 0–10 m (Figure 8A) and 20–50 m (Figure 8B) suggest that conductive earth materials dominate the uppermost 50 m with resistivities (<80 Ωm) typical of saturated alluvial deposits (Soupios et al. [1,2]; Koutsios et al. [4]; Kanta et al. [5]; Mollidor et al. [6]; von Papen et al. [7]; Yogeshwar et al. [8]; Kourgialas et al. [9]). The electrical resistivity depth slice from 0–10 m shows a dominant conductive anomaly with resistivity values <20 Ωm that widens coastwards and is wrapped by slightly less conductive materials (20 to 80 Ωm). The large conductive structure represents the fine-grained clastic sediments in the center of the sedimentary plain passing outwards into coarse-grained clastic sediments. This interpretation is remarkably consistent with the distribution of Late Neogene–Quaternary clastic sediments shown in the geologic map (see Figure 1). A local maximum electrical resistivity value of 300 Ωm occurs in the northernmost portion of the sedimentary plain, suggesting shallow weathered/fractured bedrock. This observation agrees with a group of drill holes that reached the bedrock (see Figure 1). The Inachos River runs west-east and then sharply turns southward (see Figure 1 and Figure 8A). The river’s current flow mirrors the geometry of the conductive structure (i.e., <20 Ωm, in Figure 8A). The Manessi River occurs immediately at the limits of all the electrical resistivity depth slices, and the Erasinos River occurs further out. Nonetheless, the rivers are responsible for most of the Late Neogene–Quaternary clastic deposition in the AB (Zangger [21]), and consequently, the low-resistivity values seen in-depth slices 0–10 m and 20–50 m (Figure 8A,B). The wider southern limits are attributed to the sedimentation and deposition of the three rivers.
The average electrical resistivity depth slice from 20–50 m also reveals a preeminent conductive anomaly with electrical resistivity values <20 Ωm bordered by incrementally higher resistivity values (Figure 8B). The prominent conductive anomaly is interpreted as deeper levels of the large conductive structure mapped in depth slice 0–10 m. The resistivity values from 20 to 120 Ωm correlate with the peripheral wedge of coarse-grained sediments of Quaternary age observed in the AB (see Figure 1). The resistivity anomalies with values between 120–300 Ωm are interpreted as more resistive structures linked to drier conditions of the peripheral young strata; and propagate deeper as shown in the northwestern, north-central, and eastern sections of depth slice 20–50 m (Figure 8B). The northwestern anomaly coincides with the easternmost edge of a west-east trending normal fault. The anomaly in the east occurs on the downthrown block of a northwest-southeast trending normal fault.
The depth slice of average electrical resistivity from 50–100 m (Figure 8C) depicts that the interpreted highly-fractured and strongly-weathered karstic bedrock with electrical resistivity values ≥300 Ωm dominates the central segment of the depth slice. The resistive structure or interpreted bedrock is laterally interrupted by conductive structures linked to the unconformably overlying young sedimentary wedge. This lateral (for the same depth) change in resistivity can be interpreted as a structural discontinuity such as a fracture zone or a fault zone. This assumption is strongly supported by the presence of various known normal faults and other subsurface geological features (at the same location where resistivity anomalies were found) that have been previously interpreted as long structural discontinuities in the hydrogeologic model of the AB (Giannoulopoulos [36]). Our TEM data supports the existence of normal faults and the interpretation of Giannoulopoulos [36].) The resulting electrical resistivity values ≥300 Ωm for the interpreted bedrock are of basin-scale proportions. The measured narrow low-resistivity range is explained by high porosity levels caused by diagenetic processes, episodes of brittle faulting and fracturing (see Hinojosa-Prieto and Hinzen [25]), a shallow water table (Karastathis et al. [23,24]), and highly conductive fluids (brines and leachates) that affect the porous bedrock of sedimentary origin.
Finally, the average electrical resistivity depth slice from 100–130 m (Figure 8D) also maps a prominent resistive structure. Only a few small and concentric conductive structures prevail at such depths, possibly the deepest stratigraphic levels of Late Neogene sediments. The resulting four depth slices of inverted average electrical resistivity suggest the occurrence of five long structural discontinuities that we interpret as conjugate (NW-SE and SW-NE trending), sub-vertical fracture zones. These geologic features are drawn as thick dashed black lines in Figure 8C,D. The features probably control the size and distribution of the detected concentric conductive structures and the Late Neogene–Quaternary deposition of clastic materials in the AB. The orientation of the proposed fracture zones is consistent with the known active to probable active normal faults shown in Figure 1. This idea implies that the fracture zones might share the same faulting history as the normal faults.

6. Discussion

Previous geophysical surveys in the AB have poorly constrained the depth and topography of the soil–bedrock interface. As of today, our TEM survey is the largest geophysical deployment done so far in the AB that attempts to constrain the thickness and geometry of the Late Neogene‒Quaternary sediment cover. However, there are areas with low TEM station coverage. Also, neither our TEM survey nor other geophysical surveys have sampled the corners of the AB. The surface area of the AB is about 300 km2. A geological engineering soil map for the greater Nafplion area covers ~33 km2 and identifies eighteen soil types. Our compilation and synthesis of the 185 vintage stratigraphic logs coupled with the average electrical resistivity depth slices and the engineering soil map collectively evidence the highly heterogeneous nature of the Late Neogene–Quaternary clastic deposits in the AB. Fault scarp data from normal faults of presumed Pliocene to Quaternary age, collected at outcropping bedrock locations, indicate an NW-SE oriented extensional stress field consistent with the pattern seen offshore (Papanikolaou et al. [53]; Georgiou and Galanakis [54].) The proposed subsurface structural discontinuities stemming from our TEM results agree with the distribution of normal faults in the AB (i.e., Photiades [38]) and the depositional pattern such faults control. Besides, the hydrogeological assessment of the AB (Giannoulopoulos [36]) proposes the presence of sub-vertical structural discontinuities in the AB’s bedrock without cross-cutting the overlying young sedimentary plain; an interpretation also reached from our TEM results.
The texture of clastic deposits in the AB decreases towards the center of the valley. Upper Pliocene marls, sandy marls, sandstones, and conglomerates crop out at the periphery of the AB, whereas Quaternary fine-to-coarse grained deposits dominate the inner part of the AB (see Figure 1). The shallow borings along the coastline reveal detail textural changes and contain dated materials, but they do not reach the carbonate bedrock. Conversely, the shallow stratigraphic logs are more scattered, lack dated materials, occasionally reach bedrock, reveal both vertical and lateral textural changes, and in general, shed light on the broader stratigraphic record of the AB. An irregularly thick clastic transgressive-regressive sequence with a distinctive, highly heterogeneous texture comprises the Late Neogene–Quaternary sediment wedge of the AB. The depth of the soil-bedrock contact is uneven and increases westwards due to the denser occurrence of normal faults. The interface between the Upper Pliocene sediments and the bedrock is mappable across the AB; however, the available auger cores along the coastline and the nearby shallow seismic studies reveal the Upper Pliocene–Quaternary stratigraphic contact at a local scale. The results of the TEM survey detect the depth-to-bedrock and the thickness and geometry of the unconformably overlying Late Neogene–Quaternary heterolithic clastic sequence.
The saltwater intrusion observed in the coastal area is already recorded and reported by drill holes along the coastline. The measured concentration of chlorine in the groundwater, especially at the shallow layers, exceeds the 35,000–40,000 mg/L threshold set by the Greek Ministry of Agriculture [55]. Considering that the concentration of chlorine in seawater is approximately 19,000 mg/L (see, e.g., Krieger [56]; Hem [57]), it is shown that the above high values are approximately twice the average seawater chlorine concentrations. Stratigraphic evidence shows that this coastal section is covered by sandy-clayey soils, which are, in turn, mantled by an extensive clay layer (Zangger [21]). In combination with the lowland slopes and the sea-level fluctuations in the broader study area, the composition of these layers resulted in repeated flooding of the soils with seawater. Subsequently, since the groundwater level was less than half a meter deep, evaporation resulted in the removal of water, and the continuous accumulation of salts resulted in the accumulation of chlorines in the groundwater, which in turn reached high levels (35,000–40,000 mg/L), also known as salt pan. Another brackish front that has emerged over the last decade is found in the NE front area of Manesi–Midea–Amygdalitsa–Monastiraki. The brackish front is related to the deeper karstic, fractured aquifer linked to the extensive normal faulting zone, and a seawater intrusion through a fracture zone network. We observed both an IP effect and an SPM effect in our TEM measurements. The IP effect causes transient responses that have negative polarity (anomaly) at late times. To avoid non-unique inversion results, we did not use late times of transient with IP. The SPM effect is likely caused by the metallic casing of some drill holes located at a short distance (<3–5 m) from the TEM’s wire loop; however, we avoided measuring close to drill holes.

7. Conclusions

One hundred and forty-two 1D inverted resistivity models from TEM soundings coupled with 185 vintage stratigraphic logs and available upfront geological and geophysical information were instrumental in characterizing the subsurface conditions of a young sedimentary basin. The main goal was to estimate the soil-bedrock interface across the basin and to detect subsurface geological/tectonic structures. The TEM technique is a quick and cost-effective way to investigate the soil-bedrock contact across a sedimentary basin without mapping individual beds of contrasting clastic materials in a thick heterogeneous clay-rich soil package. The present basin-scale TEM survey yielded several quasi-2D electrical resistivity profiles with lengths that traverse the whole AB in various directions. It also yielded a spatially constrained quasi-3D inverted average electrical resistivity model that varies from <1–360 Ωm. The TEM results were combined successfully with the 185 vintage stratigraphic logs and together shed light on the subsurface geological understanding of the AB. The integration of both data sets reveals the following: the Late Neogene–Quaternary clastic sequence is heterolithic in nature and irregularly thick (>180 m); the bedrock, comprised of Triassic–Upper Cretaceous strongly-weathered, highly-fractured karstic limestones thrusted over Paleogene flysch deposits, is affected by basin-scale, sub-vertical structural discontinuities; and the irregular soil‒bedrock interface suggests an undulating bedrock topography across the basin. In general, in the north, the young soil package thickens westwards towards two local normal faults. It is moderately thick in the center and thinner in the east. We attribute the uneven bedrock topography and the proposed sub-vertical discontinuities to episodes of Neogene‒Quaternary brittle extensional deformation in the Peloponnese and the karstification history of the region.

Author Contributions

Conceptualization, H.R.H.-P. and P.S.; methodology, H.R.H.-P. and P.S.; software, P.B.; formal analysis, P.B.; investigation, H.R.H.-P.; resources, H.R.H.-P. via doctoral studies; data curation, H.R.H.-P.; writing—original draft preparation, H.R.H.-P.; writing—review and editing, H.R.H.-P.; visualization, H.R.H.-P., P.B., P.S.; supervision, H.R.H.-P.; project administration, H.R.H.-P.; funding acquisition, H.R.H.-P. via doctoral studies. All authors have read and agreed to the published version of the manuscript.

Funding

This research: part of the HERACLES Project, was funded by the Fritz Thyssen Foundation, grant number Az. 10.11.2.39, and the Gerda Henkel Foundation, grant number AZ 25/F/11 awarded to Klaus-G. Hinzen at Cologne University, Germany.

Institutional Review Board Statement

Not applicable.

Informed Consent Statement

Not applicable.

Data Availability Statement

The data presented in this study are available on request from the corresponding author. The data are not publicly available due to a lack of a data hosting infrastructure.

Acknowledgments

TEM data collected in the frame of the HERACLES project. The corresponding author would like to thank Klaus G. Hinzen for allowing exploring of the exciting field of archaeoseismology during the HERACLES project; to Joseph Maran, Susanne Prillwitz, Ursula Damm-Meinhardt, Gregor Schweppe, and Claus Fleischer for invaluable logistic support; Eberhard Zangger for sharing the vintage Greek stratigraphic logs; to Nadine Haaf for early discussions of the TEM data; and to Alkestis Papadimitriou (4th Ephorate of Prehistoric and Classical Antiquities) for permitting the fieldwork. This work is part of the start-up fund (SF18063) of P.S. and is supported by the College of Petroleum Engineering and Geosciences (CPG), KFUPM. The authors, therefore, gratefully acknowledge the CPG for technical and financial support. We also thank the invited academic editor (Bülent Tezkan) and three anonymous reviewers for their comments and suggestions which improved the quality of the manuscript.

Conflicts of Interest

The authors declare no conflict of interest. The funders had no role in the study’s design, in the collection, analyses, or interpretation of data, in the writing of the manuscript, or in the decision to publish the results.

References

  1. Soupios, P.M.; Kalisperi, D.; Kanta, A.; Kouli, M.; Barsukov, P.; Vallianatos, F. Coastal aquifer assessment based on geological and geophysical survey, northwestern Crete, Greece. Environ. Earth Sci. 2010, 61, 63–77. [Google Scholar] [CrossRef]
  2. Soupios, P.M.; Barsukov, P.; Gurk, M.; Savvaidis, A. Regional tectonic model of Volvi Lake in northern Greece by applying 3D TEM modeling. In Proceedings of the 20th International Geophysical Congress and Exhibition of Turkey, Antalya, Turkey, 25–27 November 2013. Extended Abstract. [Google Scholar]
  3. Vallianatos, F. Transient Electromagnetic Method in the Keritis basin (Crete, Greece): Evidence of hierarchy in a complex geological structure in view of Tsallis distribution. Ann. Geophys. 2017, 60 (Suppl. S6), GM 675. [Google Scholar] [CrossRef] [Green Version]
  4. Koutsios, A.; Kontopoulos, N.; Kalisperi, D.; Soupios, P.; Avramidis, P. Sedimentological and Geophysical Observations in the Delta Plain of Selinous River: The Lost City of Ancient Helike. Bull. Geol. Soc. Greece 2010, 43, 654–662. [Google Scholar] [CrossRef] [Green Version]
  5. Kanta, A.; Soupios, P.M.; Barsukov, P.; Kouli, M.; Vallianatos, F. Aquifer characterization using shallow geophysics in the Keritis Basin of Western Crete, Greece. Environ. Earth Sci. 2013, 70, 2153–2165. [Google Scholar] [CrossRef]
  6. Mollidor, L.; Tezkan, B.; Bergers, R.; Löhken, J. Float-TEM: In-loop transient electromagnetic measurements on lake Holzmaar, Germany. Geophys. Prospect. 2013, 61, 1056–1065. [Google Scholar] [CrossRef]
  7. Von Papen, M.; Tezkan, B.; Israil, M. Characterization of an aquifer in Roorkee, India using the spatially constrained inversion of in-loop TEM data. Near Surf. Geophys. 2013, 11, 85–94. [Google Scholar] [CrossRef]
  8. Yogeshwar, P.; Tezkan, B.; Haroon, A. Investigation of the Azraq sedimentary basin, Jordan using integrated geoelectrical and electromagnetic techniques. Near Surf. Geophys. 2013, 11, 381–389. [Google Scholar] [CrossRef]
  9. Kourgialas, N.N.; Dokou, Z.; Karatzas, G.P.; Panagopoulos, G.; Soupios, P.M.; Vafidis, A.; Manoutsoglou, E.; Schafmeister, M. Saltwater intrusion in an irrigated agricultural area: Combining density-dependent modeling and geophysical methods. Environ. Earth Sci. 2016, 75, 1–15. [Google Scholar] [CrossRef]
  10. Autio, U.; Smirnov, M.Y.; Savvaidis, A.; Soupios, P.; Bastani, M. Combining electromagnetic measurements in the Mygdonian sedimentary basin, Greece. J. Appl. Geophys. 2016, 135, 261–269. [Google Scholar] [CrossRef]
  11. Demirci, I.; Candansayar, M.E.; Vafidis, A.; Soupios, P. Two Dimensional Joint Inversion of Direct Current Resistivity, Radio-Magnetotelluric, and Seismic Refraction Data: An application from Bafra Plain, Turkey. J. Appl. Geophys. 2017. [Google Scholar] [CrossRef]
  12. Kalisperi, D.; Kouli, M.; Vallianatos, F.; Soupios, P.; Kershaw, S.; Lydakis-Simantiris, N. A Transient ElectroMagnetic (TEM) Method Survey in North-Central Coast of Crete, Greece: Evidence of Seawater Intrusion. Geosciences 2018, 8, 107. [Google Scholar] [CrossRef] [Green Version]
  13. Rani, P.; Soupios, P.; Barsukov, P. Regional tectonic model of Southern, Central part of the Mygdonian basin (Northern Greece) by applying 3D Transient Electromagnetic Modeling. J. Appl. Geophys. 2019, 176, 104008. [Google Scholar] [CrossRef]
  14. Ruiz-Aguilar, D.; Tezkan, B.; Arango-Galvá, C.; Romo-Jones, J.M. 3D inversion of MT data from northern Mexico for geothermal exploration using TEM data as constraints. J. Appl. Geophys. 2020, 172, 103914. [Google Scholar] [CrossRef]
  15. Amorosi, A.; Farina, M.; Severi, P.; Petri, D.; Caporale, L.; Di Dio, G. Genetically related alluvial deposits across active fault zones: An example of alluvial fan-terrace correlation from the upper Quaternary of the southern Po Basin, Italy. Sediment. Geol. 1996, 102, 275–295. [Google Scholar] [CrossRef]
  16. Sweetkind, D.S.; Taylor, E.M.; Putnam, H. Stratigraphic Inferences Derived from Drill Hole Data of Tertiary Basin-Filling Rocks of the Pahrump Valley Basin, Nevada and California; US Geological Survey Open-File Report 2003-051; U.S. Geological Survey: Reston, VI, USA, 2003; p. 30.
  17. Taylor, E.M.; Sweetkind, D.S. Using Borehole data and three-dimensional models to map the groundwater system in the Amargosa Desert basin, Nevada and California. In Geological Models for Groundwater Flow Modeling-Workshop Extended Abstracts: Geological Survey of Canada; Thorleifson, L.H., Berg, R.C., Eds.; Open-File Report 5048; Government of Canada: Ottawa, ON, Canada, 2005; pp. 93–96. [Google Scholar]
  18. Sweetkind, D.S.; Drake, R.M., II. Geologic Characterization of Young Alluvial Basin-Fill Deposits from Drill-Hole Data in Yucca Flat, Nye County, Nevada; US Geological Survey Scientific Investigations Report 2007-5062; U.S. Geological Survey: Reston, VI, USA, 2007; p. 17.
  19. Papastamatiou, J.; Vetoulis, D.; Tataris, A.; Christodoulou, G.; Bornova, J.; Lalechos, N.; Kounis, G. Argos Sheet in Scale 1:50,000, Geological Map of Greece; Institute for Geology and Subsurface Research: Athens, Greece, 1960.
  20. Tataris, A.; Kallergis, G.; Kounis, G.; Bizon, G.; Christodoulou, G. Nafplion Sheet in Scale 1:50,000, Geological Map of Greece; Institute for Geology and Subsurface Research: Athens, Greece, 1970.
  21. Zangger, E. The Geoarchaeology of the Argolid; Deutsches Archäologisches Institut Athens: Gebr. Mann Verlag Berlin: Berlin, Germany, 1993; p. 153. [Google Scholar]
  22. Apostolidis, E.; Koutsouveli, A. Engineering geological mapping in the urban and suburban regions of Nafplion city (Argolis, Greece). Bull. Geol. Soc. Greece 2010, 43, 1418–1427. [Google Scholar] [CrossRef] [Green Version]
  23. Karastathis, V.K.; Karmis, P.; Novikova, T.; Roumelioti, Z.; Gerolymatou, E.; Papanastassiou, D.; Lakopoulos, S.; Tsombos, P.; Papadopoulos, G.A. The contribution to geophysical techniques to site characterization and liquefaction risk assessment: Case study of Nafplion city, Greece. J. Appl. Geophys. 2010, 72, 194–211. [Google Scholar] [CrossRef]
  24. Karastathis, V.K.; Papadopoulos, G.A.; Novikova, T.; Roumelioti, Z.; Karmis, P.; Tsombos, P. Prediction and evaluation of nonlinear site response with potentially liquefiable layers in the area of Nafplion (Peloponnesus, Greece) for a repeat of historical earthquakes. Nat. Hazards Earth Syst. Sci. 2010, 10, 2281–2304. [Google Scholar] [CrossRef] [Green Version]
  25. Hinojosa-Prieto, H.R.; Hinzen, K.G. Seismic velocity model and near-surface geology at Mycenaean Tiryns, Argive basin, Peloponnese, Greece. Near Surf. Geophys. 2015, 13, 103–113. [Google Scholar] [CrossRef]
  26. Hinzen, K.G.; Hinojosa-Prieto, H.R.; Kalytta, T. Earthquake site effects at Mycenaean Tiryns and Midea. Seismol. Res. Lett. 2016, 87, 1–15. [Google Scholar] [CrossRef]
  27. Hinzen, K.G.; Maran, J.; Hinojosa-Prieto, H.R.; Damm-Meinhardt, U.; Reamer, S.K.; Tzislakis, J.; Kemna, K.; Schweppe, G.; Fleischer, C.; Demakopoulou, K. Reassessing the Mycenaean Earthquake Hypothesis: Results of the HERACLES Project from Tiryns and Midea, Greece. Bull. Seismol. Soc. Am. 2018, 108, 1046–1070. [Google Scholar] [CrossRef] [Green Version]
  28. Soupios, P.; Kouli, M.; Vallianatos, F.; Vafidis, A.; Stavroulakis, G. Estimation of Aquifer Parameters from Surficial Geophysical Methods: A Case Study of Keritis Basin in Crete. J. Hydrol. 2007, 338, 122–131. [Google Scholar] [CrossRef]
  29. Domenico, P.A.; Schwartz, F.W. Physical and Chemical Hydrogeology, 2nd ed.; John Wiley & Sons, Inc.: New York, NY, USA, 1990; p. 324. [Google Scholar]
  30. Hinojosa-Prieto, H.R. Local Site Effects in Archaeoseismology: Examples from the Mycenaean Citadels of Tiryns and Midea (Argive Basin, Peloponnese, Greece). Ph.D. Thesis, University of Cologne, Cologne, Germany, 2016. [Google Scholar]
  31. Van Andel, T.H.; Zangger, E.; Perissoratis, C. Quaternary transgressive/regressive cycles in the Gulf of Argos, Greece. Quat. Res. 1990, 34, 317–329. [Google Scholar] [CrossRef]
  32. Van Andel, T.H.; Perissoratis, C.; Rondoyanni, T. Quaternary tectonics of the Argolikos gulf and adjacent basins, Greece. J. Geol. Soc. Lond. 1993, 150, 529–539. [Google Scholar] [CrossRef]
  33. Piper, D.J.W.; Perissoratis, C. Quaternary neotectonics of the South Aegean arc. Mar. Geol. 2003, 198, 259–288. [Google Scholar] [CrossRef]
  34. Anastasakis, G.; Piper, D.J.W.; Dermitzakis, M.D.; Karakitsios, V. Upper Cenozoic stratigraphy and paleogeographic evolution of Myrtoon and adjacent basins, Aegean Sea, Greece. Mar. Pet. Geol. 2006, 23, 353–369. [Google Scholar] [CrossRef]
  35. Ntageretzis, K. Paleotsunami Imprints in the Near-Coast Sedimentary Records of the Gulfs of Lakonia and Argolis (Peloponnese, Greece). Ph.D. Thesis, Johannes Gutenberg-University of Mainz, Mainz, Germany, 2014. [Google Scholar]
  36. Giannoulopoulos, P. Groundwater Hydraulics and Mathematical Modeling in Argos Plain. Ph.D. Thesis, Agricultural University of Athens, Athens, Greece, 2000. [Google Scholar]
  37. Mitropoulos, D.; Zananiri, I. Upper Quaternary evolution of the northern Argolis gulf, Nafplion area. Bull. Geol. Soc. Greece 2010, 43, 1474–1485. [Google Scholar] [CrossRef] [Green Version]
  38. Photiades, A. Geological contributions to the tectonostratigraphic of the Nafplion area (NW Argolis, Greece). Bull. Geol. Soc. Greece 2010, 43, 1495–1507. [Google Scholar] [CrossRef] [Green Version]
  39. Karmis, P.D.; Giannoupoulos, P.; Tsombos, P. Geophysical investigations at Nafplion city, Greece: Hydrogeological implications. Bull. Geol. Soc. Greece 2010, 43, 1447–1456. [Google Scholar] [CrossRef] [Green Version]
  40. Hübner, C.; Giese, S. Bericht zur Geophysikalischen Prospektion im Stadtgebiet von Tiryns. In Deutsches Archäologisches Institut Archäologischer Anzeiger; German: Berlin, Germany, 2006; Volume 1, pp. 163–169. [Google Scholar]
  41. Zananiri, I.; Hademenos, V.; Piteros, C. Geophysical investigations near the ancient Agora at the city of Argos, Greece. J. Geophys. Eng. 2010, 7, 171–182. [Google Scholar] [CrossRef]
  42. Applied Electromagnetic Research (AEMR). Available online: http://aemr.net/page2.htm (accessed on 17 May 2021).
  43. Constable, S.C.; Parker, R.L.; Constable, C.G. Occam’s inversion: A practical algorithm for generating smooth models from electromagnetic sounding data. Geophysics 1987, 52, 289–300. [Google Scholar] [CrossRef]
  44. Barsukov, P.O.; Fainberg, E.B. On the geoelectric structure of the Sphinx Area in Egypt. Near Surf. Geophys. 2016, 14, 39–45. [Google Scholar] [CrossRef]
  45. Strack, K.M. Exploration with Deep Transient Electromagnetics; Elsevier: Amsterdam, The Netherlands, 1992. [Google Scholar]
  46. Svetov, B.S.; Barsukov, P.O. Transformation of quasi-stationary geoelectric transient processes into equivalent wave processes. Izv. Phys. Solid Earth 1984, 8, 29–37. (In Russian) [Google Scholar]
  47. Barsukov, P.O.; Fainberg, E.B. On the Locality of Transient Electromagnetic Soundings with a Single-Loop Configuration. Izv. Phys. Solid Earth 2018, 54, 349–358. [Google Scholar] [CrossRef]
  48. Gubatenko, V.P.; Tikshaev, V.V. On changes in the sign of electromotive force of induction in the transient electromagnetic field method. Izv. Phys. Solid Earth 1979, 3, 95–99. (In Russian) [Google Scholar]
  49. Kaufman, A.A.; Keller, G.V. Frequency and Transient Soundings; Elsevier: Amsterdam, The Netherlands, 1983; p. 685. [Google Scholar]
  50. Barsukov, P.O.; Fainberg, E.B.; Khabensky, E.O. Shallow Investigation by TEM-FAST Technique: Methodology and Case Histories. In Electromagnetic Sounding of the Earth’s Interior Theory, Modeling, Practice, 2nd ed.; Spichak, V.V., Ed.; Elsevier: Amsterdam, The Netherlands, 2015; pp. 55–77. [Google Scholar] [CrossRef]
  51. BerdicheVsky, M.N.; Dmitriev, V.I. Magnetotelluric Sounding of Horizontally-Uniform Media; NEDRA: Moscow, Russia, 1992; p. 250. (In Russian) [Google Scholar]
  52. Reynolds, J.M. An Introduction to Applied and Environmental Geophysics, 2nd ed.; John Wiley & Sons: Hoboken, NJ, USA, 2011; p. 712. [Google Scholar]
  53. Papanikolaou, D.; Chronis, G.; Metaxas, C. Neotectonic structure of the Argolic gulf. Bull. Geol. Soc. Greece 1994, 30, 305–316. [Google Scholar]
  54. Georgiou, C.; Galanakis, D. Neotectonic study of urban and suburban Nafplion area (Argolida-Greece). Bull. Geol. Soc. Greece 2010, 43, 1428–1437. [Google Scholar]
  55. Greek Ministry of Agriculture. Water Level and Quality Control Measurements in Argolic Basin; Technical Report in Greek: Athens, Greece, 1963–1975. [Google Scholar]
  56. Krieger, R.A. The Chemistry of Saline Waters. Ground Water 1963, 1, 7–12. [Google Scholar] [CrossRef]
  57. Hem, J.D. Study and Interpretation of the Chemical Characteristics of Natural Water, 3rd ed.; Water Supply Paper 2254; United States Geological Survey: Reston, VI, USA, 1985; p. 280.

Short Biography of Authors
Hector R. Hinojosa-Prieto is currently the Principal Geoscientist at Cordillera Geo-Services, LLC and an Adjunct Faculty at the Department of Engineering Technology at Texas State University, San Marcos Texas, USA. He has contributed to industry and academic publications during his career, including geological surveys for regional tectonic studies, geophysical surveys, exploration of natural resources, earthquake studies of active and past seismicity, and geoarchaeological surveys geotechnical site characterization.
Pantelis Soupios is currently a professor of near-surface geophysics at the Department of Geosciences, College of Petroleum Engineering and Geosciences at the King Fahd University of Petroleum and Minerals, Kingdom of Saudi Arabia. Over his career, he has repeatedly worked at the interface between applied geophysics, environmental and engineering geology, natural hazard, hydrogeology, soil science, and chemistry.
Pavel Barsukov currently works at the Institute of Physics of the Earth, Russian Academy of Sciences. He researches TEM technology, 3D EM-modeling, TEM instruments. He has published more than 50 research papers at international journals and conferences and has two filled patents.
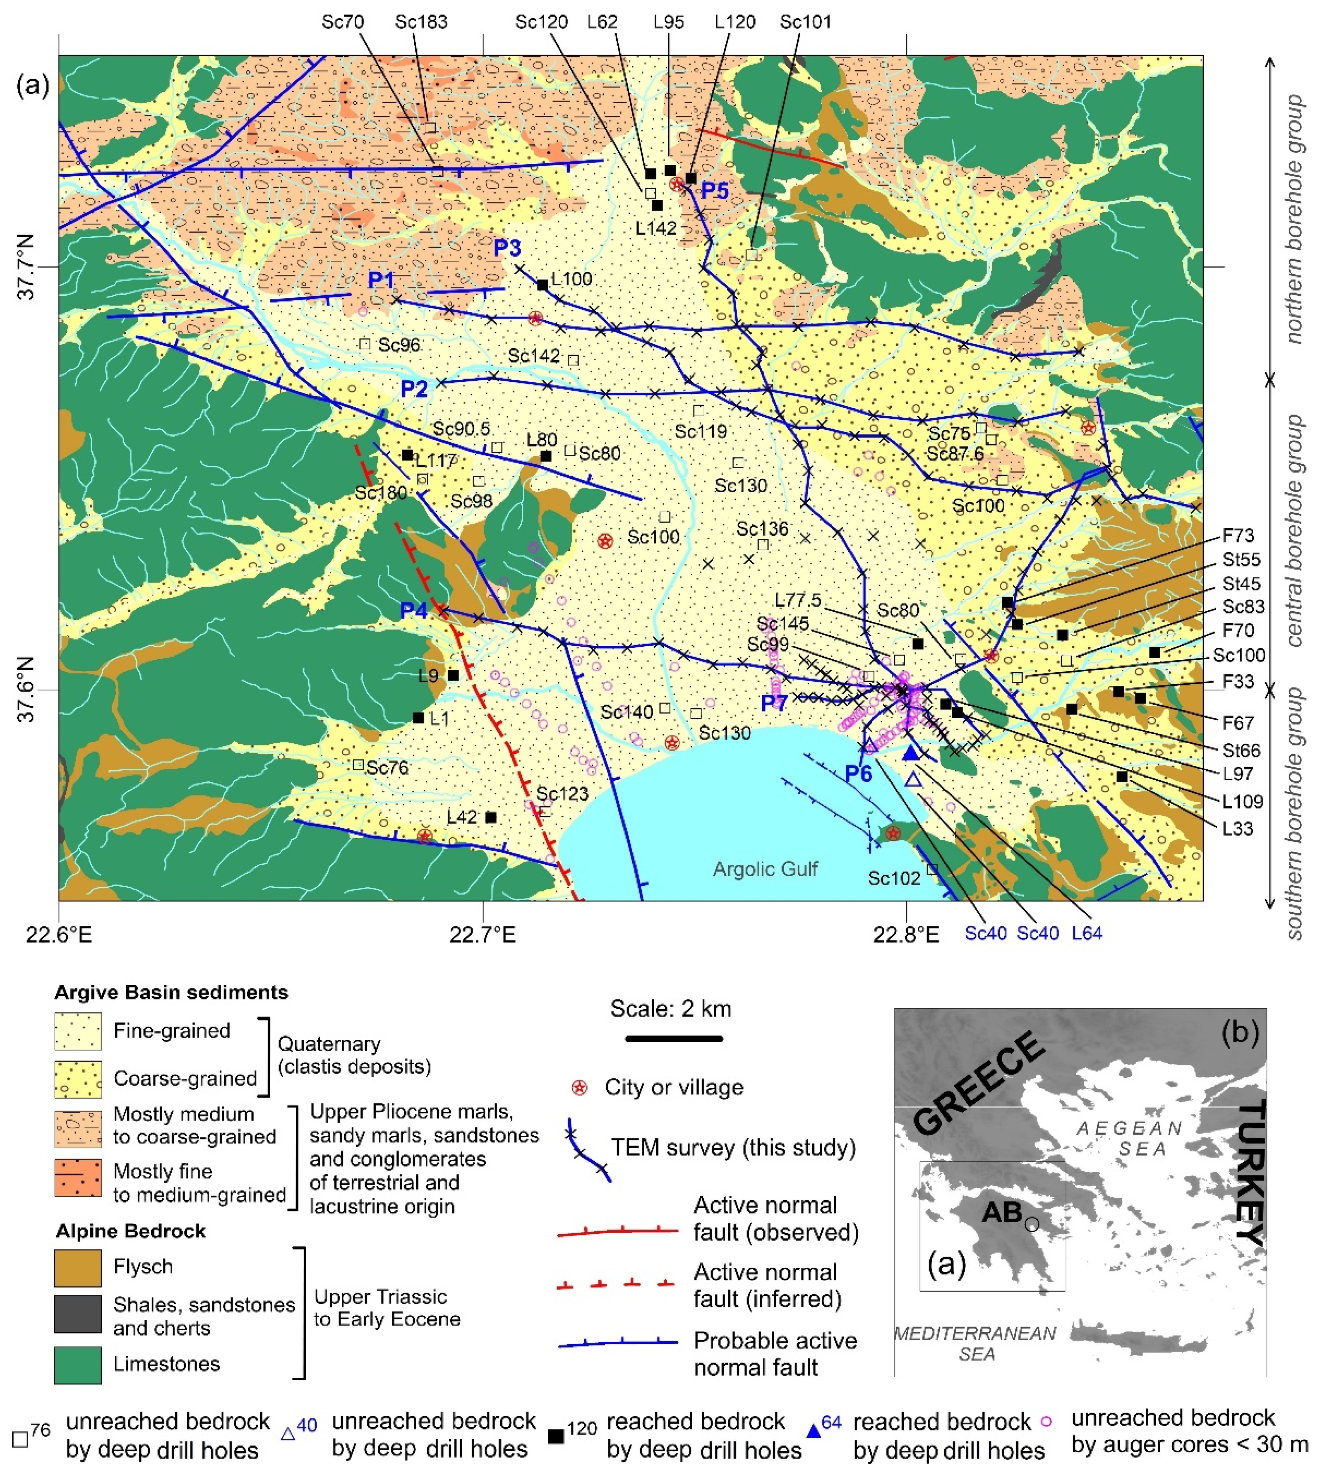
Figure 1. (a) Geologic map of the Argive Basin, Peloponnese, Greece (after Hinojosa-Prieto [30]) showing the distribution of the present TEM deployment, shallow drill holes (pink open circles: <30 m by Zangger [21]), and shallow drill holes (indicated by black open and filled squares: 30–185 m by Greek Service of Land Improvement [GSLI], unpublished data; blue open and filled triangles 40–64 m by Karastathis et al. [23,24]). Pink open circles correspond to shallow soil drill holes that did not reach the bedrock. Black open squares and blue open triangles correspond to shallow drill holes that did not reach the bedrock with drilling depth shown by adjacent numbers. Black-filled squares and blue-filled triangles correspond to shallow drill holes that reached the bedrock with depth to bedrock shown by adjacent numbers. (b) Index map of the Aegean region.
Geosciences 11 00317 g001
Figure 2. Field photograph of the exposed geologic contact between the Holocene fluviotorrential alluvial (A) and colluvial (B) unconsolidated deposits deposited over Triassic–Upper Cretaceous bedrock. Karstic limestone dominates the bedrock rock type. The photographs were taken in the easternmost central part of the AB.
Geosciences 11 00317 g002
Figure 3. Simplified vintage stratigraphic logs in the Argive Basin, Peloponnese, Greece (compiled by Hinojosa-Prieto [30] after GSLI, unpublished data, and Karastathis et al. [23,24]). A complex interbedding of different clastic textures are observed in the stratigraphic logs, suggesting heterolithic facies for the Late Neogene–Quaternary deposits. Stratigraphic logs that did not reach the bedrock are labeled in black by Sc (sedimentary cover) followed by a number that indicates the maximum drilling depth in meters. Stratigraphic logs that reached the bedrock are labeled in red by the type of rock (i.e., L for limestone, F for flysch, and or St for schist), followed by a number that indicates the depth to bedrock in meters. The dotted-blue line shown in the stratigraphic logs indicates the depth where the drilling reached the bedrock. (Note: The arrangement of the stratigraphic logs neither relates to the TEM profiles shown in Figure 1, Figures 6 and 7 nor intends to create geological cross-sections).
Geosciences 11 00317 g003
Figure 4. Transient response (A), apparent resistivity curve with time (B), and the transformation/inversion of the measured data (E(t)/I) to the ρ(h) dependence (C) from TEM station 058A. The blue circles in (A) correspond to the observed transient responses with time. The red curve with red circles in (B) labeled ρa(t) is the calculated apparent resistivity response by applying the asymptotic formula to the observed transient responses. The last graph (C) shows the transformation (dashed black line) and step-wise (layered) inversion (continuous black line) of the acquired data.
Geosciences 11 00317 g004
Figure 5. Measured TEM data (apparent resistivity with time) from five different TEM stations (102B, 081A, 123B, 063A, and 101A in the upper-left corner). The error bars in the raw TEM data were used for excluding some noise points from the inversion. Data with negative signal were not considered in the inversion process. The results after transformation (smooth curves with symbols) and Levenberg-Marquardt 1D inversion (piecewise uniform model) are also shown.
Geosciences 11 00317 g005
Figure 6. Example of 1D inversion of the TEM data (solid blue line) with nearby vintage vertical stratigraphic logs. The stratigraphic logs L97 and L109 reach bedrock at 97 m and 109 m, respectively, and are located ~418 m and ~630 m eastward from TEM station A009C on profile P4 (also shown in Figure 7). The stratigraphic logs suggest that the resistivity structure of a young sedimentary cover deposited over a weathered and fractured bedrock should yield a low to high resistivity pattern, where the low-resistivities correspond to the clastic sequence over a high-resistivity half-space (bedrock). The TEM soundings support this resistivity structure.
Geosciences 11 00317 g006
Figure 7. Map of the Argive Basin (lower right) showing the distribution of the quasi-2D electrical resistivity profiles (blue lines) across the basin. The higher resistivity anomalies (300 Ωm) shown in all profiles represent the interpreted bedrock formation. The lower resistivity anomalies in tones of blue to yellow represent the thick and irregular Late Neogene–Quaternary heterolithic clastic deposits. The geologic interface between the heterolithic sedimentary cover and the weathered and fractured bedrock is traced across all quasi-2D resistivity profiles. The lower resistivity anomalies within the interpreted bedrock formation represent sub-vertical-to-vertical structural geologic discontinuities (e.g., fracture zones, faults, or patches of highly-weathered rock). It should be mentioned that during the inversion and final interpretation of the resulted quasi-2D sections, blocky structures such as the one shown in P4 beneath the WDS can appear as artifacts [type H (p1 > p2 < p3) curve where the resistivity of the middle layer (leachates with a resistivity less than 1 Ωm) is less than 20 times the resistivity of the layer above and below (~300 Ωm), Reynolds [52]. For example, the resistivity anomaly in the SW end of Profile P6 corresponds to a saline water intrusion (SWI). All quasi-2D resistivity profiles have vertical exaggeration shown by the label V/H.
Geosciences 11 00317 g007
Figure 8. Depth slices of average electrical resistivity (AD) for the Argive Basin derived from the TEM deployment. The depth slices are plotted over the digital terrain model and known normal faults and structural features. Depth slices in (AD) are for 0–10 m, 20–50 m, 50–100 m, and 100–130 m, respectively. For simplicity, only (A) shows the distribution of the TEM sounding stations and the vintage stratigraphic logs (drill holes). Both the depth to bedrock and interpreted structural discontinuities from Giannoulopoulos [36], plotted in (C,D), agree with the TEM results, the gravity results from Karastathis et al. [23], and the well-known structural geologic conditions (Europe UTM Zone 34N coordinate system).
Geosciences 11 00317 g008
Publisher’s Note: MDPI stays neutral with regard to jurisdictional claims in published maps and institutional affiliations.