Article

Vertical Land Motion as a Driver of Coastline Changes on a Deltaic System in the Colombian Caribbean

1
Department of Geography, University of Victoria, Victoria, BC V8P 5C2, Canada
2
Department of Geography, UC Santa Barbara, Santa Barbara, CA 93106, USA
3
Department of Geosciences, Virginia Tech, Blacksburg, VA 24061, USA
*
Author to whom correspondence should be addressed.
Geosciences 2021, 11(7), 300; https://doi.org/10.3390/geosciences11070300
Submission received: 24 May 2021 / Revised: 3 July 2021 / Accepted: 15 July 2021 / Published: 20 July 2021
(This article belongs to the Special Issue Shoreline Dynamics and Beach Erosion)

Abstract

:
To face and properly mitigate coastal changes at a local level, it is necessary to recognize and characterize the specific processes affecting a coastline. Some of these processes are local (e.g., sediment starvation), while others are regional (e.g., relative sea-level change) or global (e.g., eustatic sea-level rise). Long tide gauge records help establish sea-level trends for a region that accounts for global (eustatic, steric) and regional (isostatic) sea-level changes. Local sea-level changes are also the product of vertical land motion (VLM), varying depending on tectonic, sedimentological, and anthropogenic factors. We investigate the role of coastal land subsidence in the present-day dynamics of an abandoned delta in the Colombian Caribbean. Satellite images and synthetic aperture radar acquisitions are used to assess decadal-scale coastline changes and subsidence rates for the period 2007–2021. We found that subsidence rates are highly variable alongshore. Local subsidence rates of up to −1.0 cm/yr correspond with an area of erosion rates of up to −15 m/yr, but coastal erosion also occurs in sectors where subsidence was not detected. The results highlight that local coastline changes are influenced by multiple, interacting drivers, including sand supply, coastline orientation and engineering structures, and that subsidence alone does not explain the high rates of coastal erosion along the study area. By the end of the century, ongoing coastal erosion rates of up to −25 m/yr, annual rates of subsidence of about −1 cm/yr, and current trends of global sea-level rise are expected to increase flooding levels and jeopardize the existence of the deltaic barrier island.

1. Introduction

The Intergovernmental Panel on Climate Change forecasts rates of sea-level rise (SLR) between 8 and 16 mm/yr by the end of the century, resulting in a global sea-level rise between 0.52 to 0.98 m for a high greenhouse gas emission scenario [1]. Adding to the predicted increases of global mean sea level (GMSL), the upward or downward movement of the land surface—also known as vertical land motion (VLM)—may exacerbate relative sea-level (RSL) changes at local scales. Changes in RSL result from the combined effect of the mean sea-level height (i.e., GMSL) and VLM [2], and it is measured relative to a local tide gauge benchmark [3]. The most common triggers of VLM are glacial isostatic adjustments (GIA), earthquakes and tectonics, aquifer compaction and sediment consolidation [3,4]. Where VLM takes place near the coast, it may modify the coastline by the emergence or submergence of the terrain [2], resulting in, for example, shoreline progradation or retreat, respectively. Within the various causes of VLM, this work focuses on subsidence, defined as the downward movement of the land surface with respect to a datum or point of reference [5], and how it relates to coastal morphodynamics. Subsidence is driven by factors such as natural sediment compaction [6], fault displacements [5], or human actions (e.g., groundwater extraction [7], withdrawal of petroleum and natural gas [8], soil desiccation [9]).
Deltas are common coastal landforms formed by the deposition and reworking of sediments from river systems where they enter larger bodies of water, such as oceans or lakes. Worldwide, most large deltas are subsiding at rates faster than the present global sea-level rise [10]. In the case that abundant sediment supply exists, a trade-off can be established between sediment delivery and subsidence in deltaic areas: the sediment deposition that triggers subsidence also helps compensate for or exceeds the subsidence. For instance, in some locations of the Mekong Delta in Vietnam, sediment accretion exceeds compaction rates, resulting in a net elevation gain of the delta surface [6]. However, when the delivery of fluvial sediment supply decreases, sediment compaction is no longer balanced by sediment deposition [6]. In this case, as the sediment matrix compresses and dehydrates, fluid pressure decreases and organic carbon-rich materials, if present, oxidize to carbon dioxide, resulting in a total mass and volume loss within the soil column [9] (Figure 1). Törnqvist et al. [11] noted that, adding to the sizeable natural component of subsidence due to isostatic flexure and the compaction of young sediments, subsidence caused by artificial drainage of wetlands and groundwater withdrawal can be up to an order of magnitude faster. For instance, using interferometric synthetic aperture radar (InSAR), VLM of up to −8 mm/yr have been measured in the coastal plain of the Selle River mouth (southern Italy) [12] and of up to −5 mm/yr in the Tiber Delta in Rome [13]. Additionally, Zhang et al. [14] reported average VLM rates of −5.1 mm/yr in the modern Yellow River Delta from 1992 to 2000.
Whilst the role of subsidence as a natural driver of delta growth and abandonment has been recognized and coined as the cyclic evolution of deltas [15], its influence in the evolution of coastal landscapes and the seaward progradation (i.e., accretion) or landward retreat (i.e., erosion) of coastlines has not been fully addressed. Despite subsidence being recognized as one of the key controls on coastline changes [13,16,17], the majority of research has focused on the added impact of current subsidence rates and rising sea levels for future scenarios of inundation and erosion (e.g., [12,18]). However, local-scale studies can help to better understand how VLM (subsidence or emergence) translates to coastline changes and related geomorphic responses. Accordingly, this study aims to support evidence-based policymaking by (i) testing the application of InSAR interferometry to estimate the rates and spatial distribution of VLM in a coastal setting, and (ii) linking VLM to recent coastline evolution derived from satellite imagery along a deltaic barrier.

Study Site

The study area is located in the Colombian Caribbean, between the municipalities of Ciénaga and Barranquilla (Figure 2). The area extends 70 km along the coastline eastward from the mouth of the Magdalena River. As the largest basin in Colombia, the Magdalena River and its tributaries cover 257,438 km2 [19] and its discharge averages 10,287 and 4068 m3/s during high and low flows, respectively [20]. Eight major shifts in delta location have been reported for the river since the Pliocene, the latest of which has occurred since the mid-Holocene, by way of a westward migration of a former river mouth located by the Ciénaga Grande de Santa Marta (hereafter CGSM) to its present location [21] (Figure 2). Adding to the natural displacement of the delta, human-made structures associated with a harbor built in the 1920s near the mouth of the river have confined its mouth to a single channel, thus further reducing the present influence of the Magdalena River in the study area [22]. Moreover, a highway built next to the coastline in the 1950s to connect the cities of Barranquilla and Santa Marta formed a causeway for the otherwise free interchange of water between ocean and lagoons, producing accelerated degradation and mortality of mangrove forest due to hypersalinization [23].
The conditions described above have favored a transition of the landscape from fluvial to littoral-dominated process, portrayed by a palimpsest of fluvial and marine landforms such as channels, lagoons, oxbow lakes, salt plains, beaches, and dunes shaped by the predominant northeasterly trade winds [24] (Figure 2). Following Oertel [25], the landforms required to make up a barrier island system are present in the study area (i.e., mainland, backbarrier lagoon, barrier island, barrier platform, shoreface, inlets and inlet deltas). The sediments associated with these landforms, originated in marine and fluvio-lacustrine environments [26], range from poorly consolidated sands along the shorefront to laminated muds within lagoons and in the backshore. These Holocene sediments are bounded on the east side by the Santa Marta Bucaramanga Fault (SMBF), a regional-scale striking left-lateral structure that extends 374 km from the Caribbean coast to the eastern range of Colombia (Figure 2a) [27,28]. The fault marks a contrasting relief change between the Sierra Nevada de Santa Marta range east of the structure, and the flat topography of the Magdalena Delta floodplain to the west. According to the records of seismological activity in the area, there is no evidence of significant earthquakes associated with the SMBF with magnitudes (mb) larger than 4.9 since instrumental records are available (i.e., 1984). The few earthquakes registered for the observational period have magnitudes (mb) of less than 4.6 [29] (location of epicenters shown in Figure 2a).
Rapid coastline changes have been identified in the study area since the 1950s, affecting natural and human resources; specifically, coastal erosion rates increase alongshore in the same direction as the littoral drift (east–west) [24]. Chronic erosion is threatening the highway that connects the cities of Barranquilla and Santa Marta and, consequently, a rock rip-rap structure was built in 2014 to protect the highway from continuous erosive processes in a point known as the 20th km (the 0 km is located at the outskirts of Barranquilla) [30] (Figure 2). This hard structure has fixed the coastline in that area, but adjacent sectors keep rapidly retreating landward. The causes of coastal retreat have not been fully identified. A regional analysis of the sea-level trends for the Caribbean coast between 1950 and 2001 found a statistically significant sea-level rise trend of approximately 2 mm/yr [31]. Moreover, a sea-level rise of 5.3 mm/yr between 1950 and 2010 was measured at a tide gauge station located in Cartagena, approximately 100 km southeast of the study site [32], which indicates that, in addition to regional sea-level rise, there might be additional drivers contributing to the observed coastal retreat. Based on data from a global navigation satellite system (GNSS) station, subsidence velocities between −1.78 and −1.82 mm/yr have been quantified for Cartagena [33]. The influence of the rate of RSL change on barrier behavior is not completely understood, but some of the known effects of RSL rise include reworking of sand eroded from barrier fronts into transgressive dunes and shifts in sediment supply due to the modification of slope and course of rivers [34].

2. Materials and Methods

A two-fold approach was followed: (i) coastline changes were assessed using the USGS Digital Shoreline Analysis System (DSAS) tool [35] for 2010–2020, and (ii) VLM rates were quantified using Synthetic Aperture Radar (SAR) interferometric analysis of images acquired for the periods 2007–2011 and 2017–2021. The results of these approaches were illustrated and contrasted to establish the relationship between coastline changes and VLM.

2.1. Coastline Changes

Satellite images taken by GeoEye-1 and SkySat-1 platforms with 5 and 3 m ground pixel resolutions, respectively, were used to trace coastlines between 2010 and 2020. Using this imagery, past coastlines were visually delineated along the limit between wet and dry sediment. This well-established methodological approach [36,37,38] provides a proxy for the mean high water line (MHWL). Once a set of coastlines were established, changes were quantified using DSAS [35]. From the various statistics that DSAS produces, the average-of-rates (AOR) method, obtained by averaging the values resulting from the distance between each pair of available coastlines divided by the time between surveys, was selected to assess the rates of coastline changes over time. The AOR values were processed for transects spaced at 100 m intervals, perpendicular to a reference baseline traced parallel to the coastline. Accordingly, for two consecutive years, the accuracy of the coastline position depends on the image resolution (5 or 3 m), the georeferencing error (estimated to be 1 m), and a physical component of the error related to the magnitude of the tidal changes and slope of the beach (as intertidal range/tan (slope)) [17,39]. The latter was assessed by using an average beach slope of 9.0° (pers. obs. June/2019), and a maximum intertidal range of 0.4 m. Determining the quadratic sum of each of these components yielded an annual maximum uncertainty for coastline change estimates of ±5.0 m/yr.

2.2. Vertical Land Motion Rates

SAR images from the Advanced Land Observing Satellite (ALOS) L-Band and Sentinel-1A/B C-Band satellites (search.asf.alaska.edu (accessed on 14 May 2021)) were gathered for the periods July 2007 to February 2011 and February 2017 to February 2021, respectively (see details in Table 1). The ALOS data were acquired along ascending orbit geometry, whereas ascending and descending orbits acquisitions were used for Sentinel-1. Interferograms for selected pairs of images were created and unwrapped using GAMMA, an InSAR processing software [40]. The analysis began with co-registering Single Look Complex (SLC) images to a reference image, which includes a standard matching algorithm using a digital elevation model (DEM), precise orbital parameters, and amplitude images [41]. For the Sentinel-1A/B datasets, the step above was followed by an enhanced spectral diversity (ESD) approach [42,43]. Using this dataset, a set of high-quality interferograms was generated, where only those interferograms with short perpendicular and temporal baselines were processed. A multi-looking operator of 20 and 4 pixels in range and azimuth was applied to obtain a ground resolution cell of approximately 46.0 m × 56.4 m (Table 1). The corresponding figures for ALOS are 6 and 3 pixels in range and azimuth, resulting in a ground resolution of 38.5 m × 23.6 m (Table 1).
To calculate and remove the effect of topographic phase and flat earth correction [44], a 1-arcsecond (~30 m) Shuttle Radar Topography Mission DEM [45] and precise satellite orbital information were used. To identify the elite (i.e., less noisy) pixels, only those pixels with average coherence larger than 0.65 were considered in the analysis, a value that has been used in coastal landscapes with conditions similar to the study area [12,46]. To retrieve the absolute (unwrapped) phase values, a minimum cost flow (MCF) algorithm adapted for sparsely distributed elite pixels was applied (see unwrapping in in Figure 3). Although the precise orbits are used, a few interferograms were still affected by a ramp-like signal, which was removed by fitting a second-order polynomial to their unwrapped phase [47]. Several wavelet-based filters were further applied to correct for effects of spatially uncorrelated topography error and topography correlated atmospheric delay [48] (see atmospheric and orbit correction in Figure 3). Subsequently, a re-weighted least square approach was iteratively applied to invert the corrected measurement of the unwrapped phase at each elite pixel and solve the surface deformation time series. The effect of residual atmospheric errors was further reduced by applying a high pass filter based on continuous wavelet transform to the time series of surface deformation at each elite pixel. Finally, an estimate of the long-term line-of-sight (LOS) deformation rate was obtained as the best-fitting linear slope (hereafter velocity) to the time series of surface deformation at each elite pixel. Together with the LOS velocities, an estimation of the residuals for each elite pixel is provided by plotting the standard deviation of the LOS velocities.
For the Sentinel-1A/B dataset, by combining the ascending and descending LOS velocities in Equation (1), the vertical velocities were retrieved in Cartesian coordinates over those areas where scatterers of both tracks overlap or are in close proximity [49].
dz ≈ (DlosAsc + DlosDesc)/2 cosθ
where DlosAsc and DlosDesc are the LOS velocities along the ascending and descending orbits, θ is the incidence angle, and dz is the projection of the displacement along the vertical Cartesian axis.
Only the Sentinel-1A/B dataset, therefore, yielded true estimates of VLM. In the case of ALOS data, a qualitative comparison was carried out between its LOS velocities and those obtained after processing the Sentinel-1A/B dataset. It should be noted that in using LOS velocities, the horizontal and vertical velocities are not separated for the observed period. The qualitative comparison between the velocities was made after performing an inverse distance weighted (IDW) interpolation model for transforming the discrete points representing VLM and LOS velocities of individual scatterers into a continuous surface. IDW has been used to interpolate InSAR scattered data points where a relationship or influence over neighboring data is not proven [49]. After running the IDW using a 120-m neighborhood search radius weighted with a cubic exponential power, a 100-m resolution, continuous velocity surface was obtained. A Moran’s I test was used to support the choice of distances above for the IDW interpolation. The steps and parameters to obtain the VLM are summarized in Table 1 and Figure 3. Lastly, aggregations of both the VLM and coastline change transects at 1.5 and 5 km resolutions were performed to examine the effect of scale on our observations. The results are presented in the Supplementary Materials.
Figure 3. Flow diagram of interferometric processing of InSAR data (modified from Li et al. [50]).
Geosciences 11 00300 g003
Uncertainties in VLM rate estimates arise from the backscatter signal being affected by soil structure and moisture [51,52], resulting in apparent ground deformation values that may reach 0.5 radians [53]. Considering this value as the maximum uncertainty level, an annual uncertainty of ±0.2 cm/yr and ±0.7 cm/yr is expected for Sentinel-1A/B and ALOS, respectively. Adding to soil variability, the amount of radar wave penetration in areas with vegetation coverage depends on the structure and density of the canopy and the radar wavelengths; accordingly, wavelengths less than 10 cm (C-band, e.g., Sentinel-1A/B) mostly sense the upper portions of vegetation whilst wavelengths longer than 20 cm (L-band, e.g., ALOS) penetrate deeper into the canopy and can interact with the ground [54], yielding higher coherence values than C-band data [55]. Consequently, ALOS has proven to be more effective in reaching scatters below sparse vegetation [56,57].
Last, the deformation values obtained using SAR data were compared and validated with the velocity values from two permanent GNNS stations located in Barranquilla (11.0197°/−74.8496°) and Santa Marta (11.2253°/−74.1870°). Despite these stations being situated outside the study area, the satellite frames covered their locations, rendering them helpful to establish whether the trends found using these two approaches were alike (see Figure 2 for the location of GNSS stations).

3. Results

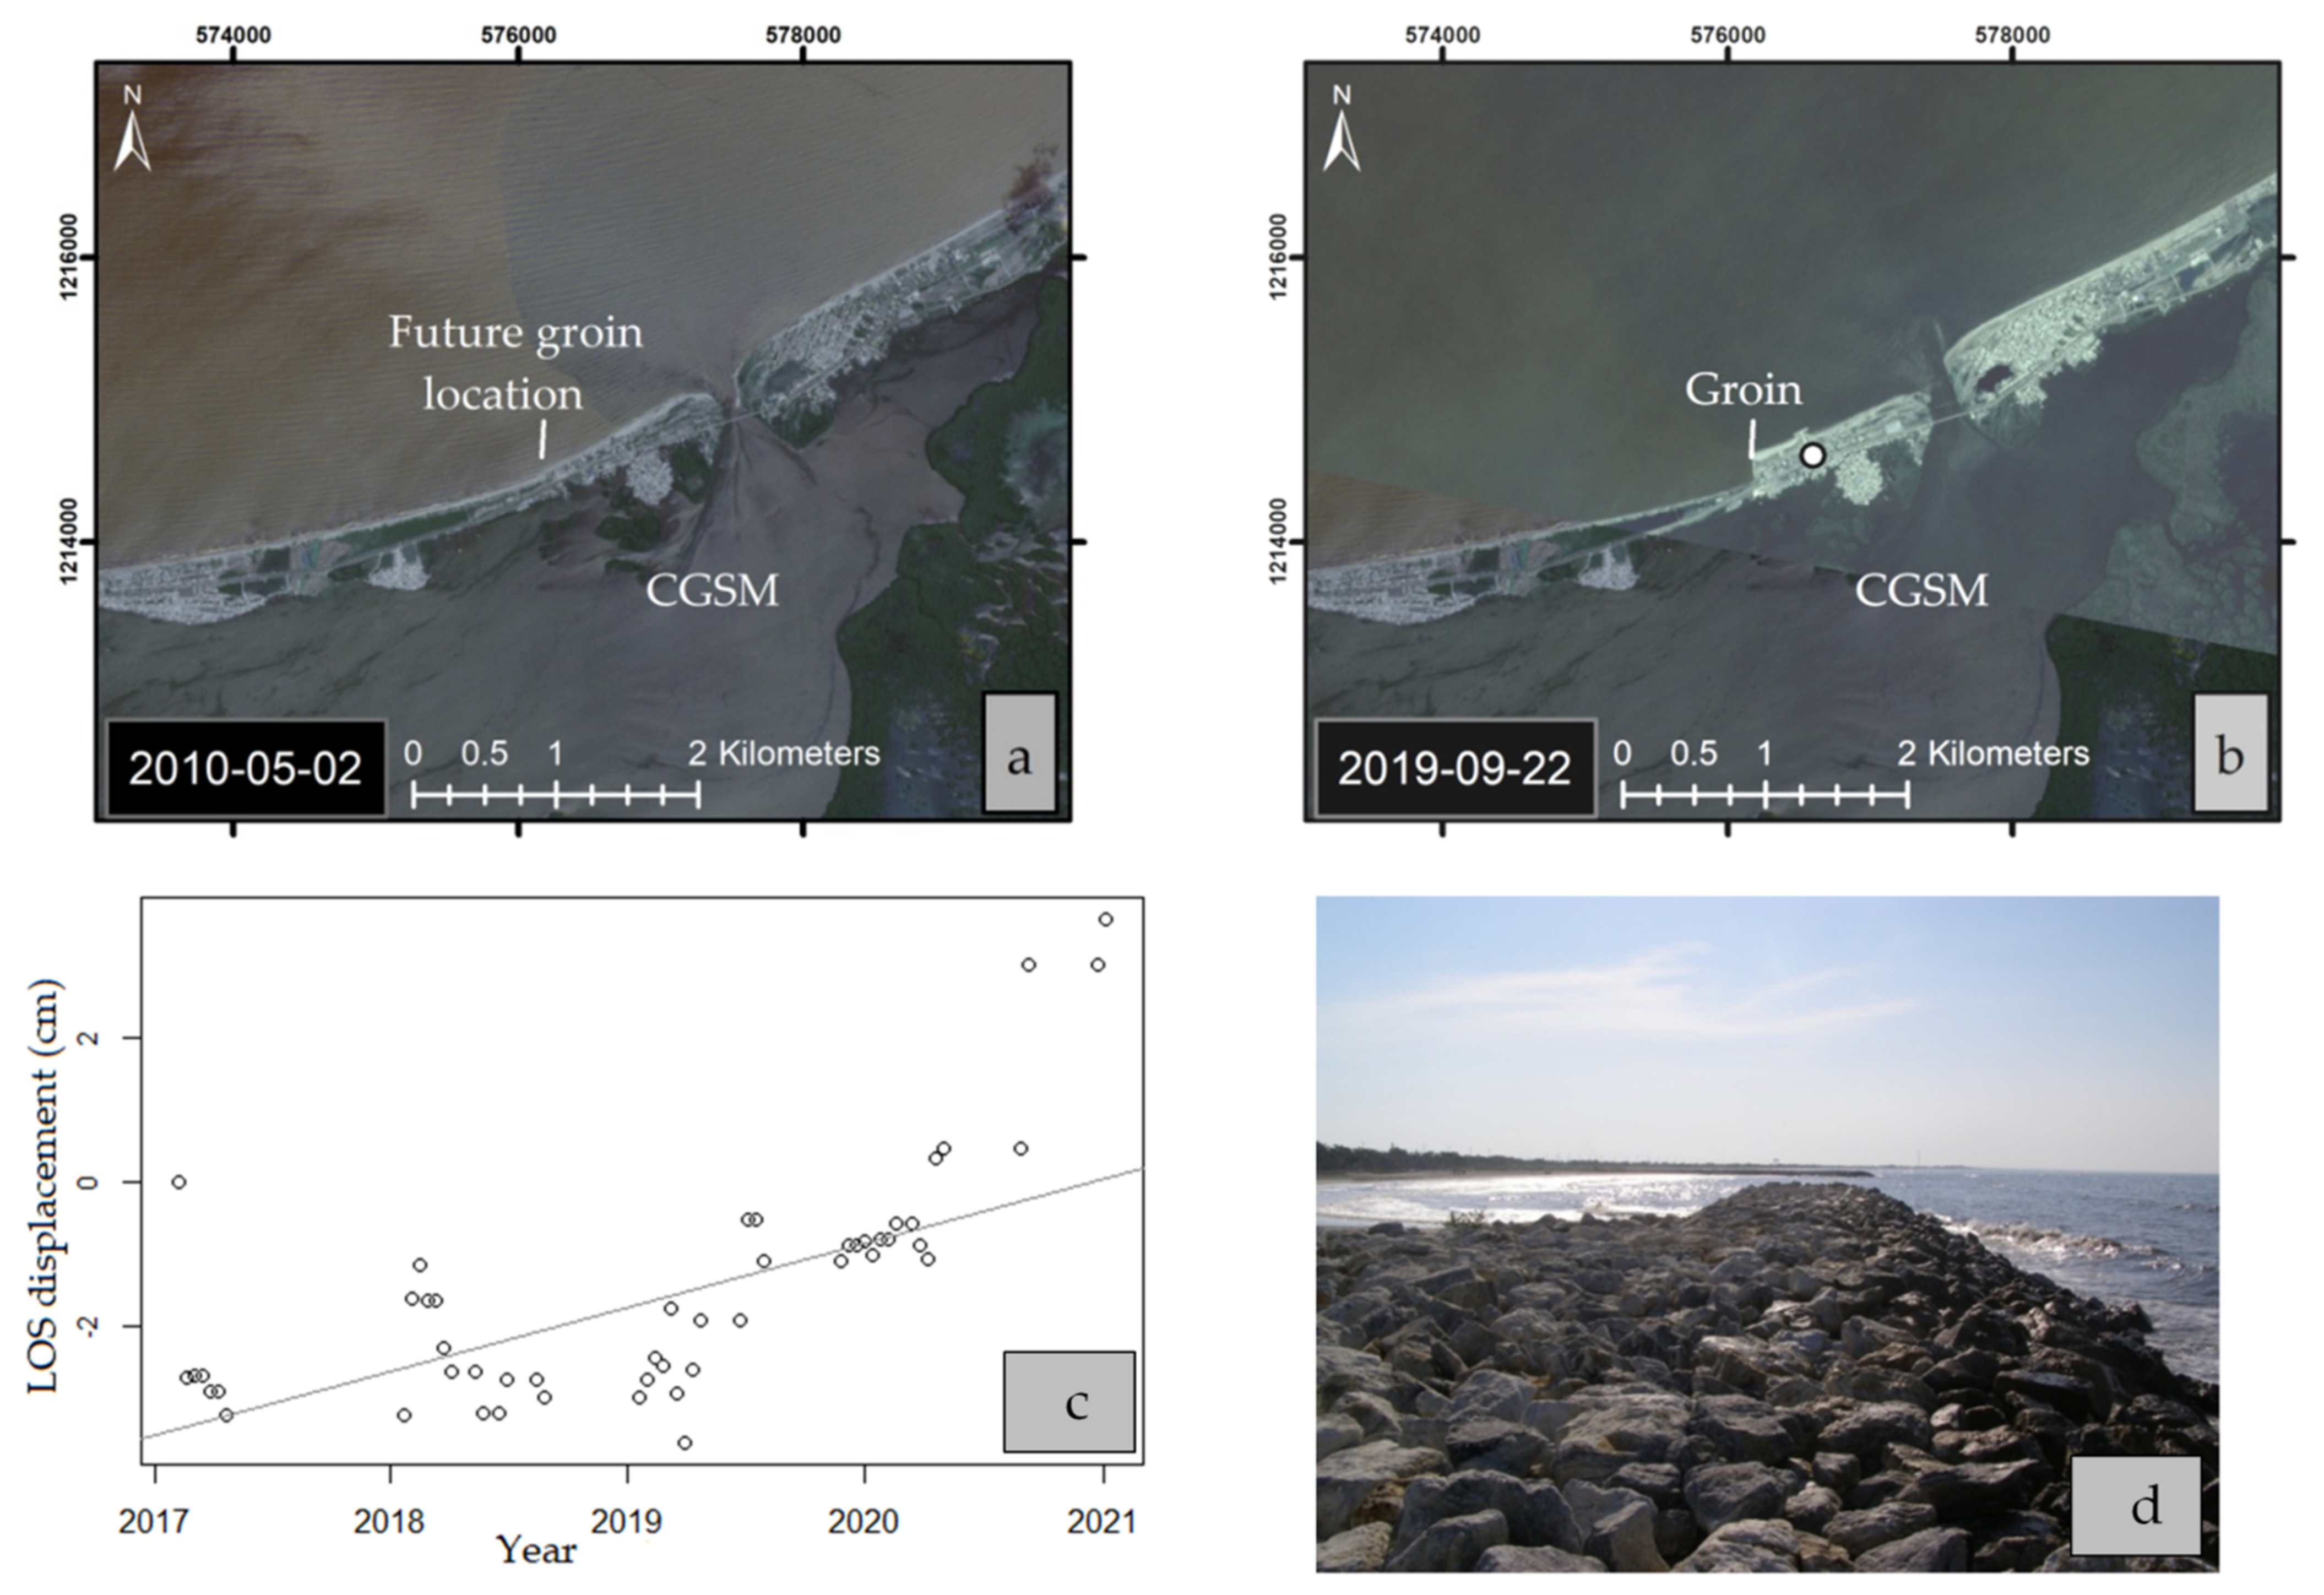
3.1. Coastline Changes

The average annual horizontal coastline change rates for 2010–2020 ranged from over −25 to +15 m/yr (Figure 4). Erosion rates increased alongshore in the same direction as the littoral drift (east–west). The only exceptions to the predominant erosive regime occurred on the westernmost segment of the study area where accretion rates larger than +10 m/yr were identified. Localized accretion was also observed on the east side of the mouth of the CGSM and next to two groins built west of the coastal town of Ciénaga in the early 2010s (see white and green colors in Figure 4).
From the mouth of the CGSM to the 20th km, erosion ranged between −1 and −10 m/yr (see pink and yellow transects in Figure 4). This erosion peaked along the stretch between the 20th km and La Atascosa lagoon (orange and red transects in Figure 4) and reached local average values up to −25 m/yr. Erosion rates progressively decreased westward from this lagoon and changed to accretion west of the El Torno lagoon (see green colors in Figure 4), where a levee, built at the mouth of the Magdalena River, hampers the westerly movement of sediment. The most significant erosion rate values for 2010–2020 occurred seaward of La Atascosa lagoon. Upon inspection of the imagery, it was observed that this largest average erosion rate was produced from the migration of an inlet after a breach of the lagoon in 2016.

3.2. Vertical Land Motion (VLM) and Line of Sight (LOS) Velocities

For both ALOS and Sentinel-1A/B data, vegetation coverage and the high dynamics of the coastline resulted in areas below the coherence threshold of 0.65 established in this work. Thus, there is a lack of information westward of Cuatro Bocas lagoon, where wetlands and vegetation are widespread (Figure 5 and Figure 6). However, bare and sparsely vegetated terrain along the barrier island, particularly in the eastern and central areas where salt plains, stabilized dunes, and paleo-beaches are typical, provides a continuous strip of sufficient return signal, achieving the coherence threshold.
VLM velocities, calculated by combining the LOS velocity vectors of Sentinel-1A (i.e., ascending track) and Sentinel-1B (i.e., descending track) are shown in Figure 5. The Supplementary Materials show the same results of Figure 5 after aggregating the data in 1.5 and 5 km sections. In the coastal town of Ciénaga and northeast from this location, it is observed that VLM velocities are larger than −0.5 cm/yr, and decrease (i.e., become more negative) around the CGSM. West of Ciénaga and seaward from the CGSM, the signal is patchy. Subsidence rates are the largest westward from the location known as Kangarú (see Figure 2b for location), reaching values of up to −1.0 cm/yr along the stretch of coast between Kangarú and Cuatro Bocas lagoon, a sector characterized by erosion rates larger than 5 m/yr (see yellow and orange transects in Figure 5). In contrast, velocities larger than +0.5 cm/yr were observed west of the CGSM mouth (see dark blue in Figure 5).
LOS velocities from Sentinel-1A and B show the same trend as the overall VLM (Figure 5) along the deltaic barrier island, suggesting that the vertical component of land displacement dominates over the horizontal component at this incident angle (Figure 6a,b). LOS velocities related to scatterers in the coastal town of Ciénaga were around zero for all three tracks illustrated in Figure 6, and became smaller (i.e., subsidence increased), southward from the town, towards the eastern margin of the CGSM. Westward from the town Ciénaga, specifically in the stretch of coast between the mouth of the CGSM to Kangarú (see Figure 2b for locations), LOS velocities of Sentinel-1A showed a zone ranging from 0 to +0.5 cm/yr (white colors in Figure 6a), whereas both ALOS and Sentinel-1B indicated LOS velocities ranging between −0.5 and −1.5 cm/yr (see orange and brown colors in Figure 6b,c). Westward of Kangarú (close to site 2 in Figure 6a), the LOS velocities of ALOS, Sentinel-1A, and Sentinel-1B revealed negative values along the coastline and around the wetlands.
The standard deviation (S.D.) of the LOS velocities, illustrated in Figure 7, indicates that the smallest spread of the LOS velocities, given by the standard deviation values closer to zero, is found for the Sentinel-1B data (Figure 7b). For all tracks, the smallest standard deviation values occur in the town of Ciénaga (Figure 7), reflecting higher coherence values in urban settings. In the undeveloped areas, the largest S.D. values occur on the CGSM shores (see red colors in Figure 7), where the most negative LOS velocities within the study site occur (Figure 6 and Figure 7). In general, it is observed that extreme LOS velocities, either positive or negative, coincide with high S.D. values (red colors in Figure 7).

3.3. LOS Displacement Time Series

To inspect the trends of the land displacement over time, the LOS displacement time series of four sites are depicted in Figure 8, Figure 9, Figure 10 and Figure 11, whose locations are shown in Figure 6a. Figure 8 shows the LOS displacements for site 1 and exemplifies the anthropogenic impact on VLM (Figure 6a and Figure 8). In this sector, to face coastal erosion on the western side of the mouth of the CGSM, two groins were built in 2012. These coastal structures produced a gain of sediment on the updrift side of the groins, reflected by a slope value of 0.9 cm/yr for the best fitting line to the associated time series.
Figure 9 and Figure 10 illustrate the time series of an area that was densely vegetated with mangroves until the 1980s (site 2 and 3, Figure 6a). This sector became the location of frequent overwashes that left behind sandy deposits, buried vegetation, and vegetated dunes scarped by erosive processes [24] (Figure 9c). Typical time series show gradual downward displacement with slopes of approximately −0.5 cm/yr (Figure 9b and Figure 10b).
The westernmost time-series transect was located seaward from El Torno lagoon (site 4, Figure 6a). Although the shorefront in this area is erosive, no breachings have been observed in this lagoon during the last decade, and limited overwash deposits appear on satellite imagery. The area between the lagoon and the coastline consists of beach sands and embryo dunes sparsely covered with pioneer vegetation. LOS velocities for this site revealed a negative slope of −1.2 cm/yr for the linear fitting regression.

3.4. Comparison of VLM and LOS Velocities and GNSS Data

The trends in vertical land movement measured at the GNSS stations located in Santa Marta and Barranquilla were contrasted with VLM and LOS velocity values from InSAR pixels located nearby these stations. Every four years, daily readings for each station were processed by the Deutsches Geodätisches Forschungsinstitut (DGFI) to provide long-term displacements for a network of permanent stations in South America. Roughly matching the time span for ALOS data, a solution for 2006–2011 compiled for the GNSS station in Santa Marta (Figure 2), indicated a vertical displacement of −0.52 cm/yr for that period [58]. For the same area, LOS velocities of −0.12 cm/yr were found for ALOS data. For the GNSS station in Barranquilla, vertical displacements of −0.14 cm/yr were reported for 2007–2009 [58], whereas a value of −0.31 cm/yr was obtained for the ALOS LOS velocities for 2007–2011. Sentinel data is not available for these years. For the period 2017–2021, VLM estimates using Sentinel-1A/B data near the Santa Marta station are −1.31 cm/yr. An updated processed solution for the GNSS stations to contrast the above values is not available yet.

4. Discussion

4.1. Subsidence in Deltas

Dating of modern deltas reveals that many major deltas worldwide were formed during the Holocene between 8,500 and 6,500 years before the present. The Fraser (Canada), Mississippi (United States), and Nile (Egypt) River deltas, to cite a few, were all formed within that period [59]. Accordingly, it has been suggested that following the initial rapid SLR during deglaciation, Holocene deltaic sequences began to accumulate as the rate of fluvial sediment input exceeded the declining rate of SLR in continental margins [59]. Compaction of the strata deposited during the Holocene has been described as a major driver of natural land subsidence in these dynamic environments [11,60]. In the case of the Magdalena River, we argue that downward trends in vertical land motion (VLM) reflect ongoing subsidence associated with modern fluvio-lacustrine sediments [26,61] that overlie relict sediments from a former delta that migrated westward after the mid-Holocene [21]. Low magnitude seismological activity associated with the SMBF indicates that VLM estimates reported in this work (Figure 5), at least during the period of observation (2007–2021), are not earthquake-driven, which suggests that one of the primary drivers of this process is sediment compaction of organic and mud deposits.
VLM in the study site is closely related to the Holocene history of the Magdalena delta and the supply of sediment from the drainage basin. Natural drainage displacements and levee constructions since the 1920s [22] have progressively diminished the amount of sediment delivered by the Magdalena River to the study area [22], disrupting the balance between sedimentation and natural compaction of sediments. More recently, the construction of the highway between Barranquilla and Santa Marta in the 1950s hampered the interchange of water between lagoons and ocean [23], indirectly causing subsidence by disturbing the mangrove forest.
Compared to previous assessments of RSL change for the region, which indicate current rising sea levels of approximately 0.5 cm/yr [32], local subsidence values of up to −1.5 cm/yr highlight the relevance of incorporating subsidence in the prediction of SLR and coastline positions. Earlier work aiming to correlate coastline erosion to sea-level rise, as measured from historical tide gauges, revealed that the average coastline change is two orders of magnitude greater than the rate of the sea-level rise [62]. Thus, by increasing the rate of local RSL, subsidence might increase future flooding risk associated with storms [55,63], resulting in the possible drowning of the deltaic barrier island.

4.2. Linking VLM and Coastal Erosion

The coastline changes and VLM findings are contrasting. Whereas erosion processes underlie most of the study area, the signal of VLM is highly variable along the study area. In other words, not all areas with annual shoreline erosion rates larger than the uncertainty threshold (i.e., ±5.0 m/yr) were associated with local subsidence. This indicates that subsidence is a factor that can exacerbate the impact of ongoing erosive processes. We explored the influence of scale by examining aggregations of the data at 1.5- and 5-km scales (see Supplementary Materials). At all scales considered, the sector with high coastline erosion rates of around −10 m/yr coincided spatially with subsidence rates of up to −1.0 cm/yr (i.e., stretch between Kangarú and Cuatro Bocas in Figure 5). Regions that exhibited coastal erosion within the range of uncertainty (± 5m/yr, e.g., seaward from the CGSM) showed a variable VLM signal at all scales. A similar interplay is described for a stretch of coast comprised of marshes and mud in the Mekong Delta in Vietnam, where secular coastal erosion values larger than −50 m/yr are paired with subsidence rates exceeding −1.5 cm/yr [17]. Similarly, high coastal erosion trends in an abandoned lobe of the Yellow River delta in China were associated with average subsidence rates of −0.7 cm/yr and up to −2.1 cm/yr for the period 1992–2000 [13]. These observations highlight the regional variability and complexity of drivers behind the coastal change that demand weighing the different drivers of change even within one deltaic system.
In addition to the natural compaction caused by sediment overloading, the site-specific subsidence rates observed along the stretch of coast between Kangarú and Cuatro Bocas might be triggered by the effect of localized dehydration and mortality of mangrove forest (Figure 1), following the highway construction in the early 1950s [23]. In this sector, as the mangrove decayed after the highway construction, soil salinity has hampered the establishment of vegetation [23], giving place to barren or sparsely vegetated swales (see Figure 9c). Yuill et al. [8] report that a large component of subsidence in organic-rich soils (e.g., peats associated with mangroves) is due to the exposure of soils to atmospheric oxygen, which reduces soil volumes by converting organic carbon into carbon dioxide gas (Figure 1). In coastal Louisiana, at least 60% of subsidence takes place within the uppermost 5–10 m, where woodpeat is widespread [11]. Subsidence in the former mangrove forest within the study area (Figure 9 and Figure 10) may therefore be higher with this additional factor at play and is at its root caused by the anthropogenic alteration of the wetland. Other factors causing site-specific variability in subsidence rates are related to the uneven distribution of compressible sediments, hydraulic properties in aquifer systems, and groundwater extractions from aquifer systems [56,57]. In the Mississippi delta, the variability of the underlying Holocene lithology modulates compaction rates and their spatial variability [11]. Such factors may explain the variability in VLM and LOS velocity observations east of Kangarú (Figure 5). A lack of detailed knowledge of the Holocene stratigraphic sequence at this site hinders establishing any current relationship between subsidence rates and underlying substrates, but surficial geological cartography, developed by the Colombian Geological Survey [26], indicates that subsidence takes place in alluvial and fluvial-lacustrine sediments that make up a floodplain landform [24].
A rise in relative sea level as a product of either subsidence or an increase of GMSL creates more space for sediments to accumulate (i.e., accommodation space) [64], which is an underlying condition for transgression to occur. In other words, for any given interval of time, accommodation space is created by a rise in sea level and/or subsidence. Thus, where rates of accommodation space are larger than sediment deposition, there is a landward shift in sedimentary environments, an expansion of the subtidal zone [65], and a landward displacement of the barrier [34]. Although stratigraphic evidence of a transgressive succession was not gathered in this work, previous mapping of chronic erosion in conjunction with frequent overwashes between Kangarú and Cuatro Bocas [24] indicate that transgression might occur along this stretch of coast. Transgression was identified by two processes acting in tandem on the landscape: (i) storm overwash deposition resulting in temporal accretion of sediments landward of the contemporaneous shoreline, followed by (ii) a period of more gradual erosion interrupted by a new overwash cycle. Thus, we suggest that subsidence velocities of up to −1 cm/yr in the observed stretch of coast are a factor that underpins transgression of the coastline and the occurrence of overwashes, resulting in a landscape composed of scarped dunes and eroding beaches overlain by washover fans and surrounded by overwash channels. The spatial variability of VLM and LOS velocities east of Kangarú (see Figure 5) refrain us from extending the hypothesis of a transgressive shift of the coastline to the stretch of coast seaward from the CGSM.

4.3. Utility and Limitations of InSAR for Interpretations of Coastal Landscape Change

Within the study area, the analyses of four specific sites show the potential of InSAR as a tool to help explain local changes to the landscape. Although somewhat expected, coastline accretion and the upward movement of the terrain on the updrift side of a pair of groins built in 2012 (Figure 8 and site 1 in Figure 6a) stresses the reliability of the technique and its effectiveness in detecting VLM. It also illustrates that VLM estimates may include upward VLM related to crustal motion and the effect of sediment deposition and surface accretion. In a similar manner, in addition to subsidence, the finding of LOS velocities smaller than −1.0 cm/yr seaward of El Torno lagoon and near the coastline (Figure 11 and site 4 in Figure 6a), might be influenced by the erosive regime of the coastline. Indeed, Shirzaei et al. [55] indicate that, in dynamic landscapes, VLM estimates do include changes in surface elevation due to erosion or deposition and must be separated from other types of VLM. Thus, in addition to the locations mentioned above, areas next to sand beaches, such as the coastal town of Ciénaga and the westernmost extreme of the study site, the VLM velocities might be influenced by the removal or deposition of sand associated with erosion or accretion.
In contrast to the aforementioned locations, the locations of the time series for sites 2 and 3 are over 1 km landward from the coastline (see Figure 6a, Figure 9 and Figure 10), in sectors that were populated by abundant mangrove forest until the 1980s. Therefore, this area is prone to gas emission related to the oxidation of organic-rich soils. VLM along these locations ranges between −0.5 and −1 cm/yr (Figure 5, Figure 9b and Figure 10b). As the sites selected for the time-series profiles are not in close vicinity to the coastline, their velocity values are not influenced by the erosive regime of the coastline and can be considered to reflect subsidence only. Deltaic areas with similar subsidence rates to the values reported above have been described elsewhere [12,13,14].
Caveats of the InSAR methodology in this study also arise in vegetated areas when the surface backscattering properties due to growing vegetation change through time [66]. This factor is especially the case for wavelengths of less than 10 cm (e.g., Sentinel-1 A/B C-band) that interact with leaves and soft-stemmed vegetation. The constantly changing vegetation conditions result in temporal decorrelation and a reduction of the coherence level [66,67]. This issue was addressed by contrasting the outcomes of Sentinel-1A/B with ALOS, a satellite with a longer wavelength (L-band), which penetrates deeper in the canopy or ground surface [54]. When comparing LOS velocities for Sentinel-1A/B and ALOS ascending orbit, we found that, even though the latter provided absolute larger subsidence values, the trends for both platforms were aligned for most of the study area (Figure 6).
Given the caveats mentioned above, the absolute values of VLM should be interpreted with caution in the context of an application demanding high accuracy levels. However, despite the lack of temporal overlap between the Sentinel-1A/B and ALOS datasets, the outcomes of ALOS and Sentinel-1A/B were consistent in revealing areas prone to upward and downward movements with respect to a reference point in Ciénaga.

5. Conclusions

This study combined satellite images and InSAR data to examine the interplay of vertical land motion (VLM) (2007–2021) and coastline changes (2010–2020) along a deltaic barrier in the Colombian Caribbean. The findings are as follows:
  • Annual coastal erosion rates increase in the same direction as the littoral drift (i.e., East-West direction), reaching a peak of −25 m/yr next to a lagoon known as Cuatro Bocas. In contrast, VLM patterns are highly variable along the study site, precluding linking coastal erosion rates to negative VLM values in general.
  • VLM in the study area is linked to the Holocene History of the Magdalena River delta and the supply of sediment from the drainage basin. Anthropogenic alterations are known to have caused alteration in sediment supply, which is not sufficient to counterbalance sediment compaction.
  • Although subsidence alone does not explain the high rates of coastal erosion along the study area, it is a factor that enhances erosive processes and is linked to the occurrence of overwashes and breaching of lagoons. The zones with the highest subsidence (up to −1.5 cm/yr) are areas surrounding the Ciénaga Grande de Santa Marta composed of marshes and mud. These local subsidence values are at least two times larger than gauge-measured rates of SLR.
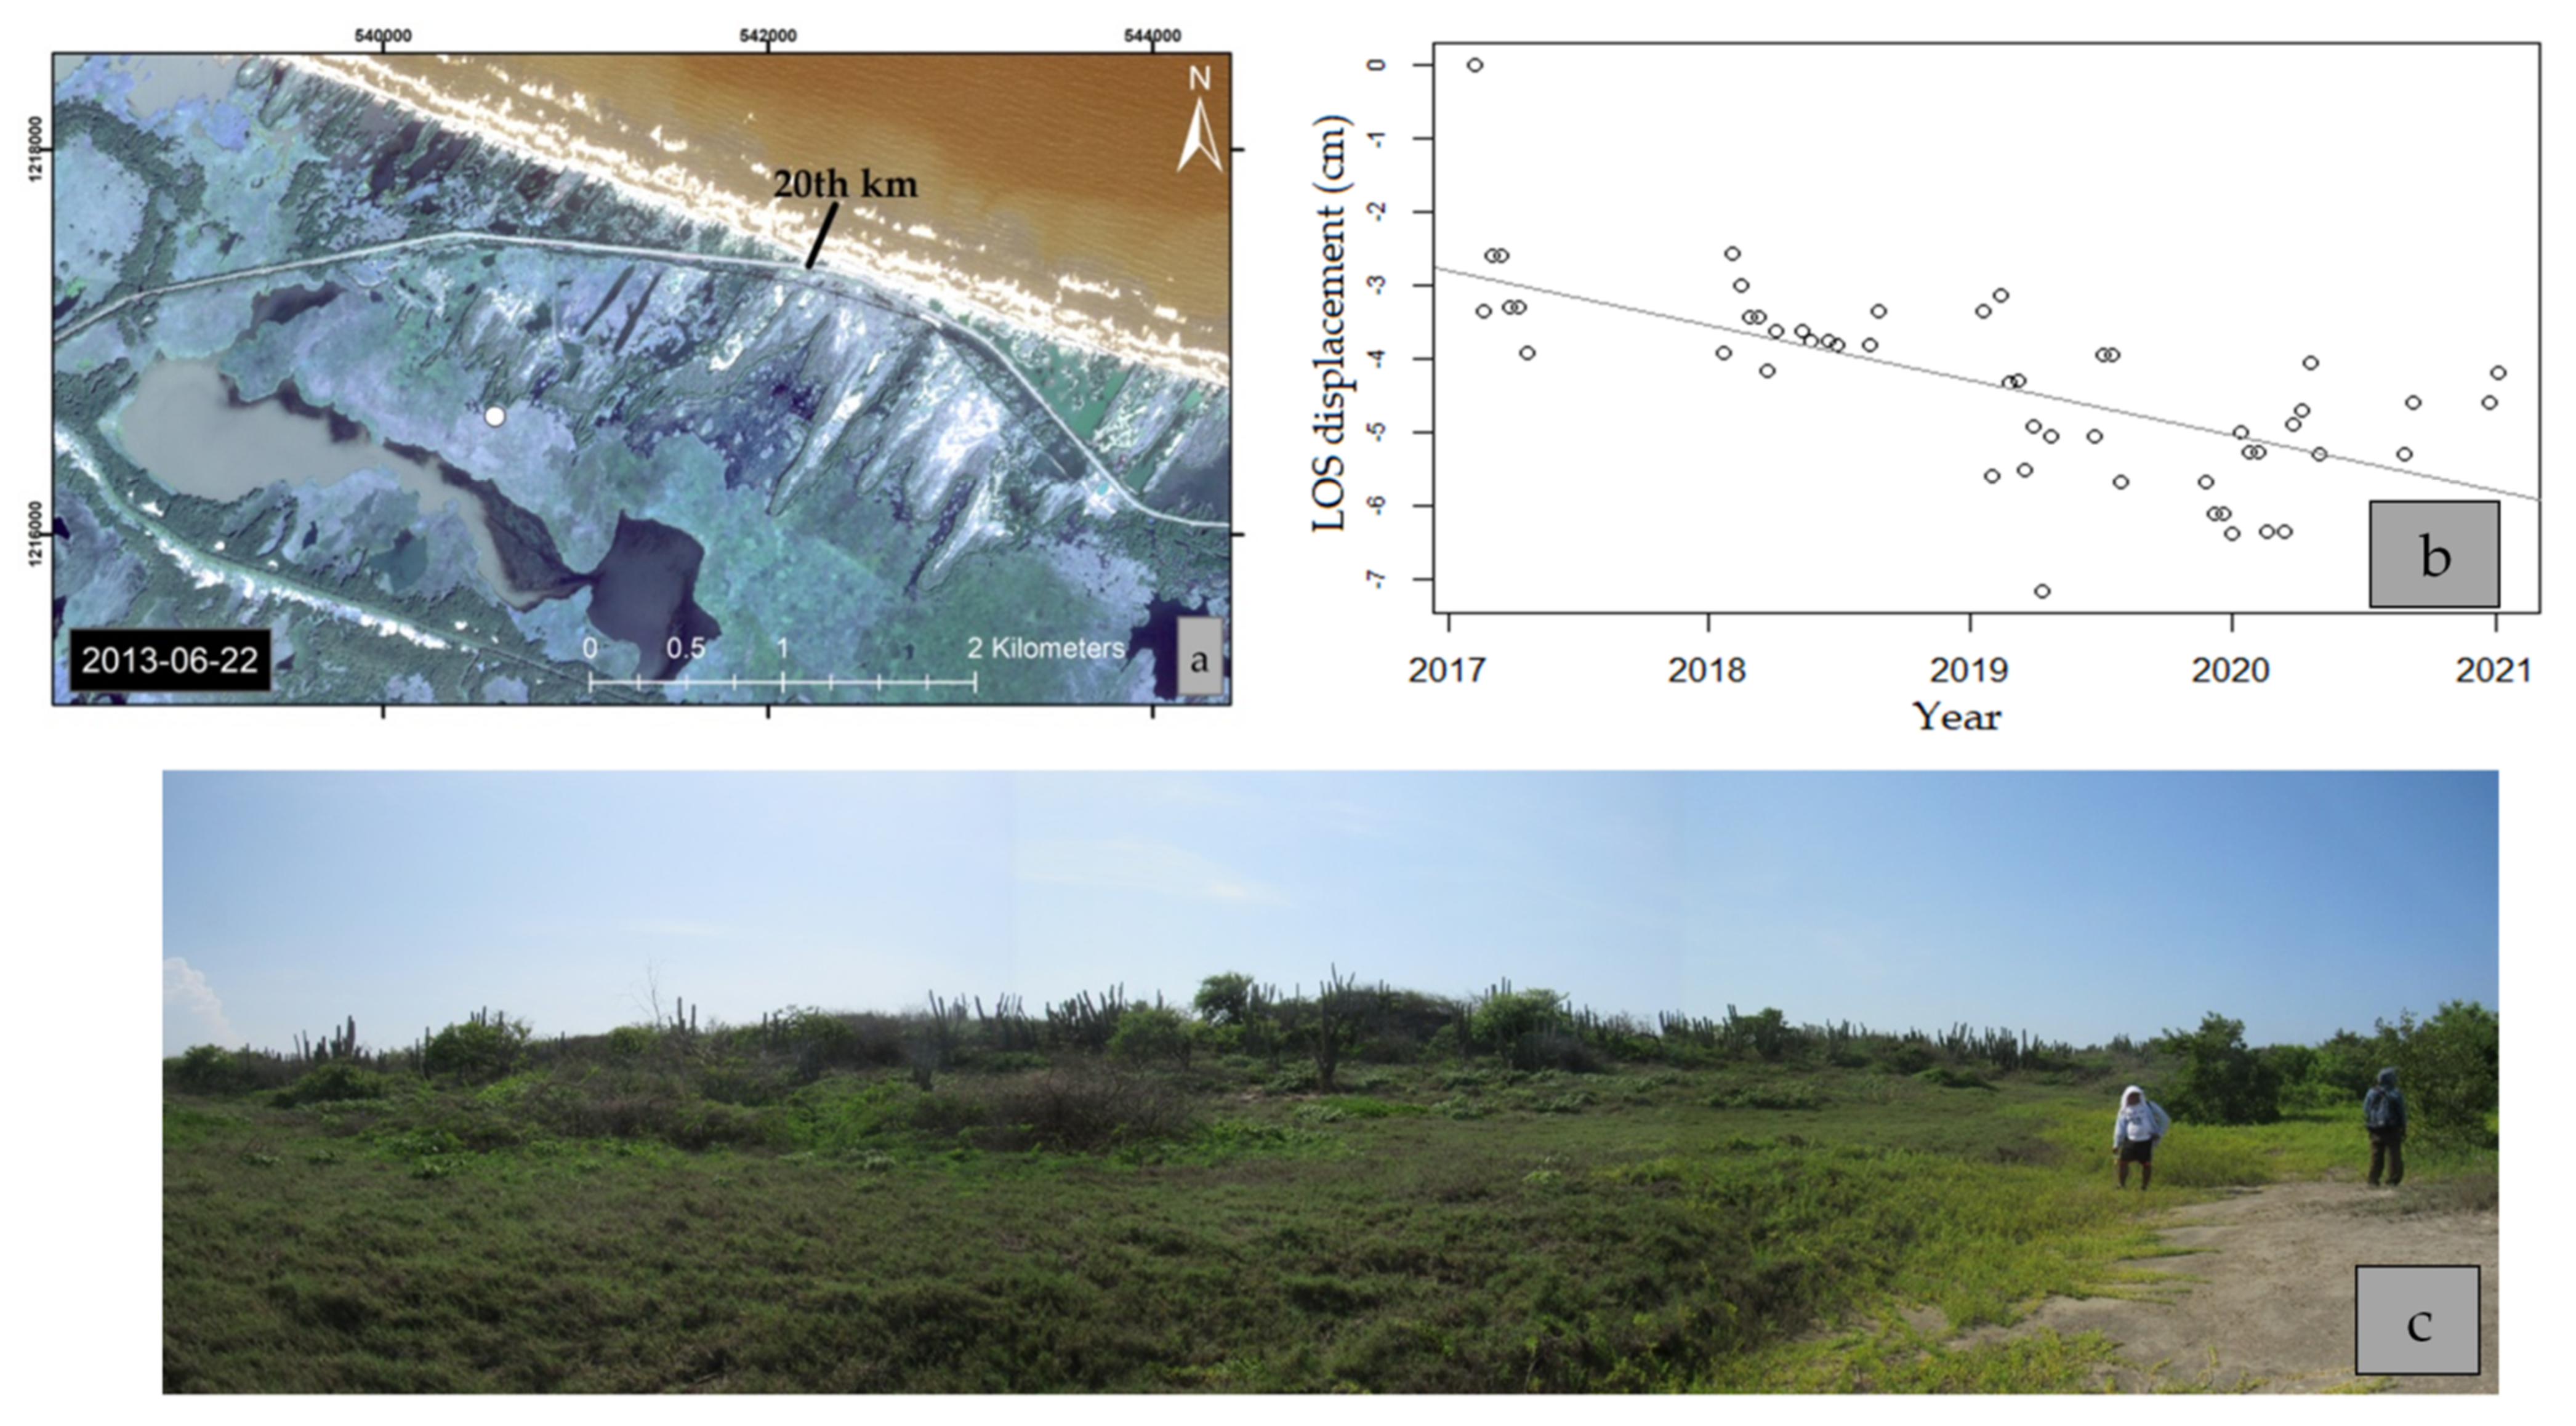
  • Local subsidence rates of up to −1 cm/yr were found in an area where mangrove forest was abundant before a highway was built in the 1950s. The likely primary drivers of subsidence in this sector are sediment compaction of the Holocene alluvium and gas emission followed by oxidation from organic-rich soils.
  • Using InSAR close to the coastline is complex due to the ever-changing condition of the littoral, particularly in vegetated and highly dynamic coastlines. In those areas of the study site next (within ~100 m) to the coastline, the velocities obtained by combining Sentinel-1A/B interferograms might reflect the added effect of VLM of land surface change due to sediment accretion/erosion.
There is a lack of research that jointly discusses coastal dynamics and VLM at a local scale to date. Thus, this work provides a baseline to be used as a blueprint to track coastal dynamics and future ground motions once longer records of radar data become available. In addition to contributing to the explanation the chronic erosion of the study area, the outcomes of this project are relevant for engineers of a proposed expansion to the current highway.

Supplementary Materials

The following are available online at https://www.mdpi.com/article/10.3390/geosciences11070300/s1; Figure S1: VLM rates for 2017–2021 as derived from Sentinel 1A/B data and coastline changes for 2010–2020. Data was aggregated in (a) 1.5-km and (b) 5.0-km sections.

Author Contributions

J.F.G. performed the InSAR analysis with the support of E.K. and M.S.; J.F.G. performed coastal changes analysis with the assistance of I.J.W.; M.S. provided codes and expertise to perform InSAR analysis. All authors analyzed the results and contributed to the paper writing, editing and revisions. All authors have read and agreed to the published version of the manuscript.

Funding

This project was supported by funding provided to EK through an NSERC Discovery Grant. M.S. was supported by the National Aeronautics and Space Administration (NASA) grant 80NSSC170567.

Data Availability Statement

Processed data are available upon request to the first author.

Acknowledgments

The authors thank three anonymous reviewers for their constructive comments and feedback that improved the final manuscript. We are grateful to the following individuals and institutions for their input and support: Edwin Niessen, Alice Gentleman, Evaristo Rada, Ismael Fernández, Pro-Ciénaga Foundation, and to the staff of the Isla de Salamanca Park Way.

Conflicts of Interest

The authors declare no conflict of interest.

References

  1. Church, J.A.; Clark, P.U.; Cazenave, A.; Gregory, J.M.; Jevrejeva, S.; Leverman, A.; Merrifield, M.A.; Milne, G.A.; Nerem, R.S.; Nunn, P.D.; et al. Sea Level Change. In Climate Change 2013: Contribution of Working Group I to the Fifth Assessment Report of the Intergovernmental Panel on Climate Change; Stocker, T.F., Oin, D., Plattner, G.K., Tignor, M., Allen, S.K., Boschung, J., Nauels, A., Xia, Y., Eds.; Cambridge University Press: Cambridge, UK, 2013. [Google Scholar]
  2. Gregory, J.M.; Griffies, S.M.; Hughes, C.W.; Lowe, J.A.; Church, J.A.; Fukimori, I.; Gomez, N.; Kopp, R.E.; Landerer, F.; Cozannet, G.L.; et al. Concepts and Terminology for Sea Level: Mean, Variability and Change, Both Local and Global. Surv. Geophys. 2019, 40, 1251–1289. [Google Scholar] [CrossRef] [Green Version]
  3. Pugh, D. Changing Sea Levels: Effects of Tides, Weather and Climate, 1st ed.; Cambridge Univesity Press: Cambridge, UK, 2004. [Google Scholar]
  4. Pugh, D.; Woodworth, P. Sea-Level Science: Understanding Tides, Surges, Tsunamis and Mean Sea-Level Changes; Cambridge University Press: Cambridge, UK, 2014. [Google Scholar] [CrossRef]
  5. Dokka, R.K. Modern-Day Tectonic Subsidence in Coastal Louisiana. Geology 2006, 34, 281–284. [Google Scholar] [CrossRef]
  6. Zoccarato, C.; Minderhoud, P.S.J.; Teatini, P. The Role of Sedimentation and Natural Compaction in a Prograding Delta: Insights from the Mega Mekong Delta, Vietnam. Sci. Rep. 2018, 8, 11437. [Google Scholar] [CrossRef]
  7. Minderhoud, P.S.J.; Middelkoop, H.; Erkens, G.; Stouthamer, E. Groundwater Extraction May Drown Mega-Delta: Projections of Extraction-Induced Subsidence and Elevation of the Mekong Delta for the 21st Century. Environ. Res. Commun. 2020, 2, 011005. [Google Scholar] [CrossRef]
  8. Yuill, B.; Lavoie, D.; Reed, D.J. Understanding Subsidence Processes in Coastal Louisiana. J. Coast. Res. 2009, 10054, 23–36. [Google Scholar] [CrossRef]
  9. Dixon, T.H.; Dokka, R.K. Earth Scientists and Public Policy: Have We Failed New Orleans? Eos Trans. Am. Geophys. Union 2008, 89, 96–97. [Google Scholar] [CrossRef] [Green Version]
  10. Syvitski, J.P.M.; Kettner, A.J.; Overeem, I.; Hutton, E.W.H.; Hannon, M.T.; Brakenridge, G.R.; Day, J.; Vörösmarty, C.; Saito, Y.; Giosan, L.; et al. Sinking Deltas Due to Human Activities. Nat. Geosci. 2009, 2, 681–686. [Google Scholar] [CrossRef]
  11. Törnqvist, T.E.; Wallace, D.J.; Storms, J.E.; Wallinga, J.; Van Dam, R.L.; Blaauw, M.; Derksen, M.; Klerks, C.J.; Meijneken, C.; Snijders, E.M. Mississippi Delta Subsidence Primarily Caused by Compaction of Holocene Strata. Nat. Geosci. 2008, 1, 173–176. [Google Scholar] [CrossRef]
  12. Di Paola, G.; Alberico, I.; Aucelli, P.P.C.; Matano, F.; Rizzo, A.; Vilardo, G. Coastal Subsidence Detected by Synthetic Aperture Radar Interferometry and Its Effects Coupled with Future Sea-Level Rise: The Case of the Sele Plain (Southern Italy). J. Flood Risk Manag. 2018, 11, 191–206. [Google Scholar] [CrossRef] [Green Version]
  13. Polcari, M.; Albano, M.; Montuori, A.; Bignami, C.; Tolomei, C.; Pezzo, G.; Falcone, S.; La Piana, C.; Doumaz, F.; Salvi, S.; et al. InSAR Monitoring of Italian Coastline Revealing Natural and Anthropogenic Ground Deformation Phenomena and Future Perspectives. Sustainability 2018, 10, 3152. [Google Scholar] [CrossRef] [Green Version]
  14. Zhang, J.Z.; Huang, H.; Bi, H. Land Subsidence in the Modern Yellow River Delta Based on InSAR Time Series Analysis. Nat. Hazards 2015, 75, 2385–2397. [Google Scholar] [CrossRef]
  15. Roberts, H.H. Dynamic Changes of the Holocene Mississippi River Delta Plain: The Delta Cycle. J. Coast. Res. 1997, 13, 605–627. [Google Scholar]
  16. El-Fishawi, N.M. Coastal Erosion in Relation to Sea-Level Changes, Subsidence and River Discharge, Nile Delta Coast. Acta Mineral. Petrogr. 1989, 30, 161–171. [Google Scholar]
  17. Anthony, E.J.; Brunier, G.; Besset, M.; Goichot, M.; Dussouillez, P.; Nguyen, V.L. Linking Rapid Erosion of the Mekong River Delta to Human Activities. Sci. Rep. 2015, 5, 14745. [Google Scholar] [CrossRef] [PubMed] [Green Version]
  18. Shirzaei, M.; Bürgmann, R. Global Climate Change and Local Land Subsidence Exacerbate Inundation Risk to the San Francisco Bay Area. Sci. Adv. 2018, 4, eaap9234. [Google Scholar] [CrossRef] [PubMed] [Green Version]
  19. Restrepo, J.D.; Kjerfve, B.; Hermelin, M.; Restrepo, J.C. Factors Controlling Sediment Yield in a Major South American Drainage Basin: The Magdalena River, Colombia. J. Hydrol. 2006, 316, 213–232. [Google Scholar] [CrossRef]
  20. Torregroza-Espinosa, A.C.; Restrepo, J.C.; Correa-Metrio, A.; Hoyos, N.; Escobar, J.; Pierini, J.; Martínez, J.-M. Fluvial and Oceanographic Influences on Suspended Sediment Dispersal in the Magdalena River Estuary. J. Mar. Syst. 2020, 204, 103282. [Google Scholar] [CrossRef]
  21. Romero-Otero, G.A.; Slatt, R.M.; Pirmez, C. Evolution of the Magdalena Deepwater Fan in a Tectonically Active Setting, Offshore Colombia. In Memoir 108: Petroleum Geology and Potential of the Colombian Caribbean Margin; Bartolini, C., Mann, P., Eds.; American Association of Petroleum Geologists AAPG/Datapages: Houston, TX, USA, 2015; pp. 675–707. [Google Scholar]
  22. Von Erffa, A.F. Sedimentation, Transport Und Erosion an Der Nordkuste Kolumbiens Zwischen Barranquilla und Der Sierra Nevada de Santa Marta. Bol. Investig. Cient. Colombo-Alem. 1973, 7, 155–209. [Google Scholar]
  23. Elster, C.; Perdomo, L.; Schnetter, M.-L. Impact of ecological factors on the regeneration of mangroves in the Ciénaga Grande de Santa Marta, Colombia. Hydrobiology 1999, 413, 35–46. [Google Scholar] [CrossRef]
  24. Gómez, J.F.; Byrne, M.L.; Hamilton, J.; Islas, F. Historical Coastal Evolution and Dune Vegetation in Isla Salamanca National Park, Colombia. J. Coast. Res. 2016, 33, 632–641. [Google Scholar] [CrossRef]
  25. Oertel, G.F. The barrier island system. Mar. Geol. 1985, 63, 1–18. [Google Scholar] [CrossRef]
  26. Hernández, M.; Maldonado, I. Geología de La Plancha 18-Ciénaga; INGEOMINAS: Santafé de Bogotá, Colombia, 1999.
  27. Idárraga-García, J.; Romero, J. Neotectonic study of the Santa Marta Fault System, Western foothills of the Sierra Nevada de Santa Marta, Colombia. J. South Am. Earth Sci. 2010, 29, 849–860. [Google Scholar] [CrossRef]
  28. Paris, G.; Machete, M.N.; Dart, R.L.; Haller, K.M. Maps and Database of Quaternary Folds and Faults in Colombia and Its Offshore Regions; Open File 0284; United States Geological Survey: Denver, CO, USA, 2000; p. 61.
  29. United States Geological Survey. Latest Earthquakes Report. Available online: https://earthquake.usgs.gov/earthquakes (accessed on 8 January 2021).
  30. El Heraldo. Contratan Obras Del Kilómetro 19 Con Firma Edgardo Navarro Vives. Available online: https://www.elheraldo.co/local/contratan-obras-del-kilometro-19-con-firma-edgardo-navarro-vives-167730 (accessed on 10 May 2021).
  31. Losada, I.; Reguero, B.; Mendez, F.; Castanedo, S.; Abascal, A.; Mínguez, R. Long-term changes in sea-level components in Latin America and the Caribbean. Glob. Planet. Chang. 2013, 104, 34–50. [Google Scholar] [CrossRef]
  32. Andrade, C.A.; Thomas, Y.F.; Lerma, A.N.; Durand, P.; Anselme, B. Coastal Flooding Hazard Related to Swell Events in Cartagena de Indias, Colombia. J. Coast. Res. 2013, 290, 1126–1136. [Google Scholar] [CrossRef]
  33. Andrade-Amaya, C.A.; Ferrero-Ronquillo, A.J.; León-Rincón, H.; Mora-Paez, H.; Carvajal-Perico, H. Sobre cambios en la línea de costa entre 1735 y 2011 y la subsidencia en la Bahía de Cartagena de Indias, Colombia. Rev. Acad. Colomb. Cienc. Exactas Físicas Nat. 2017, 41, 94–106. [Google Scholar] [CrossRef] [Green Version]
  34. Van Heteren, S. Barrier Systems. In Coastal Environments and Global Change, 1st ed.; Masselin, K., Gehrels, K., Eds.; John Wiley & Sons: West Sussex, UK, 2014; pp. 194–226. [Google Scholar]
  35. Thieler, E.R.; Martin, D.; Ergul, A. The Digital Shoreline Analysis System: Shoreline Change Measurement Software Extension for ArcView; Open File Report 03–076; Woods Hole Coastal and Marine Science Center: Woods Hole, MA, USA, 2003.
  36. Boak, E.H.; Turner, I. Shoreline Definition and Detection: A Review. J. Coast. Res. 2005, 214, 688–703. [Google Scholar] [CrossRef] [Green Version]
  37. Dolan, B.H.R. Storms and Shoreline Configuration. J. Sediment. Res. 1981, 51. [Google Scholar] [CrossRef]
  38. Moore, L. Shoreline Mapping Techniques. J. Coast. Res. 2000, 16, 111–124. [Google Scholar]
  39. Del Río, L.; Gracia, F.J. Error determination in the photogrammetric assessment of shoreline changes. Nat. Hazards 2012, 65, 2385–2397. [Google Scholar] [CrossRef] [Green Version]
  40. Werner, C.; Wegmüller, U.; Strozzi, T.; Wiesmann, A. GAMMA SAR and interferometric processing software. In Proceedings of the ERS—ENVISAT Symposium, Gothenburg, Sweden, 16–20 October 2000. [Google Scholar]
  41. Sansosti, E.; Berardino, P.; Manunta, M.; Serafino, F.; Fornaro, G. Geometrical SAR image registration. IEEE Trans. Geosci. Remote Sens. 2006, 44, 2861–2870. [Google Scholar] [CrossRef]
  42. Yague-Martinez, N.; Prats-Iraola, P.; Gonzalez, F.R.; Brcic, R.; Shau, R.; Geudtner, D.; Eineder, M.; Bamler, R. Interferometric Processing of Sentinel-1 TOPS Data. IEEE Trans. Geosci. Remote Sens. 2016, 54, 2220–2234. [Google Scholar] [CrossRef] [Green Version]
  43. Shirzaei, M.; Bürgmann, R.; Fielding, E.J. Applicability of Sentinel-1 Terrain Observation by Progressive Scans Multitemporal Interferometry for Monitoring Slow Ground Motions in the San Francisco Bay Area: Sentinel-1 Multitemporal Interferometry. Geophys. Res. Lett. 2017, 44, 2733–2742. [Google Scholar] [CrossRef]
  44. Franceschetti, G.; Lanari, R. Synthetic Aperture Radar Processing, 1st ed.; CRC Press: Boca Raton, FL, USA, 1999. [Google Scholar] [CrossRef]
  45. Farr, T.G.; Rosen, P.A.; Caro, E.; Crippen, R.; Duren, R.; Hensley, S.; Kobrick, M.; Paller, M.; Rodriguez, E.; Roth, L.; et al. The Shuttle Radar Topography Mission. Rev. Geophys. 2007, 45. [Google Scholar] [CrossRef] [Green Version]
  46. Amato, V.; Aucelli, P.P.; Corrado, G.; Di Paola, G.; Matano, F.; Pappone, G.; Schiattarella, M. Comparing geological and Persistent Scatterer Interferometry data of the Sele River coastal plain, southern Italy: Implications for recent subsidence trends. Geomorphology 2020, 351, 106953. [Google Scholar] [CrossRef]
  47. Shirzaei, M.; Walter, T. Estimating the Effect of Satellite Orbital Error Using Wavelet-Based Robust Regression Applied to InSAR Deformation Data. IEEE Trans. Geosci. Remote Sens. 2011, 49, 4600–4605. [Google Scholar] [CrossRef]
  48. Shirzaei, M.; Burgmann, R. Topography correlated atmospheric delay correction in radar interferometry using wavelet transforms. Geophys. Res. Lett. 2012, 39, 01305. [Google Scholar] [CrossRef]
  49. Vilardo, G.; Ventura, G.; Terranova, C.; Matano, F.; Nardò, S. Ground deformation due to tectonic, hydrothermal, gravity, hydrogeological, and anthropic processes in the Campania Region (Southern Italy) from Permanent Scatterers Synthetic Aperture Radar Interferometry. Remote Sens. Environ. 2009, 113, 197–212. [Google Scholar] [CrossRef]
  50. Li, X.; Huang, G.; Kong, Q. Atmospheric Phase Delay Correction of D-InSAR Based on Sentinel-1A. Int. Arch. Photogramm. Remote Sens. Spat. Inf. Sci. 2018, 955–960. [Google Scholar] [CrossRef] [Green Version]
  51. Morrison, K.; Bennett, J.C.; Nolan, M.; Menon, R. Laboratory Measurement of the DInSAR Response to Spatiotemporal Variations in Soil Moisture. IEEE Trans. Geosci. Remote Sens. 2011, 49, 3815–3823. [Google Scholar] [CrossRef]
  52. Morrison, K.; Bennett, J.C.; Nolan, M. Using DInSAR to Separate Surface and Subsurface Features. IEEE Trans. Geosci. Remote Sens. 2012, 51, 3424–3430. [Google Scholar] [CrossRef]
  53. Molan, Y.E.; Lu, Z. Modeling InSAR Phase and SAR Intensity Changes Induced by Soil Moisture. IEEE Trans. Geosci. Remote Sens. 2020, 58, 4967–4975. [Google Scholar] [CrossRef]
  54. Hensley, S.; Munjy, R.; Rosen, P. Interferometric Synthetic Aperture Radar (IFSAR). In Digital Elevation Model Technologies and Applications: The DEM Users Manual, 1st ed.; Maune, D.F., Ed.; American Society for Photogrammetry and Remote Sensing: Bethesda, MD, USA, 2001; pp. 143–206. [Google Scholar]
  55. Shirzaei, M.; Freymueller, J.; Törnqvist, T.E.; Galloway, D.L.; Dura, T.; Minderhoud, P.S.J. Measuring, modelling and projecting coastal land subsidence. Nat. Rev. Earth Environ. 2021, 2, 40–58. [Google Scholar] [CrossRef]
  56. Luo, Q.; Perissin, D.; Zhang, Y.; Jia, Y. L- and X-Band Multi-Temporal InSAR Analysis of Tianjin Subsidence. Remote Sens. 2014, 6, 7933–7951. [Google Scholar] [CrossRef] [Green Version]
  57. Tosi, L.; Da Lio, C.; Strozzi, T.; Teatini, P. Combining L- and X-Band SAR Interferometry to Assess Ground Displacements in Heterogeneous Coastal Environments: The Po River Delta and Venice Lagoon, Italy. Remote Sens. 2016, 8, 308. [Google Scholar] [CrossRef] [Green Version]
  58. Sánchez, L.; Seitz, M. Station positions and velocities of the SIR11P01 multi-year solution, epoch 2005.0. In Proceedings of the SIRGAS 2011 General Meeting, Heredia, Costa Rica, 8–11 August 2011. [Google Scholar] [CrossRef]
  59. Stanley, D.J.; Warne, A.G. Worldwide Initiation of Holocene Marine Deltas by Deceleration of Sea-Level Rise. Science 1994, 265, 228–231. [Google Scholar] [CrossRef] [PubMed]
  60. Teatini, P.; Tosi, L.; Strozzi, T. Quantitative evidence that compaction of Holocene sediments drives the present land subsidence of the Po Delta, Italy. J. Geophys. Res. Space Phys. 2011, 116, 08407. [Google Scholar] [CrossRef]
  61. Colmenares, P.; Mesa, M.; Roncancio, J.; Pedraza, P.; Contreras, A.; Cardona, A.; Silva, C.; Romero, J.; Alvarado, S.; Romero, O.; et al. Geología de La Plancha 18; INGEOMINAS: Santafé de Bogotá, Colombia, 2007.
  62. Leatherman, S.P.; Zhang, K.; Douglas, B.C. Sea level rise shown to drive coastal erosion. Eos 2000, 81, 55–57. [Google Scholar] [CrossRef]
  63. Mazzotti, S.; Lambert, A.; Van Der Kooij, M.; Mainville, A. Impact of anthropogenic subsidence on relative sea-level rise in the Fraser River delta. Geology 2009, 37, 771–774. [Google Scholar] [CrossRef]
  64. Catuneanu, O. Principles of Sequence Stratigraphy; Elsevier: Milan, Italy, 2006. [Google Scholar]
  65. Mount, J.; Twiss, R. Subsidence, Sea Level Rise, and Seismicity in the Sacramento–San Joaquin Delta. San Fr. Estuary Watershed Sci. 2005, 3, 1–19. [Google Scholar] [CrossRef] [Green Version]
  66. Pepe, A.; Calò, F. A Review of Interferometric Synthetic Aperture RADAR (InSAR) Multi-Track Approaches for the Retrieval of Earth’s Surface Displacements. Appl. Sci. 2017, 7, 1264. [Google Scholar] [CrossRef] [Green Version]
  67. Oliver-Cabrera, T.; Wdowinski, S. InSAR-Based Mapping of Tidal Inundation Extent and Amplitude in Louisiana Coastal Wetlands. Remote Sens. 2016, 8, 393. [Google Scholar] [CrossRef] [Green Version]
Figure 1. Properties of soil structure before (left) and after (right) compaction takes place. Emission of CO2 occurs when dehydrated organic-rich soils are exposed to atmospheric oxygen (modified from Yuill et al. [8]).
Geosciences 11 00300 g001
Figure 2. Study area and its surrounding wetlands and lagoons; (a) the epicenters of earthquakes and the coverage of ALOS and the Sentinel-1A/B ascending and descending radar data are included. The study site extends from the River Magdalena mouth (west) to the town of Ciénaga (east); (b) detail of the study area indicating the locations referred to in the manuscript. The wind rose displays the distribution of wind speed and direction for the study site.
Geosciences 11 00300 g002aGeosciences 11 00300 g002b
Figure 4. Coastline changes (m/yr) as derived from DSAS for the period 2010–2020.
Geosciences 11 00300 g004
Figure 5. VLM rates for 2017–2021 as derived from Sentinel 1A/B data and coastline changes for 2010–2020 displayed with an arbitrary offset from the actual coastline for presentation purposes. Positive velocities (white and cold colors) represent stable areas and displacements toward the satellite, while negative velocities (warm colors) indicate displacement away from the satellite.
Geosciences 11 00300 g005
Figure 6. LOS velocities for (a) Sentinel-1A ascending track for 2017–2021; (b) Sentinel-1B descending track for 2017–2021, and (c) ALOS ascending track for 2007–2011. Positive velocities (white and cold colors) represent stable areas and displacements toward the satellite, while negative velocities (warm colors) indicate displacements away from the satellite. The location of the four time series described below is shown in (a).
Geosciences 11 00300 g006
Figure 7. Standard deviation (S.D.) for each pixel of the estimated LOS velocities for (a) Sentinel-1A ascending track for 2017–2021; (b) Sentinel-1B descending track for 2017–2021, and (c) ALOS ascending track for 2007–2011. Red/green colors indicate high/low variability in the LOS velocities over time.
Geosciences 11 00300 g007
Figure 8. Satellite images before (a) and after (b) the groins were installed. Location of time series is indicated by white dot; (c) LOS displacement time series from Sentinel-1A for 2017–2021 (line represents the best fitting line with a slope of 0.9 cm/yr), and (d) photograph of the groins taken in 2014. Source of imagery: GeoEye images provided by Planet Labs Inc.
Geosciences 11 00300 g008
Figure 9. (a) Aerial photograph taken in 1953 showing the former mangrove forest before the highway was built. Parabolic dunes are seen in the backshore. Location of time series is indicated by white dot; (b) LOS displacement time series from Sentinel-1A for 2017–2021 (line represents the best fitting line with a slope of −0.52 cm/yr), and (c) shows standing dead trees on a former wetland.
Geosciences 11 00300 g009
Figure 10. (a) Area affected by coastal erosion seaward of the highway as observed in 2013. Location of time series is indicated by white dot; (b) LOS displacement time series from Sentinel-1A for 2017–2021 (line represents the best fitting line with a slope of −0.71cm/yr), and (c) photograph of the dunes landward from the 20th km. Source of imagery: Digital Globe provided GeoEye image.
Geosciences 11 00300 g010
Figure 11. (a) El Torno lagoon showing stabilized washover in 2013. Location of time series is indicated by white dot; (b) LOS displacement time series from Sentinel-1A for 2017–2021 (line represents the best fitting line with a slope of −1.2 cm/yr); (c) photograph of the beach seaward, and (d) next to the north shore of the lagoon. Source of imagery: Digital Globe provided GeoEye image.
Geosciences 11 00300 g011
Table 1. Parameters used to create interferograms during InSAR processing.
ConditionALOSSentinel-1A/B
Acquisition dates2007–20112017–2021
Path 143/14477/142
Frame 20032/555
Baseline distance (m)1000500
Temporal distance (days)600400
Azimuth looks34
Range Looks620
Images 1350/53
Pairs selected763
Incidence angle (°)38.834.0
Heading angle (°)348.8347.9/192.0
Publisher’s Note: MDPI stays neutral with regard to jurisdictional claims in published maps and institutional affiliations.

