Article

Seismic Vulnerability Assessment and Simplified Empirical Formulation for Predicting the Vibration Periods of Structural Units in Aggregate Configuration

1
Department of Architecture and Urbanism, Politehnica University of Timişoara, Traian Lalescu Street, 300223 Timişoara, Romania
2
Department of Structures for Engineering and Architecture, School of Polytechnic and Basic Sciences, University of Naples “Federico II”, P.le V. Tecchio, 80125 Naples, Italy
3
Department of Civil and Environmental Engineering, University of Perugia, 06123 Perugia, Italy
*
Author to whom correspondence should be addressed.
Geosciences 2021, 11(7), 287; https://doi.org/10.3390/geosciences11070287
Submission received: 4 June 2021 / Revised: 3 July 2021 / Accepted: 7 July 2021 / Published: 9 July 2021

Abstract

:
The present research aims at investigating the vibration period of structural units (SUs) of a typical masonry aggregate located in the historical center of Mirandola, a municipality in the province of Modena. The clustered building consists of eighteen SUs mutually interconnected to each other, which are characterized by solid brick walls and deformable floors. First of all, non-linear static analyses are performed by adopting the 3Muri software focusing on two distinct modelling techniques concerning the analyzed SUs in isolated and clustered configurations. Congruently to the procedure adopted, in order to evaluate a reliable seismic structural response of the SUs arranged in aggregate conditions, the contribution in terms of stiffness and mass derived from adjacent buildings is considered. The analysis results are represented in terms of risk factor, stiffness, and ductility. Secondly, the eigenvalue analysis is faithfully developed to identify the main vibration modes of the investigated SUs by proposing an empirical formulation, that allows for predicting the vibration period of structural units placed in aggregate configuration starting from the corresponding isolated ones. Finally, fragility functions are derived for both the heading and intermediate SUs to point out the expected damages under earthquakes with different intensities.

1. Introduction

The seismic safety of existing masonry buildings represents, as it is known, one of the main priorities for safeguarding historical centers of countries belonging to the Mediterranean area [1,2]. Generally, over the centuries, masonry constructions were considered as the predominant construction type, considering both the easy finding of the basic material and the simple execution phases of the artworks. However, awareness of the architectural and structural development that characterized the masonry constructions throughout the various eras is not only an essential prerequisite for the design of new buildings, but also constitutes an essential technical knowledge to clearly intervene on the existing building heritage with maintenance, consolidation, upgrading or seismic adaptation interventions [3].
Nowadays, in most Italian centers, it is easy to find a built heritage of historic masonry structures without an adequate safety level to resist the increasingly frequent and disastrous seismic actions. This structural inadequacy generates a drastic increase in terms of global vulnerability and, therefore, of the seismic risk of entire urbanized sectors. Thus, seismic vulnerability represents one of the main elements to be taken into consideration for the protection of historic buildings [4,5].
As it is well known, vulnerability can be understood as the propensity of buildings to suffer a certain level of damage due to a seismic event. The methods for assessing seismic vulnerability suggested by the design code require a wide and articulated knowledge of the essential typological and structural requirements (types of connection between walls, types of floors and roofs, etc.) of construction [6,7,8]. Since these existing buildings are frequently grouped in aggregate configuration into urban centers, the intrinsic vulnerability factors are difficult to be identified in advance, since the construction matrix of SUs is the living representation of the evolution of a set of design techniques relating to different time periods. Moreover, the complex structural articulation makes these buildings mutually interacting, so to further aggravate their susceptibility at damage under seismic phenomena [9,10,11].
Buildings erected in aggregate conditions are often built according to traditional practice with very variable types of vertical structure (heterogeneous or multi-leaf masonry walls) and deficient construction details (bad connections between orthogonal walls and between walls and floors, variation in the thickness of the walls along with the building height), which implicitly involve behavioral deficiencies in terms of stability and safety in areas characterized by considerable seismicity. Therefore, such types of clustered constructions have a structural behavior that cannot be identified a priori to predict the possible failure scenario [12,13,14].
Nonetheless, several factors influence their seismic performance, mainly depending on the interactions among the individual SUs. In particular, the presence of not significantly effective connections between the different SUs favors the occurrence of local collapse mechanisms in different cases. Jointly, an aggravation of the kinematic stability conditions is given by the presence of construction irregularities (e.g., orthogonal walls not well connected) and/or geometric (e.g., buildings with different heights), which are the main causes of the activation of out-of-plane collapses [15,16].
The interactions between the contiguous structural cells must be appropriately considered in the study of the vulnerability of the whole aggregate since the dynamic response of each SU is strongly influenced by the mutual interaction between the structural bodies involved in the seismic scenario [17,18,19]. The capacity offered by the single SU against the earthquake may differ considerably from the capacity of the entire aggregate, especially in the case of deformable floors and walls with poor mechanical characteristics. Such constructions, characterized by a strongly non-linear response, can inevitably lead to evaluation errors, that could compromise the result of the seismic evaluation [20,21]. For this reason, it is essential to consider a simplified structural model to take into account all the intrinsic peculiarities of the SUs, that can more correctly estimate their vulnerability level. More generally, the dynamic characterization, which is obtained through stochastic modal identification methods in the frequency domain where the source of the exciting impulse is the environmental vibration of the SUs, would be effective for an accurate cognitive investigation of the health state of buildings [22,23]. However, this task is not always possible or easy to be implemented. Therefore, simplified procedures for simulated modal identification analysis of the inspected buildings are developed. In this regard, many mechanical models are analyzed in several scientific papers [4,5,9], where the uncertainties related to vulnerability factors are often considered to quantify the seismic response of the entire aggregate and to set up appropriate risk mitigation procedures [24,25].
Thus, based on these considerations, the present study aims to focus on the seismic response of a masonry aggregate composed of eighteen SUs located in the historical center of Mirandola, a municipality within the province of Modena. This clustered building, affected by the earthquake which occurred in Emilia-Romagna in 2012, is made up of SUs representative of the building classes (solid brick walls with deformable floors) present in the examined urban area. The main objective of the present research is to study the influence of the vibration period of the structural units on the global response of the whole aggregate. Moreover, non-linear static analyses are performed to evaluate the seismic behavior of the SUs in both isolated and aggregate conditions.
From the acquired results, it is observed that the behavior offered in an aggregate condition considerably increases the expected seismic response of SUs, providing the main engineering demand parameters (EDPs), such as the maximum base shear and displacements, are greater than those of the corresponding isolated SUs. Furthermore, through mechanical simulation, it is detected how the vibration period decreases in aggregate configurations due to the increase in both the stiffness and mass of single SUs deriving from the adjoining clustered buildings. To this purpose, a simplified mathematical formulation is provided for predicting the vibration period of aggregate SUs confined, starting from that of the same structural cells in isolated configuration. Finally, a set of fragility curves are derived to estimate the propensity at the damage of the SUs investigated.

2. Framework of the Study

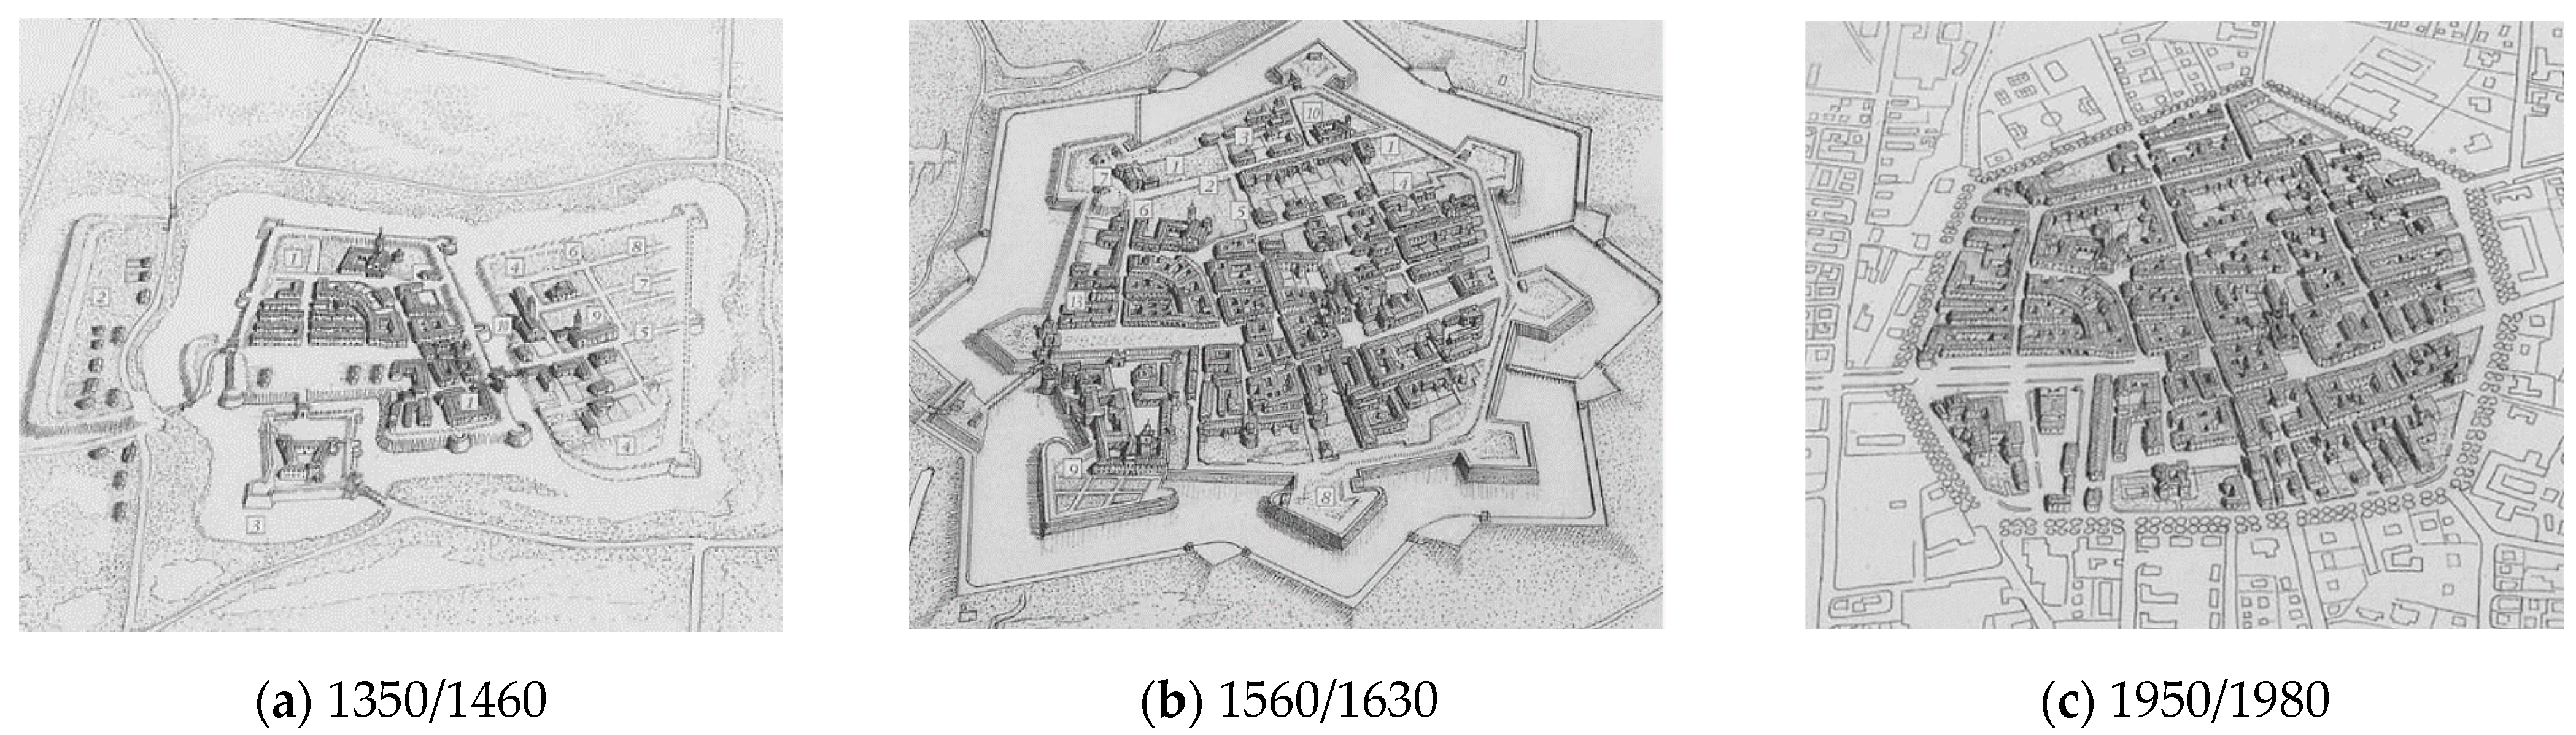
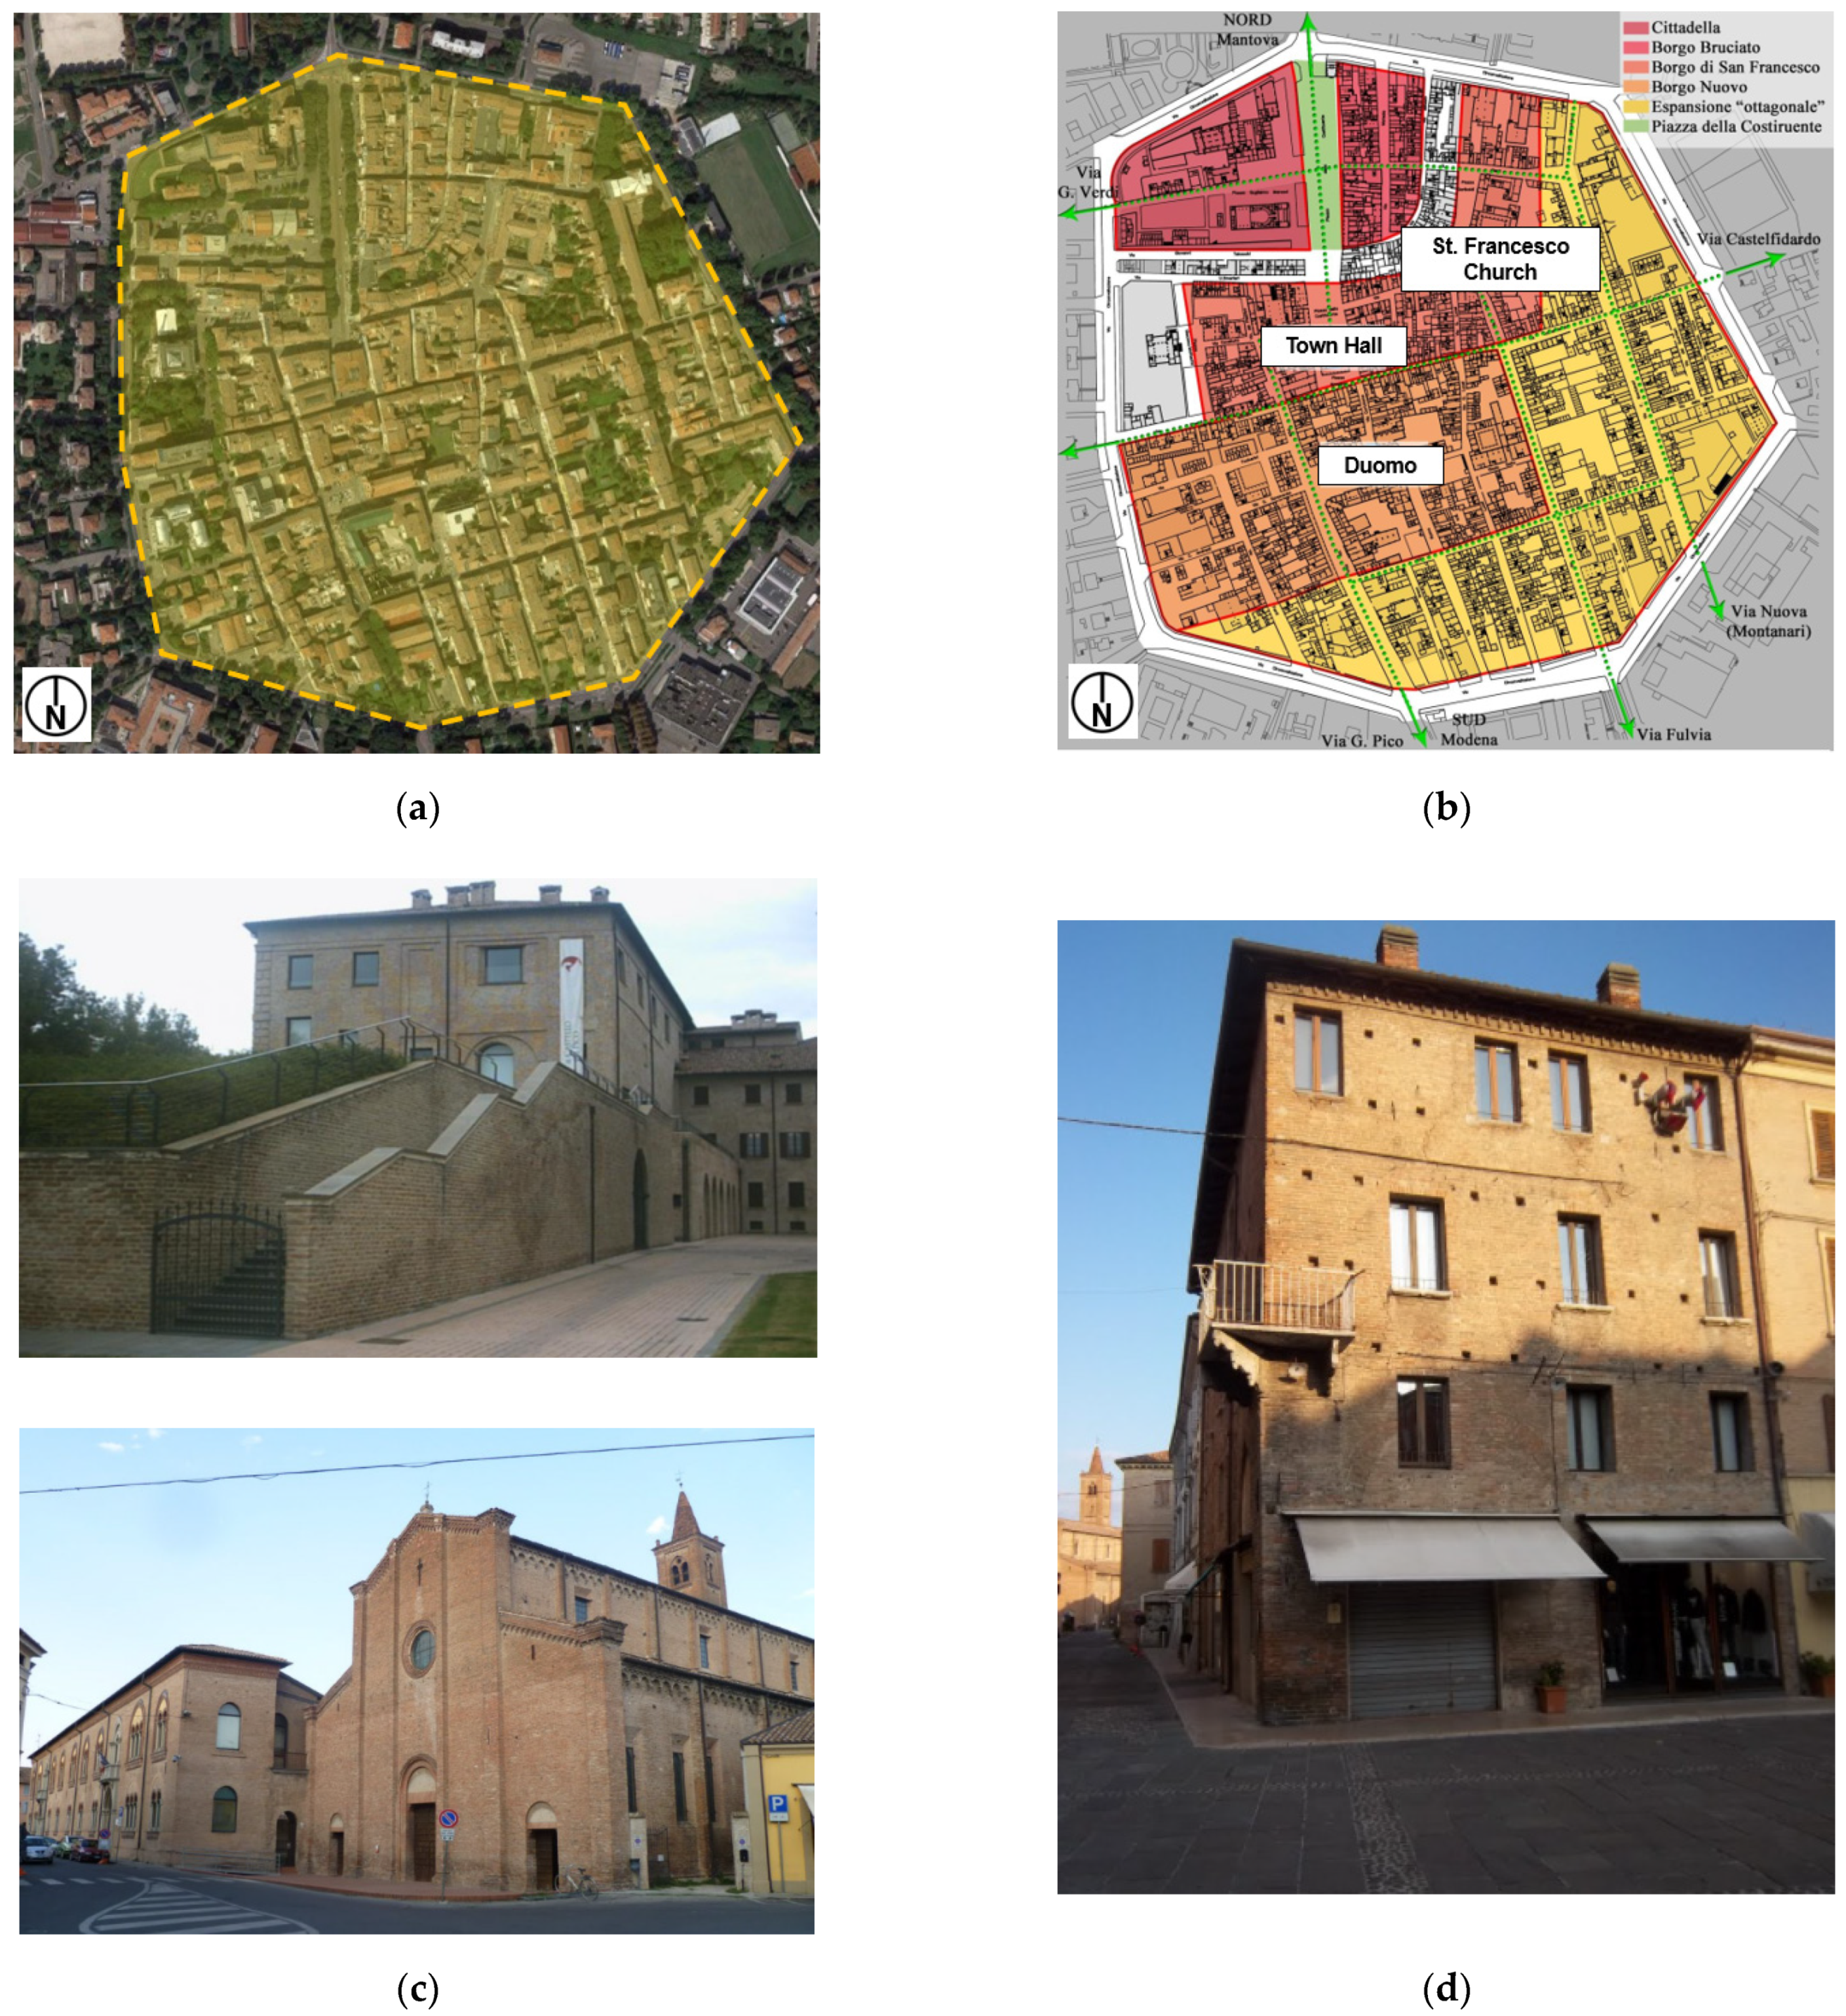
2.1. Historical Centre of Mirandola

The historic center of Mirandola developed over the centuries was based on a casual urban process. The first “Forma Urbis”, apparently casual, responds to settlement rules predisposed to the creation of roads, public spaces necessary for civic life, and public buildings, where the bureaucratic activities of the entire community were carried out.
The historic center of Mirandola is the representation of the spatial configuration of urban interventions developed since the Middle Ages. The city was erected as a fortified city, in which the conformation of the historical settlement is well structured and organized. The pole of the urban layout is the Pico Castle, which stands on the hill of the Favorita, a connecting element with the adjacent villages and the conformation of the main roads. The urban configuration of Mirandola was conceived by incorporating the most important buildings (houses, churches, and palaces) formed around the Pico Castle, to create a planimetric asset with new architectural elements. In general, the buildings are arranged in a clustered configuration on the main path, presenting a free front for the external view and access and an opposite front that overlooks the relevant area (Figure 1) [26].
Nowadays, the new buildings, the union of the villages, and the organization of new neighborhoods have kept unchanged the primordial planimetric configuration of the city (Figure 2). Actually, the historical center is characterized mainly by masonry buildings, erected in aggregate configuration, in which the coexistence of construction heterogeneities, sometimes incongruous, has led to the manifestation of specific seismic vulnerability factors.

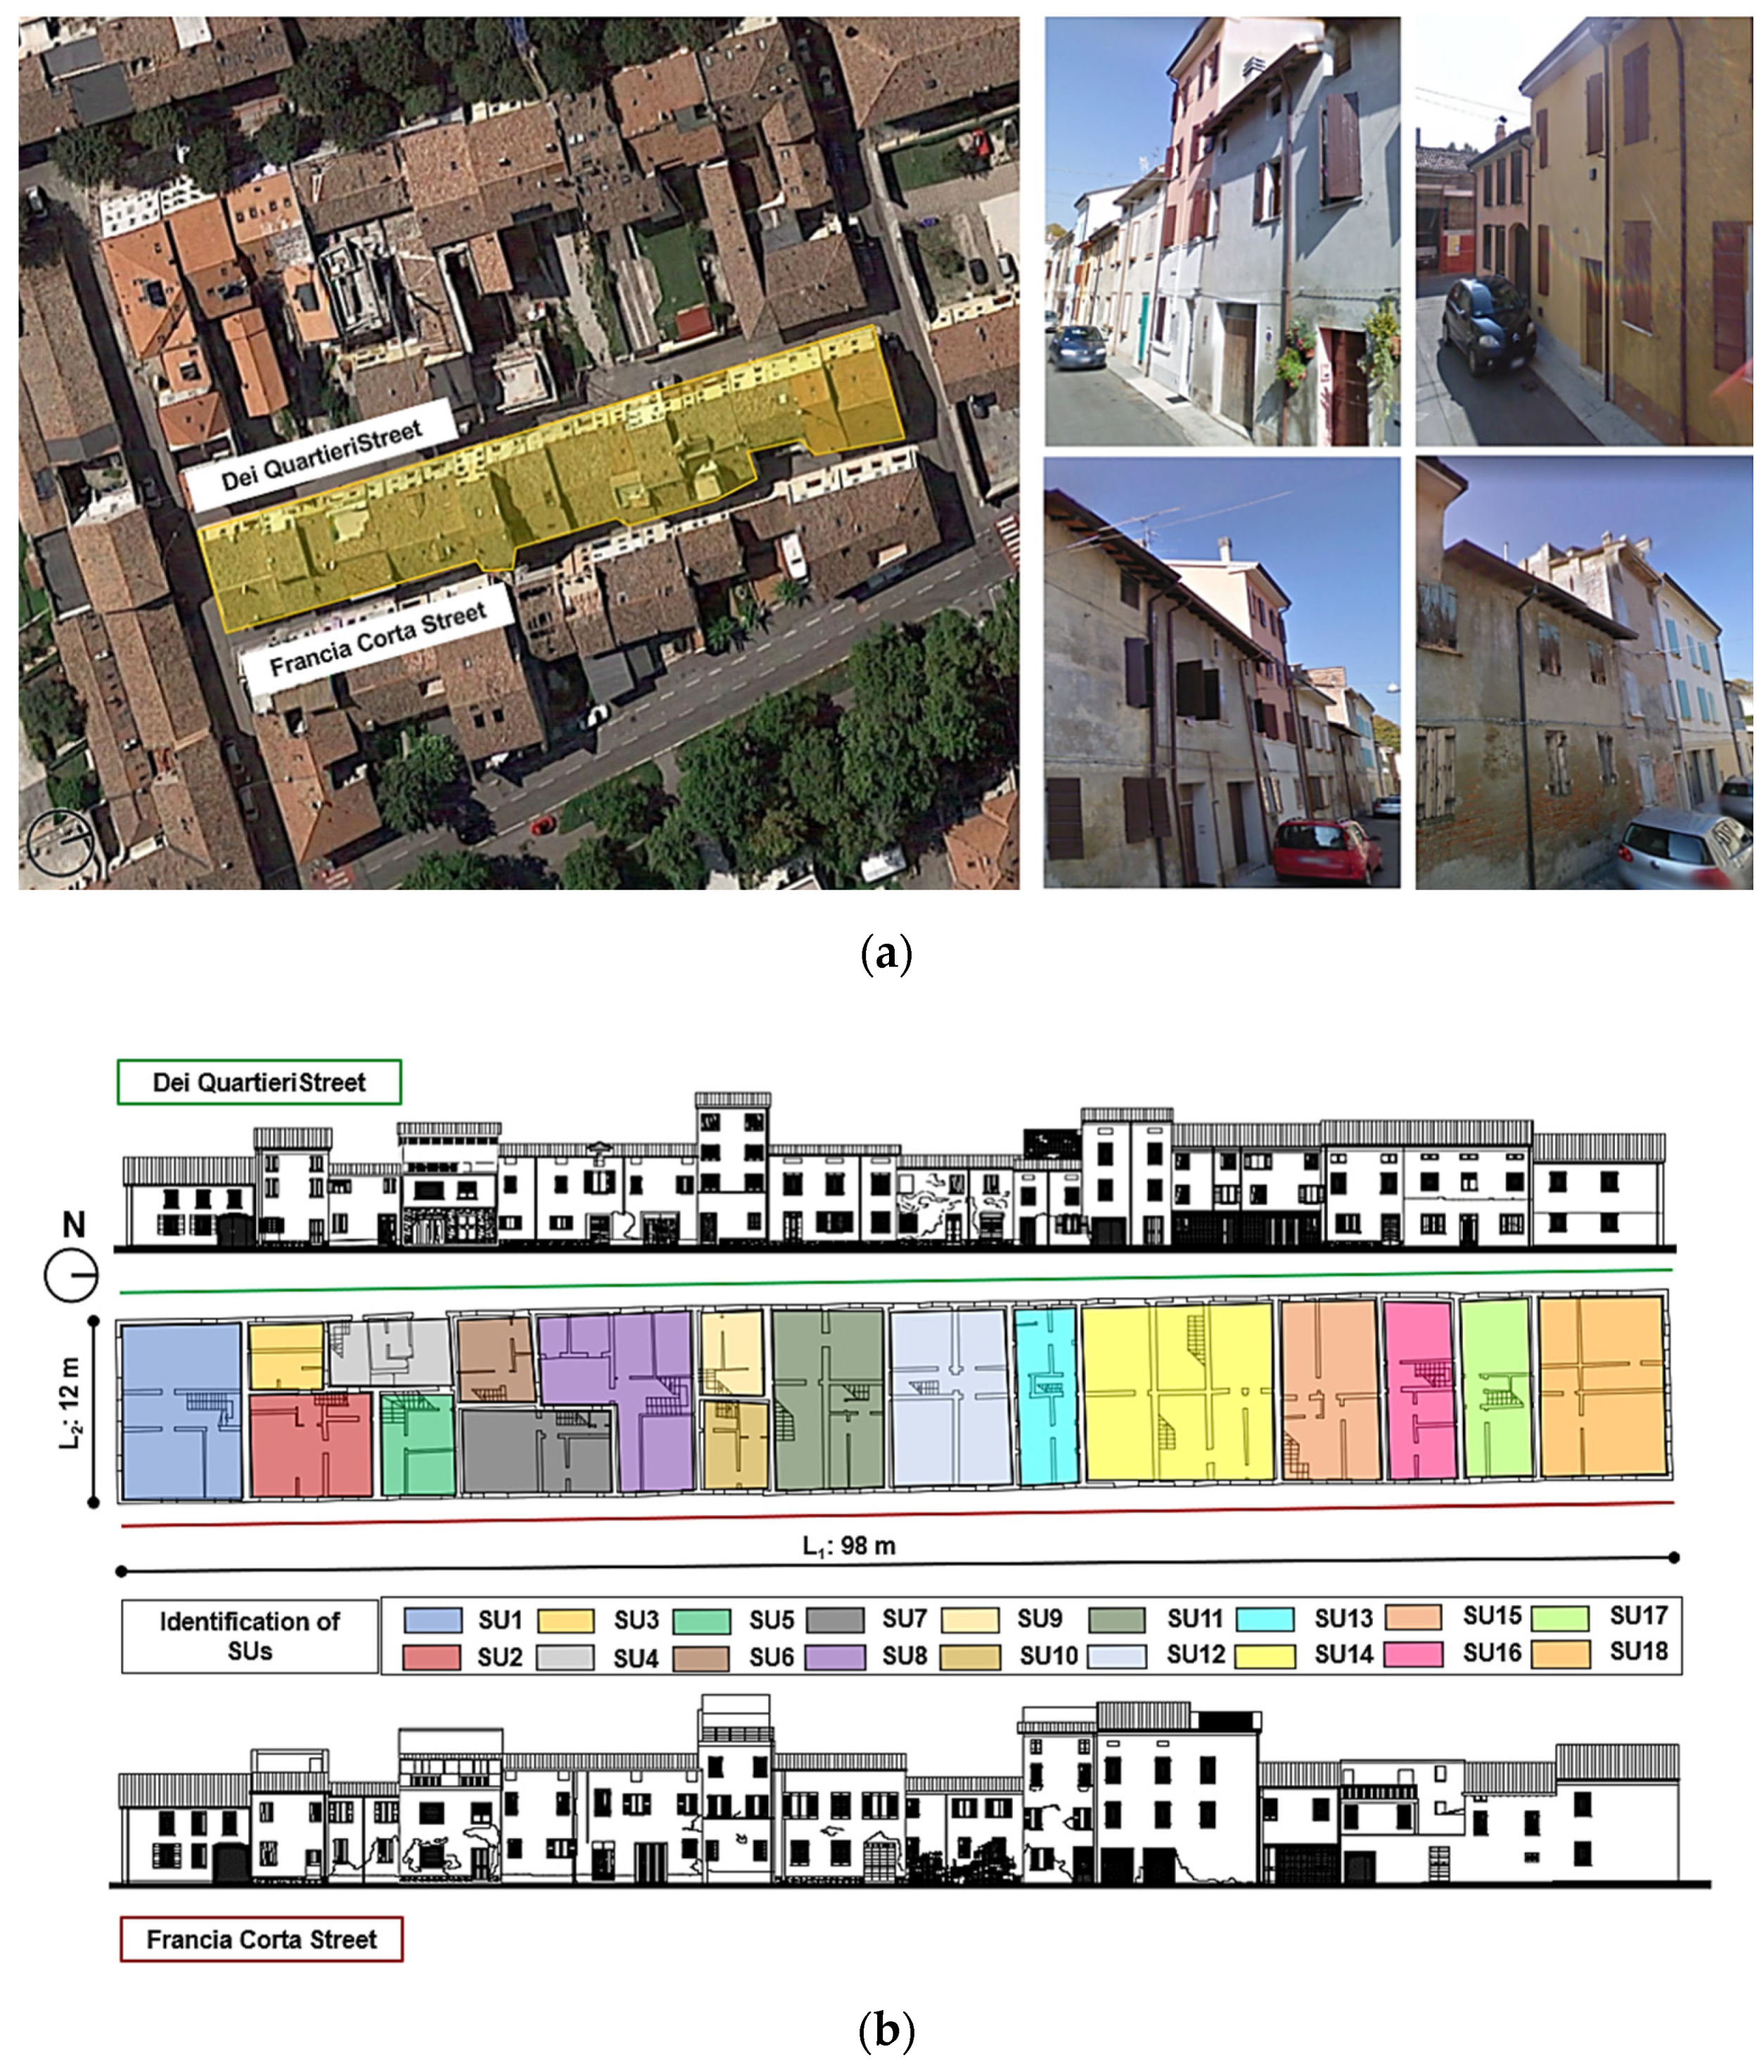
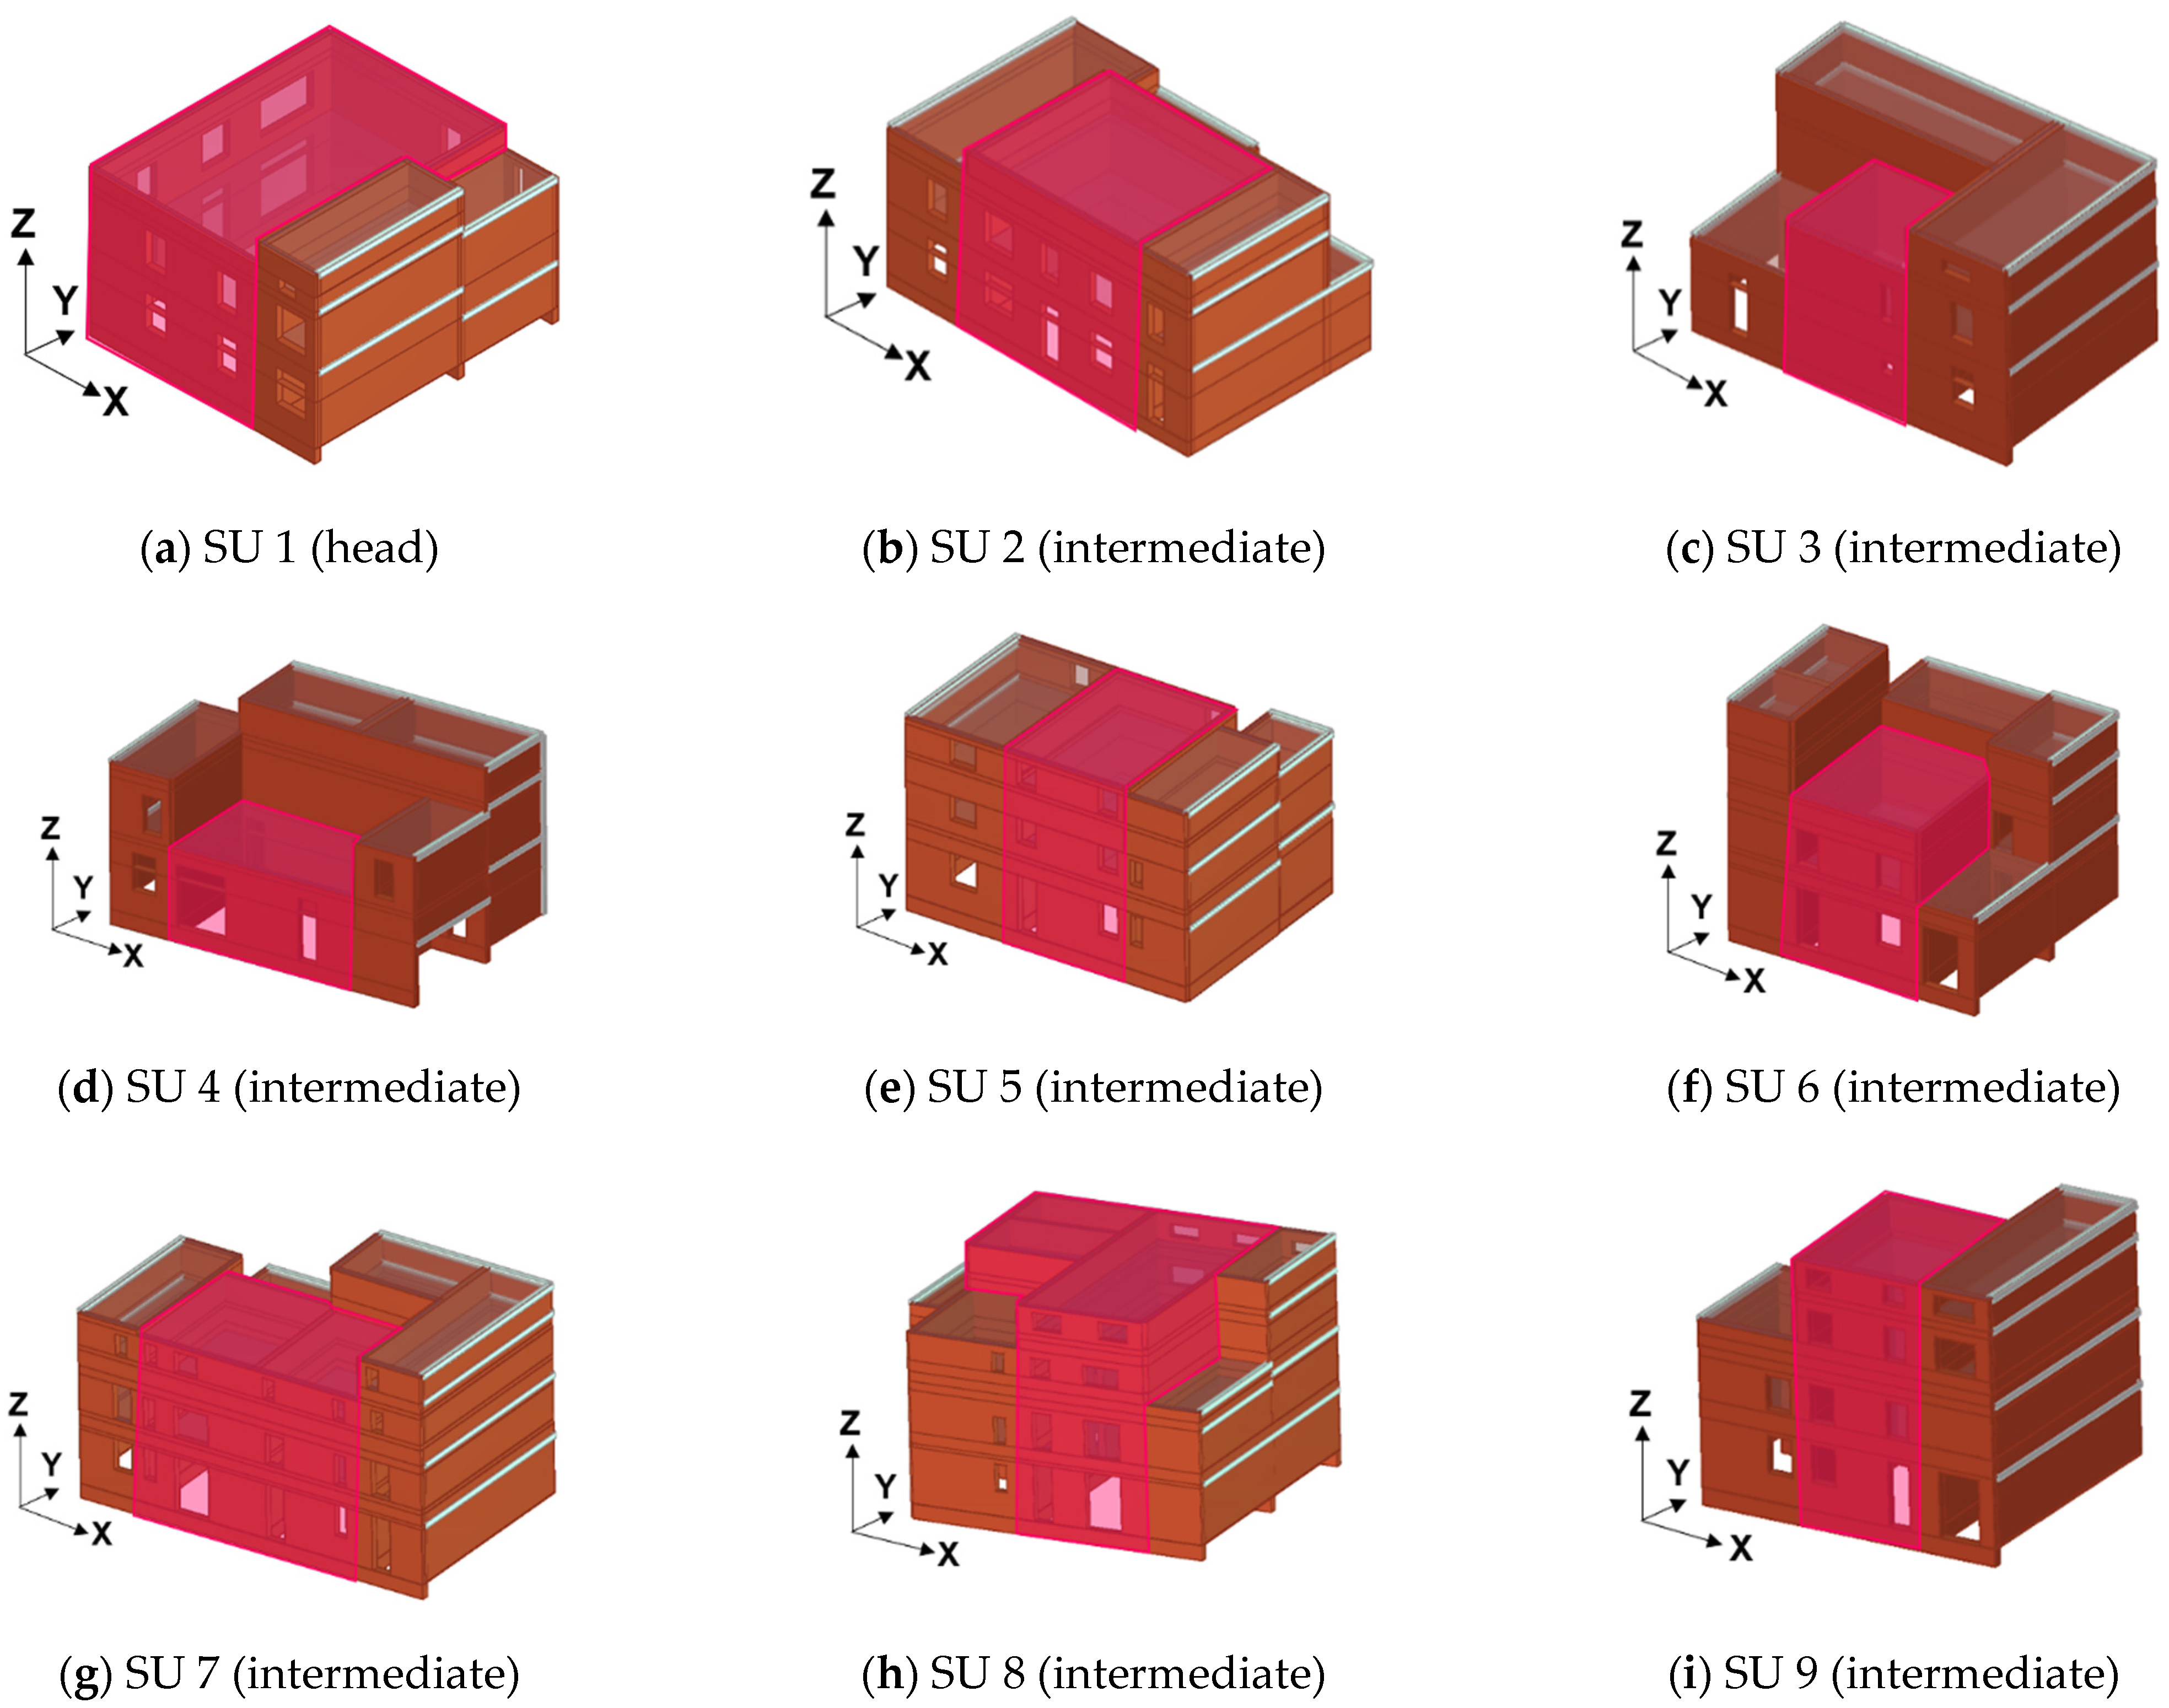
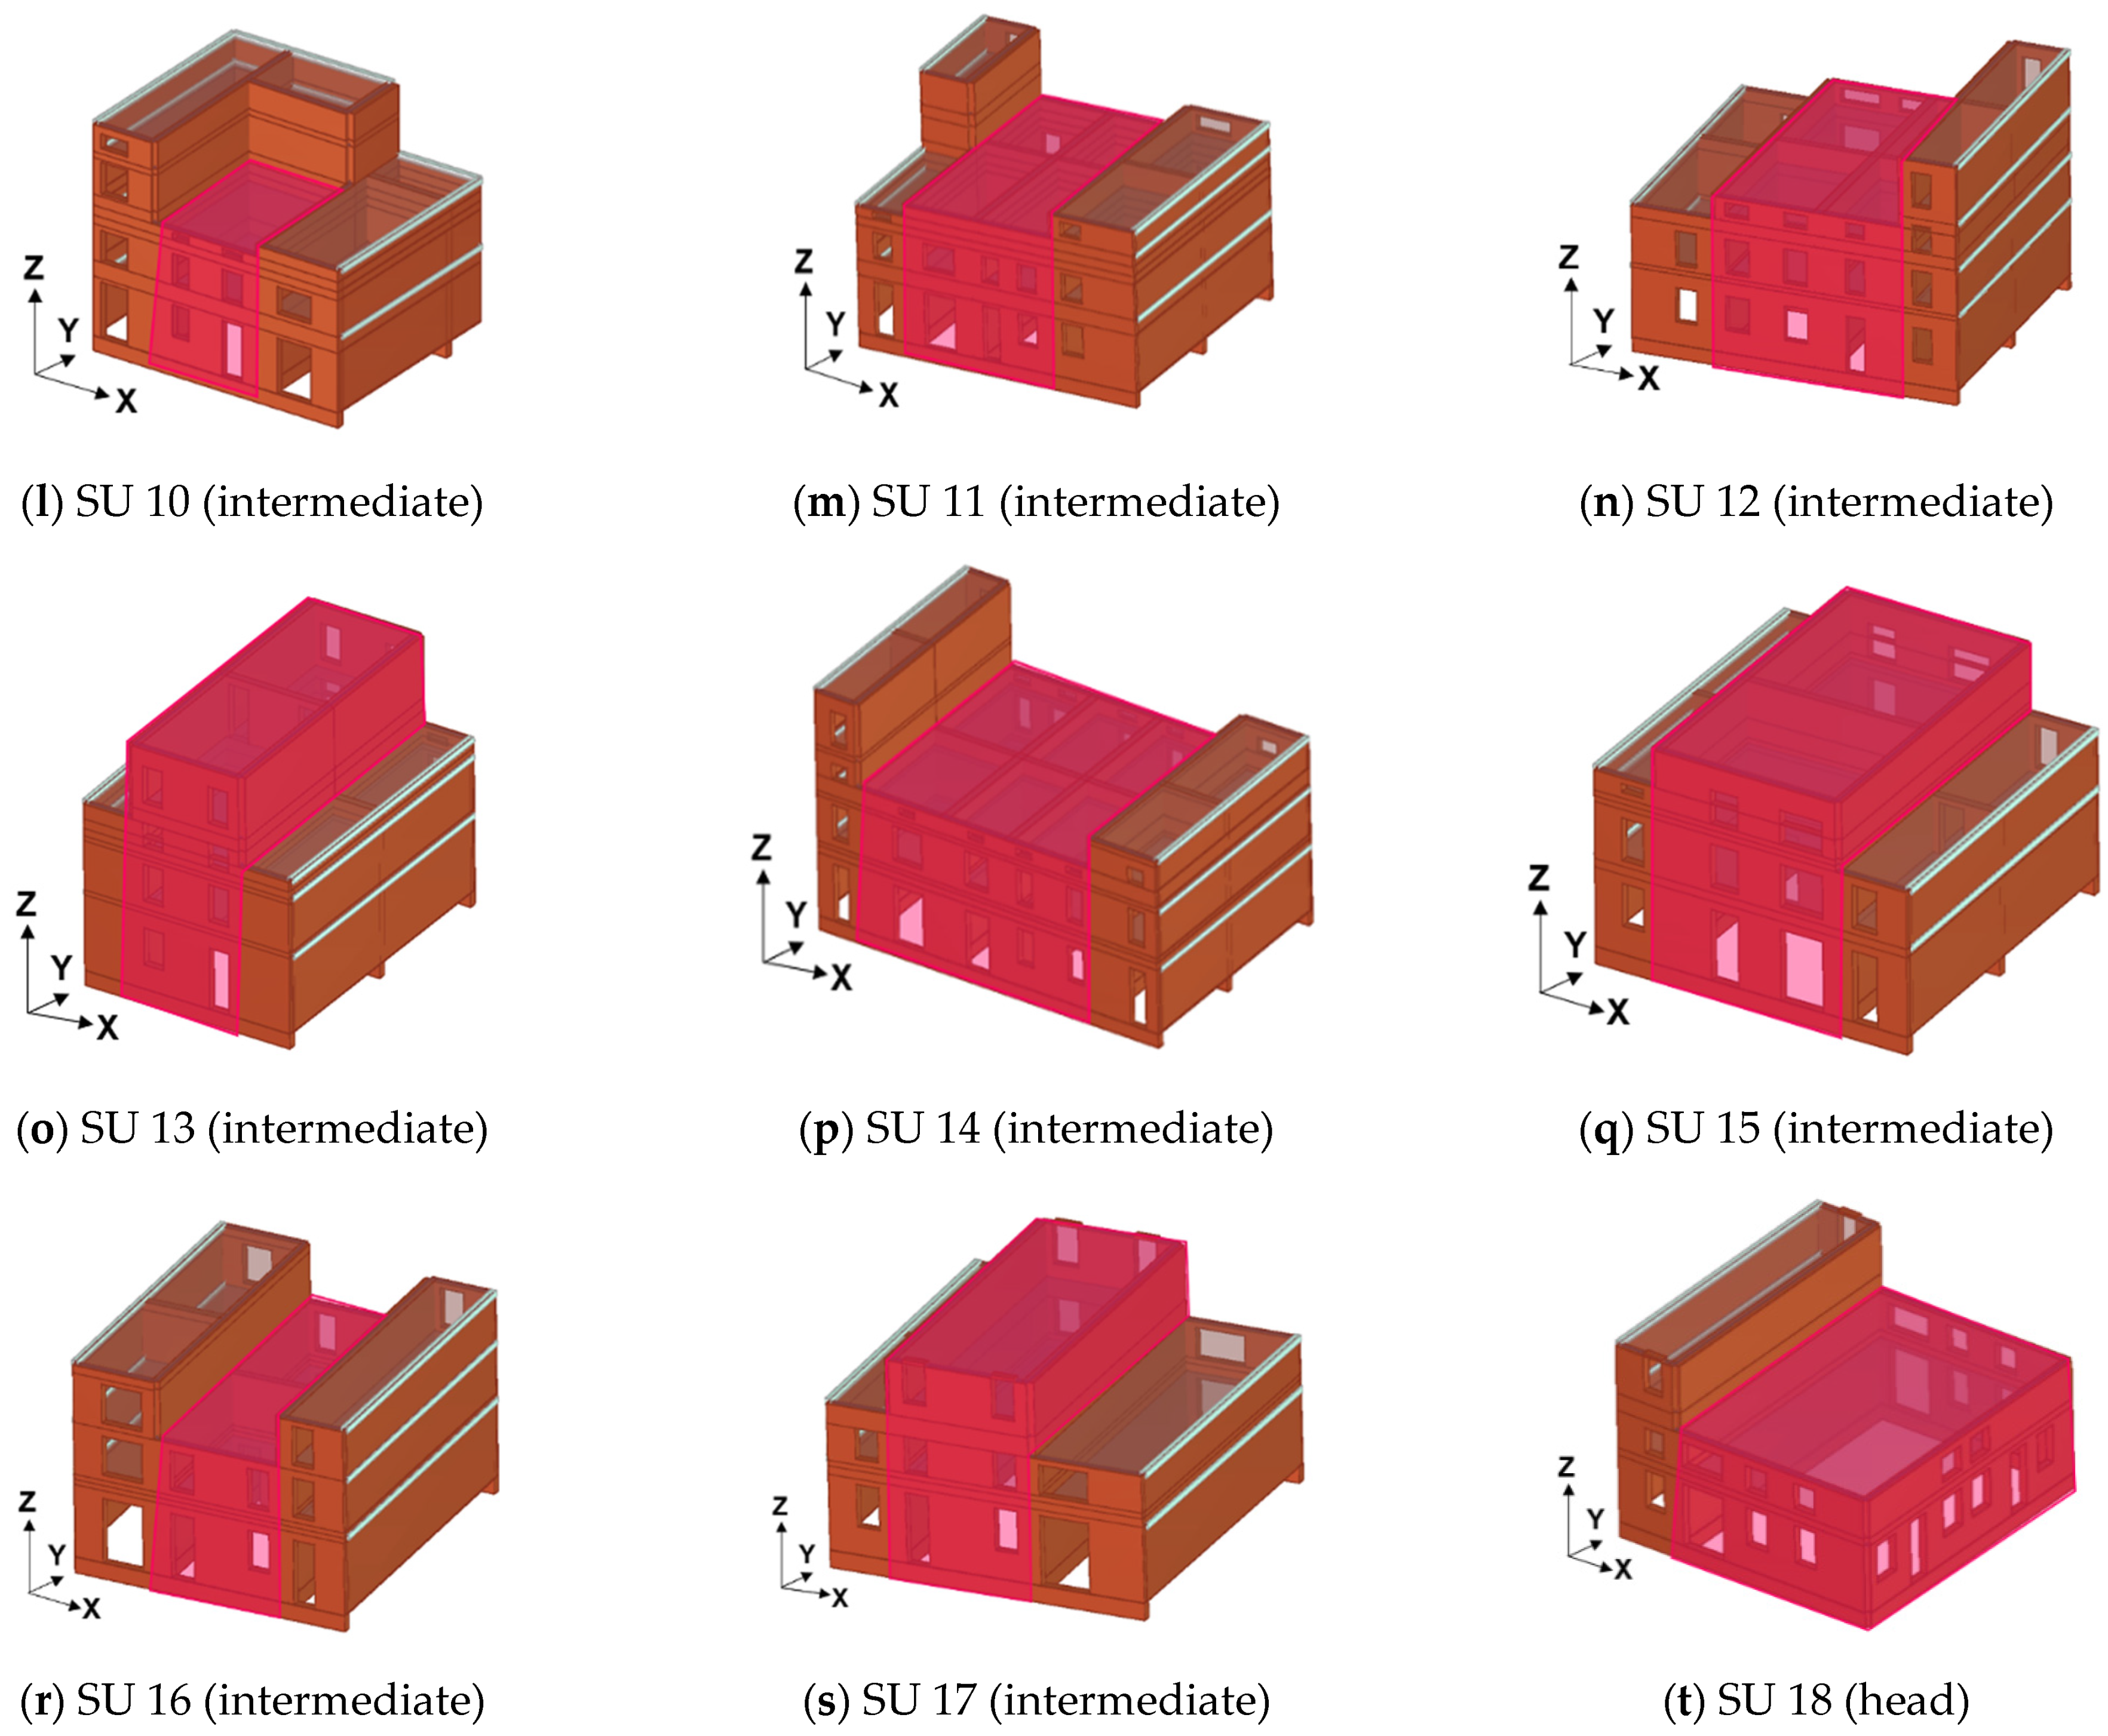
2.2. Case Study Aggregate

The historic center of the city of Mirandola consists of 43 urban areas consisting of buildings erected in the aggregate configuration, as specified in the Recovery Plan of the city approved in July 2001.
The characterization of the present built-up heritage highlights how the size of urban areas is connected to the evolutionary process of the city. Although Mirandola did not have a radial growth, as has happened for other historic Italian cities, it is noted that the dimensional variation of the building aggregates is related to the transition from the first expansion phase of the city (quadrangular plan) to the second one (octagonal plan) [26].
Globally, the buildings located in the historic center are mainly characterized by construction heterogeneity (solid brick walls) with the presence of semi-rigid and/or deformable floors. This building type represents the most common construction typology of the historical centers of the Emilia-Romagna Region.
Concerning the case study building, it is an existing masonry row aggregate composed of 18 SUs mutually interacting with each other (Figure 3). So, the structural units identified as SU1 and SU18 (see Figure 3b), located on the external part of the aggregate, occupy the head position; instead, the 16 internal cells are placed in an intermediate position. On average, the floor number of SUs varies from two to four above ground with an average inter-story height of 2.80 m. The vertical structures, characterized by solid brick walls, have an average thickness ranging from 0.24 m to 0.50 m. The horizontal structures are mainly made of wooden elements with upper double planking.
Along the clustered building façades, which are oriented in the longitudinal direction, the absence of steel tie-rod elements is noticed. This means that, in this direction, the mutual connection between the various SUs is completely entrusted to the compressive contact actions between the walls of adjacent units.
Regarding the physical condition of the examined aggregate, the main view along Francia Corta Street does not show, globally, a marked deterioration of the materials. There are evident spots of humidity and partial detachment of the plaster, which do not alter the building’s static. Similarly, the façade facing Dei Quartieri Street does not show signs of structural decay or cracks.
The mechanical properties of the clustered building structural elements were assumed according to the indications prescribed by Table C8.5.I of the NTC18 [27].
Due to the absence of accurate on-site test procedures, the mechanical characteristic of the masonry was suitably reduced by assuming a confidence factor, CF, equal to 1.35, which corresponds to a level of knowledge LC1 (limited knowledge), based on the historical-critical analysis, the complete geometric survey and limited investigations on the construction details (§ C8.5.2 of the Italian standard explicative Circular [27]) of the examined building, as well as limited tests on the mechanical characteristics of the materials (§ C8.5.3 of the Italian standard explicative Circular [27]). Under these circumstances, for mechanical parameters (fm, τ0, fv0) the minimum values of the intervals reported in Table C8.5.I of the Italian standard [27] were considered, while for the elastic moduli (E and G), the average values provided by the above-mentioned table were taken into account. Based on these considerations, the following mechanical parameters for solid brick masonry are depicted in Table 1:

3. Seismic Vulnerability Assessment

3.1. Empirical Method

To estimate the seismic vulnerability of buildings aggregate, it was adopted a specific vulnerability form proposed in [4,28,29], which is based on Benedetti and Petrini’s vulnerability index method. The proposed vulnerability form, widely recognized internationally, was appropriately conceived for historical aggregate buildings by adding—to the original form—five new additional parameters, which take into account the effects of the mutual interaction among SUs under seismic action. In particular, the new parameters were added to the 10 basic parameters used in the past to survey the buildings considered in isolated configuration [4,28,29] (Table 2).
The vulnerability index, IV, was evaluated for each SU as the weighted sum of the class selected (for each of the 15 parameters listed in Table 2) multiplied by the respective weight [28]. It is possible to notice how these parameters are distributed into four decreasing vulnerability classes (A, B, C, D), whose weight expresses the influence of the single parameter on the global vulnerability of the building.
The vulnerability index, IV, was evaluated by adopting the following Equation (1):
I V = i = 1 15 S i W i
For an easy assessment of the expected vulnerability, the vulnerability range was assumed in the interval (0 ÷ 1) by adopting a normalization of the vulnerability indexes through the following mathematical Equation (2):
V I = [ I V ( i = 1 15 S min W i ) | i = 1 15 [ ( S max W i ) ( S min W i ) ] | ]
Thus, based on these conditions, the distribution of the vulnerability indices concerning the analyzed SUs is plotted in Figure 4.
From the acquired vulnerability scenario, it appears that the estimated vulnerability is below the average threshold of 0.5. As it can be seen, the variability of seismic vulnerability is mainly influenced by the in-elevation interaction between adjacent SUs. This issue is related to the presence of adjacent buildings with different heights, which, consequently, significantly influences the global vulnerability.
Subsequently, the typological vulnerability curves were derived to characterize the expected damage of the analyzed SUs varying the macroseismic intensity [30]. Mathematically, the curves were derived according to Equation (3):
μ D = 2.5 [ 1 + tan h ( I EMS - 98 + 6.25 V I 13.1 Q ) ]
From the above-presented equation, the vulnerability curves depend on three main factors, that are the normalized vulnerability index (VI), the hazard, expressed in terms of macroseismic intensity (I), and a ductility factor, Q, which was herein assumed as equal to 2.3 and describes the ductility of typological classes of buildings examined [30].
Therefore, the mean typological vulnerability curves presented in Figure 5 were plotted to estimate the expected level of damage for the buildings’ stock analyzed. Moreover, the other two curves (VI + 2σ; VI − 2σ) identify the upper and lower bounds of the statistical range of the expected damage [31].
It is worth noting that in Figure 5b, the fixed vulnerability range highlights how varying the hazard threshold is, expressed in terms of macroseismic intensity, and the vulnerability indexes progressively increase with a maximum expected damage level equal to D4 (partial collapse, VI = 0.48 and µD = 4.19)

3.2. Mechanical Analyses

The numerical analyses were performed using the 3Muri software [32] based on the Frame Macro-Elements (FME) theory. In this approach, it was assumed that masonry walls are considered as a set of single-dimensional macro-elements (columns, beams, and nodes) suitably interconnected to each other. The strength criteria of deformable elements were assumed based on EN 1998-3 provisions [33], which have established, as maximum drifts for shear and flexural collapse failures, the values of 0.4% and 0.6%, respectively. Another parameter to be considered for the global seismic structural response is the damping, which conditions the dissipation of the seismic energy input, limiting the forced vibrations of the structure. More in particular, this parameter is based on intrinsic mechanisms concerning the building material, the structural type, and the type of soil systems, that could be properly defined as the percentage of the total vibration energy lost in a loading cycle. From a standard point of view, NTC18 [27] provides a reference design spectrum assuming a damping value of 5% and suggesting a formulation to modify the spectrum when the effective damping assumes different values.
In the case under study, the analyses were carried out along the two main global directions of buildings, X and Y, assuming a design spectrum damping of 5% for the evaluation of the seismic demand, Dmax. These analyses were interrupted at a 20% decay of the maximum shear resistance according to the NTC18 indications [27]. The main topic considered for the reference case study building was to estimate the influence of the mutual interaction among adjacent structural units. The reference case study clustered structural cells are illustrated in Figure 6, where the aggregate configuration effect was modelled taking into account the half part of the units contiguous to the reference one accounting for their contribution in terms of both stiffness and mass.
In addition, the behavior of the above-presented SUs was also analyzed in isolated configurations to appreciate the differences in terms of stiffness, ductility, ultimate displacement, and base shear concerning the case of aggregate constructions [4].
To this purpose, four different distributions of seismic forces (±X, ±Y) were considered, so as to simulate 288 analyses (144 for each configuration, namely aggregate and isolated). The results in terms of capacity curves are presented in Figure 7.
From a careful analysis of the results, it is possible to notice how the global behavior of the structure in both configurations, namely aggregate and isolated, showed a capacity variability in the two analysis directions. In particular, in the longitudinal direction (X-direction), an average increment of 48% was noted for SUs placed in aggregate configurations in comparison to the isolated ones. Furthermore, in terms of displacement ductility, a decrease of 55% was obtained in the aggregate configuration since, in this case, the confinement effect offered by the contiguous structural units on the reference one limits the expected displacements compared to the isolated cases. However, this limitation also depends on the torsional phenomena, which are more critical for the external structural cells. The torsional effects arose from the addition of aliquots of structural mass passing from the isolated configuration to the aggregate one, causing a non-uniform distribution of the in-plane resistant elements. Thus, the more pronounced eccentricity between centroid and stiffness center triggered a premature rupture of more wall panels. Conversely, in direction Y, the aggregate configuration denotes an increase of 41% in terms of both resistance and displacement capacity.
Subsequently, to understand the variation of the global response between the examined structural configurations (aggregate and isolated), the main capacity parameters (stiffness, strength, ductility, and ultimate displacement) were plotted and correlated to each other. The results are depicted in Figure 8.
From the achieved results, it is possible to note the variability of the monitored structural parameters in the two analysis directions.
First of all, by analyzing the maximum stiffness (see Figure 8a) in X-direction, it can be seen that Kagg = 375,000 daNcm−1 and Kiso = 190,000 daNcm−1. So, passing from aggregate to isolated configurations, a stiffness reduction of −97% was attained. Similarly, in the Y-direction, Kagg. exhibits an average increase of two times compared to the value provided by Kiso. In terms of maximum shear strength (see Figure 8b), it was observed how in the ±X and ±Y-directions, Vagg, globally, had a noticeable reduction compared to the corresponding Viso. This result is due to the fact that, in aggregate configuration, the seismic load is distributed on a higher number of shear-resistant wall areas. Regarding the displacement ductility (see Figure 8c), it was observed that in both analysis directions, the points cloud is quite homogeneous for 1 < µ < 10, while µ > 10 is reached for the heading structural units. Finally, it is noted how in ±X-directions, the ultimate displacements, du, associated with the aggregate configuration are reduced concerning the isolated ones (see Figure 8d). Conversely, in ±Y-directions, the behavior is reversed for the aggregate configurations providing an increase of about 1.5 times with respect to the isolated cases.
Furthermore, to take into account the effective degree of confinement provided by the SUs adjacent to the reference structural cells, the most significant three configurations, namely (i) the head cell confined on one side only (SU 1), (ii) intermediate cell confined on three sides (SU 7) and (iii) intermediate confined on two sides (SU 13), were extrapolated from the considered portions of the building aggregate (Figure 9).
These configurations were compared, in terms of capacity curves, with the analogous SUs placed in isolated morphology conditions, as reported in Figure 10.
The achieved results show a difference in terms of behavior in the two analysis directions. In particular, in X-direction, SU 7 offers the highest strength and stiffness since it is confined by other structural cells, but it has reduced displacements compared to the other clustered units. The highest strength and stiffness is due to the large contribution offered in X-direction by masonry walls of the other three SUs working under earthquake. On the other hand, SU 7 exhibited the lowest ultimate displacement, since its seismic movements are strongly limited by the adjacent SUs, which have constrained on three sides (instead of one and two sides for SU 1 and SU 13, respectively) of the inspected structural cell.
In contrast, SU 1 (head cell) has both strength and stiffness lower than those of the other SUs in the aggregate configurations. This is justified by the fact that the position of SU 1 (constrained on one side only) makes it more susceptible to damage, since the structural connection with contiguous units occurs only on one side by compressive contact, while the opposite free side of the SU is subjected to torsion phenomena, which cause an increment of the damage. However, as desirable, the SUs in the aggregate configuration provide shear and stiffness greater than the same units considered in the isolated configurations. Nevertheless, at the same time, the aggregate SUs show a reduction in terms of displacement due to the clustered effect given by the contiguous structural cells. In Y-direction, it can be seen how SU 13 in aggregate configuration has a higher stiffness and resistance compared to the ones of SU 1 and SU 7, respectively. Furthermore, the above-mentioned SU 13 provides an ultimate displacement approximately equal to three times higher than that of SU7 and 1.5 times greater than that of SU 1. Consequently, by comparing the same SUs with the analogous cells in isolated configuration, it was noted how the intermediate aggregate units (SU 7 and SU 13), even if they have a higher strength and stiffness, provide a reduced displacement capacity. Nonetheless, SU 1 showed the worst behavior in terms of strength, stiffness, and ultimate displacement. Moreover, a seismic check at the Ultimate Limit State (ULS), defined according to the Italian Code, NTC18 [27], was carried out. In particular, the seismic verification was estimated through the seismic index, ζ, which represents the ratio between the capacity acceleration (PGAC), evaluated at the ULS considered, and the corresponding acceleration demand, PGAD, related to the construction site. In particular, for ζ ≥ 1 of the analyzed SUs provided a good seismic response without reaching significant structural damages; conversely, for ζ < 1, a more or less damaged condition was reached and the SUs required appropriate retrofitting interventions [4]. The ζ-safety indexes for all examined cases are reported in Figure 11.
The obtained results show clear indications regarding the seismic capacity of the buildings aggregate compared to the isolated buildings one. In particular, in X-direction, it can be seen that SU 1 (head) in aggregate configuration has a seismic index slightly higher than that of the isolated one due to the additional mass contribution offered by SU 2. Nevertheless, the isolated SU 1 has a safety index lower than 1. Moreover, almost all the SUs (isolated and in aggregate conditions) have a seismic index lower than 1, not satisfying the verification. This inconsistency is given due to the presence of in-elevation discontinuity, which alters the expected global behavior. In Y-direction, it is noted that almost all the SUs, except for SUs 13 and 14 (which have more than two floors above ground), have a safety index lower than 1. Conversely, the same SUs in isolated conditions have a seismic index higher than 1, since they are not affected by the constraint effect given by the adjacent SUs.

3.3. Sensitivity Analysis

In compliance with the analyses introduced in Section 3.2, herein the main objective is to analyze the uncertainties relating to the models examined by means of a sensitivity analysis (SA). This analysis is performed for identifying the parameters having the greatest impact in the calculation phase. Specifically, the characteristics of the materials, the thicknesses of the masonry, the stiffness of the floors are all factors affected by high uncertainties that can alter the achieved results. From an applicative point of view, an SA can be of two types: (i) knowledge sensitivity and (ii) improvement sensitivity. In the first case, it is possible to deepen the knowledge of the most significant structural parts by optimizing the on-site test procedures; in the second case the structural elements leading to the structural upgrading by optimizing expected costs are identified.
Mathematically, the sensitivity indexes (IS), appropriately diversified according to the type of analysis considered, can be calculated as follows [32]:
I S = α mean   α min α mean   knowledge   sensitivity
I S = α mean   α max α mean   improvement   sensitivity
where αmean, αmin and αmax represent the mean, minimum and maximum safety index achieved during the non-linear calculation phase by combining, simultaneously, the parametric variations of improved material properties (group G1) and retrofit interventions on floor types (group G2).
In this case, this methodological procedure focused on the relevant structural schemes, i.e., those relating to SUs 1, 7 and 13, by adopting the 3Muri sensitivity post-processor [32]. In this perspective, the mechanical characteristics of the masonry, fm, τ0, fv0, E and G (group G1) were varied as a function of a possible enhancement intervention on the floor systems (group G2) by assuming a variability interval equal to 10%. The elaborated results are presented in Figure 12.
By comparing the results derived from simulation, it is possible to note how globally, for the SU1, there is a higher sensitivity associated with group G1 than the other one. Therefore, the improvement of the mechanical characteristics had a greater impact than the retrofitting interventions on the floor systems, since the sensitivity indices are 21.87% and 25.39%, respectively. On the contrary, it is noted that for SU7 and SU13, the second analysis group (group G2) has slightly higher sensitivity indices than those offered by group G1. This highlights how both the reinforcement of the floor structures and the improvement of the characteristics of masonry are very important for the intermediate units, whose behavior is influenced by the contiguous units. Finally, it was observed how the increase in the mechanical parameters also increase the overall seismic safety indexes (black squares) compared to the corresponding values in the phase before interventions (yellow circles).

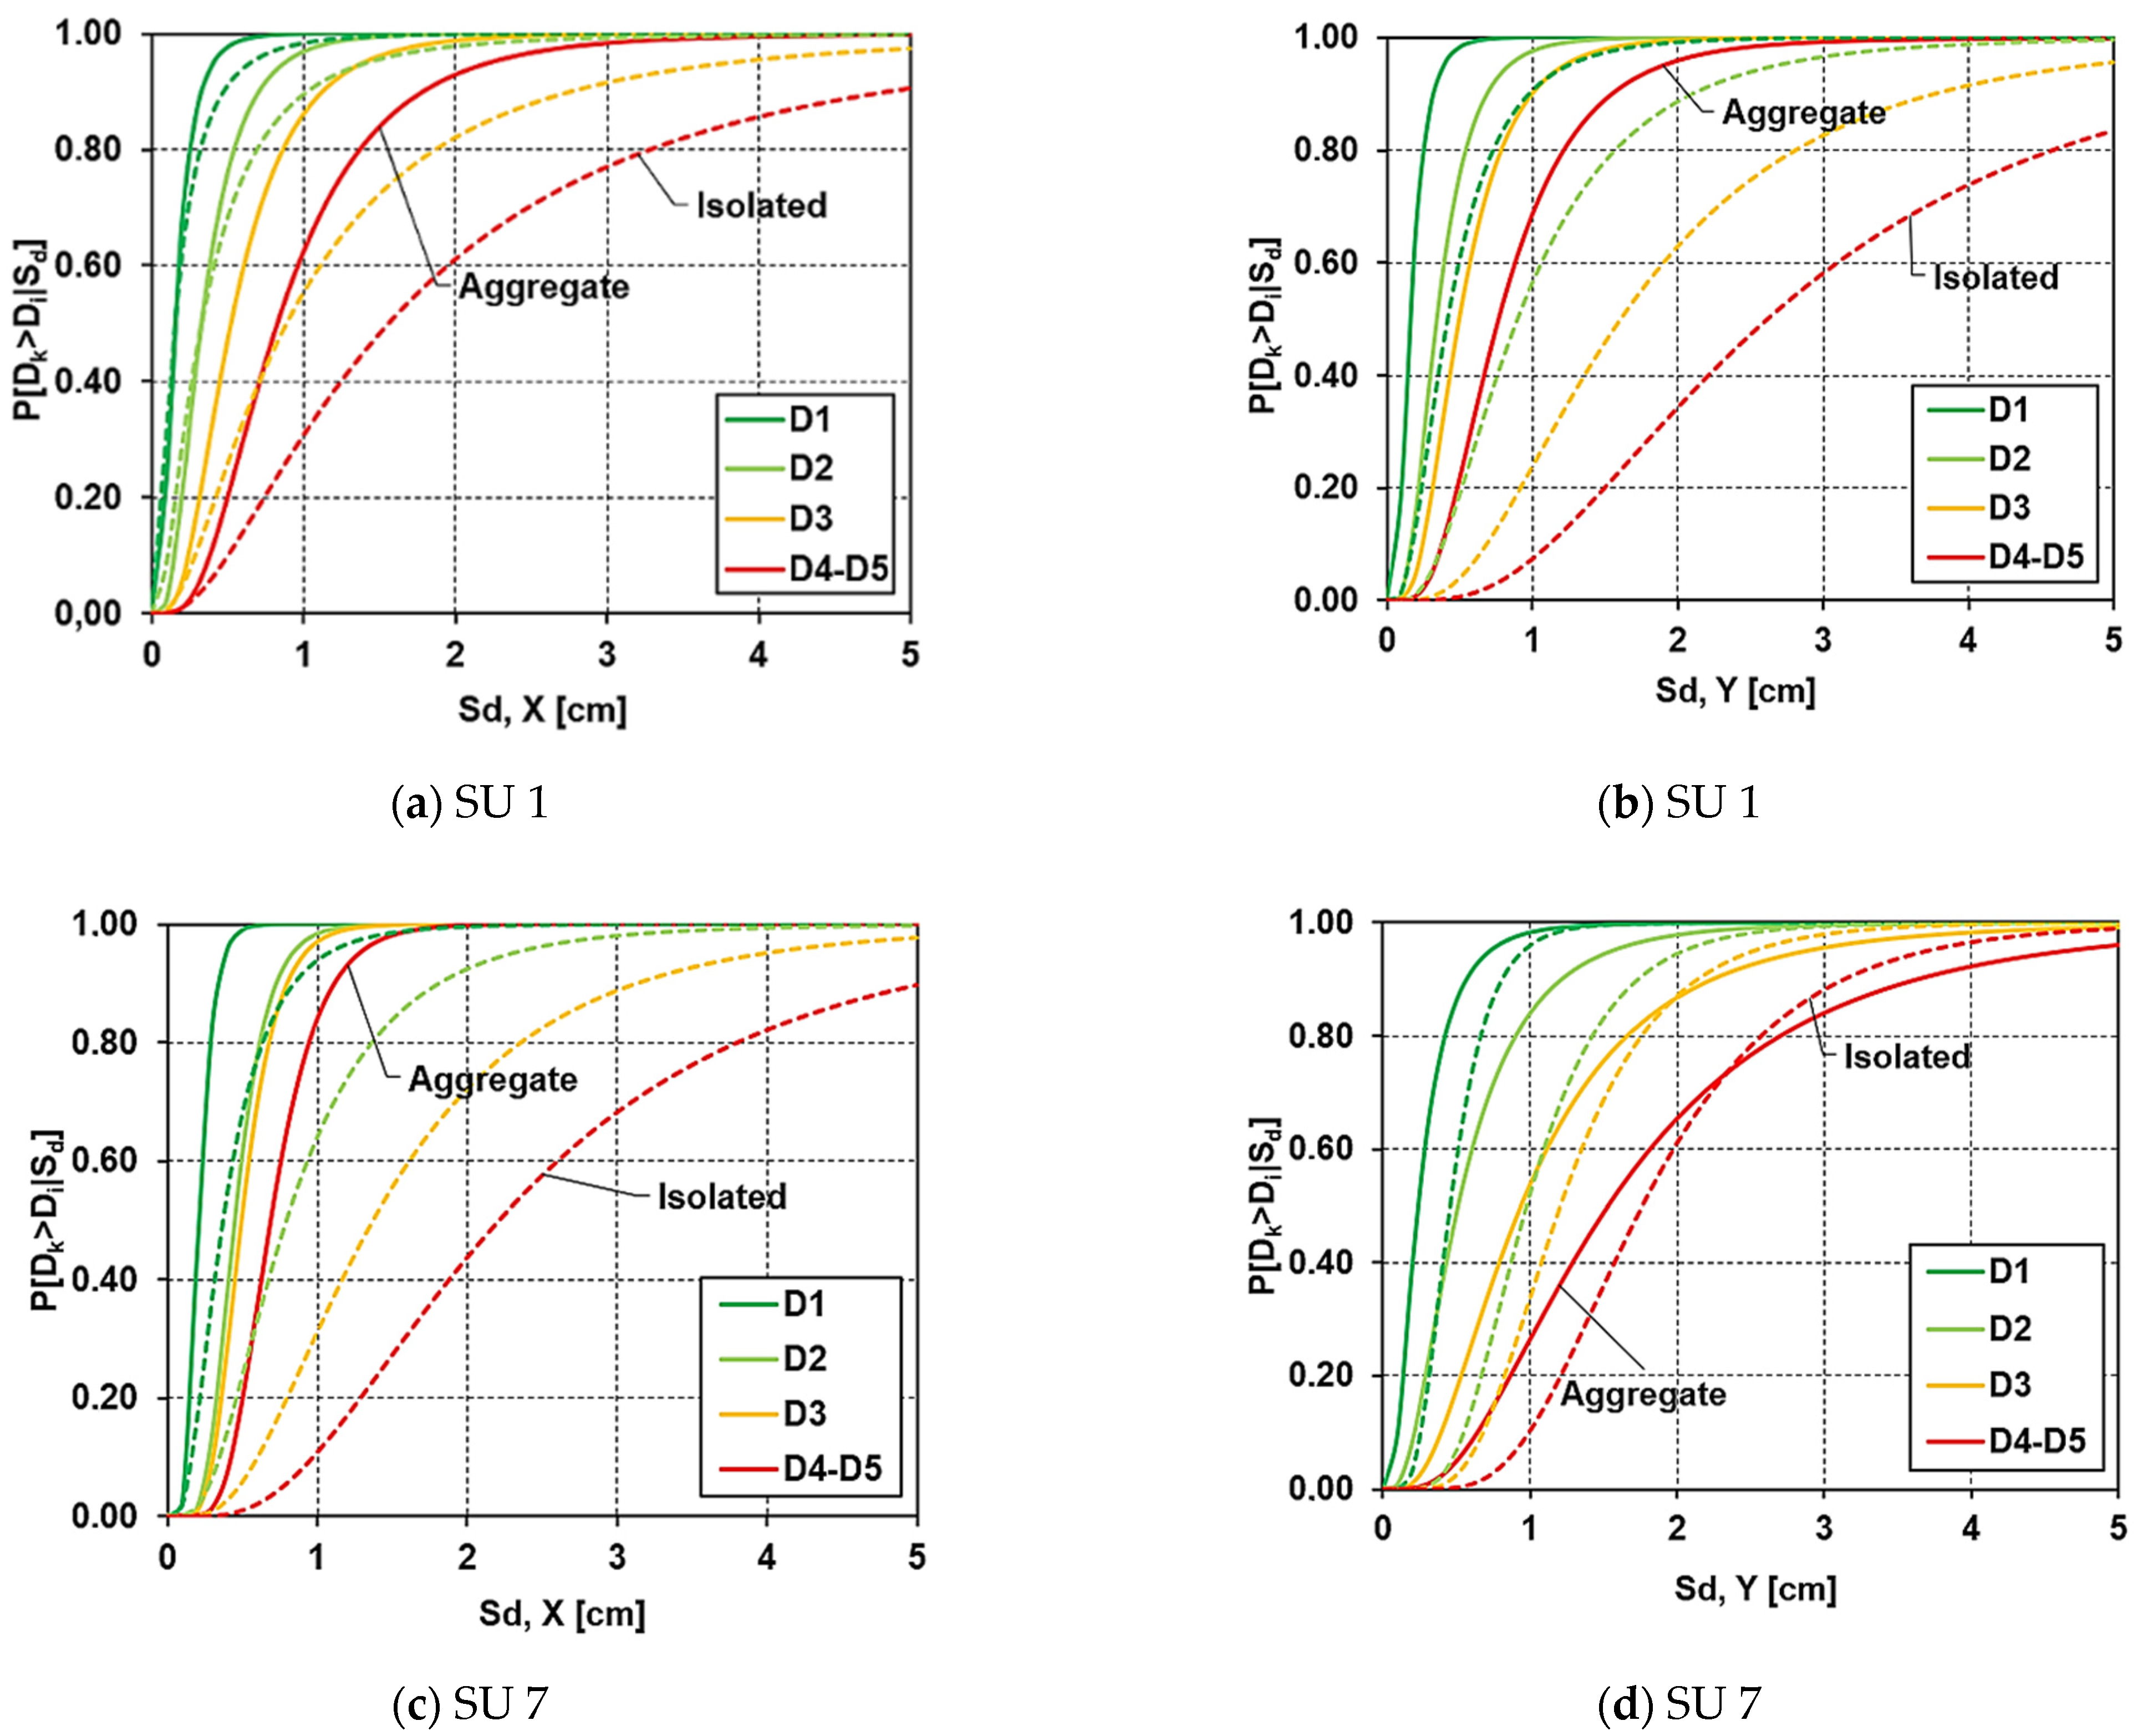
3.4. Fragility Assessment

In this section, the fragility functions were analyzed for the reference case study SUs analyzed in Section 3.2. As it is known, fragility curves represent the probability of exceeding a certain damage threshold varying the intensity measurement, IM, generally represented by either the PGA or the spectral displacements, Sd [34,35]. The evaluation of the fragility curves was herein estimated according to the methodology proposed in [36], where four damage states, namely D1 (slight), D2 (moderate), D3 (near collapse), and D4-D5 (collapse), were considered as suggested in [4]. Methodologically, fragility curves were derived according to Equation (6):
P [ DS | PGA ] = Φ [ 1 β ln ( S d S d DS ¯ ) ]
where the operator Φ is the cumulative distribution function, SdDS is the median displacement value associated with each damage threshold and β is the standard deviation of the log-normal distribution. This latter factor is a function of the structural ductility, μ, of the SDoF system, and it was evaluated as the natural logarithm of the ratio between the ultimate displacement, du, and the corresponding yielding displacement, dy, multiplied by a correlation coefficient of 0.45 [36]. Thus, the damage states and the standard deviations were identified, as reported in Table 3:
Thus, based on these prerogatives, the fragility functions were plotted in Figure 13 for the above-mentioned case study SUs examined in Section 3.2.
From the obtained results, it was observed how the probability of exceeding a certain damage threshold DSi (with i = 1, …, 4) is much more accentuated in the case of the clustered configuration. As explained in Section 3.2, the increment in terms of mass deriving from close SUs provides an increase in the seismic load, but a consequent reduction of the expected displacements. Considering SU 1 in X-direction, for a maximum displacement of 0.5 cm, the achieved damage thresholds D1 and D2, evaluated for aggregate and isolated configurations, are comparable to each other. Instead, starting from a target displacement of 1 cm, there is a difference in terms of the expected damage probability thresholds. In particular, SU 1 considered as isolated provided a lower probability of damage than the same SU placed in the masonry compound. Extending this consideration to the Y-direction), the same condition arises. This circumstance depends on the fact that the reference SU in the isolated condition shows an increase in the displacements (dy = 0.60 cm; du = 1.46 cm) compared to those of the clustered SU (dy = 0.23 cm; du = 1.44 cm) which has lower values of the expected damage thresholds. This condition was observed even for the other SUs analyzed.
For an exhaustive comparison between aggregate and isolated SUs, in Table 4, the displacements (yielding and ultimate) achieved for the case study configurations are depicted.
Finally, in Figure 14, the comparison in terms of damage levels between SU 1 (head SU, confined on one side) and SU 13 (intermediate SU, confined on two sides) is illustrated to point out the influence of structural performance on the fragility assessment.
The results show that SU 1, which occupies a heading position, provides a higher probability of damage than that of the corresponding SU 13. It is worth highlighting how the head unit, despite having a lower number of floors (therefore, a lower mass and stiffness) and a reduced lateral constraint offered by the adjacent cells, provided an expected damage level greater than the SU 13 one, since the torsional phenomena limit the capacity displacements and, consequently, the expected damage is much higher.

4. Prediction of the Vibration Period
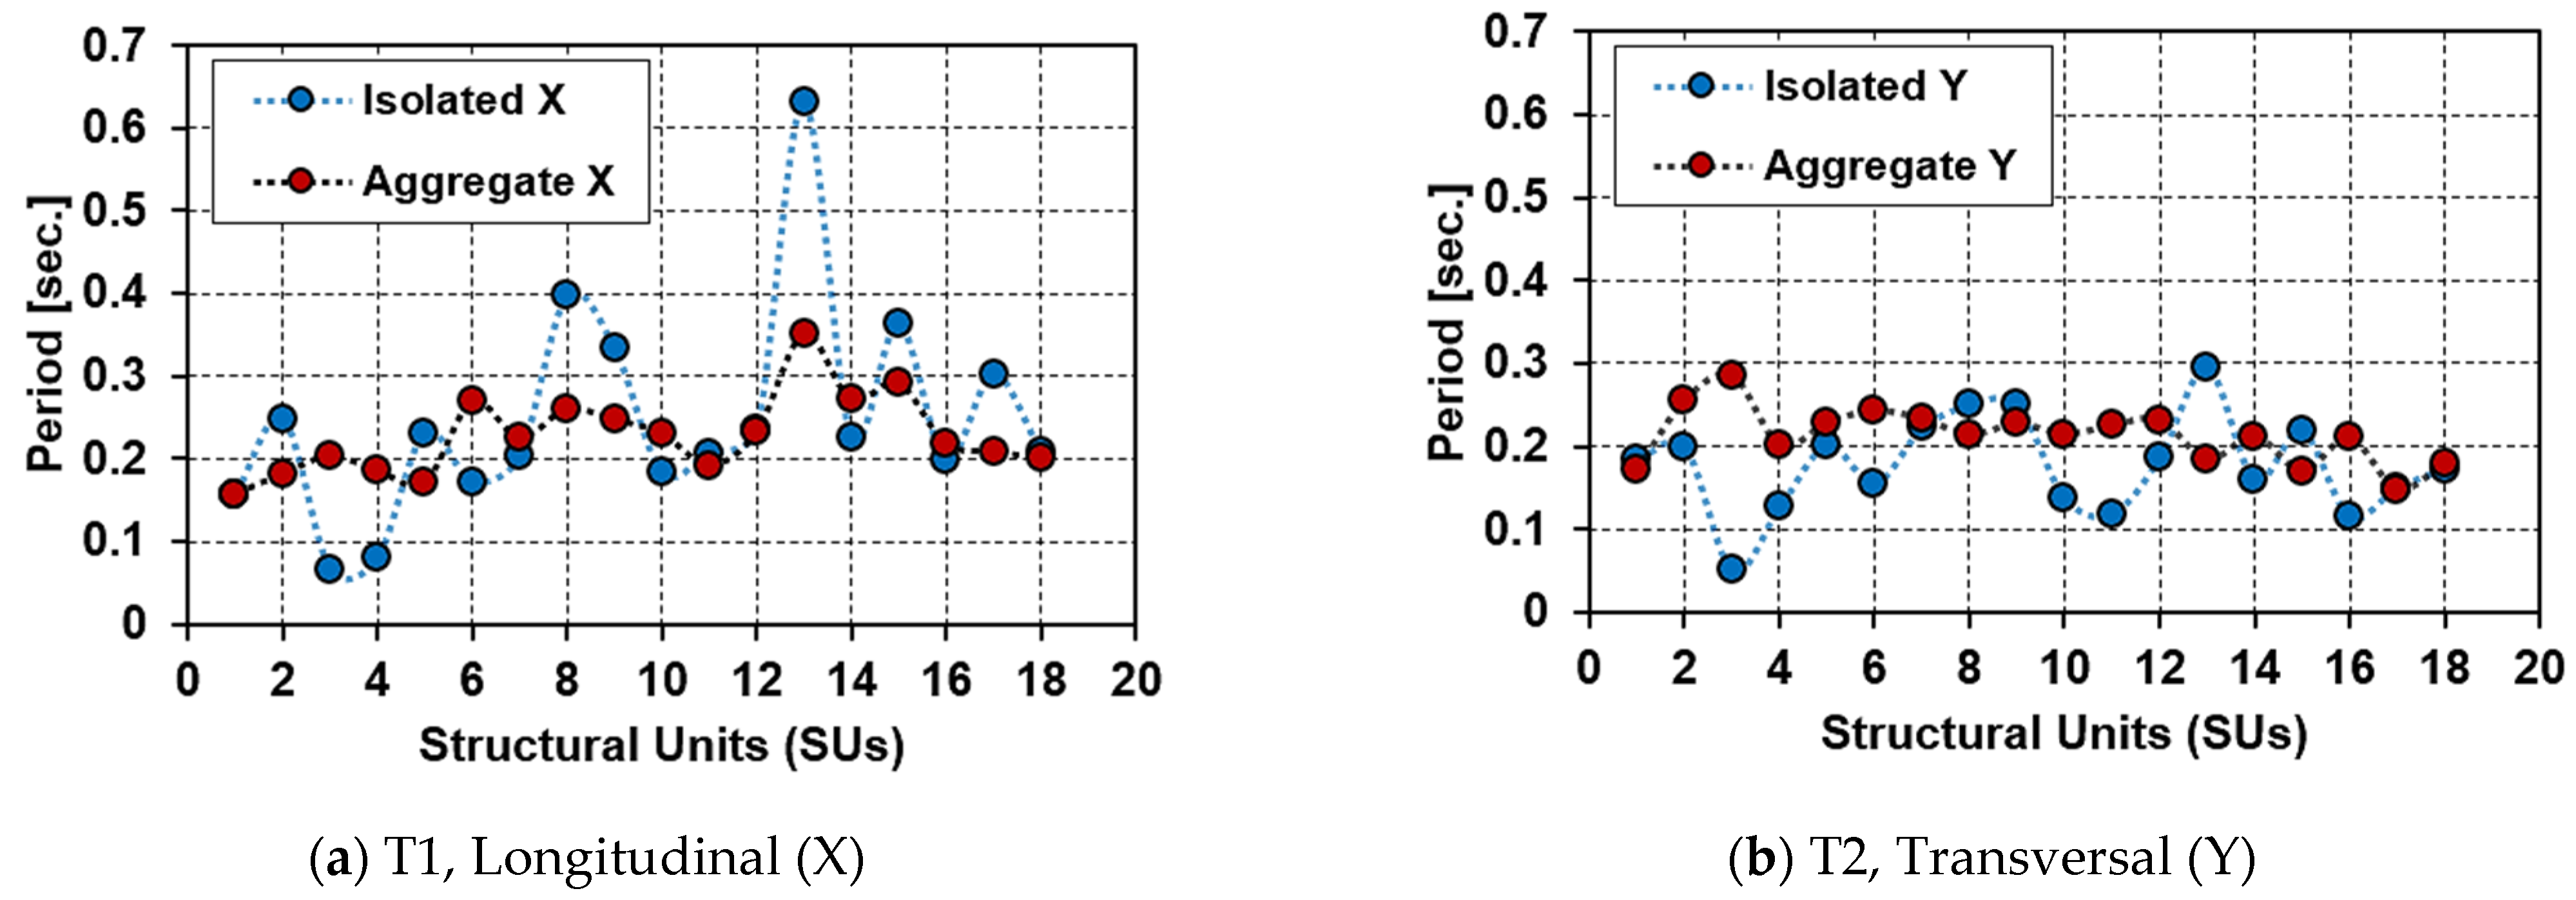
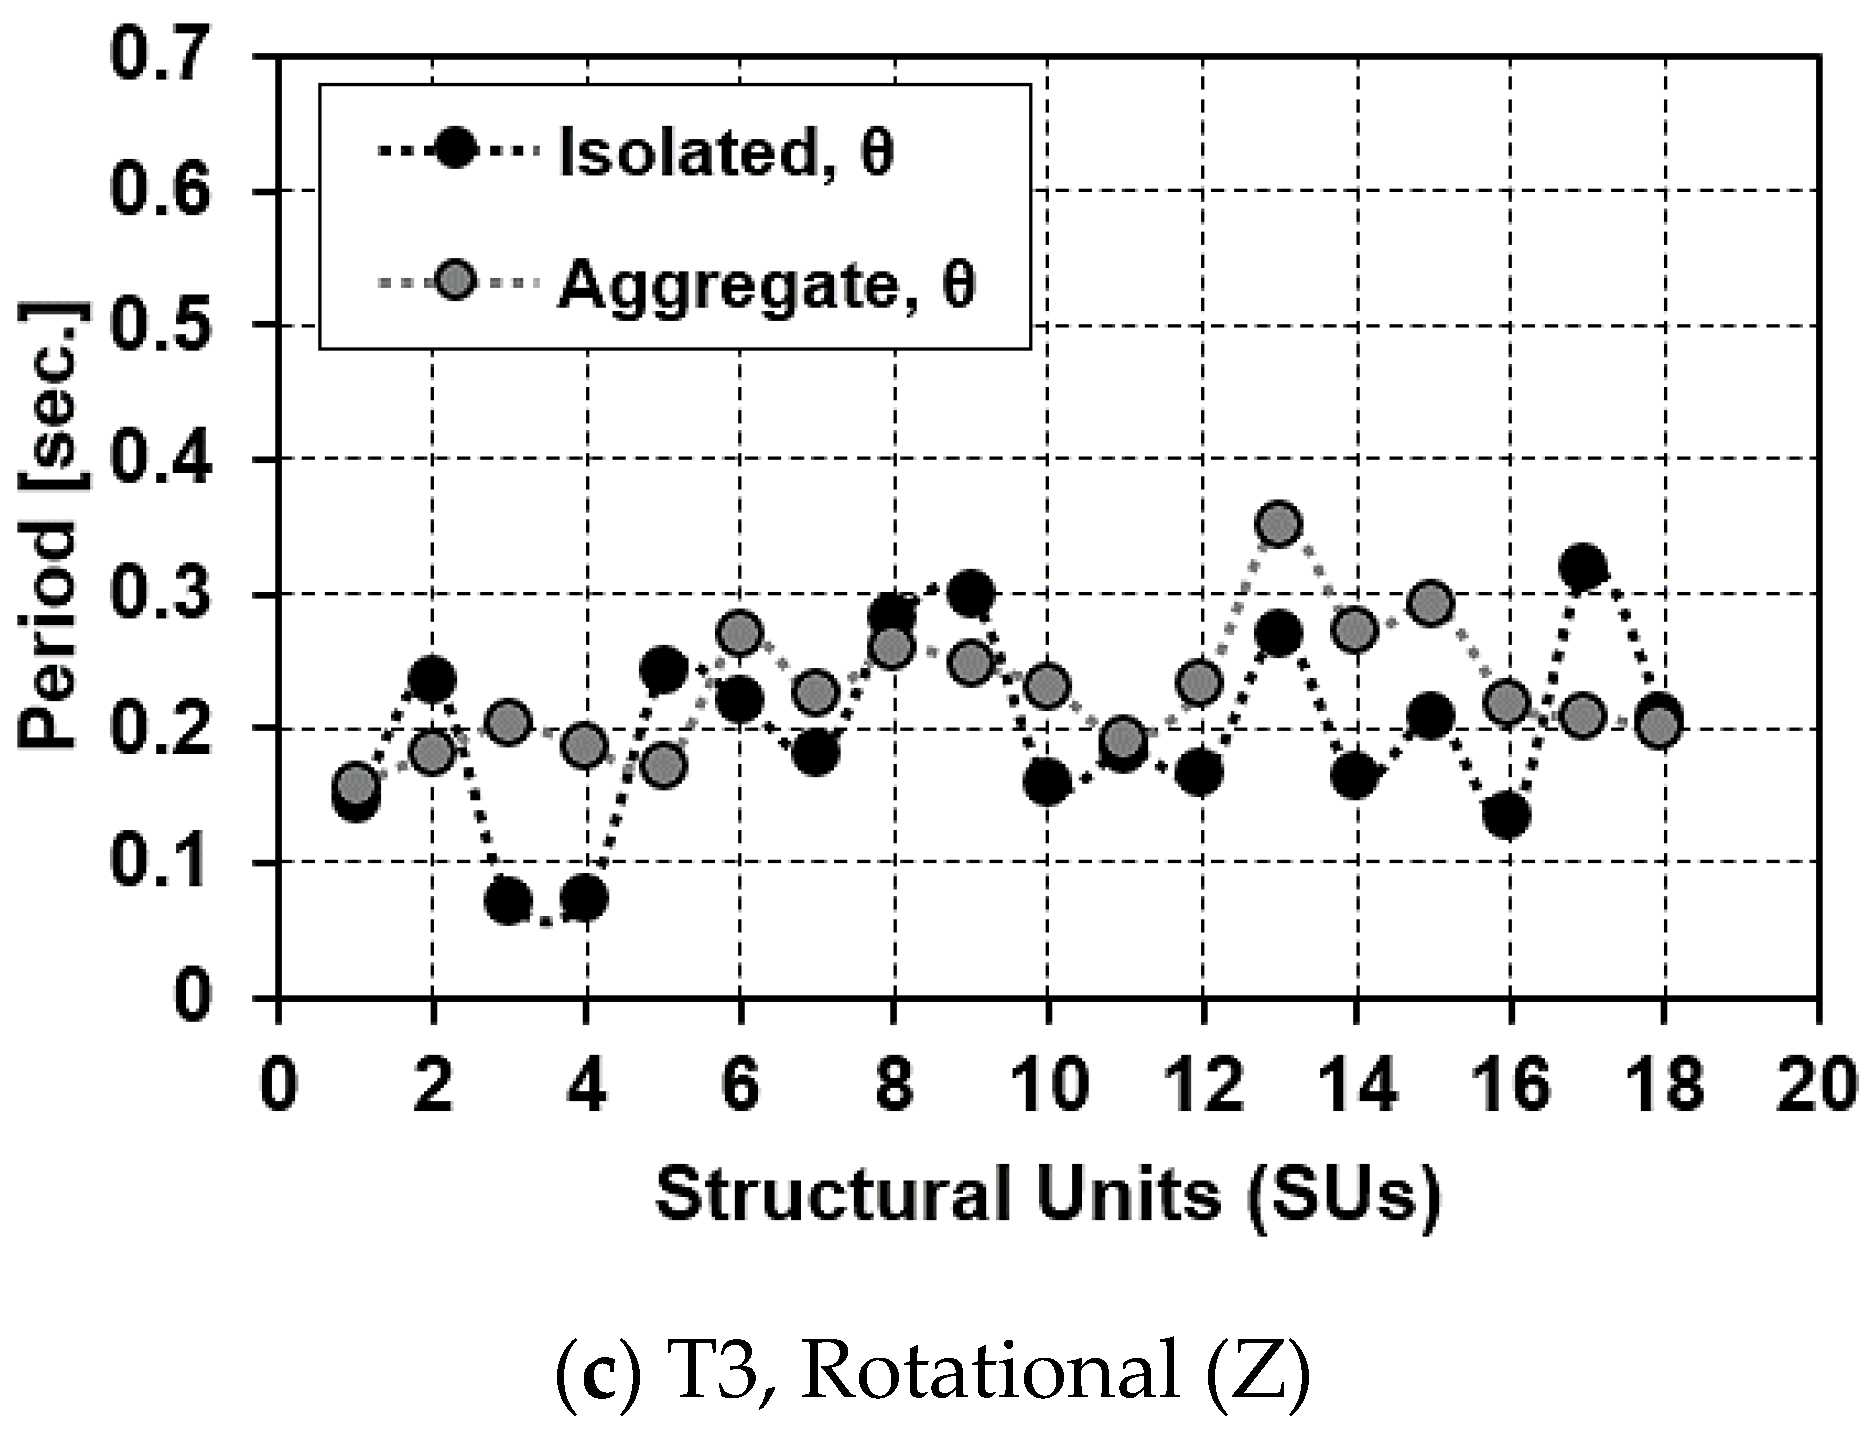
4.1. Modal Analysis

Modal analysis was performed to point out the main vibration periods of the case study SUs evaluated in both configurations, namely clustered and isolated. The eigenvalue analysis was herein appropriately performed using the 3Muri software [32], taking into consideration the two translational vibration periods, T1 and T2, evaluated in the X- and Y-directions, respectively, and the in-plane rotational period, T3, associated to the vertical direction (Z). The modal analysis results are summarized in Figure 15.
From the comparison presented, it was noticed that in X-direction, the vibration periods provided by the isolated configurations are higher compared to those of the aggregate ones. More specifically, the intermediate SUs (n. 2, 8, 9, 13, 15, 17) placed in isolated positions reached vibration periods higher than those in aggregate configurations.
As it is seen in Figure 15a, SU 13 had a vibration period of T = 0.63 s, with a percentage increase of more than twice compared to the period of the aggregate SU. In general, as stated in Section 3.2, the in-elevation regularity and the presence of adjacent units, that reduce the modal displacements, play an important role in the evaluation of the vibration period. On the other hand, in Y-direction, the results obtained by analyzing the two structural configurations are comparable. As it is shown in Figure 15b, the SU 3 in isolated condition had a vibration period about three times lower than that of the same SU in aggregate configuration. This occurs since, in the aggregate configuration, the modal analysis takes into account the influence of the additional mass induced by the units adjacent to the reference one. Finally, in Figure 15c, the torsion mode was analyzed. Moreover, in this case, globally, the results obtained are comparable, except for both SUs 3 and 4, which show a reduction of the vibration period of 35% and 38%, respectively, in comparison to the values achieved for the same structural cells in clustered configurations.

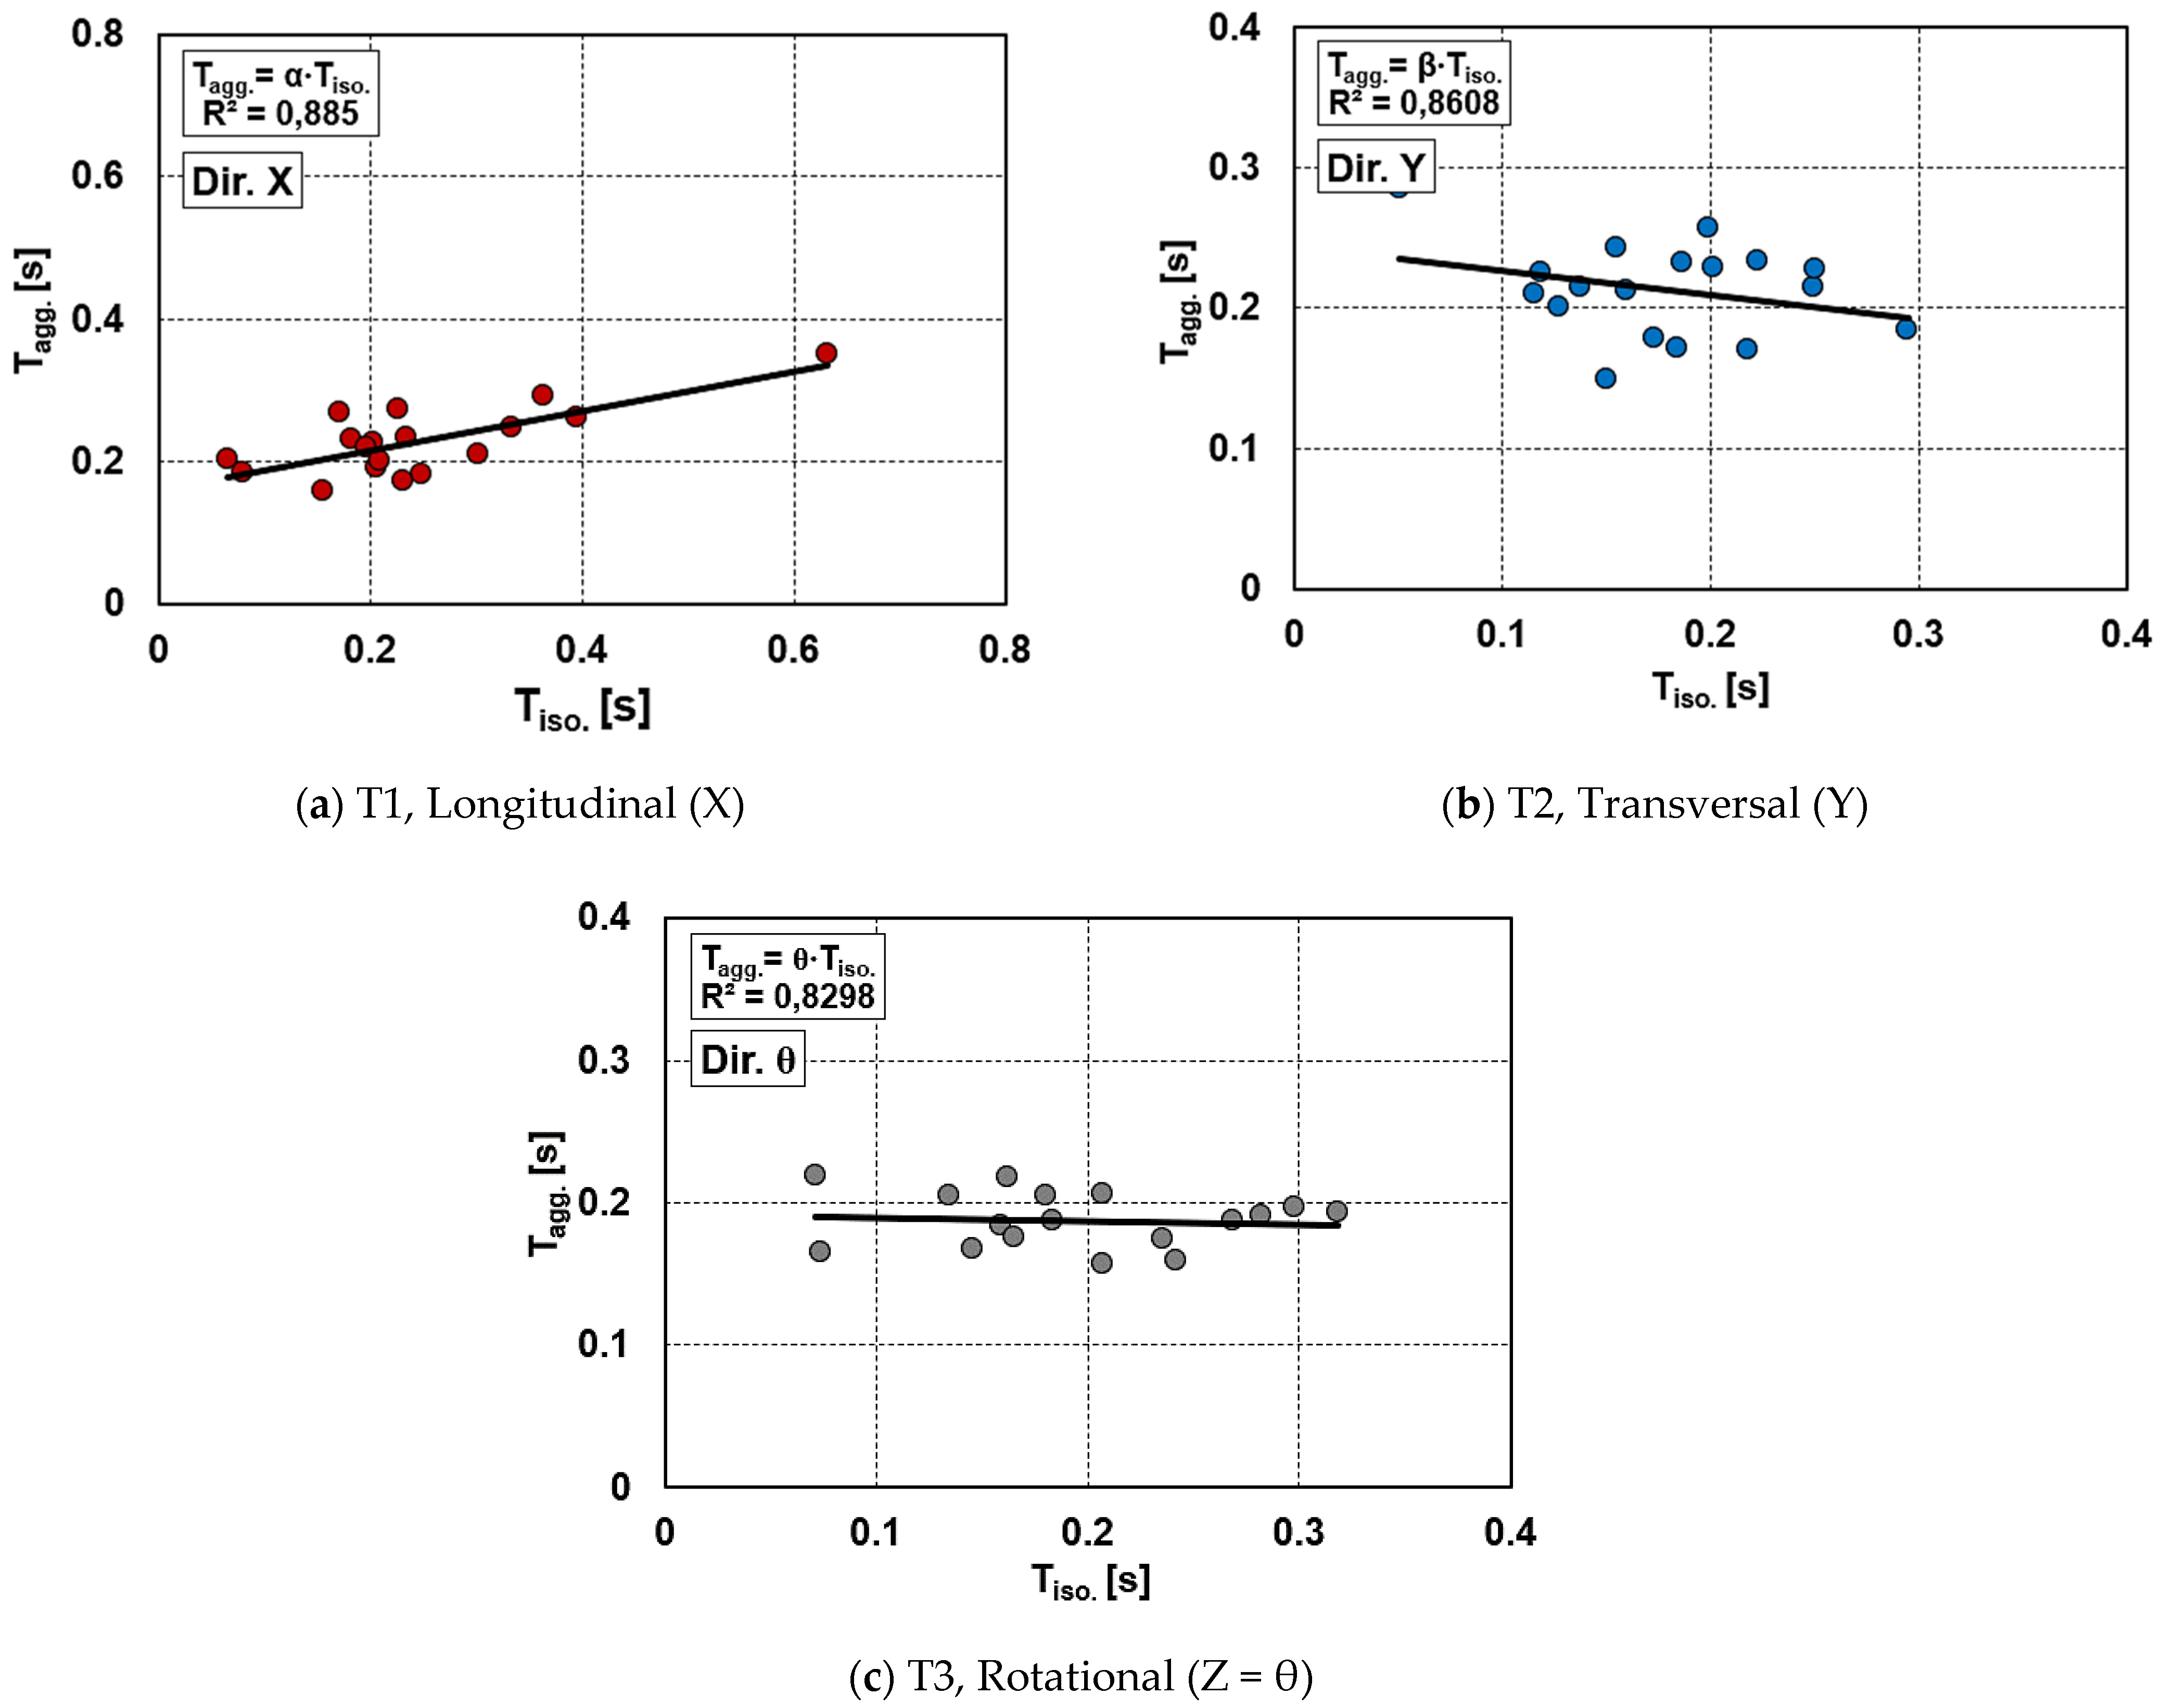
4.2. Linear Regression Formula

In a subsequent analysis phase, through a regression analysis, a mathematical law expressing the vibration periods of the aggregate SUs starting from those of the isolated ones was derived. This simplified methodology, even if it cannot replace a more accurate dynamic identification test, can be useful to predict the vibration periods of SUs of historical centers having morphological and structural features similar to those of buildings herein investigated. The achieved results are summarized in Figure 16.
The regression formulations analyzed show how the determination coefficient (R2) is robust since it assumed values greater than 0.5 in all the cases examined. This coefficient implicitly takes into account all variables associated with the increment of both mass, stiffness and, the in-elevation interaction among structural units examined.
The achieved mathematical formulations are reported in the following Equations (7)–(9):
T agg . = α T iso .
T agg . = β T iso .
T agg . = θ T iso .
where α, β, and θ are the empirical coefficients, estimated equal to 0.7905, 1.0732, 0.8867, respectively.

4.3. Derivation of Forecasting Empirical Formula

Generally, the main technical regulations [27,33,37] allow identifying the fundamental vibration periods of buildings using empirical formulations base on two factors, namely a coefficient, Ci, that takes into account the type of construction, and the height, H, of the building (not exceeding 40 m), as reported in Equation (10):
T = C H 3 / 4
This formulation is based on the Rayleigh method [38], which was originally calibrated on a class of American RC buildings that have different technological characteristics from those of the Italian heritage. However, this methodology was largely used for the prediction of the predominant vibration periods of buildings when more detailed structural analyses were not carried out. Furthermore, in the case of existing buildings, this approach would seem to overestimate the vibration period, since the slight variation of the functional parameter, Ci, dependent on the structural technology, is not able to cover all the different seismic responses of the real building stocks.
However, the proposed formulation is qualitatively ineffective for predicting the vibration period structural units placed in aggregate configurations. For this reason, a modification of Equation (8), based on the position of the structural units in the building compound, is herein provided. In particular, it was used a correlative coefficient, Ci, evaluated as the ratio between the percentage of the mass of the single-cell and the total mass of the whole aggregate. The proposed formulation is reported in the following Equation (11):
T = C i H 3 / 4 = M i M Tot H 3 / 4
The utility of the present formulation is the simplicity of application for the prediction of the vibration period of clustered units. This mathematical correlation is not dissimilar from the one proposed in [27,33,37,39], but it has the advantage of being functional and more easily usable for estimating the predominant vibration period of aggregate SUs. The proposed formula provided the results shown in Figure 17.
First of all, in Figure 17a, the above-mentioned formulation is compared to the respective vibration periods obtained by numerical simulation in the two analysis directions. From the obtained results, it is clear that the proposed calibration is comparable with the periods deriving from the mechanical analysis. However, the variation of results (with a maximum average increase of 8% for the Y-direction and an average decrease of 1% for the X-direction) concerning those obtained from the mechanical analysis is essentially due to the position of the SUs. Furthermore, in Figure 17b, the variation of the correlation coefficient Ci, as a function of the vibration period of each SUs, is shown.
As it is noticed, the coefficient Ci presents a variability directly proportional to the mass variation of the single SUs compared to the total mass of the entire aggregate. In this circumstance, SUs with a higher mass rate have a Ci proportional to the excited mass in terms of expected frequencies.
Finally, the proposed method was suitably compared with similar formulations [27,33,37,39], which are based on the above-mentioned Equation (8). In particular, Calvi et al. [39] assume a coefficient Ci = 0.040, since the masonry structures have a considerable rigidity before cracking, while EC8 [33] and NTC08 [40] adopt Ci = 0.05 for masonry building and the USB American Code [37] sets Ci = 0.0488. The results of the above-mentioned comparison are plotted in Figure 18.
In Figure 18a, it can be seen that the period estimated by Equation (9) is comparable with that proposed by Calvi et al. [39] and the design codes examined [33,37,40], since the correlative coefficients, Ci, are not dissimilar. However, when the mass of the single SUs increases (see from SU 12 to SU 16), the correlations proposed in the literature tend to underestimate the vibration period since they do not take into account the mass variation of the aggregate structural cell. Similarly, in Figure 18b, the vibration period, Ti, is related to the height of the SUs examined.
For heights between 4.0 m and 7.5 m, the formulations proposed by [27,33,37,39,40] underestimate the expected vibration period, while for heights ranging from 8.0 m to 12.0 m, the proposed formulations are comparable to each other. However, it seems that the literature methods are reliable in predicting the vibration periods. In fact, for building heights of up to 8.0 m, the literature methods result in a safe condition, providing seismic forces to be adopted in the case of linear analyses (static and dynamic) greater than those expected. Moreover, for building heights greater than 8 m, the methods provide vibration periods comparable to the numerical ones.

5. Conclusions

This research article focused on the seismic vulnerability assessment of a historical center’s structural units using both empirical and mechanical approaches, providing a mathematical formulation for predicting their predominant vibration period. The case study aggregate, placed in the historic center of Mirandola in the Emilia-Romagna region of Italy, was made of eighteen SUs appropriately identified based on their architectural–structural features, which are representative of the most common typological class of buildings found in the inspected area.
First of all, the rapid screening of the seismic vulnerability was conducted according to an index-based method widely used for structural units in historical compounds. From the analysis performed, the following results were obtained:
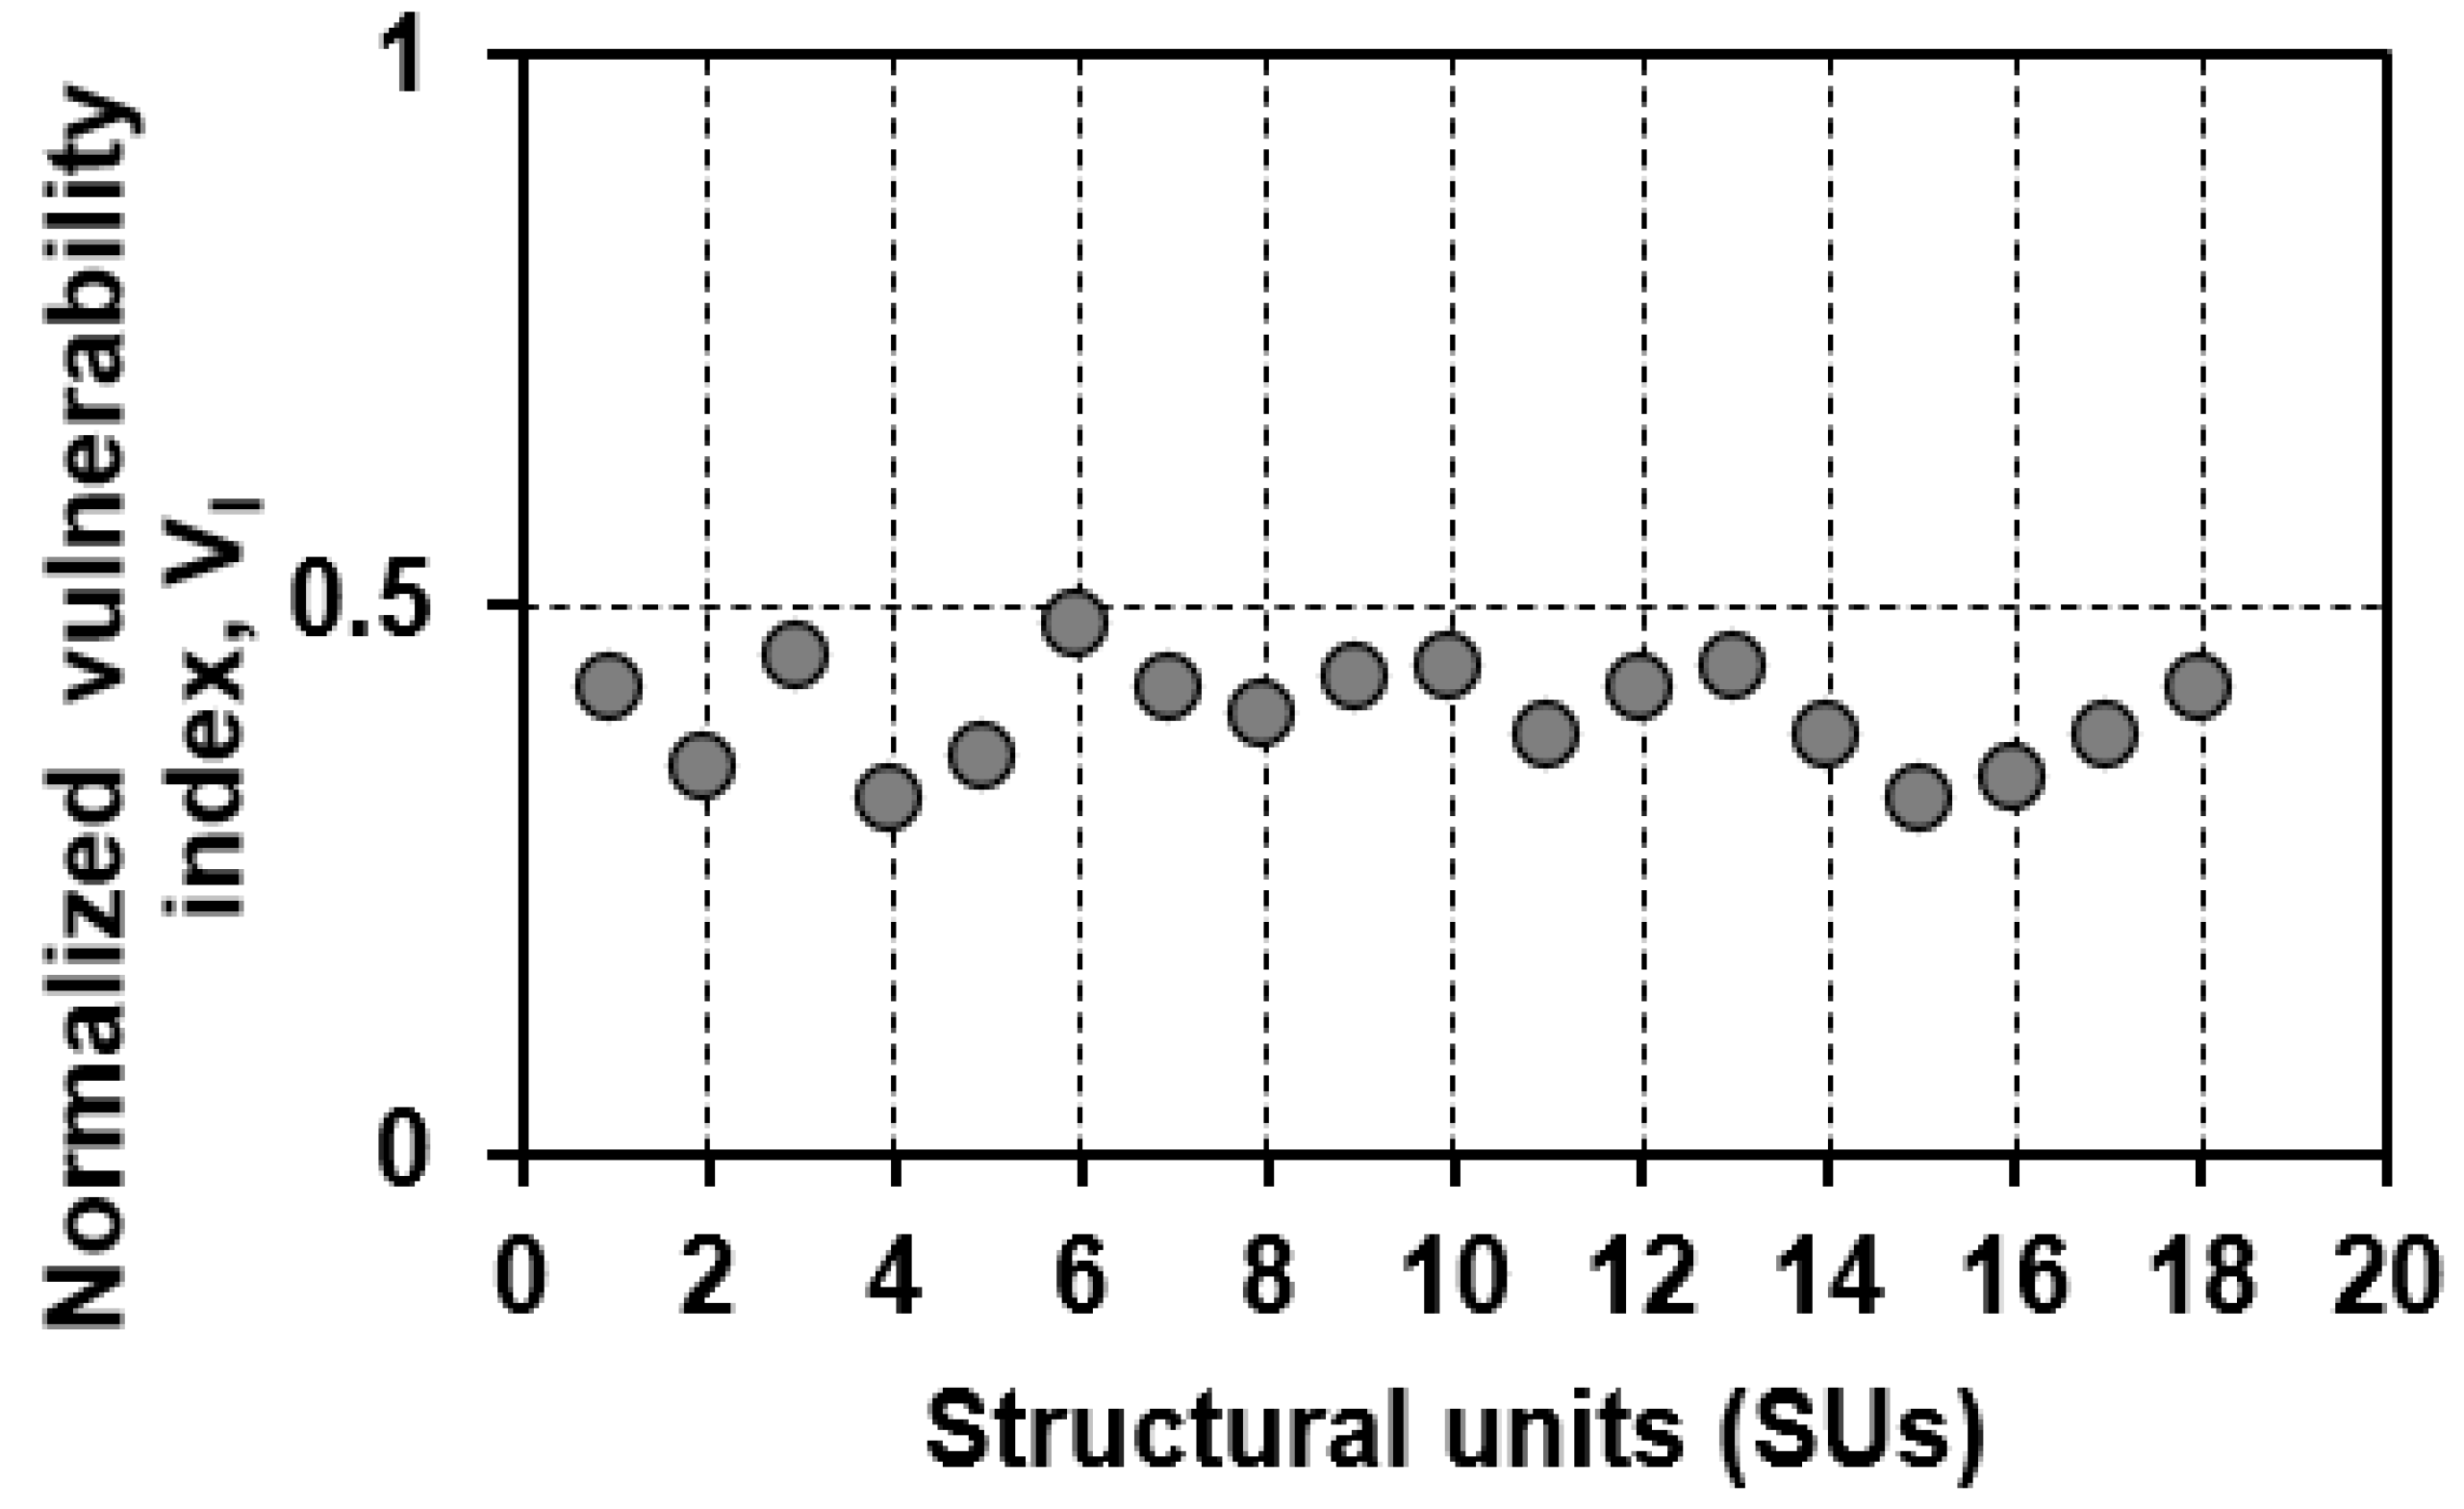
  • The estimated normalized vulnerability, VI, of SUs is lower than the mean threshold fixed to 0.5. Moreover, variability of the vulnerability indices of the estimated sample is mainly influenced by the in-elevation interaction between adjacent structural units (see parameter 11 of the survey form);
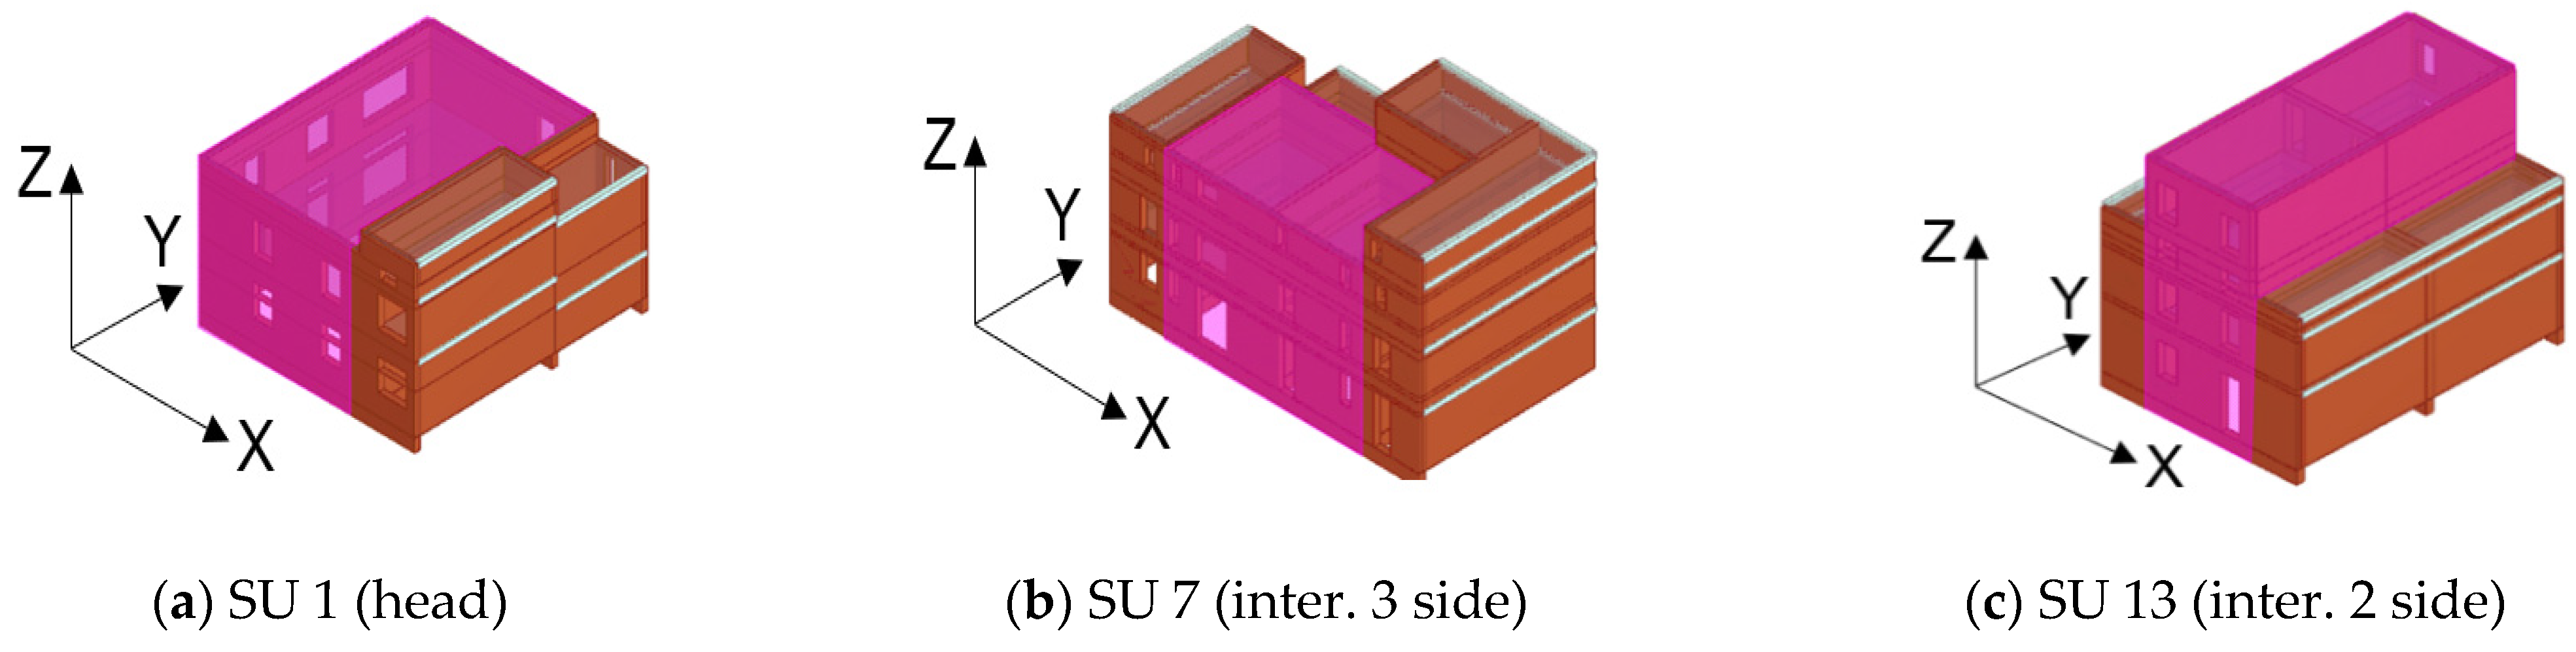
  • The presence of clustered buildings with different heights significantly influences the global vulnerability, since under seismic events such SUs are subjected to hammering effects;
  • The vulnerability range estimated varies from 0.32 < VI < 0.48 (medium vulnerability);
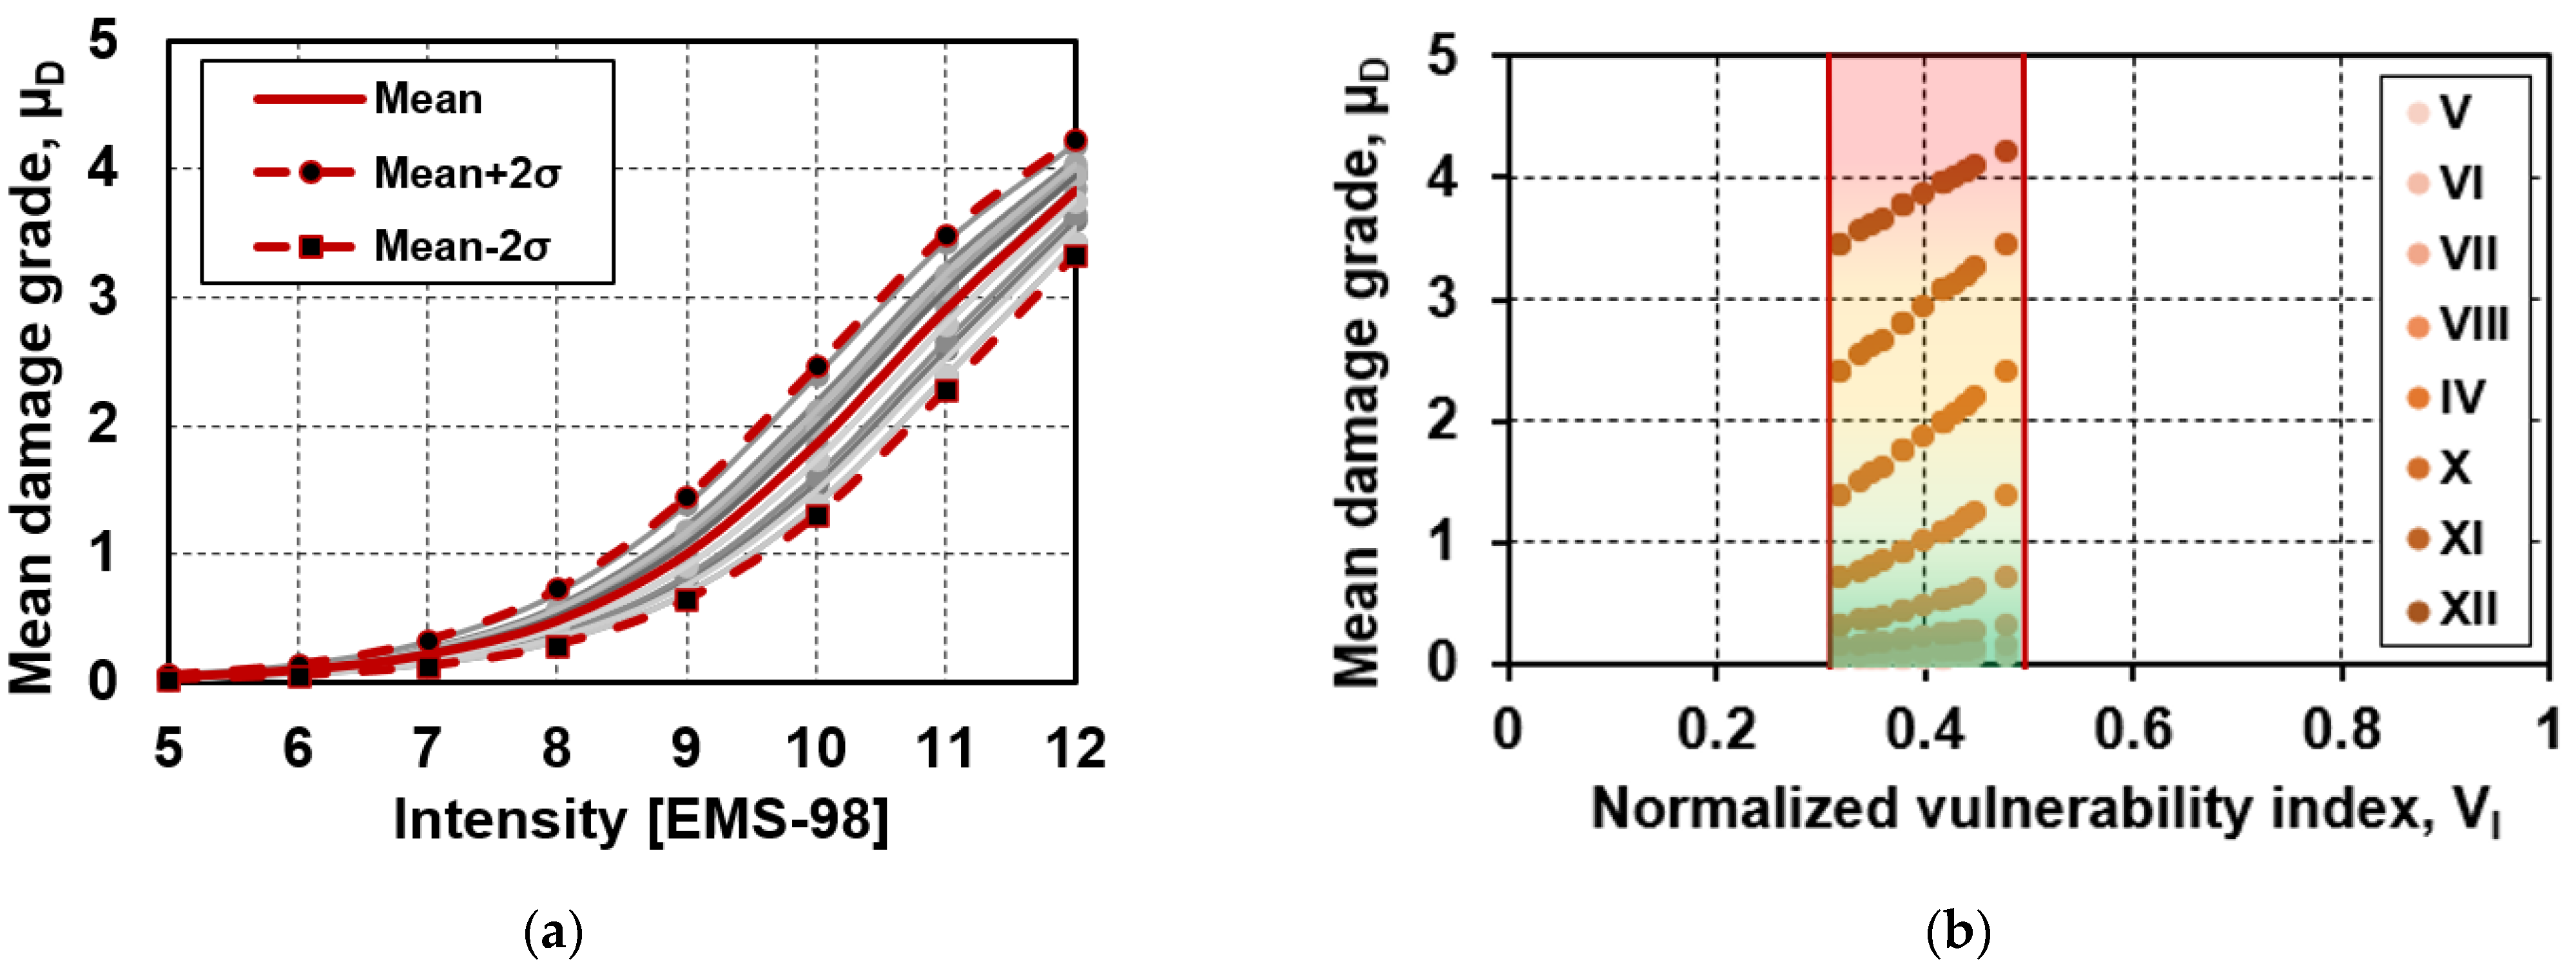
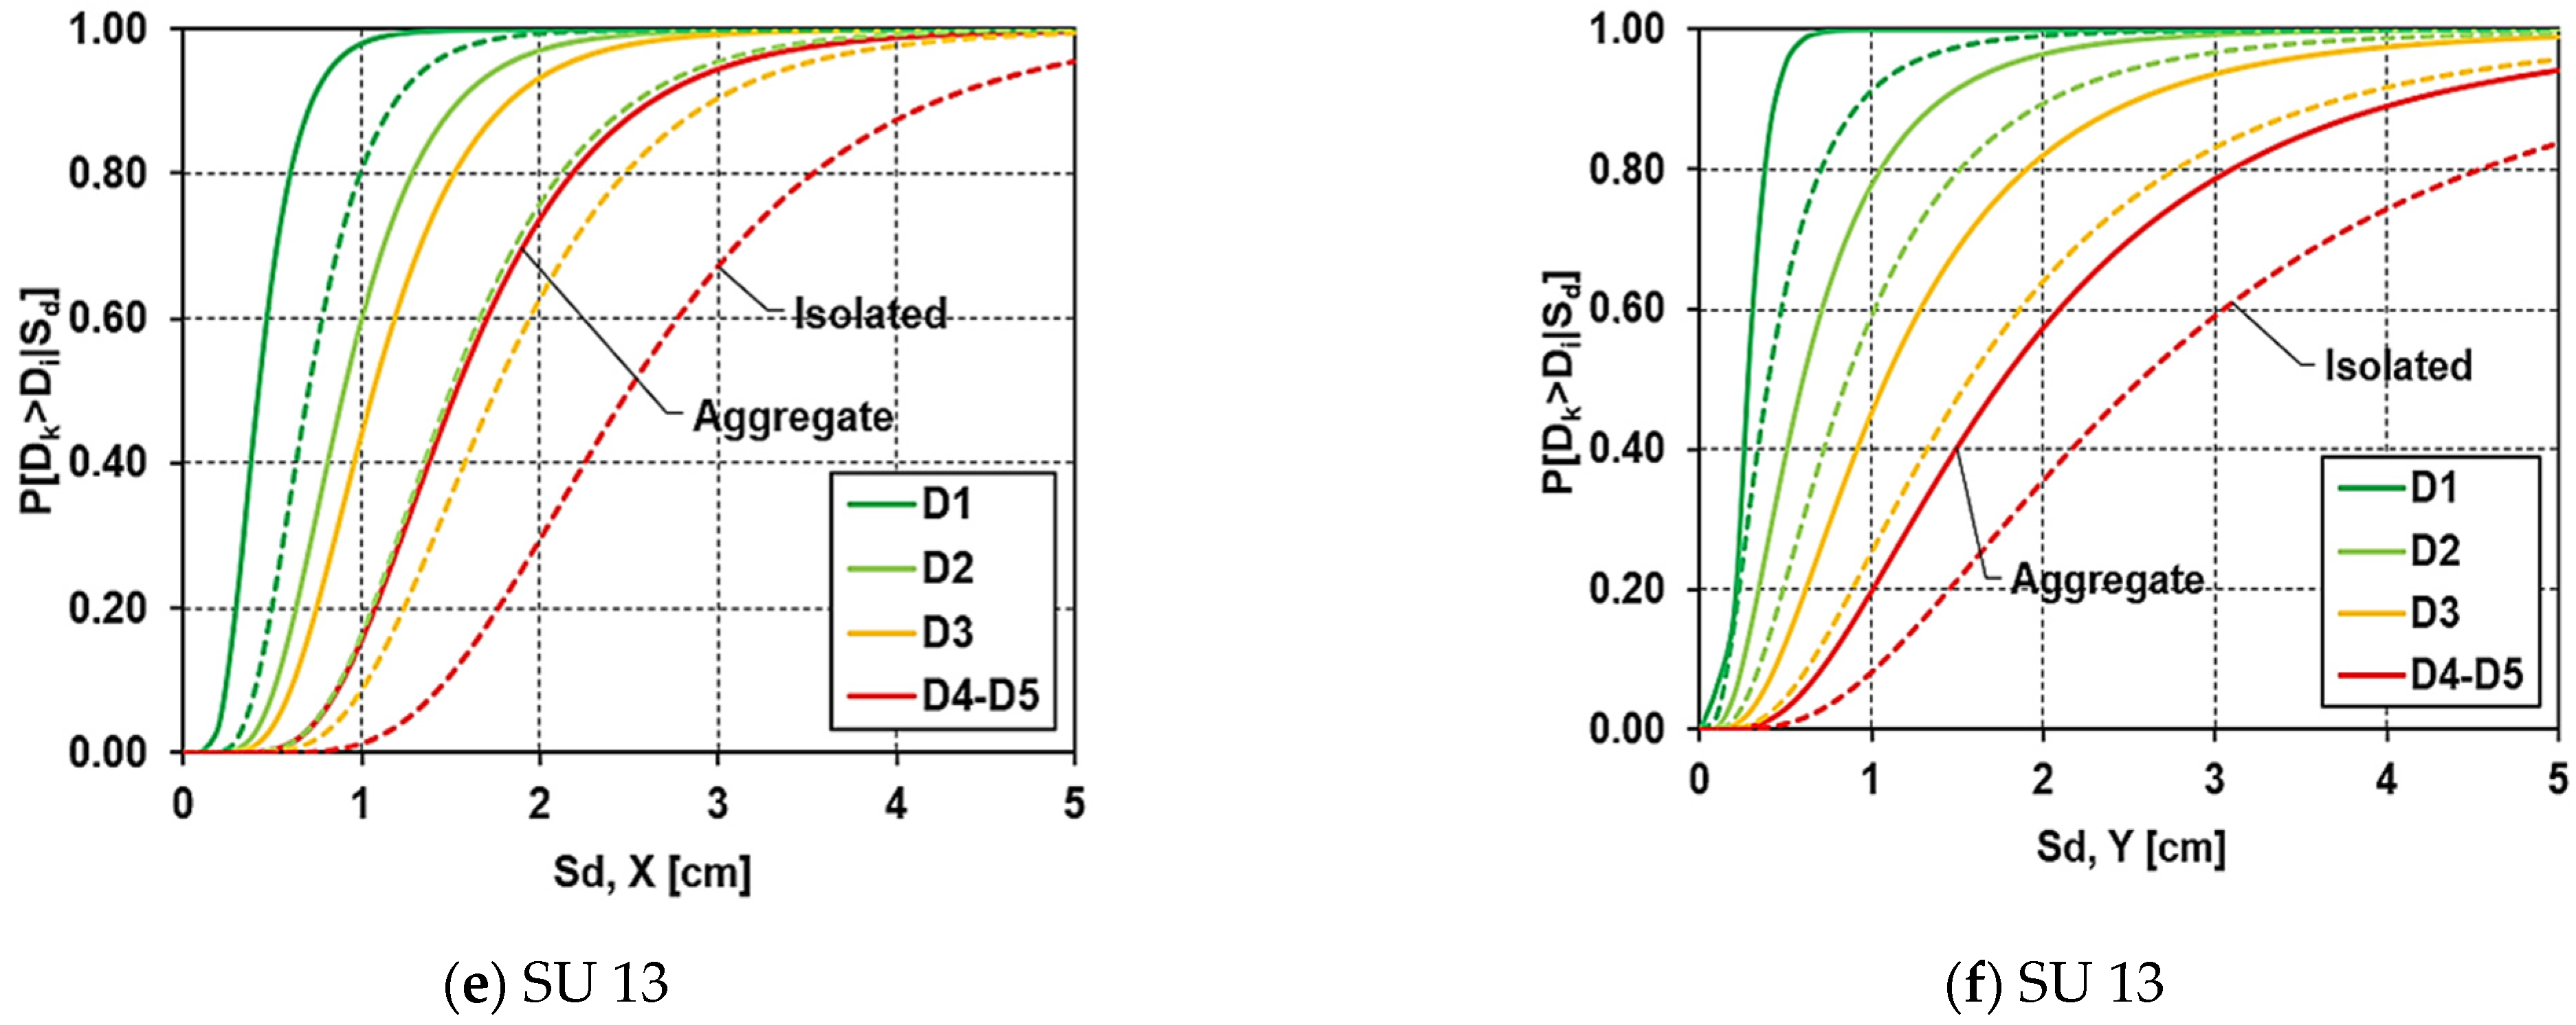
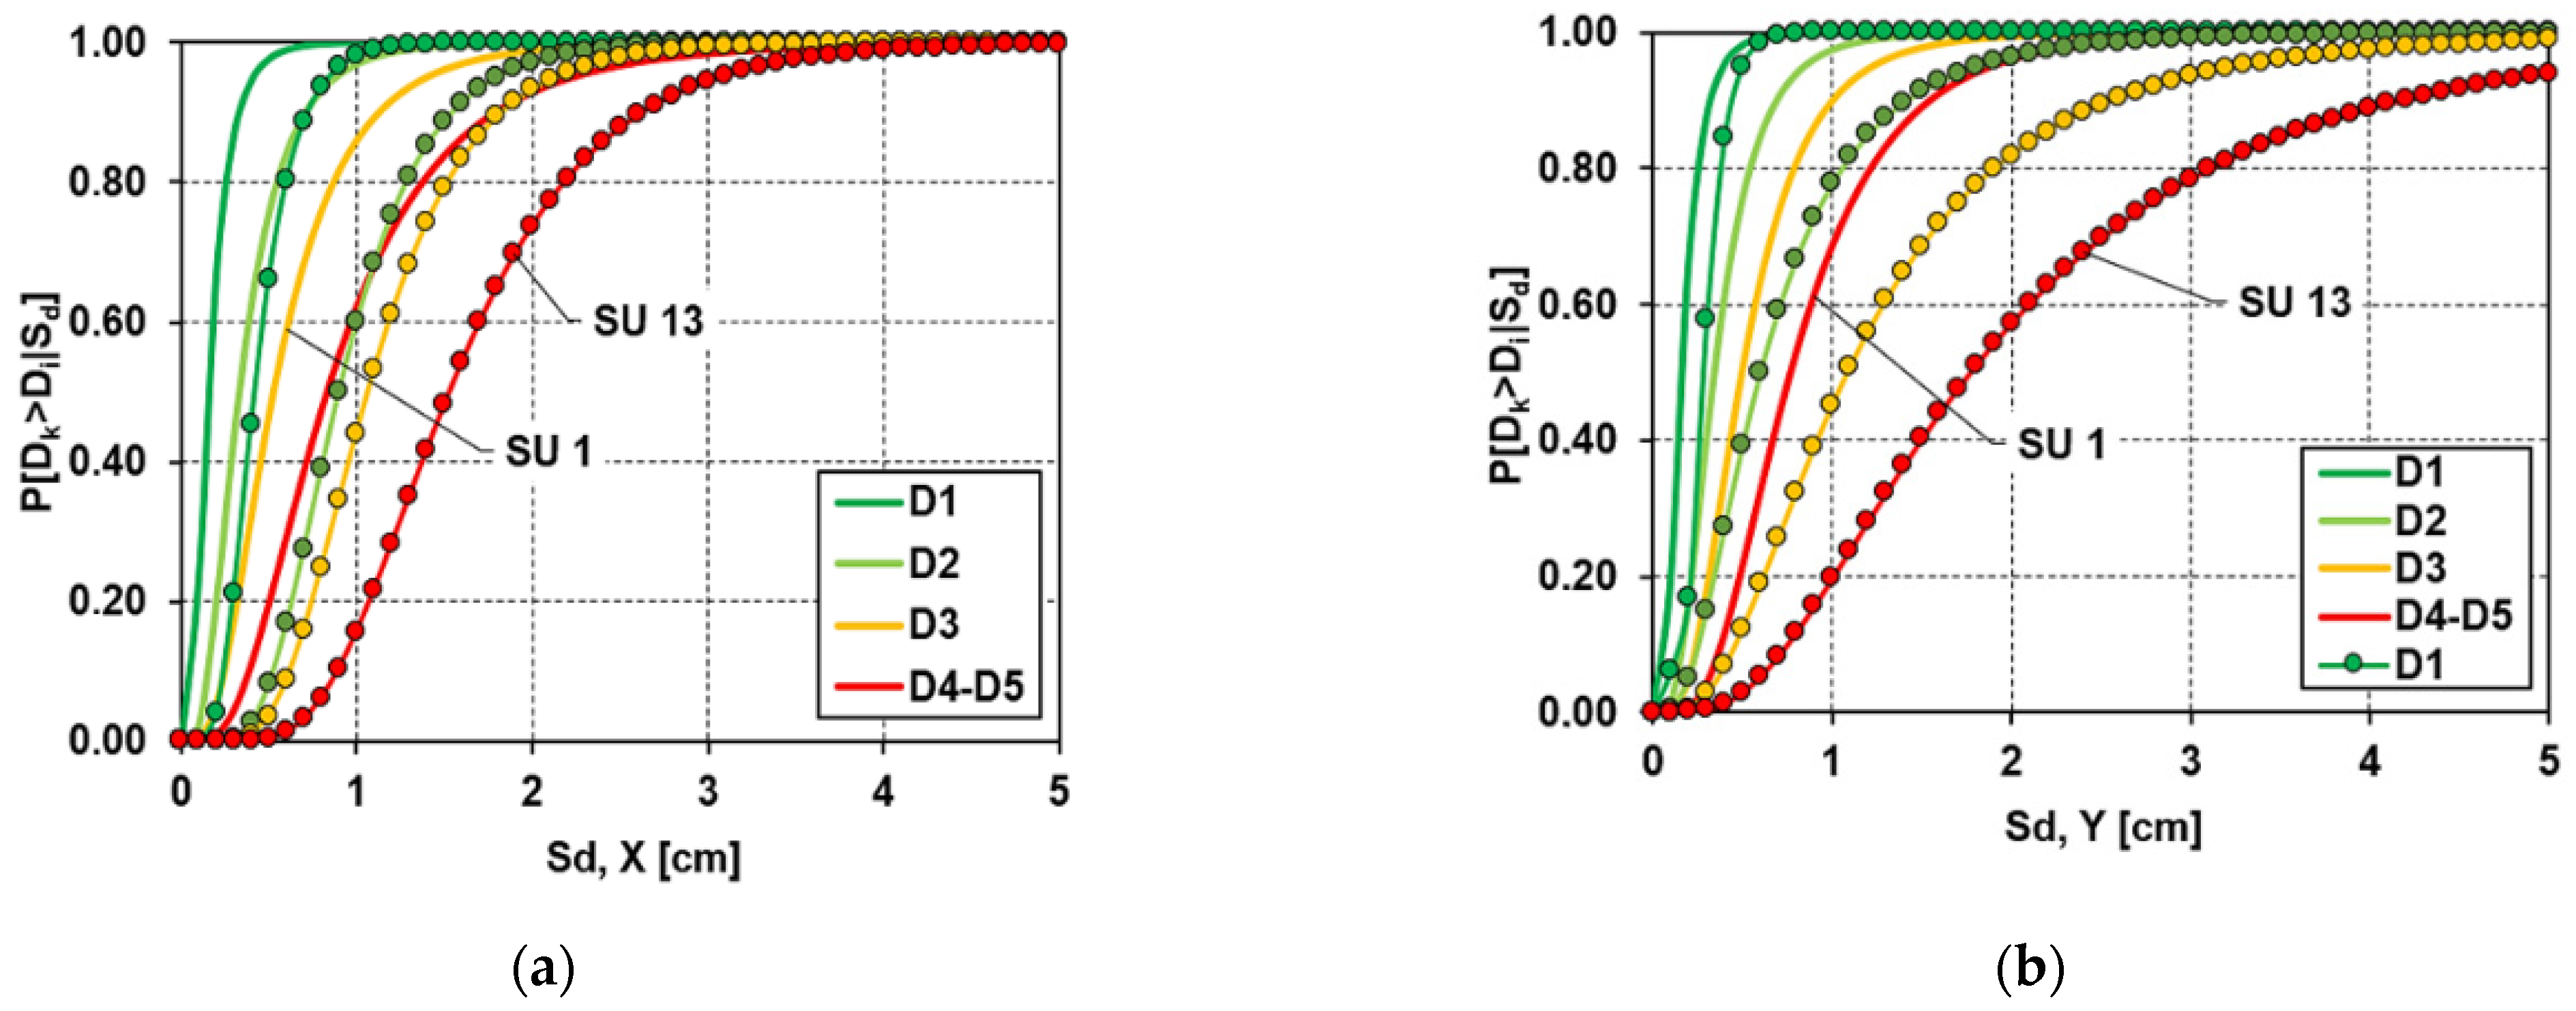
  • The typological vulnerability curves derived for the case study SUs show how as the hazard levels, expressed in terms of macroseismic intensity, increase, the expected damage augments as well until the maximum threshold, D4, is reached (partial collapse, VI = 0.48 and µD = 4.19).
Secondly, non-linear static analyses were implemented to capture the difference between SUs in aggregate configurations and the same SUs considered as isolated structures. To this purpose, the 3Muri calculation software was used by adopting the macro elements modeling approach. The main outcomes were:
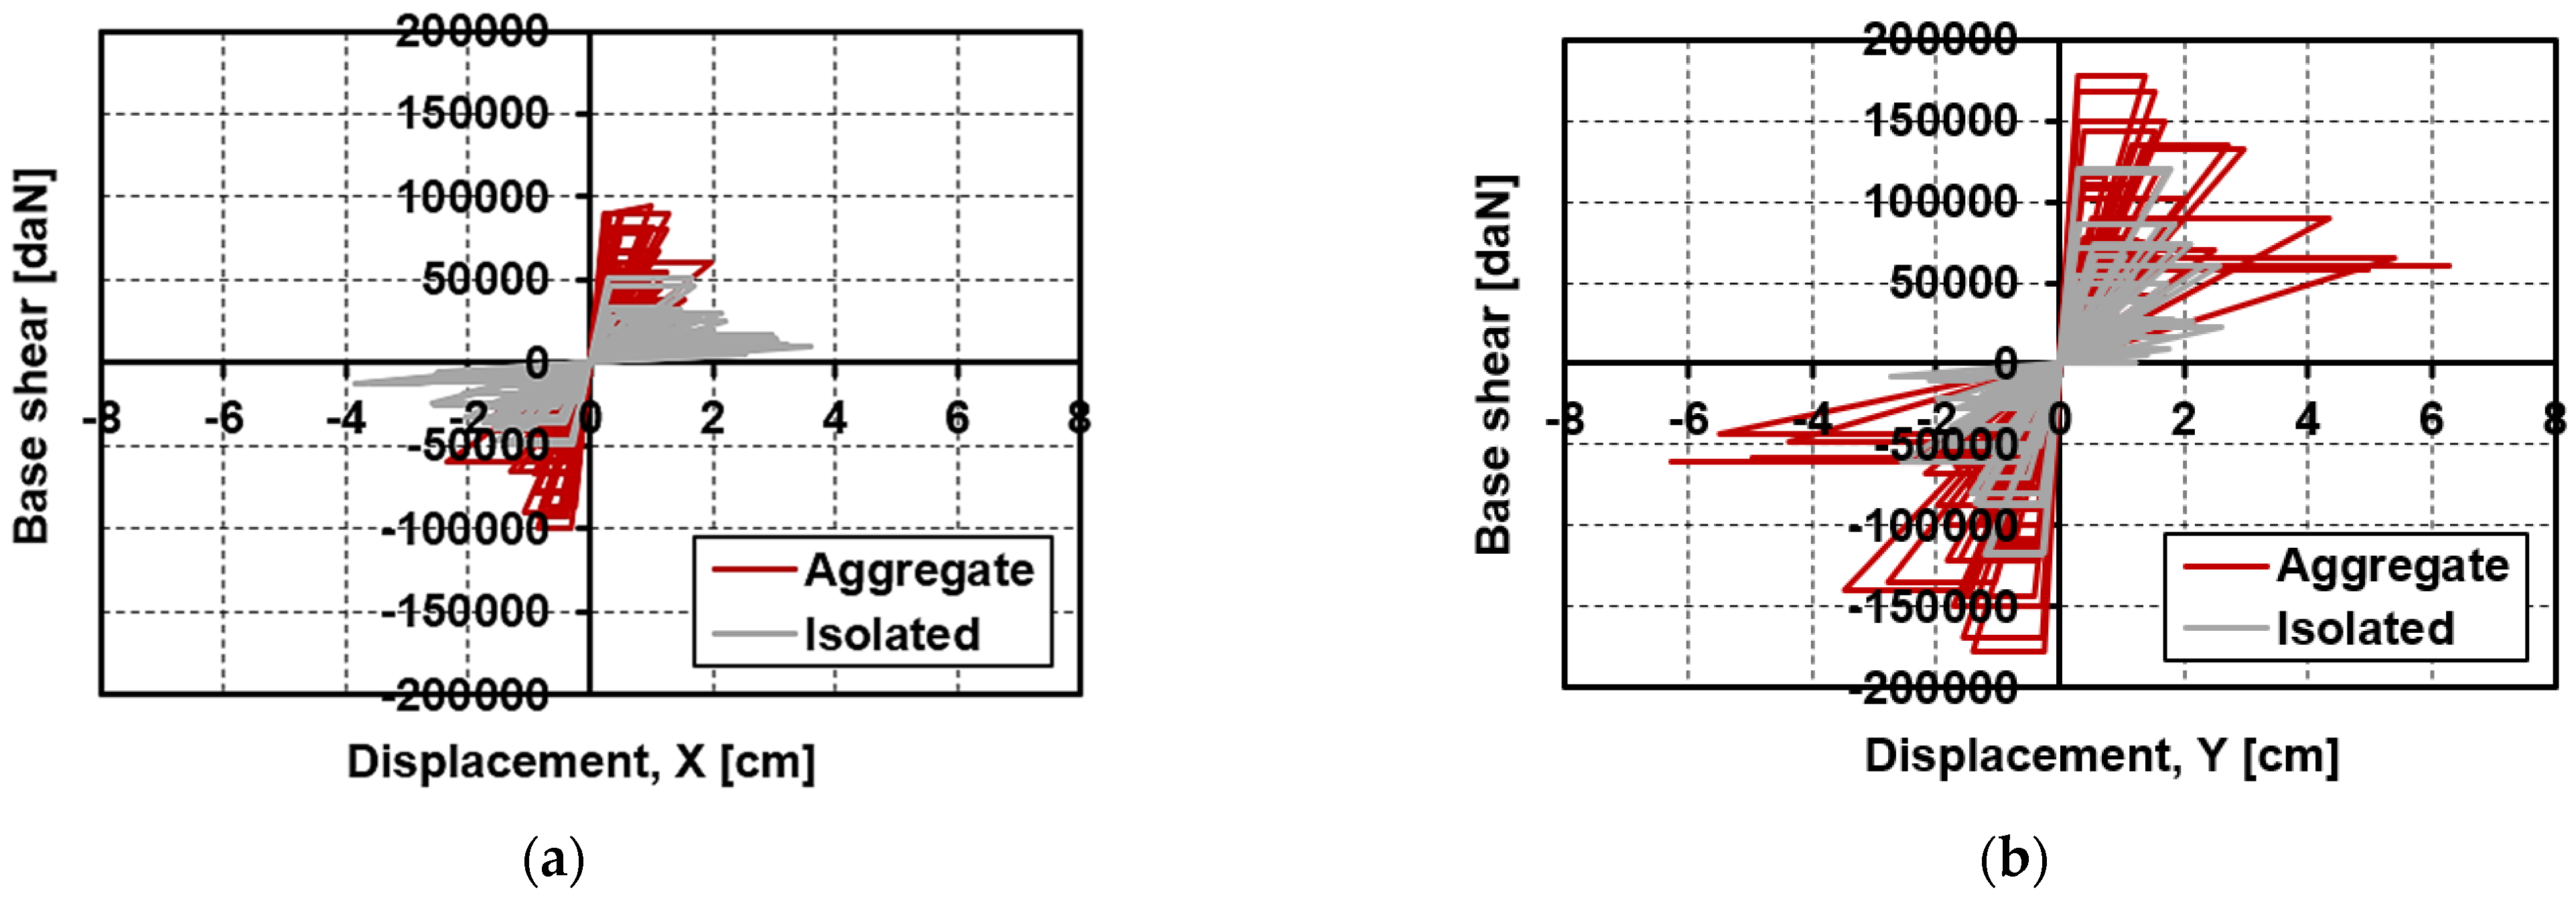
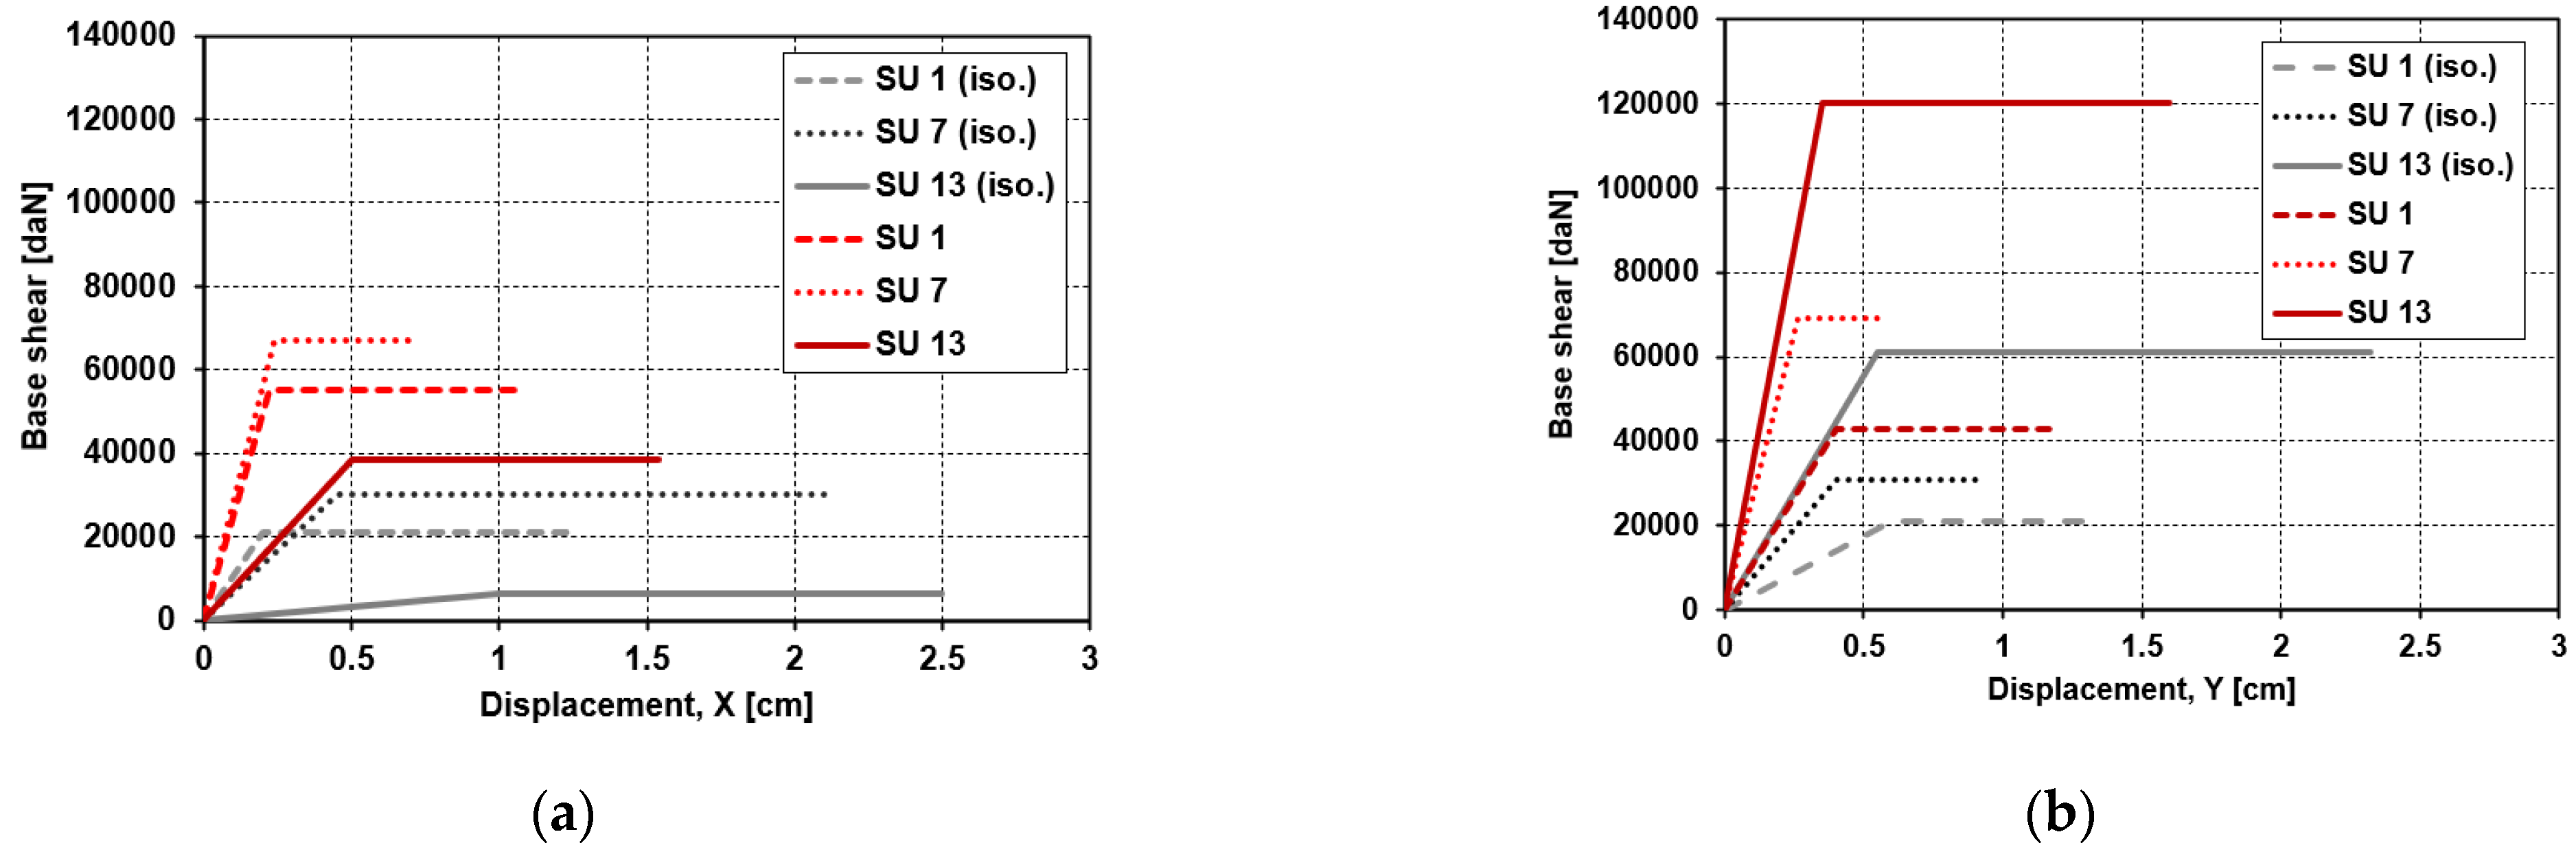
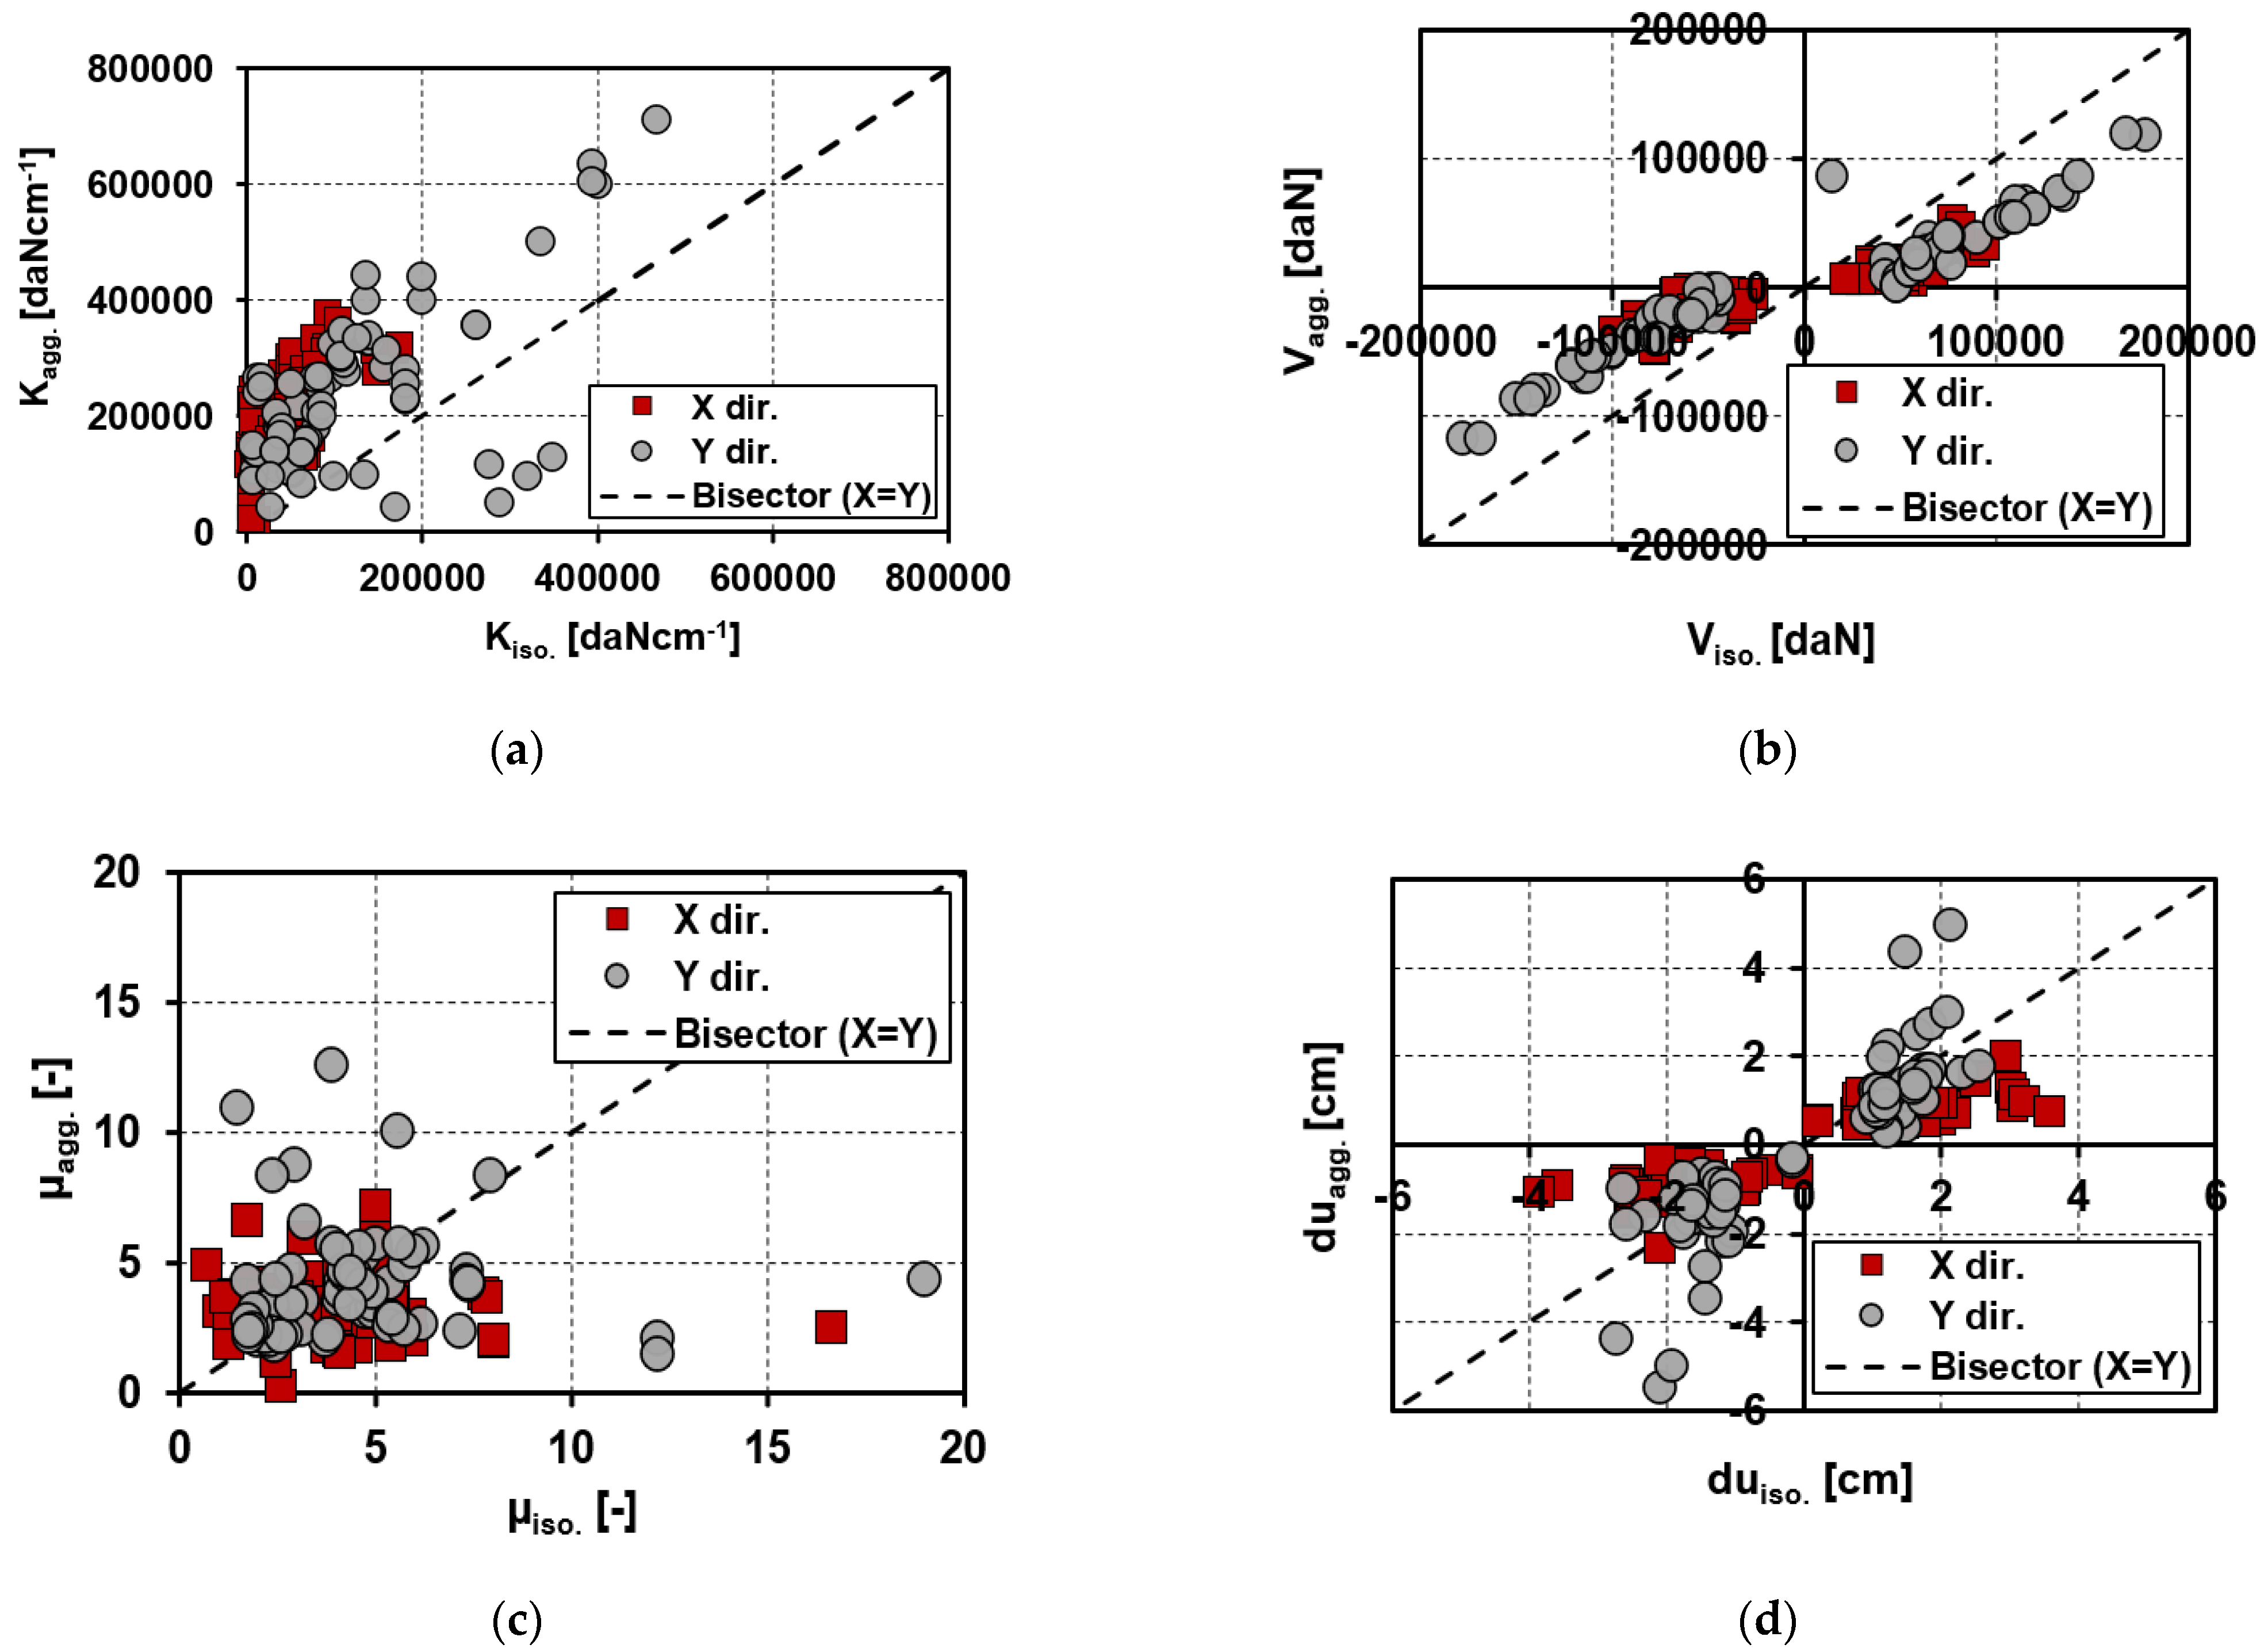
  • The structures in both configurations, namely aggregate and isolated, have a variable capacity in the two analysis directions X and Y. In particular, in the longitudinal direction (X-direction), an average strength increment of 48% was noted for the SUs placed in aggregate conditions with respect to the isolated ones;
  • In terms of displacement ductility, a decrease of 55% was obtained, since the SUs in a clustered configuration, given the confinement effect offered by the contiguous structural units, limit the expected displacements compared to the corresponding isolated cases. However, this limitation also depends on the torsion phenomena, which are more influent for the external structural cells;
  • In terms of stiffness, in X-direction, the isolated case provided a stiffness reduction of 402% compared to the aggregate one. Similarly, in the Y-direction, the aggregate case stiffness was averagely two times higher than the isolated case one;
  • In terms of maximum shear strength, it was found that in all analysis directions the strength of aggregate SUs is much higher (around three times) than the isolated SUs, since in the aggregate configuration the seismic load is distributed on a higher number of shear-resistant wall areas;
  • In terms of ductility, µ, it was observed that in both analysis directions 1 < µ<10 and µ > 10 was achieved for head SUs only;
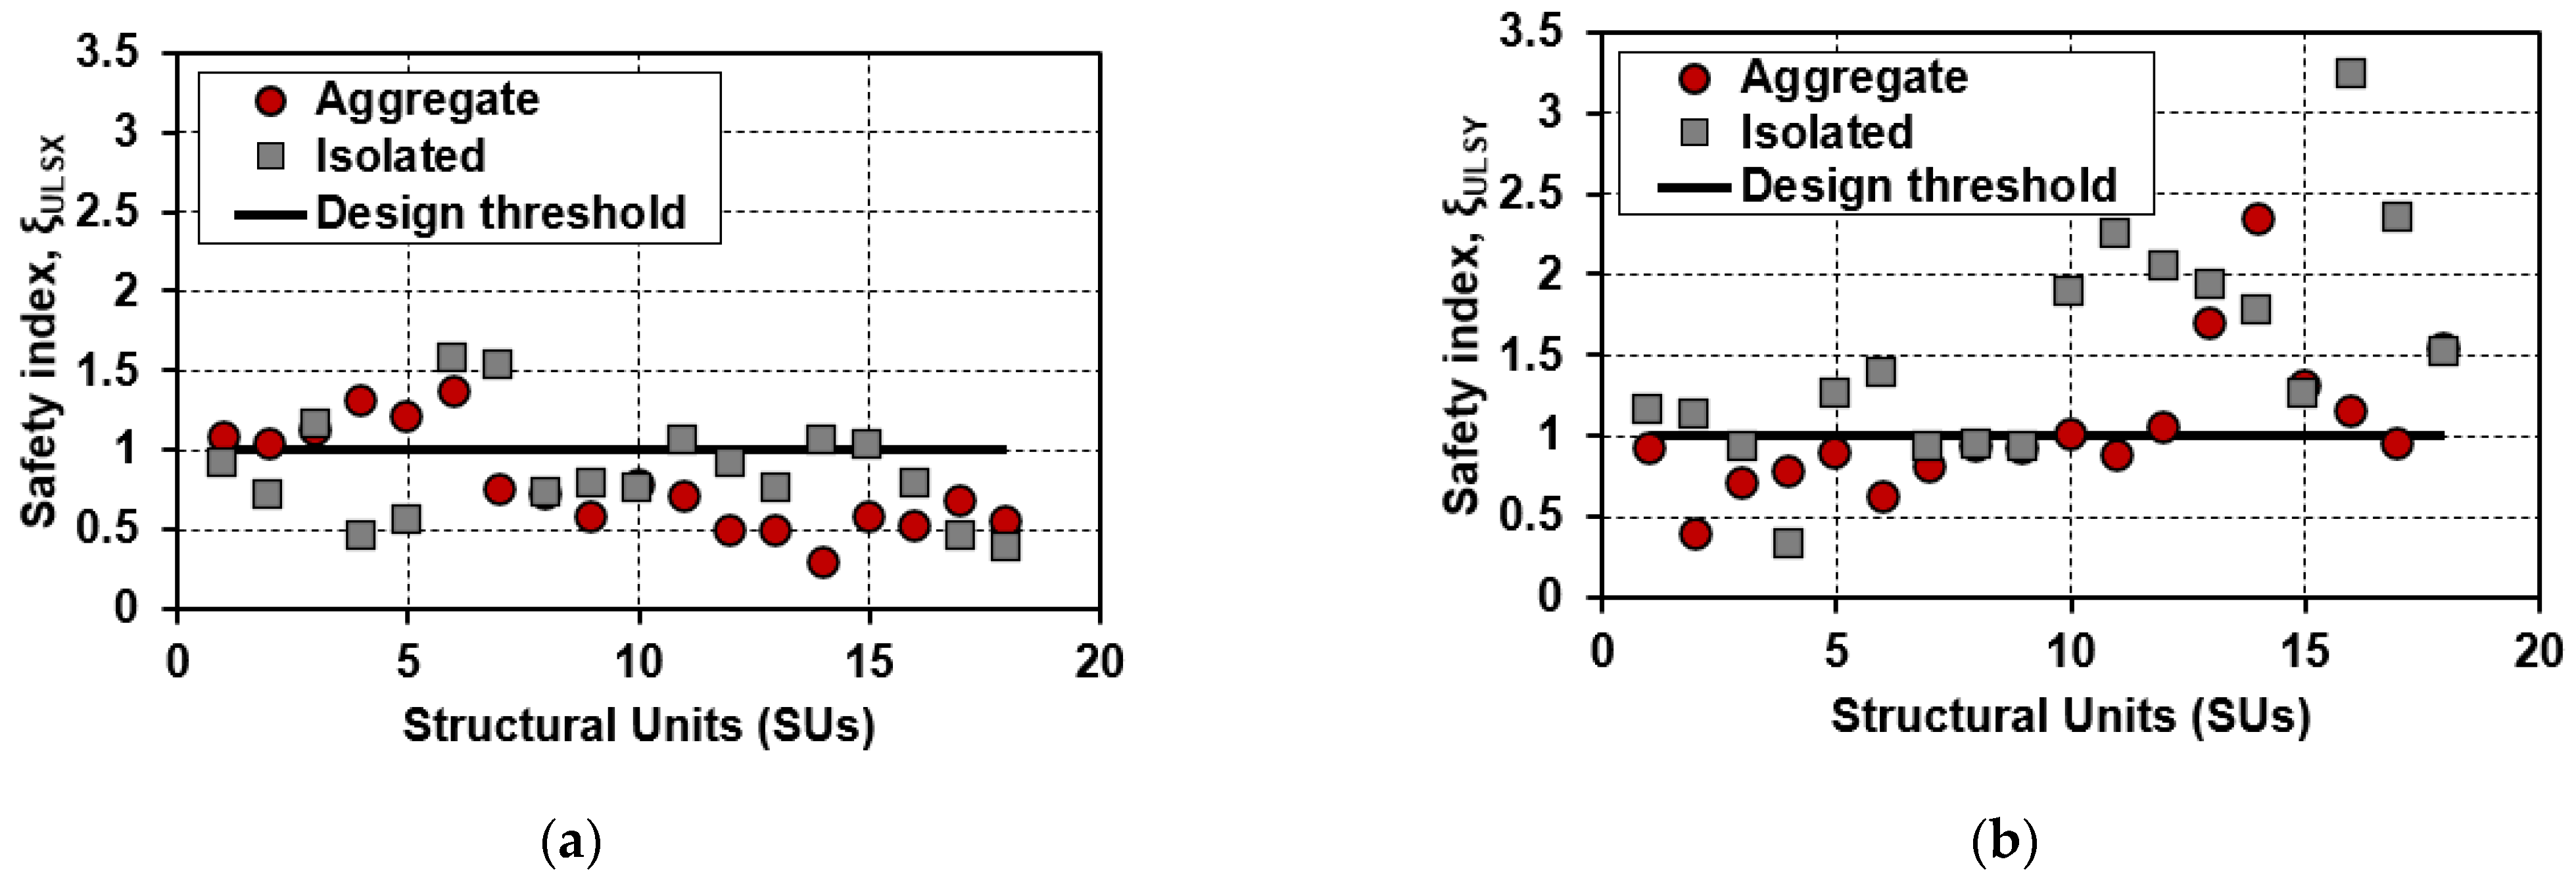
  • In terms of the seismic index, ξ, almost all the SUs (isolated and in aggregate conditions) have a seismic index lower than 1, not satisfying the code provisions. This is due to the presence of in-elevation discontinuities, which alter the global seismic behavior.
Thirdly, three different aggregate structural configurations were analyzed to provide suitable indications about the expected damage employing fragility curves. Overall, it was found that the structural units in aggregate configuration provide a greater probability of damage than the same SUs in isolated conditions. This depends on the fact that, in the clustered configuration, the examined units have generally reduced displacements since the elongated shape of the aggregate produces large displacements of the head SUs, which interrupt the analysis when the intermediate cells exhibit a scarce excursion in the plastic field.
Finally, a simplified formulation for predicting the vibration period of SUs arranged in clustered configuration was provided. This empirical formulation, suitably calibrated based on mechanical analysis, was compared with the main literature formulations. The main results achieved are discussed below:
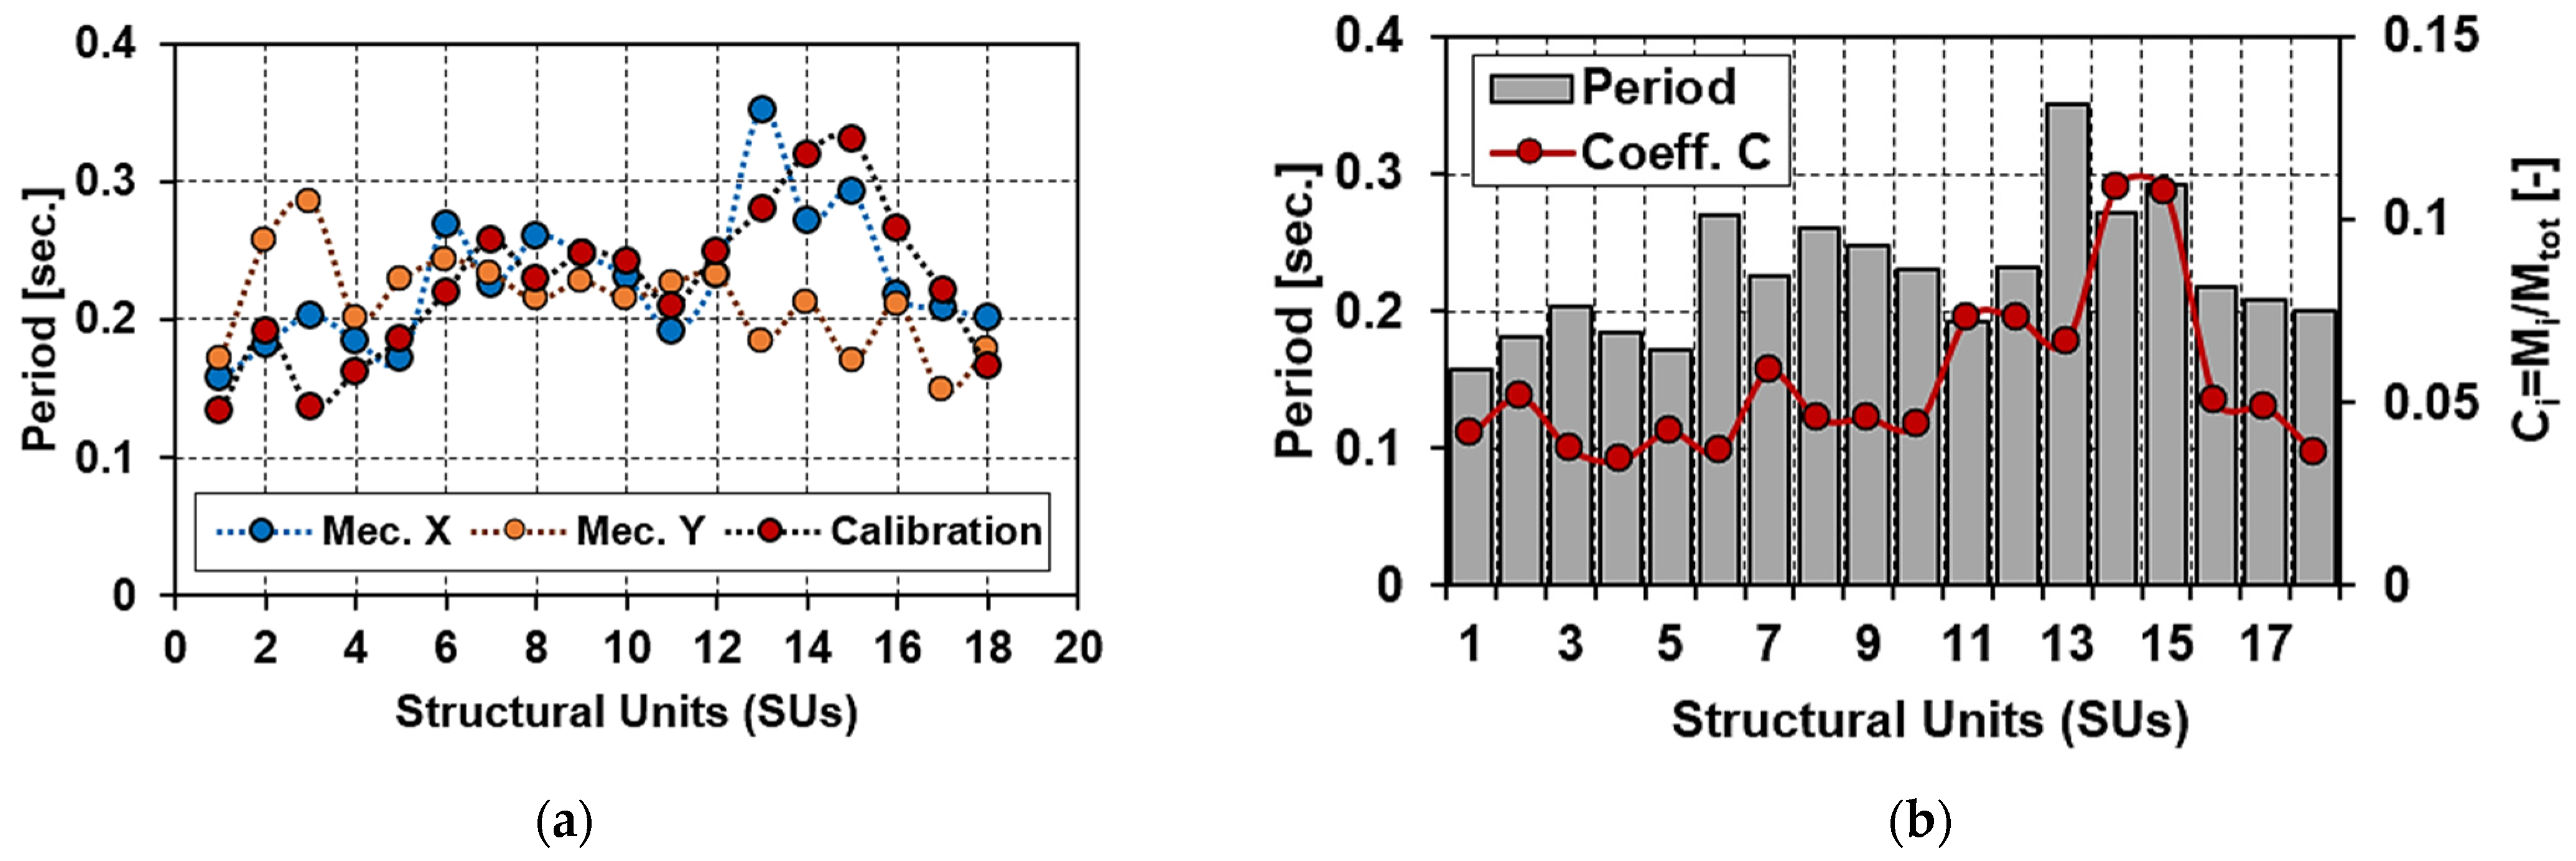
  • The coefficient Ci used for the proposed calibration formula is intended as the ratio between the mass of the reference SU and the total mass of the aggregate;
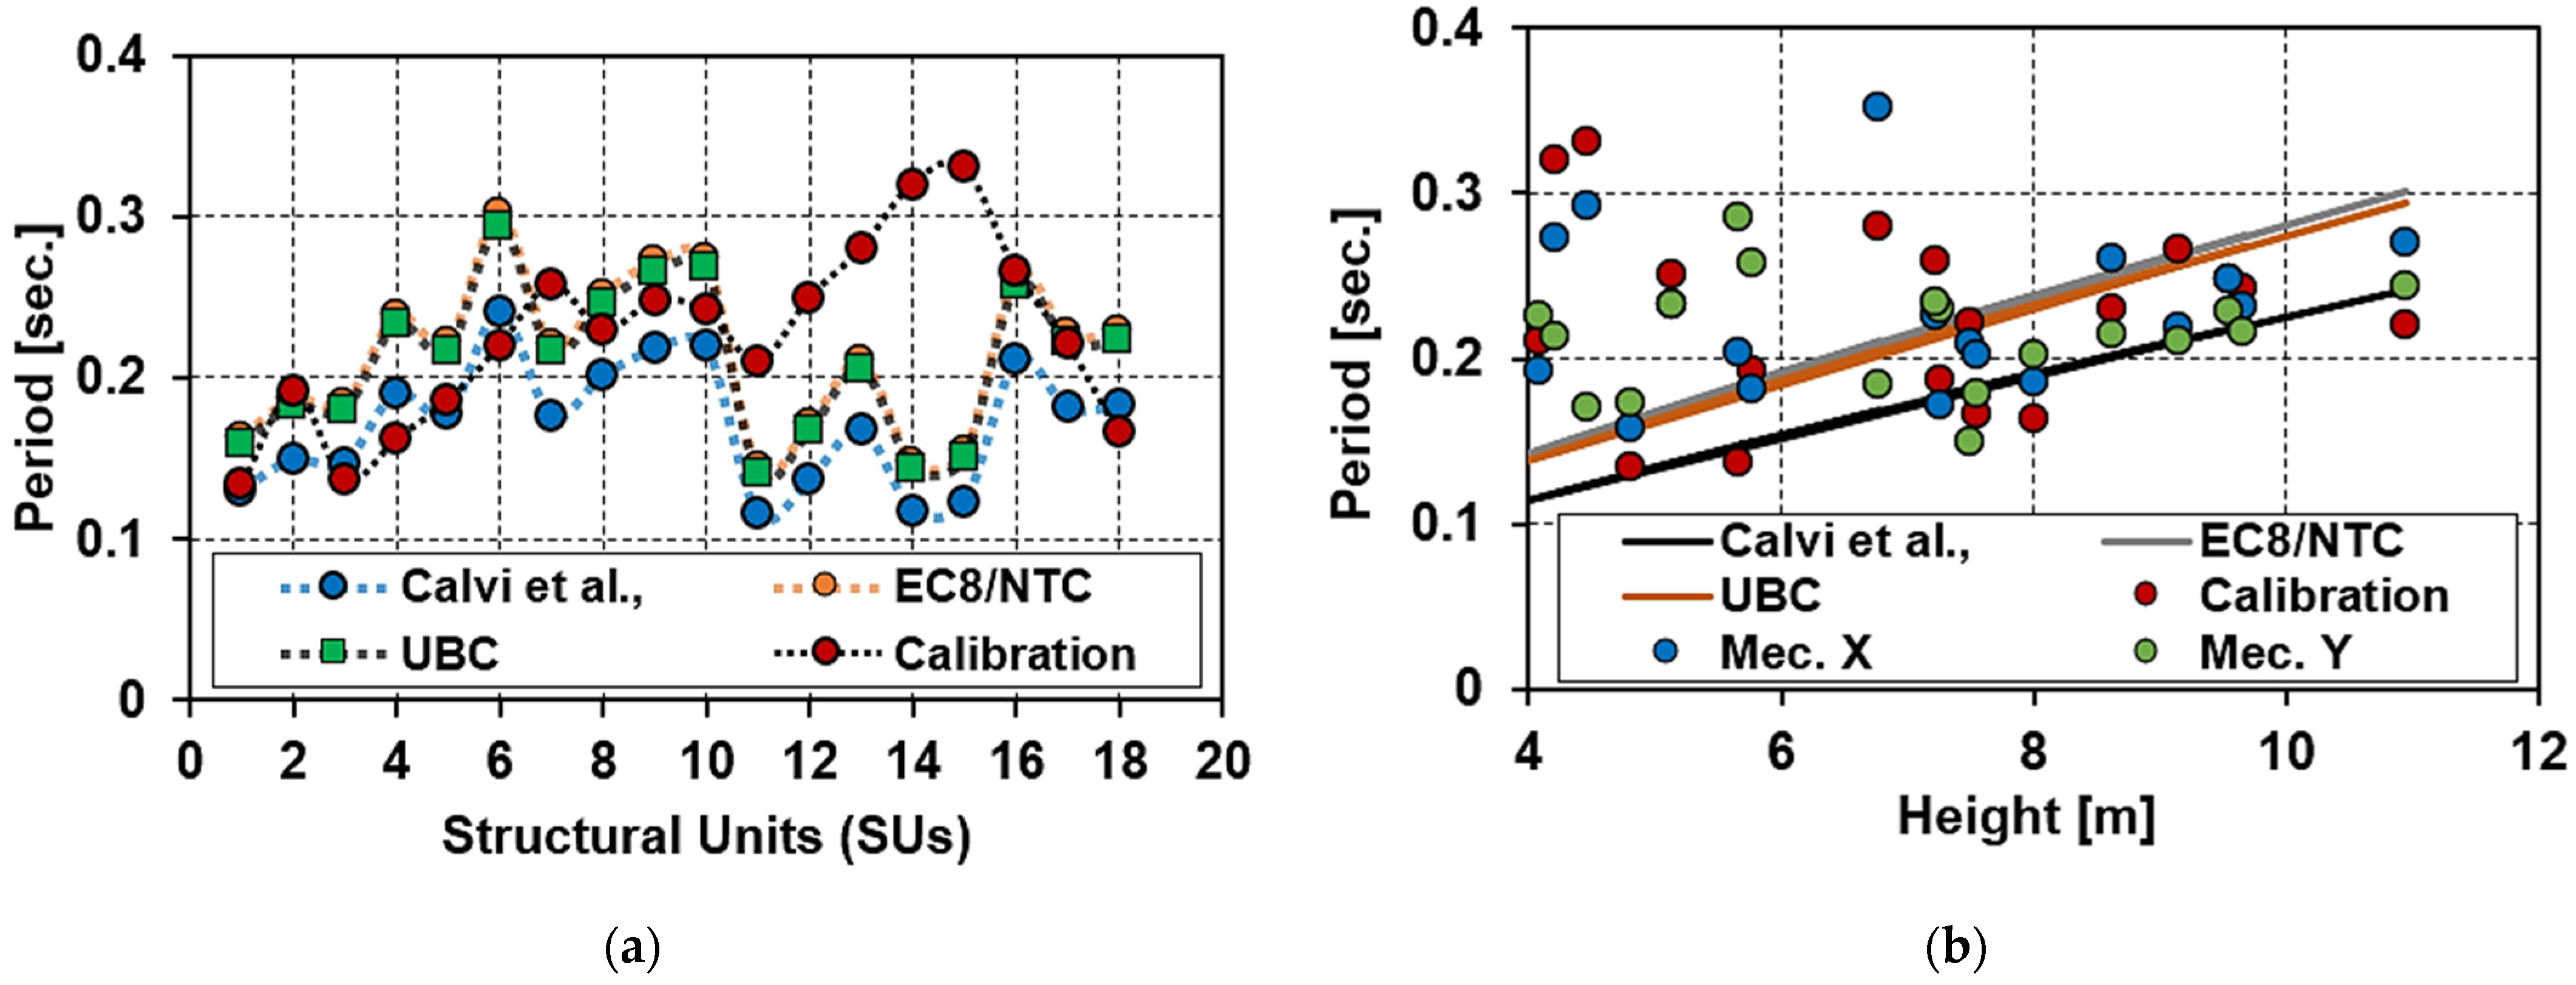
  • The proposed calibration formula provides periods comparable with those deriving from the mechanical analysis. In particular, when compared to the 3Muri analysis results, it was observed how the empirical relation had a maximum average increase of 8% in Y-direction and an average decrease of 1% in X-direction;
  • The vibration period, Ti, predicted by literature and standard relationships, if evaluated for heights between 4.0 m < H < 7.5 m, underestimates the expected predominant period derived from the formulation herein proposed. Contrary, for heights ranging from 8.0 m to 12 m, the proposed formulation gives results comparable to the literature and standard ones.

6. Patents

Author Contributions

Conceptualization, A.F., N.C., G.M. and M.M.; methodology, N.C. and A.F.; software, N.C.; validation, A.F., N.C., G.M. and M.M.; formal analysis, N.C.; investigation, N.C. and A.F.; resources, A.F.; data curation, A.F. and G.M.; writing—original draft preparation, N.C. and A.F.; writing—review and editing, A.F., G.M. and M.M.; visualization, N.C.; supervision, A.F.; project administration, A.F. and G.M. All authors have read and agreed to the published version of the manuscript.

Funding

This research received no external funding.

Data Availability Statement

Data deriving from the current study can be provided to the readers based upon their explicit request.

Acknowledgments

This work was developed under the financial support of the Italian Civil Protection Department within the ReLUIS-DPC 2019–2021 research project, which is gratefully acknowledged.

Conflicts of Interest

The authors declare no conflict of interest.

References

  1. Masi, A.; Lagomarsino, S.; Dolce, M.; Manfredi, V.; Ottonelli, D. Towards the updated Italian seismic risk assessment: Exposure and vulnerability modelling. Bull. Earthq. Eng. 2021. [Google Scholar] [CrossRef]
  2. Kassem, M.M.; Mohamed Nazri, F.; Noroozinejad Farsangi, E. The seismic vulnerability assessment methodologies: A state-of-the-art review. Ain Shams Eng. J. 2020, 11, 849–864. [Google Scholar] [CrossRef]
  3. Predari, G.; Mochi, G.; Gulli, R. The transformation process of masonry buildings in historic towns: The case of Medicina in northern Italy. Constr. Hist. 2014, 29, 1–20. [Google Scholar]
  4. Formisano, A.; Chieffo, N.; Vaiano, G. Seismic Vulnerability Assessment and Strengthening Interventions of Structural Units of a Typical Clustered Masonry Building in the Campania Region of Italy. GeoHazards 2021, 2, 6. [Google Scholar] [CrossRef]
  5. Greco, A.; Lombardo, G.; Pantò, B.; Famà, A. Seismic Vulnerability of Historical Masonry Aggregate Buildings in Oriental Sicily. Int. J. Archit. Herit. 2020, 14, 517–540. [Google Scholar] [CrossRef]
  6. Sarhosis, V.; Milani, G.; Formisano, A.; Fabbrocino, F. Evaluation of different approaches for the estimation of the seismic vulnerability of masonry towers. Bull. Earthq. Eng. 2018, 16, 1511–1545. [Google Scholar] [CrossRef] [Green Version]
  7. Clementi, F.; Gazzani, V.; Poiani, M.; Lenci, S. Assessment of seismic behaviour of heritage masonry buildings using numerical modelling. J. Build. Eng. 2016, 8, 29–47. [Google Scholar] [CrossRef]
  8. Ferrante, A.; Giordano, E.; Clementi, F.; Milani, G.; Formisano, A. FE vs. DE Modeling for the Nonlinear Dynamics of a Historic Church in Central Italy. Geosciences 2021, 11, 189. [Google Scholar] [CrossRef]
  9. Munari, M.; Valluzzi, M.R.; Cardani, G.; Anzani, A.; Binda, L.; Modena, C. Seismic vulnerability analyses of masonry aggregate buildings in the historical centre of Sulmona (Italy). In Proceedings of the 13th International Conference SFR 2010, Edinburgh, UK, 15–17 June 2010. [Google Scholar]
  10. Mosoarca, M.; Onescu, I.; Onescu, E.; Anastasiadis, A. Seismic vulnerability assessment methodology for historic masonry buildings in the near-field areas. Eng. Fail. Anal. 2020, 115, 104662. [Google Scholar] [CrossRef]
  11. Chieffo, N.; Onescu, I.; Formisano, A.; Mosoarca, M.; Palade, M. Integrated Empirical-mechanical Seismic Vulnerability Analysis Method for Masonry Buildings in Timișoara: Validation based on the 2009 Italian Earthquake. Open Civ. Eng. J. 2020, 14, 314–333. [Google Scholar] [CrossRef]
  12. Formisano, A. Local-and global-scale seismic analyses of historical masonry compounds in San Pio delle Camere (L’Aquila, Italy). Nat. Hazards 2017, 86, 465–487. [Google Scholar] [CrossRef]
  13. Formisano, A.; Massimilla, A. A novel procedure for simplified nonlinear numerical modeling of structural units in masonry aggregates. Int. J. Archit. Herit. 2018, 12, 1162–1170. [Google Scholar] [CrossRef]
  14. Chieffo, N.; Formisano, A. Comparative seismic assessment methods for masonry building aggregates: A case study. Front. Built Environ. 2019, 5. [Google Scholar] [CrossRef]
  15. Gulli, R.; Mochi, G.; Predari, G. An expeditious methodology for the seismic vulnerability assessment of building aggregates. Tema Technol. Eng. Mater. Archit. 2018, 4, 81–90. [Google Scholar]
  16. Predari, G.; Bartolomei, C.; Morganti, C.; Mochi, G.; Gulli, R. Expeditious methods of urban survey for seismic vulnerability assessment. Int. Arch. Photogramm. Remote Sens. Spat. Inf. Sci. 2019, XLII-2/W17, 271–278. [Google Scholar] [CrossRef] [Green Version]
  17. Grillanda, N.; Valente, M.; Milani, G. Adaptive NURBS based local failure analyses of retrofitted masonry aggregates. In AIP Conference Proceedings; AIP Publishing: Melville, NY, USA, 2021. [Google Scholar]
  18. Grillanda, N.; Valente, M.; Milani, G.; Chiozzi, A.; Tralli, A. Advanced numerical strategies for seismic assessment of historical masonry aggregates. Eng. Struct. 2020, 212, 110441. [Google Scholar] [CrossRef]
  19. Grillanda, N.; Valente, M.; Milani, G. ANUB-Aggregates: A fully automatic NURBS-based software for advanced local failure analyses of historical masonry aggregates. Bull. Earthq. Eng. 2020, 18, 3935–3961. [Google Scholar] [CrossRef]
  20. Senaldi, I.E.; Guerrini, G.; Comini, P.; Graziotti, F.; Penna, A.; Beyer, K.; Magenes, G. Experimental seismic performance of a half-scale stone masonry building aggregate. Bull. Earthq. Eng. 2020, 18, 609–643. [Google Scholar] [CrossRef]
  21. Senaldi, I.E.; Magenes, G.; Penna, A. Numerical investigations on the seismic response of masonry building aggregates. Adv. Mater. Res. 2010, 133, 715–720. [Google Scholar] [CrossRef]
  22. Formisano, A.; D’amato, M. Seismic Analysis and Retrofitting of Historical Buildings; Frontiers Media SA: Lausanne, Switzerland, 2020. [Google Scholar]
  23. D’Amato, M.; Laguardia, R.; Di Trocchio, G.; Coltellacci, M.; Gigliotti, R. Seismic Risk Assessment for Masonry Buildings Typologies from L’Aquila 2009 Earthquake Damage Data. J. Earthq. Eng. 2020, 1–35. [Google Scholar] [CrossRef]
  24. Onescu, E.; Onescu, I.; Mosoarca, M. The impact of timber roof framework over historical masonry structures. In IOP Conference Series: Materials Science and Engineering; IOP Publishing: Bristol, UK, 2019. [Google Scholar]
  25. Mosoarca, M.; Apostol, I.; Keller, A.; Formisano, A. Consolidation methods of Romanian historical building with composite materials. Key Eng. Mater. 2017, 747, 406–413. [Google Scholar] [CrossRef]
  26. Ricchiuto, F. Strategie Valutative della Vulnerabilità Sismica degli Aggregati Edilizi in Relazione alla Caratterizzazione Costruttiva: Risultanze delle Analisi sugli Aggregati dell’Intero Centro Storico di Mirandola. Master’s Thesis, University of Bologna, Bologna, Italy, 2013. (In Italian). [Google Scholar]
  27. Ministry of Infrastructure and Transport. Technical Standards for Construction; Official Gazette: Rome, Italy, 2018. (In Italian)
  28. Formisano, A.; Mazzolani, F.M.; Florio, G.; Landolfo, R. A quick methodology for seismic vulnerability assessment of historical masonry aggregates. In Proceedings of the COST Action C26 Final Conference “Urban Habitat Constructions under Catastrophic Events”, Naples, Italy, 16–18 September 2010. [Google Scholar]
  29. Formisano, A.; Chieffo, N.; Mosoarca, M. Seismic vulnerability and damage speedy estimation of an urban sector within the municipality of San Potito Sannitico (Caserta, Italy). Open Civ. Eng. J. 2017, 11, 1106–1121. [Google Scholar] [CrossRef] [Green Version]
  30. Lagomarsino, S.; Giovinazzi, S. Macroseismic and mechanical models for the vulnerability and damage assessment of current buildings. Bull. Earthq. Eng. 2006, 4, 415–443. [Google Scholar] [CrossRef]
  31. Chieffo, N.; Formisano, A. The influence of geo-hazard effects on the physical vulnerability assessment of the built heritage: An application in a district of Naples. Buildings 2019, 9, 26. [Google Scholar] [CrossRef] [Green Version]
  32. S.T.A. DATA. 3Muri-Seismic Calculation of Masonry Structures; User Manual; S.T.A. DATA srl: Turin, Italy; Available online: https://www.3muri.com/documenti/brochure/en/3Muri10.9.0_ENG.pdf (accessed on 3 June 2021).
  33. EN 1998-3. Eurocode 8: Design of Structures for Earthquake Resistance. Part 3: Assessment and Retrofitting of Buildings; CEN: Bruxelles, Belgium, 2004; pp. 1–97. [Google Scholar]
  34. Donà, M.; Carpanese, P.; Follador, V.; Sbrogiò, L.; da Porto, F. Mechanics-based fragility curves for Italian residential URM buildings. Bull. Earthq. Eng. 2020, 19, 3099–3127. [Google Scholar] [CrossRef]
  35. Rota, M.; Penna, A.; Magenes, G. A methodology for deriving analytical fragility curves for masonry buildings based on stochastic nonlinear analyses. Eng. Struct. 2010, 32, 1312–1323. [Google Scholar] [CrossRef]
  36. Lagomarsino, S.; Cattari, S. Seismic Vulnerability of Existing Buildings: Observational and Mechanical Approaches for Application in Urban Areas. Seism. Vulnerability Struct. 2013, 1–62. [Google Scholar] [CrossRef]
  37. ICBO. Uniform Building Code, UBC; International Conference of Building Officials: Whittier, CA, USA, 1997. [Google Scholar]
  38. Trifunac, M.D.; Ivanović, S.S.; Todorovska, M.I. Apparent Periods of a Building. II: Time-Frequency Analysis. J. Struct. Eng. 2001, 127, 527–537. [Google Scholar] [CrossRef] [Green Version]
  39. Calvi, G.M. A Displacement-Based Approach for Vulnerability Evaluation of Classes of Buildings. J. Earthq. Eng. 1999, 3, 411–438. [Google Scholar] [CrossRef]
  40. Ministry of Infrastructure and Transport. Updating Technical Standards for Construction; Official Gazette: Rome, Italy, 2008. (In Italian)
Figure 1. Historical-urban development of the city of Mirandola [26].
Geosciences 11 00287 g001
Figure 2. Historical compartment and urban plan of the city with the main roads and sub-urban borough (a,b) [26]; (c,d) styles of architectural buildings.
Geosciences 11 00287 g002
Figure 3. Identification of the case study aggregate (a) and view along the main street (b).
Geosciences 11 00287 g003
Figure 4. Vulnerability index distribution for the SUs of the case study aggregate.
Geosciences 11 00287 g004
Figure 5. Vulnerability curves for the case study aggregate (a) and statistical variation of the vulnerability index for each macroseismic intensity (b).
Geosciences 11 00287 g005
Figure 6. The macro-element models of the investigated SUs in the clustered conditions (pink) and the adjacent buildings (brown).
Geosciences 11 00287 g006aGeosciences 11 00287 g006b
Figure 7. Capacity curves in X (a) and Y (b) directions for each SU in aggregate and isolated conditions.
Geosciences 11 00287 g007
Figure 8. The main EDPs evaluated for aggregate and isolated SUs.
Geosciences 11 00287 g008
Figure 9. Numerical model of the reference case study SUs: (a) head SU, (b) intermediate SU confined on 3 sides, and (c) intermediate SU confined on 2 sides.
Geosciences 11 00287 g009
Figure 10. Capacity curves of the examined SUs in X- (a) and Y- (b) directions.
Geosciences 11 00287 g010
Figure 11. Seismic risk index, ζ, evaluated for all structural configurations in X (a) and Y (b) analysis directions.
Geosciences 11 00287 g011
Figure 12. Sensitivity analysis for the clustered configurations examined.
Geosciences 11 00287 g012
Figure 13. Fragility curves for the examined structural units in X- (a,c,e) and Y- (b,d,f) directions.
Geosciences 11 00287 g013aGeosciences 11 00287 g013b
Figure 14. Influence of the structural positions on the fragility assessment of inspected SUs in (a) X direction and (b) Y analysis directions.
Geosciences 11 00287 g014
Figure 15. Main vibration periods of the examined SUs.
Geosciences 11 00287 g015aGeosciences 11 00287 g015b
Figure 16. Linear regression relationships for estimation of the vibration periods of investigated SUs.
Geosciences 11 00287 g016
Figure 17. Comparison of mechanical and empirical vibration periods (a) and (b) variation of the coefficient Ci for each SUs.
Geosciences 11 00287 g017
Figure 18. Comparison among different formulations to estimate vibration periods of investigated SUs (a) and period vs. height trends obtained from theoretical relationships and mechanical analyses (b).
Geosciences 11 00287 g018
Table 1. Basic mechanical properties of masonry walls used for inspected SUs [27].
Mechanical Parameter CF (LC1)
Average compressive strengthfm2.6 Nmm−21.35
Shear strengthτ00.05 Nmm−2
Average shear strengthfv00.13 Nmm−2
Young modulusE1500 Nmm−2
Tangential elasticity modulusG500 Nmm−2
Specific weightw18.0 KNm−3
Table 2. Vulnerability form for historical aggregate buildings.
ParametersVulnerability ClassWeight
ABCD
1. Organization of vertical structures0520451
2. Nature of vertical structures0525450.25
3. Location of the building and type of foundation0525450.75
4. Distribution of plan resisting elements0525451.5
5. In-plane regularity0525450.5
6. Vertical regularity0525450.8
7. Type of floor0525450.8
8. Roofing01525451
9. Details0025450.25
10. Physical conditions0525451
11. Presence of adjacent building with different height−20015451
12. Position of the building in the aggregate−45−25−1501.5
13. Number of staggered floors01525450.5
14. Structural or typological heterogeneity among S.U.−15−100451.2
15. Percentage difference of opening areas among adjacent façades−20025451
Table 3. Damage levels, DSi, and the corresponding dispersion, β.
Damage Thresholds DSi
D10.7‧dySlight
D21.5‧dyModerate
D30.5‧(dy + du)Near collapse
D4, D5duCollapse
Standard Deviation β
0.45‧ln(µ)
Table 4. Target displacements, dy and du, for the examined SUs.
Structural UnitsIsolated (X dir.)Aggregate (X dir.)
dy (cm)du (cm)dy (cm)du (cm)
10.221.560.221.10
70.512.210.300.69
131.002.500.481.53
Structural UnitsIsolated (Y dir.)Aggregate (Y dir.)
dy (cm)du (cm)dy (cm)du (cm)
10.601.460.231.44
70.460.980.340.52
130.522.480.401.77
Publisher’s Note: MDPI stays neutral with regard to jurisdictional claims in published maps and institutional affiliations.

