Abstract
Seafloor heat flow measurements are utilized to determine the geothermal regime of the Danube deep-sea fan in the western Black Sea and are presented in the larger context of regional gas hydrate occurrences. Heat flow data were collected across paleo-channels in water depths of 550–1460 m. Heat flow across levees ranges from 25 to 30 mW m−2 but is up to 65 mW m−2 on channel floors. Gravity coring reveals sediment layers typical of the western Black Sea, consisting of three late Pleistocene to Holocene units, notably red clay within the lowermost unit cored. Heat flow derived from the bottom-simulating reflector (BSR), assumed to represent the base of the gas hydrate stability zone (GHSZ), deviates from seafloor measurements. These discrepancies are linked either to fast sedimentation or slumping and associated variations in sediment physical properties. Topographic effects account of up to 50% of heat flow deviations from average values. Combined with climate-induced variations in seafloor temperature and sea-level since the last glacial maximum large uncertainties in the prediction of the base of the GHSZ remain. A regional representative heat flow value is ~30 mW m−2 for the study region but deviations from this value may be up to 100%.
1. Introduction
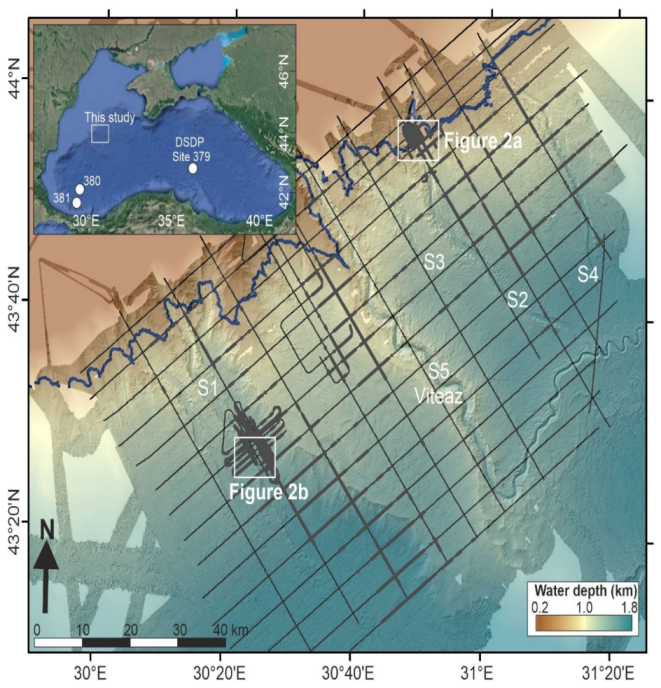
Gas hydrates were initially discovered in the Black Sea in 1974 [1]. Since then, a number of scientific research projects were conducted studying the general occurrence and distribution of gas hydrates along the continental margins of the Black Sea, e.g., [2,3,4,5,6,7,8]. Several seismic studies [9,10,11,12,13,14,15] were conducted to map bottom-simulating reflectors (BSRs), which are used as an indicator for the base of the structure I (sI) gas hydrate stability zone (GHSZ). However, BSRs are not widely distributed in the Black Sea [2,8,10,16] and occur in patches (Figure 1, see also e.g., [6,17]). Across the thick sediment deposits of the Viteaz channel-levee system of the Danube deep-sea fan, a stack of up to five BSRs was identified and linked to former climate conditions of the lower seafloor temperature and sea levels during glacial times compared to inter-glacial climate epochs [9,18]. The shallow feather edge of the sI gas hydrate systems in ~720 m water depth marks the onset of BSRs towards deeper water [19,20,21]. With very few exceptions, gas venting is seen only in water depths shallower than the 720 m feather edge of the current GHSZ [17,19,20,21,22,23,24].
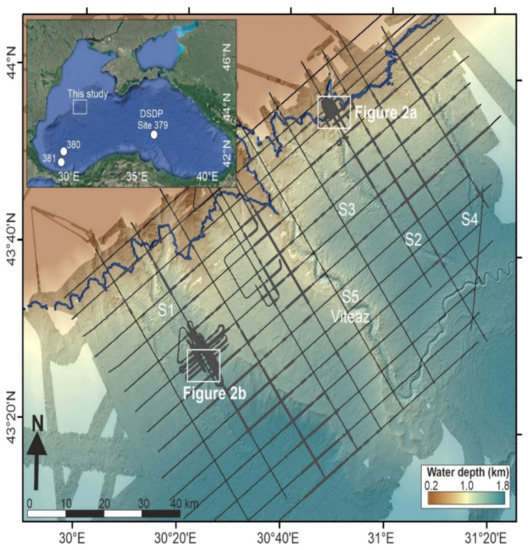
Figure 1.
Bathymetry of the Danube deep-sea fan with five major channels identified. Grey shaded symbols mark the seismically identified bottom-simulating reflector (BSR) along the seismic lines of expedition MSM34 (black lines). The 720 m isobath (blue solid line) marks the feather edge of the structure I gas hydrate stability zone. Inset shows the entire Black Sea region with DSDP Leg 48 drill sites [25].
Scientific drilling and coring were first performed in the Black Sea during the Deep Sea Drilling Project (DSDP) Leg 42 at Sites 379−381 (Figure 1), defining the background sedimentological and pore water geochemical constraints within the upper 200 to 300 m of sediment below seafloor [25]. Additional giant piston coring and geotechnical probing up to ~40 m below seafloor (mbsf) were performed at the Danube deep-sea fan during the previous ASSEMBLAGE 1, BLASON 2, and GHASS projects [26,27,28]. To further study gas hydrates in this region, drilling with the MARUM-MeBo200 seafloor drill rig [29] was performed in 2017 during expedition M142 in the frame of the German SUGAR project [30]. Drilling at three sites up to ~148 mbsf across the S2 channel-levees (Figure 1) defined the geophysical and geochemical setting of the mostly fine-grained turbidite sediment system, but no gas hydrates were recovered [30]. New downhole in situ temperature data combined with detailed pore water chemistry from recovered sediments and the drilling-derived gas composition [31] confirmed initial models [21,32] that the current base of the GHSZ is shallower than expected from the prominent BSRs in this region [17].
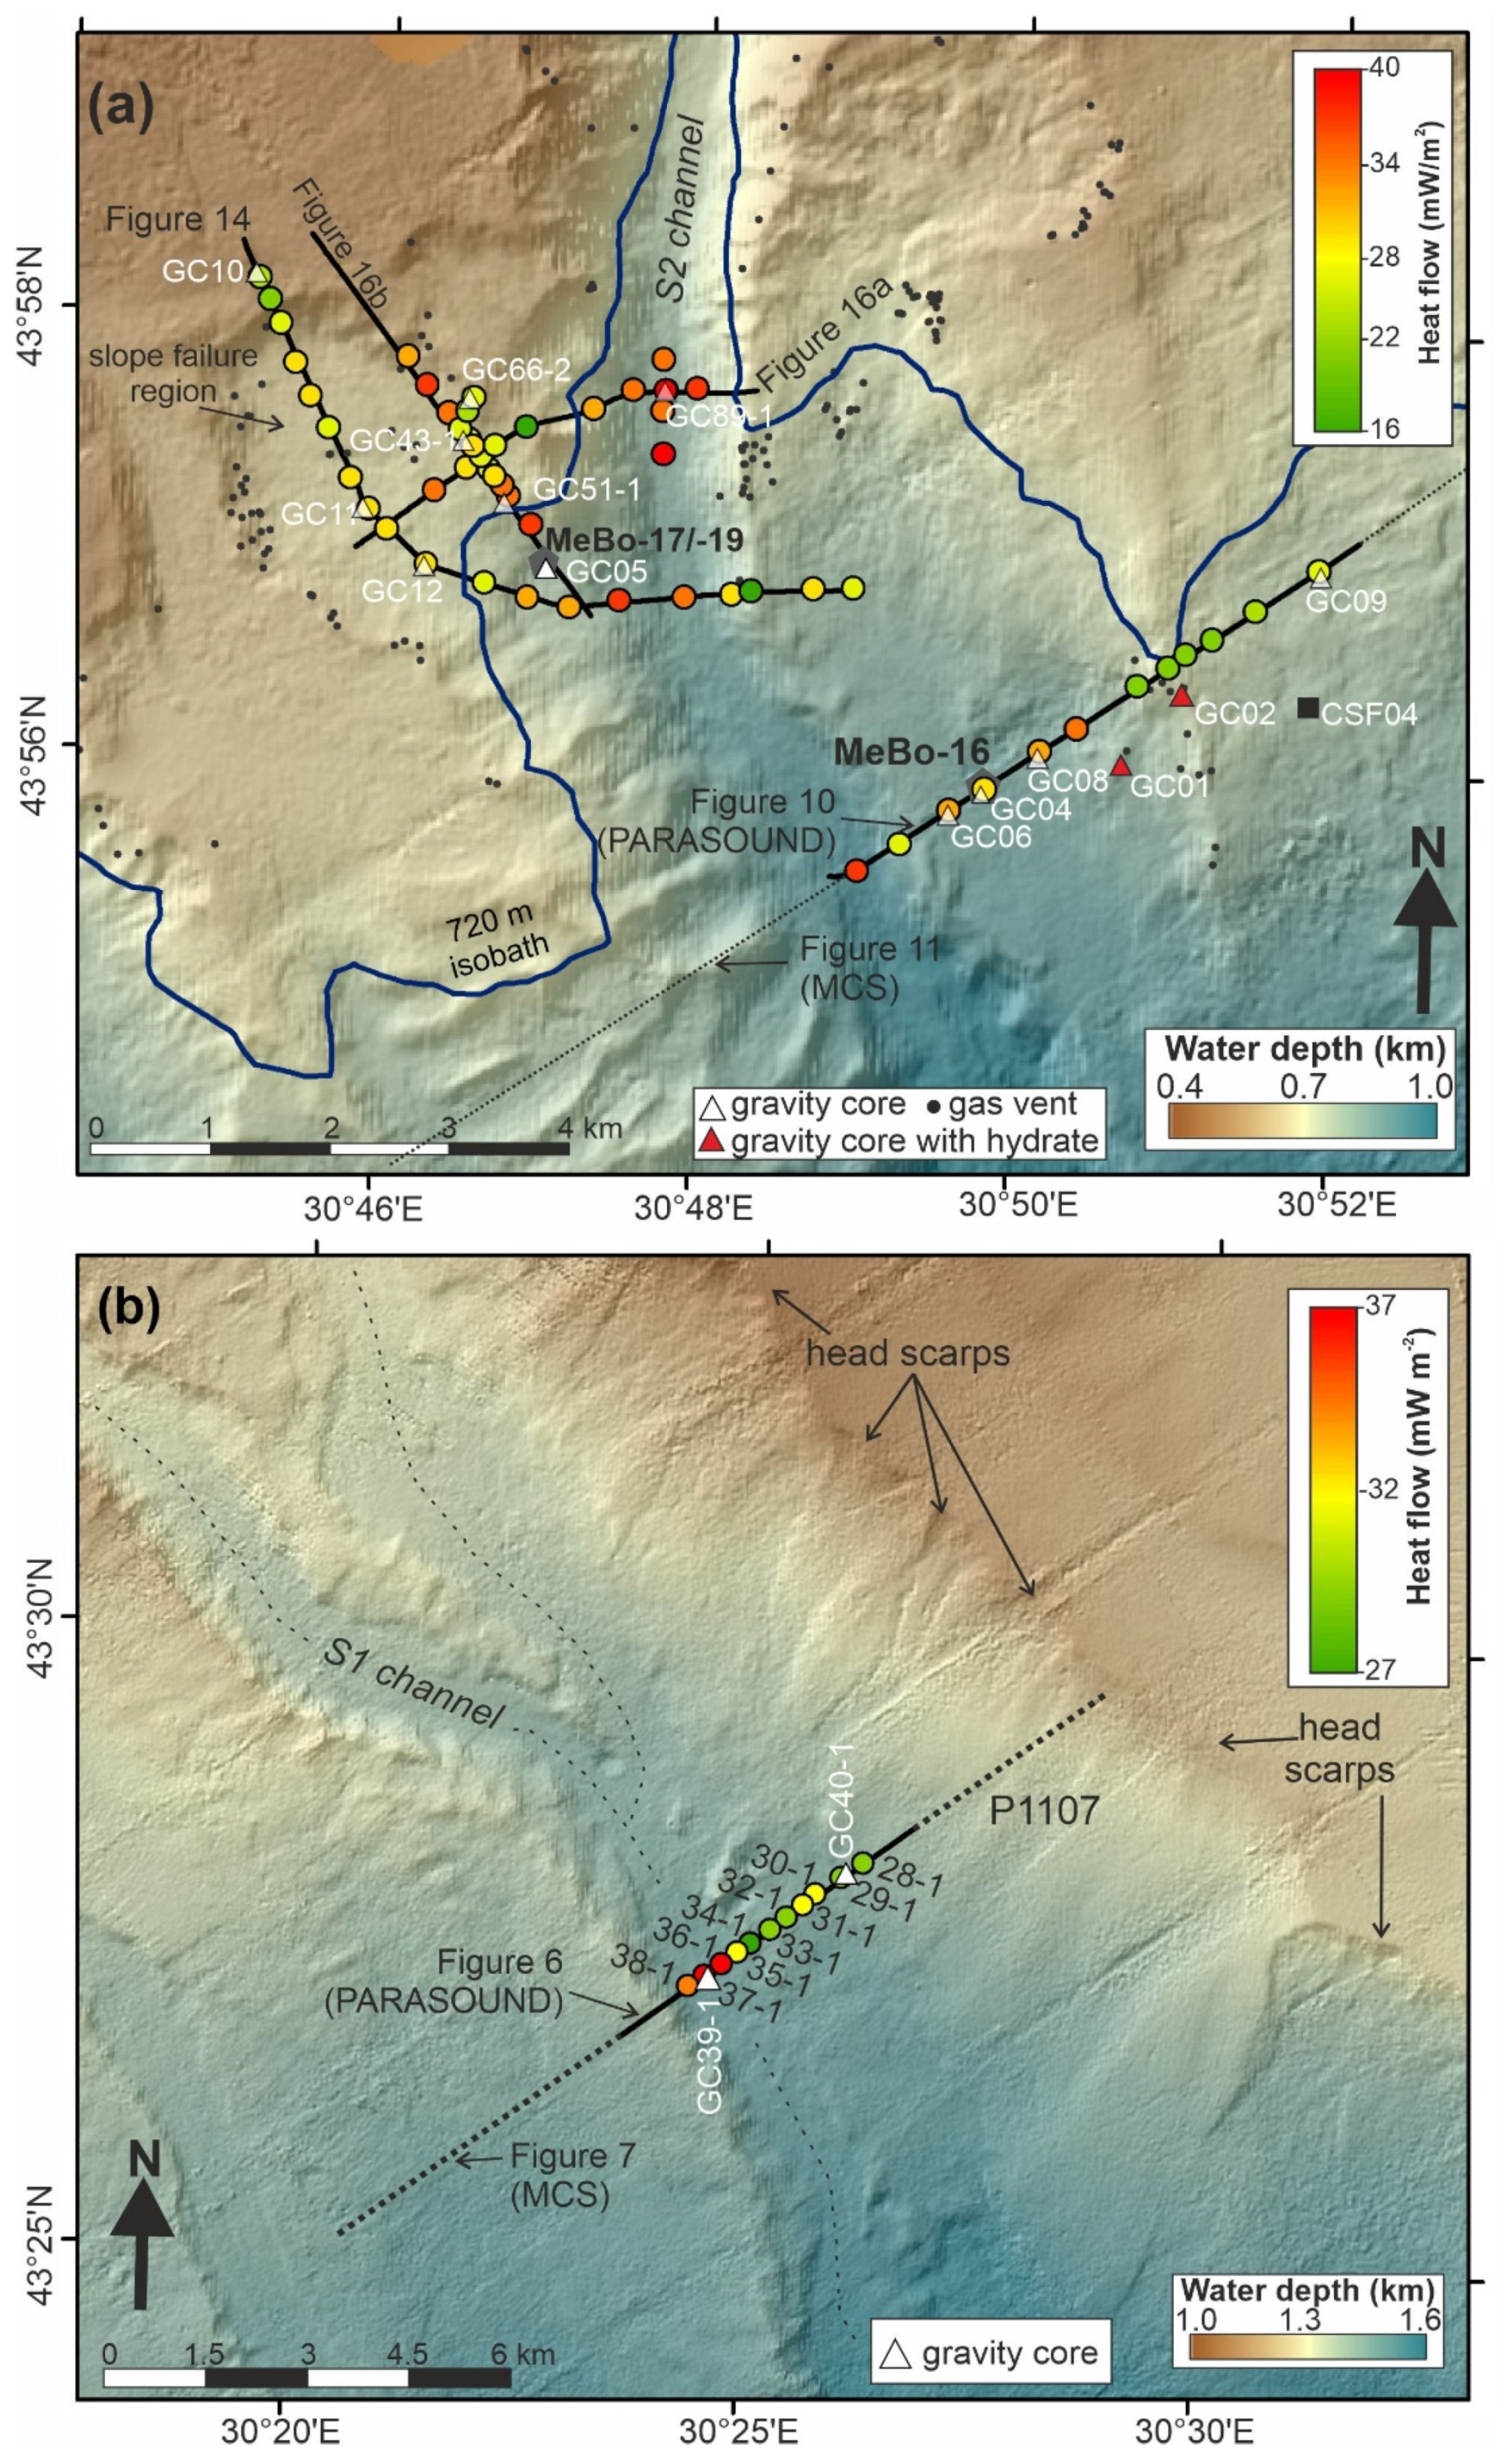
This finding sets the stage for our new study focusing on shallow penetration heat-probe measurements conducted across the S1 and S2 channels (Figure 2). Heat-probe data were previously used to define a map of thermal gradients and a related map of the theoretical thickness of the GHSZ across the entire Black Sea [3]. New heat-probe data acquired during two expeditions (MSM34 [11], M142 [30]) have been re-analyzed to estimate thermal gradients and heat flow and are compared to results from BSR-depth conversion and deep-drilling data. In general, shallow penetration heat-probe data are potentially affected by changes in bottom-water temperatures and are possibly susceptible to recent erosional and associated depositional events such as mass-transport deposits (MTDs) or sediment mass flows within channels. Previous work [14] indicated anomalous high heat flow values of >50 mW m−2 within the S2 channel talweg and similar anomalies along the head scarp of a prominent slope failure. In our new study, we set out to explain these anomalies and ask the specific questions of what may cause the high heat flow in the channel talweg and whether this phenomenon could be explained by topographic focussing effects or other recent sedimentary processes. To address this issue, we undertook 2D topographic modeling across the S1 and S2 channels and incorporate results from deep drilling and shallow gravity coring. The overarching scientific question is whether shallow penetration heat-probe data can be used to reliably predict the deeper thermal setting for assessing the thickness of the GHSZ across the Danube deep-sea fan in the western Black Sea. Linked to this analysis is the common approach to convert the depth of the BSR to surface heat flow assuming that the BSR is an isotherm and marks the current base of the GHSZ [33,34]. Combining thermal modeling, BSR-depth constraints, and heat flow values from probe-measurements and/or drilling has been successfully applied at many convergent margins (e.g., Nankai [35,36,37], Makran [38], Costa-Rica [39], Cascadia [40,41,42,43,44], Chile [45]) and passive continental margins (e.g., Taiwan [46], South China Sea [47,48], East coast of India [49,50]). Required parameters for such a conversion include the geochemical conditions of pore water salinity, types of hydrocarbon occurrences, sediment thermal conductivity, and P-wave velocity for time-depth conversion.
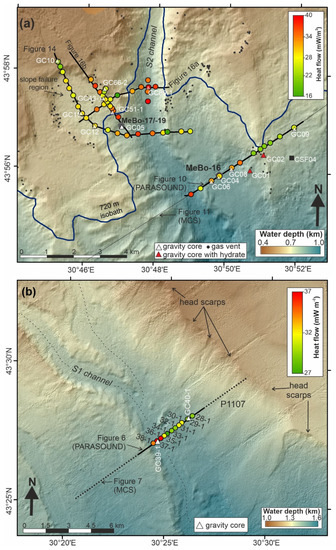
Figure 2.
(a) Bathymetry around the S2 channel with MeBo drill sites. Shown as colored dots are heat flow values from probe measurements and gravity core stations as white triangles. Station CSF04 is from the GHASS expedition [21]. Gas vents seen along failure scarps and ridges are indicated by black dots. The 720 m isobath (blue solid line) marks the upper edge of the gas hydrate stability zone. (b) Detailed bathymetry around the S1-channel with heat flow values along profile P1007 and gravity core stations (white triangles). Note the abundant failure head scarps at the eastern edge of the S1 levee.
2. Geologic Background
The Black Sea Basin is a sedimentary basin that formed due to the closure of the Thetys Ocean. During the Neogene, it underwent several phases of extension and closure [50] with associated large fault systems [51,52]. Our study region in the northwestern Black Sea (Figure 1) is a typical passive margin setting with extensive continental shelves [53], and dominated by large-scale submarine channel systems, with the Danube channel (also called Viteaz or S5 channel) being the largest system identified [54]. Nine individual channel systems were identified in our study region off the Bulgarian and Romanian margin (Figure 1). The S1 to S5 channels represent different stages of sediment transport and evolution of the Danube deep-sea fan [54,55,56]. In contrast, four channels (N1–N4) were associated with the Dniepr river system further to the east. The sediments found in the associated fan complex consist of fine-grained turbidites (clay to silt grainsize, [30]) and form stacks of alternating channel and levees deposits [13,57,58]. Mass-transport deposits (MTDs) are found pervasively on the slope, with head-scarps predominantly seen at the slope edge and along channel walls [17]. The Danube and Dniepr deep-sea fans started to develop in the Pleistocene around 900 ka ago [54]. The Viteaz channel, forming the largest of the five channel systems associated with the Danube river, began to develop during the last glacial maximum (LGM). Sea-level in the Black Sea was at least 100 m lower than today [59,60,61] during the LGM, and sea water was also fresher with a salinity of 3–4 PSU (practical salinity unit) [62] compared to today’s salinity of ~22 PSU [63]. Bottom-water temperatures during the LGM with values of around 4 °C [27] were lower than today’s temperature of nearly constant ~9 °C across much of the slope region [3,64]. This significant change in temperature, pressure, and salinity conditions strongly affected the gas hydrate regime of the Black Sea [14,21,32,65]. Despite the increase in pressure promoting gas hydrate formation, the overwhelming temperature increase at the sea floor resulted in an up-dip migration of the base of the GHSZ, which is one of the primary controls on the limits of gas venting occurrences and associated slope instability across the study region [17,20].
3. Materials and Methods
3.1. Heat-Probe Measurements
During expeditions M142 and MSM34, an identical marine heat-probe system was used acquiring the data utilized in this study. The probe was constructed in the classical ‘violin bow’ style [66], with 22 thermistors distributed in a string over an active length of 5.2 m attached to a steel pipe. The top-weight was in both cases ~1 ton [11,30]. The heat-probe was typically deployed (after an initial calibration run) in pogo-mode, with the probe not brought back to the sea-surface between stations. Data were analyzed after a set of stations was completed with the probe back on deck. The thermistor-string was initially calibrated by using the probe in deep water with expected homogenous water-mass properties over the entire length of the probe. Temperatures of the individual 22 sensors of the string were compared to a PT100 reference temperature sensor attached to the electronics unit stored in the probe’s top-weight. Offsets of the individual sensors to the PT100 were defined and subsequently applied to the raw temperature readings. In situ temperatures were calculated from the frictional decay of temperature of each sensor after the probe’s penetration into the sediments (typically considering a 7–8 min time-window). At several stations of expedition MSM34 and all of those from expedition M142, we used the probe to also measure in situ thermal conductivity. A defined heat-pulse of 20–30 s length was emitted after the probe’s penetration into the sediment and the temperature decay over another 7–8 min was used to calculate thermal conductivity, following standard procedures [34].
3.2. Estimation of Heat Flow from BSR Depth
Seismic data across the region of the Black Sea showed a typical seismic reflection referred to as BSR [10,18]. As the BSR is in principle an isotherm [33], it can be used to estimate thermal gradients and heat flow under the assumption that the BSR coincides with the base of gas hydrate stability. A pure methane system was assumed in the Danube deep-sea fan region as no evidence for the presence of other light hydrocarbons in significant amounts has been found to date [31]. Along seismic lines that cross the S1 and S2 channels, the depth of the BSR was converted to depth using an average velocity of 1600 m s−1 based on velocity data known from drilling [67] and previous seismic analyses [18,68]. The gas hydrate phase curve [69] was determined for an assumed pore water salinity of 3 PSU, corresponding to pore water salinities in Late Pleistocene sediment [62]. The predicted temperature at the depth of the BSR was combined with a constant seafloor temperature of 9 °C and an average thermal conductivity of 1.4 mW m−1 K−1 to estimate heat flow values.
3.3. Heat Flow Modeling
Using constraints of the bathymetry and general known temperature gradients in the region, we modeled the effect of the seafloor topography on the local heat flow regime across the S1 and S2 channel systems. The modeling incorporated a constant bottom-water temperature of 9 °C and an average sediment thermal conductivity estimated from porosity measured at the gravity-core and deeper drilling sites (MeBo-16 (GeoB22603-1), MeBo-17 (GeoB22605-1), and MeBo-19 (GeoB22620-1)). As thermal conductivity of pore water and methane hydrate is very similar (approximately 0.6 W m−1 K−1, [70]), the derived composite sediment thermal conductivity is nearly independent of variations in gas hydrate saturation across the study region. We used a steady-state 2D numerical model of the cross section of the channels to calculate the correction factors required to estimate undisturbed heat flow. All calculations were done with FlexPDE (available online: https://www.pdesolutions.com/, accessed on 1 June 2021).
3.4. Coring and Stratigraphy
Gravity coring was conducted during both expeditions to study the sedimentology and upper pore water geochemistry related to the observed slump-scars and gas flares. A Minicorer (MIC) was used during MSM34 only to supplement gravity coring. The MIC recovers the very soft and unconsolidated upper ~50 cmbsf, which is often disturbed or lost in parts in the GCs.
Typical procedure for the gravity cores was to cut the core into 1.0 m long sections after recovery of the coring system on deck. After transfer to the lab, each 1.0 m long section was then split lengthwise into an archive and a working half (from which sub-samples were taken for further analyses). Photographic imaging with an uncalibrated system was done manually in the main geo-laboratory during expedition MSM34 yielding images of varying color-scheme. Imaging during M142 was done with a Smart-CIS 1600 LS line scanning system [30]. Sediment porosity was determined from all cores taken during expedition M142 [30] following standard drilling operations introduced by the Ocean Drilling Program [71]. A plug of ~5 cm3 was taken at regular depth intervals and usually coupled with measurements for pore water salinity [67]. If visual core description showed major lithological changes, additional porosity samples were taken to reflect the change in sedimentology.
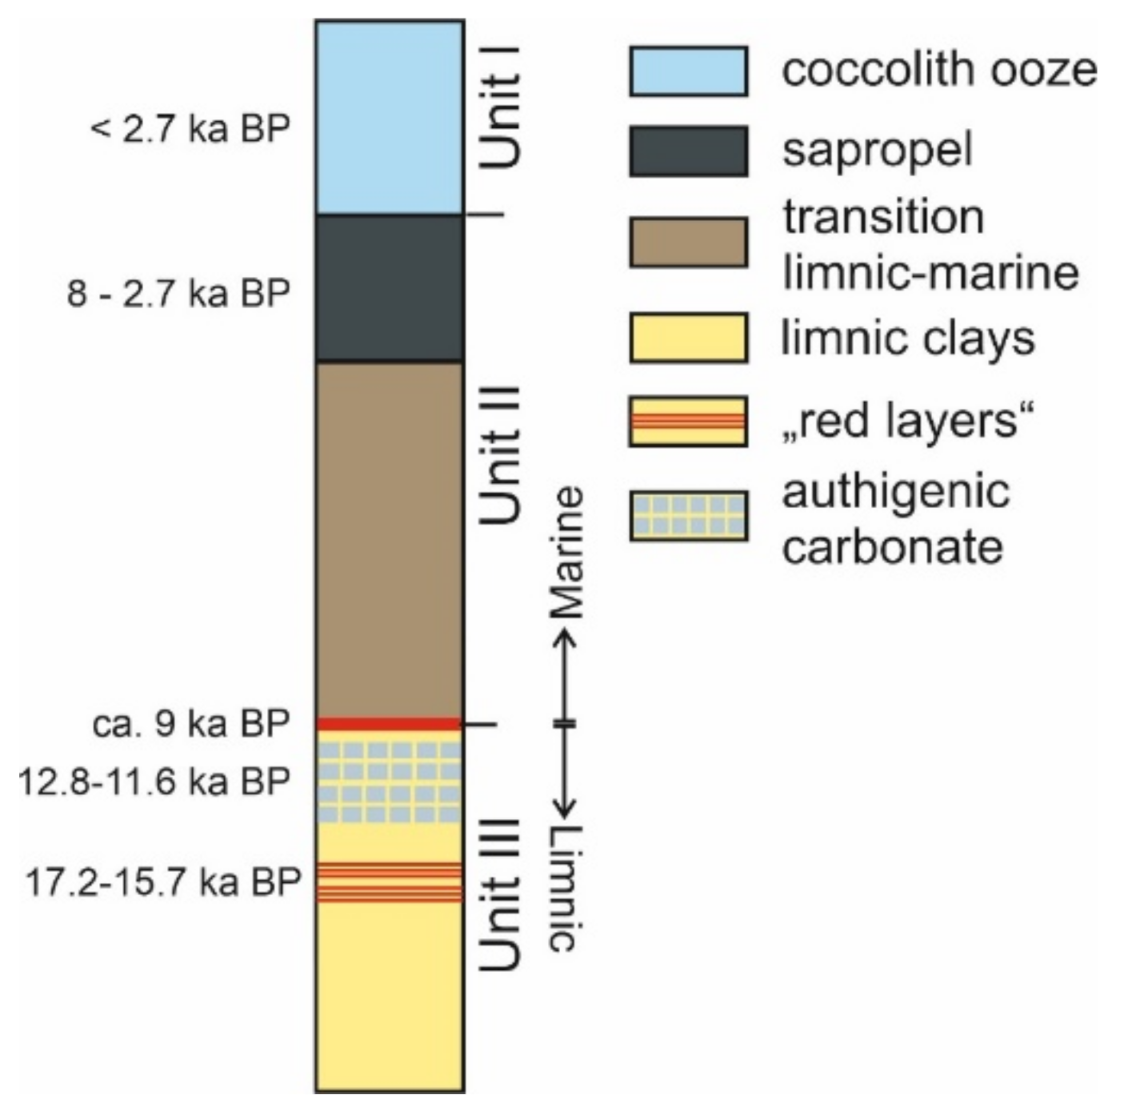
Stratigraphic units and approximate ages of the glacial and postglacial sediments seen within the upper 6–10 mbsf have been previously defined [72,73,74,75,76,77,78]. Here, we followed a simplified classification into three units (Figure 3): The deepest unit represents sediments from the last limnic phase of the Black Sea prior to ~9 ka BP. This unit consist of typically greenish-grey silty-clay and is characterized by the occurrence of several red layers that are dated to 15.7–17.2 ka BP [79]. These red layers have been correlated to meltwater pulses (Heinrich events) from the disintegrating Fennoscandian Ice Sheet [72]. Meltwater was transported by the Dniepr River into the Black Sea so that the thickness and prominence of these red layers decreases west-wards [79]. Two carbonate-rich layers (blueish-grey to dark grey clay) were deposited just prior to the reconnection of the Black Sea ‘Lake’ to the Mediterranean Sea at ca. 9 ka BP [77]. Sediments associated with the Younger Dryas appear in contrast somewhat darker grey [72].
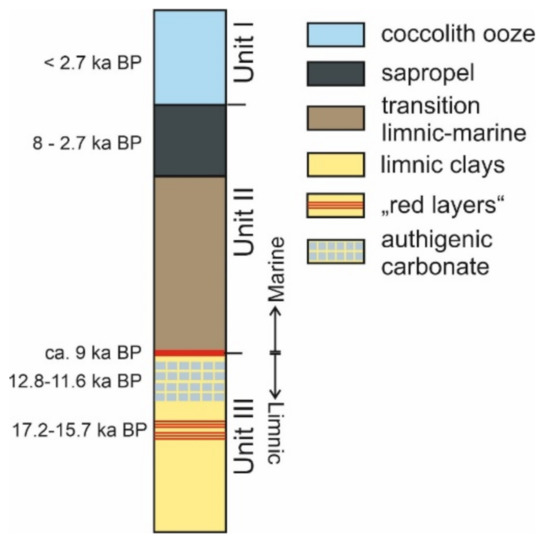
Figure 3.
Simplified stratigraphic classification of the main three glacial/postglacial sedimentary units and approximate ages seen within the upper 6–10 mbsf observed in the western Black Sea upper slope region [72,73,74,75,76,77,78]. Individual unit-thickness is drawn not to scale.
This change in the oceanographic setting also has a profound impact on the geochemistry of the sediments. Warmer sea water temperatures and increasing stratification of the water column favored the formation of sapropel [80] and an overall oxygen depletion [81]. Increasing biological productivity coupled with the preservation of organic matter under these euxinic conditions resulted in the deposition of greenish-black mud with high organic matter contents, called Unit II [82]. At ~2.7 ka BP [77], the first invasion of coccolithophorids marks the onset of Unit I and is identifiable by the carbonate-rich white lamination of the sediments [75]. The definition of these three main sedimentary units has also been corroborated with detailed XRF core scanning and 14C carbon-dating of molluscs and ostracods [72,83] and also applied at MARUM to three gravity cores taken during expedition M142. The marked changes in color and character of sediments associated with these units were used to assign depths of the unit boundaries for the cores recovered during expedition MSM34. Where applicable for cores from M142, we added the XRF-record as additional constraint.
3.5. PARASOUND Imaging
The PARASOUND echosounder system was installed on both vessels used to conduct expeditions MSM34 (R/V MARIA S. MERIAN) and M142 (R/V METEOR). Two acoustic waves with frequencies of 18−20 kHz (primary high frequency, PHF) and 22−24 kHz created by superposition a secondary high (40−42 kHz, SHF) and a secondary low-frequency (~4 kHz, SLF) pulse. The opening angle of the transducer was 4° by 5°, which corresponds to a footprint diameter of about 7% of the water depth. While the SLF was used for the sub-bottom profiling, the PHF can be used to image gas bubbles in the water column. In this study, we focused on the SLF data for sub-seafloor imaging. In general, the PARASOUND data showed penetration depths varying from 20 to ~100 mbsf. For image display purposes, we applied the instantaneous amplitude (envelope) attribute to the raw data. The PARASOUND data were used to describe the main sedimentary environments and potential presence of free gas in the subsurface, which was identified either from high-amplitude reflections (bright-spots) and/or from vertical acoustic masking (wipe-out) of the entire sedimentary column. Mass-transport deposits or channel mass flows were identified by the absence of coherent layering and their overall low-amplitude character in contrast to surrounding sedimentary structures.
3.6. Multibeam Data
A composite multibeam-based seafloor bathymetric map of the study region was created, combining data from several expeditions. The hull-mounted Kongsberg EM710 (1°/1° beam angle and 70−100 kHz operating frequency) multibeam echosounder (MBES) system was the primary acquisition system in water depths <600 m during expedition M142. In water depth of >600 m, a hull-mounted Kongsberg EM122 12 kHz MBES system was used (expedition MSM34: 2°/2° beam angle; expedition M142 and M143: 1°/2° beam angle). In both MBES systems, the maximum swath angle was set to 130°, running in equidistance mode for spacing the beams across the ship tracks. Survey speed during acquisition varied between 3 and 8 knots. Motion data and static offsets were recorded by the ship’s internal sensors and directly applied to the MBES data sets. To clean the data, we manually edited the data using the software MB-System [84]. The multibeam data from all surveys were corrected post-expedition to account for measured sound velocity profiles and corrected for tidal variations by using the Oregon State University Tidal Prediction Software OTPS (https://www.tpxo.net/otps, accessed on 1 June 2021). Finally, all data sets were merged into one composite depth map gridded with a 10 m by 10 m spacing.
4. Results
In total, 57 heat-probe measurements are available around the S2 channel and MeBo drill sites (Figure 2a) and 11 measurements across the S1 channel (Figure 2b). During the two expeditions MSM34 and M142, 18 gravity cores (GC) were taken at stations around the S2 channel and three cores were taken at the S1 channel. These are used to characterize the sedimentary environment penetrated by the heat-probe and provide additional physical properties (here porosity) in the upper 6 mbsf. These data are combined with deeper drilling data [67] to assign average values in porosity and thermal conductivity for modeling and BSR-depth conversion to heat flow.
4.1. General Sediment Description and Physical Properties
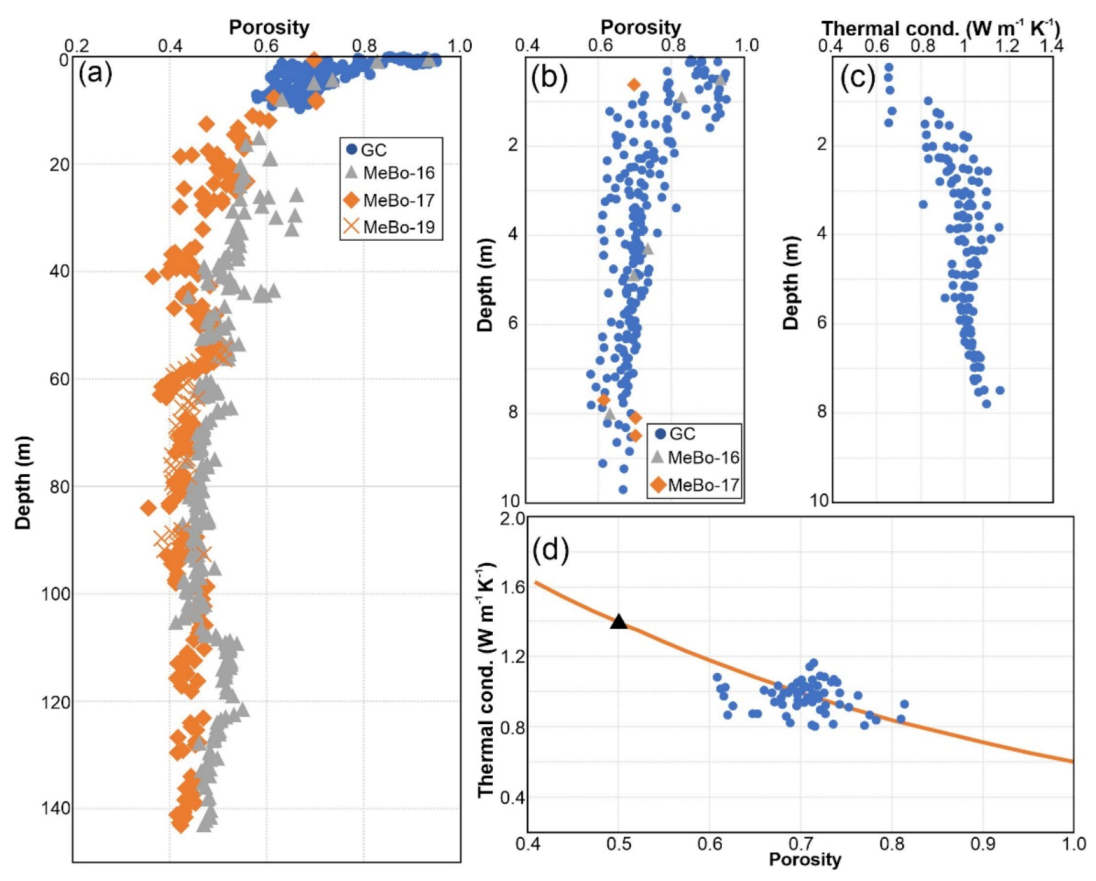
The upper 0–3 mbsf contains typically two distinct sediment layers with different types of sediment. The upper portion contains coccolith ooze (sedimentary Unit I) and sapropel (top of Unit II) (up to ~1 mbsf) showing low thermal conductivity values (0.6–0.9 Wm−1K−1) and high porosity (Figure 4). Below the sapropel layer, grey clay is deposited and thermal conductivity values increase slightly to ~1.0 Wm−1K−1. Below ~3 mbsf, grey clay with distinct red layers is found. The sediments below ~3 mbsf show average thermal conductivity values of 1.0–1.1 Wm−1K−1. Porosity shows a steady decline with depth below the sapropel layer to ~0.6 at 6 mbsf. The fast decline in porosity is emphasized when using the data from deeper drilling (Figure 4a). The exponential decline in porosity is seen up to 10 mbsf, below which, porosity only gradually decreases to the maximum drilling depth. Variations in the porosity trend and associated changes in sediment bulk density were correlated to larger stratigraphic units across the channel in a previous study [67]. An empirical relationship between thermal conductivity and porosity derived from our data is shown in Figure 4d. A theoretical relationship [85,86] between these parameters using a thermal conductivity of 0.6 Wm−1K−1 for pore water and 3.25 Wm−1K−1 for sediment grains fits the data below the sapropel-rich units reasonably well. On average, porosity is 0.5 for depths below 20 mbsf, which corresponds to a thermal conductivity value of 1.4 Wm−1K−1 using the theoretical relationship (black triangle in Figure 4d). This value is used in the thermal modeling of topographic effects on heat flow and to derive heat flow from BSR depths as outlined below.
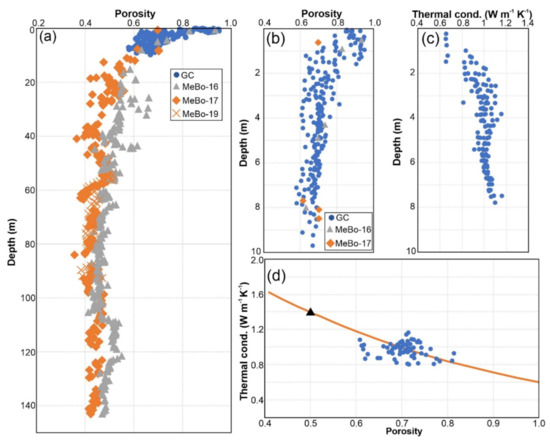
Figure 4.
(a) Porosity derived from MeBo200 and gravity coring (GC) at stations around the S2 channel (Figure 2a). On average, the porosity is ~0.5 across all depths. (b) Detailed view of porosity in the upper 10 mbsf. (c) Thermal conductivity derived at heat-probe stations with coincident gravity cores. (d) Cross-plot of thermal conductivity and porosity from coincident heat-probe and GC stations (blue) with theoretical trend (orange) using a thermal conductivity of 0.6 Wm−1K−1 for pore water and 3.25 Wm−1K−1 for sediment grains. An assumed porosity of 0.5 corresponds to a thermal conductivity of 1.4 Wm−1K−1 (shown as black triangle).
4.2. S1 Channel
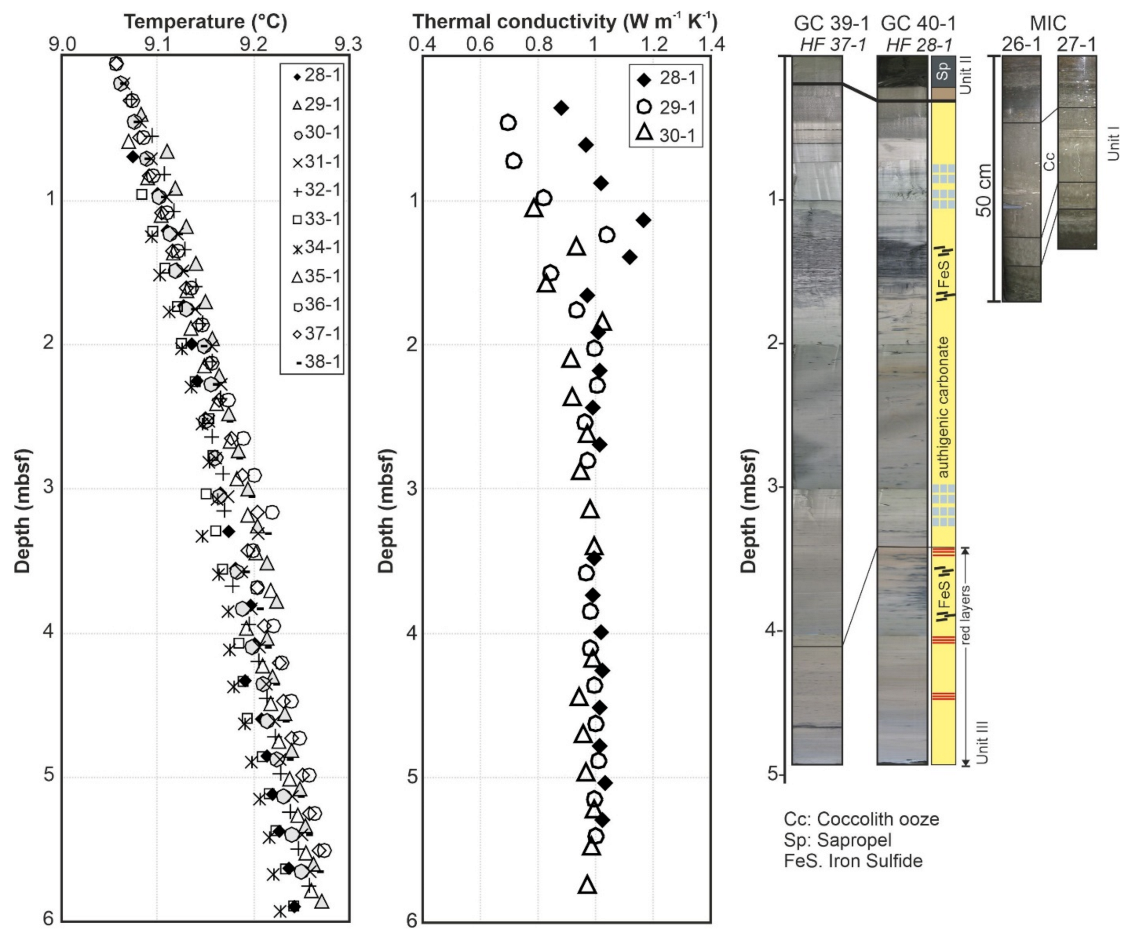
At the S1 channel, heat-probe data were acquired along one primary seismic line (P1107; see Figure 2b for location and orientation) across the main channel incision upslope onto the eastern levee. The highest heat flow above 35 mW m−2 is seen in the channel talweg (Figure 2b). The other values are on average around 30 mW m−2. Sediments recovered at two stations along this profile show the main sedimentary units expected (Figure 5). The uppermost coccolith-rich Unit I was only recovered with the MIC and was lost in the both gravity cores. The upper red-layers marking Heinrich event HS1, which has been attributed to an age of ~16 ka [72,83], is faintly visible in the core images (Figure 5). Using this time-marker, approximate sedimentation rates can be calculated for both core stations. At GC 40-1 located on the eastern levee, the red layer is at ~380 cm bsf (including the missing Unit I), which corresponds to an average sedimentation rate of 0.25 m ka−1. At GC 39-1 within the central channel talweg, the same red layer is seen at ~460 cm bsf (again, adding the missing Unit I from the MIC). This relates to a sedimentation rate of ~0.3 m ka−1.
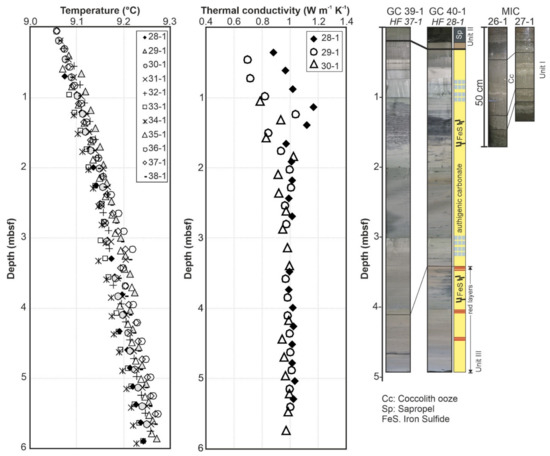
Figure 5.
Results from heat flow measurements and coring at the S1 channel (location see Figure 2b). Shown are from left to right: temperature data and thermal conductivity, as well as gravity core (GC) images with lithological units and Minicorer (MIC) images of the upper 50 cm, lost in the GCs.
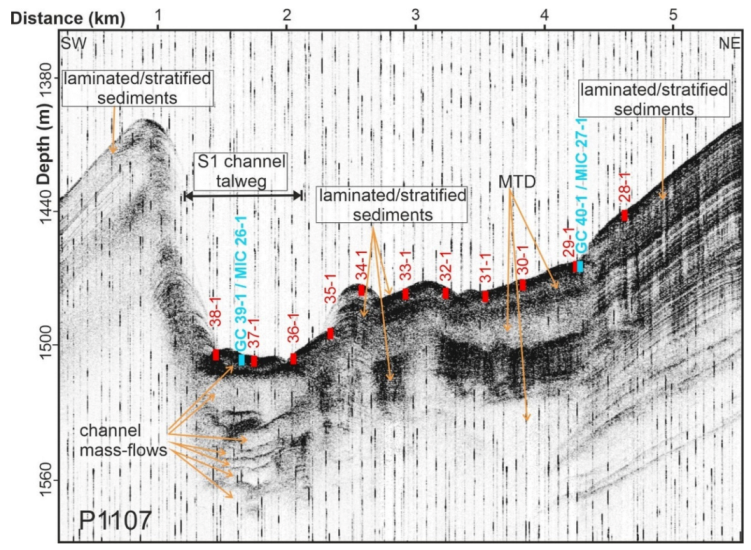
The PARASOUND data acquired along the profile show an average penetration of 60 mbsf (Figure 6). A distinct change in sediment structure from the channel incision towards the eastern levee is seen. The main channel incision is characterized by a stack of eight mass flow deposits and a thin uppermost veneer of ~4 mbsf of stratified sediments. Below this veneer, only mass-flows and no further stratified intervals are seen within the penetration limit of the data. West of the channel, the levee shows regularly stratified sediments. The portion of the profile P1107 between 2.2 and 4.2 km distance along the line shows two MTDs (separated by a stratified unit) above a deeper section of stratified sediments. An abrupt change in this pattern is seen at a distance of 4.2 km along the line: further eastward along the line (approximately at the GC station 40-1) no MTDs are identifiable in the record and a well stratified reflection pattern is seen. The prominent failure scarps at the eastern edge of the S1 levee (Figure 2b) correlate to these buried MTDs.
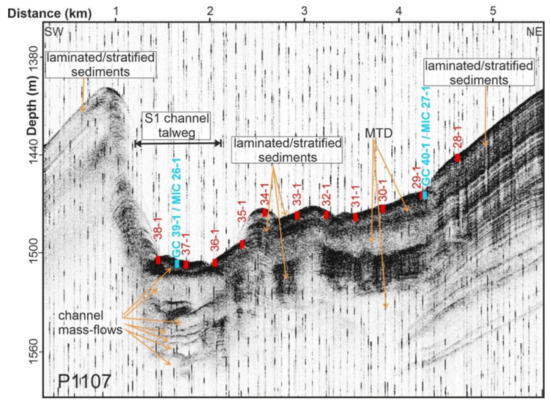
Figure 6.
PARASOUND sub-bottom profiler data at the S1 channel and superimposed location of heat-probe (red), gravity (GC), and Minicorer (MIC) stations (cyan). Up to eight mass-flow packages are seen in the main channel incision. East of the channel talweg, two MTDs overlie stratified sediments. East of the GC 40-1 station (distance of 4.2 km along the line) a change in reflection pattern is seen towards more uniformly stratified sediments.
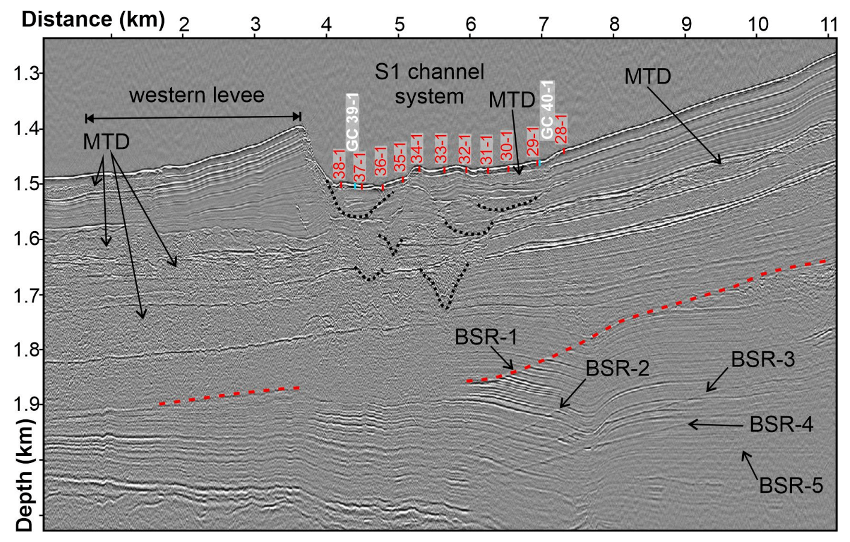
Along this profile P1107, the seismic data reveal a BSR (here referred to as BSR-1) along most of the line (Figure 7). Below the BSR-1, up to four additional reflections similar in character to the uppermost BSR-1 are imaged [9,18]. The data also show that the S1 channel had been meandering through time forming several laterally shifting incisions (marked with dotted lines on Figure 7) between line-distance 4–7 km. Below the western levee of the S1 channel consisting of stratified sediment layers, a stack of several thick MTDs are seen extending further to the West.
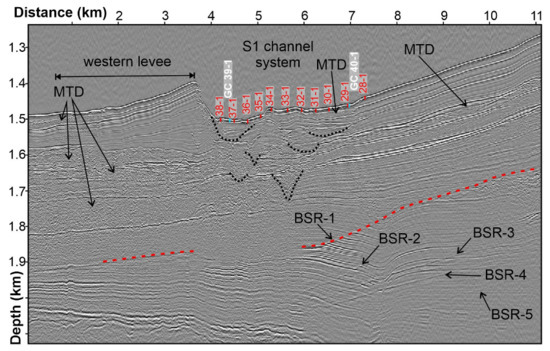
Figure 7.
Seismic data of P1107 across the S1 channel system (coincident to PARASOUND data of Figure 6). Several mass transport deposits (MTD) are marked. Paleochannel incisions are indicated by black dotted lines. Five bottom-simulating reflectors (named BSR-1 to BSR-5) are identified with the uppermost reflection highlighted with a red-dashed line. Location of heat-probe stations (red) and gravity core (GC) stations (cyan) are also marked.
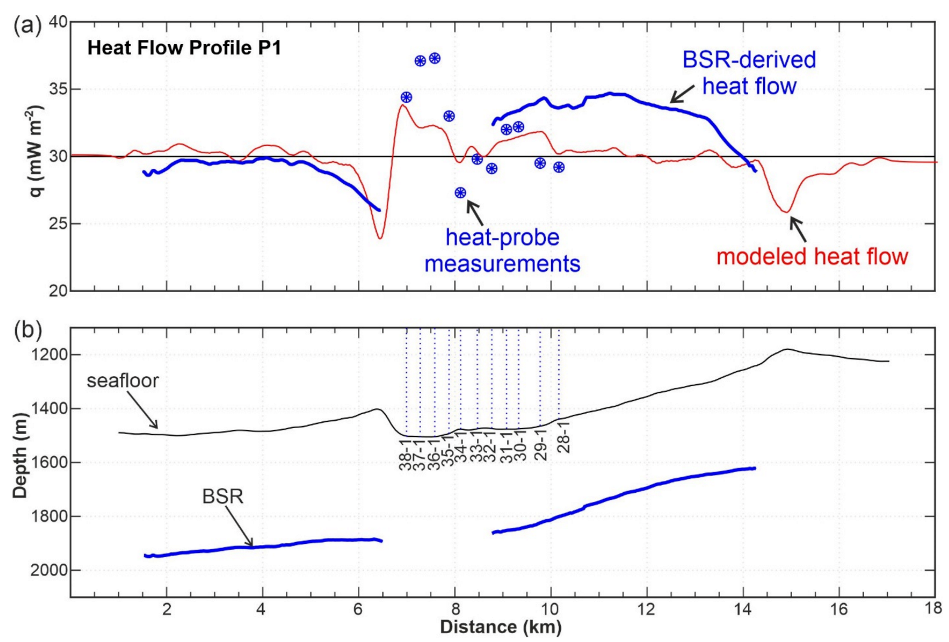
Assuming that the uppermost BSR-1 marks the current base of the GHSZ, the depth of the BSR below seafloor was converted to heat flow (Figure 8). The heat flow trend from the BSR as well as the heat-probe measurements overall correlate well with the predicted heat flow of average 30 mW m−2 which includes effects from topography. However, a pronounced higher value in BSR-derived heat flow is estimated along the eastern levee where the multichannel seismic (MCS) data indicate a lack of MTDs but revealed rather uniformly stratified sediments.
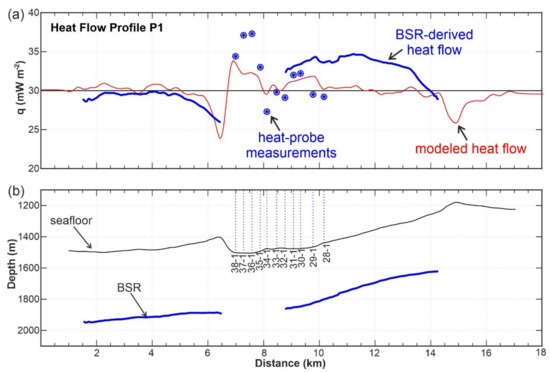
Figure 8.
(a) Modeled heat flow along profile P1 across S1 channel with heat-probe measurements and BSR-derived values for comparison. The black solid line is the assumed heat flow at the bottom of the model. (b) Topography of the profile (black) and depth of BSR (blue) along line P1107.
4.3. S2 Channel
4.3.1. Eastern Levee
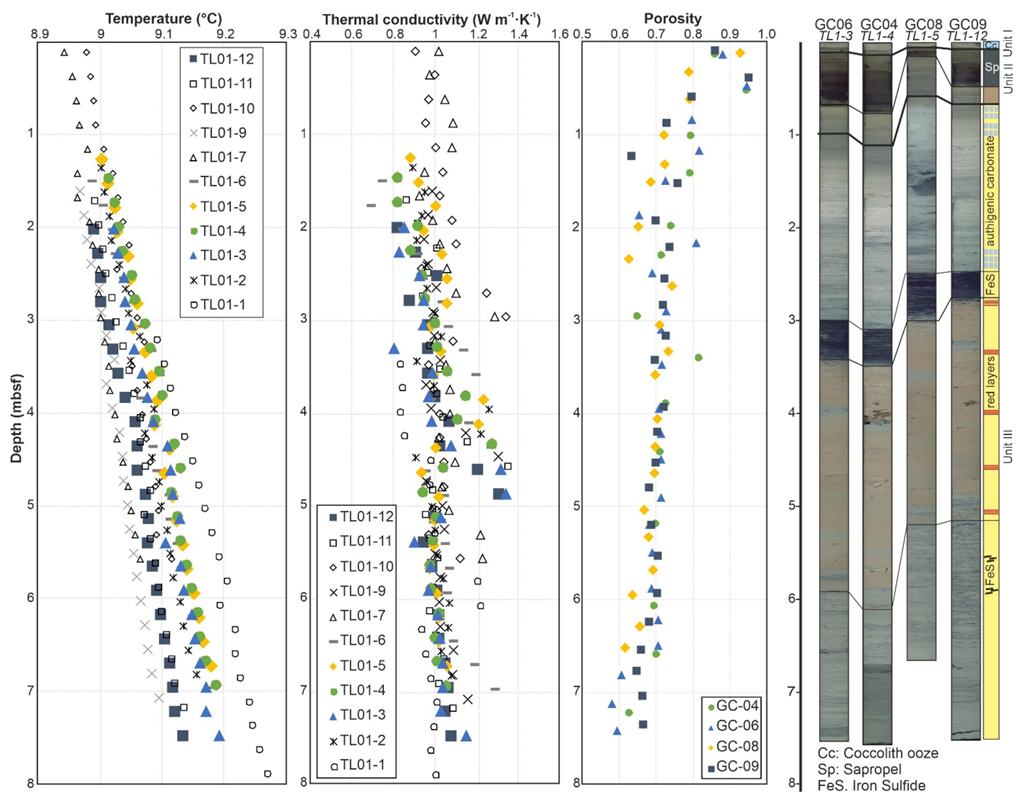
Across the eastern levee of the S2 channel and across drill site MeBo-16 (GeoB22603-1), a heat-probe sequence (TL01) consisting of 12 measurements was completed (Figure 2a). TL01-01 within the floor of the S2 channel shows the highest heat flow of all stations measured along this profile, with a value of ~37 mW m−2. However, the thermal gradient measured at TL01-01 is offset by up to 0.1 °C relative to the other measurements at equivalent depths. This may indicate that the probe over-penetrated significantly. Heat flow at stations TL01-02 to TL01-06 lies above the average value of ~25 mWm−2. Further east along the profile, heat flow is decreased to below the average value.
Gravity cores recovered along this profile show the expected set of three sediment units with clearly identifiable red layers marking the Heinrich events (Figure 9). No MIC have been taken along this profile but all gravity cores showed some coccoliths-rich sediments of Unit I, so sediment loss (as seen along the S1 channel) may be small. Converting the depth of the uppermost red layer (HS 1, 16 ka age; [72,83]) to sedimentation rates yields values ranging from ~0.21 m ka−1 at stations GC06 and GC04 to a slightly lower value of 0.19 m ka−1 at GC08 and 0.17 m ka−1 at GC09. The four long sediment cores show the decline in porosity with depth although values are more scattered in the upper 3 mbsf, above the onset of the red layers. Accordingly, thermal conductivity values are lower in the upper 3 mbsf (and also more scattered) than at greater depth.
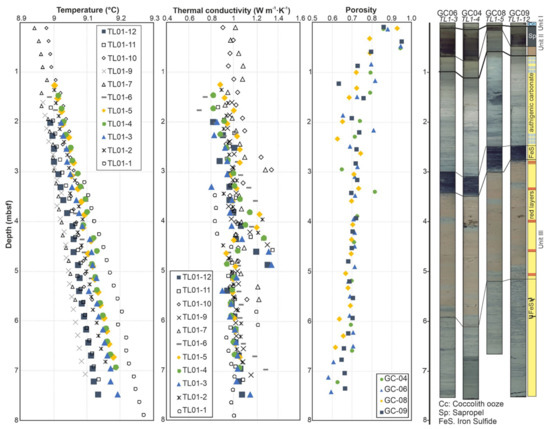
Figure 9.
Results from heat flow measurements at the eastern levee of the S2 channel (location see Figure 2a), TL01 deployment sequence. Shown are from left to right: temperature thermal conductivity, and porosity, as well as core images and lithological units. Thermal conductivity profiles coincident to gravity cores are shown with colored lines. Station TL01-01 is within the channel talweg and shows much higher absolute temperature values.
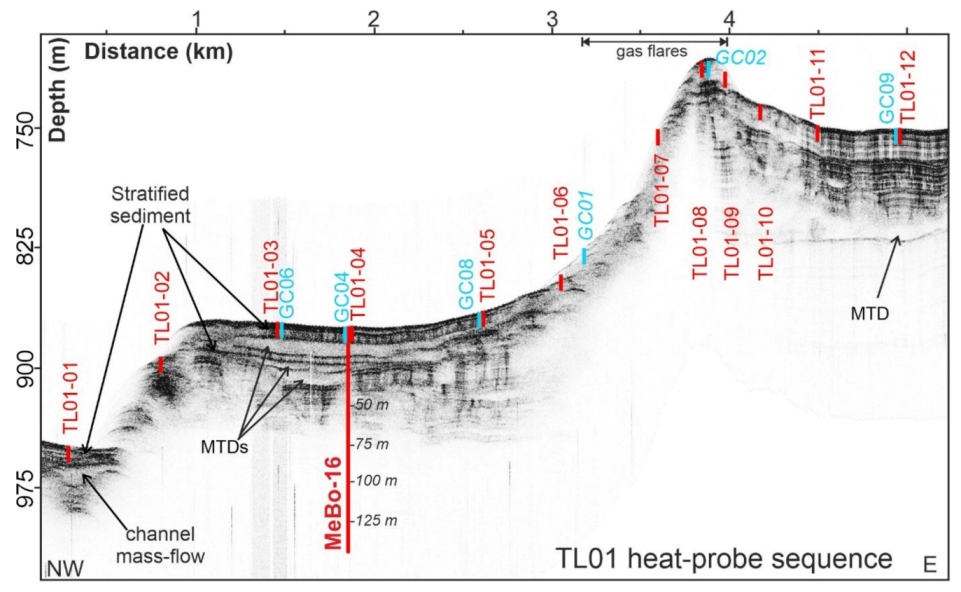
The PARASOUND data along the heat-probe stations of the TL01 sequence (Figure 10) show that within the channel incision at heat flow station TL01-01, up to 14 m of laminated sediments overlie the first recognizable channel mass-flow. This is more than three times the thickness recognized at the S1 channel. Up on the eastern levee, abundant MTDs interrupt intervals of laminated sediments. PARASOUND imaging is reduced due to the steep slope between stations TL01-05 and TL01-08. East of the ridge, up to 50 m thick stratified sediments overlie a prominent MTD.
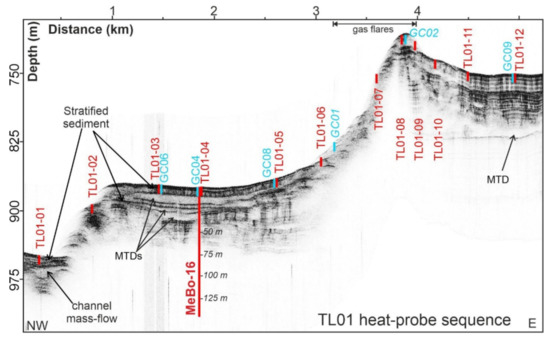
Figure 10.
PARASOUND profile along heat-probe stations of TL01 deployment sequence at eastern levee of the S2 channel. Location of profile see Figure 2a. Shown are heat-probe (red) and gravity core (GC) stations (cyan), as well as the MeBo-16 drill site. Abundant gas flares were seen around station TL01-07 [17]. At stations GC01 and GC02, gas hydrate was recovered (stations are slightly off this profile).
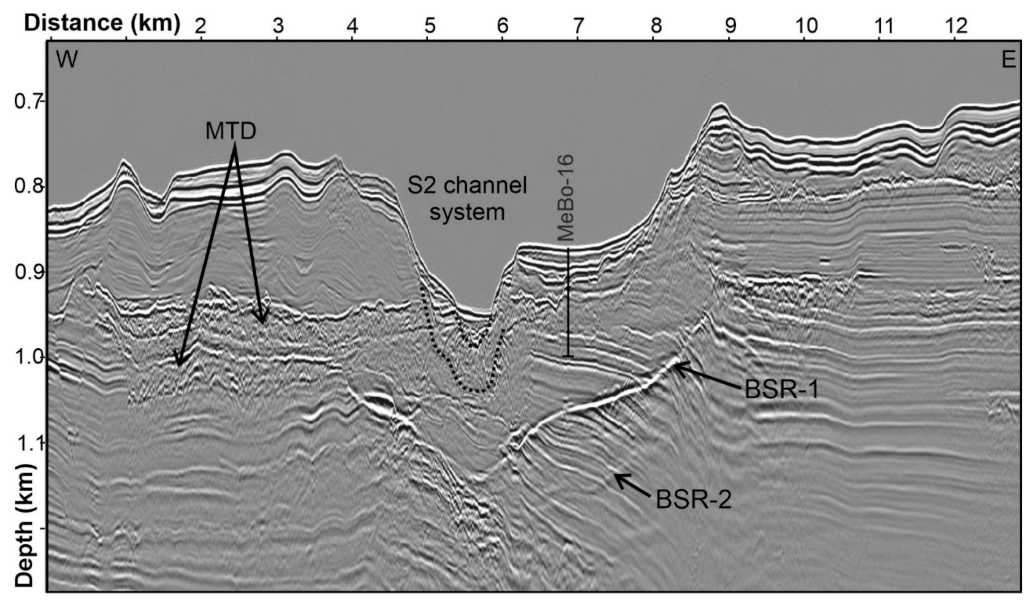
The seismic data (Line 897-03 from expedition MSM34 [11]; Figure 11) along the heat-probe profile show a prominent strong BSR with one lower-lying second BSR (BSR-2). The BSR reflections are nearly lost below the channel and further to the western levee of the channel. Similar to the setting at the S1 channel, the western levee deposits are underlain by at least two thick MTDs. At this location of the profile crossing the S2 channel, no meandering of the channel talweg is identified.
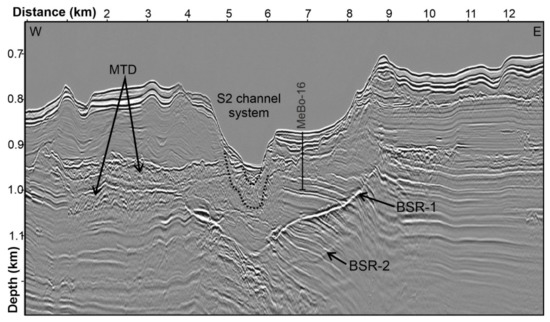
Figure 11.
MCS data across S2 channel system (line 897-03). Mass transport deposits (MTD) are marked. Paleochannel incisions are indicated by black dotted lines. Two bottom-simulating reflectors (BSR-1 and BSR-2) are identified in this section as well as drill site MeBo-16 (GeoB22603-1).
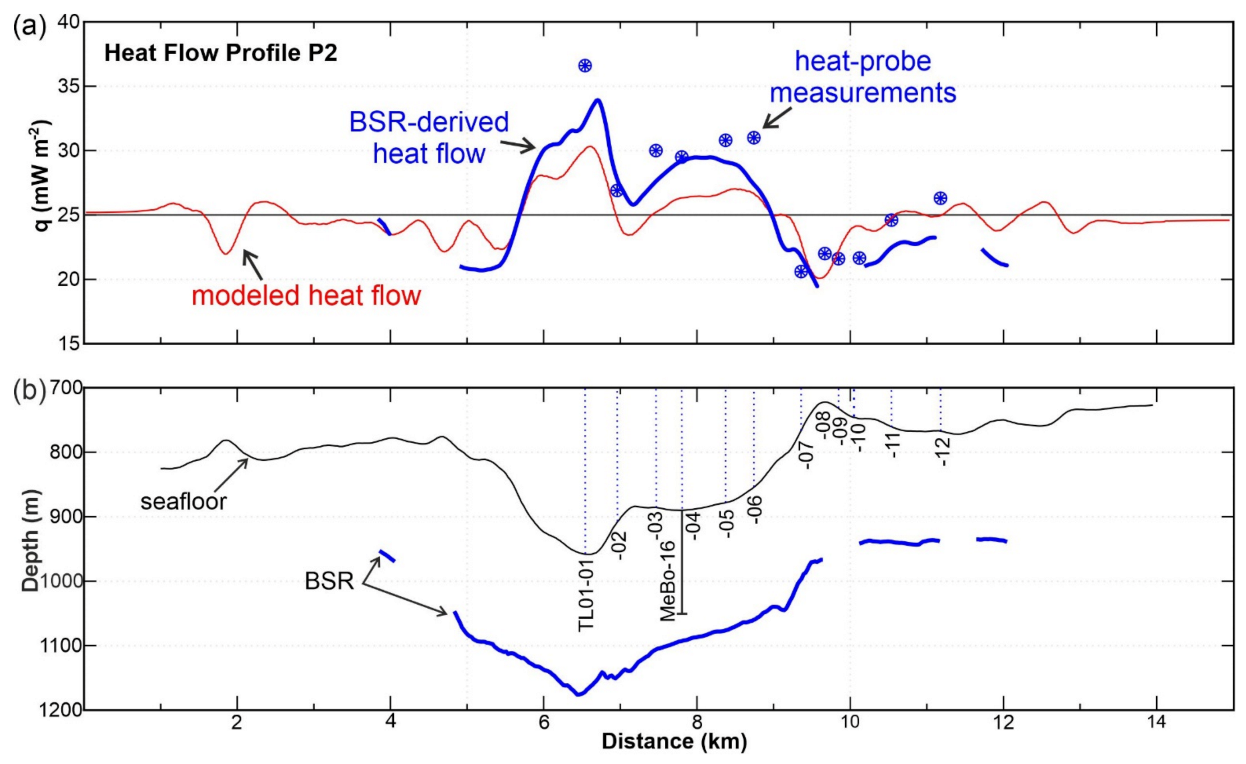
A heat flow model along the profile of line 897-03 predicts an average heat flow of 25 mW m−2 (Figure 12) and topography induced variations. In general, measured and predicted seafloor heat flow agree very well. The channel incision (and associated levee flanks) result in a sinusoidal pattern in heat flow (between 6–8 km along the profile), whereas the ridge at the eastern portion of the profile (at a distance of ~9.5 km) results in a depression in heat flow. Results from the heat-probe measurements and BSR-derived heat flow mimic the same pattern as predicted but are systematically higher than the modeled heat flow data between 6–9 km along profile.
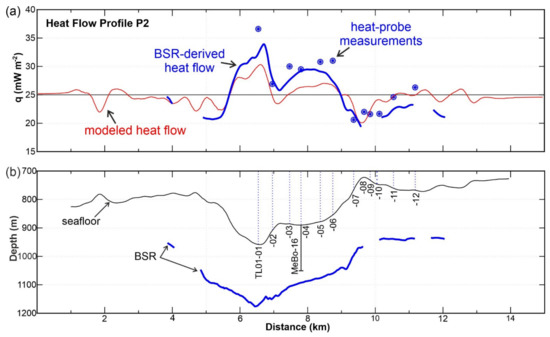
Figure 12.
(a) Modeled heat flow (red line) along profile P2 across S2 channel with TL01 deployment sequence (blue symbols) and BSR-derived heat flow (blue line) along MCS Line 897-03. The black solid line is the assumed heat flow at the bottom of the model. (b) Topography of the profile P2 (black) and depth of the BSR (blue).
4.3.2. Slope-Failure Region Near S2 Channel
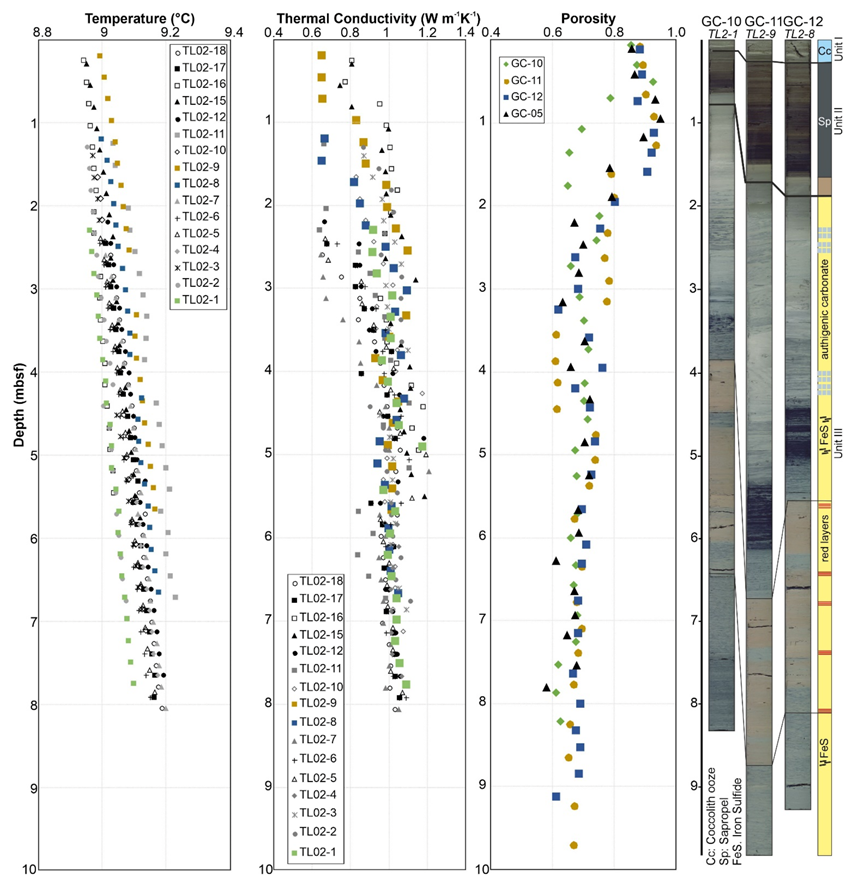
A prominent slope failure depression (a horse-shoe-shaped region) is seen along the western levee of the S2 channel (Figure 2a). Along the failure scarps, abundant gas flares were identified in water-column acoustic data [13,17]. Heat flow values along sequence TL02 during expedition M142 show no significant change across the failure plane and head scarp (Figure 2a) and temperature gradients (Figure 13) are very similar between stations. No effect from the steep step at the northern edge of the scarp near Station TL02-01 on the heat flow value is also identifiable. The highest heat flow values (~35 mW m−2) are seen at stations TL02-13 and TL02-14 at the flank and S2 channel floor. Along the eastern slope failure scarp, heat flow values are also elevated, but scattered with no consistent trend or link to the topographic feature.
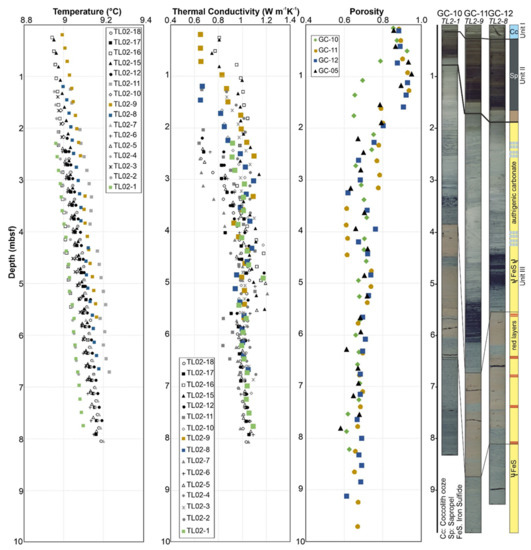
Figure 13.
Results from heat flow measurements at the western levee of the S2 channel along profile of the TL02 sequence (location see Figure 2a). Shown are from left to right: temperature, thermal conductivity, and porosity, as well as core images and lithological units.
Three gravity cores were taken along the profile (GC10–GC12, Figure 13) and show the sedimentary Units I–III. No evidence for a slump deposits or erosional unconformity is identified in the interval cored. Again, no shallow MIC data are available to define blow-by or sediment loss for the gravity cores. At all three stations, some sediment of Unit I was recovered and sediment loss is likely minimal. Thus, using the shallowest red layer again as proxy for the HS1 event at 16 ka ago [72,73,74,75,76,77,78,79,80,81,82,83], sedimentation rates are ~0.25 m ka−1 (GC10), ~0.42 m ka−1 (GC 11), and ~0.36 m ka−1 (GC12) and thus nearly twice as high compared to the rates seen on the eastern levee along TL01 sequence.
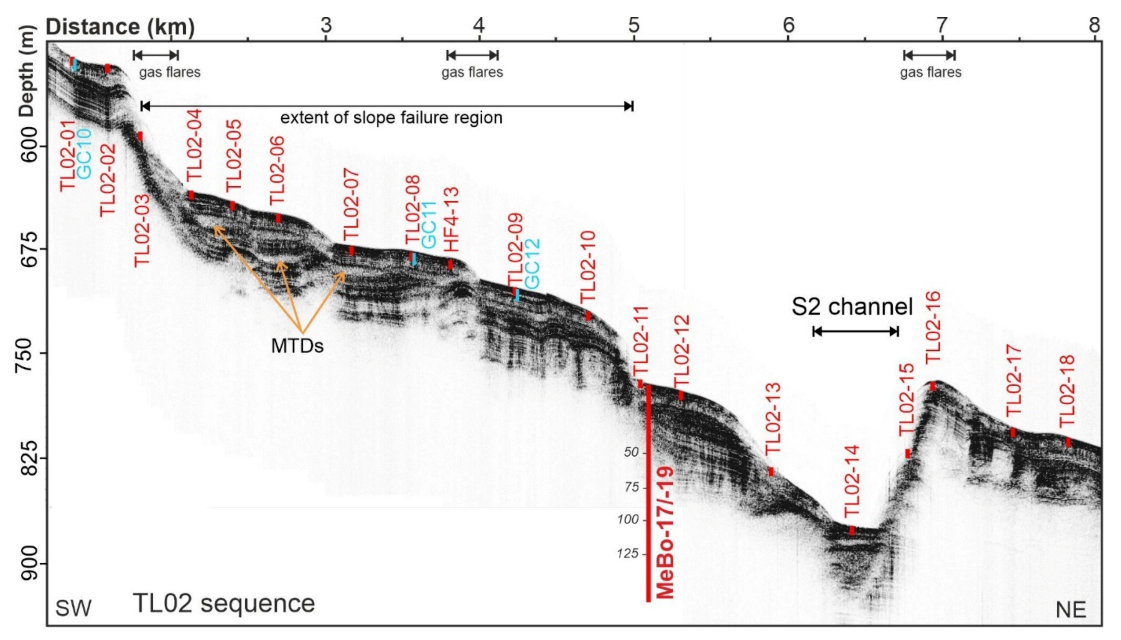
The PARASOUND data acquired along the TL02 sequence (Figure 14) reveal an upper veneer of layered sediment with a thickness of ~14 m thickness above the first detectable MTD. This veneer of sediments is also seen in the channel floor itself (at Station TL02-14) and on top of the eastern levee. Underneath the veneer, alternating intervals of MTD and layered sediments are seen up to the maximum penetration depth of the PARASOUND data (~70 mbsf).
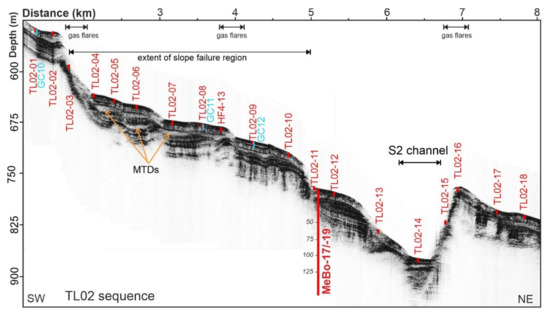
Figure 14.
PARASOUND data along the TL02 heat-probe deployment sequence (red). Also shown are the gravity core (GC) stations (cyan). Location of the joint drill sites MeBo-17 (GeoB22605-1) and MeBo-19 (GeoB22620-1) are projected onto this line (distance to line ~340 m).
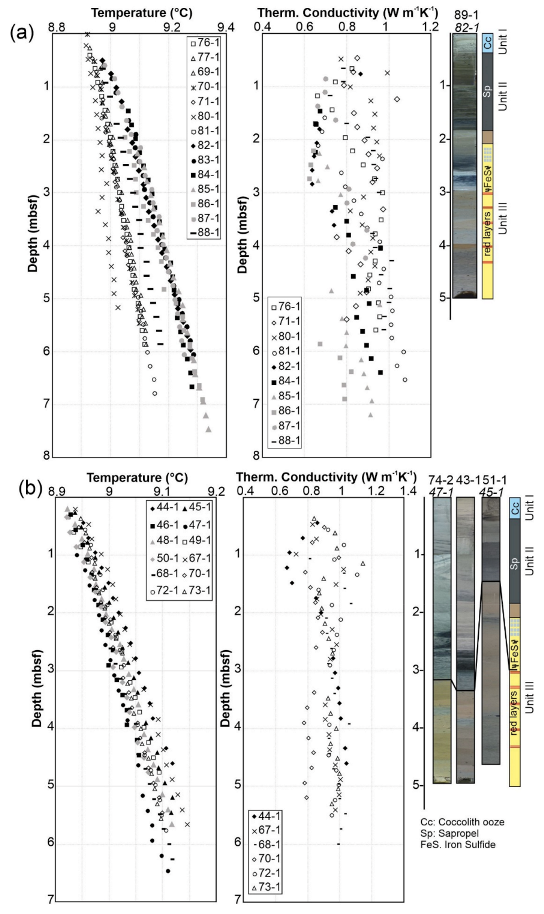
We also acquired a set of heat-probe stations and gravity cores during expedition MSM34 along the eastern edge of the slope failure region and gas vents as well as the crossing of the S2 channel (Figure 15). The heat flow values at the scarp region are scattered and vary from as low as 18 mW m−2 (Station 80-1 on top of a small ridge) to 35.5 mW m−2 (Station 49-1). Within the S2 channel, all stations show heat flow values >35 mW m−2. However, the temperature profiles at the stations within the channel floor all show much higher absolute values than at any other station (Figure 15). This may indicate that the probe again over-penetrated, by probably up to 2 m. Gravity cores taken at the edge of the slope failure did not recover sediment of Unit I although these sediments were recovered in the coincident MIC with thicknesses of 40–50 cm. Due to the apparent and unspecified sediment loss, we did not estimate sedimentation rates for these stations.
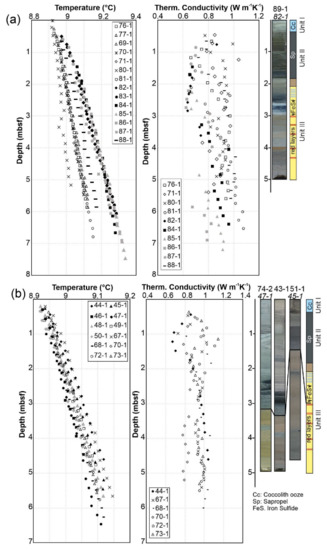
Figure 15.
Results from heat flow measurements at (a) the eastern edge of the horse-shoe-shaped slump-feature (along profile shown in Figure 16a) and (b) crossing of the S2 channel (along profile shown in Figure 16b). Shown are from left to right: temperature and thermal conductivity, as well as core images and lithological units.
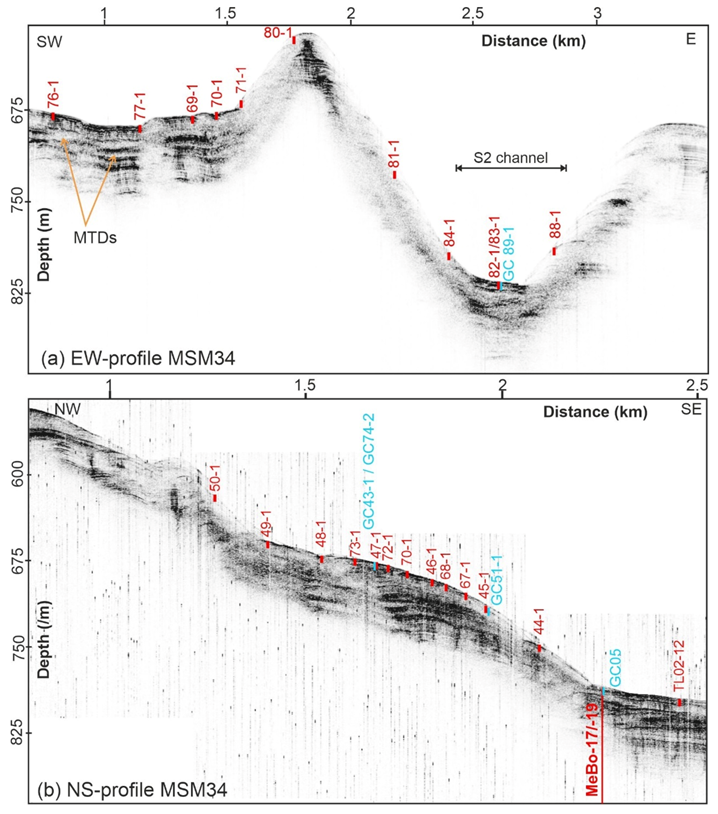
PARASOUND imaging at the edge of the slope failure and across the channel incision (Figure 16) is much reduced, but the same sedimentary environment as seen elsewhere is still discernible with the veneer of sediments over an interval consisting of alternating MTDs and layered sediment.
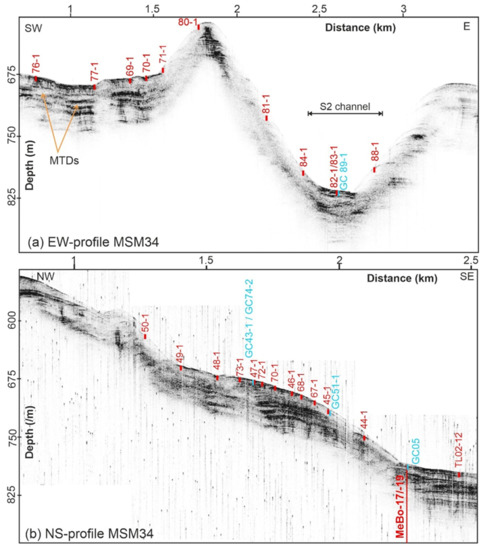
Figure 16.
PARASOUND data (a) across the northern portion of the S2 channel and (b) along the eastern edge of the slope failure (location see Figure 2a). Location of heat-probe (red) and gravity core (cyan) stations are indicated together with the drill sites MeBo-17 (GeoB22605-1) and MeBo-19 (GeoB22620-1).
5. Discussion
The complex history of the Black Sea with changing environmental conditions during glacial and interglacial periods provide significant challenges in assessing the physical bounds of the gas hydrate regime. As shown in previous studies [18,21,32], different stages in the Black Sea evolution with changing bottom-water temperatures, varying sea levels, and ocean and porewater salinities resulted in drastically different extents of the GHSZ. Since the LGM, sea level has risen by at least 100 m [49], bottom-water temperatures increased from 4 to ~9 °C in water depths >400 m [27,83] and influx of ocean water from the Mediterranean resulted in an increase of salinity to currently ~22 PSU. These effects have also a pronounced impact on the temperature regime within the subsurface. The increase in bottom-water temperatures from 4 to 9 °C starting around 9–10 ka ago resulted in a decrease in thermal gradients within the upper 300 mbsf by up to 10 °C km−1 [18,32]. According to these models, thermal gradients are rebounding gradually since the last ~3 ka to the imposed average (undisturbed) thermal gradient.
Measurements with the heat-probe (often to only 6 mbsf) can thus still be affected by these changes and can additionally be modified from effects of fast sedimentation or erosion and slumping [87,88]. While the uppermost sediments are possibly still adjusting to the most recent temperature and salinity variations, the deeper sediment environment at depth of the base of gas hydrate stability may still be untouched and thus may reflect former (and older) stable climate conditions, as shown by modeling of the stack of up to five BSRs [18]. As indicated by deep drilling and in situ temperature measurements at the drill site MeBo-17 (GeoB22605-1), the current base of the GHSZ may no longer coincide with the seismically imaged BSR [17,32]. Thus, using the BSR as a proxy for heat flow may also be erroneous in some parts of the Black Sea. Measurements with a shallow heat-robe thus have to be carefully interpreted to be used as indicator for the thermal regime in the subsurface and to predict the base of gas hydrate stability.
5.1. What Is the Effect of Topography on Heat Flow Especially inside the Channel Incision?
Topographic variations have a significant impact on surface heat flow [89]. Focusing in depressions and defocusing at elevated ridges result in higher or lower heat flow values, respectively, compared to the regional average heat flow. Our modeling along two representative profiles across the S1 and S2 channels (Figure 8 and Figure 12) shows that topographic changes result in an increase or decrease in heat flow of up to 5 mW m−2, which is nearly 20% of the regional heat flow (Figure 8 and Figure 12). Even using a constant value in thermal conductivity of 1.4 Wm−1K−1 results in the expected trends from topographic variations in the BSR-derived heat flow values. However, topography alone appears to be insufficient to explain the discrepancies between the model and measurements with the heat-probe showing much-increased heat flow values within the channel talweg.
5.2. Can Recent Sedimentation or Erosion Explain the Mismatch between Model and Data?
We see no evidence in the PARASOUND data that recent influx of sediment through the channel in form of a mass flow or turbidity currents has increased sedimentation rates. Actually, a higher recent influx of sediment in the channels would depress the heat flow; yet, the opposite is seen. The PARASOUND data also show a significant sediment stratification inside the channel floor above the first recognizable acoustically transparent units, which we interpret as mass-flows. Coring also recovered all main sedimentary units down to the red layers indicative for HS1 sedimentation. If the uppermost Unit I was missing in gravity cores, the co-located MICs did recover the coccolith-rich upper Unit I. The uppermost red layer is identified in all cores and by using XRF scanning, this was correlated to HS1 (Niederbockstruck, pers. communication) seen in other cores that were also age-dated using other techniques [72,83]. Thus, an average sedimentation rate for the post-glacial period (16 ka to today) was calculated. Sedimentation rates at the channel floors are very similar between core stations and between the S1 and S2 channel. The lowest sedimentation rates are seen along the eastern levee of the S2 channel (<0.2 m ka−1) but are not resulting in comparably lower heat flow values relative to the average value and expected trend from topography (Figure 12).
A different explanation for the apparently high values from the heat-probe could be an apparent overpenetration of the probe at stations within the channel floor. The thermal gradients are slightly higher at greater depth compared to near the seafloor and with no significant change in thermal conductivity (Figure 4), higher heat flow values are estimated. A question arises, why the probe over-penetrated only at stations inside the channel floor. This happened during both expeditions (MSM34 and M142), so we can exclude improper tool-handling during either one of the experiments. Are the sediments inside the channel softer and less consolidated than elsewhere? If this were true, this could then only be explained by the presence of a much thicker uppermost Unit I consisting of the coccolith-rich sediments and water-rich sapropel possessing higher porosity and lower density and thus less resistance to the probe-penetration. The clay deposited below the sapropel was always recovered in all cores and showed very similar porosity values (Figure 5, Figure 9, Figure 13, and Figure 15). This would then imply a potential higher sedimentation rate inside the channels and a theoretical depression of the heat flow. Some evidence for a much thicker Unit I inside the channel floor comes from expedition M142 and MeBo200 drilling. Attempts to land the MeBo200 drill rig during expedition M142 inside the channel floor failed numerous times as the rig could not be properly landed in a stable manner and the rig sank too deep into the sediments so that no clear visual observation of the bottom-hole assembly plate was possible [30]. At the other stations on the levees, the rig did not sink that deep into the sediments, indicating a less thick deposit of uppermost soft flocculate sediment layer [30].
5.3. BSR-Depth Variations, Base of Gas Hydrate Stability
The BSR depth is often used as proxy for heat flow under the assumption that the BSR coincides with the base of the GHSZ [34,40,41]. Within the Black Sea, this is not necessarily the case as shown by numerical modeling [17,21,32]. These studies indicate that the BSR just marks an onset of free gas (and associated acoustic impedance reversal), but the current base of the GHSZ is much shallower by ~20–30 m. These analyses focus on the upper edge of the gas hydrate zone in the Danube deep-sea fan and water depths <900 m. No drilling data are available for the critical depths near the BSRs in deeper water.
If the BSR forms the current base of the GHSZ, then the depth of the BSR below seafloor may show some regional characteristic patterns indicative of regional-scale depositional or erosional events as well as long-lived topographic effects. We like to note that the sedimentation rates for the past 16 ka following the LGM and influx of saline water are overall small and the cumulative sediment cover deposited since the LGM may be on average <6 m. With BSR depths seen across the area reaching up to 450 mbsf or more, this small additional burial depth has little to no effect on the BSR-derived heat flow.
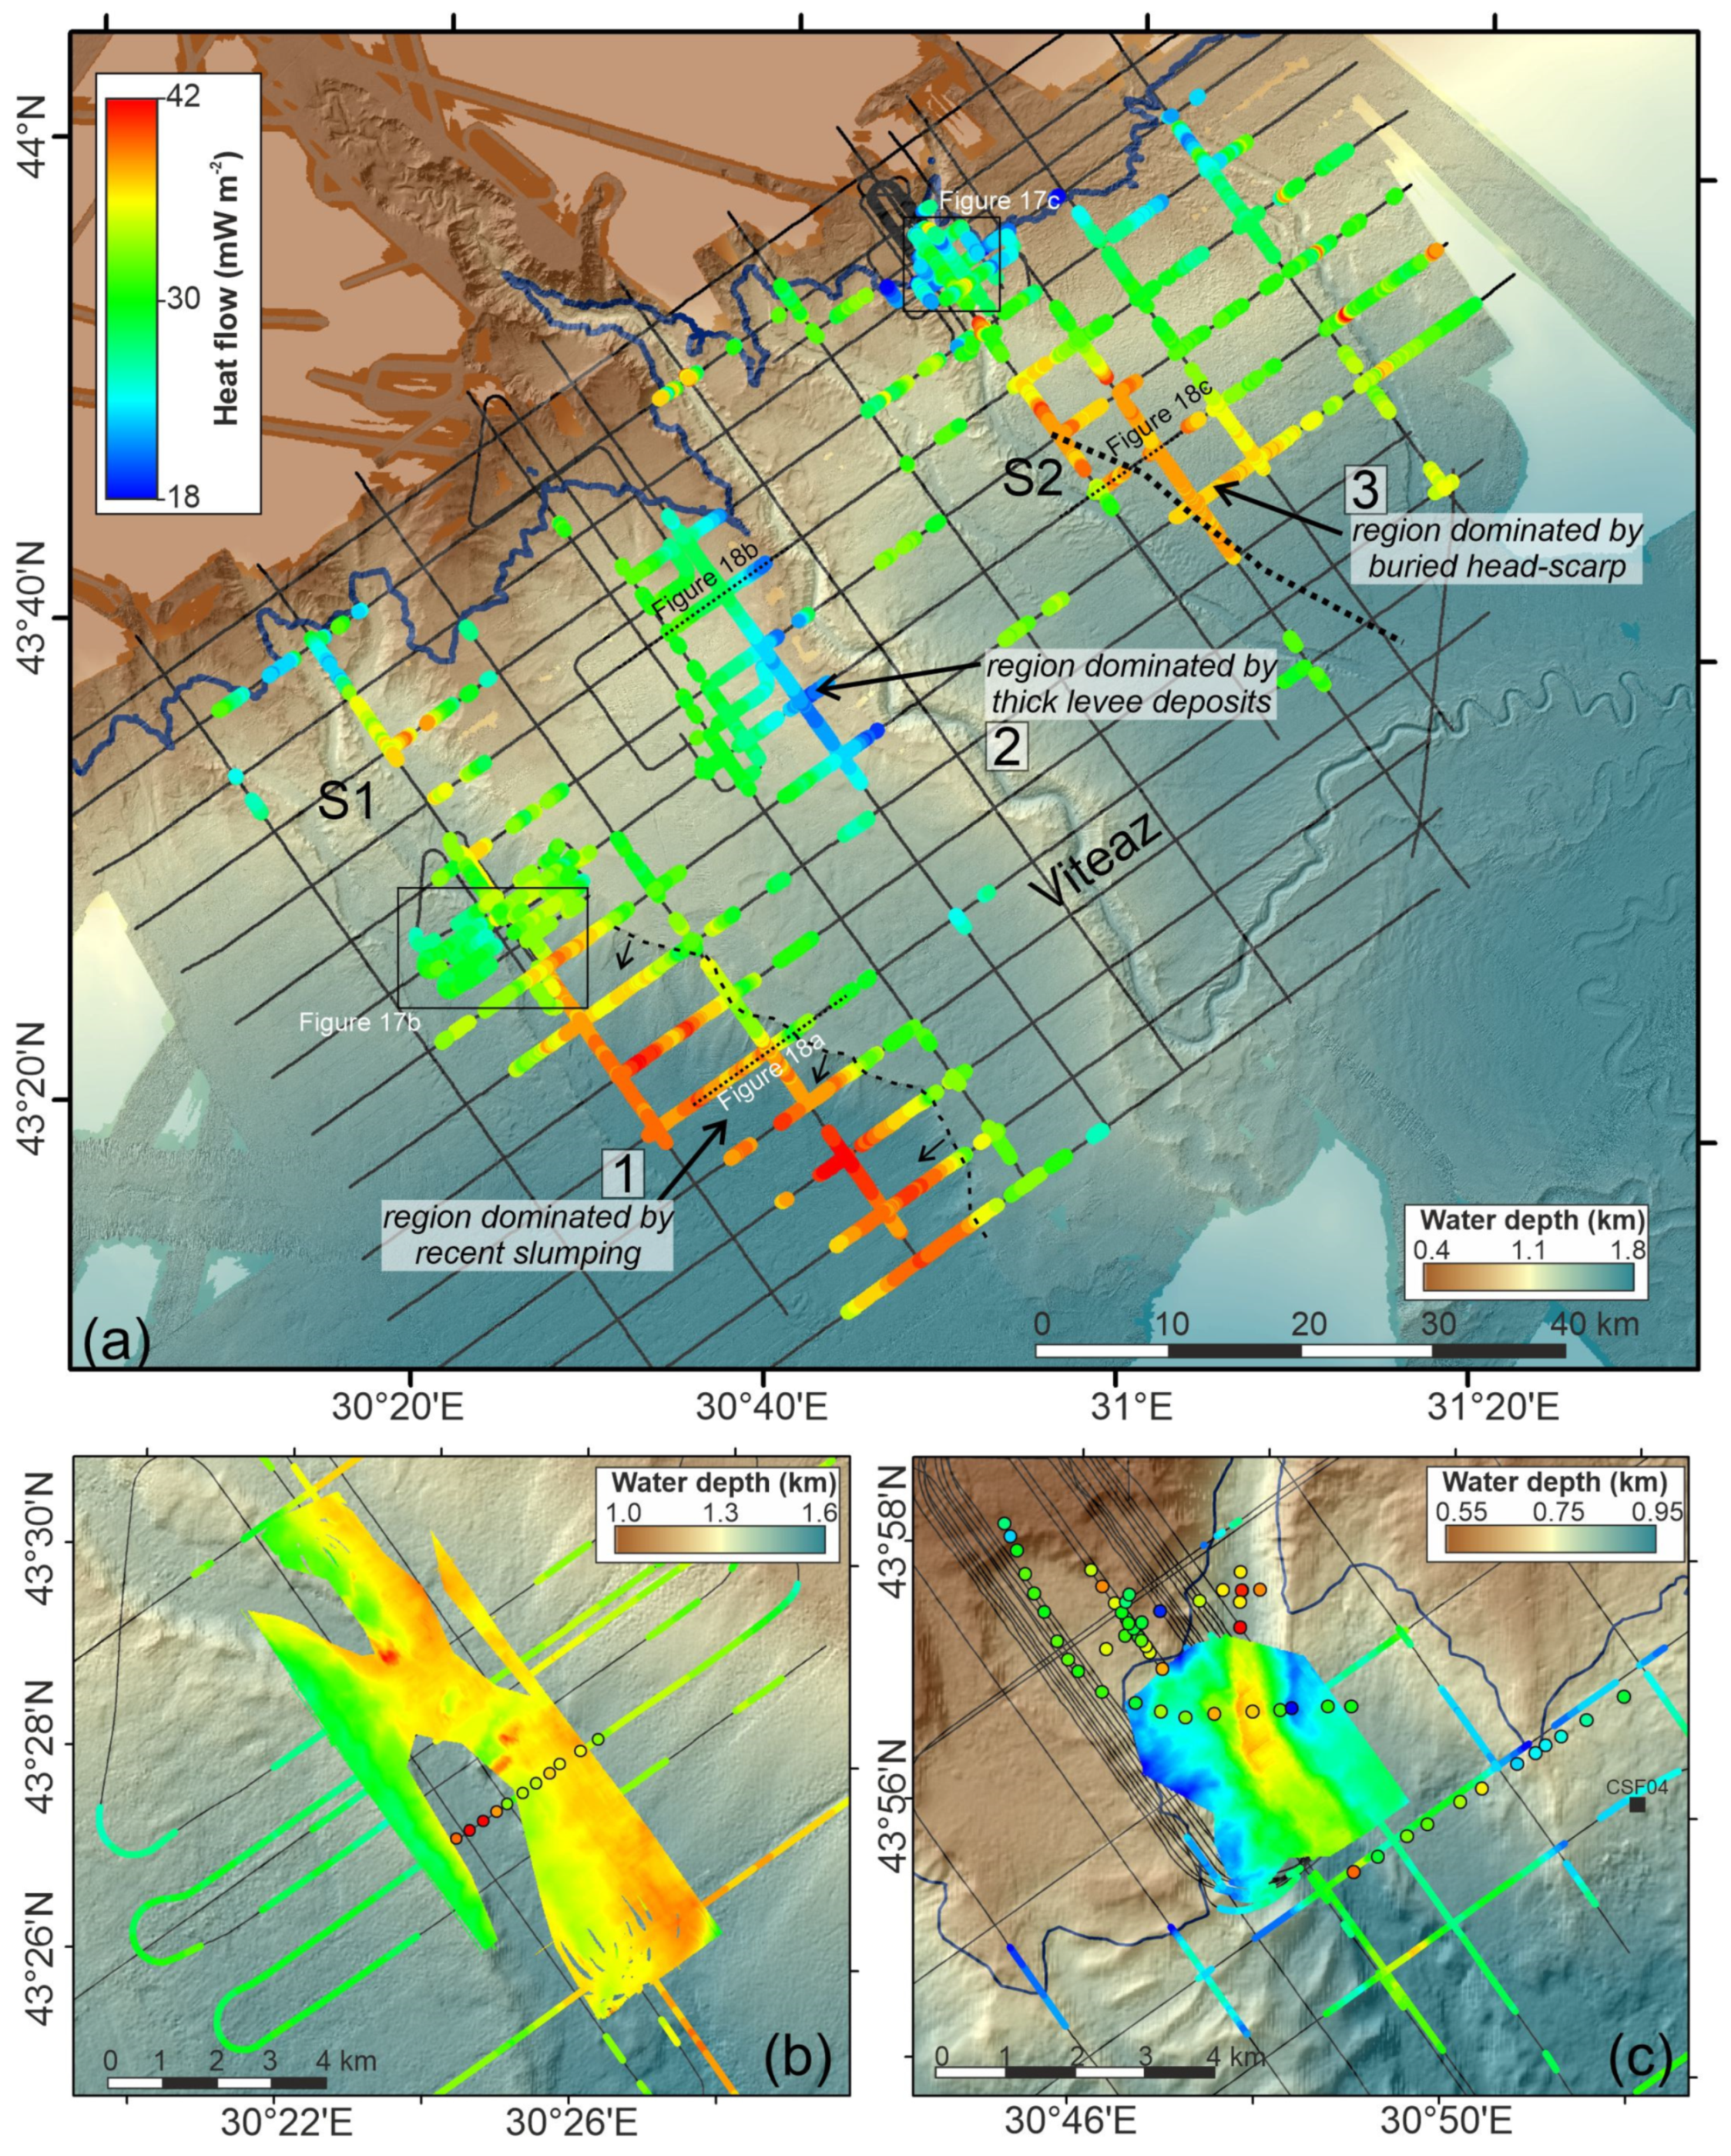
Thus, we extracted the depth of the BSR along all 2D seismic lines available and also picked the BSR within the 3D P-Cable data cubes at the S1 and S2 channels (Figure 17). The average heat flow value is ~30 mW m−2 across the study region, but three zones with marked deviations from this average value are identified. Zone 1 is at the southern end of the S1 channel with the highest heat flow estimates seen overall. Zone 2 is along the western levee of the Viteaz channel associated with very low heat flow values and zone 3 is east of the S2 channel.
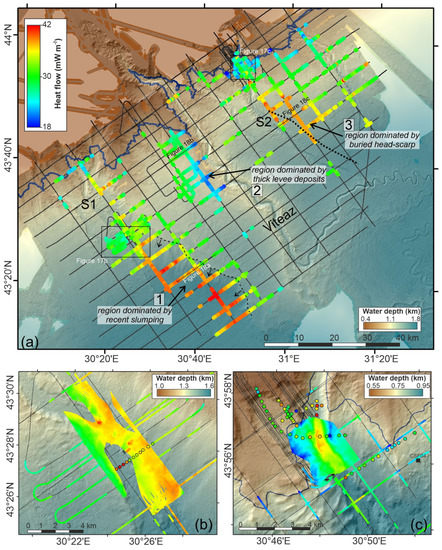
Figure 17.
(a) Regional grid of BSR-derived heat flow values and bathymetry. Seismic lines available for the study are shown as thin black lines. The dotted black line marks the edge of a buried slide-scar >150 m in elevation. Two 3D P-Cable data sets are used for detailed analyses at (b) the S1 channel, and (c) at the S2 channel. All three maps use the same color-scale for heat flow values. Heat-probe stations (colored circles) are also included in (b,c).
5.3.1. Zone 1 and P2000 P-Cable 3D Data
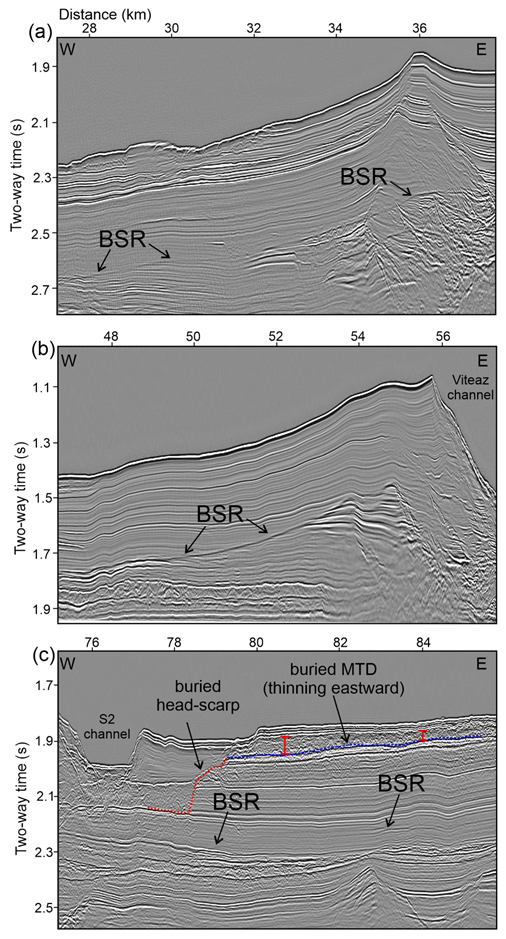
At the S1 channel, the region along the eastern levee especially south of the P-Cable 3D data shows much higher estimated thermal gradients (and thus heat flow values) from BSR-depths than predicted anywhere in the region (Figure 17b and Figure 18a). Right below the channel floor, no BSR was identified, and thus, the topographic effect of this channel incision is only inferred from the heat-probe data (Figure 17b). The BSR is better identified beneath the levees and appears to be too shallow relative to the average depth of the base of the GHSZ corresponding to a heat flow of 30 mW m−2. This may be associated with issues related to possibly recent slumping, sediment removal, and re-deposition of sediment downslope. The seafloor multibeam data reveal an almost continuous head scarp (outlined in Figure 17a) at the eastern edge of the S1 channel, marking the transition to the Viteaz-dominated levee further to the east. This change in sediment thickness above the BSR and associated varying sediment physical properties (porosity and thus thermal conductivity) may explain this apparently high heat flow, which we calculated based on constant properties. To reduce the heat flow to a lower, more average value, would require higher porosities (lower thermal conductivity). As discussed in previous studies involving BSR derived heat flow [90], lower P-wave velocities that are the result from higher porosities do not significantly alter the thermal gradient.
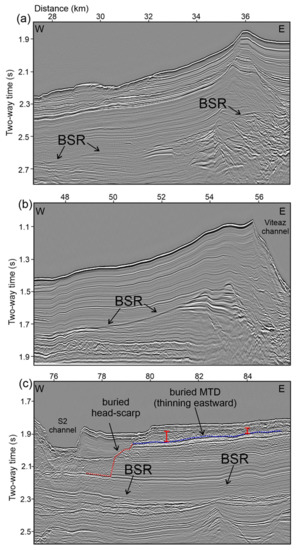
Figure 18.
Three examples of BSRs across the three anomalous zones shown in Figure 17: (a) BSR along the eastern levee of the S1 channel linking to high heat flow, (b) BSR along the western levee of the Viteaz channel, and (c) faint BSR linked to buried head scarp near S2 channel.
5.3.2. Zone 2
Along the western levee of the Viteaz channel, we identified a BSR that suggests much lower heat flow values of below 20 mW m−2 compared to the average value of ~30 mW m−2 (Figure 17a and Figure 18b). The very high sedimentation rates at this channel are likely the reason for the local depression in heat flow. It is noteworthy that the eastern levee of the channel is less thick and no BSR is identified here at all. The asymmetry of the levee thickness is a result of the Coriolis effect on the spill-over sediment material during downslope transport within the channel [57]. No other channel has a noticeable effect on BSR depression from high sedimentation, which is linked to the age of activity within the channel system. Only the Viteaz channel was inferred to be most active during glacial times and all other channels were abandoned previously during the last glacial period and thus the thermal effect of high sedimentation has subsided (healed).
5.3.3. Zone 3
The anomaly of higher heat flow values east of the S2 channel is correlated to the location of a prominent buried head scarp (Figure 17a and Figure 18c), which has an elevation of up to 150 m. Although the slope failure must be rather old (probably pre-LGM), as it is completely overlain by the undisturbed thick levee deposits of the S2 channel, some change in the thermal regime or associated sediment physical properties may be the cause for the local heat flow anomaly. The regional extent of the higher heat flow value correlates to the thickness of the buried MTD (Figure 18c). Eastwards, the MTD becomes gradually thinner and heat flow diminishes back to the average value of 30 mW m−2. Although the MTD is buried by several tens of meters of sediment, and thus is likely of pre-Holocene age, the net thermal effect is still visible.
In summary, the BSR-derived thermal gradients and estimated heat flow values overall agree with trends expected from topography (increase in the channel floors, decrease across topographic elevations), and trends expected from sedimentation and erosion. Whether the estimated values of heat flow and thermal gradient are correct hinges on the assumption that the BSR is indeed the base of the GHSZ and that our assumed sediment physical properties are representative. At the S2 channel, MeBo200 drilling and sediment sampling, in situ measurements and modeling has shown that the BSR is not necessarily always marking the current base of the GHSZ [17,32]. These climate-induced changes should be occurring uniformly across the Black Sea with more noticeable effects at the shallow-water feather edge of the GHSZ where seafloor temperature warming can reach the former BSR faster than in deeper water (and deeper buried base of stability) [21]. In other words, the discrepancy between the current base of the GHSZ and the BSR should diminish with increasing water depth. Thus, the local heat flow anomalies mapped from BSR depth variations that are not showing a water-depth trend are indicative of other processes in the sub-surface, notably sedimentation and erosion effects. Therefore, linking BSR, heat flow and thickness of the theoretical GHSZ can be highly erroneous across the study region.
Although single-station heat-probe measurements overall agree well with trends expected from topography, absolute values of derived thermal gradients and heat flow from probe-measurements are showing discrepancies to the BSR-derived values. The individual measurements are affected by local variations in sedimentation (and erosion) and should not be taken directly to estimate the thickness of the GHSZ.
6. Conclusions
In the region of the Danube deep-sea fan of the western Black Sea, many factors are influencing the gas hydrate stability: (i) long-duration and highly variable climate factors such as seafloor temperature variations and sea level fluctuation, (ii) local variation in sedimentation rates and erosion from slumping, and (iii) significant changes in topography from incised channels. Combined with very limited in situ measurements down to the depths of the BSR, predictions of the thickness of the gas hydrate stability are extremely challenging. From our analyses of over 50 heat-probe measurements, topographic modeling, and regional BSR-derived heat flow estimation, we conclude that regional estimates of the gas hydrate stability based on a value of 30 mW m−2 may be a reasonable approach. Local deviations occur over areas of several square-kilometers and uncertainties in the derived heat flow values may be as large as 100%.
Author Contributions
Conceptualization, M.R. and J.B.; methodology, M.R., H.V. and T.P.; software, H.V.; validation, G.B., J.B., T.P. and M.H.; formal analysis, M.R.; investigation, M.R. and H.V.; resources, G.B., J.B., M.H.; data curation, M.R.; writing—original draft preparation, M.R.; writing—review and editing, J.B., T.P., G.B. and H.V.; visualization, M.R.; supervision, G.B.; project administration, G.B., M.H., J.B.; funding acquisition, G.B., M.H. and J.B. All authors have read and agreed to the published version of the manuscript.
Funding
R/V METEOR cruise M142 and R/V MARIA S. MERIAN cruise MSM34 were fully integrated into the German collaborative gas hydrate program SUGAR, which also provided the funding for scientific work of the cruise (BMWi 03SX320A+G & 03SX381F, BMBF 03G0819A & 03G0856A). Cruise MSM34 was further supported by project MIDAS (EU-FP7 grant 603418).
Data Availability Statement
Data of all heat-probe stations are available in the online repository PANGAEA. Data from cruise MSM34: https://doi.org/10.1594/PANGAEA.912221; data from cruise M142: https://doi.org/10.1594/PANGAEA.912189; Bathymetric data from cruise MSM34 used in this study are available at https://doi.pangaea.de/10.1594/PANGAEA.860483, https://doi.pangaea.de/10.1594/PANGAEA.860486, https://doi.pangaea.de/10.1594/PANGAEA.894399, https://doi.pangaea.de/10.1594/PANGAEA.893874. Bathymetric data from cruise M142 are available at: https://doi.pangaea.de/10.1594/PANGAEA.895530, https://doi.pangaea.de/10.1594/PANGAEA.895506,. Bathymetric data from cruise M143 are available at: https://doi.pangaea.de/10.1594/PANGAEA.895497, https://doi.pangaea.de/10.1594/PANGAEA.895437 (for all data sets date accessed: 1 June 2021).
Acknowledgments
The authors would like to thank all ship-crews, support staff, and scientific personnel involved in conducting on board work and analyses during expeditions MSM34 and M142. Further thanks go to Janice Malnati and Bryan Niederbockstruck (University of Bremen, Faculty of Geosciences) for conducting the XRF scanning of the gravity cores.
Conflicts of Interest
The authors declare no conflict of interest. The funders had no role in the design of the study; in the collection, analyses, or interpretation of data; in the writing of the manuscript, or in the decision to publish the results.
References
- Yefremova, A.G.; Zhizchenko, B.P. Occurrence of crystal hydrates of gases in the sediments of modern marine basins. Akad. Nauk SSSR 1974, 214, 1179–1181. [Google Scholar]
- Ginsburg, G.D. Gas hydrate accumulation in deep-water marine sediments. In Gas Hydrates: Relevance to World Margin Stability and Climate Change; Henriet, J.-P., Mienert, J., Eds.; Geological Society, Special Publications: London, England, 1998; Volume 137, pp. 51–62. Available online: https://sp.lyellcollection.org/content/specpubgsl/137/1/51.full.pdf (accessed on 1 June 2021).
- Vassilev, A.; Dimitrov, L. Spatial and quantity evaluation of the Black Sea gas hydrates. Russ. Geol. Geophys. 2002, 43, 672–684. [Google Scholar]
- Bohrmann, G.; Ivanov, M.; Foucher, J.-P.; Spiess, V.; Bialas, J.; Greinert, J.; Weinrebe, W.; Abegg, F.; Aloisi, G.; Artemov, Y.; et al. Mud volcanoes and gas hydrates in the Black Sea: New data from Dvurechenskii and Odessa mud volcanoes. Geo Mar. Lett. 2003, 23, 239–249. [Google Scholar] [CrossRef]
- Starostenko, V.I.; Rusakov, O.M.; Shnyukov, E.F.; Kobolev, V.P.; Kuta, R.I. Methane in the northern Black Sea: Characterization of its geomorphological and geological environments. Geol. Soc. Lond. Spec. Publ. 2010, 340, 57–75. [Google Scholar] [CrossRef]
- Haeckel, M.; Bialas, J.; Klaucke, I.; Wallmann, K.; Bohrmann, G.; Schwalenberg, K. SUGAR participants. Gas hydrate occurrences in the Black Sea—New observations from the German SUGAR project. Fire Ice US UD DoE Methane Hydrate Newsl. 2015, 15, 6–9. Available online: http://oceanrep.geomar.de/30761/1/Haeckel%20et.al.pdf (accessed on 1 June 2021).
- Haeckel, M.; Zander, T.; Burwicz, E.; Bialas, J.; Berndt, C.; Dannowski, A.; Hensen, C.; Hölz, S.; Jegen, M.; Klaucke, I.; et al. The Gas Hydrate System of the Danube Deep-Sea Fan in the Black Sea. In Proceedings of the 9th International Conference on Gas Hydrates, Denver, CO, USA, 25–30 June 2017. [Google Scholar]
- Minshull, T.A.; Marín-Moreno, H.; Betlem, P.; Bialas, J.; Buenz, S.; Burwicz, E.; Cameselle, A.L.; Cifci, G.; Giustiniani, M.; Hillman, J.I.T.; et al. Hydrate occurrence in Europe: A review of Available evidence. J. Mar. Petrol. Geol. 2020, 111, 735–764. [Google Scholar] [CrossRef]
- Popescu, I.; De Batist, M.; Lericolais, G.; Nouzé, H.; Poort, J.; Panin, N.; Versteeg, W.; Gillet, H. Multiple bottom-simulating reflections in the Black Sea: Potential proxies of past climate conditions. Mar. Geol. 2006, 227, 163–176. [Google Scholar] [CrossRef]
- Popescu, I.; Lericolais, G.; Panin, N.; De Batist, M.; Gillet, H. Seismic expression of gas and gas hydrates across the western Black Sea. Geo Mar. Lett. 2007, 27, 173–183. [Google Scholar] [CrossRef]
- Bialas, J.; Klaucke, I.; Haeckel, M. FS MARIA S. MERIAN Fahrtbericht/Cruise Report MSM-34/1 & 2–SUGAR Site; GEOMAR Report No 15; GEOMAR Helmholtz Centre for Ocean Research: Kiel, Germany, 2014; 109p. [Google Scholar] [CrossRef]
- Küçük, H.M.; Dondurur, D.; Özel, Ö.; Sinayuç, Ç.; Merey, S.; Parlaktuna, M.; Çifç, G. Gas and Gas Hydrate Potential Offshore Amasra, Bartin and Zonguldak and Possible Agent for Multiple BSR Occurrence. Geophys. Res. Abstr. 2015, 17, EGU2015-10310-1, 2015 EGU General Assembly 2015. [Google Scholar]
- Hillman, J.I.T.; Klaucke, I.; Bialas, J.; Feldman, H.; Drexler, T.; Awwiller, D.; Atgin, O.; Çifçi, G. Gas migration pathways and slope failures in the Danube Fan, Black Sea. J. Mar. Petrol. Geo. 2018, 92, 1069–1084. [Google Scholar] [CrossRef]
- Hillman, J.I.T.; Burwicz, E.; Zander, T.; Bialas, J.; Klaucke, I.; Feldman, H.; Drexler, T.; Ahrwiller, D. Investigating a gas hydrate system in apparent disequilibrium in the Danube Fan, Black Sea. Earth Planet. Sci. Lett. 2018, 502, 1–11. [Google Scholar] [CrossRef]
- Bialas, J.; Bohlen, T.; Dannowski, A.; Eisenberg-Klein, G.; Gassner, L.; Gehrmann, R.; Heeschen, K.; Hölz, S.; Jegen, M.; Klaucke, I.; et al. Joint interpretation of geophysical field experiments in the danube deep-sea fan, Black Sea. Mar. Pet. Geol. 2020, 121, 104551. [Google Scholar] [CrossRef]
- Minshull, T.A.; Keddie, A. Measuring the geotherm with gas hydrate bottom-simulating reflectors: A novel approach using three-dimensional seismic data from the eastern Black Sea. Terra Nova 2010, 22, 131–136. [Google Scholar] [CrossRef]
- Riedel, M.; Freudenthal, T.; Bialas, J.; Papenberg, C.; Haeckel, M.; Bergenthal, M.; Pape, T.; Bohrmann, G. In situ borehole temperature measurements confirm dynamics of the gas hydrate stability zone at the upper Danube deep sea fan, Black Sea. Earth Planet. Sci. Lett. 2021, 563, 116869. [Google Scholar] [CrossRef]
- Zander, T.; Haeckel, M.; Berndt, C.; Chi, W.-C.; Klaucke, I.; Bialas, J.; Klaeschen, D.; Koch, S.; Atgin, O. On the origin of multiple BSRs in the Danube deep-sea fan, Black Sea. Earth Planet. Sci. Lett. 2017, 462, 15–25. [Google Scholar] [CrossRef]
- Naudts, L.; Greinert, J.; Artemov, Y.; Staelens, P.; Poort, J.; Van Rensbergen, P.; De Batist, M. Geological and morphological setting of 2778 methane seeps in the Dnepr paleo-delta, northwestern Black Sea. Mar. Geol. 2006, 227, 177–199. [Google Scholar] [CrossRef]
- Riboulot, V.; Cattaneo, A.; Scalabrin, C.; Gaillot, A.; Jouet, G.; Ballas, G.; Marsset, T.; Garziglia, S.; Ker, S. Control of the geomorphology and gas hydrate extent on widespread gas emissions offshore Romania. Bull. Soc. Géol. Fr. 2017, 188, 26. [Google Scholar] [CrossRef]
- Riboulot, V.; Ker, S.; Sultan, N.; Thomas, Y.; Marsset, B.; Scalabrin, C.; Ruffine, L.; Boulart, C.; Ion, G. Freshwater lake to salt-water sea causing widespread hydrate dissociation in the Black Sea. Nat. Commun. 2018, 9. [Google Scholar] [CrossRef]
- Pape, T.; Bahr, A.; Klapp, S.A.; Abegg, F.; Bohrmann, G. High-intensity gas seepage causes rafting of shallow gas hydrates in the southeastern Black Sea. Earth. Planet. Sci. Lett. 2011, 307, 35–46. [Google Scholar] [CrossRef]
- Römer, M.; Sahling, H.; Pape, T.; Bahr, A.; Feseker, T.; Wintersteller, P.; Bohrmann, G. Geological control and magnitude of methane ebullition from a high-flux seep area in the Black Sea–the Kerch seep area. Mar. Geol. 2012, 319, 57–74. [Google Scholar] [CrossRef]
- Römer, M.; Sahling, H.; dos Santos Ferreira, C.; Bohrmann, G. Methane gas emissions of the Black Sea-mapping from the Crimean continental margin to the Kerch Peninsula slope. Geo-Mar. Lett. 2019, 40, 467–480. [Google Scholar] [CrossRef]
- Ross, D.A.; Neprochnov, Y.P. Initial Reports of the Deep Sea Drilling Project; U.S. Government Printing Office: Washington, DC, USA, 1978; Volume 42, Part 2. Available online: http://deepseadrilling.org/42_2/volume/dsdp42pt2_01.pdf (accessed on 1 June 2021).
- Giunta, S.; Morigi, C.; Negri, A.; Guichard, F.; Lericolais, G. Holocene biostratigraphy and paleoenvironmental changes in the Black Sea based on calcareous nannoplankton. Mar. Micropaleontol. 2007, 63, 91–110. [Google Scholar] [CrossRef]
- Soulet, G.; Delaygue, G.; Vallet-Coulomb, C.; Böttcher, M.E.; Sonzogni, C.; Lericolais, G.; Bard, E. Glacial hydrologic conditions in the Black Sea reconstructed using geochemical pore water profiles. Earth Planet. Sci. Lett. 2010, 296, 57–66. [Google Scholar] [CrossRef]
- Ker, S.; Riboulot, V.; GHASS Cruise Team. GHASS Cruise Report. 2015, p. 53. Available online: https://archimer.ifremer.fr/doc/00300/41141/ (accessed on 1 June 2021).
- Freudenthal, T.; Wefer, G. Drilling cores on the sea floor with the remote-controlled sea floor drilling rig MeBo. Geosci. Instrum. Methods Data Syst. 2013, 2, 329–337. [Google Scholar] [CrossRef]
- Bohrmann, G.; Ahrlich, F.; Bachmann, K.; Bergenthal, M.; Beims, M.; Betzler, C.; Brünjes, J.; Deusner, C.; Domeyer, B.; Düßmann, R.; et al. R/V METEOR Cruise Report M142, Drilling Gas Hydrates in the Danube Deep-Sea Fan, Black Sea, Varna–Varna–Varna, 4 November–22 November–09 December 2017. Berichte, MARUM–Zentrum für Marine Umweltwissenschaften, Fachbereich Geowissenschaften, Universität Bremen. 2018. No 320, 121 p, ISSN 2195-9633. Available online: https://media.suub.uni-bremen.de/handle/elib/3434 (accessed on 1 June 2021).
- Pape, T.; Haeckel, M.; Riedel, M.; Kölling, M.; Schmidt, M.; Wallmann, K.; Bohrmann, G. Formation pathways of light hydrocarbons in deep sediments of the Danube deep-sea fan, Western Black Sea. Mar. Pet. Geol. 2020, 122, 104627. [Google Scholar] [CrossRef]
- Ker, S.; Thomas, Y.; Riboulot, V.; Sultan, N.; Bernard, C.; Scalabrin, C.; Ion, G.; Marsset, B. Anomalously deep BSR related to a transient state of the gas hydrate system in the western Black Sea. Geophys. J. Int. 2019, 20, 442–459. [Google Scholar] [CrossRef]
- Grevemeyer, I.; Villinger, H. Gas hydrate stability and the assessment of heat flow through continental margins. Geophys. J. Int. 2001, 145, 647–660. [Google Scholar] [CrossRef]
- Villinger, H.W.; Tréhu, A.M.; Grevemeyer, I. Seafloor Marine Heat Flux Measurements and Estimation of Heat Flux from Seismic Observations of Bottom Simulating Reflectors. In Geophysical Characterization of Gas Hydrates, Society of Exploration Geophysicists; Riedel, Willoughby, Chopra, Eds.; Society of Exploration Geophysicists: Houston, TX, USA, 2010; pp. 279–300. [Google Scholar] [CrossRef]
- Yamano, M.; Uyeda, S.; Aoki, Y.; Shipley, T.H. Estimates of heat flow derived from gas hydrates. Geology 1982, 10, 339–343. [Google Scholar] [CrossRef]
- Kinoshita, M.; Moore, G.F.; Kido, Y.N. Heat flow estimated from BSR and IODP borehole data: Implication of recent uplift and erosion of the imbricate thrust zone in the Nankai Trough off Kumano, Geochem. Geophys. Geosyst. 2011, 12, Q0AD18. [Google Scholar] [CrossRef]
- Ohde, A.; Otsuka, H.; Kioka, A.; Ashi, J. Distribution and depth of bottom-simulating reflectors in the Nankai subduction margin. Earth Planets Space 2018, 70, 60. [Google Scholar] [CrossRef]
- Kaul, N.; Villinger, H.; Rosenberger, A. Comparison of measured and BSR-derived heat flow values, Makran accretionary prism. Mar. Geol. 2000, 164, 37–51. [Google Scholar] [CrossRef]
- Harris, R.N.; Grevemeyer, I.; Ranero, C.R.; Villinger, H.; Barckhausen, U.; Henke, T.; Mueller, C.; Neben, S. Thermal regime of the Costa Rican convergent margin: 1. Along-strike variations in heat flow from probe measurements and estimated from bottom-simulating reflectors. Geochem. Geophys. Geosyst. 2010, 11, Q12S28. [Google Scholar] [CrossRef]
- Davis, E.E.; Hyndman, R.D.; Villinger, H. Rates of fluid expulsion across the northern Cascadia accretionary prism: Constraints from new heat flow and multichannel seismic reflection data. J. Geophys. Res. 1990, 95, 8869–8889. [Google Scholar] [CrossRef]
- Hyndman, R.D.; Foucher, J.P.; Yamano, M.; Fisher, A.T. The ODP Leg 131 Scientific Party. Deep sea bottom simulating reflectors: Calibration of the base of the hydrate stability field as used for heat flow estimates. Earth Planet. Sci. Lett. 1992, 109, 289–301. [Google Scholar] [CrossRef]
- Riedel, M.; Tréhu, A.M.; Spence, G.D. Characterizing the thermal regime of cold vents at the northern Cascadia margin from bottom-simulating reflector distributions, heat-probe measurements and borehole temperature data. J. Mar. Geophys. Resear 2010, 31, 1–16. [Google Scholar] [CrossRef]
- Phrampus, B.J.; Harris, R.N.; Tréhu, A.M. Heat flow bounds over the Cascadia margin derived from bottom simulating reflectors and implications for thermal models of subduction. Geochem. Geophys. Geosyst. 2017, 18, 3309–3326. [Google Scholar] [CrossRef]
- Tréhu, A.M. Subsurface Temperatures Beneath Southern Hydrate Ridge, Proc. ODP, Sci. Results, 204; Tréhu, A.M., Bohrmann, G., Torres, M.E., Colwell, F.S., Eds.; College Station TX Ocean Drilling Program: College Station, TX, USA, 2006; pp. 1–26. [Google Scholar] [CrossRef]
- Villar-Muñoz, L.; Vargas-Cordero, I.; Bento, J.P.; Tinivella, U.; Fernandoy, F.; Giustiniani, M.; Behrmann, J.H.; Calderón-Díaz, S. Gas Hydrate Estimate in an Area of Deformation and High Heat Flow at the Chile Triple Junction. Geosciences 2019, 9, 28. [Google Scholar] [CrossRef]
- Kunath, P.; Chi, W.-C.-; Berndt, C.; Chen, L.; Liu, C.-S.; Kläschen, D.; Muff, S. A Shallow Seabed Dynamic Gas Hydrate System off SW Taiwan: Results From 3-D Seismic, Thermal, and Fluid Migration Analyses. J. Geophys. Res. Solid Earth 2020, 125, e2019JB019245-T. [Google Scholar] [CrossRef]
- Li, L.; Lei, X.; Zhang, G. Heat flow derived from BSR and its implications for gas hydrate stability zone in Shenhu Area of northern South China Sea. Mar. Geophys. Res. 2012, 33, 77–87. [Google Scholar] [CrossRef]
- Dong, M.; Zhang, J.; Xu, X.; Wu, S.-G. The differences between the measured heat flow and BSR heat flow in the Shenhu gas hydrate drilling area, northern South China Sea. Energy Explor. Exploit. 2018, 37, 756–769. [Google Scholar] [CrossRef]
- Shankar, U.; Riedel, M.; Sathe, A.V. Geothermal modeling of the gas hydrate stability zone along the Krishna Godavari Basin. Mar. Geophys. Res. 2010, 31, 17–28. [Google Scholar] [CrossRef]
- Shankar, U.; Riedel, M. Seismic and heat flow constraints from the Krishna-Godavari Basin gas hydrate system. Mar. Geol. 2010, 276, 1–13. [Google Scholar] [CrossRef]
- Robinson, A.G.; Rudat, J.H.; Banks, C.J.; Wiles, R.L.F. Petroleum geology of the Black Sea. J. Mar. Petrol. Geol. 1996, 13, 195–223. [Google Scholar] [CrossRef]
- Dinu, C.; Wong, H.K.; Tambrea, D.; Matenco, L. Stratigraphic and structural characteristics of the Romanian Black Sea Shelf. Tectonophysics 2005, 410, 417–435. [Google Scholar] [CrossRef]
- Ryan, W.B.; Pitman, W.C., III; Major, C.O.; Shimkus, K.; Moskalenko, V.; Jones, G.A.; Dimitrov, P.; Gorür, N.; Sakinc, M.; Yüce, H. An abrupt drowning of the Black Sea shelf. Mar. Geol. 1997, 138, 119–126. [Google Scholar] [CrossRef]
- Winguth, C.; Wong, H.K.; Panin, N.; Dinu, C.; Georgescu, P.; Ungureanu, G.; Kruglikov, V.V.; Podshuveit, V. Upper Quaternary water level history and sedimentation in the northwestern Black Sea. Mar. Geol. 2000, 167, 127–146. [Google Scholar] [CrossRef]
- Wong, H.K.; Panin, N.; Dinu, C.; Georgescu, P.; Rahn, C. Morphology and post-Chaudian (Late Pleistocene) evolution of the submarine Danube fan complex. Terra Nova 1994, 6, 502–511. [Google Scholar] [CrossRef]
- Wong, H.K.; Winguth, C.; Panin, N.; Dinu, C.; Wollschlager, M.; Georgescu, P.; Ungureanu, G.; Krugliakov, V.V.; Podshuveit, V. The Danube and Dniepr fans, morphostructure and evolution. Geo Eco Mar. 1997, 2, 77–102. [Google Scholar]
- Popescu, I.; Lericolais, G.; Panin, N.; Wong, H.; Droz, L. Late Quaternary channel avulsions on the Danube deep-sea fan, Black Sea. Mar. Geol. 2001, 179, 25–37. [Google Scholar] [CrossRef]
- Popescu, I.; Lericolais, G.; Panin, N.; Normand, A.; Dinu, C.; Le Drezen, E. The Danube submarine canyon (Black Sea): Morphology and sedimentary processes. Mar. Geol. 2004, 206, 249–265. [Google Scholar] [CrossRef]
- Lericolais, G.; Bulois, C.; Gillet, H.; Guichard, F. High frequency sea level fluctuations recorded in the Black Sea since the LGM. Glob. Planet. Chang. 2009, 66, 65–75. [Google Scholar] [CrossRef]
- Lericolais, G.; Bourget, J.; Popescu, I.; Jermannaud, P.; Mulder, T.; Jorry, S.; Panin, N. Late Quaternary deep-sea sedimentation in the western Black Sea: New insights from recent coring and seismic data in the deep basin. Glob. Planet. Chang. 2013, 103, 232–247. [Google Scholar] [CrossRef]
- Constantinescu, A.; Toucanne, S.; Dennielou, B.; Jorry, S.; Mulder, T.; Lericolais, G. Evolution of the Danube deep-sea fan since the last glacial maximum: New insights into black sea water-level fluctuations. Mar. Geol. 2015, 367, 50–68. [Google Scholar] [CrossRef]
- Manheim, F.T.; Schug, D.M. Interstitial waters of Black Sea cores. Init. Repts. Deep Sea Drill. Proj. 1978, 42, 637–651. Available online: http://deepseadrilling.org/42_2/volume/dsdp42pt2_23.pdf (accessed on 1 June 2021).
- Özsoy, E.; Ünlüata, Ü. Oceanography of the Black Sea: A review of some recent results. Earth Sci. Rev. 1997, 42, 231–272. [Google Scholar] [CrossRef]
- Degens, E.T.; Ross, D.A. The Black Sea–Geology, Chemistry, and Biology; The American Association of Petroleum Geologists: Tulsa, OK, USA, 1974. [Google Scholar] [CrossRef]
- Poort, J.; Vassilev, A.; Dimitrov, L. Did postglacial catastrophic flooding trigger massive changes in the Black Sea gas hydrate reservoir? Terra Nova 2005, 17, 135–140. [Google Scholar] [CrossRef]
- Hyndman, R.D.; Davis, E.E.; Wright, J.A. The measurement of marine geothermal heat flow by a multi-penetration probe with digital acoustic telemetry and in situ thermal conductivity. Mar. Geophys. Res. 1979, 4, 181–205. [Google Scholar] [CrossRef]
- Riedel, M.; Freudenthal, T.; Bergenthal, M.; Haeckel, M.; Wallmann, K.; Spangenberg, E.; Bialas, J.; Bohrmann, G. Physical Properties and core-log seismic integration from drilling at the Danube Deep sea fan, Black Sea. J. Mar. Petrol. Geol. 2020, 114, 104192. [Google Scholar] [CrossRef]
- Dannowski, A.; Bialas, J.; Zander, T.; Klaeschen, D. Shear Wave Modelling of High Resolution OBS Data in a Gas Hydrate Environment in the Danube Deep-Sea Fan, Black Sea. In Proceedings of the AGU Fall Meeting, San Francisco, CA, USA, 12–16 December 2016. [Google Scholar]
- Tishchenko, P.; Hensen, C.; Wallmann, K.; Wong, C.S. Calculation of the stability and solubility of methane hydrate in seawater. Chem. Geol. 2005, 219, 35–52. [Google Scholar] [CrossRef]
- Waite, W.F.; Stern, L.A.; Kirby, S.H.; Winters, W.J.; Mason, D.H. Simultaneous determination of thermal conductivity, thermal diffusivity and specific heat in sI methane hydrate. Geophys. J. Int. 2007, 169, 767–774. [Google Scholar] [CrossRef]
- Blum, P. Physical Properties Handbook: A Guide to the Shipboard Measurement of Physical Properties of Deep-Sea Cores. ODP Tech. Note 26. 1997. Available online: http://www-odp.tamu.edu/publications/tnotes/tn26/index.htm (accessed on 1 June 2021).
- Bahr, A.; Lamy, F.; Arz, H.; Kuhlmann, H.; Wefer, G. Late glacial to Holocene climate and sedimentation history in the NW Black Sea. Mar. Geol. 2005, 214, 309–322. [Google Scholar] [CrossRef]
- Bahr, A.; Arz, H.W.; Lamy, F.; Wefer, G. Late glacial to Holocene paleoenvironmental evolution of the Black Sea, reconstructed with stable oxygen isotope records obtained on ostracod shells. Earth. Planet. Sci. Lett. 2006, 241, 863–875. [Google Scholar] [CrossRef]
- Bahr, A.; Lamy, F.; Arz, H.W.; Major, C.; Kwiecien, O.; Wefer, G. Abrupt changes of temperature and water chemistry in the late Pleistocene and early Holocene Black Sea. Geochem. Geophys. Geosyst. 2008, 9, Q01004. [Google Scholar] [CrossRef]
- Hay, B.J.; Arthur, M.A.; Dean, W.E.; Neff, E.D.; Honjo, S. Sediment deposition in the Late Holocene abyssal Black Sea with climatic and chronological implications. Deep Sea Res. 1991, 38 (Suppl. S2), 1211–1235. [Google Scholar] [CrossRef]
- Major, C.; Ryan, W.; Lericolais, G.; Hajdas, I. Constraints on Black Sea outflow to the Sea of Marmara during the last glacial-interglacial transition. Mar. Geol. 2002, 190, 19–34. [Google Scholar] [CrossRef]
- Lamy, F.; Arz, H.W.; Bond, G.C.; Bahr, A.; Pätzold, J. Multicentennial-scale hydrological changes in the Black Sea and northern Red Sea during the Holocene and the Arctic/North Atlantic Oscillation. Paleoceanography 2006, 21, PA1008. [Google Scholar] [CrossRef]
- Kwiecien, O.; Arz, H.W.; Lamy, F.; Wulf, S.; Bahr, A.; Röhl, U.; Haug, G.H. Estimated reservoir ages of the Black Sea since the Last Glacial. Radiocarbon 2008, 50, 99–118. [Google Scholar] [CrossRef]
- Soulet, G.; Ménot, G.; Bayon, G.; Rostek, F.; Ponzevera, E.; Toucanne, S.; Lericolais, G.; Bard, E. Abrupt drainage cycles of the Fennoscandian Ice Sheet. Proceedings of the National Academy of Sciences 2013, 110, 6682–6687. [Google Scholar] [CrossRef]
- Calvert, S.E.; Vogel, J.S.; Southon, J.R. Carbon accumulation rates and the origin of the Holocene sapropel in the Black Sea. Geology 1987, 15, 918–921. [Google Scholar] [CrossRef]
- Eckert, S.; Brumsack, H., Jr.; Severmann, S.; Schnetger, B.; März, C.; Fröllje, H. Establishment of euxinic conditions in the Holocene Black Sea. Geology 2013, 41, 431–434. [Google Scholar] [CrossRef]
- Piper, D.Z.; Calvert, S.E. Holocene and late glacial palaeoceanography and palaeolimnology of the Black Sea: Changing sediment provenance and basin hydrography over the past 20,000 years. Geochim. Cosmochim. Acta 2011, 75, 5597–5624. [Google Scholar] [CrossRef]
- Soulet, G.; Ménot, G.; Garreta, V.; Rostek, F.; Zaragosi, S.; Lericolais, G.; Bard, E. Black sea “lake” reservoir age evolution since the last glacial—Hydrologic and climatic implications. E. Planet. Sci. Lett. 2011, 308, 245–258. [Google Scholar] [CrossRef]
- Caress, D.W.; Chayes, D.N.; dos Santos Ferreira, C. MB-System: Mapping the Seafloor 2017. Available online: http://www.mbari.org/products/research-software/mb-system/ (accessed on 1 June 2021).
- Woodside, W.; Messmer, J.H. Thermal conductivity of porous media. I. Unconsolidated Sands. J. Applied. Physics. 1961, 32, 1688–1699. [Google Scholar] [CrossRef]
- Brigaud, F.; Vasseur, G. Mineralogy, porosity and fluid control on thermal conductivity of sedimentary rocks. Geophys. J. 1982, 98, 525–542. [Google Scholar] [CrossRef]
- Wangen, M. Heat flow. In Physical Principles of Sedimentary Basin Analysis; Cambridge University Press: Cambridge, UK, 2010; pp. 105–193. [Google Scholar] [CrossRef]
- Bjørlykke, K. Petroleum Geoscience: From Sedimentary Environments to Rock Physics, Chapter 9: Heat Transport in Sedimentary Basins; Springer: Berlin/Heidelberg, Germany, 2015; pp. 273–277. [Google Scholar]
- Lachenbruch, A.H. Rapid estimation of the topographic disturbance to superficial thermal gradients. Rev. Geophysics 1968, 6, 365–400. [Google Scholar] [CrossRef]
- Ganguly, N.; Spence, G.D.; Chapman, N.R.; Hyndman, R.D. Heat flow variations from bottom simulating reflectors on the Cascadia margin. Mar. Geol. 2000, 164, 53–68. [Google Scholar] [CrossRef]
Publisher’s Note: MDPI stays neutral with regard to jurisdictional claims in published maps and institutional affiliations. |
© 2021 by the authors. Licensee MDPI, Basel, Switzerland. This article is an open access article distributed under the terms and conditions of the Creative Commons Attribution (CC BY) license (https://creativecommons.org/licenses/by/4.0/).

