Article

Geochemical Characterization and Trace-Element Mobility Assessment for Metallic Mine Reclamation in Soils Affected by Mine Activities in the Iberian Pyrite Belt

by
Ramón Sánchez-Donoso
1,2,*,
Mari Luz García Lorenzo
3,
José María Esbrí
4,
Eva María García-Noguero
4,
Pablo Higueras
4 and
Elena Crespo
3
1
Department of Geodynamics, Stratigraphy and Paleontology, Complutense University of Madrid (UCM), 28040 Madrid, Spain
2
Institute of Geosciences (IGEO, UCM-CSIC), 28040 Madrid, Spain
3
Department of Mineralogy and Petrology, Complutense University of Madrid (UCM), 28040 Madrid, Spain
4
Instituto de Geología Aplicada (IGeA), Universidad de Castilla-La Mancha (UCLM), 13400 Almadén, Spain
*
Author to whom correspondence should be addressed.
Geosciences 2021, 11(6), 233; https://doi.org/10.3390/geosciences11060233
Submission received: 6 May 2021 / Revised: 22 May 2021 / Accepted: 27 May 2021 / Published: 29 May 2021
(This article belongs to the Special Issue Environmental Impacts of Mining in Soils and Water)

Abstract

:
The geochemical characterization of the mine deposits and soils in metal mining areas is essential in order to develop an effective mine reclamation strategy. The determination of total potentially toxic element (PTE) content, together with the application of chemical extraction procedures, can give insight into the behavior of contaminants after the application of different mine reclamation solutions, as well as identify the areas where urgent action is needed. This work presents a practical application to the evaluation of the pollution potential of trace elements in soils affected by mining activities, to be used in metallic mine reclamation. The PTE behavior was assessed by single extractions in order to simulate four environmental conditions: PTE mobility under rainfall conditions, acid mine drainage, reducing conditions, and plant uptake. The spatial distribution of contaminants in the study area was evaluated by determination of PTE total content in soil samples. Trace elements with high natural mobility, such as Zn, appeared concentrated at water and sediment discharge areas, while As, Pb, and Cu contents were higher near the mine wastes. The results obtained after the extractions suggested that the highest PTE content was extracted in the complexing–reducing medium, due to the dissolution of secondary sulfates and Fe3+ oxyhydroxides and the subsequent release of PTEs associated with those mineral phases. Reclamation strategies applied in the study area should promote efficient water drainage, infiltration, and subsuperficial water circulation in order to maintain oxidant conditions in the soil. The methodology applied in this study may constitute a valuable tool to define the geochemical constraints in metal mining areas, as well as help to develop appropriate mine reclamation solutions.

1. Introduction

The long story of metalliferous mining, processing, and smelting activities in the Iberian Pyrite Belt (southwest of the Iberian Peninsula) has left behind a legacy of numerous abandoned mines and considerable quantities of waste rock piles, spoil heaps, and tailing ponds [1,2,3]. Modern day extraction and treatment processes are usually very efficient, and the resulting mining wastes contain relatively low concentrations of potentially toxic elements (PTEs). However, wastes derived from historical mining operations are characterized by higher PTE concentrations and a relative abundance of ore minerals (i.e., pyrite, galena, and sphalerite), due to the use of less efficient mineral processing and extraction technologies [4,5]. When oxidation of the sulfides remaining in those mine wastes occurs, it results in the generation of strongly acidic leakages and acid mine drainage (AMD), as well as the mobilization of considerable quantities of PTEs and trace elements such as Pb, As, Zn, Cu, Cd, or Hg, among many others, which can cause serious environmental impact [6,7]. In this regard, several studies have already remarked the high concentrations of PTEs in soils, sediments, and water bodies near mining sites and waste deposits in the Iberian Pyrite Belt [3,8,9,10]. Drainage networks and groundwater environments have been found to be especially vulnerable to contamination by the release of PTEs from waste deposits [11], and their accumulation in flora and fauna can entail huge environmental problems [12,13,14,15,16].
Because of this, the characterization and evaluation of derelict mine wastes has become a growing concern among the scientific community, especially in regions where large quantities of wastes have been stored or abandoned [12,17,18,19,20,21]. Commonly, the characterization of soil and sediment PTE contamination is based on the determination of the PTE total contents. In a mining site, the total concentration of PTE can be useful to assess the areas of the mine wastes with higher contamination, where most of the stabilization and remediation efforts should be focused in order to prevent migration of contaminants to the environment. However, the evaluation of the total contents may not be sufficient, as it only provides limited information on the toxicity, mobility, (bio)availability, and chemical behavior of PTEs [5]. Accumulation of PTEs in soils and sediments occurs in various geochemical forms, namely, water-soluble, exchangeable, carbonate-associated, Fe–Mn oxide-associated, organic-associated, mineral, and residual forms [22,23,24]. These forms affect the way the element behaves in the soil, depending on its bioavailability, toxicity, mobility, and chemical interactions with the soil particles [5,17,24]. Water-soluble and exchangeable fractions are considered to be readily bioavailable to plants and microorganisms; carbonate-, Fe–Mn oxide-, and organic-associated fractions can be potentially available depending on the environmental conditions; residual fractions are tightly bound and would not be expected to be released under natural conditions [17,25]. Therefore, knowledge of the chemical speciation of PTE and evaluation of metal retention and mobility must be taken into account in pollution studies, in order to correctly assess the potential effects of soils polluted by heavy metals [26,27].
Selective chemical extraction methods are commonly used for the characterization of the chemical behavior (i.e., mobility, solubility, bioavailability, and toxicity) of PTEs in the environment [23] and the strength of binding between them and other soil particles. These methods consist of partial dissolution procedures that use different selective chemical reagents to define the fractionation of PTEs in soils, sediments, or mine wastes [28]. Many extraction methods and selective reagents have been proposed for studying the mobility and bioavailability of PTEs, but none has been fully recognized as a universal procedure applicable to all types of soils and sediments [5,27]. Sequential extraction procedures use a series of selective reagents chosen to successively dissolve the mineralogical fractions thought to be responsible for retaining the larger part of PTEs [17]. Sequential approaches have, however, some limitations, such as the lack of specificity in element removal, metal re-adsorption, and redistribution among the solid phase after each extraction and lack of comparability between studies due to the variability of experimental parameters. Perhaps the most important limitation may be the specificity of these processes in terms of soil element and matrix, a fact that requires the adaptation of the methods for each specific case and that limits their comparability. Lastly, they require a considerable number of sample manipulation steps, making them time-consuming and increasing the potential for contamination with each successive step [5,28,29].
Single-step extraction procedures enable for a rapid evaluation of the PTEs associated with a specific fraction in soil materials. Single-step extraction methods provide less detailed information about the different metal–solid phase association than sequential extraction procedures. However, single-step extraction methods can still give useful information about PTE behavior, when different environmental conditions are simulated (i.e., acidic, alkaline, oxidizing, or reducing conditions) by the selected single reagent or by a mixture of them. Their application is relatively simpler and quicker than sequential extraction procedures due to minor sample handling [28]. These extraction techniques were chosen in this study to obtain comparative information about the mobility of the PTEs in a catalog of different possible leaching conditions in the study area. Thus, it was intended to obtain specific information on leachability, availability, and (bio)availability rather than carrying out an indirect speciation of the PTEs.
In terms of metal mining reclamation, an adequate geochemical characterization of the mine deposits and the assessment of its potential as a pollution source are essential in order to develop an effective reclamation strategy. The application of different extraction procedures that simulate the behavior of PTEs under diverse environmental conditions can give useful information about the mobilization of those PTEs in mine soils and wastes after the application of different reclamation approaches. This, in turn, makes it easier to evaluate the applicability of different reclamation strategies and decide which one of the reclamation options is better suited to the specific mining site depending on the nature and chemical behavior of contaminants.
In this regard, the aim of the present research was to assess the polluting potential and geochemical behavior of potentially toxic elements in soils affected by mining activities in a closed pyrite mine (Lousal Mine, Setúbal, Portugal), where mine reclamation actions are going to be implemented in the near future. The mineralogical and geochemical composition of soils was evaluated, and five selective extraction procedures were applied in order to assess the mobility of PTEs (in particular, Pb, Zn, Cd, Cu, and As) under different environmental conditions. The results obtained in this study were used to evaluate the suitability of the reclamation strategies that will be applied in the Lousal mining area. With this research, we hope to contribute to the success of the Lousal Mine reclamation project and other potential mine reclamation projects that could be developed in the Iberian Pyrite Belt and other metallic mining areas.

2. Materials and Methods

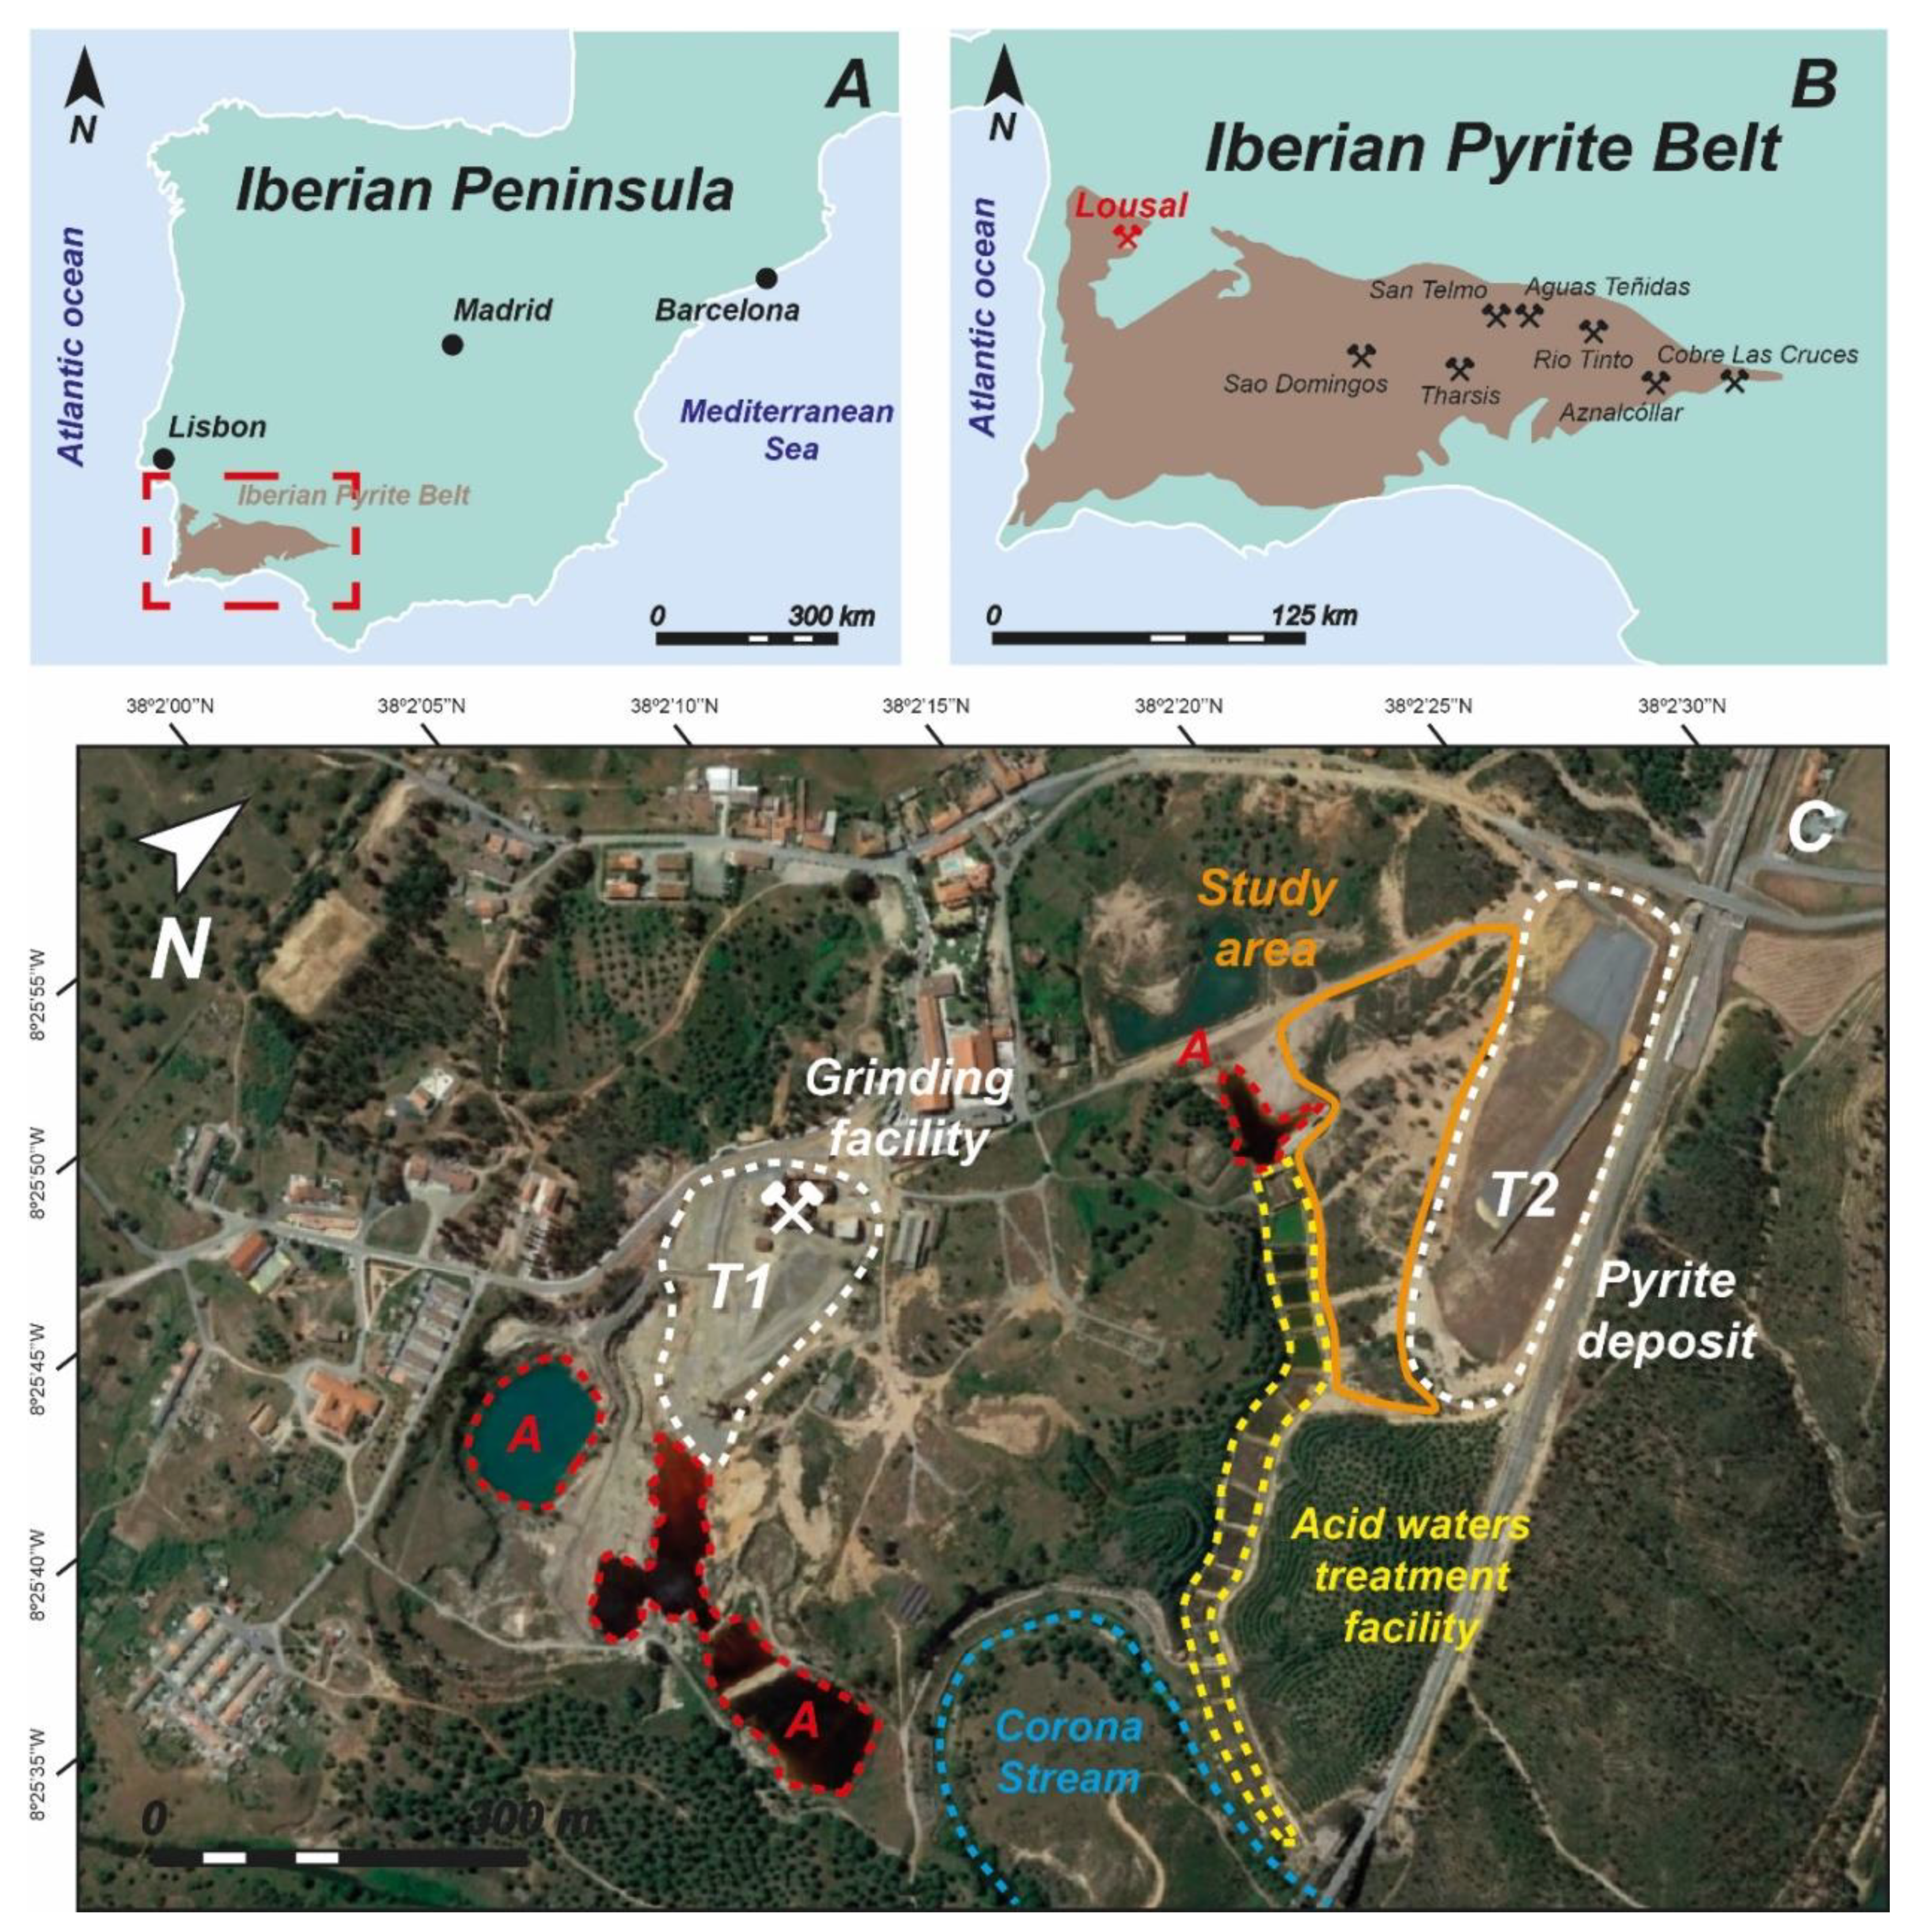
2.1. Location and Features of the Mine Site

The Iberian Pyrite Belt, one of the largest known volcanogenic massive sulfide provinces in the world, extends from the city of Seville (SW Spain) to the Portuguese coast [3,30,31]. The volcano-sedimentary sequences characteristic of this realm host more than 1700 Mt of massive sulfide deposits, with pyrite (FeS2) being the main metallic mineral and sphalerite ((Zn, Fe)S), galena (PbS), chalcopyrite (CuFeS2), and arsenopyrite (FeAsS) found in lower quantities [3,12,32]. Due to the rich mineralization of the sulfide ore bodies, the region has been characterized by a prolific mining history, which goes back to the third millennium B.C. [12,33,34,35].
The Lousal polymetallic massive sulfide mine is located in the NW region of the Iberian Pyrite Belt, near the eastern margin of the Setúbal District (Portugal) (Figure 1). The mining area is limited to the north by the Espinhaçao de Cao stream and to the south by the Corona stream, both tributaries of the Sado River [36]. The geomorphology of the region is conditioned at the NW by the presence of the Paleozoic basement of the South Portuguese Zone of the Iberian Pyrite Belt and at the SE by the tertiary sediments of the Alto Sado Basin [37,38,39,40].
This region is characterized by a typical Mediterranean climate, with moderately dry and cold winters and warm and dry summers. The average annual temperature is 16.5 °C, and total annual precipitation fluctuates around 310 mm, with most of the precipitation taking place between the months of November and March, in addition to a few short high-intensity storms at the end of the summer. The predominant soils in this area are Leptosols [41], acid soils with pH values ranging from 5 to 5.5, poor organic matter content, and very coarse texture. In some areas, poorly developed soils over the tertiary deposits are also present, characterized by a sandy texture, very limited organic matter content, and a slightly acidic nature. Due to the mining operations, most of the soils present at the mine site can be considered as Technosols [41], composed by mixtures of soil, rock fragments, and tailing material [42,43].
The Lousal area lies in the SW limb of an anticline affected by N–S and NE–SE late-stage faults, along a lineament of the volcano-sedimentary complex of the Iberian Pyrite Belt. This complex comprises felsic volcanic rocks, interbedded with black shales, volcanoclastic sandstones, and detrital sediments [30,44,45]. In the Lousal region, the volcano-sedimentary complex is overlain by the Tertiary-aged sediments of the Alto Sado Basin [42]. The mineralization hosted is related to an exhalative deposit, presumably developed in brine pools within the lower units of the volcano-sedimentary complex [44]. The ore deposit is characterized by fine-grained massive sulfides with a mineralization dominated by pyrite, with variable amounts of chalcopyrite, galena, sphalerite, pyrrhotine (Fe(1−x)S), marcasite (FeS2), bournonite (PbCuSbS3), tetrahedrite (Cu12Sb4S13), arsenopyrite, cobaltite (CoAsS), magnetite (Fe2+Fe3+2O4), and native gold [46].
The Lousal mine, located in the Grândola municipality (Alentejo Region), was exploited between 1900 and 1988, primarily for pyrite, through surface and underground works that went to depths of about 500 m [36,40,47]. During the first two decades of exploitation, various gossan deposits and supergene enrichment zones were worked mainly for copper ore. Later, in the 1930s, the mining activity increased significantly and shifted toward the exploitation of deeper ore lenses, due to the mining company needs of production of high tonnages of pyrite concentrate [47]. This trend continued for the remaining of the mine life cycle, with a notable increase in the pyrite concentrates during the late 1950s and early 1960s.
The mining legacy has resulted in a large volume of wastes, ranging from barren materials to various types of waste deposits and tailing impoundments, estimated to be greater than 1 Mt [43,44]. Two main tailings and waste material impoundments can currently be identified in the Lousal mine area, one related to the mine shafts and ore mill plants, and another related to a big deposit of fine-grained pyrite close to the railway station at the NE of the mining facilities, where the ore was deposited and later transported for chemical treatment [42,44]. During the mine life cycle, most of the waste deposits were left exposed to weathering, and no effective environmental measures were taken to reduce tailings erosion and avoid the generation of AMD. Due to the fast environmental degradation of the mine wastes after the mine closure in 1988, a rehabilitation program (RELOUSAL, Rehabilitation and Integral Development of the Lousal Mine) was promoted by the mining company (SAEPEC) and the Grândola town council. As part of this program, an AMD passive treatment facility was implemented in the northeastern area of the mining complex, next to the pyrite deposits. A system of artificial wetlands and open limestone channels was constructed in order to reduce PTE content and increase the pH of surficial waters that drained into the Corona stream [48]. Additionally, a geotextile fabric was extended over a section of the pyrite deposits next to the railway station and then covered with a soil layer, in order to encapsulate the wastes and reduce the impact of weathering processes.
Currently, a European-funded mine reclamation project (LIFE RIBERMINE, LIFE ENV/ES/000181) is starting to be applied in the soils affected by the pyrite-rich mine wastes. This project will be the first worldwide to apply a combined fluvial-geomorphic and geochemical approach to the reclamation of the mining area. The topography of the affected mine soils will be redesigned and reconstructed using the GeoFluv method [49,50,51] in order to reduce accelerated water-driven erosion, and a buffering soil amendment will be extended over the reconstructed topography to prevent the chemical weathering of the mine soils and the formation of acid mine drainage. Reclamation actions are being implemented during the years 2021 and 2022.

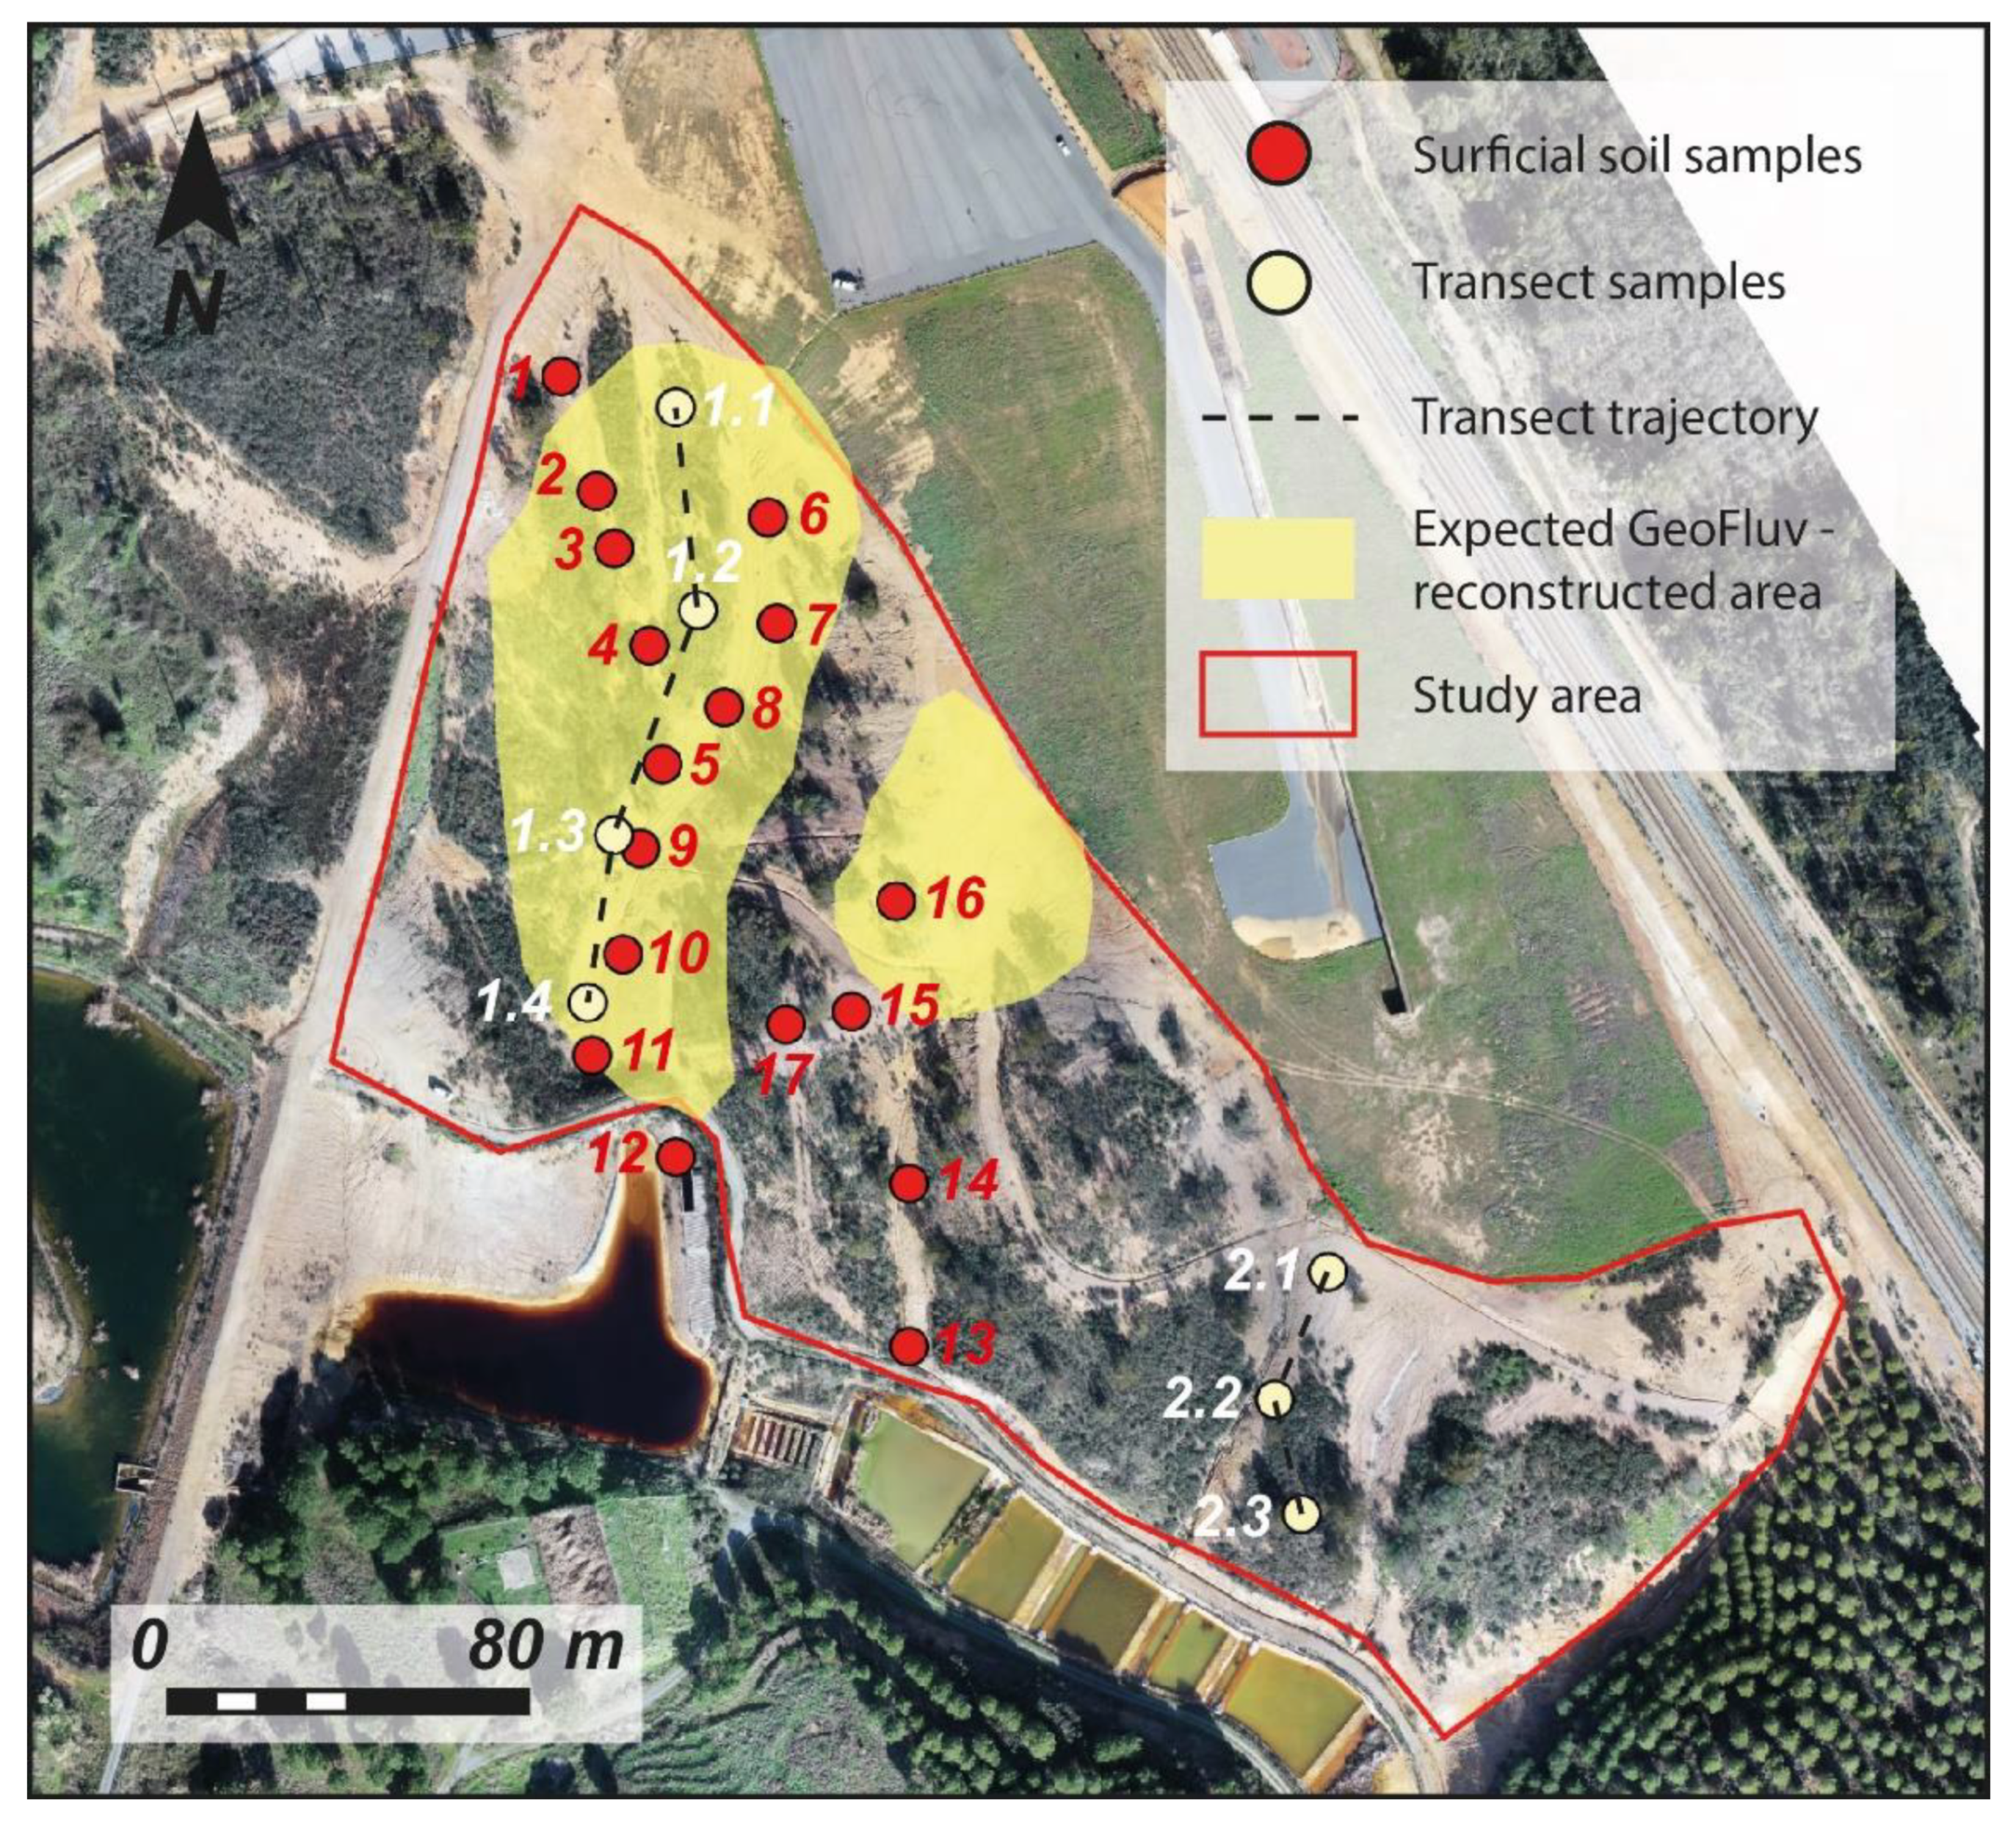
2.2. Sampling Design

The sampling campaign was conducted in January 2019. Surficial and deep soil samples were collected from the mine soils. Deep samples were collected following two transects (Transect W and Transect E), parallel to the direction of maximum slope (Figure 2). In each transect, several trenches of 1 m depth were excavated with a backhoe, and soil samples were collected from the trench walls at different depths. Samples collected down to a depth of 20 cm were considered as surficial samples, while samples collected below the first 20 cm of the soil profile were considered as deep samples. In total, 28 samples were collected using this procedure, 19 in Transect W and nine in Transect E. Alongside the samples collected in the two transects, 16 surficial samples were collected following the flow trajectory of two dry ephemeral channels developed in the soils affected by mining activities, and one sample (LOS17) was collected from sediments accumulated in a catch basin, a part of a drainage channel built to transport ADM leakages to the treatment system. The location of these samples corresponds to the areas where the topographic reconstruction of the mine wastes is expected to be implemented. Sampling was carried out by digging down below the first 10 cm of the soil and taking the sample directly with a hand shovel. All the samples were air-dried, passed through a 2 mm sieve, homogenized, and stored in plastic bags at room temperature until laboratory analysis.

2.3. Geochemical Analysis

Elemental concentration data were achieved by means of energy-dispersive X-ray fluorescence spectrometry (XRF), using a Malvern PANalytical, mod. Epsilon1 spectrometer at the Instituto de Geología Aplicada, IGEA (Castilla-La Mancha University). All the collected soil samples were ground to fine powder (approximate grain size of 100 µm) using an agate ball mill prior to analysis. Sieved samples were placed into cylindrical sample holders with a 3.6 µm Mylar filter and then introduced in the XRF spectrometer. An extended analysis time (23 min) was used to achieve the minimum standard deviation of each data. The fluorescence spectra of each sample were corrected and adapted before quantification to attenuate the effects of interelement interferences. From the total list of major, minor, and trace elements analyzed, As, Cd, Cu, Fe (Fe2O3), Pb, S (SO3), and Zn were specially chosen for this study because of their abundance and variability in these types of mine wastes, and because most of them are included in the priority contaminant list of environmental protection agencies [52]. To ensure the quality of the analyses, duplicate samples were analyzed to check precision, and a certified reference material (SRM 2711) was analyzed for accuracy. The precision results of the studied elements were as follows: Zn (87.3%), As (82.9%), Pb (93.1%), SO3 (93.5%), Fe2O3 (88.4%), and Cu (85.0%). The recovery percentages for the certified elements in SRM 2711 were as follows (in %): S (178.7–182.3), Fe (97.7–98.0), Cu (115.2–122.2), Zn (98.8–99.9), As (79.1–83.9), and Pb (111.0–112.7).

2.4. Chemical Simple Extractions

In order to assess the mobility of PTEs (Pb, Zn, Cd, Cu, and As) present in the soils affected by mining activities in the Lousal mine, five selective extraction procedures were applied to the surficial samples: water extraction, acidic medium extraction, complexing–reducing medium extraction, EDTA extraction, and DTPA extraction. These selective extractions allowed for the simulation of the potential mobility of PTEs under different environmental situations. Due to the strong association and affinity of heavy metals with fine-grained soil components, all samples were ground to fine powder (grain size < 63 µm) using an agate ball mill prior to the chemical extractions.
Water extraction was used to assess the natural mobility of PTEs soluble under actual conditions, which represent the most mobile fraction of trace elements in the sediment samples. Dilute aqueous salt solutions (CaCl2) are often used to determine the water-soluble PTE fraction in soils [53,54]. In this study, however, we used distilled water, as its composition is more similar to that of natural rainfall water. PTE content was determined in the extracts of a 1:2 (w/v) soil/water suspension [55]. The soil/water mixture was then agitated for 24 h using a Multi-Purpose Tube Rotator (Fisherbrand) and centrifuged at 3000 rpm for 5 min in order to separate the supernatant solution from the solid residue. The solution was then filtered with 0.45 µm pore spacing and kept refrigerated prior to analysis.
Acidic medium extraction was applied to simulate the effect of AMD in the selected materials and assess the potential mobilization of PTEs under acidic conditions. PTE content was determined from the extracts of a 1:50 (w/v) soil/acid solution suspension. For this extraction, 1 g of sample was mixed with 50 mL of 0.1 mol−1 HNO3 solution [56]. The suspension was agitated for 1 h and then centrifuged at 3000 rpm for 20 min. The liquid fraction was finally filtered with 0.45 µm pore spacing and kept refrigerated before laboratory analysis.
A complexing–reducing medium extraction was used to assess the PTE mobilization under anoxic conditions, using the dithionite–citrate extraction method [57]. The dithionite–citrate extraction partially mobilizes goethite, hematite, other non-crystalline Fe-oxides, and Fe–Al organic complexes present in the soil sample, thus allowing for the assessment of the PTE fraction adsorbed to those non-crystalline Fe compounds [57]. For each sample, 1 g was weighed and mixed with 40 mL of sodium citrate (chelating agent) and 5 mL of a 1 N NaHCO3 solution (buffering solution). The obtained soil/reagent suspension was heated up to 80 °C and 1 g of sodium dithionite was added. While heated, it was continually mixed for 1 min and agitated intermittently for another 15 min. The final suspension was centrifuged at 3000 rpm for 10 min, and the liquid fraction was filtered with 0.45 µm pore spacing and kept refrigerated until laboratory analysis.
EDTA extraction was used to assess the PTE fraction assimilable by plants. EDTA is a widely used complexing agent that is assumed to extract metals on exchange sites of both organic and inorganic complexes, and the PTE fraction mobilized by this selective extraction has been proven to show a good correlation with plant uptake [58,59]. PTE content was determined in the extracts of a 1:5 (w/v) soil/EDTA suspension. For each collected sample, 5 g was weighted and placed in a volumetric flask, and 25 mL of 0.05 M Na2-EDTA solution was added. The soil/EDTA suspension was agitated for 2 h and then centrifuged at 2000 rpm for 20 min. The supernatant solution was separated from the solid residue, filtered with 0.45 µm pore spacing, and kept refrigerated prior to analysis.
DTPA extraction has a similar application as the EDTA extraction, as it is commonly used to estimate plant-available PTE content in soils. EDTA extraction has been used successfully under many different soil conditions, while DTPA is often used as an extractant for micronutrients in moderate to strongly acidic soils [60]. PTE content was determined following the procedure developed by Lindsay and Norvell [61]. For each sample, 5 g was weighted and mixed with 10 mL of extractant solution (0.05 N DTPA, 0.01 N CaCl2, and 0.1 M triethanolamine). The soil/solution suspension was agitated for 2 h and then centrifuged at 3000 rpm for 20 min. The liquid fraction was filtered with 0.45 µm pore spacing and kept refrigerated before laboratory analysis.
The Pb, Zn, Cd, and Cu content in the solutions obtained by the application of the five selective extraction procedures was measured by atomic absorption spectrometry (AAS) using a ContrAA-800 high-intensity continuous spectrum atomic absorption spectrometer (Analytik Jena) at the Castilla-La Mancha University. To ensure the quality of the analyses, duplicate samples were analyzed to check precision. Each sample was analyzed thrice to verify the obtained results. In order to avoid wrong measurements due to the effect of matrix interference, a reagent blank was prepared for each of the extraction procedures, and calibration standards were prepared using the same reagent matrix used in each extraction. A calibration curve was made for each of the analyzed trace elements, and a certified standard was analyzed for accuracy. The coefficient of determination (R2) for the studied elements was as follows: Pb (0.998–0.999), Zn (0.970–0.999), Cd (0.987–0.999), Cu (0.997–0.999). The recovery percentages for the analyzed elements in the certified standard were as follows (in %): Pb (95–101), Zn (97–98), Cd (98–102), Cu (94–98). The As content was determined by atomic fluorescence spectrometry using a coupled HPCL (high-performance liquid chromatography) short column and hydride generation spectrometer (PSA Millenium Excalibur 10.055) at the Castilla-La Mancha University. A fraction of each sample was submitted to a chemical reduction prior to the laboratory analysis, which reduces As(V) to As(III) and facilitates As detection when using the hydride generation spectrometer. In order to do that, a solution of Kl/ascorbic acid was applied to the soil samples and left at room temperature for 30 min. The quality control of the analyses was performed following the same procedures as those previously described for the analysis of Pb, Zn, Cd, and Cu. The coefficient of determination (R2) for the calibration curves of As ranged between 0.998 and 0.999. The recovery percentages of As for each extraction were as follows (in %): water extraction (104), acidic medium (104), complexing–reducing medium (107), EDTA (108), and DTPA (107).

2.5. Mineralogical Analysis

The mineralogy was defined through X-ray diffraction (XRD). Original soil samples and residues after each extraction were air-dried and ground in an agate mortar to fine powder (grain size < 63 µm). Mineral phases were identified by powder XRD using a Bruker D8 Advance diffractometer equipped with a Cu anticathode. Diffractograms were recorded continuously at 2θ angles from 2° to 68°, with 0.02 stepping intervals and 1 s per step. The semiquantitative analysis was carried out according to the Chung method [62,63,64], using XPowder software [65]. The Chung method is based on the determination of the reference intensity ratios (RIR) of the existing phases, which allows the intensity calculations to be normalized according to the assumption that the sum of all phases in the sample is equal to 100%. The XRD analyses were performed at the Complutense University of Madrid (Laboratory of Geological Techniques, CAI, Complutense University of Madrid, Madrid, Spain).

2.6. Multivariate Analysis

A multivariate analysis was applied for the geochemical and mineralogical variables, including a correlation matrix and principal component and factor analysis, using Statgraphics 19 software [66]. The multivariate analysis was used to determine potential relationships between the PTE total content and the mineralogical composition of the original soil samples. The correlation matrix was applied to identify the relationship between trace element and mineralogy in the original soil samples, using Pearson’s product moment correlation coefficient [67]. Factorial analysis permits a statistical approximation for analyzing interrelations between a large number of variables. The factorial analysis was carried out by the principal component extraction method, using a varimax normalized rotation of the factors [68].

2.7. Assessment of Potential Environmental Risk

A significant number of indicators designed to approximate the quality of soils can readily be found in the literature [69,70,71]. In this study, assessment of soil contamination level was performed by the quantification of the contamination factor (CF) and the pollution load index (PLI). These indicators are useful tools to assess the degree of trace-element contamination in soils, and they allow for the comparison of results with other potentially polluted areas.

2.7.1. Contaminant Factor

The contaminant factor (CF) was calculated as the ratio between the PTE concentrations in soil samples using the Portuguese Background values [72].
CF = CSoil/CBackground
CF < 1 indicates low contamination, 1 < CF < 3 indicates moderate contamination, 3 < CF < 6 indicates considerable contamination, and CF > 6 indicates very high contamination [73]. CF values were calculated for PTEs with available geochemical background values: Pb, Zn, Cd, As, and Cu. In the case of Cd, only some of the surficial soil samples had an associated CF value, due to most of the samples showing Cd concentrations below the analytical detection limit.

2.7.2. Pollution Load Index

For the entire soil sampling site, the pollution load index (PLI) was determined as the n-th root of the product of the n CF. In samples with quantifiable Pb, Zn, Cd, As, and Cu, the n value used was 6. In samples with one or more PTEs below the analytical detection limit, the n value was reduced by the amount of PTE not quantified. In general,
PLI = (CFPb × CFZn × … × CFn)1/n
PLI < 1 indicates low contamination, 1 < PLI < 3 indicates moderate contamination, 3 < PLI < 6 indicates considerable contamination, and PLI > 6 indicates very high contamination.

3. Results and Discussion

The results of the geochemical and mineralogical characterization of the soil samples affected by mining activities, as well as those obtained from the assessment of PTE mobility under different environmental conditions, are presented here.

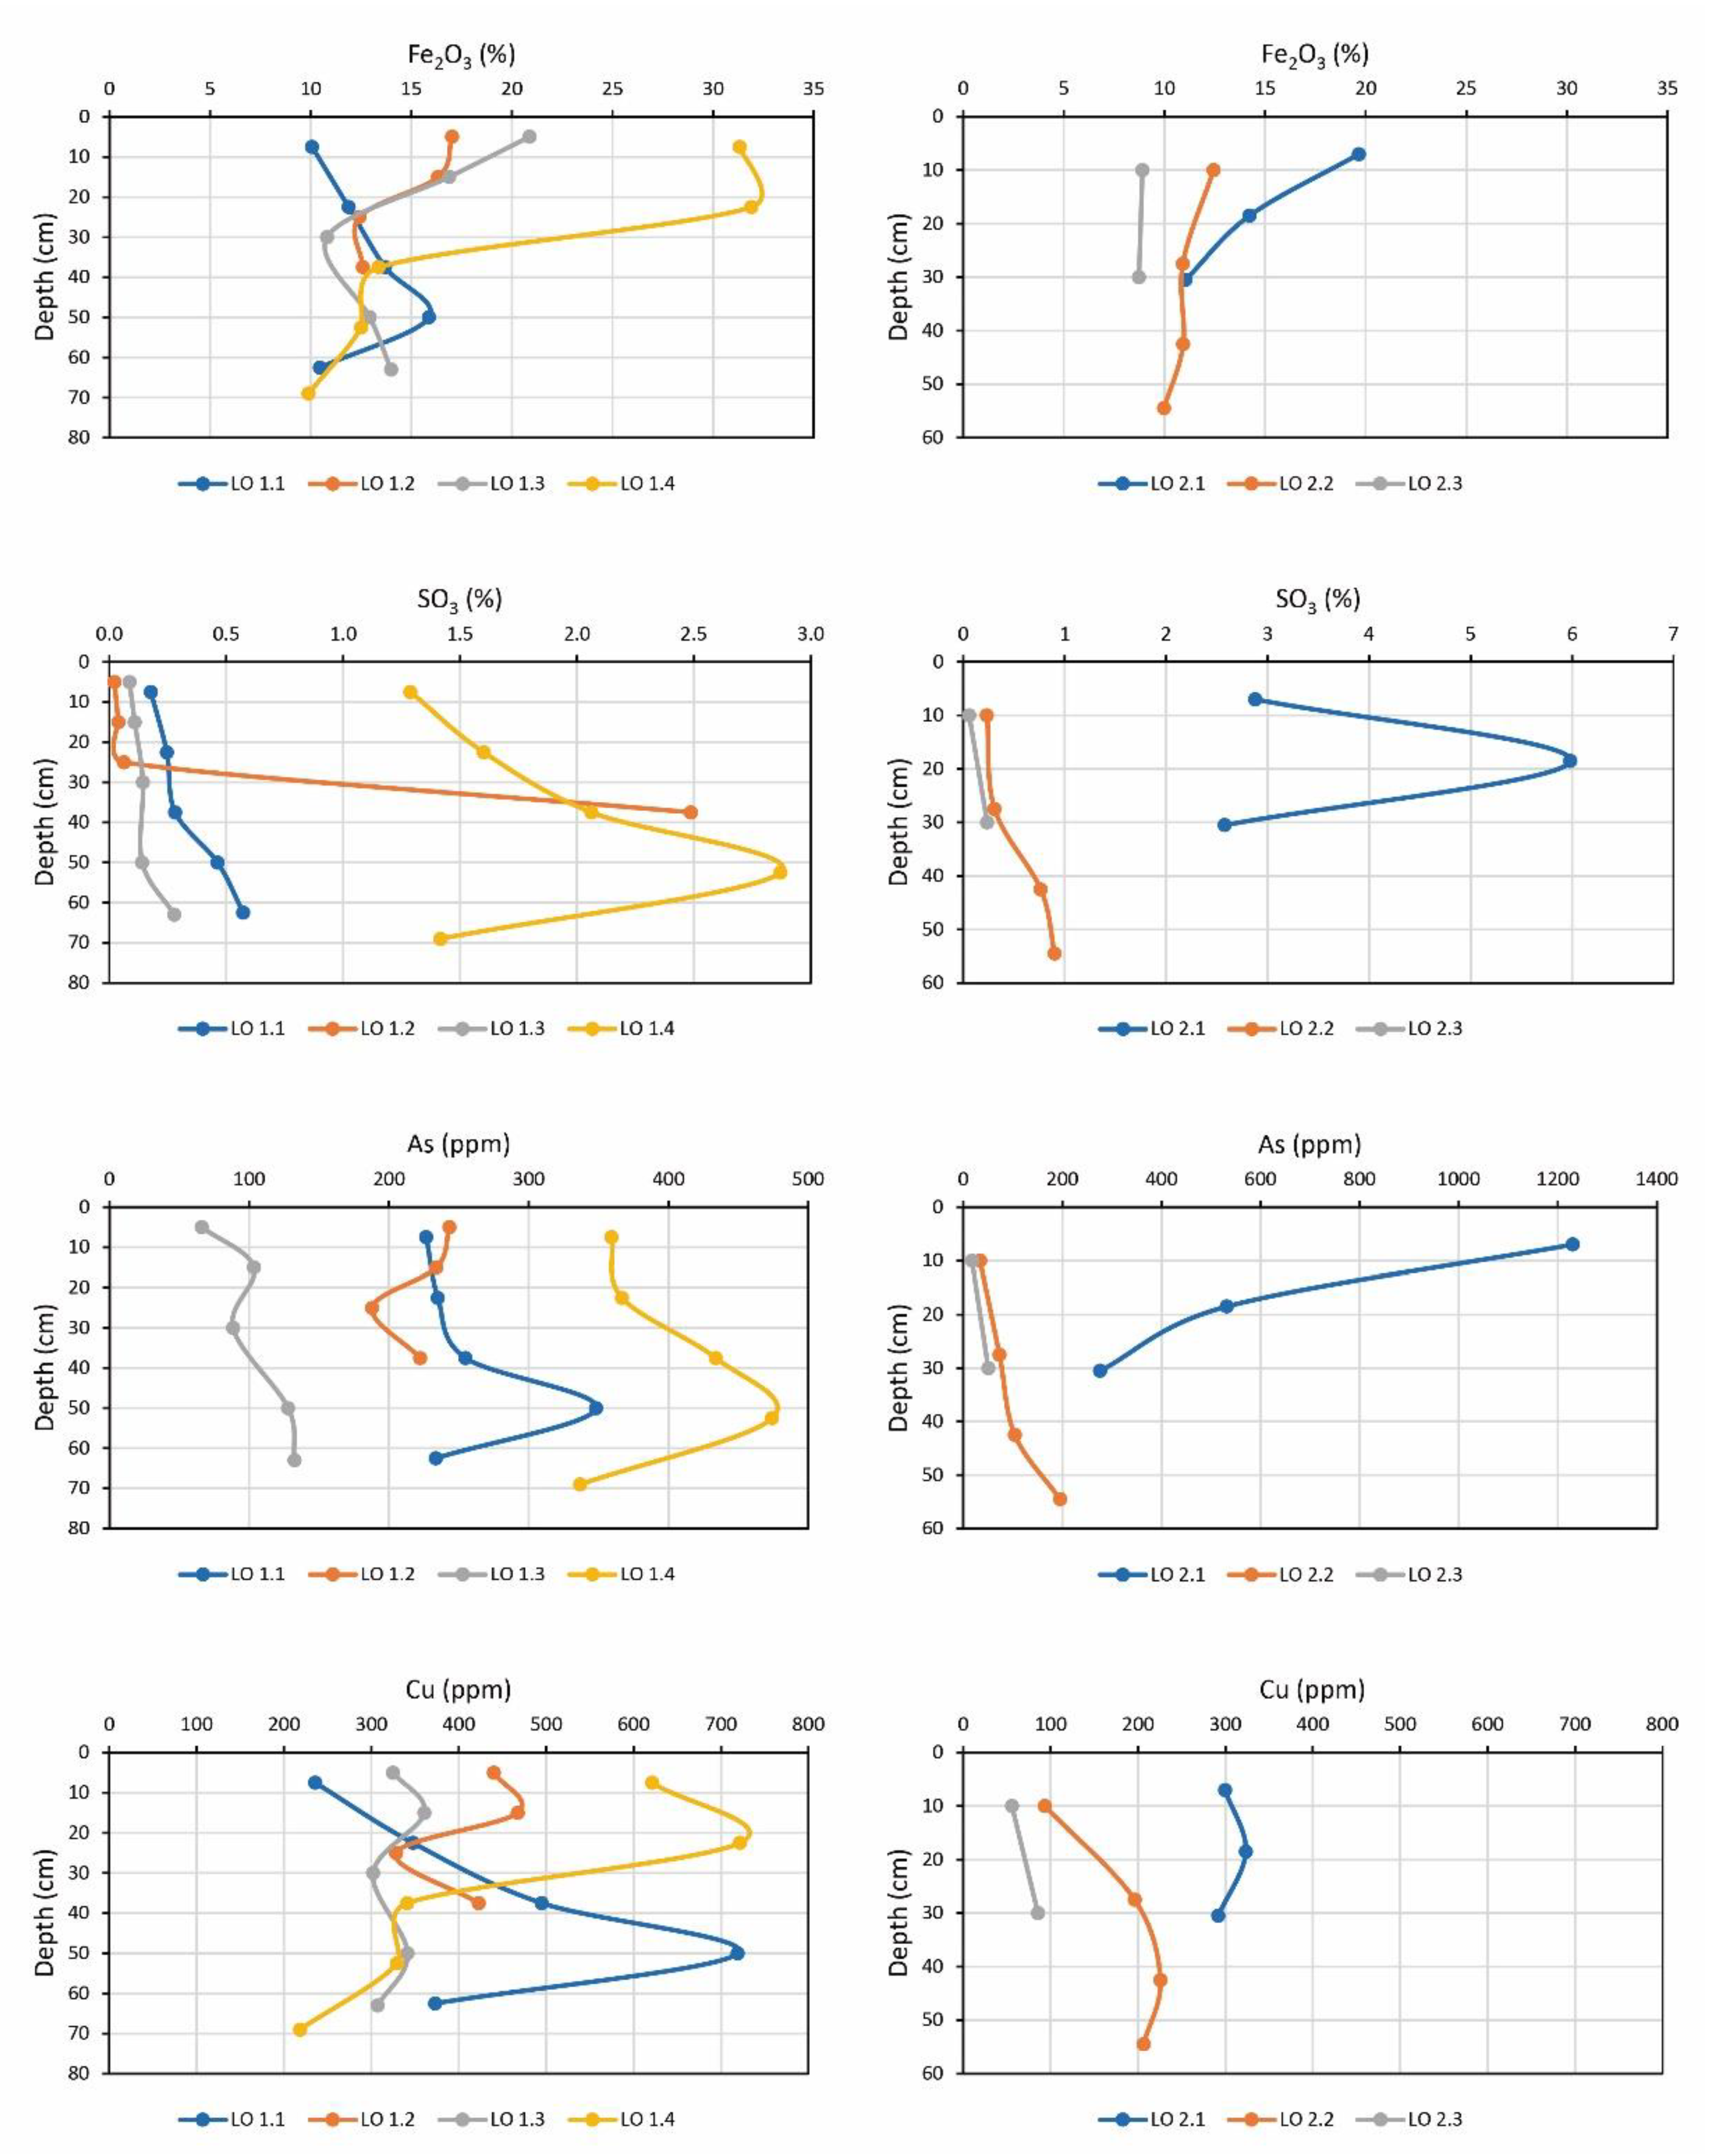
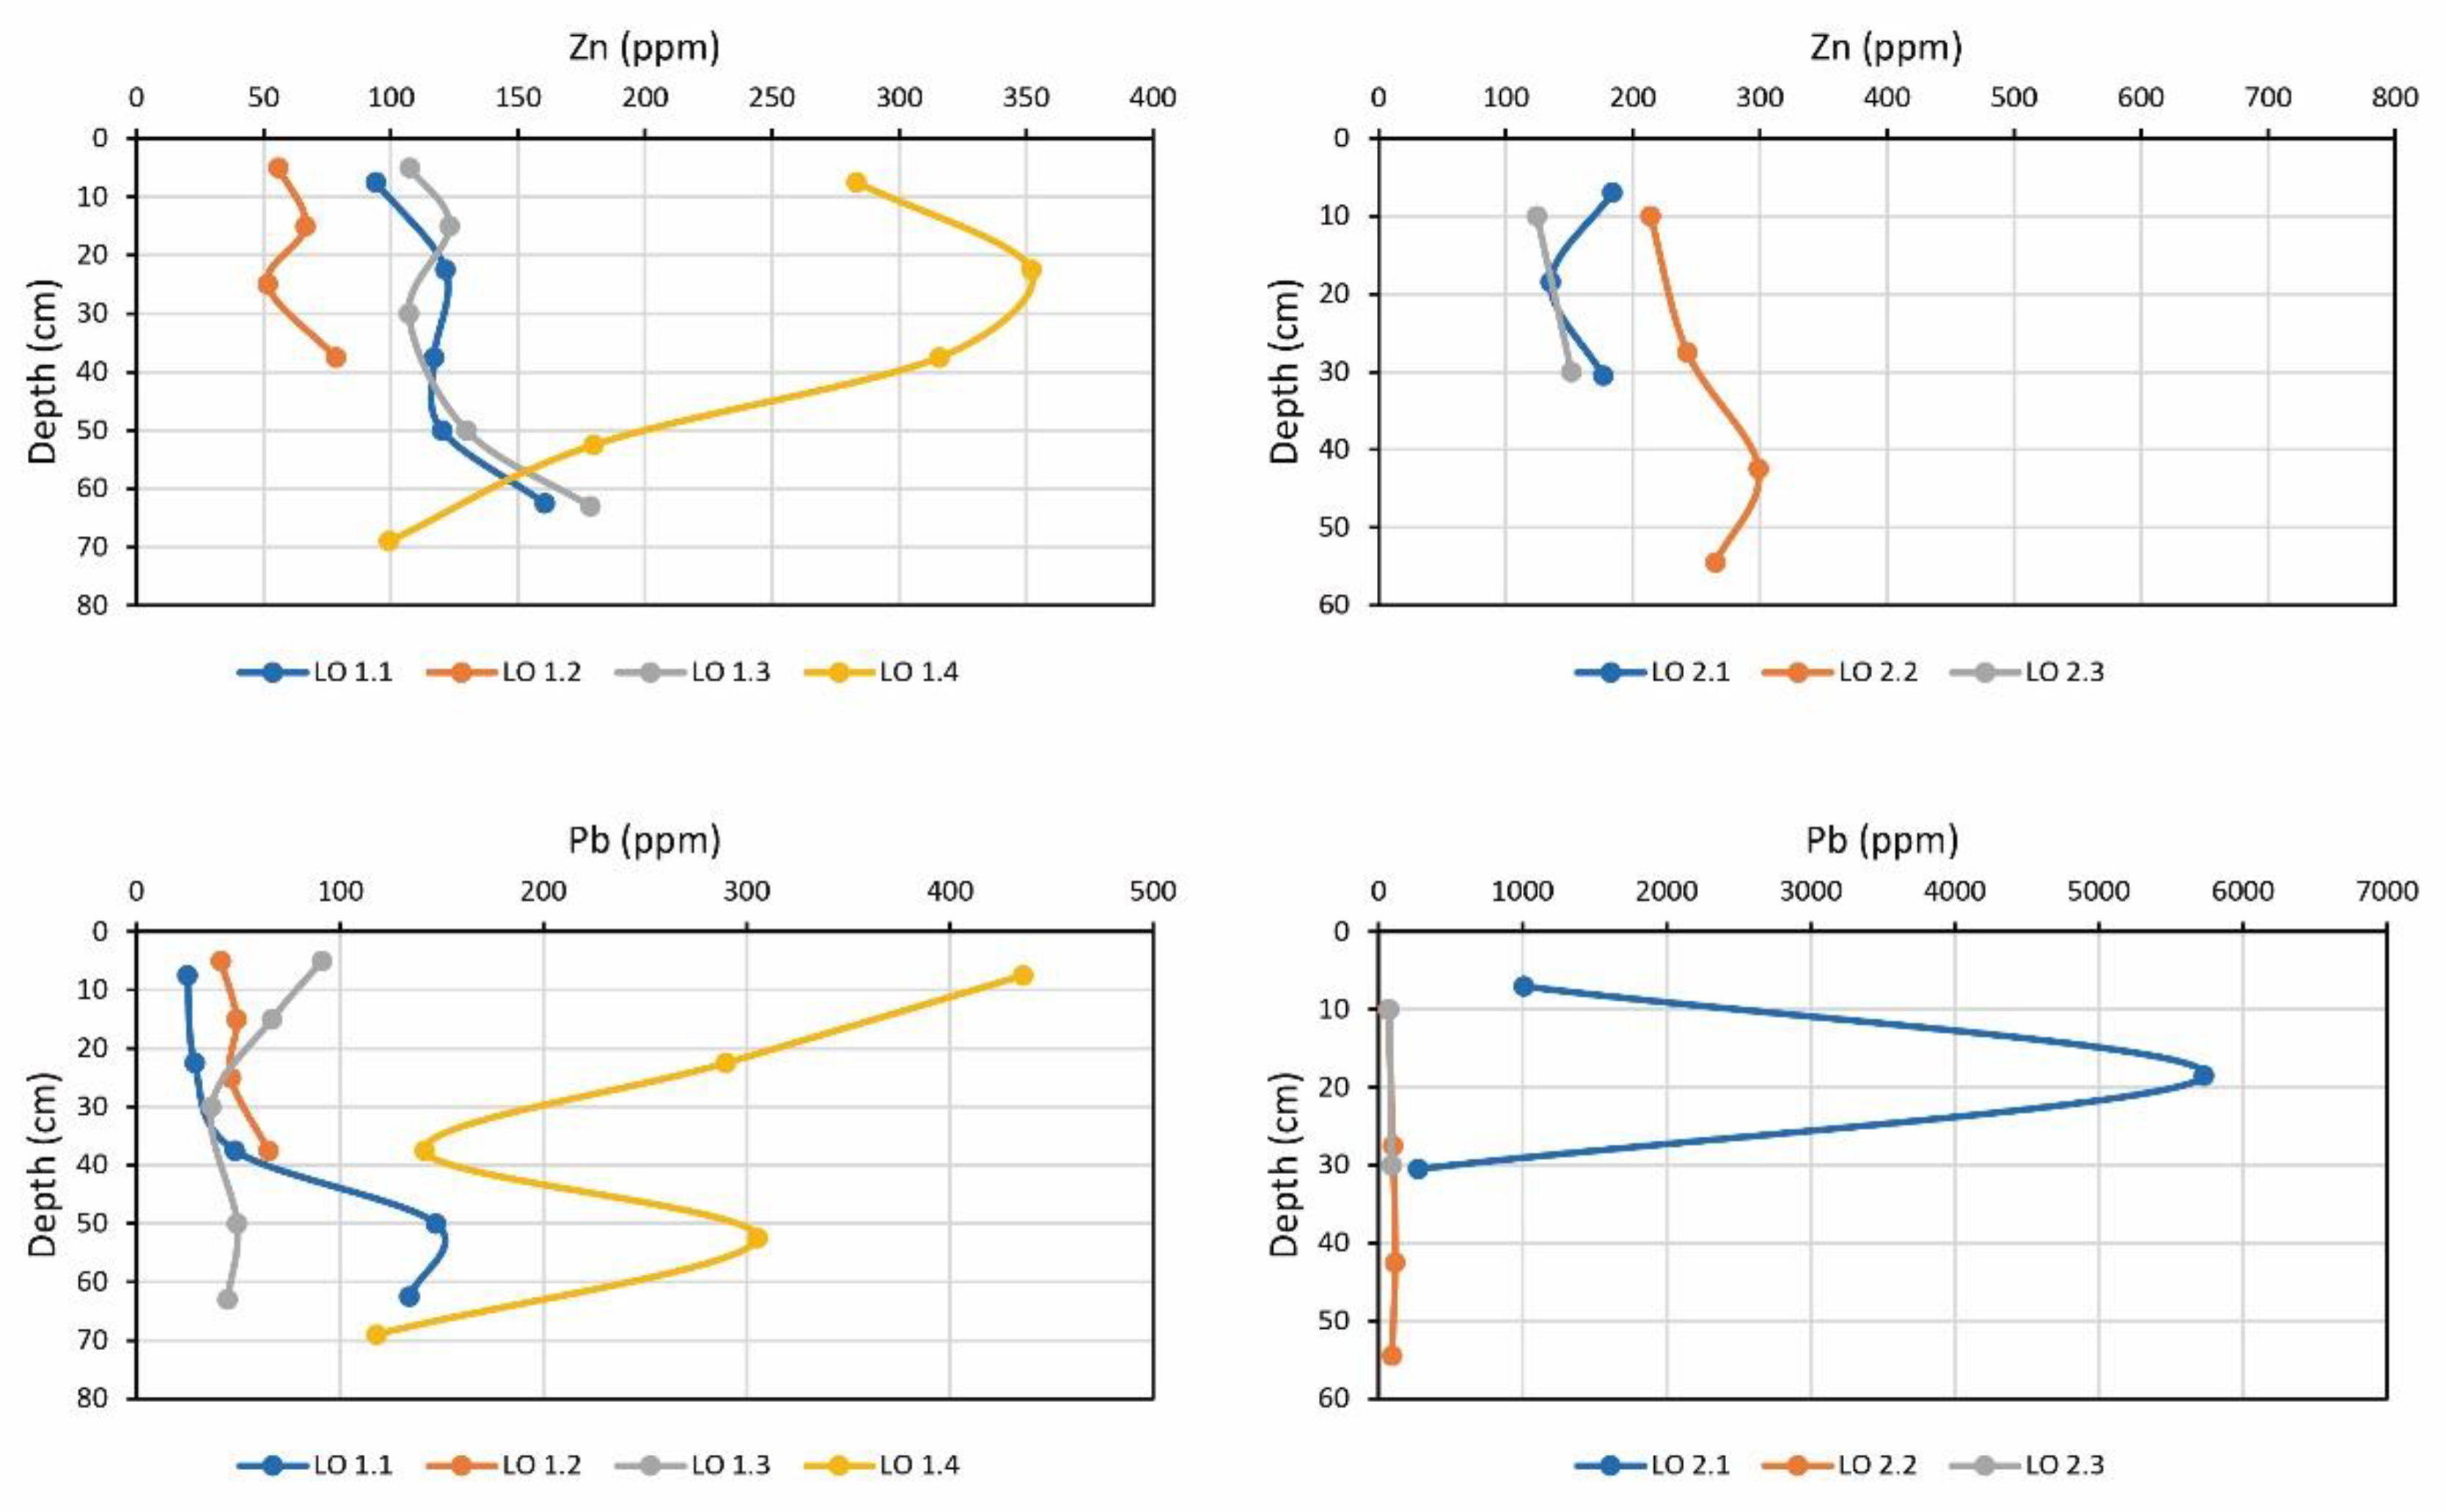
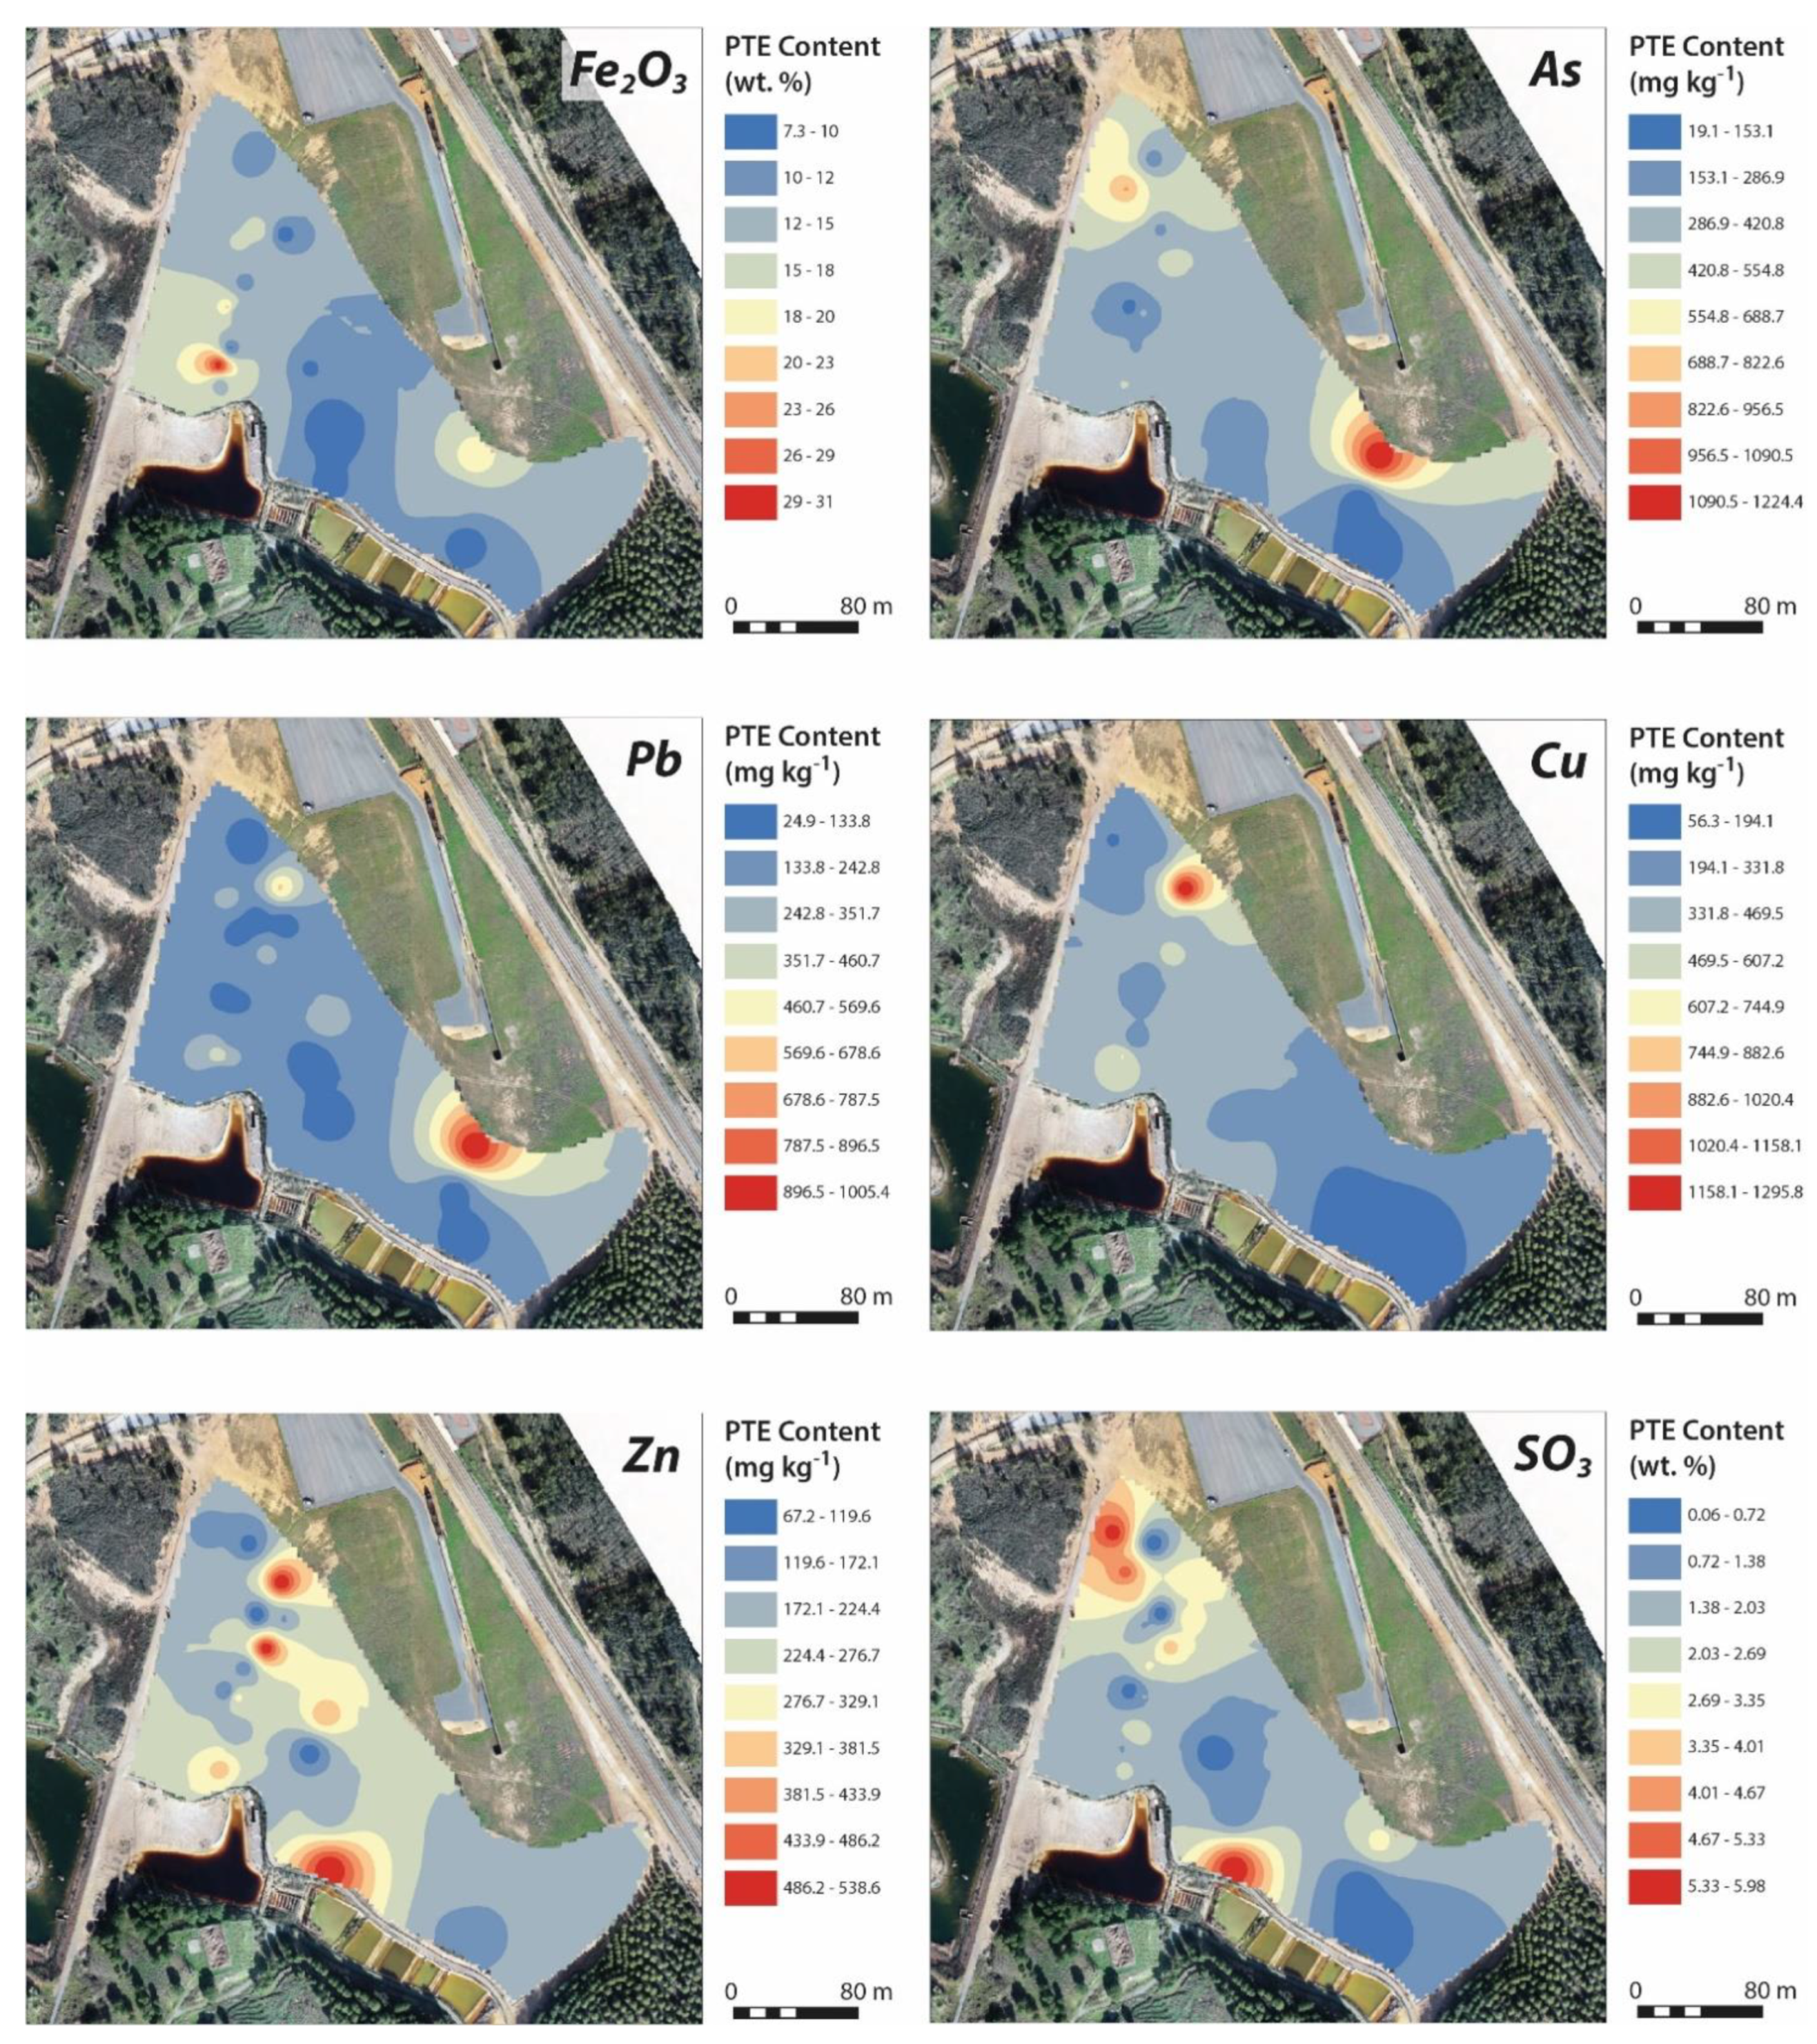
3.1. Geochemical Characterization

Total SiO2, SO3, Fe2O3, and trace-element concentrations obtained from surficial and deep samples are presented in Table 1 and Table 2. The general composition of the two transects and surficial samples was similar, characterized by notably high SiO2 (41.25 to 62.58 wt.%) and Fe2O3 content (8.73 to 57.86 wt.%), as well as moderate to high SO3 content (0.06 to 18.59 wt.%).
Trace elements such as As, Cu, Zn, and Pb were not detected in very high concentrations, although their variations at different sampling depths and locations showed an anomalous distribution. The As content ranged between 18 and 1230 mg·kg−1, with maximum values in samples LOS17 and LO2.1-01 (Table 1 and Table 2), and Pb ranged from 25 to 5730 mg±kg−1 (maximum value in sample LO2.1-02, at the beginning of transect E). Other PTEs that showed noteworthy concentration values were Cu (up to 1320 mg·kg−1, sample LOS6) and Zn (up to 546 mg·kg−1, in sample LOS6). In the case of Cd, the soil samples presented a very low content, ranging from a minimum value of 0.2 mg·kg−1 to a maximum value of only 2.6 mg·kg−1 in sample LOS7. Out of the 45 soil samples collected, 31 showed Cd content below the analytical detection limit.
The distribution of total concentration for the elements of interest is discussed next. For Fe2O3, the general tendency showed higher values near the surface and a progressive decrease with increasing sampling depth (Figure 3). In transect W, it is possible to observe that samples collected from a higher topographic position had lower concentrations than those in the low section of the transect. In this transect, Fe2O3 content seemed to be fairly consistent within the deep samples, while a progressive increase in concentration was found for the superficial samples from the beginning of the transect (at higher topographic location) to the end of the transect. Taking into account that transect W follows the trajectory of an ephemeral channel, this increase in concentration could surely be related to the mobilization of surface iron oxides by water runoff. The highest value of Fe2O3 (58 wt.%) was registered in sample LOS17, collected from the sediments accumulated in a catch basin.
The S (SO3) content followed a similar tendency as the Fe2O3, with higher values in surficial soil samples than in deep samples collected from the two transects (Figure 3). In transect W, the S content in the upper topographic positions ranged from 0.02 to 0.57 wt.%, and this appeared to be consistent throughout the soil profile, with the exception of an anomalously higher value at a depth of 40 cm in the sampling point LO 1.2. At the lower section of the transect (sampling point LO 1.4), the SO3 content was slightly higher, due to re-precipitation of secondary sulfates mobilized from upper topographic positions. In transect E, however, this tendency was reversed, with higher SO3 values near the encapsulated materials at the beginning of the transect, most probably due to the proximity to the pollution source. The absolute highest SO3 value was measured in the surficial soil sample LOS17 (18.59 wt.%).
The As concentrations showed a higher variability than that of Fe2O3, with high values specifically located at a depth of 50 cm in transect W and no clear distribution in transect E (Figure 3). In transect W, the As concentration progressively increased toward its lower section, near the AMD treatment pond, in both surficial and deep samples. The maximum values, however, corresponded to the samples located at the beginning of transect E, next to encapsulated pyrite wastes. These samples showed a significantly anomalous As concentration with a drastic reduction with depth, going from 1230 mg·kg−1 to 276 mg·kg−1 in less than 30 cm. Similarly to Fe2O3 and SO3, the highest As content was found in the sample LOS17, probably related to As adsorption processes to Fe3+ oxyhydroxides such as goethite.
Similarly to the aforementioned trace elements, the Cu contents also showed a general increase toward the lower section of transect W, with generally higher values in the surficial samples (Figure 3). This tendency appeared disrupted in the beginning of the transect and the western section of the studied area, with anomalously high values of 1320 mg·kg−1 and 719 mg·kg−1 at surface level and at a depth of 50 cm, respectively. On the other hand, transect E showed a contrasting distribution of Cu content, with higher values related to the samples located at the beginning of the transect, near the encapsulated mine wastes. The lowest Cu values appeared at the end of transect E, in samples collected in a ridge between two small depressions or swales produced by water runoff.
The Zn concentration values were fairly consistent throughout the sampling area, with no anomalously high or low values (Figure 3). Maximum Zn values (546 mg·kg−1) appeared at upper positions in the slope, near the encapsulated materials in the western section of the study area. Aside from those values, the general tendency showed a slight increase in Zn content toward the lower end of the slope, at lower topographic positions, for both surficial and deep samples. Similarly to Fe2O3 and SO3, this may indicate that Zn content was mobilized by water runoff from the materials at higher topographic positions, with relatively high Zn content, to the lower sections of the ephemeral channels. Samples collected from ridges on the slope (LO1.1 and LO1.2 in transect W, and LO2.3 in transect E) exhibited the lowest Zn values, confirming that Zn content in soils may be related to mobilization processes by water runoff.
The concentration of Pb was strongly anomalous in the lowest section of transect W and in the upper samples in transect E, showing strongly fluctuating values (Figure 3). This element appeared to be concentrated near the surface, although the highest obtained value (5730 mg·kg−1) corresponded to a depth of approximately 20 cm in the samples located at the upper section of transect E. Although Pb content was generally low for most of the collected samples, it is worth noting that, similarly to the Zn content, Pb concentration appeared to be lower in samples collected at ridge positions in the slope (LO1.1 and LO1.2 in transect W, and LO2.3 in transect E), while generally higher values of Pb appeared in sediment samples collected from the ephemeral channels.
The heterogeneity seen for the PTE content in surface and profound soil samples is common in small and highly anthropized mining areas. In those areas, the mine waste layout in heterogeneous mine dumps, usually mixing ore and gangue minerals, together with the PTE and particle dispersion to the environment through operational activities, leaching, and meteorological events, usually produces a distribution of PTEs with no apparent structure or clear tendency.
The surficial distribution of elements of interest is also shown in Figure 4. It includes information obtained from the surficial soil samples (LOS1 to LOS17) and samples collected from the first 20 cm of the soil profile in transect W and E.
Isocontent maps for Fe2O3 exhibit two clearly distinct areas of surficial concentration of this PTE: (1) an area of sediment accumulation at the western section of the study area, corresponding to the lower section of one of the ephemeral channels, and (2) the upper section of transect E, next to the encapsulated mine waste deposit. In the first case, the distribution of high concentrations of PTEs could be related to the mobilization by runoff of sediments and waste materials from the upper section of the study area and consequent accumulation in the lower section of the channel. In the second case, the high content of trace elements in the surficial samples could be due to the proximity to the encapsulated mine wastes. The geotextile fabric and soil layer that covers this area reduce the amount of infiltrating water that makes contact with the mine wastes, decreasing the impact of weathering processes and the mobilization of PTEs to lower sections of the slope.
As and Pb showed a similar surficial distribution, with higher values at the upper section of transect W and transect E. These two trace elements had notably distinct mobilization conditions. Therefore, it is reasonable to think that the coincidence in their distribution pattern correlated to the proximity to the source of PTE contamination (in this case, the encapsulated mine wastes at the top of the deposit) and not to the mobilization processes. Cu concentration in soil samples followed a similar pattern, with higher values on upper topographic positions. In this case, however, maximum concentration values corresponded to transect W and the western section of the study area, while the eastern section exhibited low Cu content.
The distribution of Zn presented a different pattern compared to the other trace elements, with higher concentrations at the central and western section of the study zone. The maximum surficial concentrations were observed at the center of the study area, next to the AMD treatment system. This location was considered the point of discharge for all the superficial runoff coming from this area of the study zone, and it showed signs of being periodically flooded. The high PTE content could, therefore, be understood as the consequence of lixiviation and mobilization of the highly mobile element Zn from upper topographic positions. Other areas of high Zn content were scattered through the western section of the study area, with no clear correlation between them.
Although not considered as a PTE, the S (SO3) content also showed a similar spatial distribution as Zn, with higher values located at runoff discharge points at the center of the study area and near the pollution source at the upper sections of the ephemeral channels. In this case, the S content was indicative of the presence of sulfates in soils, which is typical in areas affected by AMD processes.

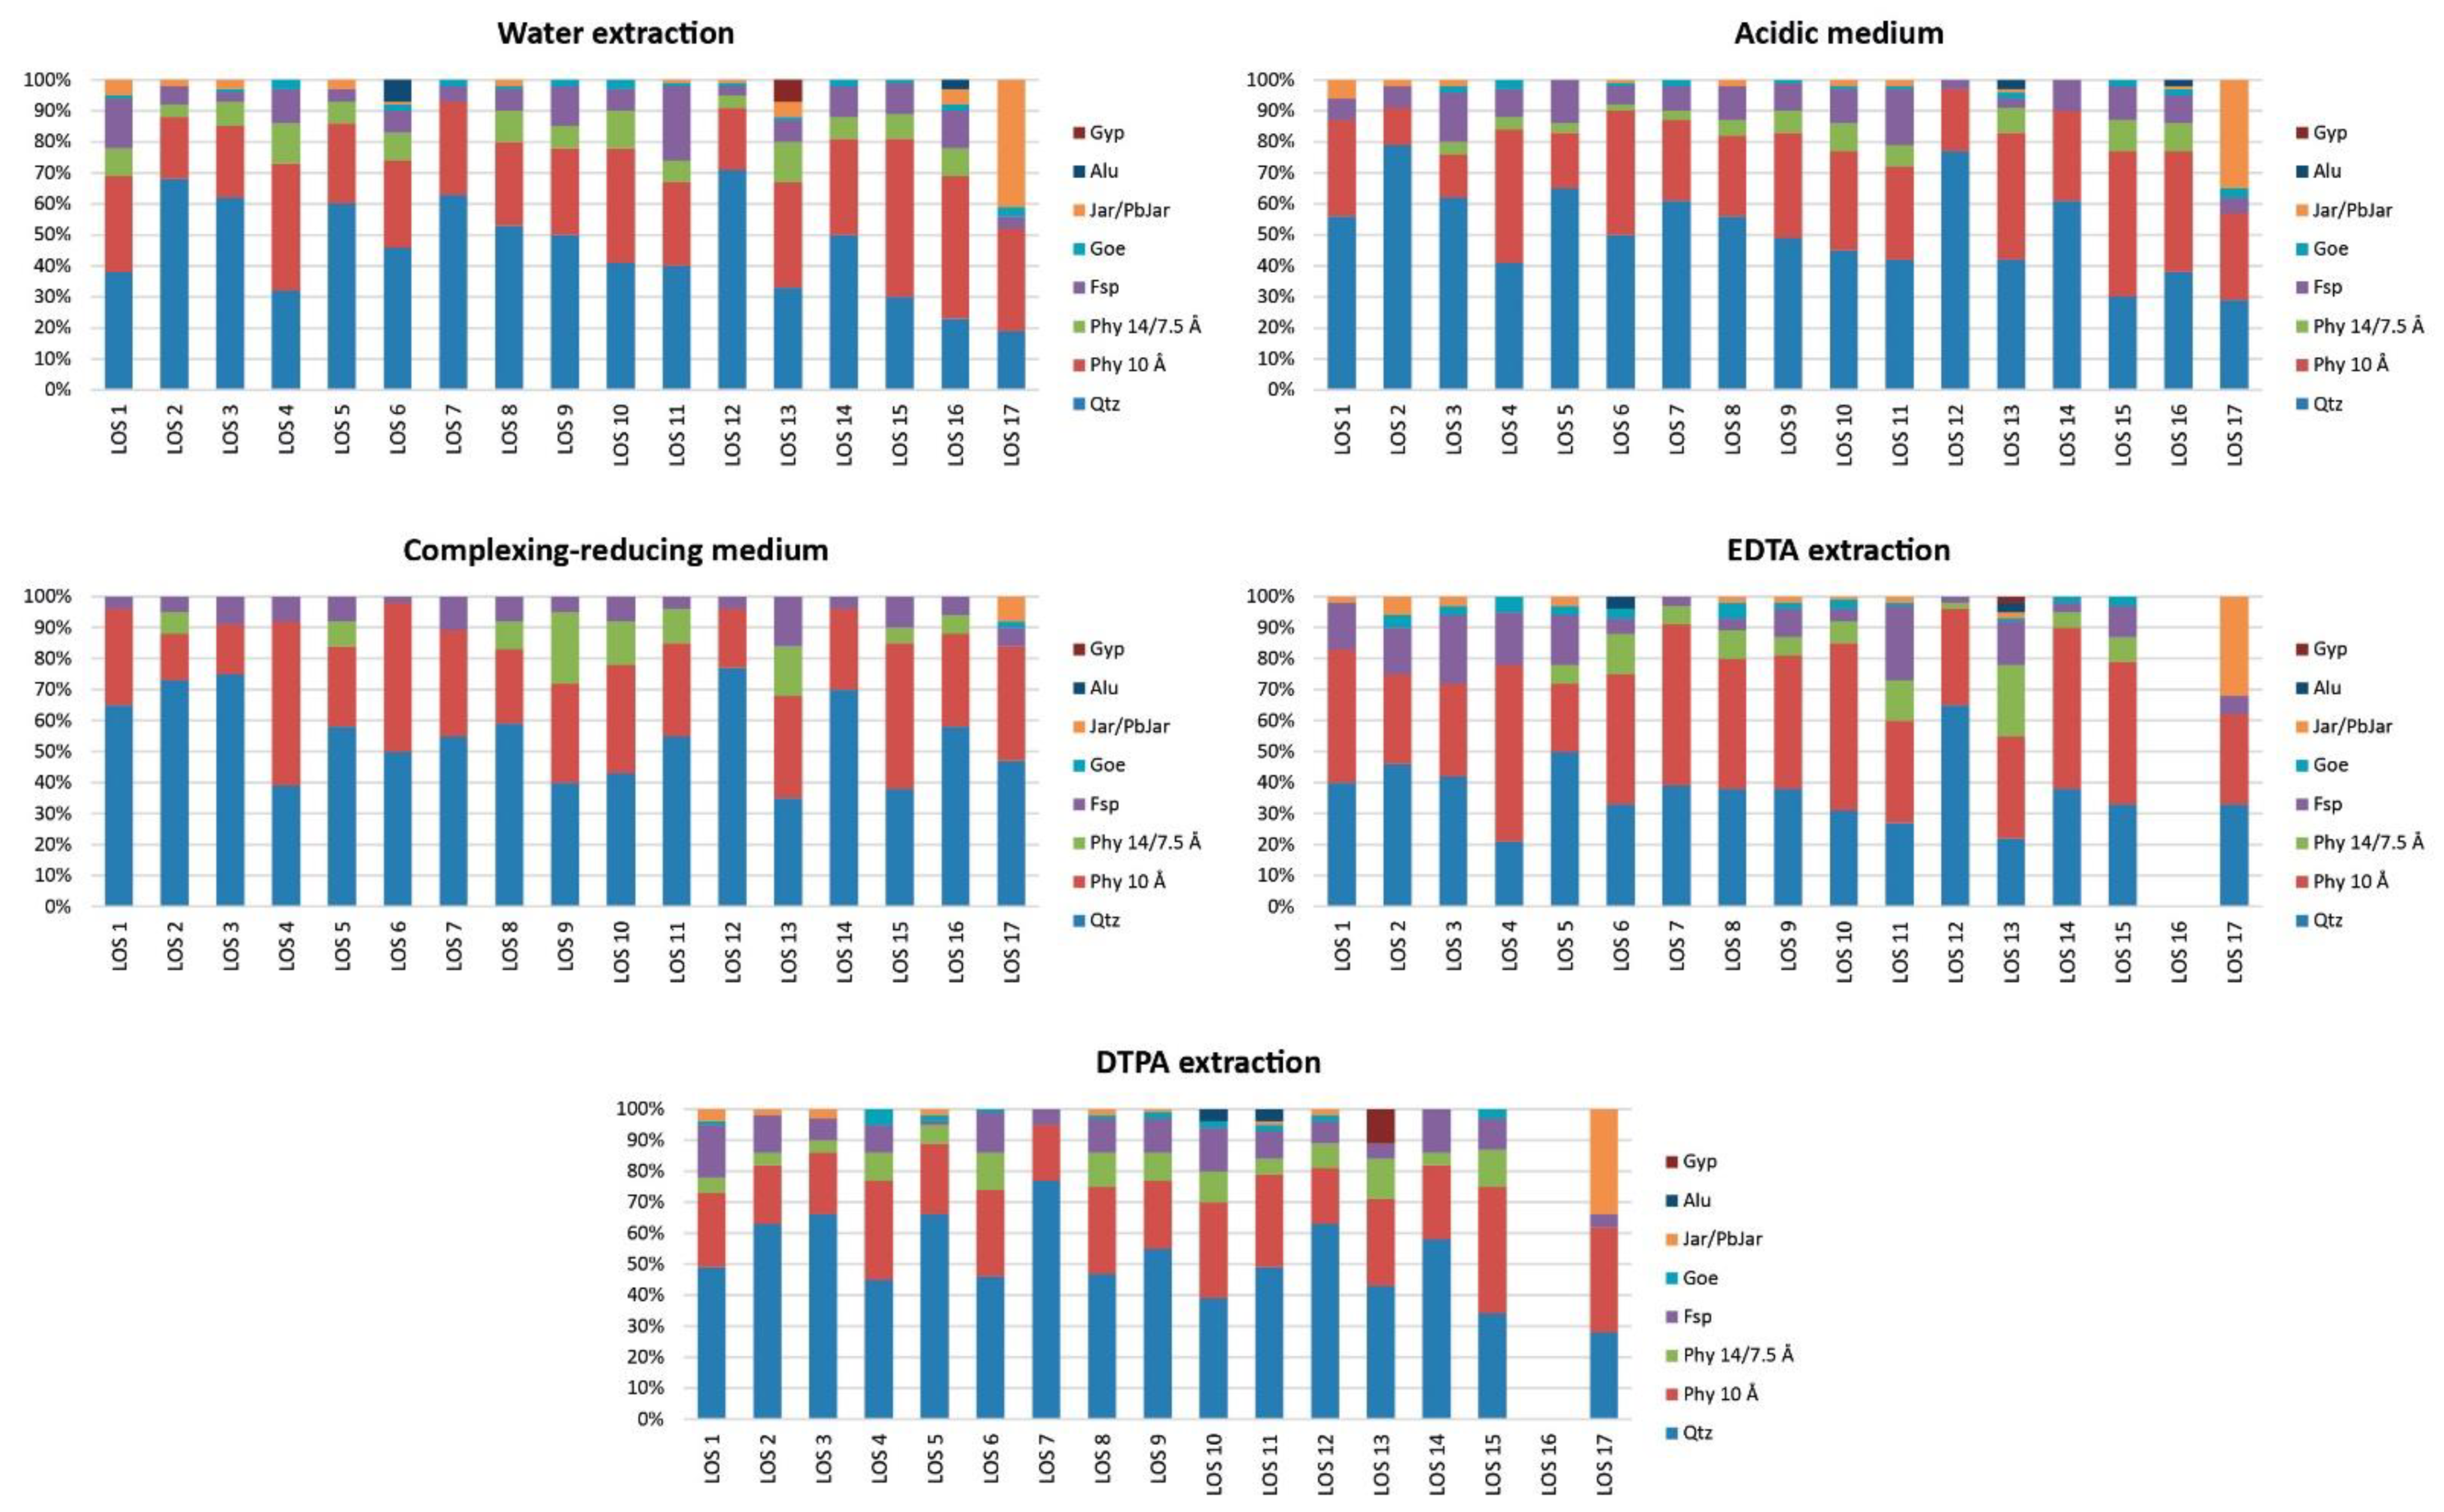
3.2. Mineralogical Characterization

A nearly homogeneous mineralogical composition can be inferred from the X-ray diffraction analysis of the surficial soil samples (Table 3). They were mainly composed of quartz (30–65%), 10 Å phyllosilicates (mica-illite, 25–60%), and feldspars (5–15%), with goethite (Fe3+O(OH)), jarosite/plumbojarosite (KFe3+3(SO4)2(OH)6; Pb0.5Fe3+3(SO4)2(OH)6), and 14 Å/7.5 Å phyllosilicates (chlorite) as minor phases. Alunite (KAl3(SO4)2(OH)6) and gypsum (CaSO4·2H2O) were identified as accessory phases in some samples. In all analyzed surficial soil samples, silicate minerals inherited from the host rocks and metasediments constituted 55–90% of the total mineralogy. The remaining mineralogical content comprised secondary minerals (jarosite/plumbojarosite, alunite, and goethite) produced by weathering processes affecting iron sulfide ores. Primary ore minerals such as pyrite were not identified by X-ray diffraction, probably due to the oxidizing processes occurring in the uppermost meters of the soils in the studied area.
These results agree with the geochemical characterization of the soil samples. High SiO2 content was directly related to the silicate mineral phases in the soil samples (quartz, phyllosilicates, and feldspars), while Fe2O3 was associated with Fe presence in clay minerals, jarosite, plumbojarosite, and goethite. Sulfur (SO3) content was mainly related to the presence of jarosite, plumbojarosite, alunite, and gypsum. This was especially evident in sample LOS17, where anomalously high values of jarosite and plumbojarosite coincided with high S (SO3) content (18.59 wt.%).
No significant differences in mineralogical composition were observed between samples collected in upper, mid, and lower sections of the ephemeral channels, with the exception of high secondary gypsum content in the LOS13 sample and a slightly higher jarosite/plumbojarosite and alunite content in some of the samples collected in upper topographic positions. Nevertheless, the total content of soluble secondary sulfates (jarosite, plumbojarosite, and alunite) in the surficial soil samples was still considerably low (up to 9%), which may indicate the presence of active dissolution and mobilization process of sulfates in the study area.

3.3. Multivariate Analysis

A geostatistical multivariate analysis was carried in order to confirm possible relationships between the total PTE and mineralogical content of the surficial soil samples (LOS1 to LOS17). The Pearson correlation analysis demonstrated a positive correlation between the jarosite/plumbojarosite content and Fe2O3 content (Pearson correlation coefficient, R = 0.9451), between SO3 and jarosite/plumbojarosite content (R = 09344), and between Pb and jarosite/plumbojarosite content (R = 0.9469). No other relevant positive or negative correlations were found in the surficial soil samples.
A factor analysis for the PTE content and soil mineralogy was also carried out to help diagnose relationships between variables (Table 4). The first four extracted factors were the only ones to display eigenvalues higher than 1. Using the four-factor model, the final factor solution represented 79.97% of the variance in the analyzed data. Factor 1 (F1) contained Fe2O3, SO3, Pb, As, and jarosite/plumbojarosite, all with a positive varimax rotated factor, as well as SiO2 and feldspars with a negative factor. This factor grouped the elements and mineralogy commonly related to AMD processes (Fe2O3, SO3, Pb, As, and jarosite/plumbojarosite) and the components of the soil samples related to the host rock (SiO2 and feldspars). Factor 2 included alteration minerals such as phyllosilicates and goethite (positive factor), as well as quartz and Cd (negative factor). The presence of Cd in F2 may not be accurate due to the very low Cd content detected in all soil samples. Factor 3 comprised alunite and gypsum (positive factor), which are both soluble sulfate phases. Lastly, F4 contained Zn and Cu (positive factor), with no clear correlation between them.
Figure 5 shows the score plots for F2–F1 and F3–F1. In the first case, samples with relative low quartz content plotted above the Y-axis (F2). Only a few of the analyzed samples (LOS1, LOS2, LOS3, and LOS17) showed relative high values of trace elements and mineral phases associated with AMD (Fe2O3, SO3, Pb, As, and jarosite/plumbojarosite) in comparison to the host rock phases (feldspars, SiO2–quartz). In the score plot for F3–F1, most of the samples plotted in the lower left margin of the graphic, which exemplified a low soluble sulfate content (alunite, gypsum, and jarosite/plumbojarosite), in agreement with the results obtained from the mineralogical characterization of the soil samples.

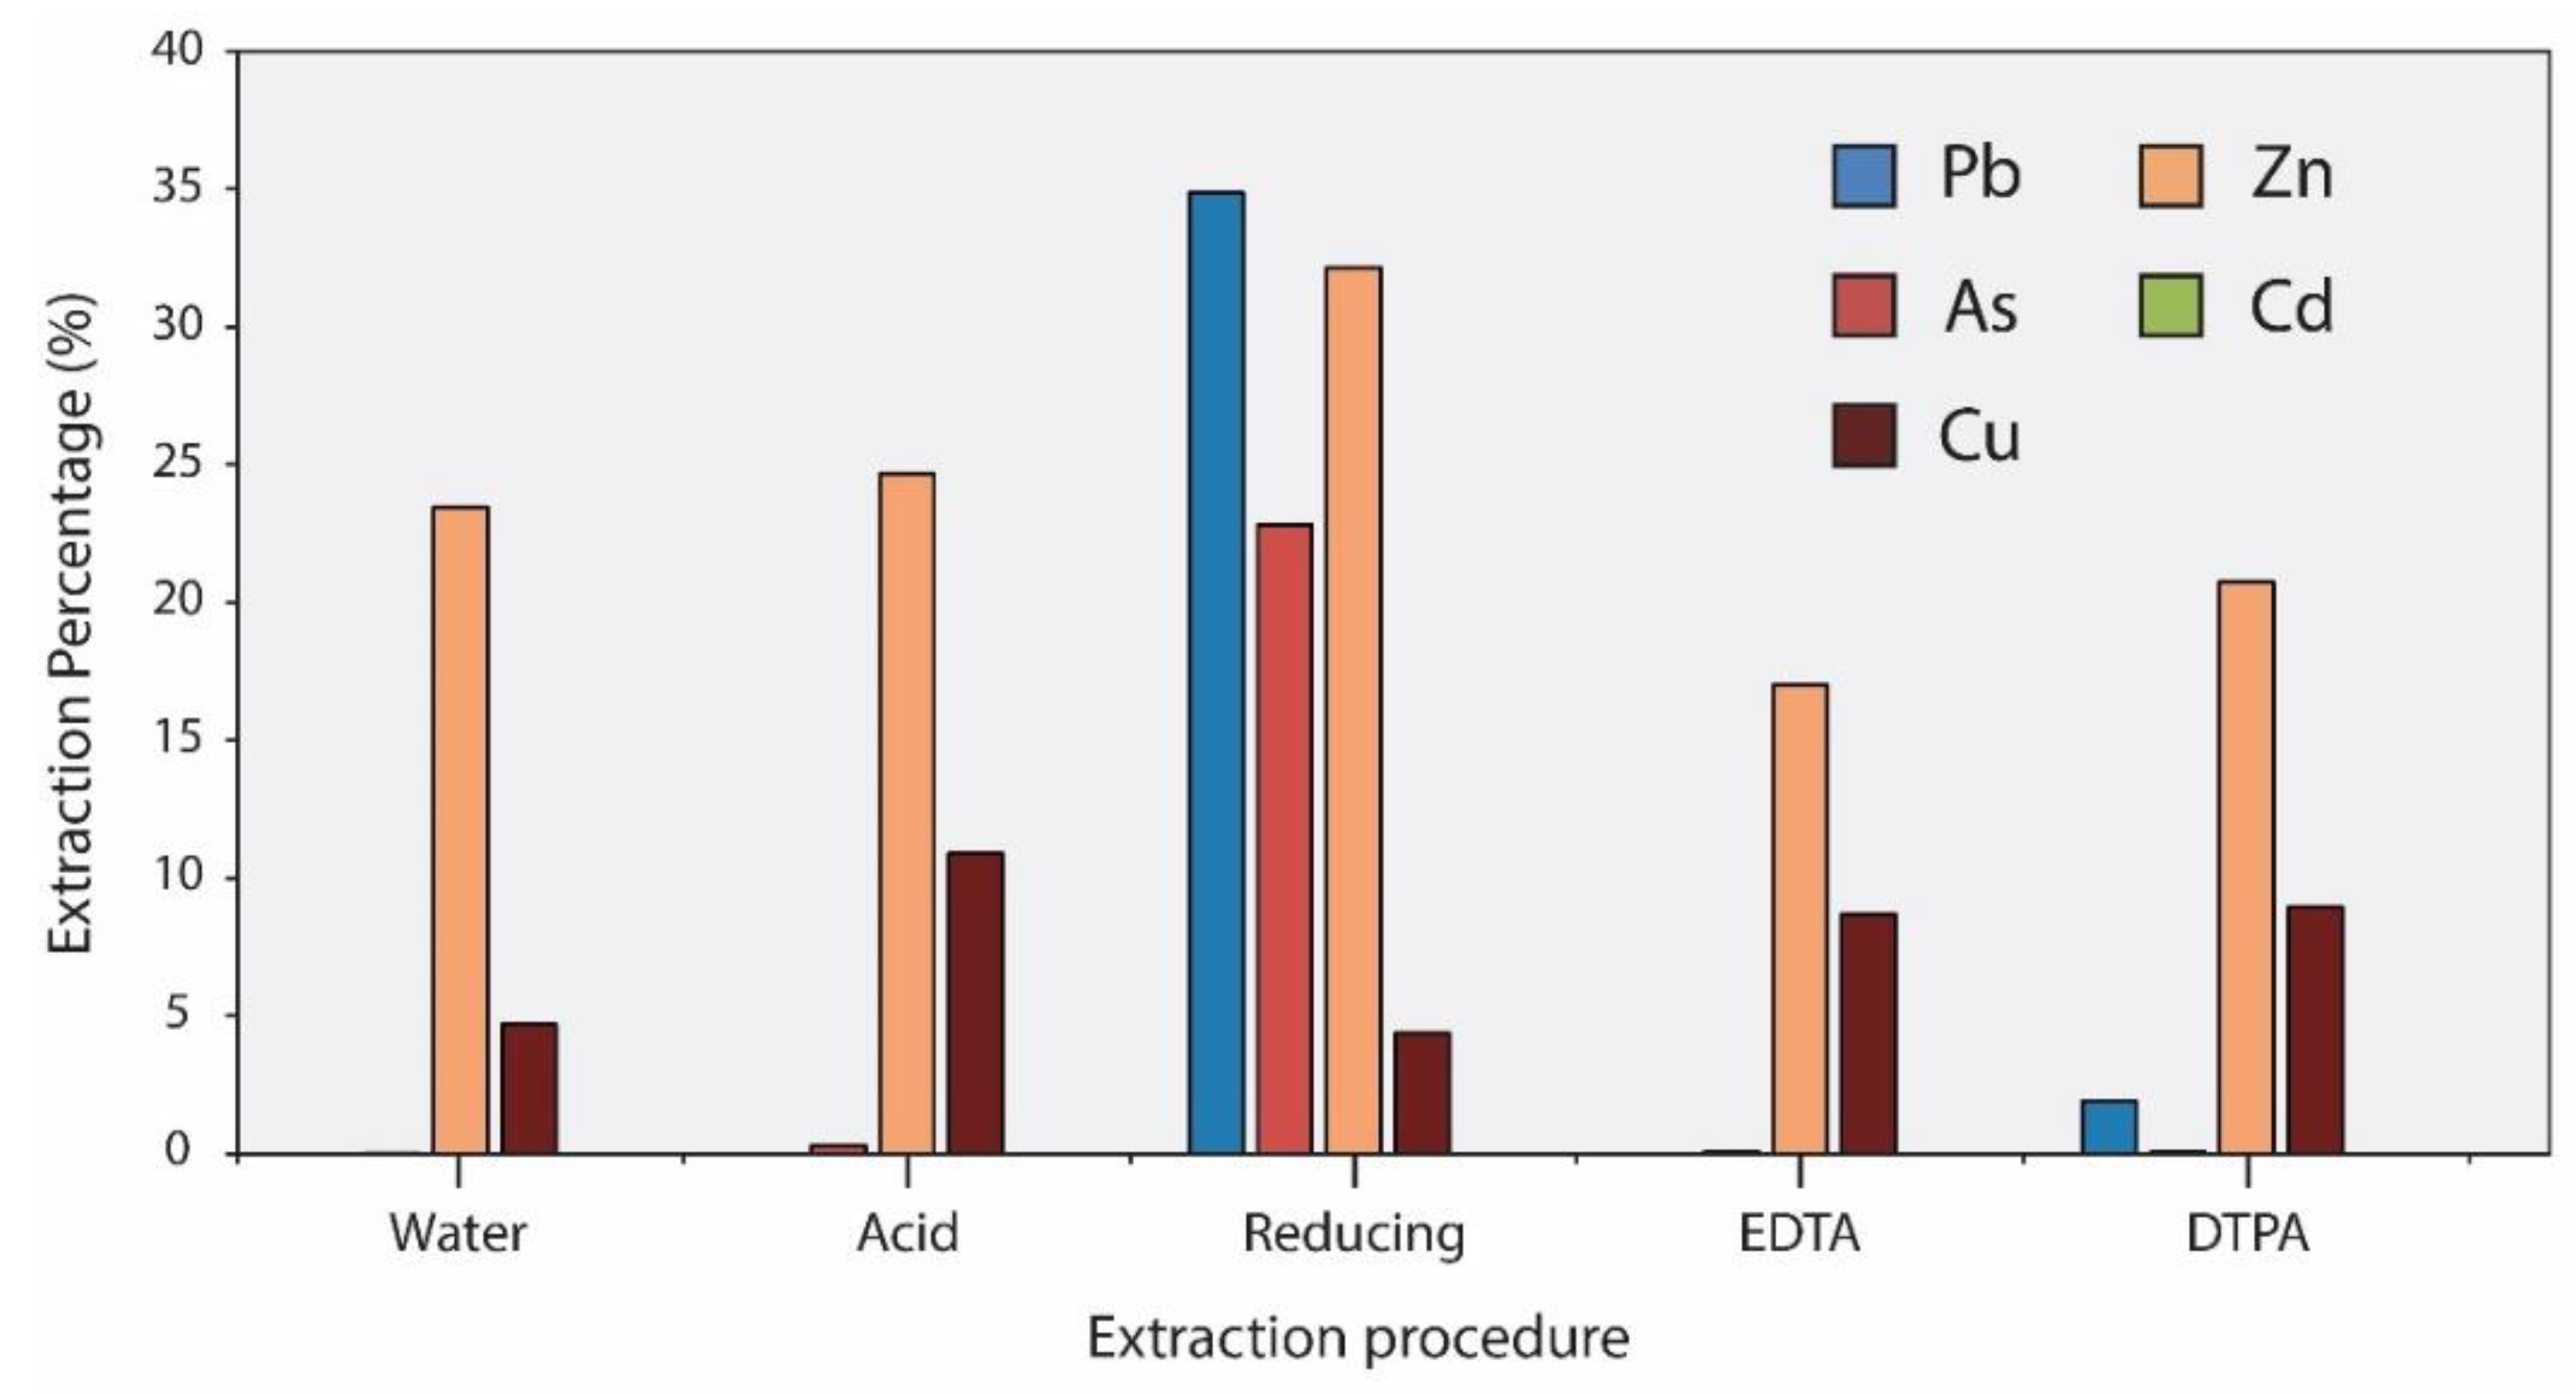
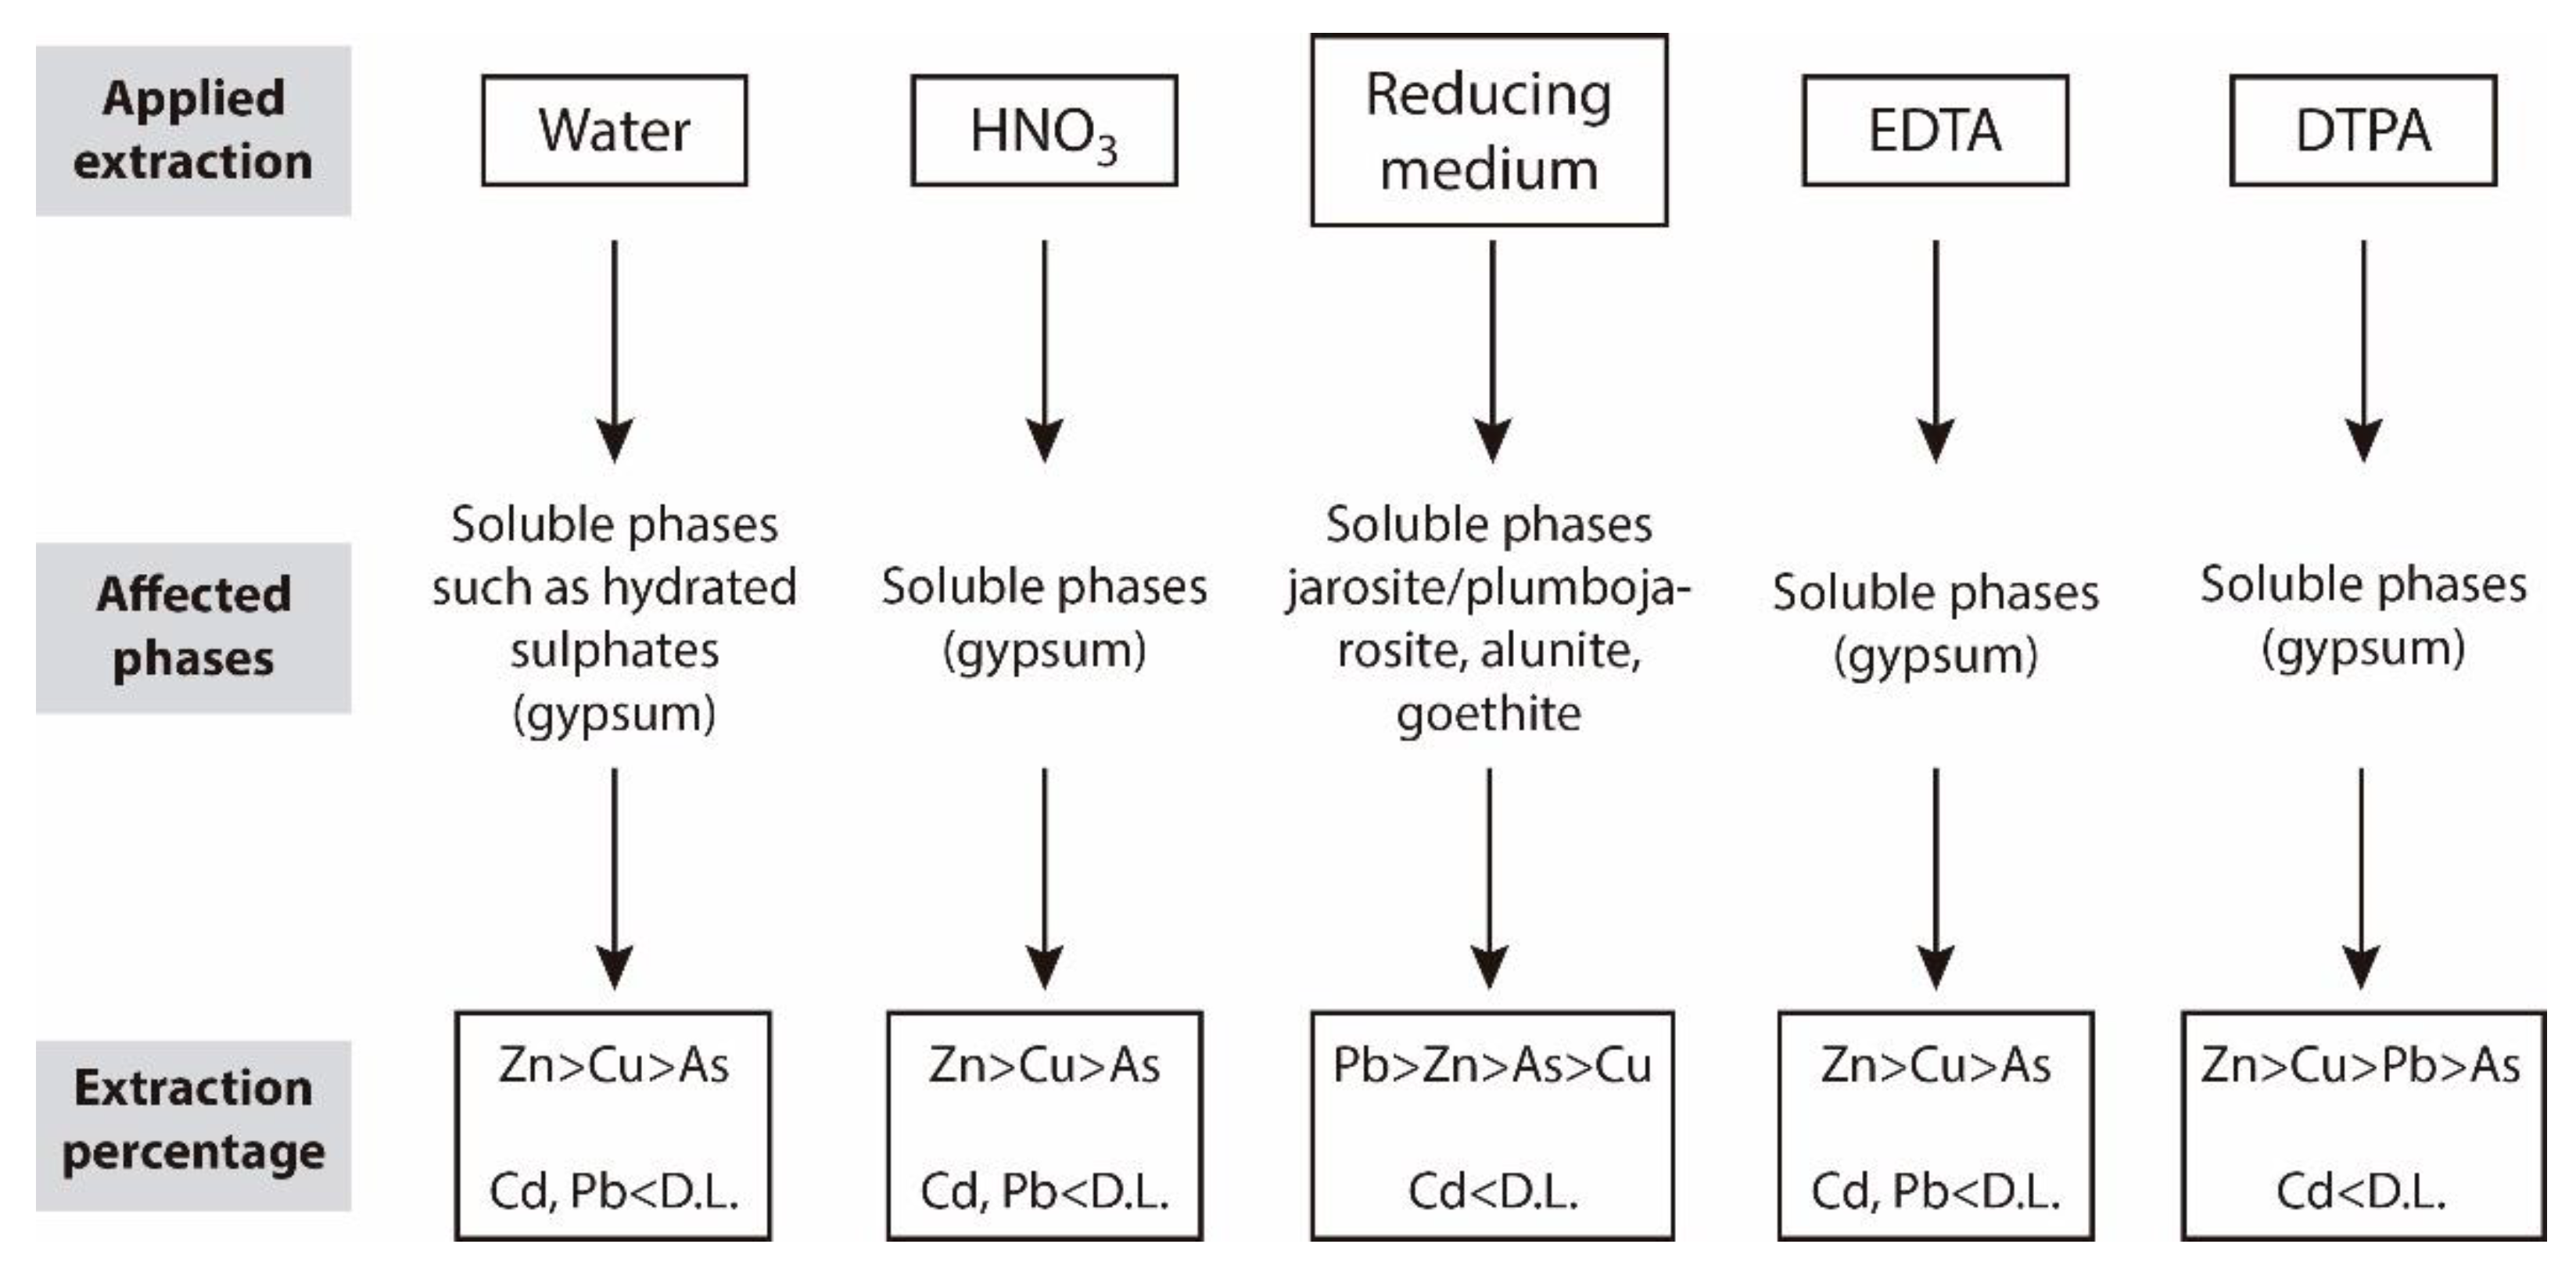
3.4. Selective Extractions

3.4.1. Water Extraction

The mobility of PTEs under natural conditions varied greatly between each of the analyzed trace elements (Table 5). The obtained results show that the highest concentration values in the soluble extraction corresponded to Zn, with a mean value of 69.8 mg·kg−1, while Cu presented intermediate values around 23.4 mg·kg−1, with highly contrasting maximum and minimum values of 99.6 mg·kg−1 and 0.1 mg·kg−1, respectively. The As extracted exhibited low mobility rates under natural conditions, with an average value of 0.04 mg·kg−1 of extractable As. Both Pb and Cd concentrations appeared below the analytical detection limit in all the measured samples; in the case of Pb, this was an indication of the low mobility of the element, whereas, for Cd, this fact was related to the very low total concentrations found.
The water extraction percentage results show that release of Zn was considerably high, with an average value of 23.4% total Zn mobilized from the original soil samples. The extraction percentages for the other PTEs were notably lower, however. Both Cu and As presented the lowest quantified absolute values of extraction percentage after water extraction, with minimum values of 0.03‰ and 0.002‰ of total Cu and As, respectively. In the cases of Pb and Cd, the extraction percentages could not be accurately estimated, due to the concentration values appearing below the analytical detection limit.
In general, there were no significant variations in the mineralogical composition of the samples after the water extraction (Figure 6), with the exception of a slight increase in some mineral phases, such as quartz and phyllosilicates, as a result of the disappearance of gypsum in some samples, i.e., samples LOS8 and LOS11.

3.4.2. Acidic Medium Extraction

Mobilization of PTEs under acidic conditions showed relatively similar results to the water extraction values (Table 5). In conditions comparable to AMD, Zn appeared as the most mobile PTE, with an average value of 72.6 mg·kg−1 in the extraction solution. When submitted to the acidic medium extraction, Cu showed the highest concentration value in comparison to other extracting conditions, with values ranging from 104.3 mg·kg−1 to 10.4 mg·kg−1, and an average value of 42.8 mg·kg−1. The As content in the soluble fraction after the acidic medium extraction was the lowest of the quantified PTEs, with its maximum value reaching only 4.048 mg·kg−1 (mean value of 1.3 mg·kg−1). Similarly to the water extraction, Pb and Cd appeared below the analytical detection limit in all samples.
Regarding the extraction percentage results, Zn showed the highest mobilization percentage, with 24.7% of total Zn content, followed by Cu, with a mean value of 10.9%. The results showed that, under acidic conditions, As was expected to be almost immobile, with an average extraction percentage of 0.29%. The extraction percentages of Pb and Cd could not be estimated, due to the lack of precisely quantified values.
The mineralogy of residues after the extraction showed the complete disappearance of water-soluble phases such as gypsum in samples LOS8, LOS11, and LOS13. The rest of the mineral phases remained unaffected, with a small relative increase in concentration due to the decrease of the aforementioned soluble phases.

3.4.3. Complexing–Reducing Medium

Amongst the five extraction procedures, soil samples subjected to the complexing–reducing medium extraction showed the highest PTE mobility regarding As, Zn, and Pb content, with average concentration values of 111.1 mg·kg−1, 84.5 mg·kg−1, and 55.8 mg·kg−1, respectively (Table 5). Regarding the Pb content, due to the fact that some samples showed Pb content below analytical detection limit, we considered the Pb content of those samples as half the detection limit value (DL/2 = 0.75 mg·kg−1), in order to estimate its mean value. By doing this, samples with low extractable Pb content could also be taken into consideration when estimating the mean value.
On the other hand, Cu content in the soluble extract appeared lower in comparison with the other extraction procedures, with an average value of 11.5 mg·kg−1. As with the other extractions, Cd content could not be quantified and appeared below the analytical detection limit.
With regard to the extraction percentages results, PTE mobilization was considerably high for Zn (30% of total Zn content) and As (mean value of 22.8%), while the Cu extraction percentage was relatively low, with an average value of 3%. In contrast to the previous extraction procedures, quantifiable lead content was released under complexing–reducing conditions in some samples. The extractable Pb released in this medium reached notably high values, with some samples exhibiting extraction percentages above 50%, reaching a maximum value of 95.27% total Pb content.
X-ray diffraction results showed a complete depletion of hydrated and secondary sulfates, such as gypsum, jarosite, and alunite, in all samples except for sample LOS17, where the jarosite/plumbojarosite content was reduced from 32 wt.% to 8 wt.%. Fe3+ oxyhydroxides such as goethite were also absent in the residual sediment samples. The disappearance of jarosite/plumbojarosite and goethite could be interpreted as a consequence of the reduction of ion Fe3+ to Fe2+, leading to the dissolution of those mineral phases. Quartz, phyllosilicate, and feldspar contents were not affected or showed a relative increase in response to the disappearance of the previously mentioned mineral phases.

3.4.4. EDTA

Mobilization of PTEs in soils after the EDTA extraction was slightly lower than that for other extraction methods, especially for Zn, with an average concentration of 50.5 mg·kg−1 (Table 5). It is worth noting that, in contrast to the other extraction procedures, Zn content appeared below the analytical detection limit in some of the analyzed samples. Cu showed moderate to low concentration values, with an average of 37.2 mg·kg−1. Extractable As content was slightly lower than that detected in acidic medium extraction, with values between 1.308 mg·kg−1 and 0.034 mg·kg−1. In all considered samples, extractable Pb and Cd appeared below the analytical detection limit.
Extraction percentages were generally low for all studied PTEs, with Zn and Cu as the trace elements that presented higher mobilization percentages, with 17% and 8.7% of total PTE content, respectively. Arsenic exhibited an almost immobile behavior in conditions comparable to plant uptake, with extraction percentages that did not exceed 0.341% of total As. The extraction percentages of Pb and Cd could not be precisely estimated; therefore, we chose not to include them, in order to avoid unnecessary error.
The mineralogical content in the residue after the EDTA extraction was almost identical to that of the original soil samples. The only mineral phase that showed a noticeable variation was gypsum, with a decrease in concentration. A relative increase in some phases, such as goethite and feldspars, could take place, as a result of the decrease of the hydrated sulfates.

3.4.5. DTPA

Results obtained from soils submitted to the DTPA extraction were similar to the EDTA extraction (Table 5). Cu content in the extraction solution was almost identical to the EDTA results, with an average concentration of 37.5 mg·kg−1. Zn and As showed slightly higher values, with 65.1 mg·kg−1 and 0.5 mg·kg−1, respectively, suggesting that the DTPA extraction procedure was able to release a higher amount of PTEs when used in strongly acidic soils. Moreover, the DTPA extraction procedure was the only methodology used that was able to extract enough Pb in all soil samples to be quantified above the analytical detection limit, with values ranging from 9.1 mg·kg−1 to 0.56 mg·kg−1.
Once the extractable PTE content was converted into percentages, Zn showed the highest values (20.7% of total Zn), followed by Cu (9%). For Pb and As, the percentages were notably low, ranging from 0.03% to 5.16% (average value of 1.8%) and from 0.294% to 0.010%, respectively.
The obtained mineralogical data were very similar to the original soil samples, with a small decrease or disappearance of gypsum in samples LOS13, LOS8, and LOS11, and with a consequent relative increase in the other mineral phases. Goethite and jarosite/plumbojarosite still appeared in most of the samples, but with a slight reduction in content.
Results obtained from the application of the five selective extraction procedures are summarized in Figure 7 and Figure 8.
In conclusion, the PTE release after the water extraction depended on the natural mobility of the trace elements and mineralogical composition of samples, affecting only soluble phases, mainly hydrated sulfates (Figure 8).
PTEs with high mobility, such as Zn, showed higher extraction percentages, while As and Pb were minimally affected. PTEs extracted after the acidic medium procedure showed slightly higher mobilization percentages as compared to the water extraction. The lower pH of this medium favored metal mobilization and attacked soluble sulfates and carbonates. However, the release of PTEs under those conditions was not especially high, due to the lack of a carbonate-associated PTE fraction in the sediment samples. In the complexing–reducing medium, hydrated sulfates, jarosite/plumbojarosite, alunite, and goethite were attacked. In this case, PTE release was especially high for As and Pb, which means that those elements were probably related to the aforementioned mineralogical phases. Specifically, most of the As content in soils in the Lousal mine samples appeared to be adsorbed to goethite, while Pb contents were probably related to secondary sulfates such as plumbojarosite.
Lastly, the bioavailable fraction assessed with the EDTA and DTPA procedures was low for all of the PTEs analyzed. Zn and Cu showed medium to low extraction percentages, and Pb and As exhibited an almost immobile behavior under conditions similar to plant uptake. The low Cd content obtained in all the extraction procedures (below the analytical detection limit) was related to the low total Cd content in the original samples.

3.5. Assessment of Potential Environmental Risk

The contaminant factor (CF) values for As and Cu were very high in almost all the soil samples analyzed (Table 6 and Table 7). In general, both surficial and deep soil samples showed similar CF values for those PTEs, with only a slightly higher CF for As in surficial samples. Regarding Cu, values of CF varied between considerably contaminated and very contaminated for almost the entirety of the samples and showed a slightly lower standard deviation than obtained for As. In the case of Pb and Zn, CF values were lower than those determined for As and Cu and varied from low contamination to very high contamination. CF values obtained for Zn were fairly constant throughout all analyzed samples, without surpassing values of CF = 6, suggesting very low to moderate contamination. In the case of Pb, the highest values were quantified in samples located at upper positions in the slope, near the encapsulated materials (LO2.1 and LOS6), and in samples collected from areas of sediment accumulation (LO1.4 and LOS17), showing a very high degree of contamination for this element in those areas. The contaminant factor for Cd varied from low to considerable contamination in some of the surficial samples, whereas it could not be estimated in the remaining samples, due to the total concentration values being below the analytical detection limit.
According to the pollution load index results (PLI) for the selected elements, the soils affected by mine activity in the Lousal mine presented contamination varying from a considerable to a very high degree. Similarly to the CF results, the highest degree of contamination was found in areas near the encapsulated materials and at the discharge points of superficial runoff coming from the slope, which showed signs of being periodically flooded.
The results obtained after applying the five proposed extraction procedures indicate that the highest PTE mobilization took place in a complexing–reducing medium. These results suggest that, if the overall environmental conditions of the Lousal mine wastes and soils changed from an oxidizing medium to a reducing medium, mobilization of PTEs such as As and Pb could be an important issue. As seen from the geochemical characterization of the original sediment samples, the spatial distribution of As and Pb content in soils did not seem to be influenced by active mobilization processes. Under the current oxidant conditions, those PTEs exhibited low mobility, indicating that they may be associated with mineral phases that are stable in an acidic and oxidizing medium, such as goethite and plumbojarosite [7,74]. However, a change to reducing conditions, which can be caused by the partial encapsulation of the mine wastes and soils or by bad drainage, could lead to the dissolution of the Fe3+ oxyhydroxides and secondary sulfates, thus favoring the release of As and Pb into the environment and nearby water courses [6,75].
PTE extraction percentages obtained after acidic medium extraction were similar to those obtained by water extraction, suggesting that the trace-element mobilization promoted by AMD did not seem to have a significant impact in the study area. However, although the acidity and chemical characteristics of runoff water did not play a major role in the release, transport, and accumulation of PTEs, the preferential surface runoff flow paths and areas of water and sediment accumulation seemed to condition the spatial distribution of certain trace elements. For example, PTEs with higher natural mobility such as Zn and ions such as SO3 associated with water-soluble phases appeared in especially high concentrations at discharge areas of surficial water runoff and sediment deposition. Remediation strategies focusing on the management of those discharge areas and preferential runoff flow paths coupled with adequate chemical treatment actions would allow for an easier control of PTEs with high natural mobility. Regarding the pollution impact on the vegetal communities developed in the analyzed soils of the Lousal mining area, the data obtained for the PTEs content assimilable by vegetation (EDTA and DTPA extractions) show that PTE plant uptake does not seem to be a huge concern in the study area. Field observations agree with those results (Figure 9), as PTE content in soils did not seem to heavily affect plant growth in the mine wastes, aside from the limitation imposed by the acidic pH on the plant community, restricting the diversity of vegetation to species tolerable to acidic soils, such as the genera Cistus and Acacia. Moreover, the existence of a well-developed plant community favored the presence of oxidant conditions in the superficial soil layer, limiting the mobility of contaminants such as As and Pb.

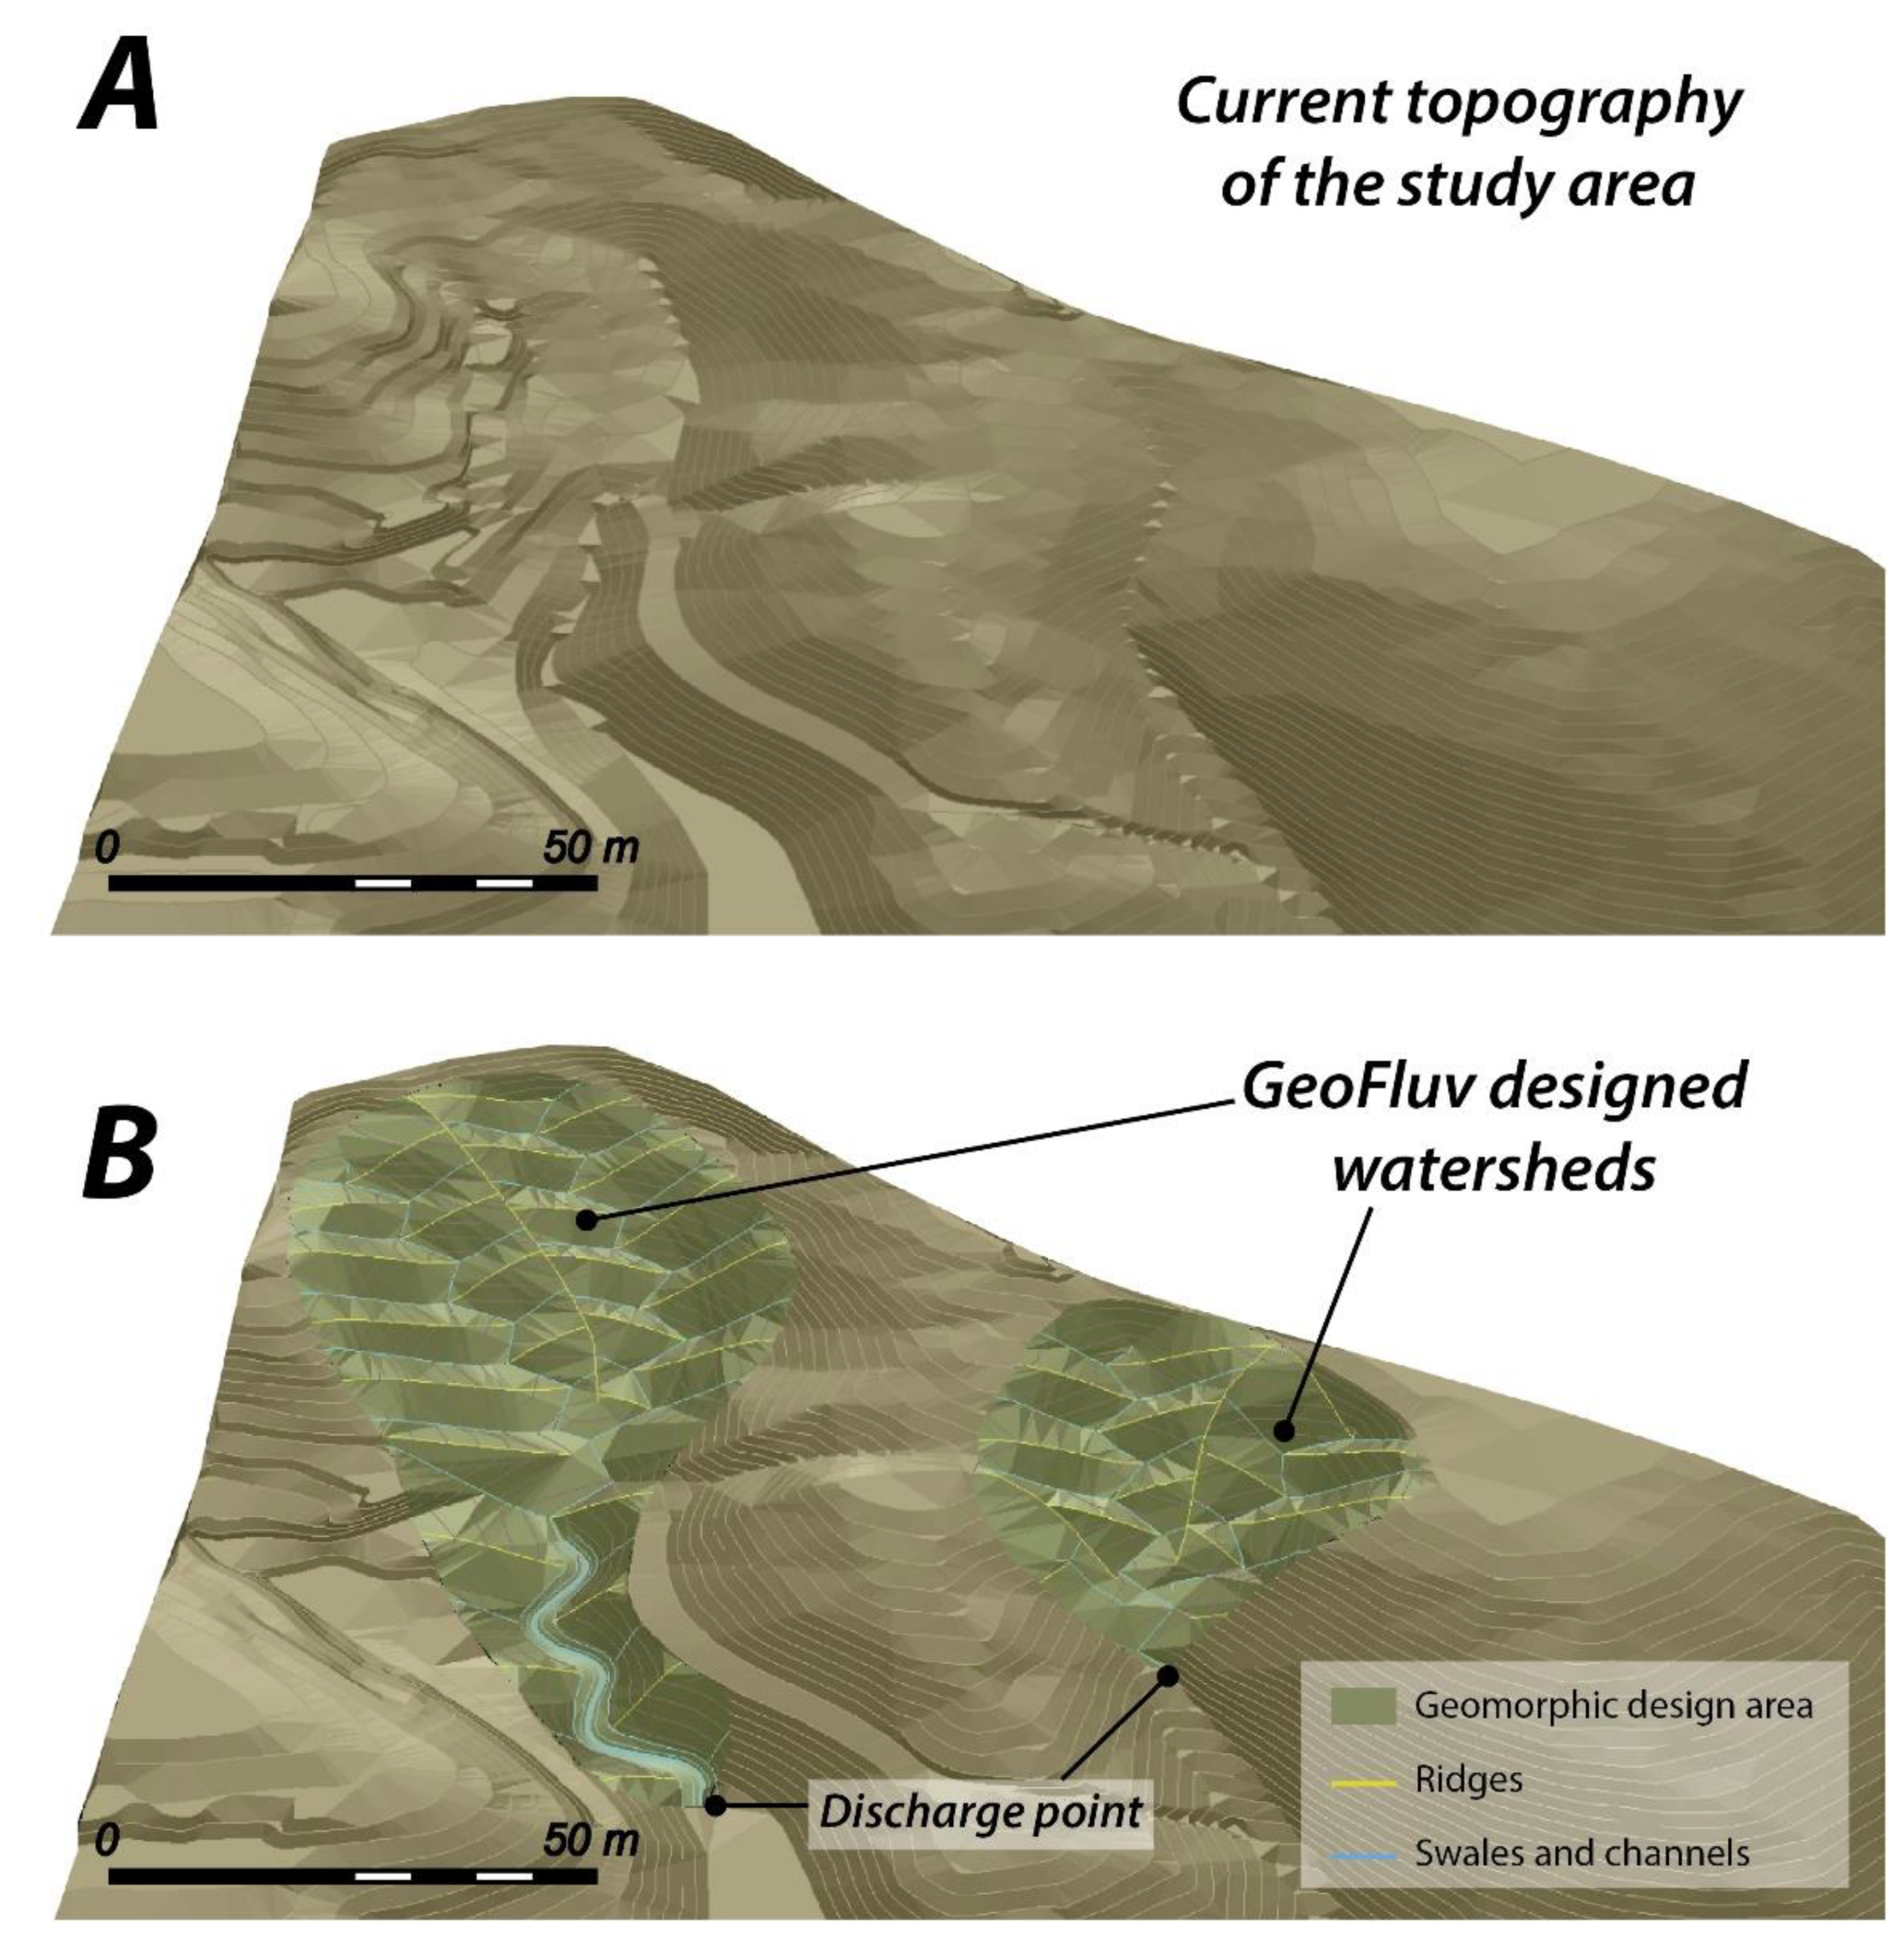
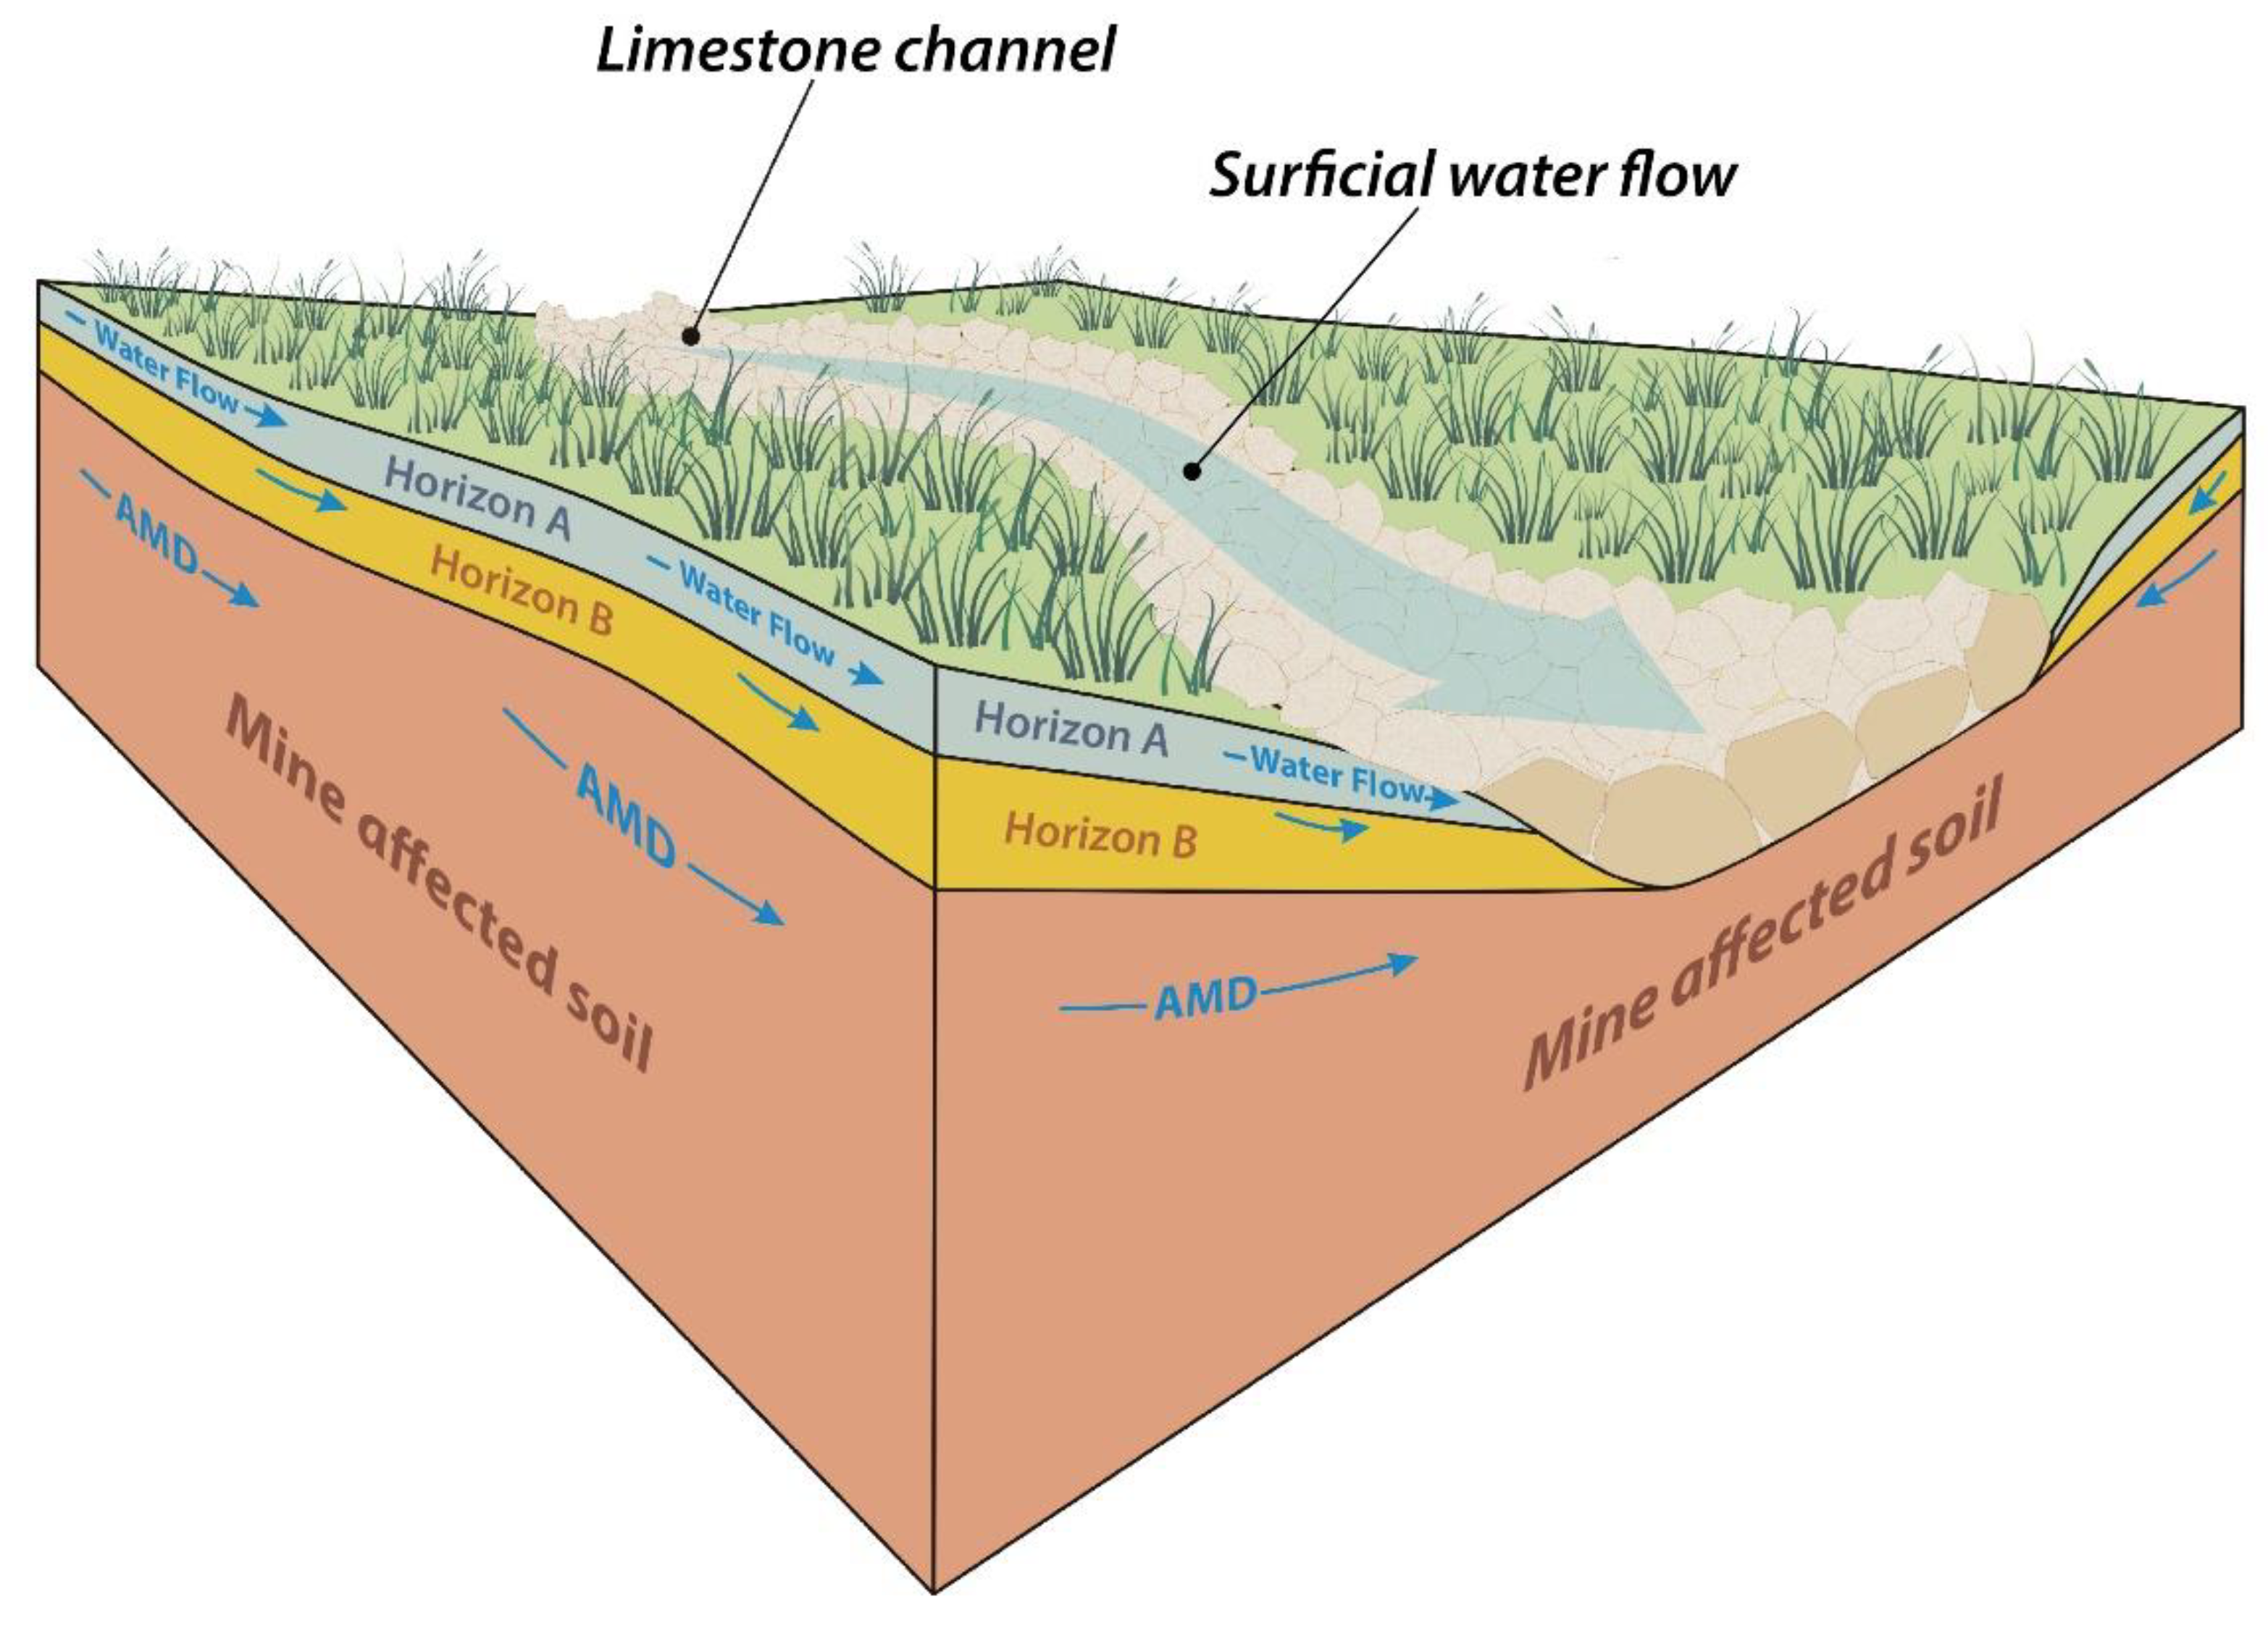
4. Application to Metallic Mine Reclamation

A combined fluvial-geomorphic and geochemical reclamation approach will be applied in the Lousal mining area throughout 2021–2022, within the framework of the European-funded mine reclamation project LIFE RIBERMINE (LIFE ENV/ES/000181). The topography of the affected mine soils will be redesigned and reconstructed, and a soil amendment will be extended over the new topography. In light of the results obtained from the geochemical characterization and PTE mobility assessment of the soil samples, if these reclamation strategies are bound to succeed, the risk of introducing reducing conditions with those reclamation actions must be taken into account and prevented.
The GeoFluv method will be applied in order to redesign the original topography. The GeoFluv method is a fluvial-geomorphic reclamation method that aims to reconstruct mature landforms and drainage networks that would develop within a natural catchment, after thousands of years of work performed by geomorphic processes [49,50,51]. This reclamation method essentially “compresses time”, building geomorphically stable and functional drainage networks that are able to efficiently manage the surficial runoff of the reclaimed area. The resulting landscape is composed of a system of ridges and swales that drain the runoff water into meandering channels, similarly to the natural landscapes in the surrounding areas.
In the Lousal mining area, this will be implemented with the reconstruction of two small drainage networks (Figure 10), which will convey surficial water flow into a series of constructed channels.
The new reclamation landscape would favor surficial water flow within preferential paths (swales and channels), thus preventing the risk of formation of periodically flooded areas that would introduce reducing conditions and accelerated mobilization of As and Pb. This reclamation approach would also facilitate the control and treatment of other contaminants with high natural mobility, such as Zn or Cd. The management of the surficial drainage though designed flow paths allows focalizing the chemical treatment actions aimed at neutralizing surficial waters and removing those contaminants that are more easily mobilized by water and particle transport processes. In this regard, limestone blocks will be extended over the riverbed of the designed channels in order to increase the pH of surficial waters and favor the precipitation of heavy metals [76] (Figure 11).
A buffering soil amendment will be extended over the new reclamation topography. The amendment will be composed of two distinct soil horizons with specific purposes: to provide a good foundation for plant growth and to favor the chemical stabilization of contaminants (Figure 11). The most surficial horizon (horizon A, 10 cm of thickness) will be composed of poultry manure, topsoil, and non-expansive clays, while the lower horizon (horizon B, 15 cm of thickness) will be made of a mixture of clays and limestone gravel. This horizon will help neutralize infiltrating water and, most importantly, facilitate subsuperficial water flow, due to the high limestone gravel content. Enhanced infiltration and subsuperficial water circulation should prevent water stagnation and, therefore, maintain oxidant conditions throughout the soil profile, reducing the risk of As and Pb mobilization. Compaction of the surficial soil horizon should be avoided in order to guarantee a good water flow through the buffering soil amendment.

5. Conclusions

The Lousal mining area was exploited from 1900 to 1988, resulting in the production of a large volume of pyrite-rich mine wastes, ranging from barren materials to various types of waste deposits and tailing impoundments. The geochemical and mineralogical characterization of the studied area shows that the mine wastes underwent intense weathering processes, producing an important contamination of the adjacent soils, which also led to the release and mobilization of PTEs into nearby water courses. Total PTE results indicate that the soils affected by mining activities were highly contaminated with As and Cu, while Zn and Pb content ranged from low to very high, depending on the analyzed samples. Cadmium levels were found to be very low in most of the soil samples.
The analysis of the spatial distribution of PTE content, together with the selective extraction procedures, proved to be powerful tools for the general study of PTE mobility and pollution potential in areas affected by mining activities. The results show that PTEs with high natural mobility, such as Zn, and elements related to soluble phases (gypsum and secondary sulfates) such as S appear concentrated at water and sediment discharge areas, while As, Pb, and Cu contents were generally higher in high topographic positions of the slope, near the contamination source.
The results obtained after applying the proposed extraction methodologies indicate that the highest mobilization took place in the complexing–reducing medium. This is especially evident in the case of otherwise near-immobile elements such as As and Pb, associated with mineralogical phases that are stable in oxidizing and acidic conditions, such as goethite and jarosite/plumbojarosite. These results allow suggesting that, if a change from oxidant to reducing conditions takes place, PTE mobilization could be an important environmental concern. Reclamation actions sought to be applied to these soils, including fluvial-geomorphic reclamation approaches and the extension of a buffering soil amendment, will favor an efficient water drainage, infiltration, and subsuperficial water circulation, thus maintaining the overall oxidant conditions in the soil.
Geo-environmental characterization, reclamation, and adaptation of closed and abandoned mines are fundamental in order to revalorize the mining heritage, particularly in regions with a long mining history, which in turn brings significant educational, environmental, socioeconomic, and eco-touristic benefits [77]. With this study, we provided an initial geochemical framework that can be directly applied to the planification and development of an effective reclamation strategy of the Lousal mine wastes. This methodological procedure is not restricted to this specific area, but can be implemented elsewhere in order to provide the necessary information about the geochemical characteristics and constraints of the mine wastes and soils affected by metallic mining, before developing an environmentally sound reclamation strategy.

Author Contributions

R.S.-D. was involved with the conceptualization of the study, contributed to the acquisition, treatment and analysis of data, wrote the original manuscript and the ongoing revised versions; M.L.G.L. contributed with the conceptualization of the study, was involved in the acquisition, treatment and analysis of data and provided ongoing reviews to paper drafts; J.M.E. participated with the conceptualization of the study, was involved in the acquisition, treatment and analysis of data and provided ongoing reviews to paper drafts; E.M.G.-N. was involved in acquisition and interpretation of laboratory data; P.H. contributed with the conceptualization of the study, was involved in the acquisition, treatment and analysis of data and provided ongoing reviews to paper drafts; E.C. was involved with the conceptualization of the study, was involved in the acquisition, treatment and analysis of data and provided ongoing reviews to paper drafts. All authors have read and agreed to the published version of the manuscript.

Funding

This research was supported by the European Union LIFE project “LIFE RIBERMINE (LIFE18 ENV/ES/000181): Fluvial freshwater habitat recovery through geomorphic-based mine ecological restoration in Iberian Peninsula”. The coauthor R.S.-D. was supported by a Tatiana Pérez de Guzmán el Bueno Foundation predoctoral scholarship.

Acknowledgments

The authors want to thank Jorge Manuel Rodriguez de Santos Relvas, Álvaro Manuel Madureira Pinto, and the Centro Ciência Viva do Lousal for their assistance during field work in Lousal.

Conflicts of Interest

The authors declare no conflict of interest. The funders had no role in the design of the study; in the collection, analysis, or interpretation of data; in the writing of the manuscript; or in the decision to publish the results.

References

  1. Sainz, A.; Grande, J.A.; de la Torre, M.L. Characterization of heavy metal discharge into the Ria of Huelva. Environ. Int. 2004, 30, 557–566. [Google Scholar] [CrossRef]
  2. Sánchez-España, J.; López Pamo, E.; Santofima, E.; Aduvire, O.; Reyes, J.; Barettino, D. Acid mine drainage in the Iberian Pyrite Belt (Odiel river watershed, Huelva, SW Spain): Geochemistry, mineralogy and environmental implications. Appl. Geochem. 2005, 20, 1320–1356. [Google Scholar] [CrossRef]
  3. Fernández-Caliani, J.C.; Barba-Brioso, C.; González, I.; Galán, E. Heavy metal pollution in soils around the abandoned mine sites of the Iberian Pyrite Belt (Soutwest Spain). Water Air Soil Pollut. 2009, 200, 211–226. [Google Scholar] [CrossRef]
  4. García-Lorenzo, M.L.; Pérez-Sirvent, C.; Martínez-Sánchez, M.J.; Molina-Ruiz, J. Trace elements contamination in an abandoned mining site in a semiarid zone. J. Geochem. Explor. 2012, 113, 23–35. [Google Scholar] [CrossRef] [Green Version]
  5. García-Lorenzo, M.L.; Pérez-Sirvent, C.; Molina-Ruiz, J.; Martínez-Sánchez, M.J. Mobility índices for the assessment of metal contamination in soils affected by old mining activities. J. Geochem. Explor. 2014, 147, 117–129. [Google Scholar] [CrossRef]
  6. Valente, T.; Leal Gomes, C. Ocurrence, properties and pollution potential of environmental minerals in acid mine drainage. Sci. Total Environ. 2009, 407, 1135–1152. [Google Scholar] [CrossRef] [PubMed] [Green Version]
  7. Valente, T.; Grande, J.A.; de la Torre, M.L.; Santisteban, M.; Cerón, J.C. Mineralogy and environmental relevance of AMD-precipitates from the Tharsis mines, Iberian Pyrite Belt (SW Spain). Appl. Geochem. 2013, 39, 11–25. [Google Scholar] [CrossRef]
  8. Chopin, E.I.B.; Alloway, B.J. Trace element partitioning and soil particle characterization around mining and smelting areas at Tharsis, Ríotinto and Huelva, SW Spain. Sci. Total Environ. 2007, 373, 488–500. [Google Scholar] [CrossRef] [PubMed]
  9. Galan, E.; Gómez-Ariza, J.L.; González, I.; Fernández-Caliani, J.C.; Morales, E.; Giráldez, I. Heavy metal pertitioning in river sediments severely polluted by acid mine drainage in the iBerian Pyrite Belt. Appl. Geochem. 2003, 18, 409–421. [Google Scholar] [CrossRef]
  10. López, M.; González, I.; Romero, A. Trace elements contamination of agricultural soils affected by sulphide exploitation (Iberian Pyrite Belt, SW Spain). Environ. Geol. 2008, 54, 805–818. [Google Scholar] [CrossRef]
  11. Perkins, W.; Bird, G.; Jacobs, S.; Devoy, C. Field-scale study of the influence of differing remediation strategies on trace metal geochemistry in metal mine tailings from the Irish Midlands. Environ. Sci. Pollut. Res. 2015, 23, 5592–5608. [Google Scholar] [CrossRef] [PubMed] [Green Version]
  12. Martín-Crespo, T.; Martín-Velázquez, S.; Gómez-Ortiz, D.; De Ignacio-San José, C.; Lillo, J. A geochemical and geophysical characterization of sulfide mine ponds at the Iberian Pyrite Belt (Spain). Water Air Soil. Pollut. 2010, 217, 387–405. [Google Scholar] [CrossRef] [Green Version]
  13. Abreu, M.M.; Tavares, M.T.; Batista, M.J. Potential use of Erica andevalensis and Erica australis in phytoremediation of sulphide mine environments: São Domingos, Portugal. J. Geochem. Explor. 2008, 96, 210–222. [Google Scholar] [CrossRef] [Green Version]
  14. Abreu, M.M.; Santos, E.S.; Ferreira, M.; Magalhães, M.C.F. Cistus salviifolius a promising species for mine wastes remediation. J. Geochem. Explor. 2012, 113, 86–93. [Google Scholar] [CrossRef]
  15. Santos, E.S.; Abreu, M.M.; Saraiva, J.A. Multielemental concentration and physiological responses of Lavandula pedunculata growing in soils developed on different mine wastes. Environ. Pollut. 2016, 213, 43–52. [Google Scholar] [CrossRef]
  16. Pérez-López, R.; Márquez-García, B.; Abreu, M.M.; Nieto, J.M.; Córdoba, F. Erica andevalensis and Erica australis growing in the same extreme environments: Phytostabilization potential of mining areas. Geoderma 2014, 230–231, 194–203. [Google Scholar] [CrossRef]
  17. Rodríguez, L.; Ruiz, E.; Alonso-Azcárate, J.; Rincón, J. Heavy metal distribution and chemical speciation in tailings and soils around a Pb-Zn mine in Spain. J. Environ. Manag. 2009, 90, 1106–1116. [Google Scholar] [CrossRef]
  18. Martín-Crespo, T.; Gómez-Ortiz, D.; Martínez-Pagán, P.; De Ignacio-San José, C.; Martín-Velázquez, S.; Lillo, J.; Faz, A. Geoenvironmental characterization of riverbeds affected by mine tailings in the Mazarrón district (Spain). J. Geochem. Explor. 2012, 119–120, 6–16. [Google Scholar] [CrossRef]
  19. Martín-Crespo, T.; Gómez-Ortiz, D.; Martín-Velázquez, S.; Martínez-Pagán, P.; De Ignacio-San José, C.; Lillo, J.; Faz, A. Geoenvironmental characterization of unstable abandoned mine tailings combining geophysical and geochemical methods (Cartagena-La Union district, Spain). Eng. Geol. 2018, 232, 135–146. [Google Scholar] [CrossRef]
  20. Oyarzun, R.; Lillo, J.; López-García, J.A.; Esbrí, J.M.; Cubas, P.; Llanos, W.; Higueras, P. The Mazarrón Pb-(Ag)-Zn mining district (SE Spain) as a source of heavy metal contamination in a semiarid realm: Geochemical data from mine wastes, soils and stream sediments. J. Geochem. Explor. 2011, 109, 113–124. [Google Scholar] [CrossRef] [Green Version]
  21. Sánchez-Donoso, R.; Martín-Duque, J.F.; Crespo, E.; Higueras, P.L. Tailing’s geomorphology of the San Quintín mining site (Spain): Landform catalogue, aeolian erosion and environmental implications. Environ. Earth Sci. 2019, 78, 166–182. [Google Scholar] [CrossRef]
  22. Brümmer, G.W. Heavy metal species, mobility and availability in soils. In The Importance of Chemical “Speciation” in Environmental Processes; Bernhard, M., Brinckman, F.E., Sadler, P.J., Eds.; Springer: Berlin, Germany, 1986; pp. 169–192. [Google Scholar]
  23. Favas, P.J.C.; Pratas, J.; Gomes, M.E.P.; Cala, V. Selective chemical extraction of heavy metals in tailings and soils contaminated by mining activity: Environmental implications. J. Geochem. Explor. 2011, 111, 160–171. [Google Scholar] [CrossRef]
  24. Arenas-Lago, F.; Andrade, M.L.; Lago-Vila, M.; Rodríguez-Seijo, A.; Vega, F.A. Sequential extraction of heavy metals in soils from a copper mine: Distribution in geochemical fractions. Geoderma 2014, 230–231, 108–118. [Google Scholar] [CrossRef]
  25. Ma, L.Q.; Rao, G.N. Heavy metals in the environment. Chemical Fractionation of cadmium, copper, nickel and zinc in contaminated soils. J. Environ. Qual. 1997, 26, 259–264. [Google Scholar] [CrossRef] [Green Version]
  26. Adamo, P.; Denaix, L.; Terribile, F.; Zampella, M. Characterization of heavy metals in contaminated volcanic soils of the Solofrana river valley (southern Italy). Geoderma 2003, 117, 347–366. [Google Scholar] [CrossRef]
  27. Martínez-Sánchez, M.J.; Navarro, M.C.; Pérez-Sirvent, C.; Marimón, J.; Vidal, J.; García-Lorenzo, M.L.; Bech, J. Assessment of the mobility of metals in a mining-impacted coastal area (Spain, Western Mediterranean). J. Geochem. Explor. 2008, 96, 171–182. [Google Scholar] [CrossRef] [Green Version]
  28. Alvarez, M.B.; Domini, C.E.; Garrido, M.; Lista, A.G.; Fernández-Band, B.S. Single-step chemical extraction procedures and chemometrics for assessment of heavy metal behavior in sediment samples from the Bahía Blanca estuary, Argentina. J. Soils Sediments 2011, 11, 657–666. [Google Scholar] [CrossRef]
  29. Sutherland, R.A. BCR-701: A review of 10-years of sequential extraction analyses. Anal. Chim. Acta 2010, 680, 10–20. [Google Scholar] [CrossRef] [PubMed]
  30. Yesares, L.; Sáez, R.; Nieto, J.M.; Ruiz de Almodóvar, G.; Gómez, C.; Escobar, J.M. The Las Cruces deposit, Iberian Pyrite Belt, Spain. Ore Geol. Rev. 2015, 66, 25–46. [Google Scholar] [CrossRef] [Green Version]
  31. Olías, M.; Nieto, J.M.; Pérez-López, R.; Cánovas, C.R.; Macías, F.; Sarmiento, A.M.; Galván, L. Control son acid mine wáter composition from the Iberian Pyrite Belt (SW Spain). Catena 2016, 137, 12–23. [Google Scholar] [CrossRef]
  32. Sánchez de la Campa, A.M.; de la Rosa, J.D.; Fernández-Caliani, J.C.; González-Castanedo, Y. Impact of abanoned mine waste on atmospheric respirable particulate matter in the historic mining district of Rio Tinto (Iberian Pyrite Belts). Environ. Res. 2011, 111, 1018–1023. [Google Scholar] [CrossRef] [PubMed]
  33. Van Green, A.; Adkins, J.F.; Boyke, E.A.; Palanques, A. A 120 year record of widespread contamination from mining of the Iberian Pyrite Belt. Geology 1997, 25, 291–294. [Google Scholar] [CrossRef]
  34. Nocete, F.; Alex, E.; Nieto, J.M.; Saéz, R.; Bayona, M.R. An archaeological approach to regional environmental pollution in th South-western Iberian Peninsula related to Third Millenium B.C mining and metallurgy. J. Archaeol. Sci. 2005, 32, 1566–1576. [Google Scholar] [CrossRef]
  35. Ruiz, F.; González-Regalado, M.L.; Borrego, J.; Morales, J.A.; Pendón, J.G.; Muñoz, J.M. Stratigrraphic sequence, elemental concentrations and heavy metal pollution in Holocene sediments from the Tinto-Odiel Estuary, Southwestern Spain. Environ. Geol. 1998, 34, 270–278. [Google Scholar] [CrossRef]
  36. Luís, A.T.; Teixeira, P.; Fernandes Pinheiro Almeida, S.; Matos, J.X.; Ferreira da Silva, E. Environmental impact of mining activities in the Lousal area (Portugal): Chemical and diatom characterization of metal-contaminated stream sediments and surface water of Corona stream. Sci. Total Environ. 2011, 409, 4312–4325. [Google Scholar] [CrossRef] [PubMed]
  37. Matzke, K. Mina do Lousal. In Proceedings of the Principais Jazigos Minerales do Sul de Portugal, Livro Guia nº4; Proceeding of the I Cong. Hispano-Luso-Americano de Geologia Económica e Aplicada, Madrid, Spain, 19–23 September 1971; pp. 25–32. [Google Scholar]
  38. Oliveira, V.; Matos, J.; Bengala, M.; Silva, N.; Sousa, P.; Torres, L. Geology and geophysics as successful tools in discovery of the Lagoa Salgada orebody (Sado tertiary basin-Iberian Pyrite Belt), Grândola, Portugal. Miner. Depos 1998, 33, 170–187. [Google Scholar] [CrossRef]
  39. Oliveira, V.; Matos, J.; Rosa, C. The NNW sector of the Iberian Pyrite Belt–new exploration perspectives for the next decade. In Proceedings of the Geode Workshop–Massive sulphide deposits in the Iberian Pyrite Belt: New advances and comparison with equivalent systems, Aracena, Spain; 2001; pp. 34–37. [Google Scholar]
  40. Matos, J.; Oliveira, V. Mina do Lousal (faixa Piritosa Ibñerica)–Percurso geológico e mineiro pelas cortas e galerías da antiga mina. IGME Pub. Museo Geominero 2003, 2, 117–128. [Google Scholar]
  41. IUSS Working Group WRB. World Reference Base for Soil Resources 2014, Update 2015: International Soil Classification System for Naming sOils and Creating Legends for Soil Maps; World Soil Resources Reports No. 106; FAO: Rome, Italy, 2015. [Google Scholar]
  42. Ferrera da Silva, E.; Patinha, C.; Cardoso Fonseca, E.; Matos, J.X.; Barrosinho, J.; Santos Oliveira, J.M. Interaction of acid mine drainage with waters and sediments at the Corona stream, Lousal mine (Iberian Pyrite Belt, Southern Portugal). Environ. Geol. 2006, 50, 1001–1013. [Google Scholar] [CrossRef]
  43. Reis, A.P.; Ferreira da Silva, E.; Sousa, A.J.; Matos, J.; Patinha, C.; Abenta, J.; Cardoso Fonseca, E. Combining GIS ans stochastic simulation to estimate spatial patterns of variation for lead at the Lousal mine, Portugal. Land Degrad. Develop. 2005, 16, 229–242. [Google Scholar] [CrossRef]
  44. Ferreira da Silva, E.; Bobos, I.; Matos, J.X.; Patinha, C.; Reis, A.P.; Cardoso Fonseca, E. Mineralogy and geochemistry of trace metals and REE in volcanic massive sulfide host rocks, stream sediments, stream waters and acid mine drainage from the Lousal mine area (Iberian Pyrite Belt, Portugal). Appl. Geochem. 2009, 24, 383–401. [Google Scholar] [CrossRef]
  45. Tornos, F. Environment of formation and styles of volcanogenic massive sulphides: The Iberian Pyrite Belt. Ore Geol. Rev. 2006, 28, 259–307. [Google Scholar] [CrossRef]
  46. Strauss, G. Sobre la geología de la provincial piritífera del SW de la Península Ibérica y de sus yacimientos, en especial sobe la mina de pirita de Lousal (Portugal). Mem. Inst. Tecnológico Geomin. España 1970, 77, 266. [Google Scholar]
  47. Ferreira da Silva, E.; Cardoso Fonseca, E.; Matos, J.X.; Pathina, C.; Reis, P.; Santos Oliveira, J.M. The effect of unconfined mine tailings on the geeochemistry of soils, sediments and Surface waters of the Lousal area (Iberian Pyrite belt, southern Portugal). Land Degrad. Develop. 2005, 16, 213–228. [Google Scholar] [CrossRef]
  48. Oliveira, M.; Ferreira, T.; Relvas, J.M.R.S.; Pinto, A.M.M.; Pereira, Z.; Matos, J.; Fernandes, C. Lousal, Portugal: Geologic and mining heritage of an ancient mine from Iberian Pyrite Belt. In Proceedings of the XIV Congreso Sobre Patrimonio Geológico y minero, Castrillón, Spain, 12–15 September 2013. [Google Scholar]
  49. Bugosh, N. Fluvial geomorphic principles applied to mined land reclamation. In Proceedings of the January OSM Alternatives to Gradient Terraces Workshop; Office of Surface mining: Farmington, NM, USA, January 2000. [Google Scholar]
  50. Bugosh, N. Innovative Reclamation Techniques at San Juan Coal Company (or why we are doing our reclamation differently). In July Rocky Mountain Coal Mining Institute National Meeting, Copper Mountain, Colorado, 3–7 November, 2003; Rocky Mountain Coal Mining Institute: Lakewood, CO, USA, 2003. [Google Scholar]
  51. Bugosh, N.; Eckels, R. Restoring erosional features in the desert. Coal Age 2006, 111, 30–32. [Google Scholar]
  52. US EPA. Clean Water Act. Section 503. U.S.; Environmental protection Agency: Washington, DC, USA, 1993; Volume 58.
  53. Rao, C.R.M.; Sahuquillo, A.; Lopez-Sanchez, J.F. Comparison of single and sequential extraction procedures for the study of rare earth elemnts remobilisation in different types of soils. Anal. Chim. Acta 2010, 662, 128–136. [Google Scholar] [CrossRef] [PubMed]
  54. Sahito, O.M.; Afridi, H.I.; Kazi, T.G.; Baig, J.A. Evaluatoin of heavy metal bioavailability in soil amended with poultry manure using single and BCR sequential extractions. Intern. J. Environ. Anal. Chem. 2015, 95, 1066–1079. [Google Scholar]
  55. García-Lorenzo, M.L. Evaluación de la Contaminación por vía Hídrica de Elementos traza en áreas con Influencia de Actividades Minero-Metalúrgicas. Aplicación a la Sierra Minera de Cartagena-La Unión (Murcia). Ph.D. Thesis, Universidad de Murcia, Murcia, Spain, 2009. [Google Scholar]
  56. Vidal, J. Evaluación de los Principales Procesos de Degradación en Fluvisoles Calcáricos de la Huerta de Murcia. Ph.D. Thesis, Universidad de Murcia, Murcia, Spain, 2002. [Google Scholar]
  57. Mehra, O.P.; Jackson, M.L. iron oxide removalfrom soils and clays by a dithionite-citrate system buffered with sodium bicarbonate. Clay Miner. Bull. 1960, 7, 317–327. [Google Scholar] [CrossRef]
  58. Alvarez, J.M.; Lopez-Valdivia, L.M.; Novillo, J.; Obrador, A.; Rico, M.I. Comparison of EDTA and sequential extraction tests for phytoavailability prediction of manganese and zinc in agricultural alkaline soils. Geoderma 2006, 132, 450–463. [Google Scholar] [CrossRef]
  59. Leleyter, L.; Rousseau, C.; Biree, L.; Baraud, F. Comparison of ETDA, HCl and sequential extraction procedures, for selected metals (Cu, Mn, Pb, Zn), in soils, riverine and marine sediments. J. Geochem. Explor. 2012, 116–117, 51–59. [Google Scholar] [CrossRef]
  60. Haynes, R.J.; Swift, R.S. An evaluation of the use of DTPA and EDTA as extractants for micronutrients in moderately acid soils. Plant. Soil 1983, 74, 111–122. [Google Scholar] [CrossRef]
  61. Lindsay, W.L.; Norvell, W.A. Development of a DTPA test for zinc, iron, manganese and copper. Soil Sci. Soc. Am. J. 1978, 42, 421–428. [Google Scholar] [CrossRef]
  62. Chung, F.H. Quantitative interpretation of X-ray diffraction patterns. I.Matrix-flushing method of quantitative multicomponent analysis. J. Appl. Cryst. 1974, 7, 519–525. [Google Scholar] [CrossRef]
  63. Chung, F.H. Quantitative interpretation of X-ray diffraction patterns. II.Adiabatic principle of X-ray diffraction analysis of mixtures. J. Appl. Cryst. 1974, 7, 526–531. [Google Scholar] [CrossRef]
  64. Chung, F.H. Quantitative interpretation of X-ray diffraction patterns. III.Simultaneous determination of a set of reference intensities. J. Appl. Cryst. 1975, 8, 17–19. [Google Scholar] [CrossRef]
  65. X-Powder Software. Available online: http://www.xpowder.com/ (accessed on 22 April 2021).
  66. Statgraphics 19 Software. Available online: https://www.statgraphics.com/ (accessed on 19 May 2021).
  67. Pérez-Sirvent, C.; Martínez-Sánchez, M.J.; García-Lorenzo, M.L.; Molina, J.; Tudela, M.L. Geochemical background levels of zinc, cadmium and mercury in anthropically influenced soils located in a semi-arid zone (SE, Spain). Geoderma 2009, 148, 307–317. [Google Scholar] [CrossRef]
  68. Albanese, S.; Madejón, E.; Pérez-de-Mora, A.; Cabrera, F. Spatial variability of the chemical characteristics of a trace-element-contaminated soil before and after remediation. Geoderma 2006, 130, 157–175. [Google Scholar]
  69. Guillén, M.T.; Delgado, J.; Albanesa, S.; Nieto, J.M.; Lima, A.; De Vivo, B. Heavy metals fractionation and multivariate statistical techniques to evaluate the environmental risk in soils of Huelva Township (SW Iberian Peninsula). J. Geochem. Explor. 2012, 119–120, 32–43. [Google Scholar] [CrossRef]
  70. Kalender, L.; Uçar, S.C. Assessment of metal contamination in seidments in the tributaries of the Euphrates River, using pollution indices and the determination of the pollution source, Turkey. J. Geochem. Explor. 2013, 134, 73–84. [Google Scholar] [CrossRef]
  71. Varol, M. Assessment of heavy metal contamination in sediments of the Tigris River (Turkey) using pollution indices and multivariate statistical techniques. J. Hazard. Mater. 2011, 195, 355–364. [Google Scholar] [CrossRef]
  72. Ferreira, M.M.S.I. Dados Geoquímicos de base de solos de Portugal Continental, Utilizando Amostragem de Baixa Densidade. Ph.D. Thesis, Universidade de Aveiro, Aveiro, Portugal, 2004. [Google Scholar]
  73. Hakanson, L. Ecological risk indez for aquatic pollution control. A sedimentological approach. Water Res. 1980, 14, 975–1001. [Google Scholar] [CrossRef]
  74. Valente, T.; Gomes, P.; Sequeira Braga, M.A.; Dionísio, A.; Pamplona, J.; Grande, J.A. Iron and arsenic-rich nanoprecipitates associated with clay minerals in sulfide-rich waste dumps. Catena 2015, 131, 1–13. [Google Scholar] [CrossRef]
  75. Valente, T.; Grande, J.A.; de la Torre, M.L.; Gomes, P.; Santisteban, M.; Borrego, J.; Sequeira Braga, M.A. Mineralogy and geochemistry of a clogged mining reservoir affected by historical acid mine drainage in an abandoned mining area. J. Geochem. Explor. 2015, 157, 66–76. [Google Scholar] [CrossRef]
  76. Skousen, J. Overview of passive systems for treating acid mine drainage. In Reclamation of Drastically Disturbed Lands; Barnishel, R.I., Ed.; American Society of Agronomy: Madison, WI, USA, 1998. [Google Scholar]
  77. Martín-Crespo, T.; Gómez-Ortiz, D.; Martín-Velázquez, S.; Esbrí, J.M.; De Ignacio-San José, C.; Sánchez-García, M.J.; Montoya-Montes, I.; Martín-González, F. Abandoned mine tailings in cultural itineraries: Don Quixote Route (Spain). Eng. Geol. 2015, 197, 82–93. [Google Scholar] [CrossRef]
Figure 1. (A) Location of the Iberian Pyrite Belt in the Iberian Peninsula; (B) the Iberian Pyrite Belt and some of its most outstanding metallic mines. The Lousal pyrite mine is located at the northwestern margin of the Iberian Pyrite Belt; (C) detailed view of the Lousal mine. T1 and T2: tailing and mine waste piles; A: acid waters dams and ponds.
Geosciences 11 00233 g001
Figure 2. Sampling sites in the study area.
Geosciences 11 00233 g002
Figure 3. PTE content variation with depth in soil samples collected from transect W (left column) and transect E (right column).
Geosciences 11 00233 g003aGeosciences 11 00233 g003b
Figure 4. Isocontent maps of total Fe2O3, SO3, and trace-element concentrations obtained from surficial soil samples.
Geosciences 11 00233 g004
Figure 5. Score plots for F1–F2 and F1–F3.
Geosciences 11 00233 g005
Figure 6. Mineralogical composition of soil samples (in wt.%) after the extractions.
Geosciences 11 00233 g006
Figure 7. Extraction percentages of Pb, As, Zn, Cu, and Cd obtained in surficial soil samples after each selective extraction procedure.
Geosciences 11 00233 g007
Figure 8. Summary of affected mineral phases and PTEs extracted in the studied soil samples.
Geosciences 11 00233 g008
Figure 9. View of the study area, with shrub vegetation (Cistus ladanifer), Acacia, and Eucalyptus growing in soils affected by mining activity.
Geosciences 11 00233 g009
Figure 10. (A) 3D view of the current topography of the study area; (B) 3D view of the proposed GeoFluv landscape, featuring two small drainage networks and a system of ridges, swales, and meandering channels to convey surficial runoff.
Geosciences 11 00233 g010
Figure 11. Schematic view of the limestone channels and soil amendment designed within the framework of the LIFE RIBERMINE reclamation project.
Geosciences 11 00233 g011
Table 1. Geochemical characterization of surficial soil samples.
Fe2O3 (%)SiO2 (%)SO3 (%)Pb
(mg·kg−1)
Zn
(mg·kg−1)
Cd
(mg·kg−1)
As
(mg·kg−1)
Cu
(mg·kg−1)
Surficial Samples
LOS 114.1256.045.701361542.6645180
LOS 212.9759.645.012152012.3842228
LOS 313.0458.373.903022120.6690228
LOS 415.6251.911.30762450.9294436
LOS 510.6462.153.001841381.9301219
LOS 613.2153.803.285915461.25301.320
LOS 78.6663.403.08611632.4421365
LOS 813.3053.503.772965451.7515536
LOS 912.1754.131.431053080.2312318
LOS 1013.1654.172.18140367<DL430512
LOS 119.4561.802.682061770.7278254
LOS 1213.8955.891.992381341.5460310
LOS 1310.0051.166.001675391.8254432
LOS 147.2963.520.72801900.3195289
LOS 159.6252.520.0942871.6335357
LOS 1611.7051.361.30320371<DL399343
LOS 1757.8614.1018.591.900205<DL1.230<DL
Table 2. Geochemical characterization of soil samples collected from the two transects (surficial and deep soil samples).
Fe2O3 (%)SiO2 (%)SO3 (%)Pb
(mg·kg−1)
Zn
(mg·kg−1)
Cd
(mg·kg−1)
As
(mg·kg−1)
Cu
(mg·kg−1)
Transect W
LO1.1-0110.0751.780.182594<DL227236
LO1.1-0211.8951.570.2529122<DL235348
LO1.1-0313.7053.650.2848117<DL255495
LO1.1-0415.8854.910.46147120<DL348719
LO1.1-0510.4756.680.57134161<DL234373
LO1.2-0117.0345.930.024156<DL243440
LO1.2-0216.3347.580.044966<DL234467
LO1.2-0312.4253.820.064652<DL188328
LO1.2-0412.6054.352.496578<DL222423
LO1.3-0120.8846.570.0991108<DL66325
LO1.3-0216.8850.430.1167123<DL103361
LO1.3-0310.8257.690.1437107<DL88302
LO1.3-0412.9555.150.1449130<DL128341
LO1.3-0514.0053.290.2845179<DL132307
LO1.4-0131.3241.251.29436283<DL359621
LO1.4-0231.9041.761.60290352<DL367722
LO1.4-0313.3851.262.06142316<DL434341
LO1.4-0413.0056.962.87305180<DL474329
LO1.4-059.8965.021.4211899<DL337218
Transect E
LO2.1-0119.6649.272.881010184<DL1230300
LO2.1-0214.2353.085.995730135<DL531323
LO2.1-0311.0555.192.58275177<DL276292
LO2.2-0112.4452.510.2367214<DL3493
LO2.2-0210.9159.130.31101243<DL73196
LO2.2-0310.9356.920.76117299<DL104226
LO2.2-049.9856.660.9094265<DL195206
LO2.3-018.9157.890.0677125<DL1856
LO2.3-028.7362.580.2491152<DL5186
Table 3. Mineralogical composition (in wt.%) of the original surficial soil samples.
QtzPhy 10 ÅPhy 14/7.5 ÅFpsGoeJar/PbJarAluGyp
LOS 136321012154
LOS 258236724
LOS 3502679233
LOS 43155662
LOS 5642743 2
LOS 649355911
LOS 76030 82
LOS 850287922 2
LOS 93832131421
LOS 102647111141
LOS 1138301015 232
LOS 1262234821
LOS 13303281012512
LOS 1445367111
LOS 15314113123
LOS 1630401010712
LOS 17253065232
Qtz: quartz; Phy 10 Å: phyllosilicates 10 Å (mica-illite); Phy 14/7.5 Å: phyllosilicates 14/7.5 Å (chlorite); Fps: feldspars; Goe: goethite; Jar/PbJar: jarosite/plumbojarosite; Alu: alunite; Gyp: gypsum.
Table 4. Varimax rotated factor for PTE total content and surficial soil sample mineralogy.
F1F2F3F4Communality
Fe2O30.9330.194−0.220−0.1450.978
SiO2−0.628−0.174−0.3750.2730.640
SO30.9380.0060.233−0.0750.939
Pb0.9610.108−0.0670.0900.948
Zn0.0060.1560.2830.8900.897
Cd−0.170−0.7540.183−0.0770.639
As0.885−0.095−0.083−0.1240.815
Cu−0.2390.024−0.1340.8360.775
Qtz−0.221−0.848−0.423−0.010.945
Phy 10 Å−0.2240.742−0.1100.1830.646
Phy 14 Å0.1200.7610.358−0.2640.792
Fsp−0.6900.297−0.386−0.0940.721
Goe−0.0350.636−0.2150.0530.455
Jar/PbJar0.9710.0860.040−0.1550.977
Alu−0.068−0.0460.902−0.0890.828
Gyp−0.061−0.1490.7920.3820.799
Table 5. Pb, As, Zn, Cu, and Cd extractable content (in mg·kg−1) after the five extraction methods applied in this study (water, acidic medium, complexing–reducing medium, EDTA, and DTPA) and extraction percentage results (in %).
WaterAcidic Medium (HNO3) Complexing-reducing MediumEDTA DTPA
PbAsZnCuCdPbAsZnCuCd PbAsZnCuCdPbAsZnCuCd PbAsZnCuCd
LOS 1<DL0.045235.014.1<DL<DL0.57435.525.7<DLLOS 173.3111.9548.625.4<DL<DL0.04118.317.5<DLLOS 10.70.41126.820.0<DL
LOS 2<DL0.011346.912.1<DL<DL2.95648.720.1<DLLOS 2<DL18.0957.2<DL<DL<DL1.27123.019.1<DLLOS 28.20.98739.620.0<DL
LOS 3<DL0.008447.213.5<DL<DL3.03241.222.3<DLLOS 3<DL234.5358.0<DL<DL<DL1.30828.720.6<DLLOS 34.21.00940.622.6<DL
LOS 4<DL0.0020100.318.8<DL<DL0.078115.643.4<DLLOS 4<DL103.34121.19.5<DL<DL0.03486.741.0<DLLOS 40.70.04398.040.2<DL
LOS 5<DL0.00108.63.4<DL<DL0.3406.815.1<DLLOS 5<DL65.1019.0<DL<DL<DL0.173<DL11.8<DLLOS 50.90.0785.912.8<DL
LOS 6<DL0.0111152.299.6<DL<DL1.853142.9104.3<DLLOS 680.8119.88161.357.1<DL<DL0.490142.998.6<DLLOS 61.60.361139.892.3<DL
LOS 7<DL0.005816.20.1<DL<DL1.26126.221.1<DLLOS 7<DL91.0839.929.6<DL<DL0.1649.318.9<DLLOS 72.10.13227.820.1<DL
LOS 8<DL0.0062133.444.5<DL<DL1.121122.861.1<DLLOS 875.336.24150.614.3<DL<DL0.337110.662.3<DLLOS 89.10.342134.863.3<DL
LOS 9<DL0.003680.422.6<DL<DL1.20671.235.5<DLLOS 9<DL37.4293.0<DL<DL<DL0.47162.834.7<DLLOS 94.20.38080.933.1<DL
LOS 10<DL0.0033113.331.3<DL<DL0.598126.671.4<DLLOS 10<DL78.67152.622.9<DL<DL0.03898.155.4<DLLOS 100.60.171118.067.6<DL
LOS 11<DL0.003446.09.9<DL<DL0.62954.842.8<DLLOS 11101.973.8279.939.6<DL<DL0.13232.242.8<DLLOS 110.70.13147.944.6<DL
LOS 12<DL0.00228.82.9<DL<DL0.1646.510.4<DLLOS 12<DL42.2815.0<DL<DL<DL0.074<DL9.3<DLLOS 127.30.0483.09.4<DL
LOS 13<DL0.0120144.327.7<DL<DL4.048149.074.6<DLLOS 1369.716.25155.67.9<DL<DL0.867139.069.7<DLLOS 132.50.467149.867.2<DL
LOS 14<DL0.002538.910.2<DL<DL0.32843.362.8<DLLOS 1476.4112.2550.136.2<DL<DL0.05836.761.2<DLLOS 141.70.08841.660.6<DL
LOS 15<DL0.00057.6<DL<DL<DL0.1507.310.5<DLLOS 15<DL85.5714.8<DL<DL<DL0.038<DL9.1<DLLOS 152.20.0597.38.2<DL
LOS 16<DL0.0122120.238.4<DL<DL0.846142.379.1<DLLOS 16<DL98.33139.5<DL<DL-----LOS 16-----
LOS 17<DL0.564787.924.8<DL<DL3.03893.027.8<DLLOS 17133.7563.95156.616.2<DL<DL0.52864.323.5<DLLOS 170.563.61179.817.3<DL
Maximum<DL0.5647152.299.6<DL<DL4.048149.0104.3<DLMaximum101.9563.95161.357.1<DL<DL1.308142.969.7<DLMaximum9.13.611149.892.3<DL
Minimum<DL0.00057.6<DL<DL<DL0.0786.510.4<DLMinimum<DL16.2514.8<DL<DL<DL0.034<DL9.1<DLMinimum0.560.0433.08.2<DL
Mean<DL0.0469.823.4<DL<DL1.372.642.8<DLMean55.8111.189.016.6<DL<DL0.453.737.2<DLMean3.00.565.137.5<DL
Extraction PercentageExtraction PercentageExtraction Percentage
WaterAcidic medium (HNO3) Complexing-reducing MediumEDTA DTPA
PbAsZnCuCdPbAsZnCuCd PbAsZnCuCdPbAsZnCuCd PbAsZnCuCd
Maximum-0.045942.9211.22--1.592047.2423.08-Maximum95.2757.5376.4915.58--0.34135.4521.15-Maximum5.160.29440.0620.95-
Minimum-0.00026.260.003--0.00184.842.95-Minimum7.042.1511.210.19--0.0061.642.56-Minimum0.030.0102.262.31-
Mean-0.004423.454.70--0.290524.6810.89-Mean34.8722.8032.154.37--0.07417.018.68-Mean1.920.07620.758.95-
<DL: values below the analytical detection limit.
Table 6. Contamination factor (CF) and pollution load index (PLI) for Pb, Zn, Cd, As, and Cu in surficial soil samples.
Contamination Factor (CF)PLI
PbZnCdAsCu
LOS 14242958
LOS 26243879
LOS 39213178
LOS 423213127
LOS 55231467
LOS 61762243814
LOS 722419107
LOS 8963231512
LOS 934<11495
LOS 1044-201512
LOS 116211376
LOS 127232198
LOS 1356312129
LOS 1422<1984
LOS 1511315105
LOS 1694-181012
LOS 17562-56-33
Table 7. Contamination factor (CF) and pollution load index (PLI) for Pb, Zn, Cd, As, and Cu in soil samples collected from the two transects.
Contamination Factor (CF)PLI
PbZnCdAsCu
Transect W
LO1.1-01<11-1075
LO1.1-02<11-11106
LO1.1-0311-12147
LO1.1-0441-162110
LO1.1-0542-11118
LO1.2-011<1-11136
LO1.2-021<1-11136
LO1.2-031<1-995
LO1.2-042<1-10126
LO1.3-0131-396
LO1.3-0221-5106
LO1.3-0311-494
LO1.3-0412-6106
LO1.3-0512-696
LO1.4-01133-161816
LO1.4-0294-172116
LO1.4-0344-201010
LO1.4-0492-22911
LO1.4-0531-1567
Transect E
LO2.1-01302-56918
LO2.1-021692-24919
LO2.1-0382-1389
LO2.2-0123-234
LO2.2-0233-366
LO2.2-0334-567
LO2.2-0433-967
LO2.3-0121-<123
LO2.3-0232-224
Publisher’s Note: MDPI stays neutral with regard to jurisdictional claims in published maps and institutional affiliations.

