
Controls on the Spatial Distribution of Trace Metal Concentrations along the Bedrock-Dominated South Fork New River, North Carolina

Abstract
:1. Introduction
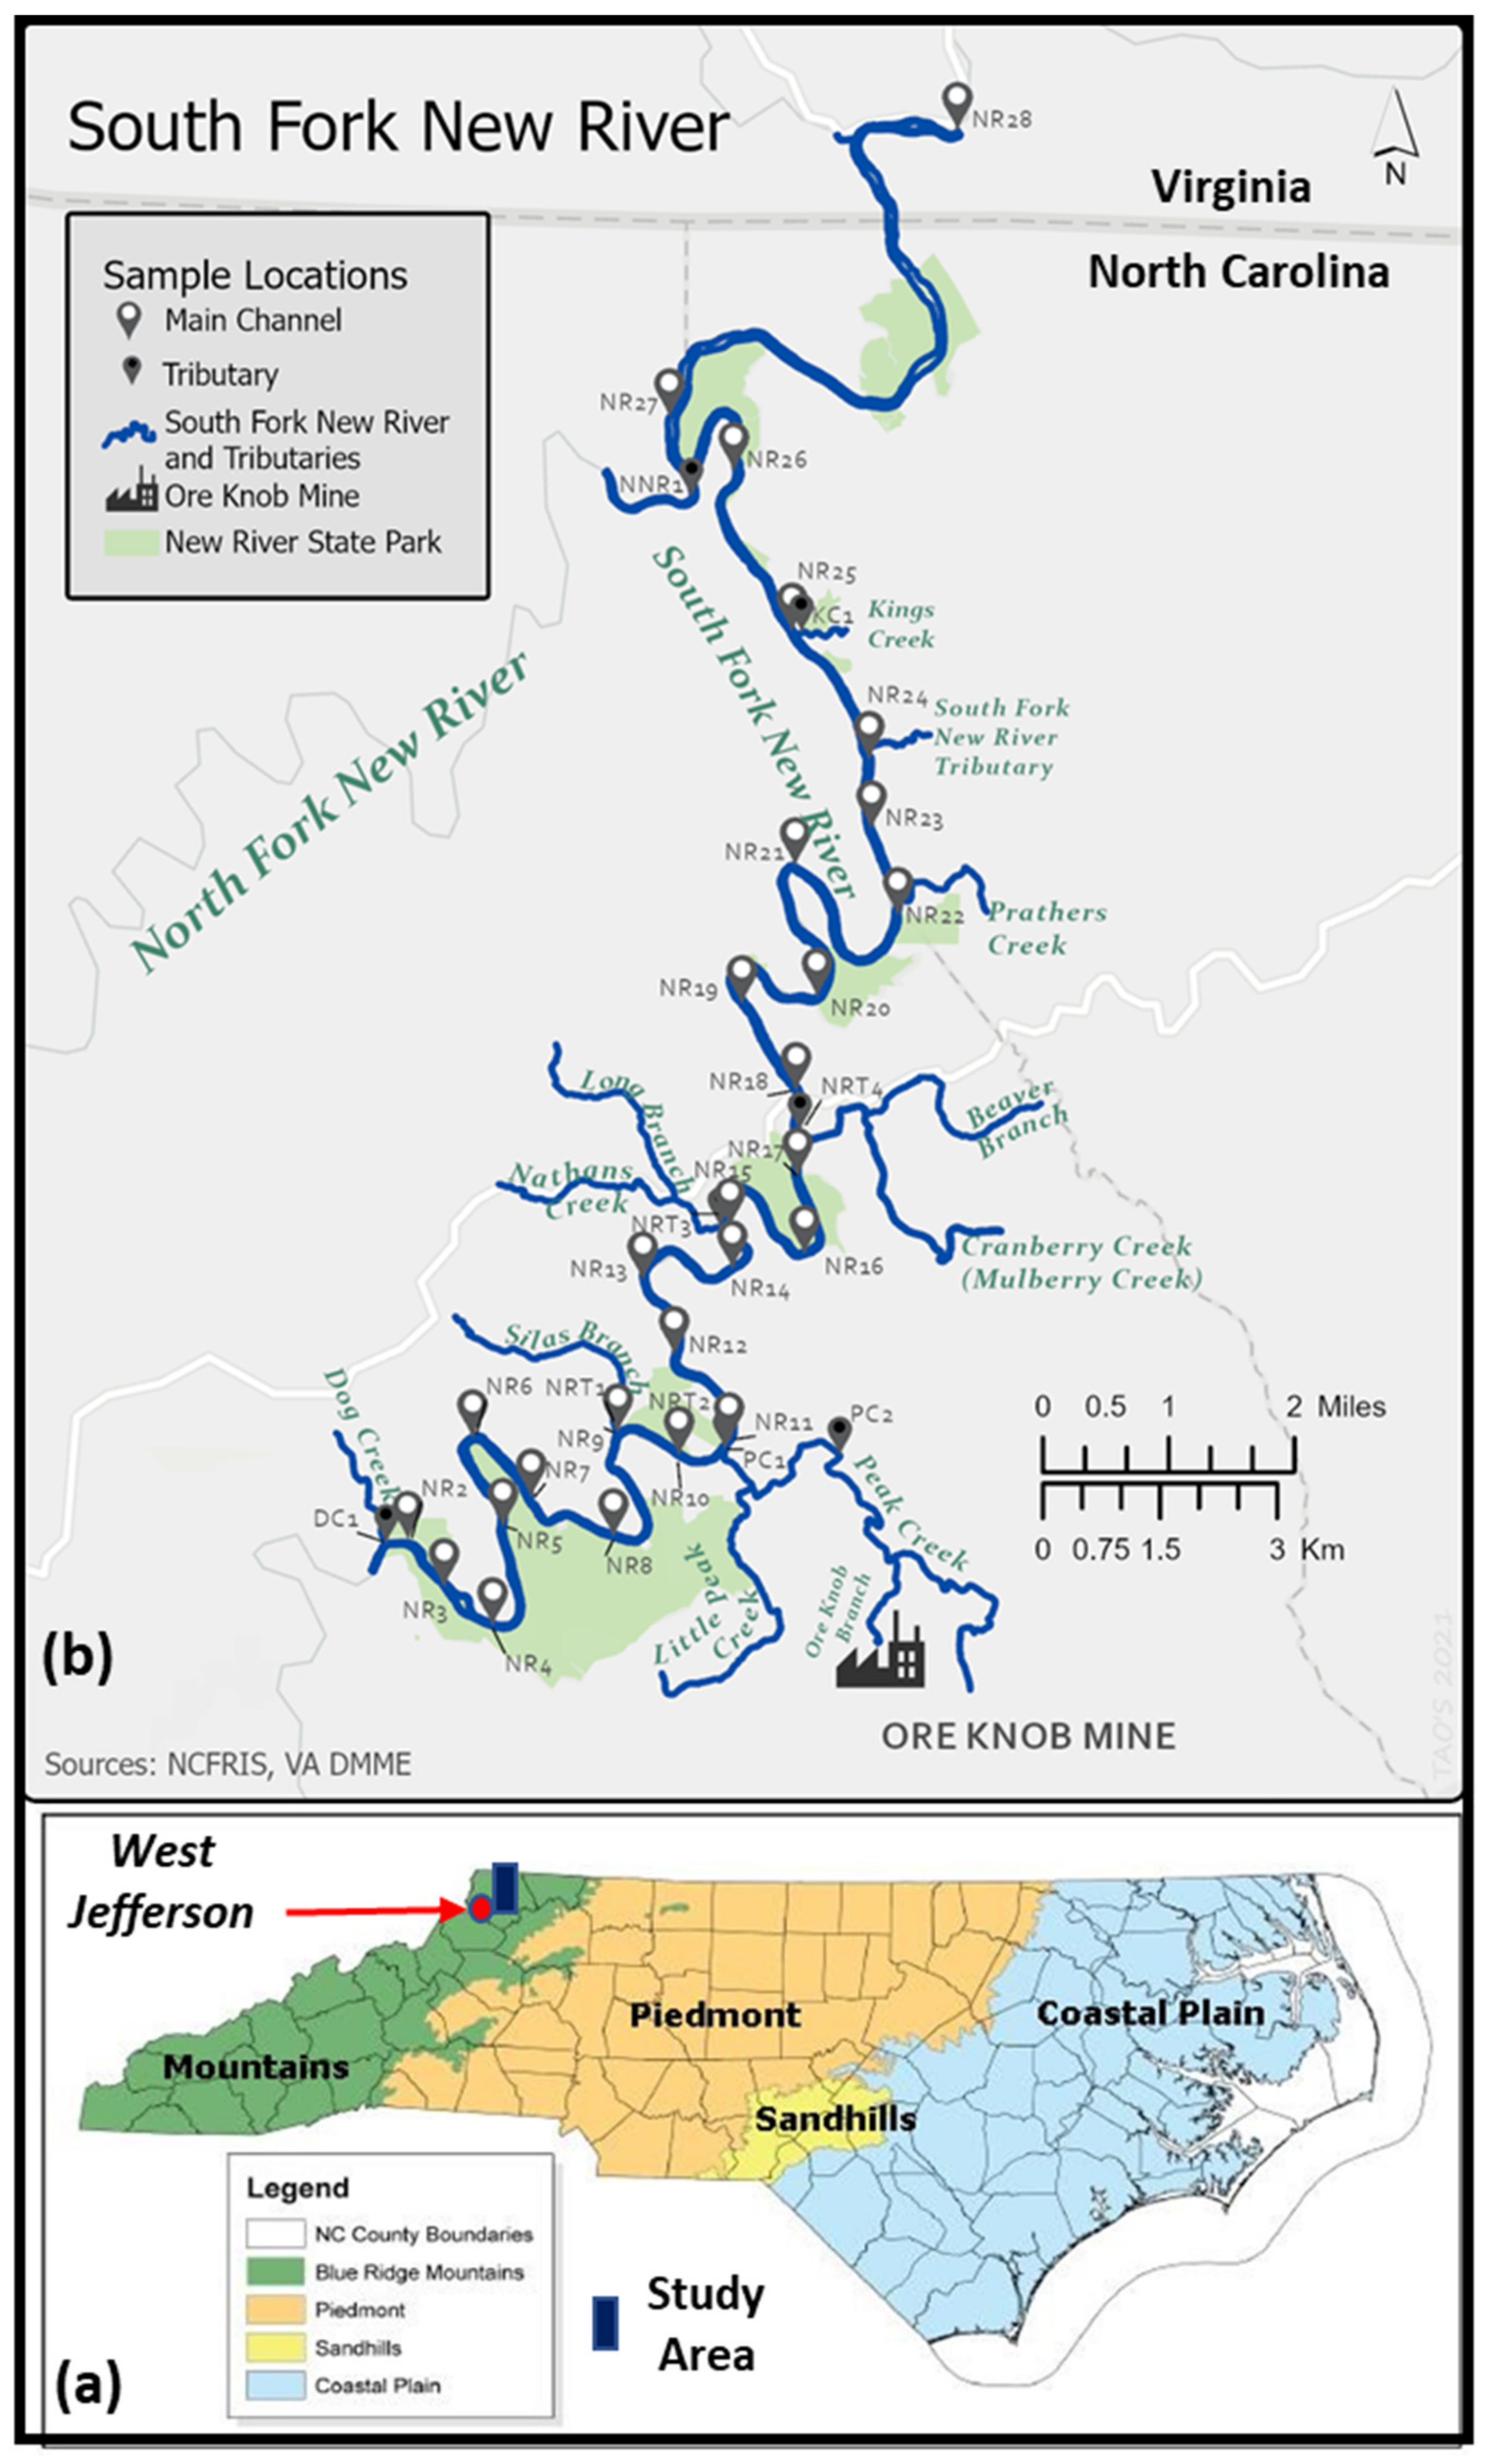
2. Study Area
The South Fork New River
3. Materials and Methods
3.1. Sample Collection
3.2. Geomorphic and Geologic Data
3.3. Analytical Methods
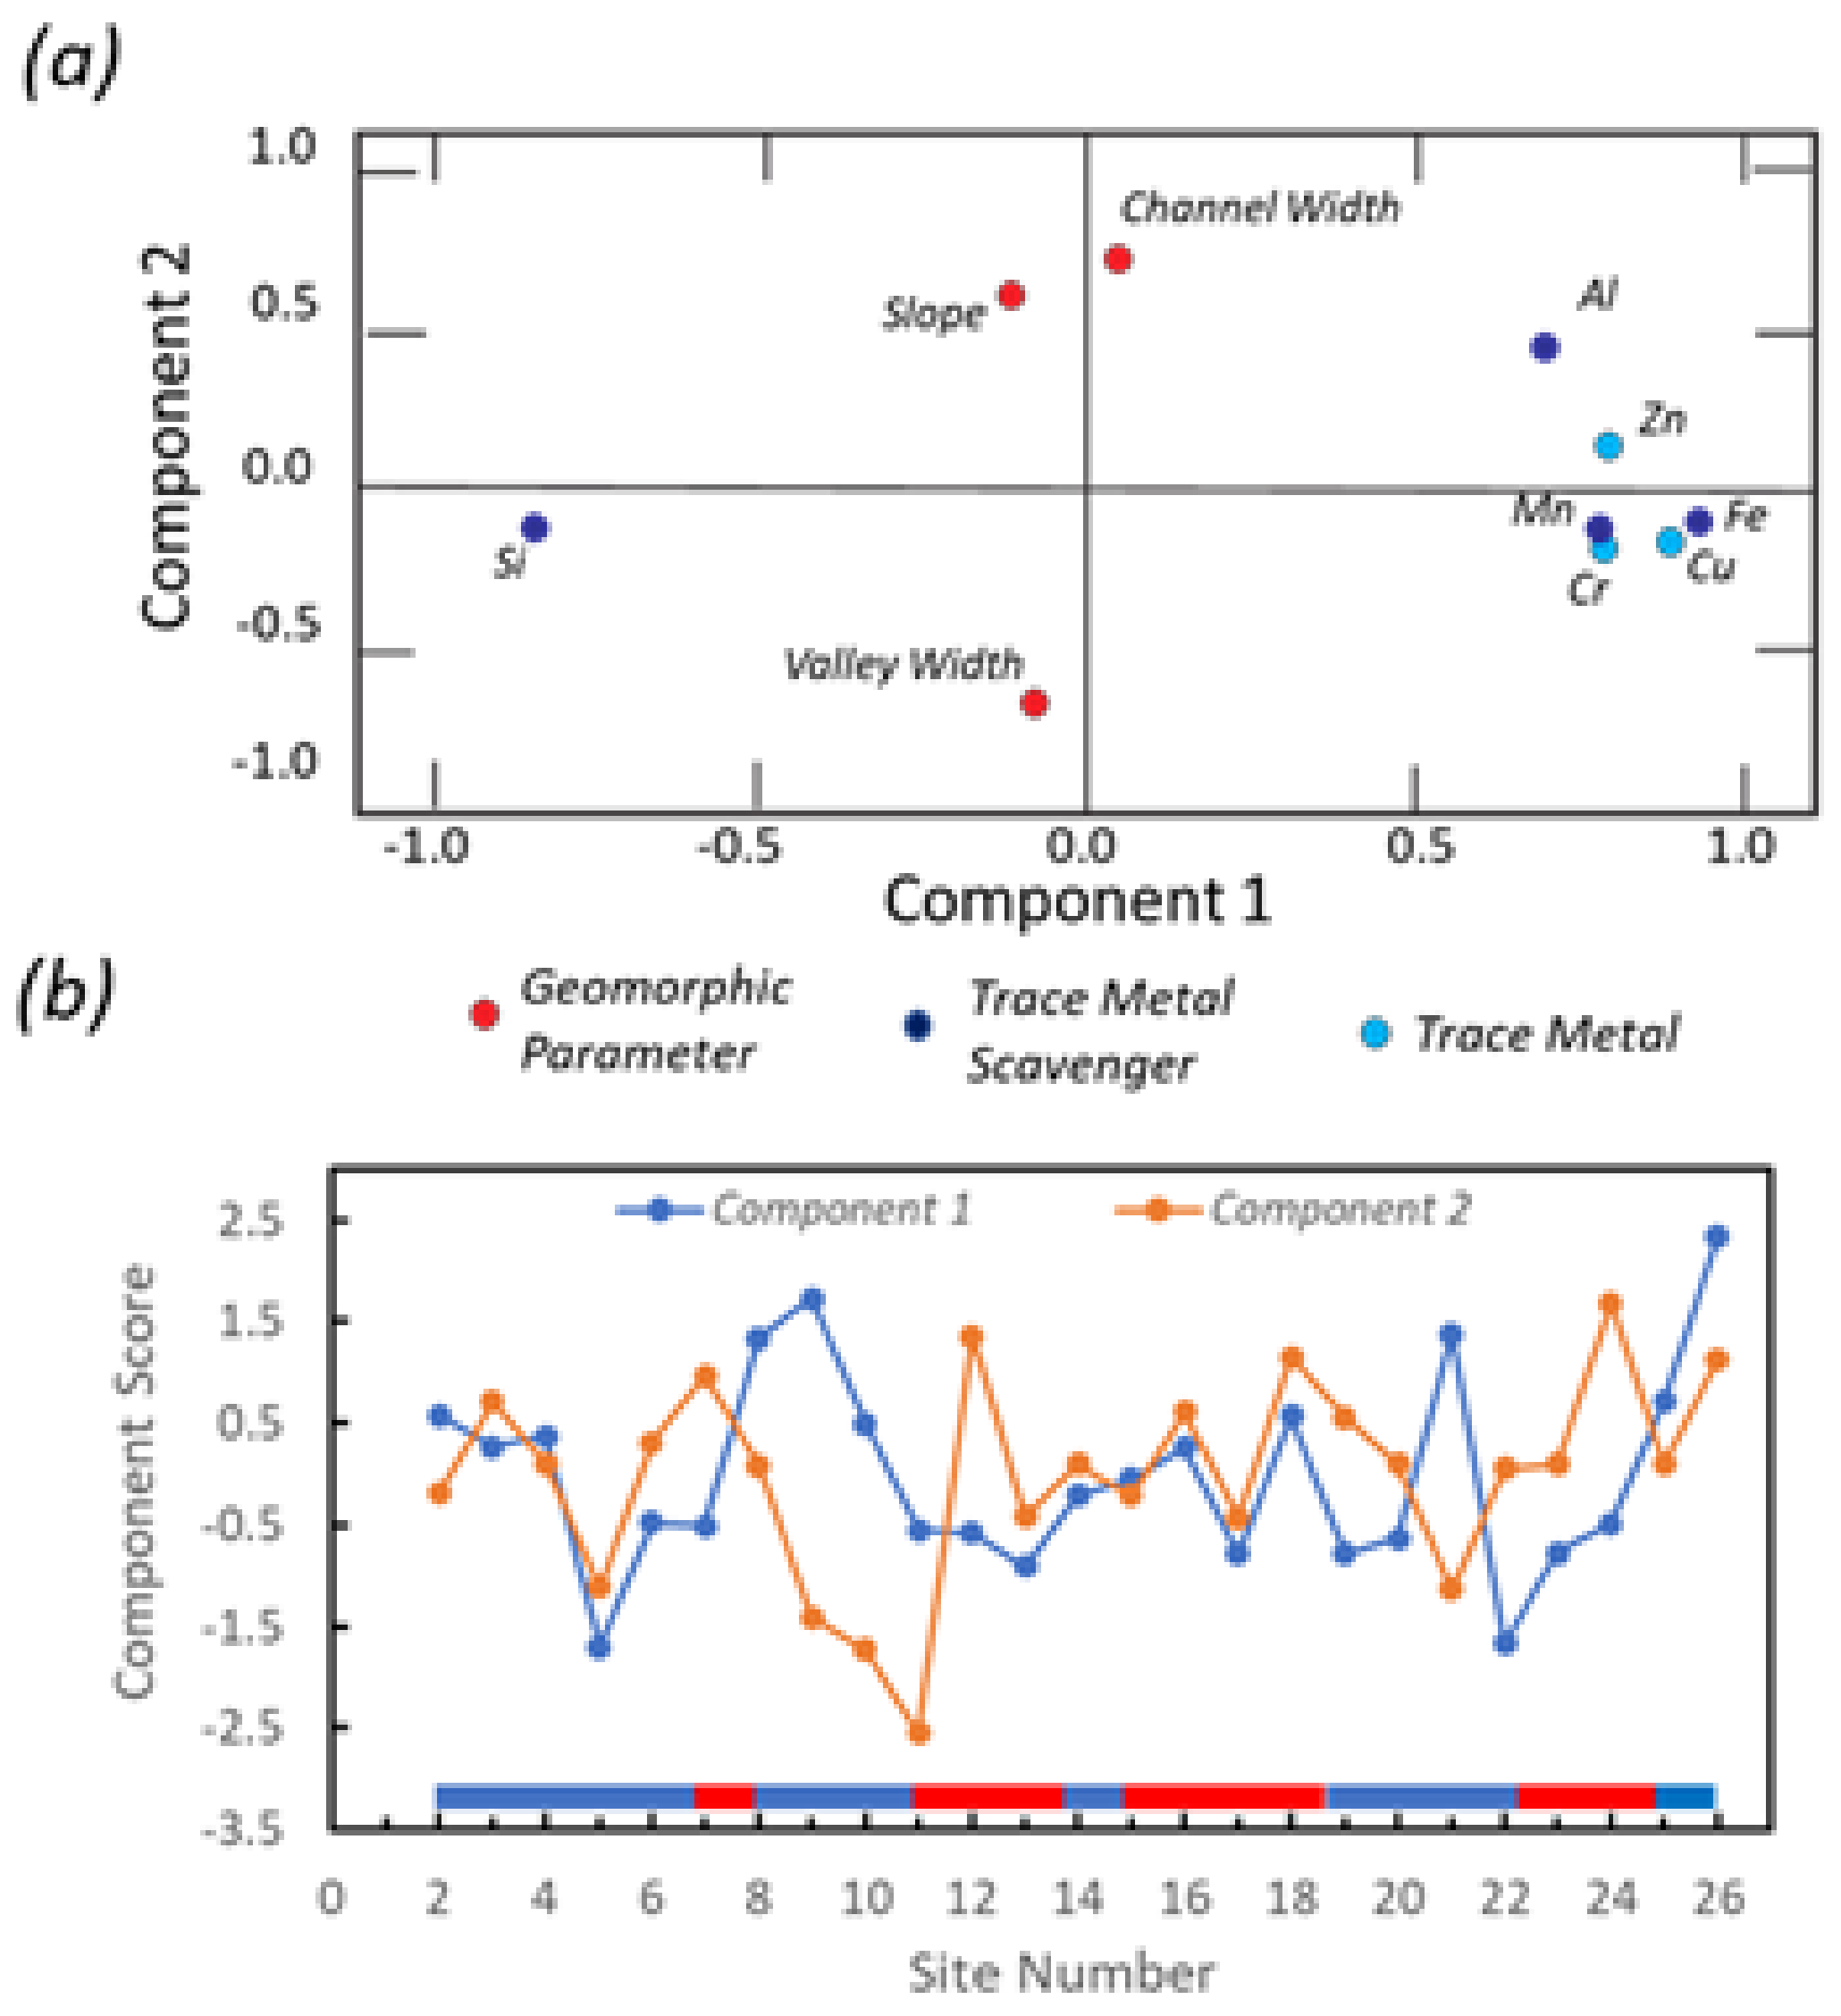
3.4. Statistical Methods
4. Results and Discussion
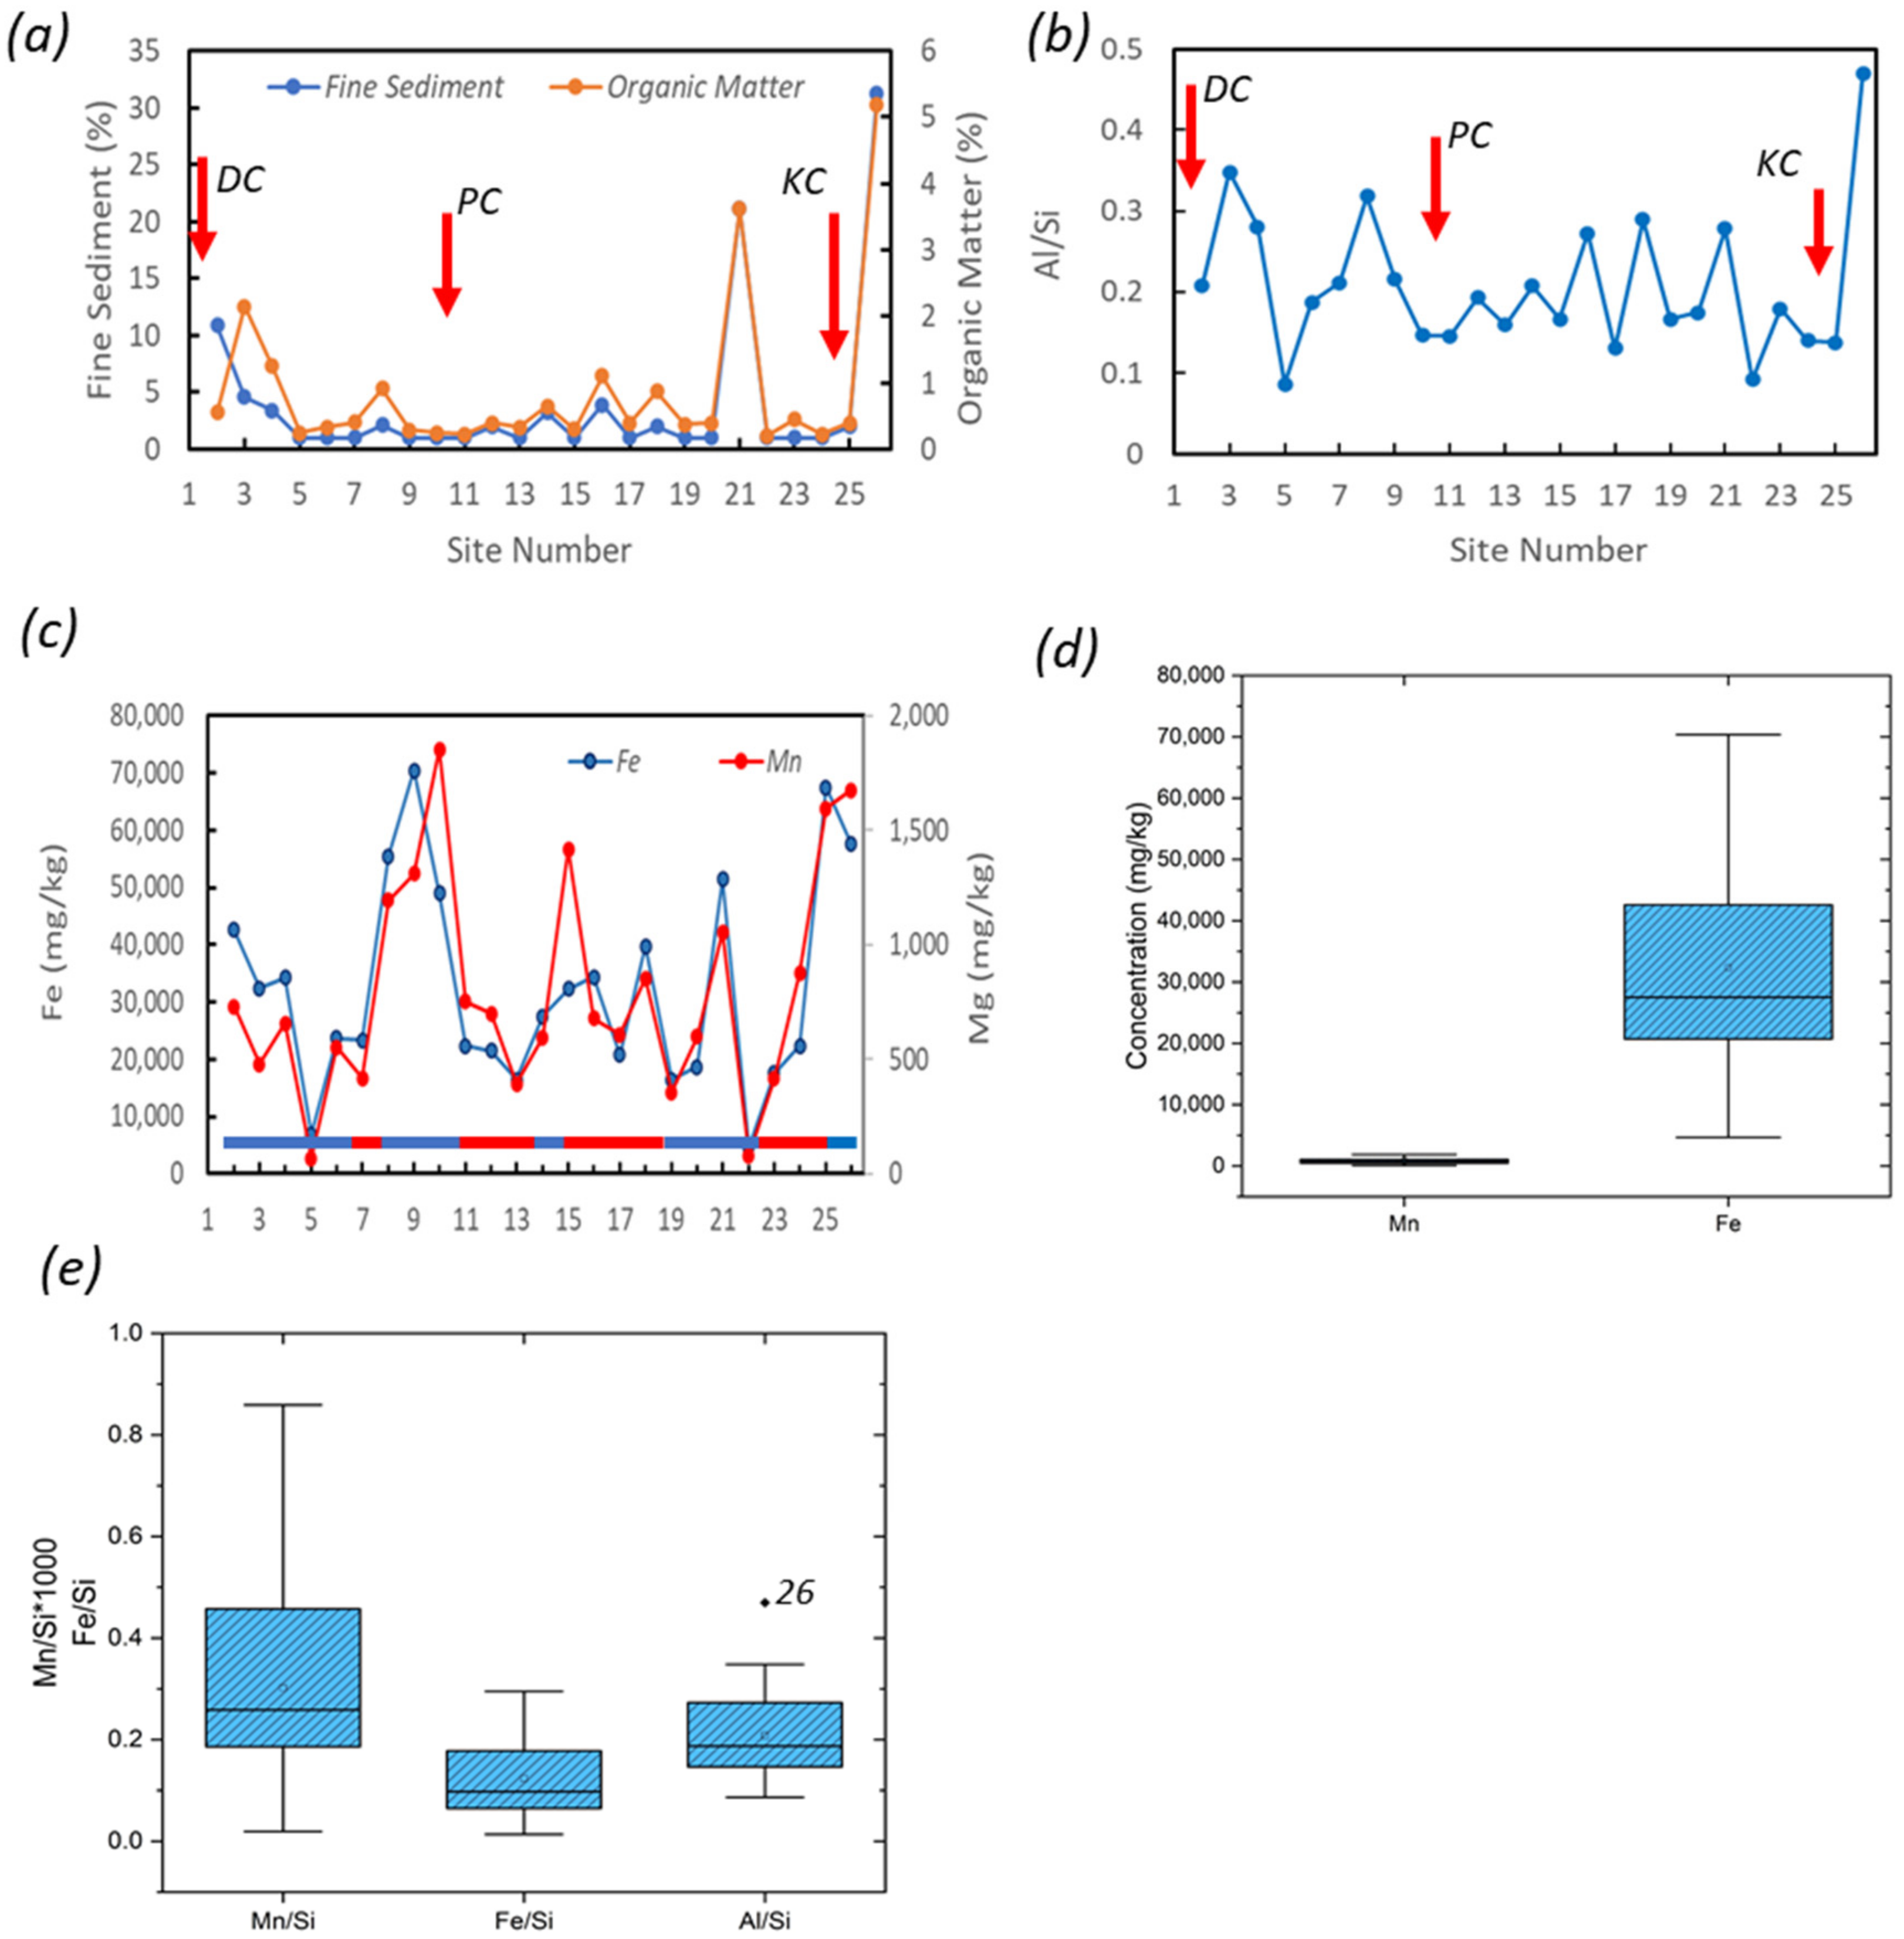
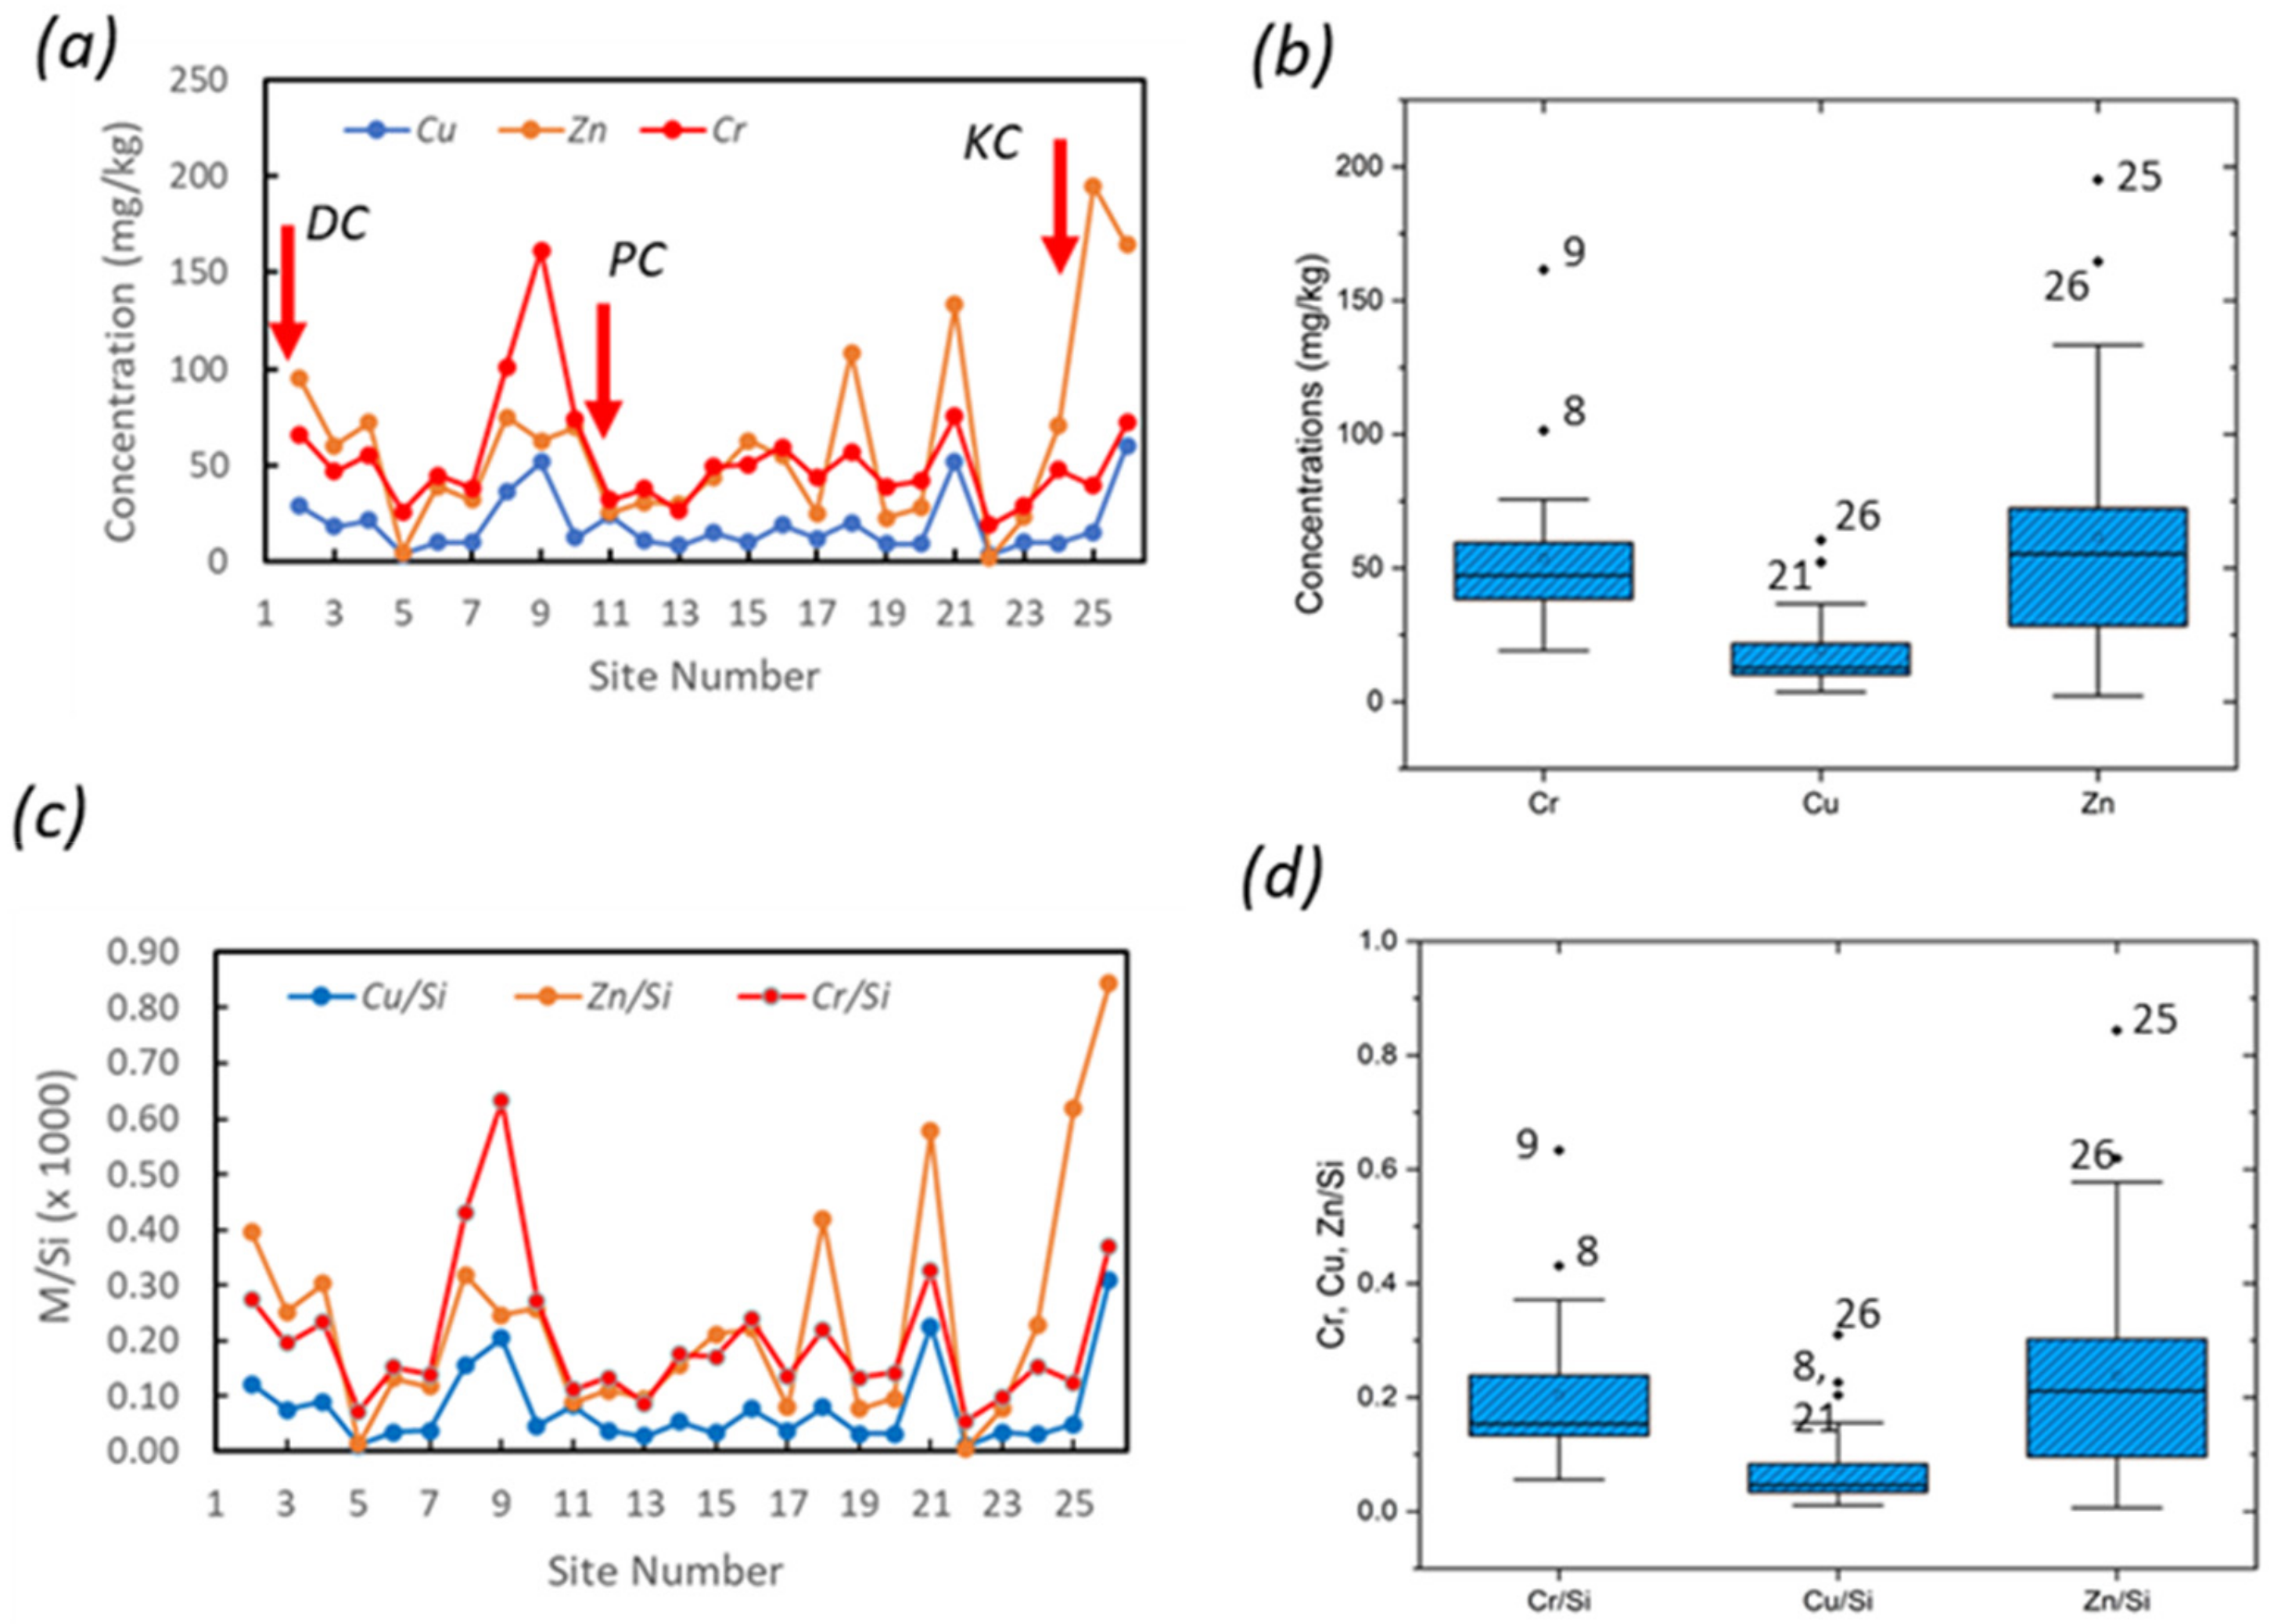
4.1. Influence of Sediment-Metal Relations on Downstream Trace Metal Patterns
4.2. Controls on the Spatial Variations in Metal Concentrations along the South Fork New River (SFNR)
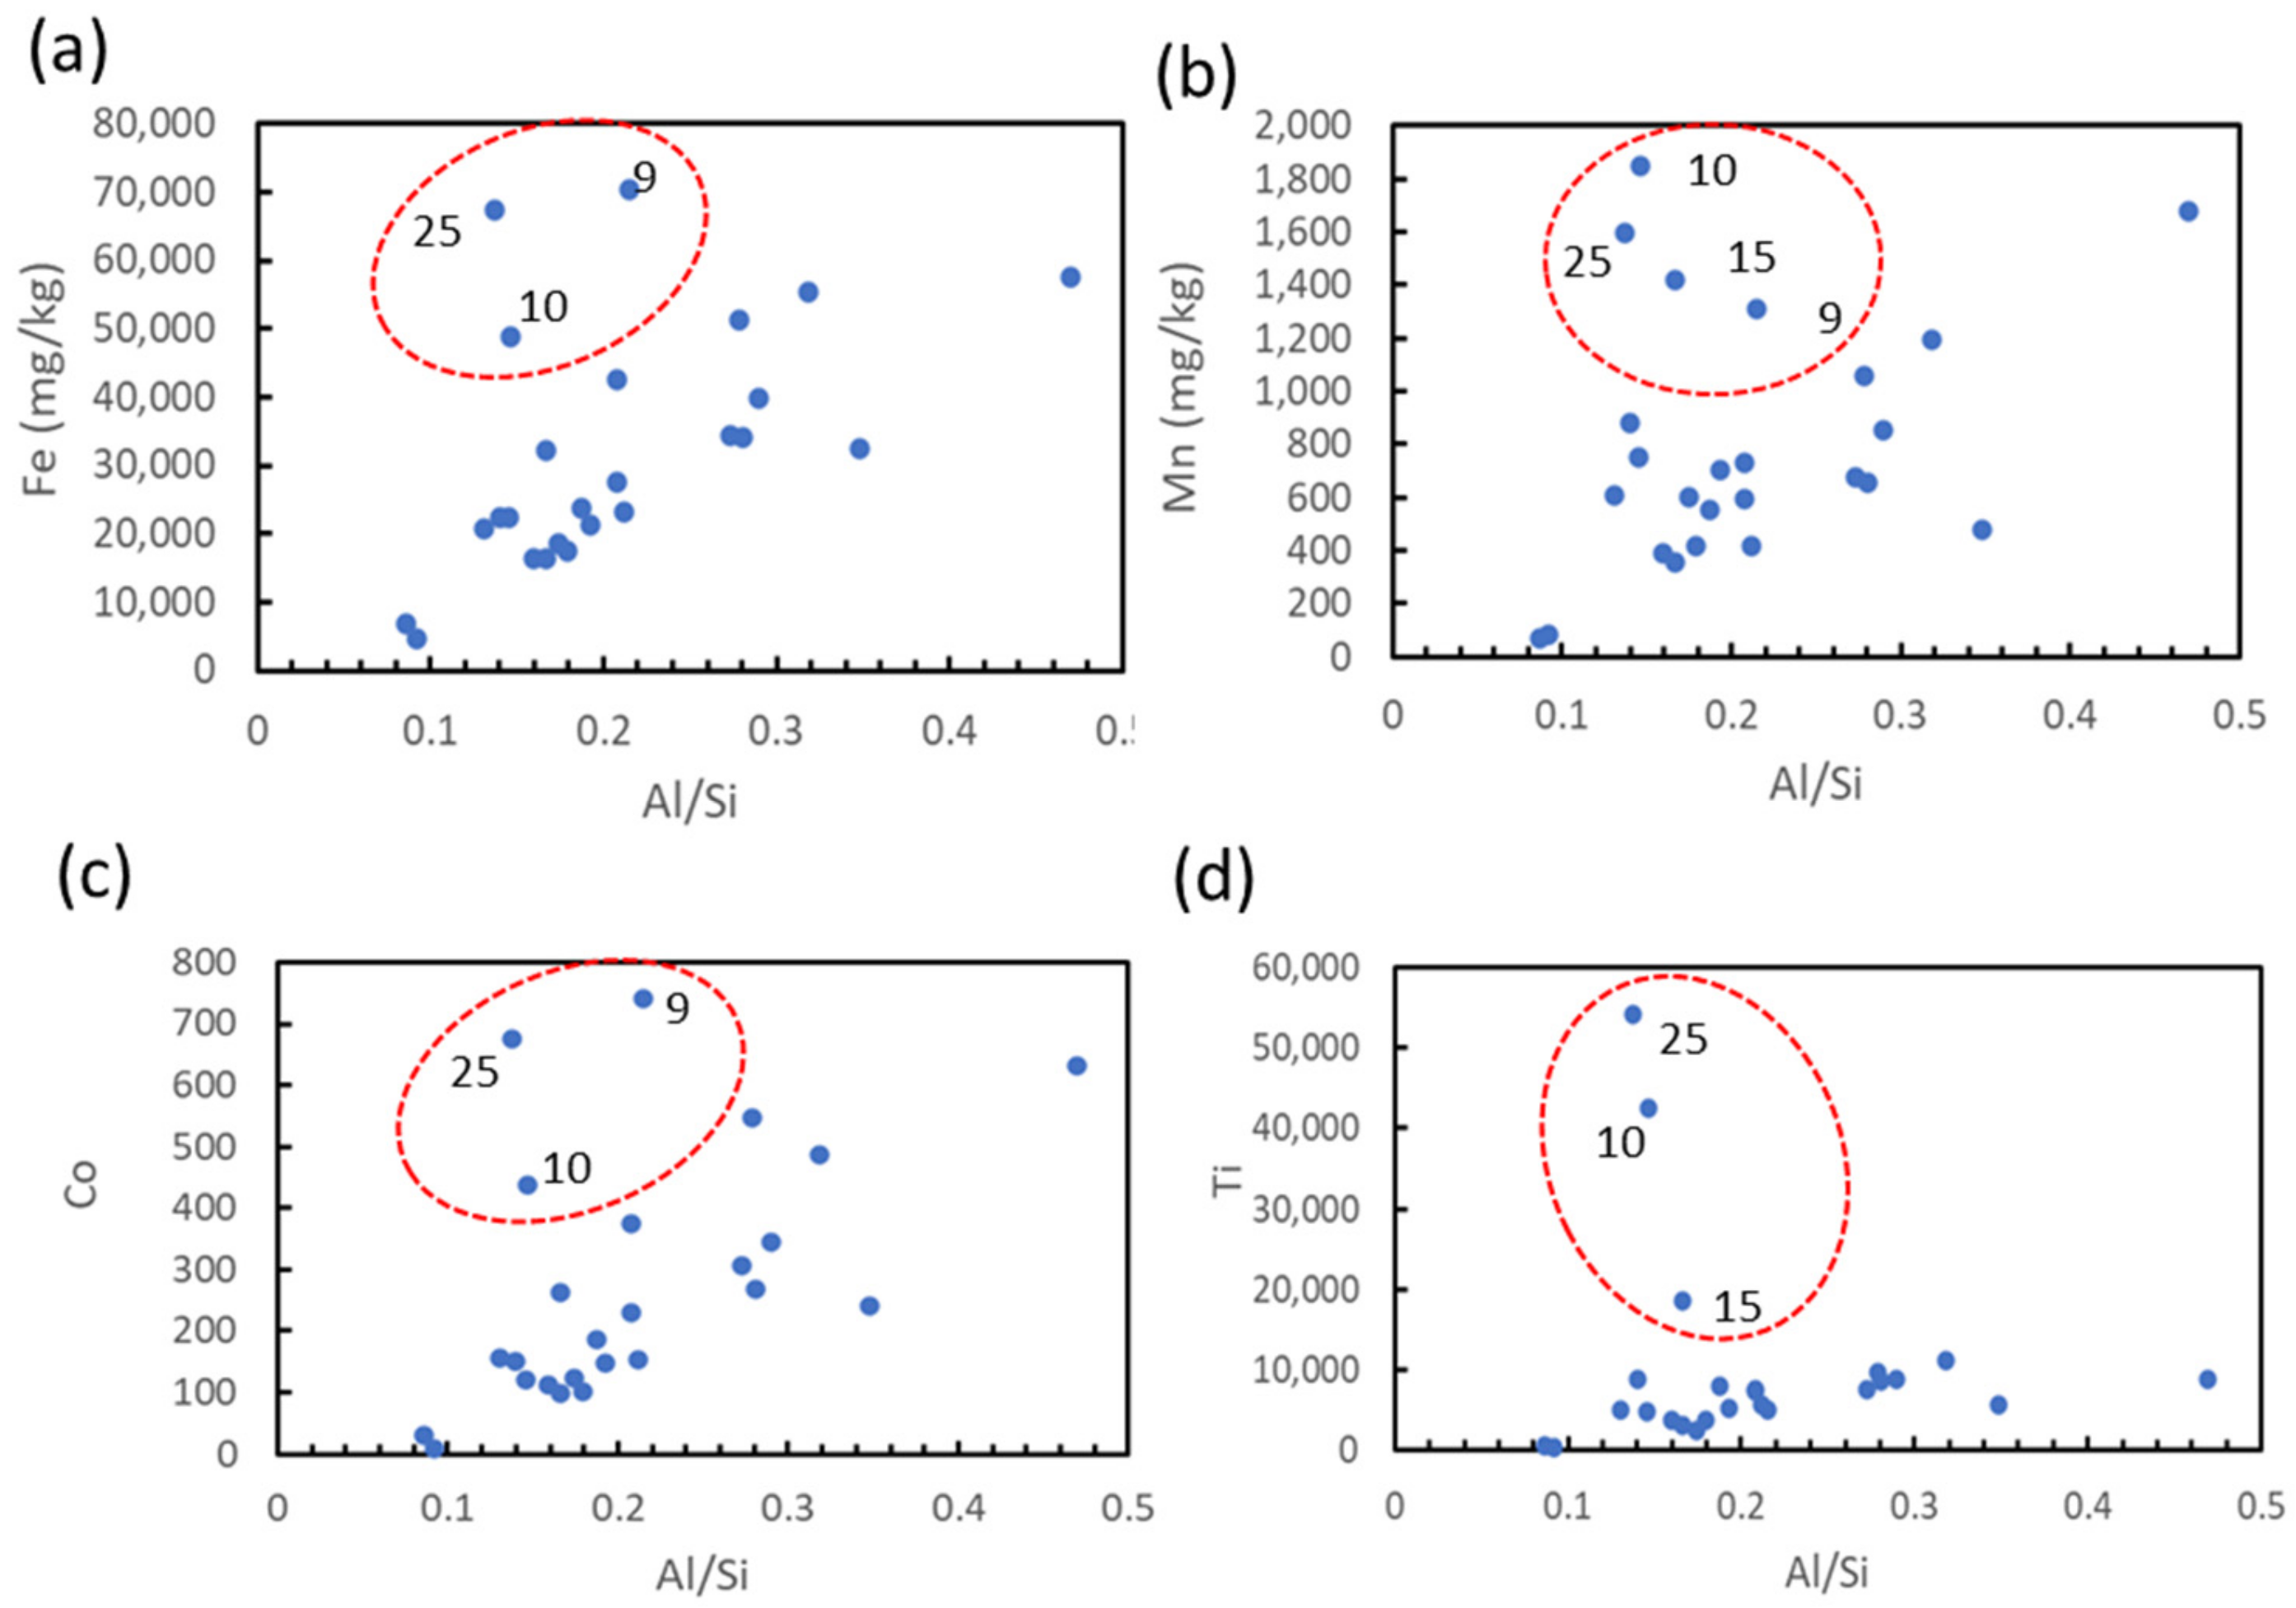
4.2.1. Potential Influence of Provenance on Spatial Variations in Metal Concentrations
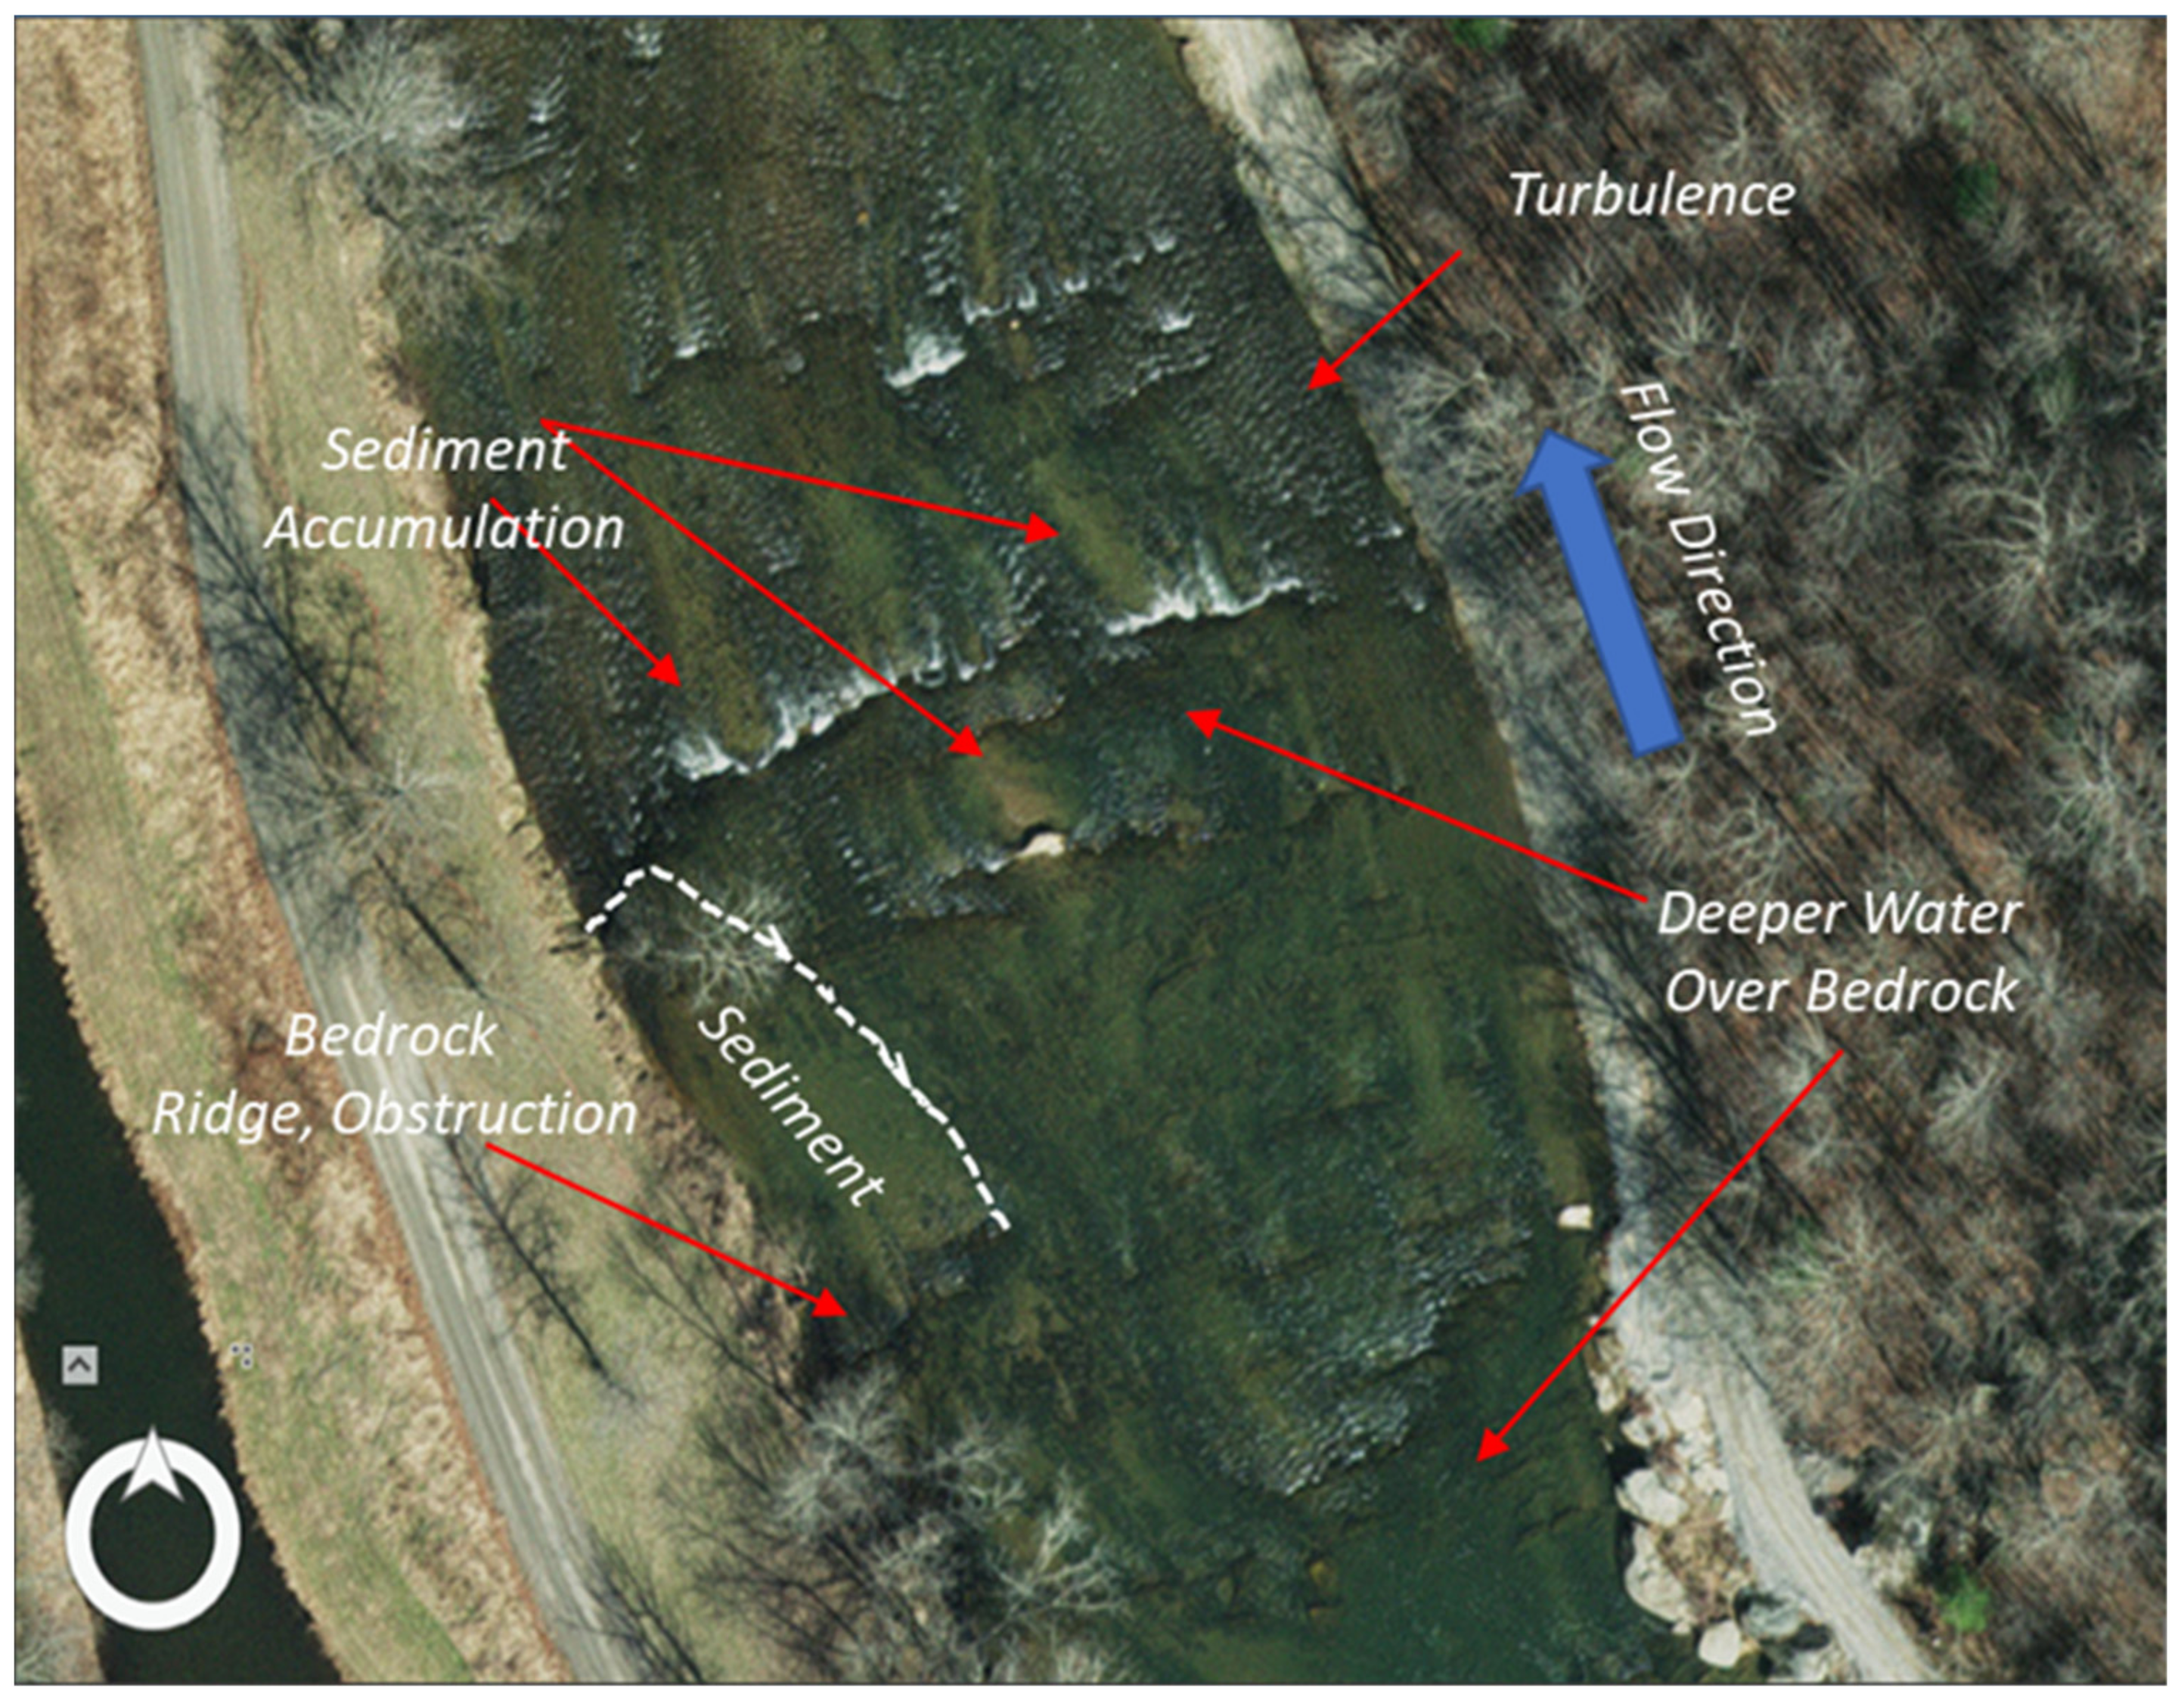
4.2.2. Localized, Geomorphic Influences on Metal Concentrations
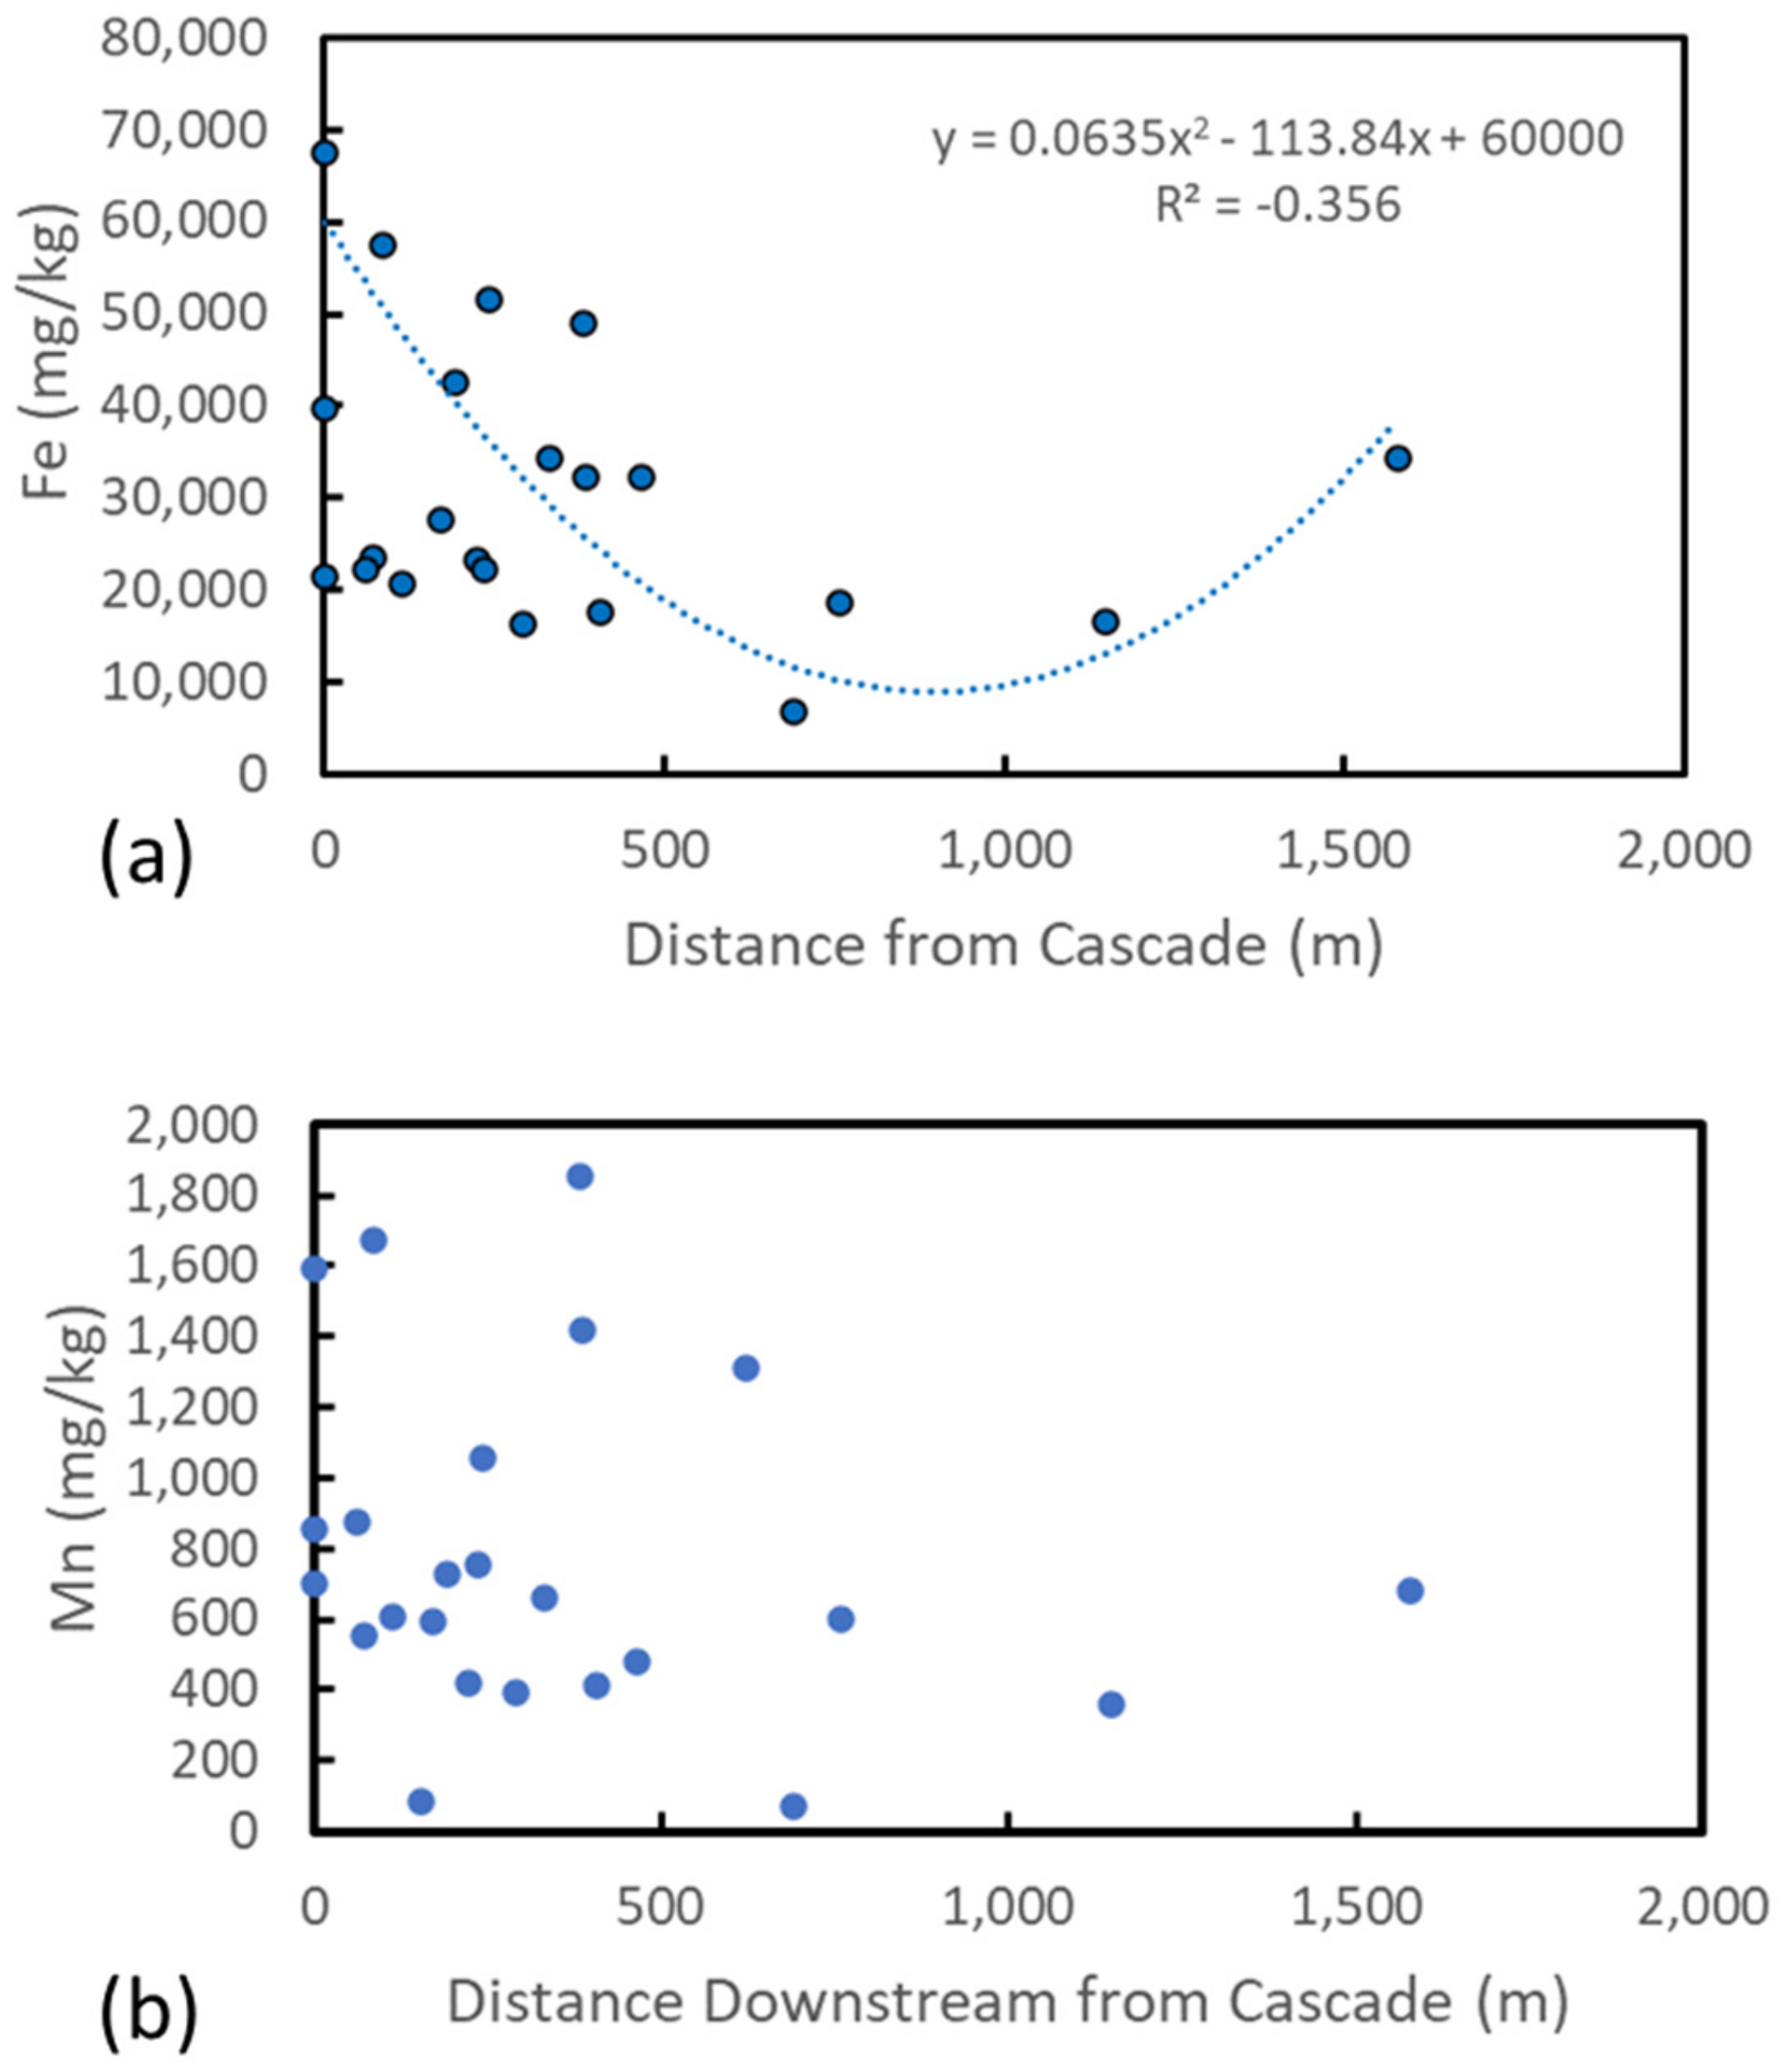
4.2.3. Reach-Scale Geomorphic Influences on Downstream Variations in Metal Concentrations
5. Summary and Conclusions
Supplementary Materials
Author Contributions
Funding
Institutional Review Board Statement
Informed Consent Statement
Data Availability Statement
Acknowledgments
Conflicts of Interest
References
- Macklin, M.G. Metal Contaminated Soil and Sediment: A Geographical Perspective. In Managing the Human Impact on the Natural Environment: Patterns and Processes; Newson, M.D., Ed.; Belhaven Press: London, UK, 1992; pp. 174–195. [Google Scholar]
- Macklin, M.G.; Brewer, P.A.; Hudson-Edwards, K.A.; Bird, G.; Coulthard, T.J.; Dennis, I.A.; Lechler, P.J.; Miller, J.R.; Turner, J.N. A Geomorphological Approach to the Management of Rivers Contaminated by Metal Mining. Geomorphology 2006, 79, 423–447. [Google Scholar] [CrossRef]
- Miller, J.R.; Orbock Miller, S.M. Contaminated Rivers: A Geomorphological-Geochemical Approach to Site Assessment and Remediation; Springer Science & Business Media: Berlin/Heidelberg, Germany, 2007; ISBN 9781402056024. [Google Scholar]
- Matys Grygar, T.; Elznicová, J.; Tůmová, Š.; Faměra, M.; Balogh, M.; Kiss, T. Floodplain Architecture of an Actively Meandering River (the Ploučnice River, the Czech Republic) as Revealed by the Distribution of Pollution and Electrical Resistivity Tomography. Geomorphology 2016, 254, 41–56. [Google Scholar] [CrossRef]
- Matys Grygar, T.; Elznicová, J.; Bábek, O.; Hošek, M.; Engel, Z.; Kiss, T. Obtaining Isochrones from Pollution Signals in a Fluvial Sediment Record: A Case Study in a Uranium-Polluted Floodplain of the Ploučnice River, Czech Republic. Appl. Geochem. 2014, 48, 1–15. [Google Scholar] [CrossRef]
- Hudson-Edwards, K.A.; Jamieson, H.E.; Lottermoser, B.G. Mine Wastes: Past, Present, Future. Elements 2011, 7, 375–380. [Google Scholar] [CrossRef]
- Miller, J.R.; Lechler, P.J.; Desilets, M. The Role of Geomorphic Processes in the Transport and Fate of Mercury in the Carson River Basin, West-Central Nevada. Environ. Geol. 1998, 33, 249–262. [Google Scholar] [CrossRef]
- Horowitz, A.J.; Elrick, K.A. The Relation of Stream Sediment Surface Area, Grain Size and Composition to Trace Element Chemistry. Appl. Geochem. 1987, 2, 437–451. [Google Scholar] [CrossRef]
- Martin, J.-M.; Meybeck, M. Elemental Mass-Balance of Material Carried by Major World Rivers. Mar. Chem. 1979, 7, 173–206. [Google Scholar] [CrossRef]
- Nelson, P.A.; Seminara, G. A Theoretical Framework for the Morphodynamics of Bedrock Channels. Geophys. Res. Lett. 2012, 39, 30. [Google Scholar] [CrossRef]
- Inoue, T.; Izumi, N.; Shimizu, Y.; Parker, G. Interaction among Alluvial Cover, Bed Roughness, and Incision Rate in Purely Bedrock and Alluvial-Bedrock Channel. J. Geophys. Res. Earth Surf. 2014, 119, 2123–2146. [Google Scholar] [CrossRef]
- Goode, J.R.; Wohl, E. Coarse Sediment Transport in a Bedrock Channel with Complex Bed Topography. Water Resour. Res. 2010, 46, 22. [Google Scholar] [CrossRef] [Green Version]
- Finnegan, N.J.; Sklar, L.S.; Fuller, T.K. Interplay of Sediment Supply, River Incision, and Channel Morphology Revealed by the Transient Evolution of an Experimental Bedrock Channel. J. Geophys. Res. Earth Surf. 2007, 112, 134. [Google Scholar] [CrossRef]
- Whipple, K.X. Bedrock rivers and the geomorphology of active orogens. Annu. Rev. Earth Planet. Sci. 2004, 32, 151–185. [Google Scholar] [CrossRef] [Green Version]
- Sklar, L.S.; Dietrich, W.E. Sediment and Rock Strength Controls on River Incision into Bedrock. Geology 2001, 29, 1087–1090. [Google Scholar] [CrossRef]
- Custer, K. Cleaning Up Western Watersheds: A Report by Kelly Custer for Mineral Policy Center; U.S. Environmental Protection Agency: Washington, DC, USA, 2003; p. 36. [Google Scholar]
- USEPA Mine Sites: Characterization, Cleanup, and Revitalization of Mine Sites. Contaminated Site Clean-Up Information; USEPA: Washington, DC, USA, 2021. [Google Scholar]
- Behrooz, M. Acid Mine Drainage at Ore Knob Tailings Pile-Hydrologic and Geochemical Characterization and Bioremediation. Ph.D. Thesis, North Carolina State University, Raleigh, NC, USA, 2012. [Google Scholar]
- Rankin, H.S.; Stuckey, J.L. Copper Deposits of Western North Carolina; TVA and NC Division of Mineral Resources: Knoxville, TN, USA, 1943. [Google Scholar]
- Kinkel, A.R., Jr. The Ore Knob Copper Deposit North Carolina, and Other Massive Sulfide Deposits of the Appalachians; USGS Professional Paper: Washington, DC, USA, 1967. [Google Scholar]
- Ore Knob Mine NPL Site. NCDHHS Public Health Assessment; NCDHHS: Raleigh, NC, USA, 2010. [Google Scholar]
- NCOneMap. NC OneMap: Geology. 2009. Available online: https://www.nconemap.gov/ (accessed on 1 December 2021).
- FRIS. North Carolina Flood Risk Information System. Available online: https://fris.nc.gov/fris/Index.aspx?ST=NC (accessed on 1 December 2021).
- Horowitz, A.J. Primer on Sediment-Trace Element Chemistry; Lewis Publishers: Boca Raton, FL, USA, 1991; ISBN 9780873714990. [Google Scholar]
- Evans, D.; Davies, B.E. The Influence of Channel Morphology on the Chemical Partitioning of Pb and Zn in Contaminated Rivers. Appl. Geochem. 1994, 9, 45–52. [Google Scholar] [CrossRef]
- Ciszewski, D. Source of Pollution as a Factor Controlling Distibution of Heavy Metals in River Chechlo Bottom Sediments. Environ. Geol. 1997, 28, 50–57. [Google Scholar] [CrossRef]
- Balaban, S.-I.; Hudson-Edwards, K.A.; Miller, J.R. A GIS-Based Method for Evaluating Sediment Storage and Transport in Large Mining-Affected River Systems. Environ. Earth Sci. 2015, 74, 4685–4698. [Google Scholar] [CrossRef]
- Hoogsteen, M.J.J.; Lantinga, E.A.; Bakker, E.J.; Groot, J.C.J.; Tittonell, P.A. Estimating Soil Organic Carbon through Loss on Ignition: Effects of Ignition Conditions and Structural Water Loss. Eur. J. Soil Sci. 2015, 66, 320–328. [Google Scholar] [CrossRef]
- Macklin, M.G. Fluxes and Storage of Sediment-Associated Heavy Metals in Floodplain Systems: Assessment and River Basin Management Issues at a Time of Rapid Envrionmental Change. In Floodplain Processes; Anderson, M.G., Walling, D.E., Bates, P.B., Eds.; John Wiley & Sons, Ltd.: Hoboken, NJ, USA, 1996; pp. 441–446. [Google Scholar]
- Bábek, O.; Grygar, T.M.; Faměra, M.; Hron, K.; Nováková, T.; Sedláček, J. Geochemical Background in Polluted River Sediments: How to Separate the Effects of Sediment Provenance and Grain Size with Statistical Rigour? CATENA 2015, 135, 240–253. [Google Scholar] [CrossRef]
- Segeman, B.B.; Lyons, T.W. Geochemistry of Fine-Grained Sediments and Sedimenary Rocks. In Sediments, Diagenesis, and Sedimentary Rocks; Treatise on Geochemistry; Mackenzie, F.T., Ed.; Elsevier: Amsterdam, The Netherlands, 2005; pp. 115–289. [Google Scholar]
- Bloemsma, M.R.; Zabel, M.; Stuut, J.B.W.; Tjallingii, R.; Collins, J.A.; Weltje, G.J. Modelling the Joint Variability of Grain Size and Chemical Composition in Sediments. Sediment. Geol. 2012, 280, 135–148. [Google Scholar] [CrossRef]
- Tukey, J.W. Exploratory Data Analysis; Addison Wesley: Boston, MA, USA, 1977. [Google Scholar]
- Reimann, C.; Garrett, R.G. Geochemical Background—Concept and Reality. Sci. Total Environ. 2005, 350, 12–27. [Google Scholar] [CrossRef]
- Dendievel, A.-M.; Mourier, B.; Dabrin, A.; Delile, H.; Coynel, A.; Gosset, A.; Liber, Y.; Berger, J.-F.; Bedell, J.-P. Metal Pollution Trajectories and Mixture Risk Assessed by Combining Dated Cores and Subsurface Sediments along a Major European River (Rhône River, France). Environ. Int. 2020, 144, 106032. [Google Scholar] [CrossRef]
- Woldfenden, P.I.; Lewin, J. Distribution of Metal Pollution in Floodplain Sediments. CATENA 1977, 4, 309–317. [Google Scholar] [CrossRef]
- Lewin, J.; Macklin, M. Metal Mining and Floodplain Sedimentation in Britian. In International Geomorphology; Part I; Garkiner, V., Ed.; John Wiley & Sons, Ltd.: Hoboken, NJ, USA, 1987. [Google Scholar]
- Taylor, M.P.; Kesterton, R.G.H. Heavy Metal Contamination of an Arid River Environment: Gruben River, Namibia. Geomorphology 2002, 42, 311–327. [Google Scholar] [CrossRef]
- USEPA. Final Expanded Site Inspection Report Ore Knob Former Mine Site, Ashe County, North Carolina; CERCLIS: Atlanta, GA, USA, 2008. [Google Scholar]
- Miller, J.R.; Mackin, G. Concentrations, Sources, and Potential Ecological Impacts of Selected Trace Metals on Aquatic Biota within the Little Tennessee River Basin, North Carolina. Water Air Soil Pollut. 2013, 224, 1613. [Google Scholar] [CrossRef]
- North Carolina Geological Survey, (NCGS). Acidic Rocks in the Little Tennessee River Basin; NCGS: Raleigh, NC, USA, 1985. [Google Scholar]
- Jankowski, J. Changes in Water Quality in a Steam Impacted by Longwall Mining Subsidence. In Proceedings of the 7th Triennial Conference on Mine Subsidence; Mine Subsidence Technological Society, Wollongong, Australia, 26–27 November 2007; pp. 241–251. [Google Scholar]
- Ladd, S.C.; Marcus, W.A.; Cherry, S. Differences in Trace Meal Concentrations among Fluvial Morphic Units and Implications for Sampling. Environ. Geol. 1998, 36, 259–270. [Google Scholar] [CrossRef]
- Ciszewski, D. Pollution of Mala Panew River Sediments by Heavy Metals: Part I. Effect of Changes in River Bed Morphology. Pol. J. Environ. Sci. Stud. 2004, 13, 589–595. [Google Scholar]
- Graf, W.L.; Clark, S.L.; Kammerer, M.T.; Lehman, T.; Randall, K.; Schroeder, R. Geomorphology of Heavy Metals in the Sediments of Queen Creek, Arizona, USA. CATENA 1991, 18, 567–582. [Google Scholar] [CrossRef]
- Skalak, K.; Pizzuto, J. The Distribution and Residence Time of Suspended Sediment Stored within the Channel Margins of a Gravel-Bed Bedrock River. Earth Surf. Process. Landf. 2010, 35, 435–446. [Google Scholar] [CrossRef]
- Wohl, E.E.; Ikeda, H. Experimental Simulations of Channel Incision into a Cohesive Substrate at Varying Gradients. Geology 1997, 25, 295–298. [Google Scholar] [CrossRef]
- Johnson, J.P.; Whipple, K.X. Feedbacks between Erosion and Sediment Transport in Experimental Bedrock Channels. Earth Surf. Process. Landf. 2007, 32, 1048–1062. [Google Scholar] [CrossRef]
- Goode, J.R.; Wohl, E. Substrate Controls on the Longitudinal Profile of Bedrock Channels: Implications for Reach-Scale Roughness. J. Geophys. Res. Earth Surf. 2010, 115, 69. [Google Scholar] [CrossRef]
- Birch, G.F.; Taylor, S.E.; Matthai, C. Small-Scale Spatial and Temporal Variance in the Concentration of Heavy Metals in Aquatic Sediments: A Review and Some New Concepts. Environ. Pollut. 2001, 113, 357–372. [Google Scholar] [CrossRef]


| n = 25 | Fine Sed. | OM | Al | Cr | Cu | Fe | Mn | SI | Zn |
|---|---|---|---|---|---|---|---|---|---|
| Fine Sed. | 1 | ||||||||
| OM | 0.000 | 1 | |||||||
| Al | 0.539 ** | −0.003 | 1 | ||||||
| Cr | 0.434 ** | −0.003 | 0.400 ** | 1 | |||||
| Cu | 0.588 ** | −0.067 | 0.457 ** | 0.591 ** | 1 | ||||
| Fe | 0.475 ** | −0.084 | 0.420 ** | 0.767 ** | 0.691 ** | 1 | |||
| Mn | 0.249 | 00.205 | 0.140 | 0.567 ** | 0.518 ** | 0.667 ** | 1 | ||
| Si | −0.611 ** | −0.037 | −0.553 ** | −0.553 ** | −0.651 ** | −0.560 ** | −0.320 * | 1 | |
| Zn | 0.523 ** | −0.118 | 0.413 ** | 0.613 ** | 0.551 ** | 0.767 ** | 0.593 ** | −0.513 ** | 1 |
| Parameter | Baseline Value (mg/kg) | Background Range (mg/kg) | 75th Percentile |
|---|---|---|---|
| Cr | 19.09 | 19.09–75.67 | 62.78 |
| Cu | 12.62 | 3.67–36.59 | 22.97 |
| Zn | 55.27 | 2.17–133.36 | 73.63 |
| Fe | 27,522 | 4676–70,362 | 45,753 |
| Mn | 679 | 70–1852 | 1056 |
| Organic Matter | 0.4 | 0.2–1.25 | 0.87 |
| Al/Si | 0.18 | 0.086–0.348 | 0.28 |
| Variable | Comp. 1 | Comp. 2 |
|---|---|---|
| Channel Width | 0.034 | 0.716 |
| Valley Width | −0.085 | −0.709 |
| Channel Slope | −0.122 | 0.622 |
| Al | 0.681 | 0.439 |
| Cu | 0.887 | −0.160 |
| Cr | 0.779 | −0.214 |
| Fe | 0.933 | −0.125 |
| Mn | 0.774 | −0.152 |
| Si | −0.852 | −0.140 |
| Zn | 0.790 | 0.145 |
Publisher’s Note: MDPI stays neutral with regard to jurisdictional claims in published maps and institutional affiliations. |
© 2021 by the authors. Licensee MDPI, Basel, Switzerland. This article is an open access article distributed under the terms and conditions of the Creative Commons Attribution (CC BY) license (https://creativecommons.org/licenses/by/4.0/).
Share and Cite
Miller, J.R.; Watkins, X.; O'Shea, T.; Atterholt, C. Controls on the Spatial Distribution of Trace Metal Concentrations along the Bedrock-Dominated South Fork New River, North Carolina. Geosciences 2021, 11, 519. https://doi.org/10.3390/geosciences11120519
Miller JR, Watkins X, O'Shea T, Atterholt C. Controls on the Spatial Distribution of Trace Metal Concentrations along the Bedrock-Dominated South Fork New River, North Carolina. Geosciences. 2021; 11(12):519. https://doi.org/10.3390/geosciences11120519
Chicago/Turabian StyleMiller, Jerry R., Xaviera Watkins, Thomas O'Shea, and Cynthia Atterholt. 2021. "Controls on the Spatial Distribution of Trace Metal Concentrations along the Bedrock-Dominated South Fork New River, North Carolina" Geosciences 11, no. 12: 519. https://doi.org/10.3390/geosciences11120519
APA StyleMiller, J. R., Watkins, X., O'Shea, T., & Atterholt, C. (2021). Controls on the Spatial Distribution of Trace Metal Concentrations along the Bedrock-Dominated South Fork New River, North Carolina. Geosciences, 11(12), 519. https://doi.org/10.3390/geosciences11120519