
Record of Crustal Thickening and Synconvergent Extension from the Dajiamang Tso Rift, Southern Tibet

 ,
, 
Abstract
1. Introduction
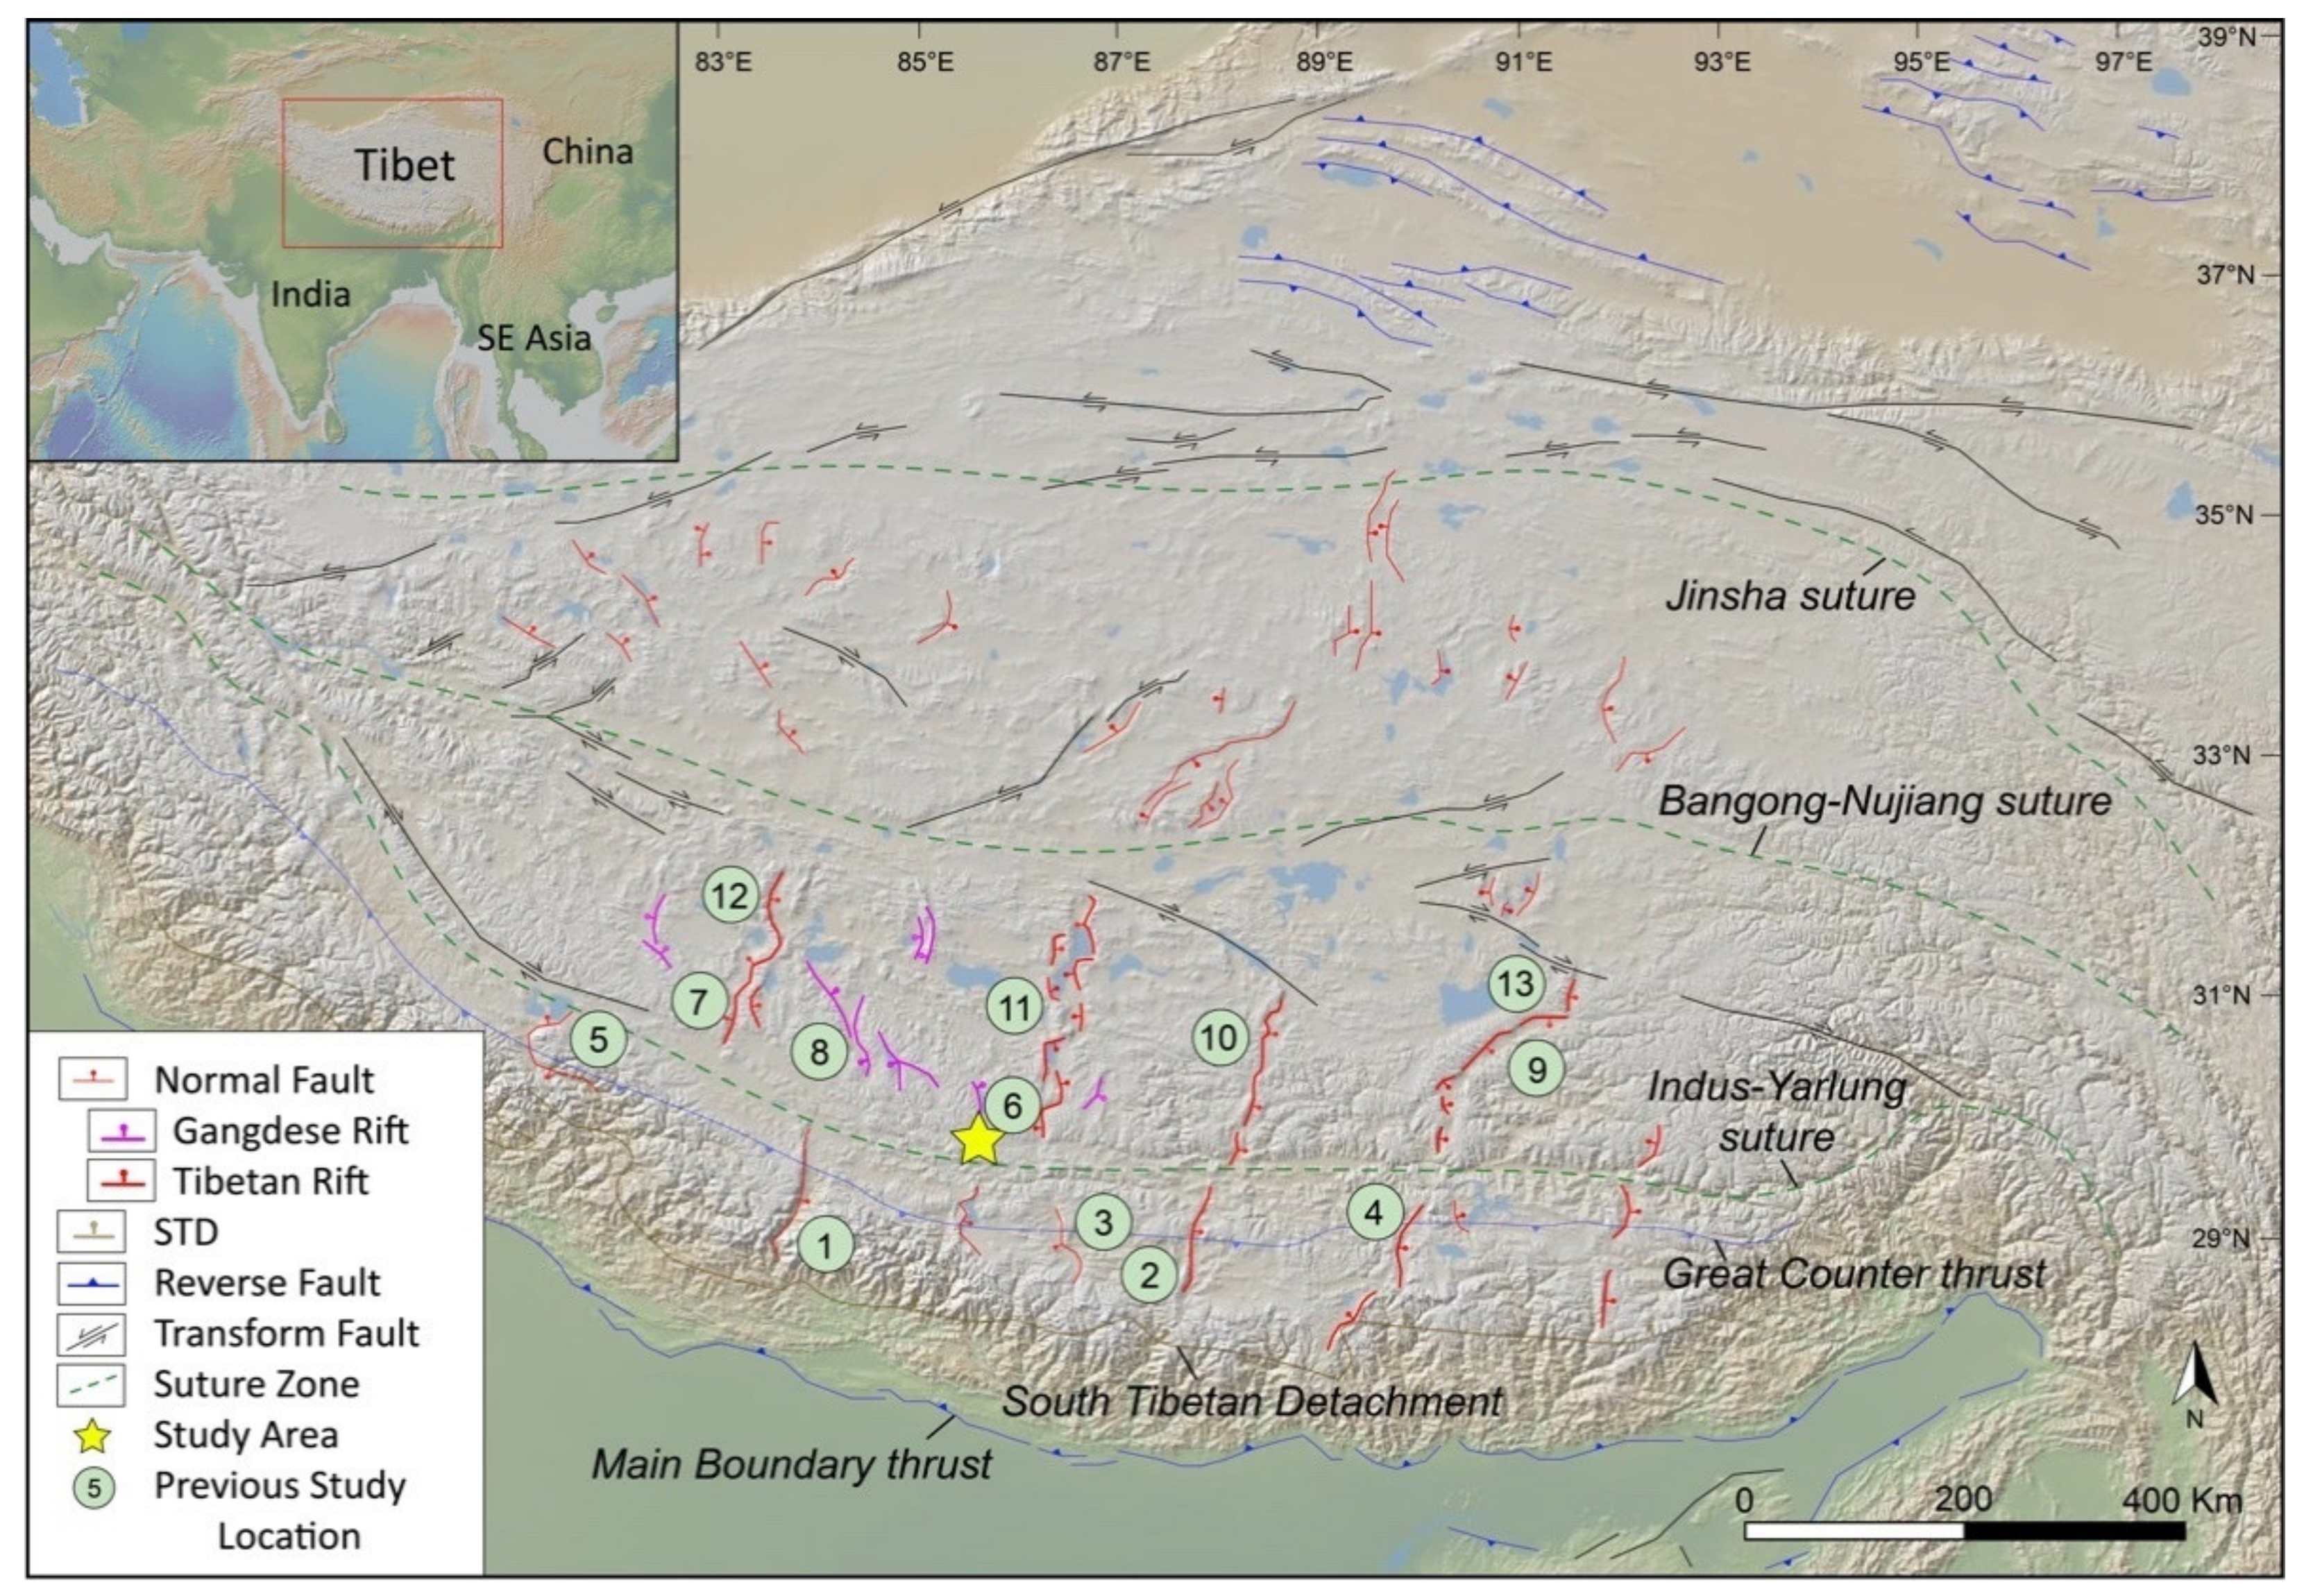
2. Geologic Setting
2.1. Rock Units
2.2. Fault Systems
2.2.1. The Great Counter Thrust
2.2.2. Gangdese Rifts
3. Methods
3.1. Field Methods and Sample Preperation
3.2. Zircon U-Pb Geochronology
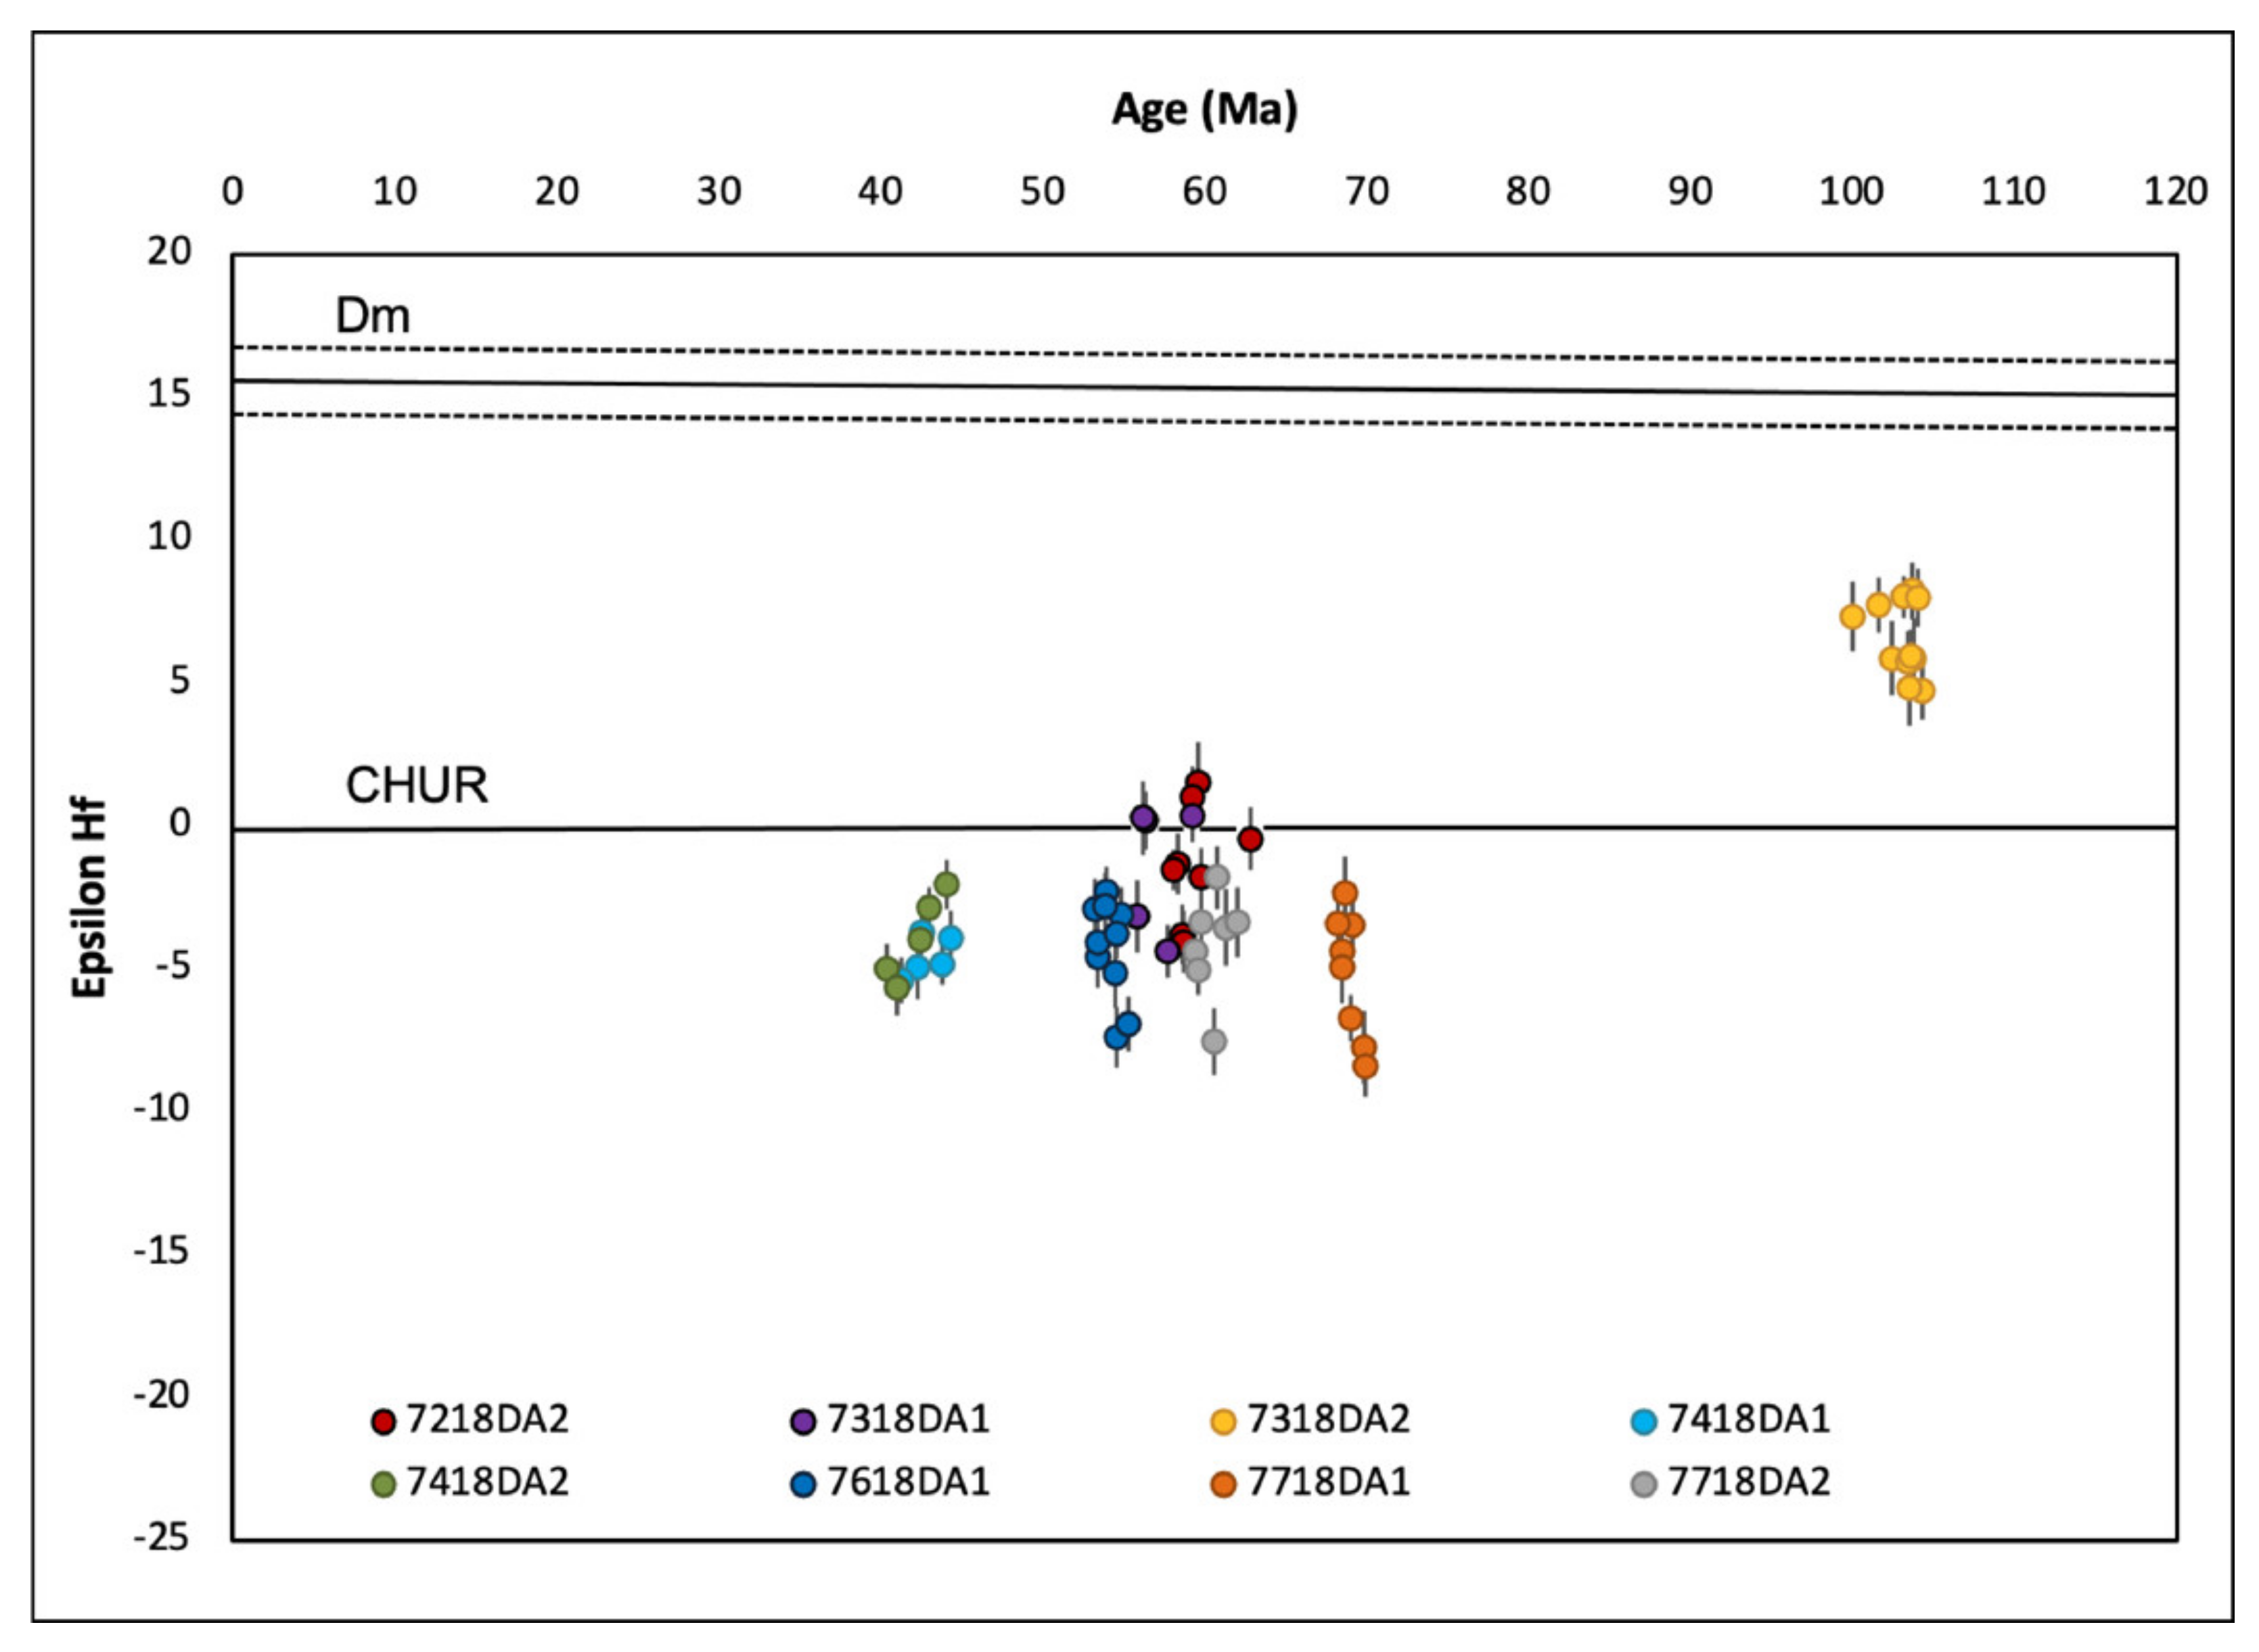
3.3. Lu-Hf Isotope Geochemistry
3.4. Zircon Trace/Rare Earth Element Geochemistry
3.5. Zircon-He Thermochronology
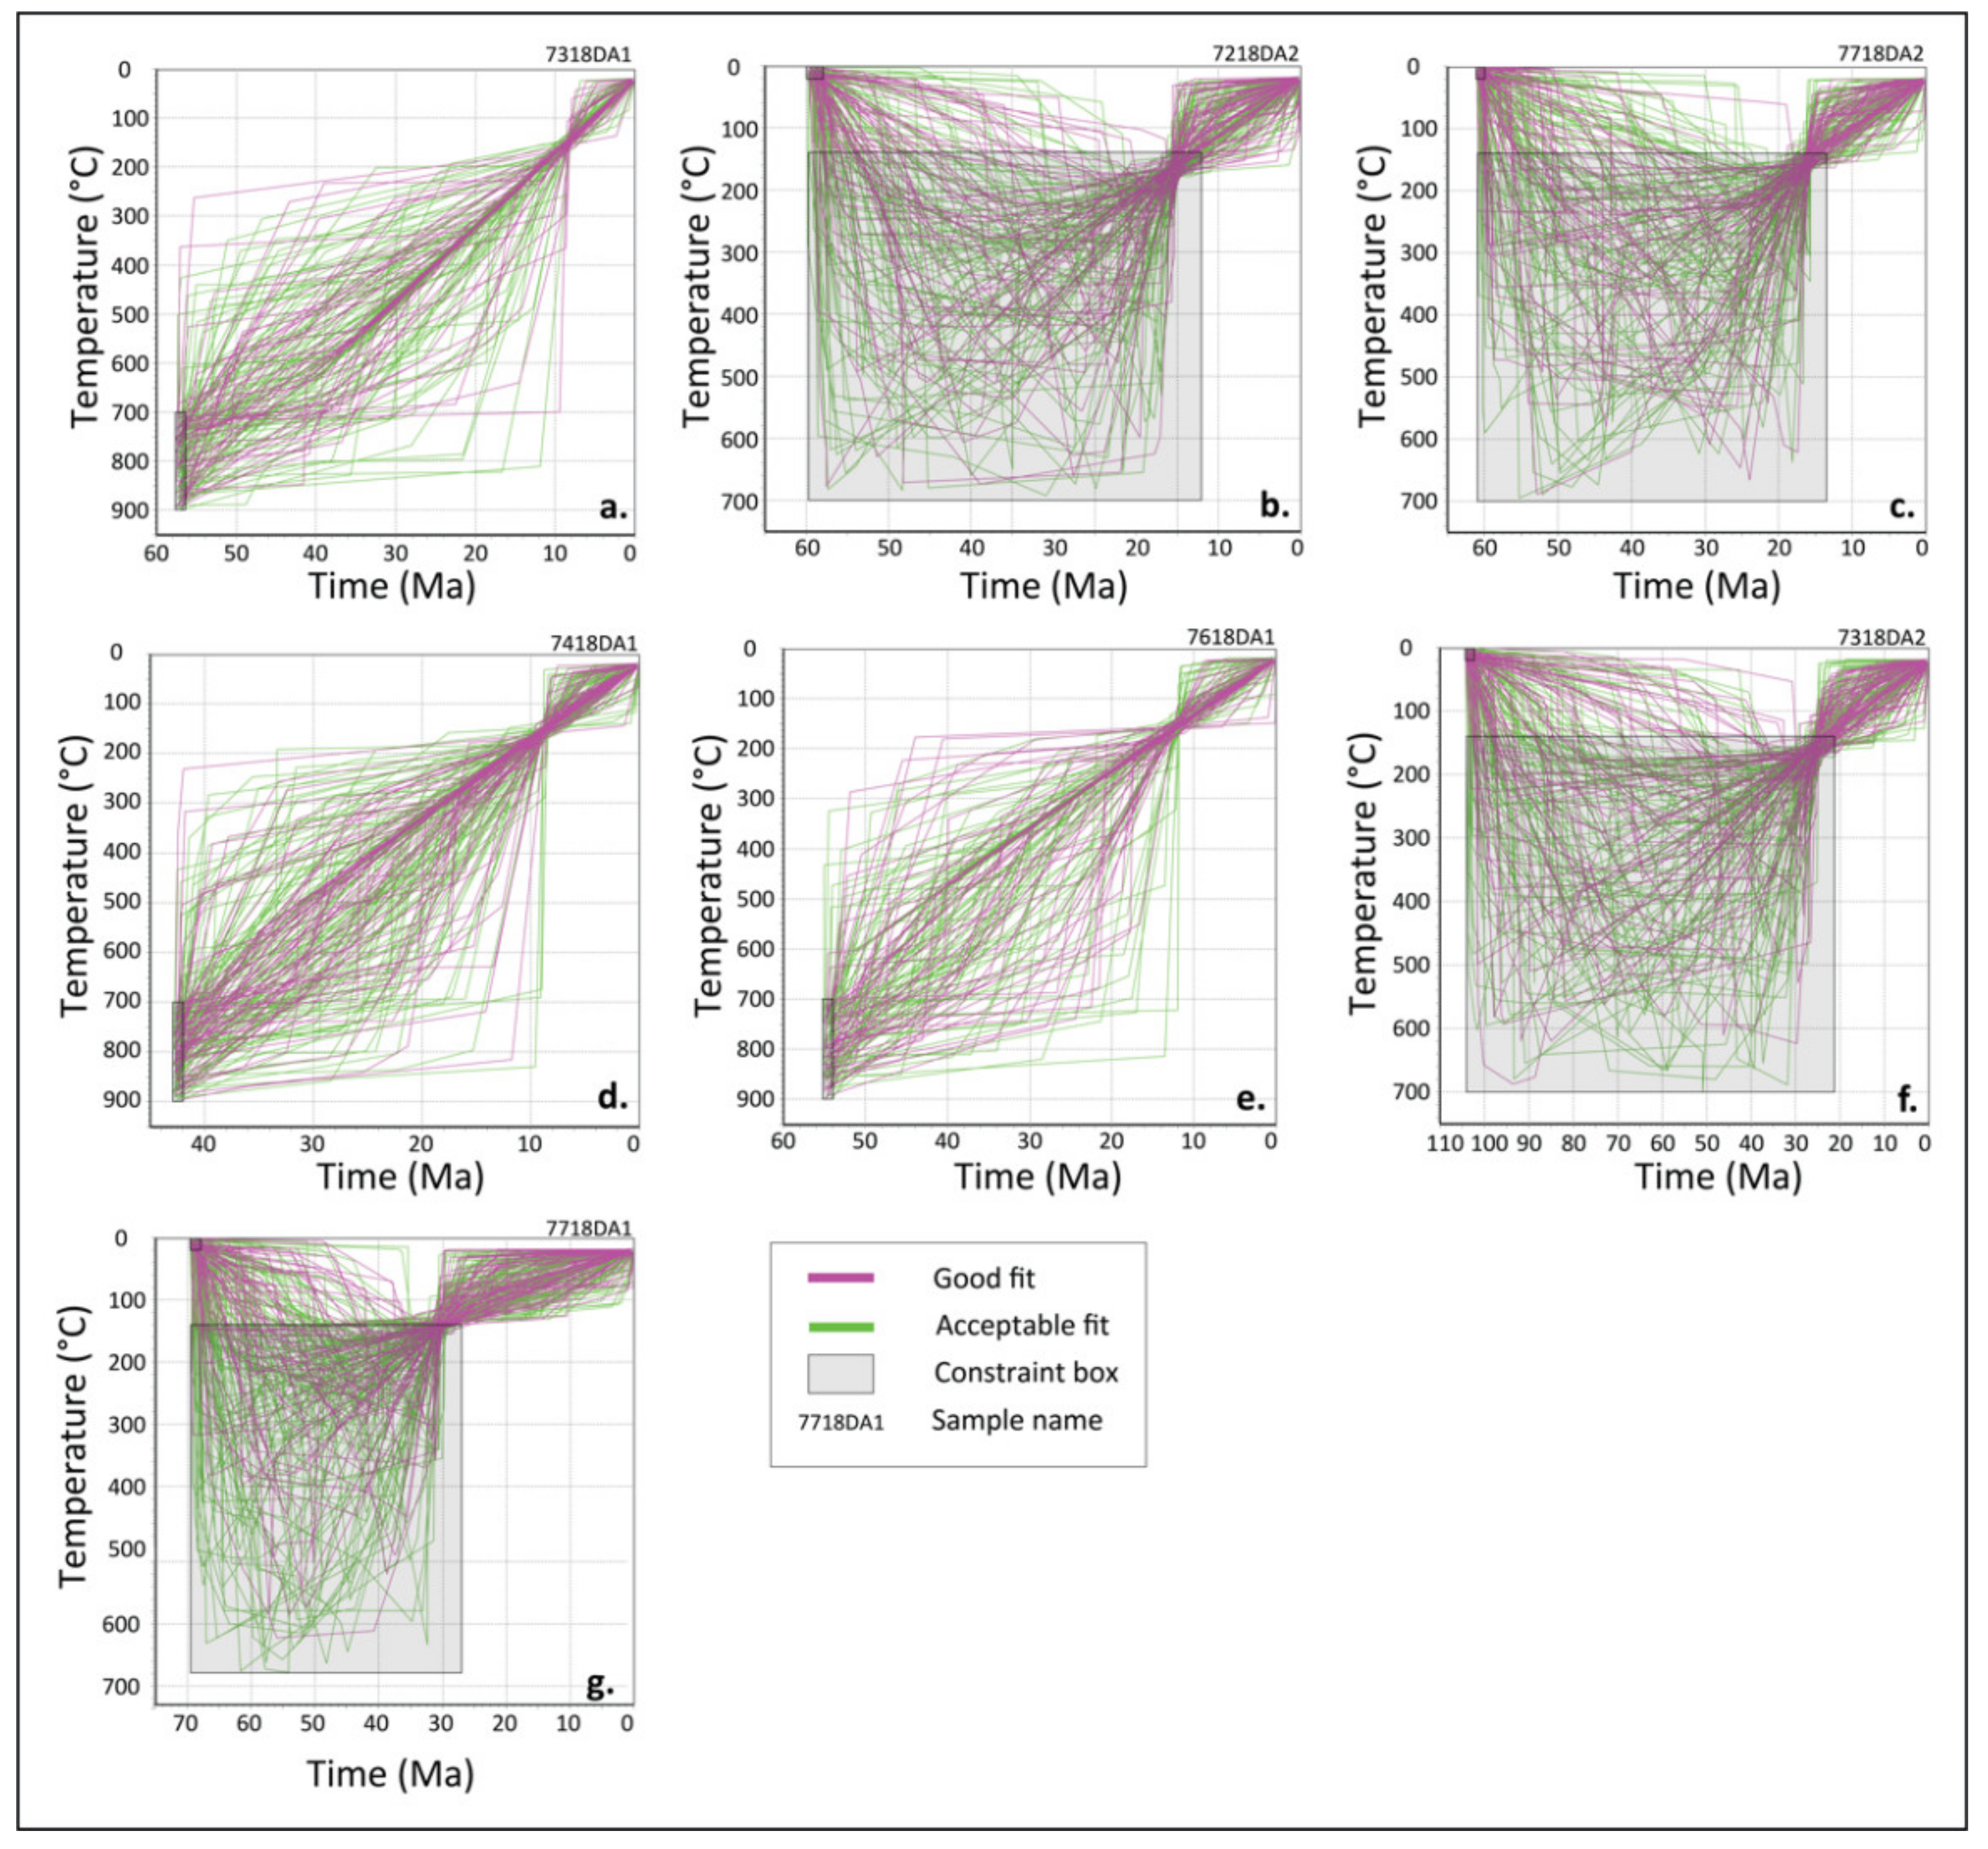
3.6. HeFTy Thermal Modeling
- Zircons extracted from extrusive samples were erupted at surface temperatures between 0 and 20 °C at the time of crystallization measured by U-Pb geochronology.
- Zircons extracted from intrusive samples were exposed to temperatures between 700 °C and 900 °C at the time of crystallization measured by U-Pb geochronology.
- ZHe cooling ages require burial of extrusive samples to at least 140–200 °C (within the ZHe partial retention zone) [86] following crystallization.
- Samples were collected at surface temperatures between 0 °C and 20 °C at 0 Ma.
3.7. Crustal Thickness Calculations
3.8. Compilation of Geochemical Data for South-Central Tibet
4. Results
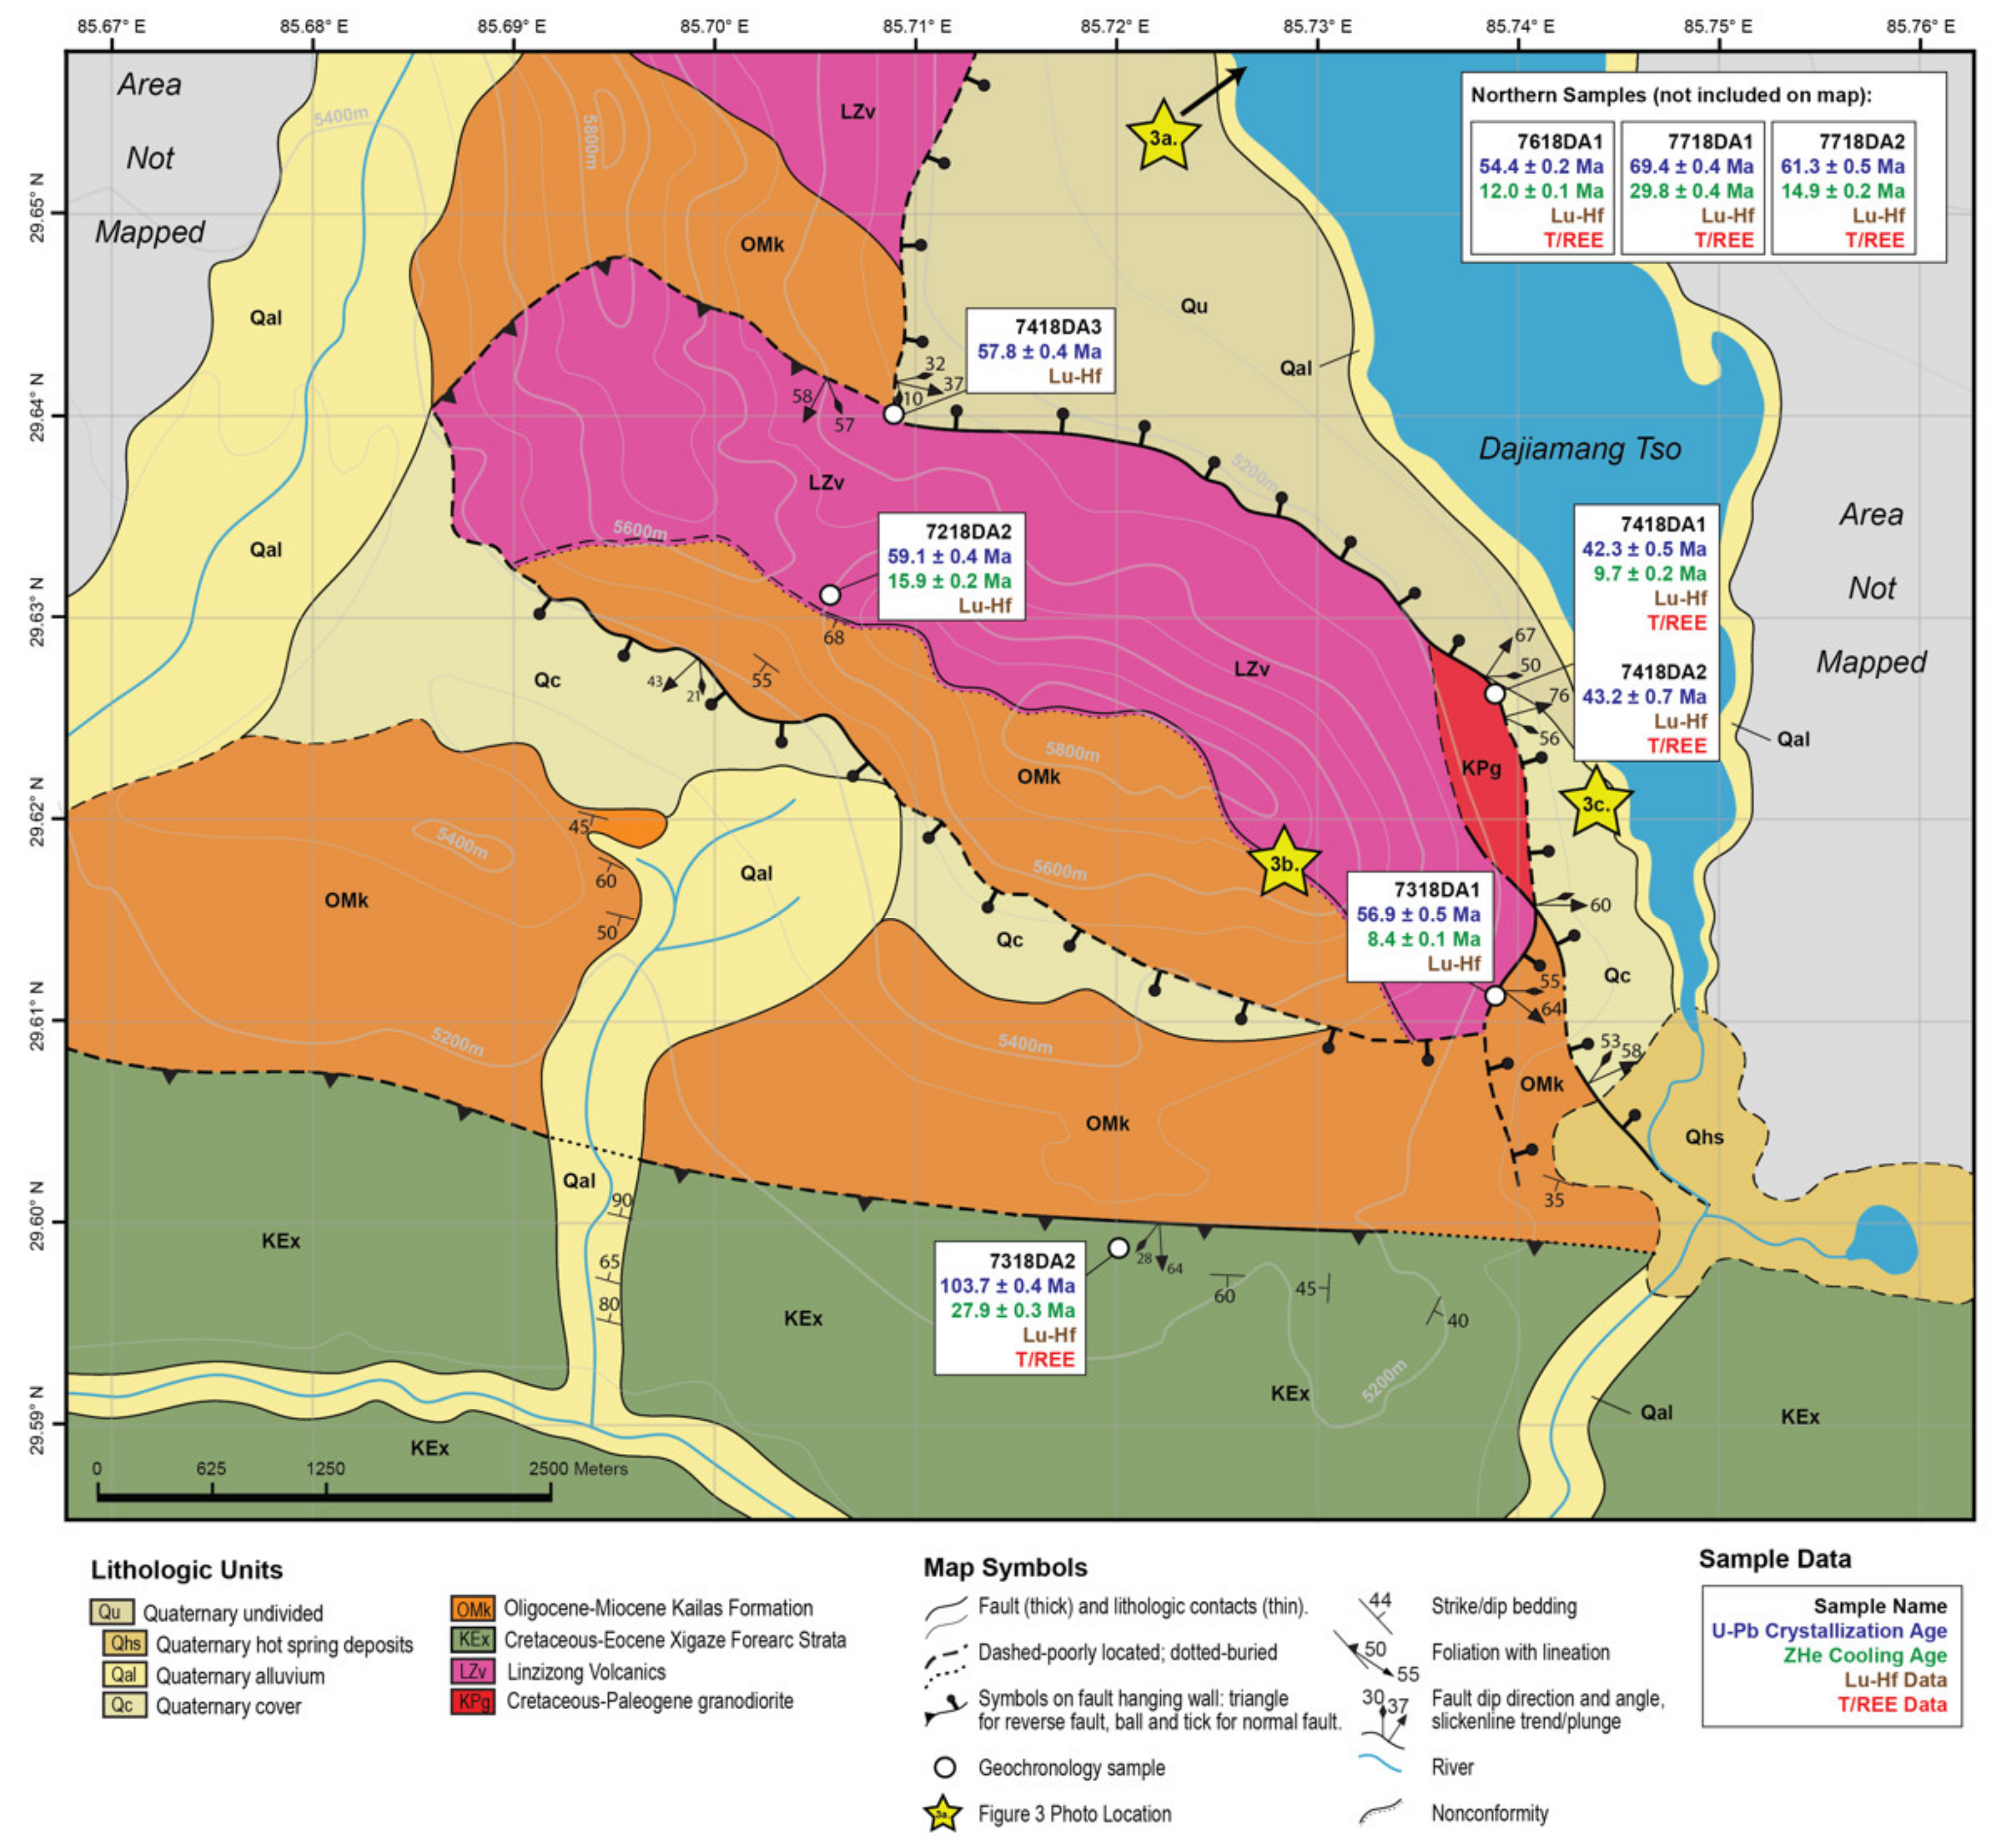
4.1. Geologic Mapping Results
4.1.1. Rock Units and Correlations
4.1.2. Fault Systems
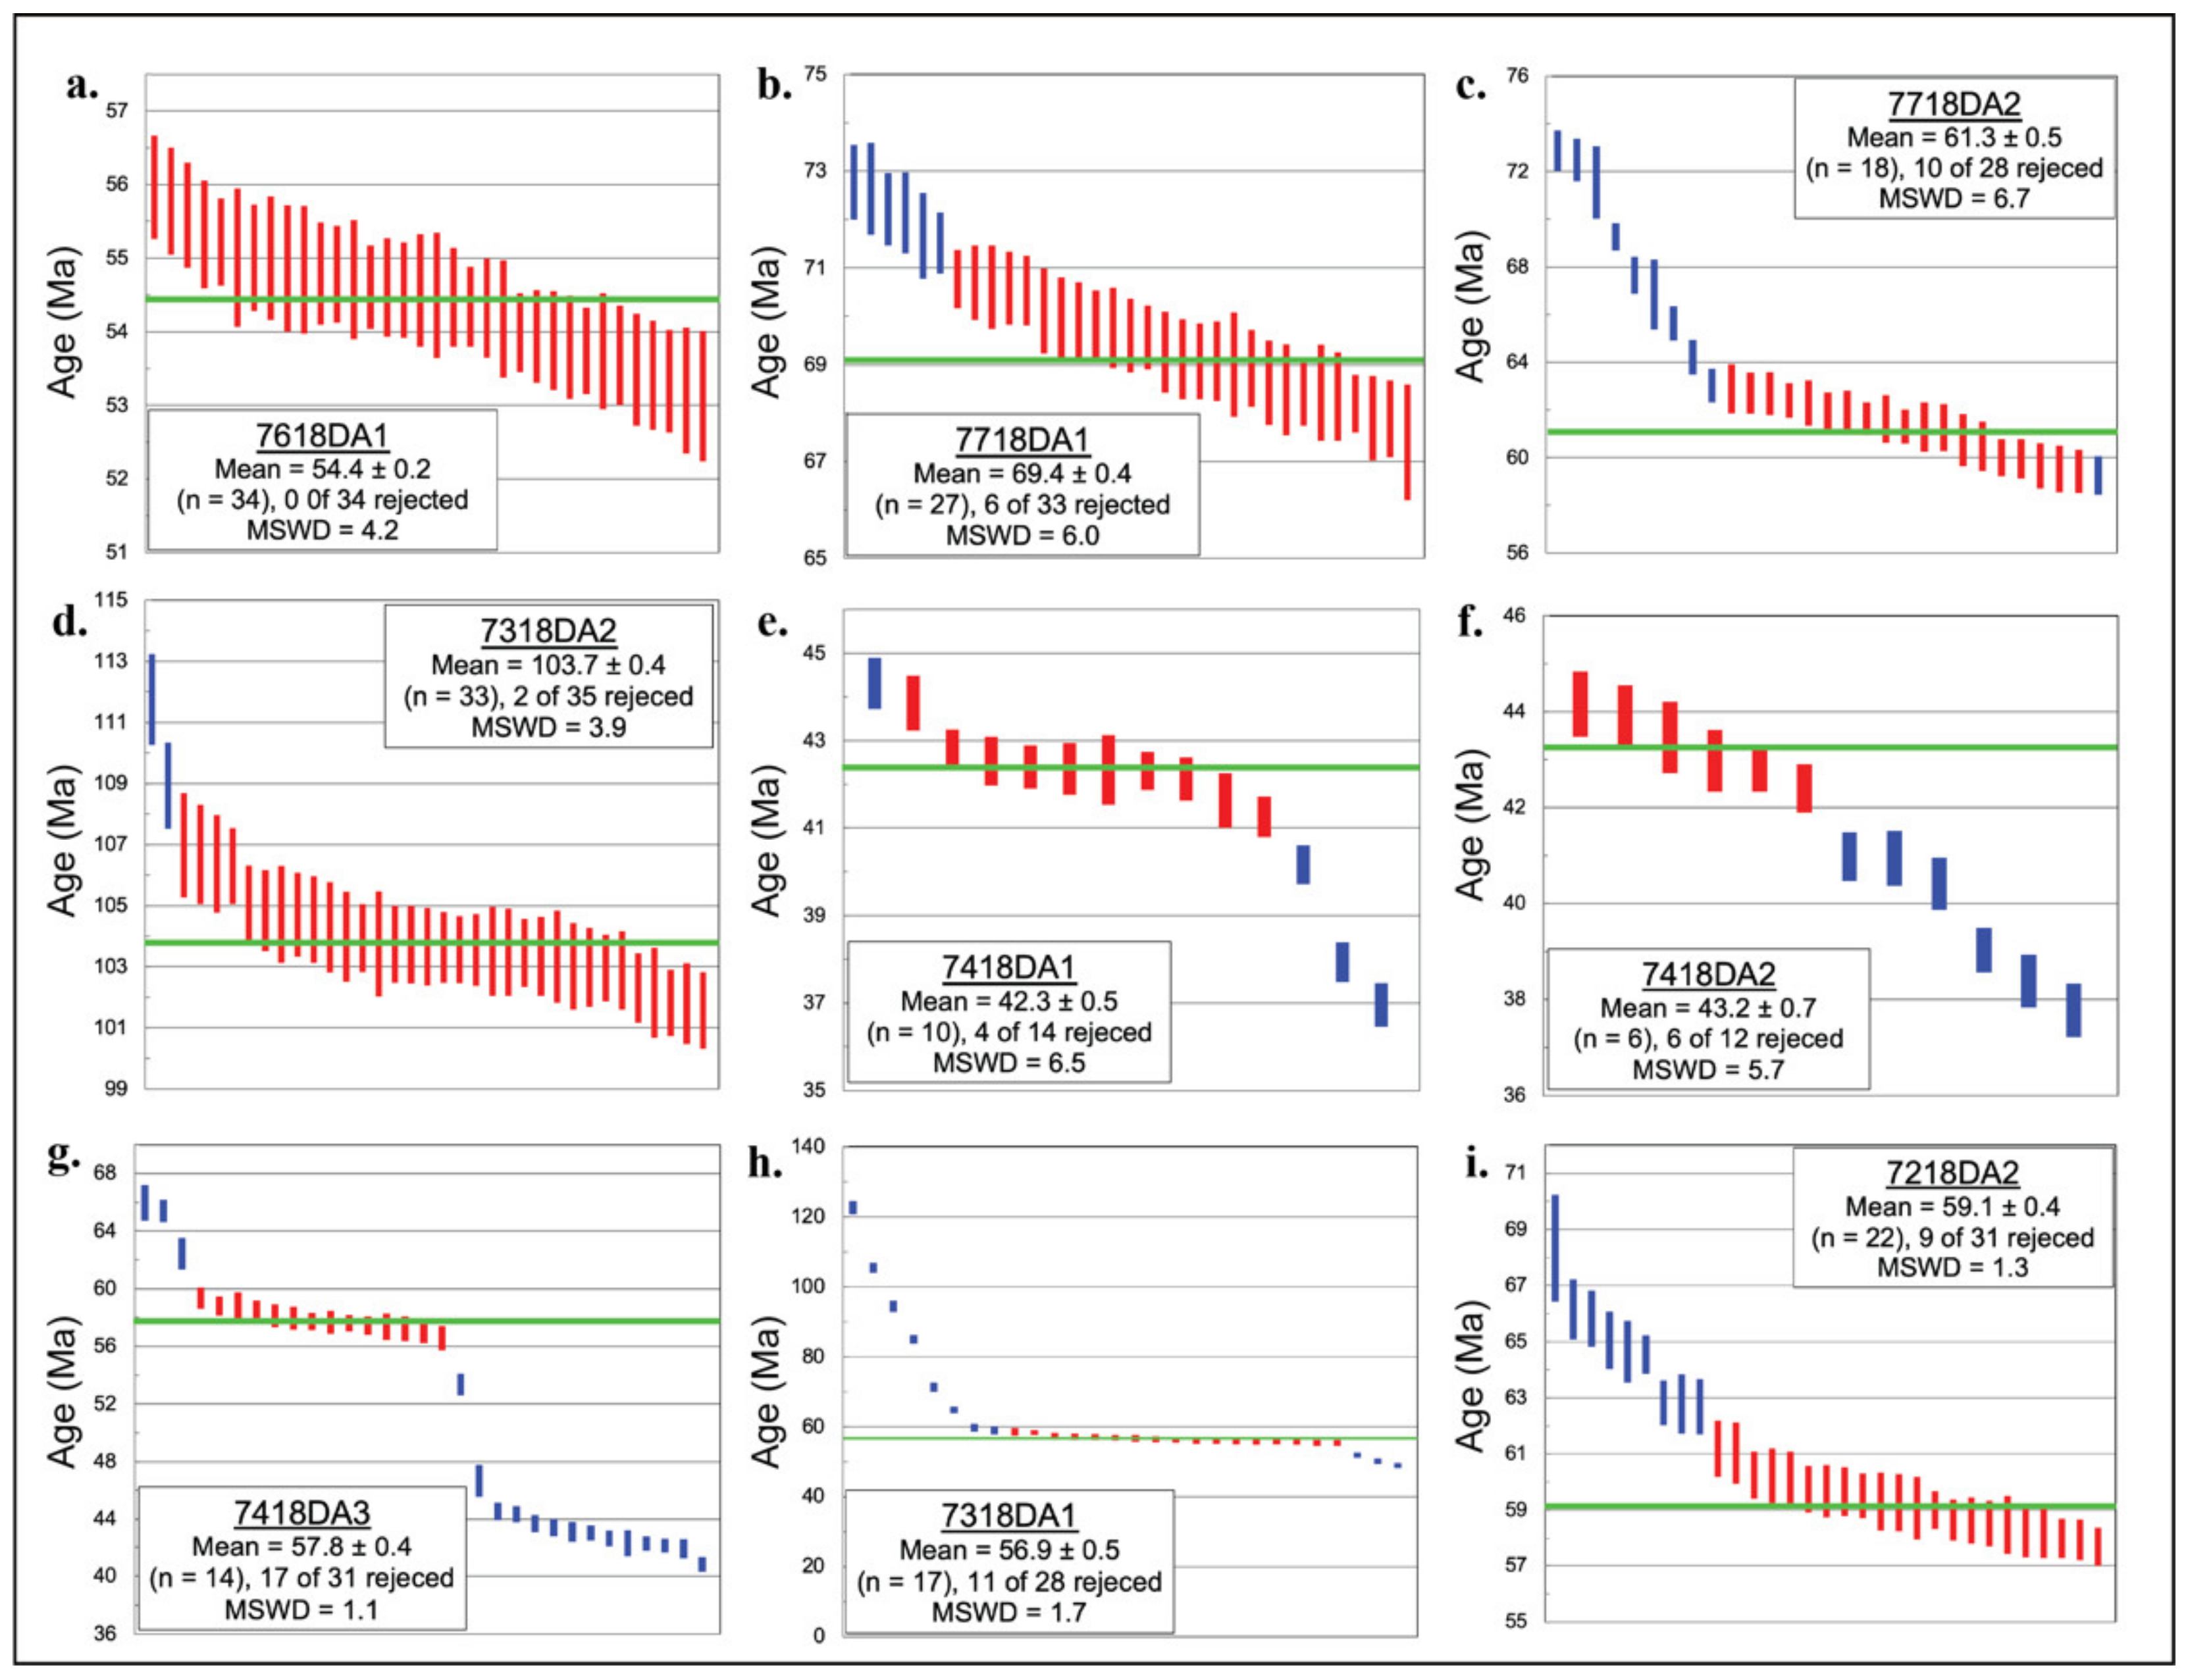
4.2. U-Pb Geochronology, Lu-Hf Geochemistry, and T/REE Geochemistry Results
- Volcanic and volcaniclastic rocks of the Linzizong Formation.
- Gangdese batholith granodiorites and associated dikes and fault rocks.
- Xigaze Group forearc rocks.
4.2.1. Group 1: Linzizong Formation Volcanic Rocks
4.2.2. Group 2: Gangdese Batholith Granodiorites and Associated Dikes and Fault Rocks
4.2.3. Group 3: Xigaze Group Forearc Rocks
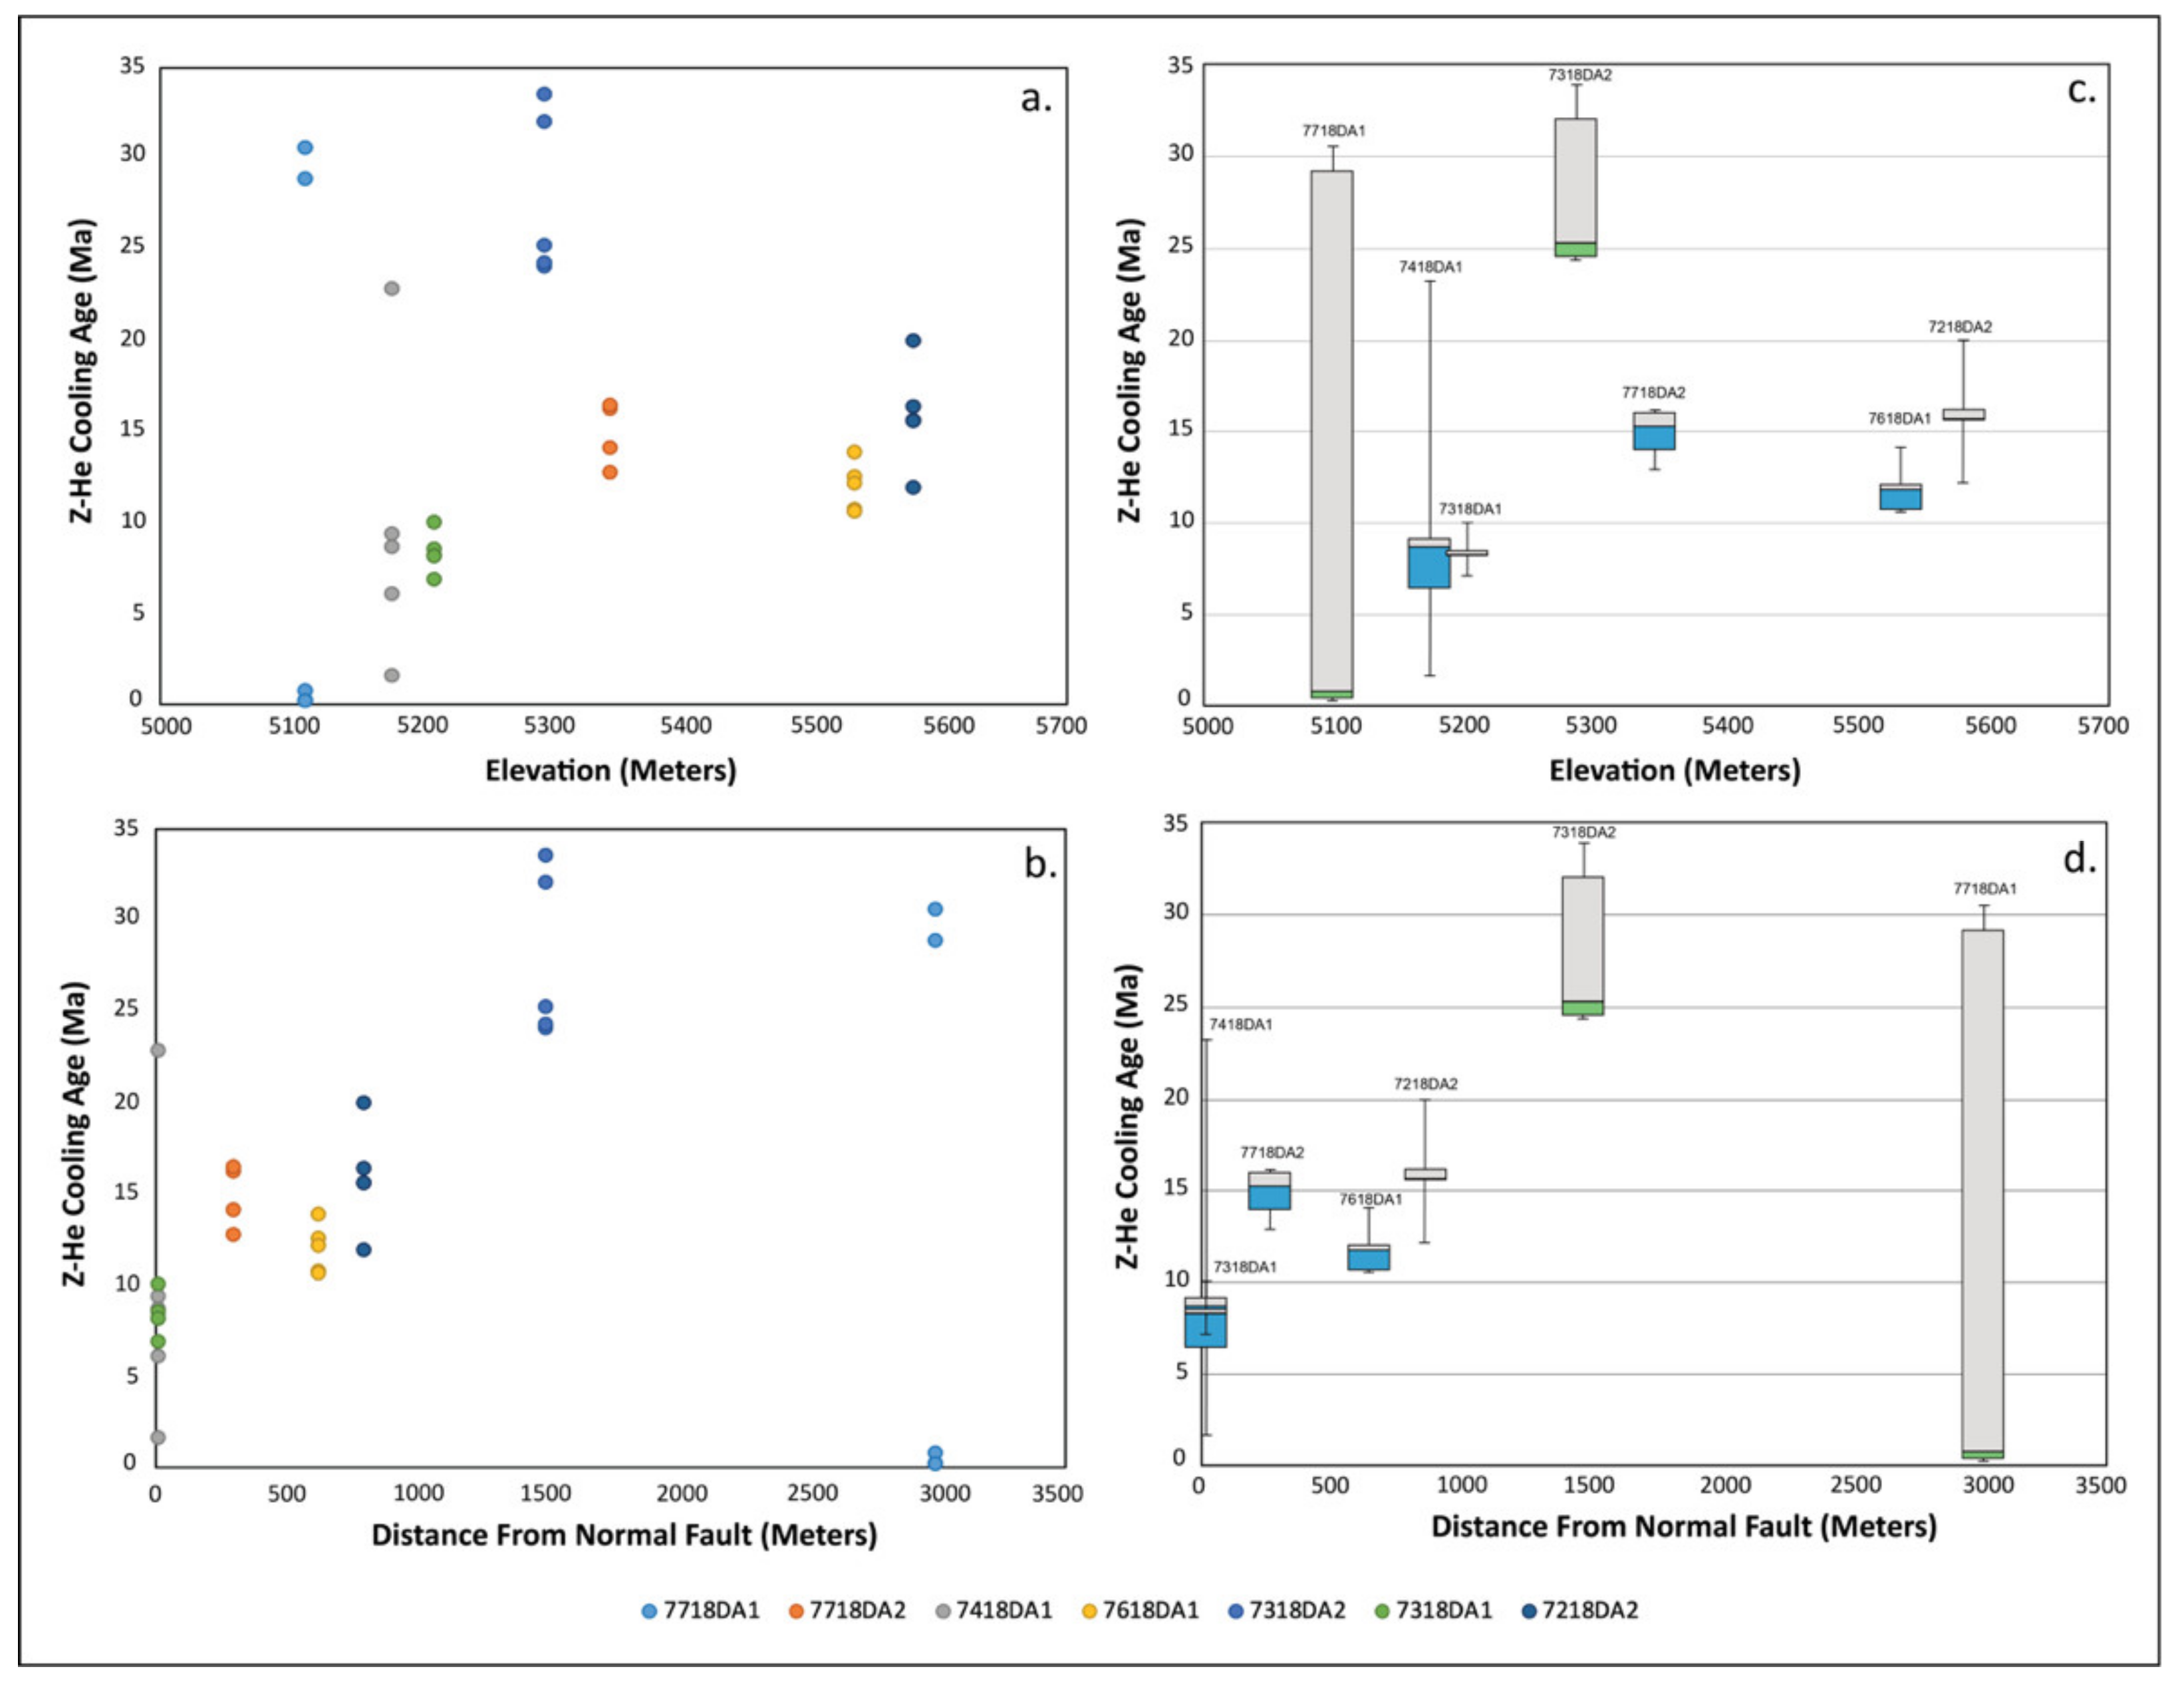
4.3. ZHe Thermochronology and HeFTy Thermal Modeling Results
4.3.1. Group A: Dajiamang Tso Footwall Rocks
4.3.2. Group A: Local Hanging Wall Rocks
5. Discussion
5.1. Tectonic Integration
5.1.1. Neo-Tethyan Subduction along the Southern Margin of the Lhasa Terrain
5.1.2. Post-Collisional Deformation along the Gangdese Thrust and Great Counter Thrust
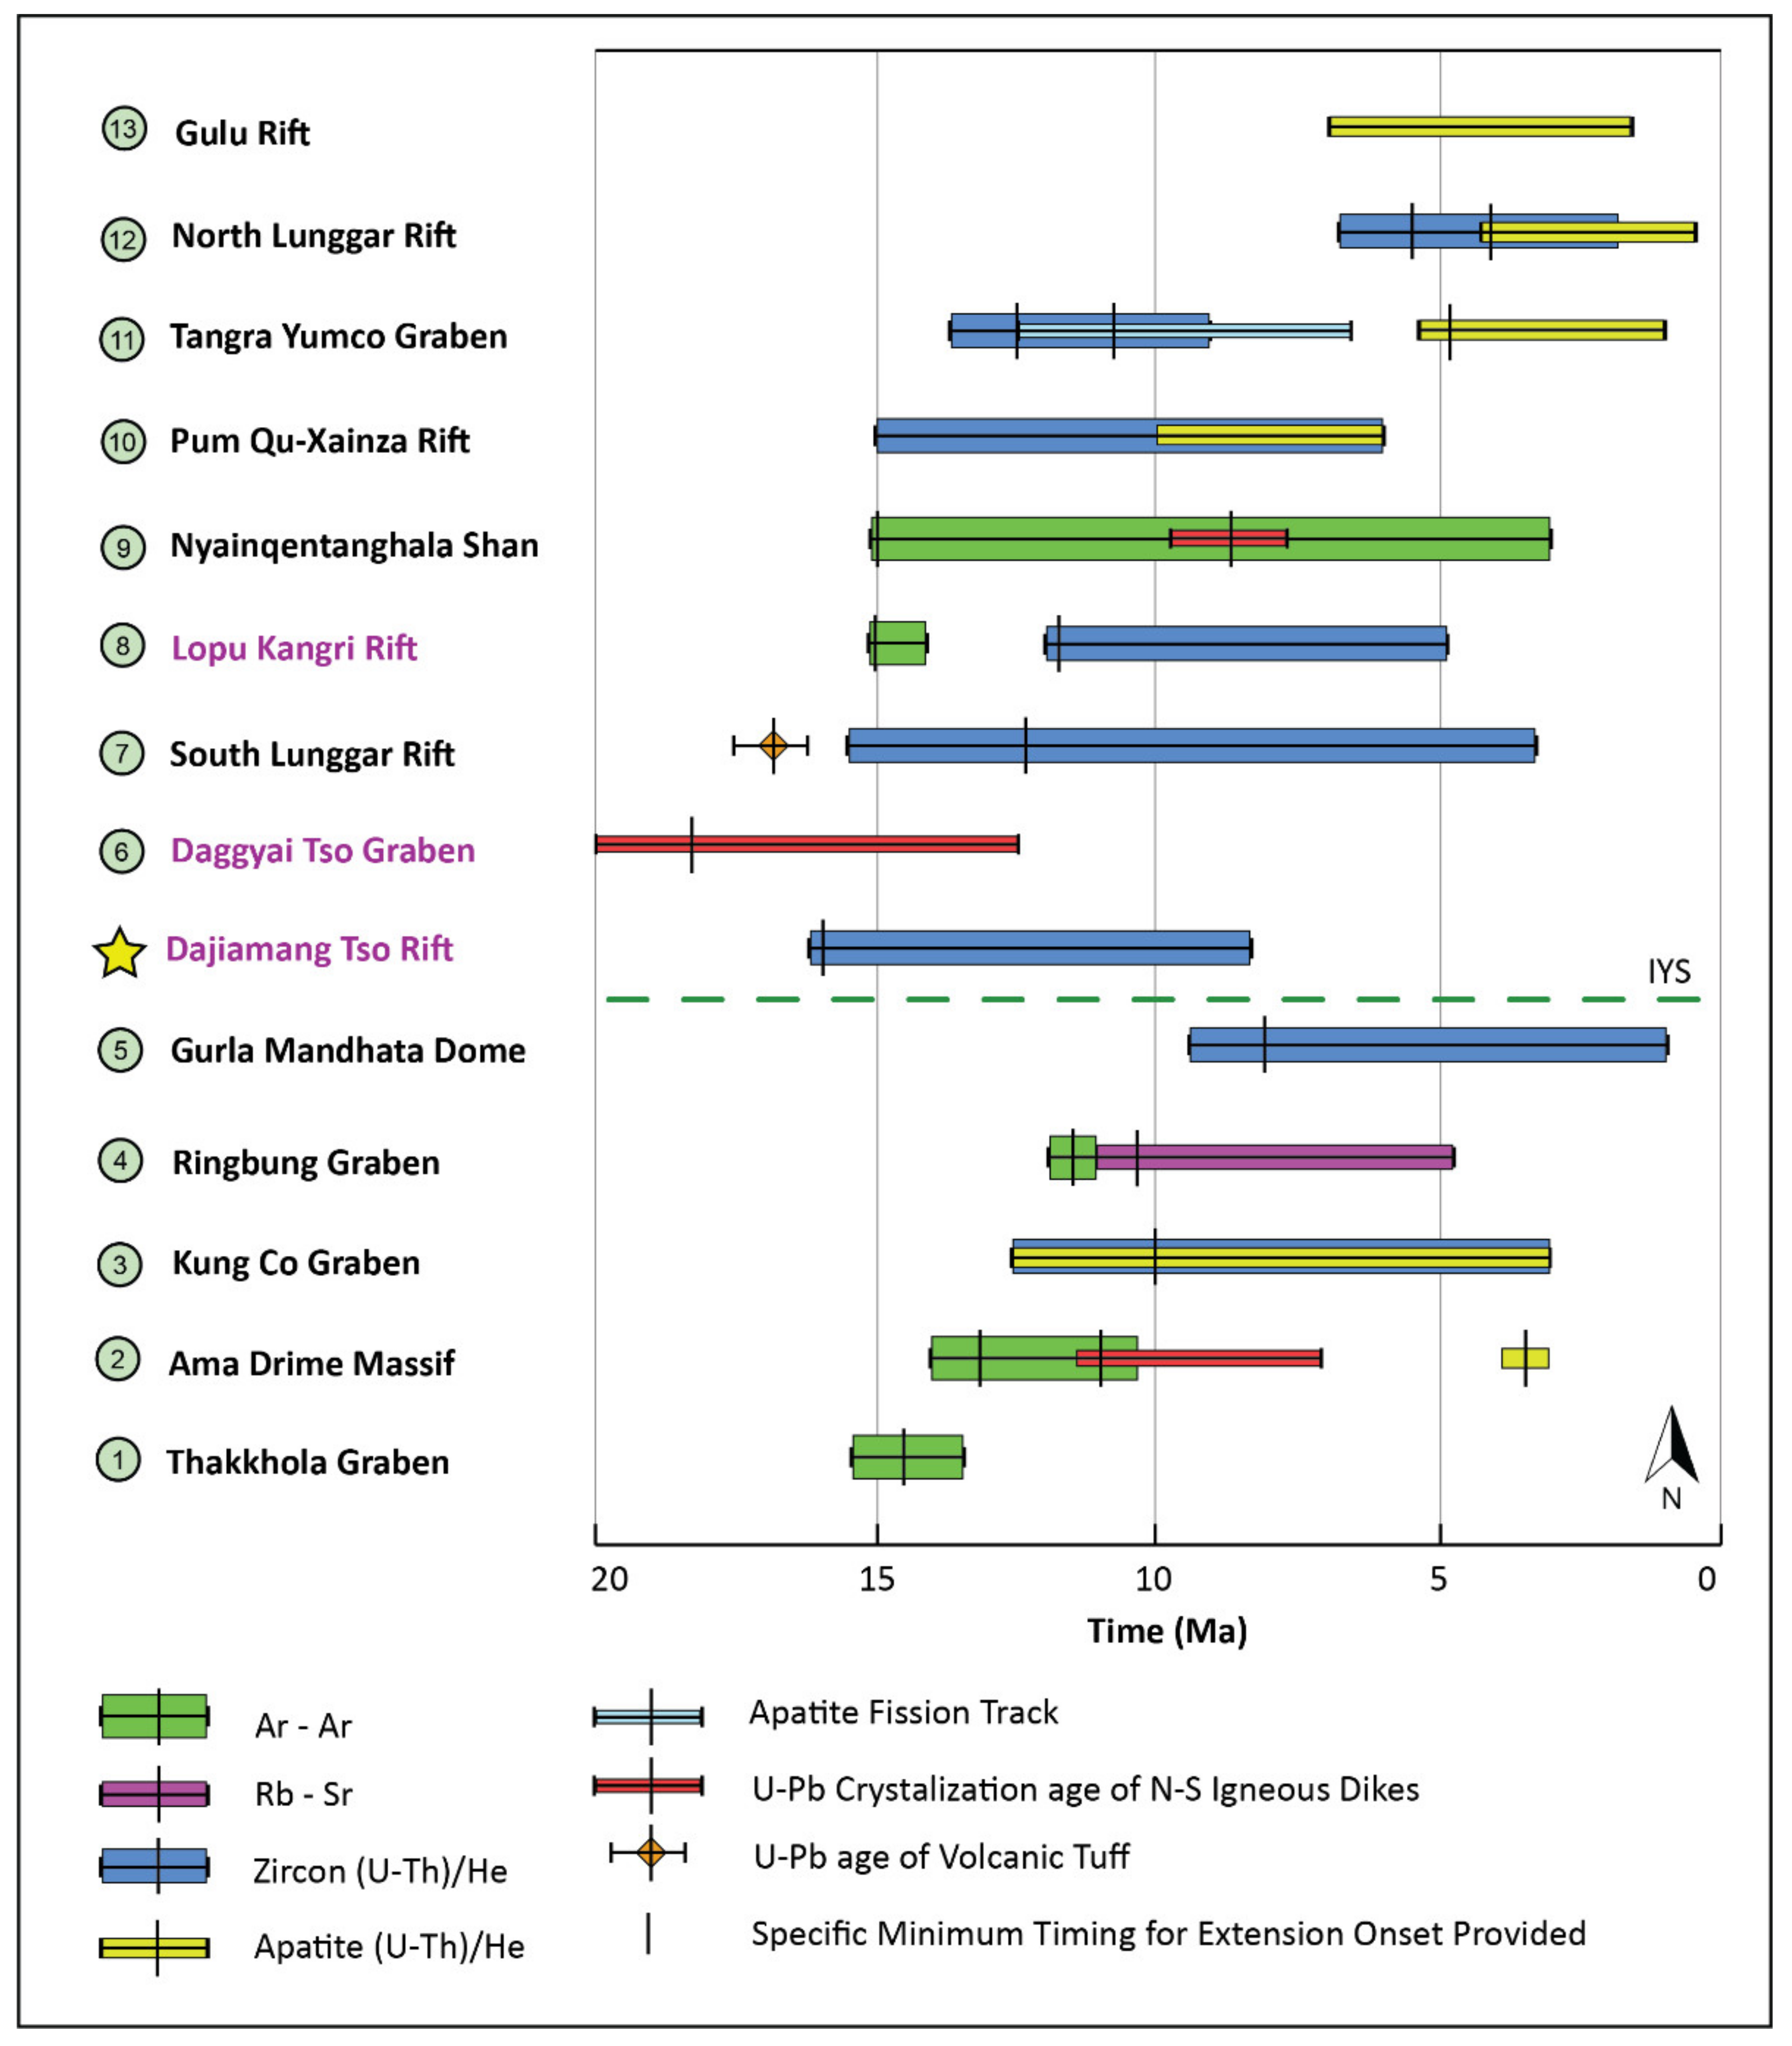
5.2. Constraints on the Timing of Extension along North-Striking Rifts
5.2.1. Gangdese Rifts
5.2.2. Tibetan Rifts
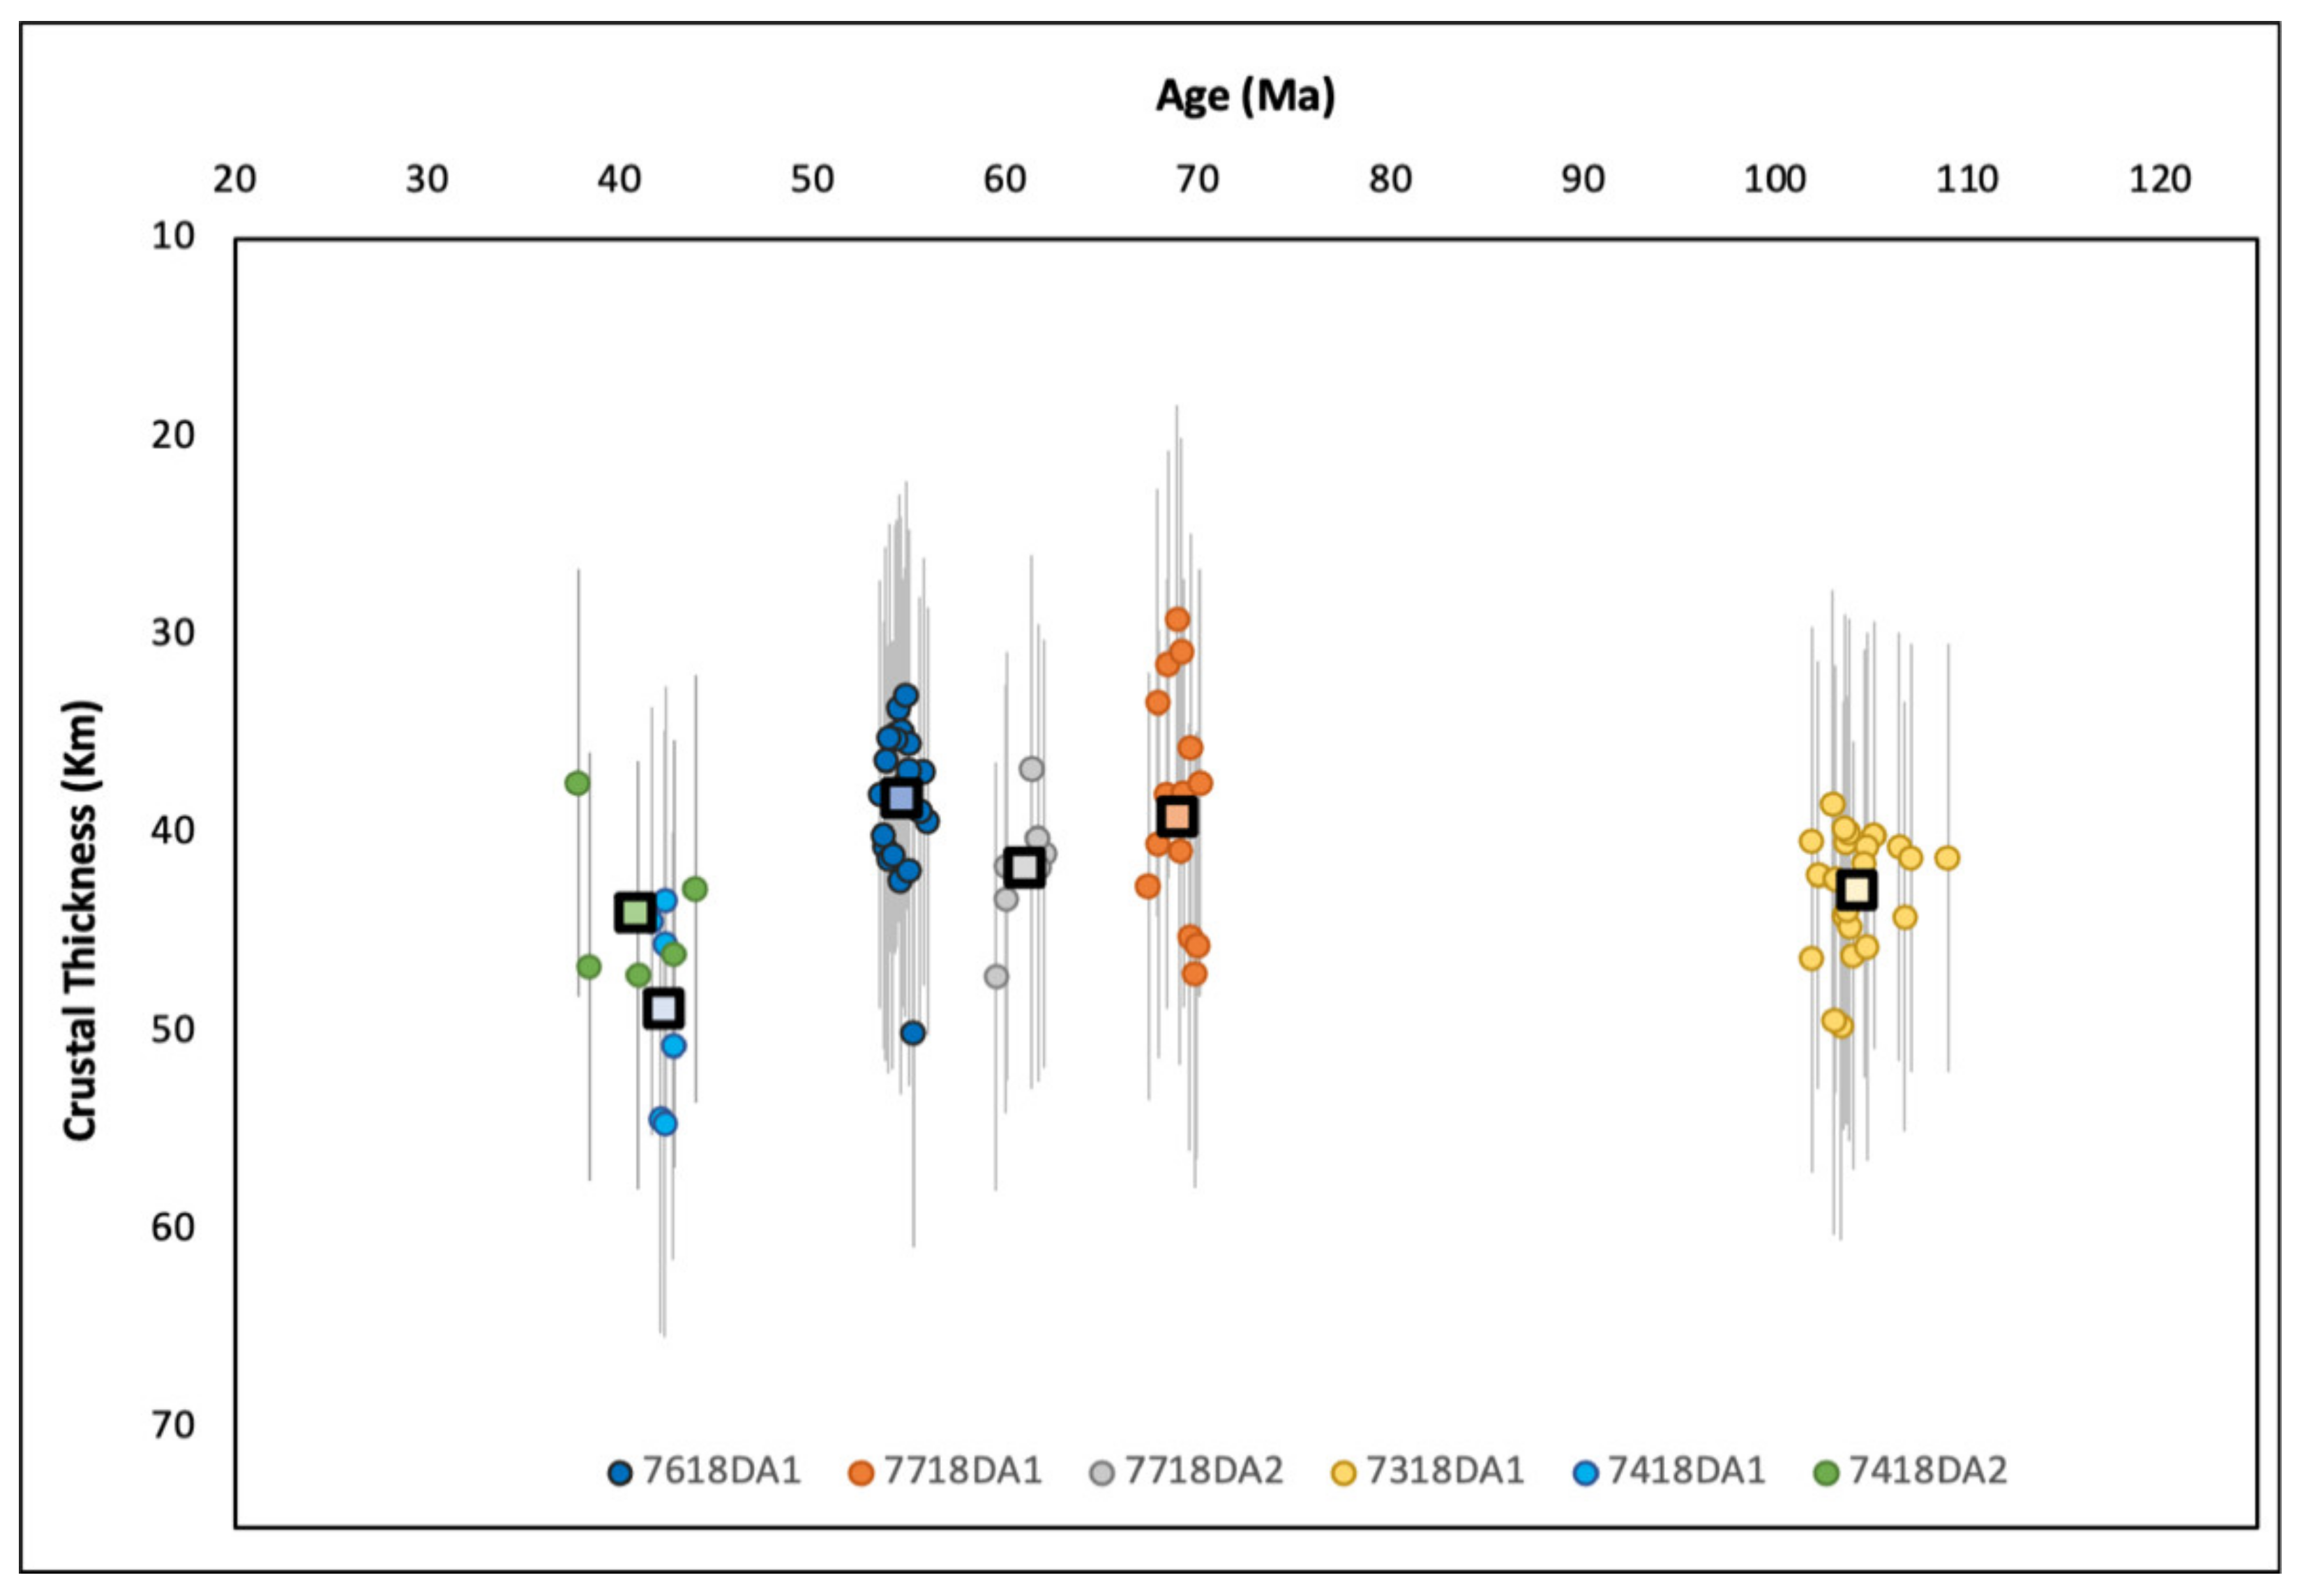
5.3. Crustal Evolution (Lu-Hf) and Crustal Thickness Trends (T/REE)
5.4. Tectonic Implications
6. Conclusions
Supplementary Materials
Author Contributions
Funding
Data Availability Statement
Acknowledgments
Conflicts of Interest
References
- Armijo, R.; Tapponnier, P.; Mercier, J.; Han, T.L. Quaternary extension in southern Tibet: Field observations and tectonic implications. J. Geophys. Res. Solid Earth 1986, 91, 13803–13872. [Google Scholar] [CrossRef]
- Zhao, W.; Mechie, J.; Brown, L.; Guo, J.; Haines, S.; Hearn, T.; Nelson, K. Crustal structure of central Tibet as derived from project INDEPTH wide-angle seismic data. Geophys. J. Int. 2001, 145, 486–498. [Google Scholar] [CrossRef]
- Kind, R.; Yuan, X.; Saul, J.; Nelson, D.; Sobolev, S.; Mechie, J.; Achauer, U. Seismic images of crust and upper mantle beneath Tibet: Evidence for Eurasian plate subduction. Science 2002, 298, 1219–1221. [Google Scholar] [CrossRef] [PubMed]
- Xu, Q.; Zhao, J.; Yuan, X.; Liu, H.; Pei, S. Mapping crustal structure beneath southern Tibet: Seismic evidence for continental crustal underthrusting. Gondwana Res. 2015, 27, 1487–1493. [Google Scholar] [CrossRef]
- Allegre, C.O.; Courtillot, V.; Tapponnier, P.; Hirn, A.; Mattauer, M.; Coulon, C.; Marcoux, J. Structure and evolution of the Himalaya–Tibet orogenic belt. Nature 1984, 307, 17. [Google Scholar]
- Yin, A. Mode of Cenozoic east-west extension in Tibet suggesting a common origin of rifts in Asia during the Indo-Asian collision. J. Geophys. Res. Solid Earth 2000, 105, 21745–21759. [Google Scholar] [CrossRef]
- Kapp, P.; DeCelles, P.G. Mesozoic–Cenozoic geological evolution of the Himalayan-Tibetan orogen and working tectonic hypotheses. Am. J. Sci. 2019, 319, 159–254. [Google Scholar] [CrossRef]
- Zuza, A.V.; Gavillot, Y.; Haproff, P.J.; Wu, C. Kinematic evolution of a continental collision: Constraining the Himalayan-Tibetan orogen via bulk strain rates. Tectonophysics 2020, 797, 228642. [Google Scholar] [CrossRef]
- Armijo, R.; Tapponnier, P.; Han, T. Late Cenozoic right-lateral strike-slip faulting in southern Tibet. J. Geophys. Res. Solid Earth 1989, 94, 2787–2838. [Google Scholar] [CrossRef]
- Taylor, M.; Yin, A.; Ryerson, F.J.; Kapp, P.; Ding, L. Conjugate strike-slip faulting along the Bangong-Nujiang suture zone accommodates coeval east-west extension and north-south shortening in the interior of the Tibetan Plateau. Tectonics 2003, 22. [Google Scholar] [CrossRef]
- Yin, A.; Taylor, M.H. Mechanics of V-shaped conjugate strike-slip faults and the corresponding continuum mode of continental deformation. Bulletin 2011, 123, 1798–1821. [Google Scholar] [CrossRef]
- Brown, L.; Zhao, W.; Nelson, K.; Hauck, M.; Alsdorf, D.; Ross, A.; Che, J. Bright spots, structure, and magmatism in southern Tibet from INDEPTH seismic reflection profiling. Science 1996, 274, 1688–1690. [Google Scholar] [CrossRef]
- Alsdorf, D.; Brown, L.; Nelson, K.D.; Makovsky, Y.; Klemperer, S.; Zhao, W. Crustal deformation of the Lhasa terrane, Tibet plateau from Project INDEPTH deep seismic reflection profiles. Tectonics 1998, 17, 501–519. [Google Scholar] [CrossRef]
- Zhao, W.; Brown, L.; Wu, Z.; Klemperer, S.; Shi, D.; Mechie, J.; Makovsky, Y. Seismology across the northeastern edge of the Tibetan Plateau. Eos Trans. Am. Geophys. Union 2008, 89, 487. [Google Scholar] [CrossRef]
- Karplus, M.; Zhao, W.; Klemperer, S.; Wu, Z.; Mechie, J.; Shi, D.; Chen, C. Injection of Tibetan crust beneath the south Qaidam Basin: Evidence from INDEPTH IV wide-angle seismic data. J. Geophys. Res. Solid Earth 2011, 116. [Google Scholar] [CrossRef]
- Mechie, J.; Zhao, W.; Karplus, M.; Wu, Z.; Meissner, R.; Shi, D.; Xue, G. Crustal shear (S) velocity and Poisson’s ratio structure along the INDEPTH IV profile in northeast Tibet as derived from wide-angle seismic data. Geophys. J. Int. 2012, 191, 369–384. [Google Scholar] [CrossRef]
- Mechie, J.; Kind, R.A. A model of the crust and mantle structure down to 700 km depth beneath the Lhasa to Golmud transect across the Tibetan plateau as derived from seismological data. Tectonophysics 2013, 606, 187–197. [Google Scholar] [CrossRef]
- Nábělek, J.; Hetényi, G.; Vergne, J.; Sapkota, S.; Kafle, B.; Jiang, M.; Huang, B.-S.; Su, H.; Chen, J.; The Hi-CLIMB Team. Underplating in the Himalaya-Tibet collision zone revealed by the Hi-CLIMB experiment. Science 2009, 325, 1371–1374. [Google Scholar]
- Chapman, J.B.; Ducea, M.N.; DeCelles, P.G.; Profeta, L. Tracking changes in crustal thickness during orogenic evolution with Sr/Y: An example from the North American Cordillera. Geology 2015, 43, 919–922. [Google Scholar]
- Chiaradia, M. Crustal thickness control on Sr/Y signatures of recent arc magmas: An Earth scale perspective. Sci. Rep. 2015, 5, 8115. [Google Scholar] [CrossRef]
- Profeta, L.; Ducea, M.N.; Chapman, J.B.; Paterson, S.R.; Gonzales, S.M.H.; Kirsch, M.; DeCelles, P.G.; Petrescu, L. Quantifying crustal thickness over time in magmatic arcs. Sci. Rep. 2015, 5, 17786. [Google Scholar] [CrossRef]
- Chapman, J.B.; Gehrels, G.E.; Ducea, M.N.; Giesler, N.; Pullen, A. A new method for estimating parent rock trace element concentrations from zircon. Chem. Geol. 2016, 439, 59–70. [Google Scholar] [CrossRef]
- Sundell, K.E.; Taylor, M.H.; Styron, R.H.; Stockli, D.F.; Kapp, P.; Hager, C.; Ding, L.; Liu, D. Evidence for constriction and Pliocene acceleration of east-west extension in the North Lunggar rift region of west central Tibet. Tectonics 2013, 32, 1454–1479. [Google Scholar] [CrossRef]
- Styron, R.H.; Taylor, M.H.; Sundell, K.E.; Stockli, D.F.; Oalmann, J.A.; Möller, A.; McCallister, A.T.; Ding, L.; Liu, D. Miocene initiation and acceleration of extension in the South Lunggar rift, western Tibet: Evolution of an active detachment system from structural mapping and (U-Th)/He thermochronology. Tectonics 2013, 32, 880–907. [Google Scholar] [CrossRef]
- Styron, R.; Taylor, M.; Sundell, K. Accelerated extension of Tibet linked to the northward underthrusting of Indian crust. Nat. Geosci. 2015, 8, 131. [Google Scholar] [CrossRef]
- Laskowski, A.K. Tectonic Evolution of the Yarlung Suture Zone, Lopu Range and Lazi Regions, Central Southern Tibet; The University of Arizona: Tucson, AZ, USA, 2016. [Google Scholar]
- Wolff, R.; Hetzel, R.; Dunkl, I.; Xu, Q.; Bröcker, M.; Anczkiewicz, A.A. High-Angle Normal Faulting at the Tangra Yumco Graben (Southern Tibet) since ∼ 15 Ma. J. Geol. 2019, 127, 15–36. [Google Scholar] [CrossRef]
- Molnar, P.; Tapponnier, P. Cenozoic tectonics of Asia: Effects of a continental collision. Science 1975, 189, 419–426. [Google Scholar] [CrossRef] [PubMed]
- Molnar, P.; Tapponnier, P. Active tectonics of Tibet. J. Geophys. Res. Solid Earth 1978, 83, 5361–5375. [Google Scholar] [CrossRef]
- Dewey, J. Extensional collapse of orogens. Tectonics 1988, 7, 1123–1139. [Google Scholar] [CrossRef]
- England, P.; Houseman, G. Extension during continental convergence, with application to the Tibetan Plateau. J. Geophys. Res. Solid Earth 1989, 94, 17561–17579. [Google Scholar] [CrossRef]
- Kapp, P.; Guynn, J.H. Indian punch rifts Tibet. Geology 2004, 32, 993–996. [Google Scholar] [CrossRef]
- Murphy, M.; Sanchez, V.; Taylor, M. Syncollisional extension along the India–Asia suture zone, south-central Tibet: Implications for crustal deformation of Tibet. Earth Planet. Sci. Lett. 2010, 290, 233–243. [Google Scholar] [CrossRef]
- Webb, A.A.G.; Guo, H.; Clift, P.D.; Husson, L.; Müller, T.; Costantino, D.; Yin, A.; Xu, Z.; Cao, H.; Wang, Q. The Himalaya in 3D: Slab dynamics controlled mountain building and monsoon intensification. Lithosphere 2017, 9, 637–651. [Google Scholar] [CrossRef]
- Taylor, M.; Yin, A. Active structures of the Himalayan-Tibetan orogen and their relationships to earthquake distribution, contemporary strain field, and Cenozoic volcanism. Geosphere 2009, 5, 199–214. [Google Scholar] [CrossRef]
- Coleman, M.; Hodges, K. Evidence for Tibetan plateau uplift before 14 Myr ago from a new minimum age for east–west extension. Nature 1995, 374, 49. [Google Scholar] [CrossRef]
- Kali, E.; Leloup, P.; Arnaud, N.; Mahéo, G.; Liu, D.; Boutonnet, E.; Li, H. Exhumation history of the deepest central Himalayan rocks, Ama Drime range: Key pressure-temperature-deformation-time constraints on orogenic models. Tectonics 2010, 29. [Google Scholar] [CrossRef]
- Lee, J.; Hager, C.; Wallis, S.R.; Stockli, D.F.; Whitehouse, M.J.; Aoya, M.; Wang, Y. Middle to late Miocene extremely rapid exhumation and thermal reequilibration in the Kung Co rift, southern Tibet. Tectonics 2011, 30. [Google Scholar] [CrossRef]
- Ratschbacher, L.; Krumrei, I.; Blumenwitz, M.; Staiger, M.; Gloaguen, R.; Miller, B.V.; Samson, S.D.; Edwards, M.A.; Appel, E. Rifting and strike-slip shear in central Tibet and the geometry, age and kinematics of upper crustal extension in Tibet. Geol. Soc. Lond. Spec. Publ. 2011, 353, 127–163. [Google Scholar] [CrossRef]
- Murphy, M.; Yin, A.; Kapp, P.; Harrison, T.; Manning, C.; Ryerson, F.J.; Lin, D.; Jinghui, G. Structural evolution of the Gurla Mandhata detachment system, southwest Tibet: Implications for the eastward extent of the Karakoram fault system. Geol. Soc. Am. Bull. 2002, 114, 428–447. [Google Scholar] [CrossRef]
- McCallister, A.T.; Taylor, M.H.; Murphy, M.A.; Styron, R.H.; Stockli, D.F. Thermochronologic constraints on the late Cenozoic exhumation history of the Gurla Mandhata metamorphic core complex, Southwestern Tibet. Tectonics 2014, 33, 27–52. [Google Scholar] [CrossRef]
- Williams, H.; Turner, S.; Kelley, S.; Harris, N. Age and composition of dikes in Southern Tibet: New constraints on the timing of east-west extension and its relationship to postcollisional volcanism. Geology 2001, 29, 339–342. [Google Scholar] [CrossRef]
- Yin, A.; Harrison, T.M. Geologic evolution of the Himalayan-Tibetan orogen. Annu. Rev. Earth Planet. Sci. 2000, 28, 211–280. [Google Scholar] [CrossRef]
- Sanchez, V.; Murphy, M.; Robinson, A.; Lapen, T.; Heizler, M. Tectonic evolution of the India–Asia suture zone since Middle Eocene time, Lopukangri area, south-central Tibet. J. Asian Earth Sci. 2013, 62, 205–220. [Google Scholar] [CrossRef]
- Laskowski, A.K.; Kapp, P.; Ding, L.; Campbell, C.; Liu, X. Tectonic evolution of the Yarlung suture zone, Lopu Range region, southern Tibet. Tectonics 2017, 36, 108–136. [Google Scholar] [CrossRef]
- Harrison, T.M.; Copeland, P.; Kidd, W.; Lovera, O.M. Activation of the Nyainqentanghla shear zone: Implications for uplift of the southern Tibetan Plateau. Tectonics 1995, 14, 658–676. [Google Scholar] [CrossRef]
- Kapp, J.L.D.A.; Harrison, T.M.; Kapp, P.; Grove, M.; Lovera, O.M.; Lin, D. Nyainqentanglha Shan: A window into the tectonic, thermal, and geochemical evolution of the Lhasa block, southern Tibet. J. Geophys. Res. Solid Earth 2005, 110. [Google Scholar] [CrossRef]
- Hager, C.; Stockli, D.; Dewane, T.; Gehrels, G.; Ding, L. Anatomy and Crustal Evolution of the Central Lhasa Terrane (S-Tibet) Revealed by Investigations in the Xainza Rift. In Proceedings of the EGU General Assembly Conference, Vienna, Austria, 7–12 April 2019. [Google Scholar]
- Dewane, T.; Stockli, D.; Hager, C.; Taylor, M.; Ding, L.; Lee, J.; Wallis, S. Timing of Cenozoic EW Extension in the Tangra Yum Co-Kung Co Rift, south-central Tibet. In Proceedings of the Agu Fall Meeting, San Francisco, CA, USA, 11–15 December 2006. [Google Scholar]
- Kapp, P.; Taylor, M.; Stockli, D.; Ding, L. Development of active low-angle normal fault systems during orogenic collapse: Insight from Tibet. Geology 2008, 36, 7–10. [Google Scholar] [CrossRef]
- Stockli, D.F.; Taylor, M.; Yin, A.; Harrison, T.M.; D’Andrea, J.; Kapp, P.; Ding, L. Late Miocene-Pliocene inception of EW extension in Tibet as evidenced by apatite (U-Th)/He data. In Proceedings of the Geological Society of America, Denver, CO, USA, 27–30 October 2002. [Google Scholar]
- Lee, H.-Y.; Chung, S.-L.; Lo, C.-H.; Ji, J.; Lee, T.-Y.; Qian, Q.; Zhang, Q. Eocene Neotethyan slab breakoff in southern Tibet inferred from the Linzizong volcanic record. Tectonophysics 2009, 477, 20–35. [Google Scholar] [CrossRef]
- Maluski, H.; Proust, F.; Xiao, X. 39 Ar/40 Ar dating of the trans-Himalayan calc-alkaline magmatism of southern Tibet. Nature 1982, 298, 152–154. [Google Scholar] [CrossRef]
- Coulon, C.; Maluski, H.; Bollinger, C.; Wang, S. Mesozoic and Cenozoic volcanic rocks from central and southern Tibet: 39Ar-40Ar dating, petrological characteristics and geodynamical significance. Earth Planet. Sci. Lett. 1986, 79, 281–302. [Google Scholar] [CrossRef]
- Pan, G.; Ding, J.; Yao, D.; Wang, L. Guidebook of 1: 1,500,000 Geologic Map of the Qinghai–Xizang (Tibet) Plateau and Adjacent Areas; Chengdu Cartographic Publishing House: Chengdu, China, 2004. [Google Scholar]
- Lee, H.; Chung, S.; Wang, Y.; Zhu, D.; Yang, J.; Song, B.; Liu, D.; Wu, F. Age, petrogenesis and geological significance of the Linzizong volcanic successions in the Linzhou basin, southern Tibet: Evidence from zircon U-Pb dates and Hf isotopes. Acta Petrol. Sin. 2007, 23, 493–500. [Google Scholar]
- Schärer, U.; Xu, R.-H.; Allègre, C.J. UPb geochronology of Gangdese (Transhimalaya) plutonism in the Lhasa-Xigaze region, Tibet. Earth Planet. Sci. Lett. 1984, 69, 311–320. [Google Scholar] [CrossRef]
- Gansser, A. Geology of the Himalayas; Wiley InterScience: Hoboken, NJ, USA, 1964. [Google Scholar]
- Aitchison, J.C.; Davis, A.M.; Luo, H. New constraints on the India–Asia collision: The lower Miocene Gangrinboche conglomerates, Yarlung Tsangpo suture zone, SE Tibet. J. Asian Earth Sci. 2002, 21, 251–263. [Google Scholar] [CrossRef]
- DeCelles, P.G.; Kapp, P.; Quade, J.; Gehrels, G.E. Oligocene–Miocene Kailas basin, southwestern Tibet: Record of postcollisional upper-plate extension in the Indus-Yarlung suture zone. GSA Bull. 2011, 123, 1337–1362. [Google Scholar] [CrossRef]
- Leary, R.; Orme, D.A.; Laskowski, A.K.; DeCelles, P.G.; Kapp, P.; Carrapa, B.; Dettinger, M. Along-strike diachroneity in deposition of the Kailas Formation in central southern Tibet: Implications for Indian slab dynamics. Geosphere 2016, 12, 1198–1223. [Google Scholar] [CrossRef]
- Shen, T.; Wang, G.; Bernet, M.; Replumaz, A.; Ai, K.; Song, B.; Zhang, K.; Zhang, P. Long-term exhumation history of the Gangdese magmatic arc: Implications for the evolution of the Kailas Basin, western Tibet. Geol. J. 2019, 55, 7239–7250. [Google Scholar] [CrossRef]
- Einsele, G.; Liu, B.; Dürr, S.; Frisch, W.; Liu, G.; Luterbacher, H.; Ratschbacher, L.; Ricken, W.; Wendt, J.; Yu, G.; et al. The Xigaze forearc basin: Evolution and facies architecture (Cretaceous, Tibet). Sediment. Geol. 1994, 90, 1–32. [Google Scholar] [CrossRef]
- Dürr, S.R.B. Provenance of Xigaze fore-arc basin clastic rocks (Cretaceous, south Tibet). Geol. Soc. Am. Bull. 1996, 108, 669–684. [Google Scholar] [CrossRef]
- An, W.; Hu, X.; Garzanti, E.; BouDagher-Fadel, M.K.; Wang, J.; Sun, G. Xigaze forearc basin revisited (South Tibet): Provenance changes and origin of the Xigaze Ophiolite. Bulletin 2014, 126, 1595–1613. [Google Scholar] [CrossRef]
- Orme, D.A.; Laskowski, A.K. Basin analysis of the Albian–Santonian Xigaze forearc, Lazi region, south-central Tibet. J. Sediment. Res. 2016, 86, 894–913. [Google Scholar] [CrossRef]
- Wang, E.; Kamp, P.J.; Xu, G.; Hodges, K.V.; Meng, K.; Chen, L.; Wang, G.; Luo, H. Flexural bending of southern Tibet in a retro foreland setting. Sci. Rep. 2015, 5, 12076. [Google Scholar] [CrossRef]
- Wang, J.-G.; Hu, X.; Garzanti, E.; An, W.; Liu, X.-C. The birth of the Xigaze forearc basin in southern Tibet. Earth Planet. Sci. Lett. 2017, 465, 38–47. [Google Scholar] [CrossRef]
- Orme, D.A.; Carrapa, B.; Kapp, P. Sedimentology, provenance and geochronology of the upper Cretaceous–lower Eocene western Xigaze forearc basin, southern Tibet. Basin Res. 2015, 27, 387–411. [Google Scholar] [CrossRef]
- Orme, D.A. Burial and exhumation history of the Xigaze forearc basin, Yarlung suture zone, Tibet. Geosci. Front. 2019, 10, 895–908. [Google Scholar] [CrossRef]
- Heim, A.; Gansser, A. Central Himalaya: Geological Observations of the Swiss Expedition 1975, 1936; Hindustan Publishing Corporation: Delhi, India, 1939. [Google Scholar]
- Yin, A.; Harrison, T.M.; Murphy, M.; Grove, M.; Nie, S.; Ryerson, F.; Feng, W.X.; Zeng Le, C. Tertiary deformation history of southeastern and southwestern Tibet during the Indo-Asian collision. Geol. Soc. Am. Bull. 1999, 111, 1644–1664. [Google Scholar] [CrossRef]
- Murphy, M.; Yin, A. Structural evolution and sequence of thrusting in the Tethyan fold-thrust belt and Indus-Yalu suture zone, southwest Tibet. Geol. Soc. Am. Bull. 2003, 115, 21–34. [Google Scholar] [CrossRef]
- Zhang, P.-Z.; Shen, Z.; Wang, M.; Gan, W.; Bürgmann, R.; Molnar, P.; Wang, Q.; Niu, Z.; Sun, J.; Hanrong, S.; et al. Continuous deformation of the Tibetan Plateau from global positioning system data. Geology 2004, 32, 809–812. [Google Scholar] [CrossRef]
- Paces, J.B.; Miller, J.D., Jr. Precise U-Pb ages of Duluth complex and related mafic intrusions, northeastern Minnesota: Geochronological insights to physical, petrogenetic, paleomagnetic, and tectonomagmatic processes associated with the 1.1 Ga midcontinent rift system. J. Geophys. Res. Solid Earth 1993, 98, 13997–14013. [Google Scholar] [CrossRef]
- Schmitz, M.D.; Bowring, S.A.; Ireland, T.R. Evaluation of Duluth Complex anorthositic series (AS3) zircon as a U-Pb geochronological standard: New high-precision isotope dilution thermal ionization mass spectrometry results. Geochim. Cosmochim. Acta 2003, 67, 3665–3672. [Google Scholar]
- Black, L.P.; Kamo, S.L.; Allen, C.M.; Davis, D.W.; Aleinikoff, J.N.; Valley, J.W.; Mundil, R.; Campbell, I.H.; Korscch, R.J.; Williams, I.S. Improved 206Pb/238U microprobe geochronology by the monitoring of a trace-element-related matrix effect; SHRIMP, ID–TIMS, ELA–ICP–MS and oxygen isotope documentation for a series of zircon standards. Chem. Geol. 2004, 205, 115–140. [Google Scholar]
- Gehrels, G.E.; Valencia, V.A.; Ruiz, J. Enhanced precision, accuracy, efficiency, and spatial resolution of U-Pb ages by laser ablation–multicollector–inductively coupled plasma–mass spectrometry. Geochem. Geophys. Geosyst. 2008, 9. [Google Scholar] [CrossRef]
- Gehrels, G.; Valencia, V.; Pullen, A. Detrital zircon geochronology by laser-ablation multicollector ICPMS at the Arizona LaserChron Center. Paleontol. Soc. Pap. 2006, 12, 67–76. [Google Scholar] [CrossRef]
- Gehrels, G.; Pecha, M. Detrital zircon U-Pb geochronology and Hf isotope geochemistry of Paleozoic and Triassic passive margin strata of western North America. Geosphere 2014, 10, 49–65. [Google Scholar] [CrossRef]
- Pullen, A.; Ibáñez-Mejia, M.; Gehrels, G.E.; Giesler, D.; Pecha, M. Optimization of a laser ablation-single collector-inductively coupled plasma-mass spectrometer (Thermo Element 2) for accurate, precise, and efficient zircon U-Th-Pb geochronology. Geochem. Geophys. Geosyst. 2018, 19, 3689–3705. [Google Scholar] [CrossRef]
- Ludwig, K.; Mundil, R. Extracting reliable U-Pb ages and errors from complex populations of zircons from Phanerozoic tuffs. Geochim. Cosmochim. Acta 2002, 66, A463. [Google Scholar]
- Ludwig, K.R. Isoplot 3.00: A geochronological toolkit for Microsoft Excel. Berkeley Geochronol. Cent. Spec. Publ. 2003, 4, 70. [Google Scholar]
- Reiners, P.W. Zircon (U-Th)/He thermochronometry. Rev. Miner. Geochem. 2005, 58, 151–179. [Google Scholar] [CrossRef]
- Hourigan, J.K.; Reiners, P.W.; Brandon, M.T. U-Th zonation-dependent alpha-ejection in (U-Th)/He chronometry. Geochim Cosmochim. Acta 2005, 69, 3349–3365. [Google Scholar] [CrossRef]
- Guenthner, W.R.; Reiners, P.W.; Ketcham, R.A.; Nasdala, L.; Giester, G. Helium diffusion in natural zircon: Radiation damage, anisotropy, and the interpretation of zircon (U-Th)/He thermochronology. Am. J. Sci. 2013, 313, 145–198. [Google Scholar] [CrossRef]
- Ketcham, R.A. Forward and inverse modeling of low-temperature thermochronometry data. Rev. Miner. Geochem. 2005, 58, 275–314. [Google Scholar] [CrossRef]
- Ketcham, R.A.; Gautheron, C.; Tassan-Got, L. Accounting for long alpha-particle stopping distances in (U–Th–Sm)/He geochronology: Refinement of the baseline case. Geochim. Cosmochim. Acta 2011, 75, 7779–7791. [Google Scholar] [CrossRef]
- Sundell, K.; Laskowski, A.K.; Kapp, P.A.; Ducea, M.N. Jurassic to Neogene quantitative crustal thickness estimates in southern Tibet from recalibrated Sr/Y and La/Yb trace element geochemical proxies. GSA Today 2020. [Google Scholar] [CrossRef]
- Chapman, J.B.; Kapp, P. Tibetan magmatism database. Geochem. Geophys. Geosyst. 2017, 18, 4229–4234. [Google Scholar] [CrossRef]
- DeCelles, P.G.; Kapp, P.; Gehrels, G.E.; Ding, L. Paleocene-Eocene foreland basin evolution in the Himalaya of southern Tibet and Nepal: Implications for the age of initial India-Asia collision. Tectonics 2014, 33, 824–849. [Google Scholar] [CrossRef]
- Hu, X.; Wang, J.; BouDagher-Fadel, M.; Garzanti, E.; An, W. New insights into the timing of the India–Asia collision from the Paleogene Quxia and Jialazi formations of the Xigaze forearc basin, South Tibet. Gondwana Res. 2016, 32, 76–92. [Google Scholar] [CrossRef]
- Yin, A.; Harrison, T.M.; Ryerson, F.; Wenji, C.; Kidd, W.; Copeland, P. Tertiary structural evolution of the Gangdese thrust system, southeastern Tibet. J. Geophys. Ress Solid Earth 1994, 99, 18175–18201. [Google Scholar] [CrossRef]
- Zhang, R.; Murphy, M.A.; Lapen, T.J.; Sanchez, V.; Heizler, M. Late Eocene crustal thickening followed by Early-Late Oligocene extension along the India-Asia suture zone: Evidence for cyclicity in the Himalayan orogen. Geosphere 2011, 7, 1249–1268. [Google Scholar] [CrossRef]
- Laskowski, A.K.; Kapp, P.; Cai, F. Gangdese culmination model: Oligocene–Miocene duplexing along the India-Asia suture zone, Lazi region, southern Tibet. GSA Bull. 2018, 130, 1355–1376. [Google Scholar] [CrossRef]
- Searle, M.; Windley, B.; Coward, M.; Cooper, D.; Rex, A.; Rex, D.; Tingdong, L.; Xuchang, X.; Jan, M.Q.; Thakur, V.; et al. The closing of Tethys and the tectonics of the Himalaya. Geol. Soc. Am. Bull. 1987, 98, 678–701. [Google Scholar] [CrossRef]
- Harrison, T.M.; Copeland, P.; Kidd, W.; Yin, A. Raising tibet. Science 1992, 255, 1663–1670. [Google Scholar] [CrossRef]
- Wang, C.; Li, X.; Liu, Z.; Li, Y.; Jansa, L.; Dai, J.; Wei, Y. Revision of the Cretaceous–Paleogene stratigraphic framework, facies architecture and provenance of the Xigaze forearc basin along the Yarlung Zangbo suture zone. Gondwana Res. 2012, 22, 415–433. [Google Scholar] [CrossRef]
- Gan, W.; Zhang, P.; Shen, Z.K.; Niu, Z.; Wang, M.; Wan, Y.; Zhou, D.; Cheng, J. Present-day crustal motion within the Tibetan Plateau inferred from GPS measurements. J. Res. Solid Earth 2007, 112. [Google Scholar] [CrossRef]
- Hawkesworth, C.; Kemp, A. Using hafnium and oxygen isotopes in zircons to unravel the record of crustal evolution. Chem. Geol. 2006, 226, 144–162. [Google Scholar] [CrossRef]
- Kapp, P.; DeCelles, P.G.; Leier, A.; Fabijanic, J.; He, S.; Pullen, A.; Gehrels, G.E.; Ding, L. The Gangdese retroarc thrust belt revealed. GSA Today 2007, 17, 4. [Google Scholar] [CrossRef]


Publisher’s Note: MDPI stays neutral with regard to jurisdictional claims in published maps and institutional affiliations. |
© 2021 by the authors. Licensee MDPI, Basel, Switzerland. This article is an open access article distributed under the terms and conditions of the Creative Commons Attribution (CC BY) license (https://creativecommons.org/licenses/by/4.0/).
Share and Cite
Burke, W.B.; Laskowski, A.K.; Orme, D.A.; Sundell, K.E.; Taylor, M.H.; Guo, X.; Ding, L. Record of Crustal Thickening and Synconvergent Extension from the Dajiamang Tso Rift, Southern Tibet. Geosciences 2021, 11, 209. https://doi.org/10.3390/geosciences11050209
Burke WB, Laskowski AK, Orme DA, Sundell KE, Taylor MH, Guo X, Ding L. Record of Crustal Thickening and Synconvergent Extension from the Dajiamang Tso Rift, Southern Tibet. Geosciences. 2021; 11(5):209. https://doi.org/10.3390/geosciences11050209
Chicago/Turabian StyleBurke, William B., Andrew K. Laskowski, Devon A. Orme, Kurt E. Sundell, Michael H. Taylor, Xudong Guo, and Lin Ding. 2021. "Record of Crustal Thickening and Synconvergent Extension from the Dajiamang Tso Rift, Southern Tibet" Geosciences 11, no. 5: 209. https://doi.org/10.3390/geosciences11050209
APA StyleBurke, W. B., Laskowski, A. K., Orme, D. A., Sundell, K. E., Taylor, M. H., Guo, X., & Ding, L. (2021). Record of Crustal Thickening and Synconvergent Extension from the Dajiamang Tso Rift, Southern Tibet. Geosciences, 11(5), 209. https://doi.org/10.3390/geosciences11050209