Article

Tectonic Transport Directions, Shear Senses and Deformation Temperatures Indicated by Quartz c-Axis Fabrics and Microstructures in a NW-SE Transect across the Moine and Sgurr Beag Thrust Sheets, Caledonian Orogen of Northern Scotland

1
Department of Geosciences, Virginia Polytechnic Institute and State University, Blacksburg, VA 24061, USA
2
Department of Earth & Environmental Sciences, University of Kentucky, Lexington, KY 40506, USA
3
Department of Geology, Smith College, Northampton, MA 01063, USA
4
Department of Geosciences, University of Massachusetts, Amherst, MA 01003, USA
5
British Geological Survey, Edinburgh EH9 4LA, UK
6
School of Environment, Geography and Geosciences, University of Portsmouth, Portsmouth PO1 3QL, UK
*
Author to whom correspondence should be addressed.
Geosciences 2021, 11(10), 411; https://doi.org/10.3390/geosciences11100411
Submission received: 19 August 2021 / Revised: 23 September 2021 / Accepted: 27 September 2021 / Published: 30 September 2021
(This article belongs to the Special Issue Evolution of Modern and Ancient Orogenic Belts)

Abstract

:
Moine metasedimentary rocks of northern Scotland are characterized by arcuate map patterns of mineral lineations that swing progressively clockwise from orogen-perpendicular E-trending lineations in greenschist facies mylonites above the Moine thrust on the foreland edge of the Caledonian Orogen, to S-trending lineations at higher structural levels and metamorphic grades in the hinterland. Quartz c-axis fabrics measured on a west to east coast transect demonstrate that the lineations developed parallel to the maximum principal extension direction and therefore track the local tectonic transport direction. Microstructures and c-axis fabrics document a progressive change from top to the N shearing in the hinterland to top to the W shearing on the foreland edge. Field relationships indicate that the domain of top to the N shearing was at least 55 km wide before later horizontal shortening on km-scale W-vergent folds that detach on the underlying Moine thrust. Previously published data from the Moine thrust mylonites demonstrate that top to the W shearing had largely ceased by 430 Ma, while preliminary isotopic age data suggest top to the N shearing occurred at ~470–450 Ma. In addition, data from the east coast end of our transect indicate normal-sense top down-SE shearing at close to peak temperatures at ~420 Ma that may be related to the closing stages of Scandian deformation, metamorphism and cooling/exhumation.
1. Introduction

Mineral grain shape lineations in metamorphosed and plastically deformed rocks have been used for over a hundred years to infer tectonic transport directions (e.g., Geikie [1]; Peach et al., [2], p. 599; see reviews by Cloos [3]; Anderson [4]; Kvale [5]; Law and Johnson [6]). Although such linear grain shape fabrics may develop by many different structural processes, where it can be demonstrated that they have developed parallel to the maximum principal stretch direction, their trend is commonly used as an indicator of local tectonic transport direction (the geographic direction in which rocks are transported by tectonic processes such as movement on underlying faults and pervasive shearing). Transport directions can, of course, change both spatially and temporally, and may reflect complex flow patterns (particularly under ductile conditions in the mid-lower crust) and strain path partitioning at a wide range of scales [7,8,9,10,11,12,13]. Additionally, orogen-scale arcuate lineation patterns are commonly interpreted as indicating transpressional deformation associated with variable components of orogen-perpendicular shortening and orogen parallel shearing (e.g., Burg et al., [14]; Xypolias et al., [15]).
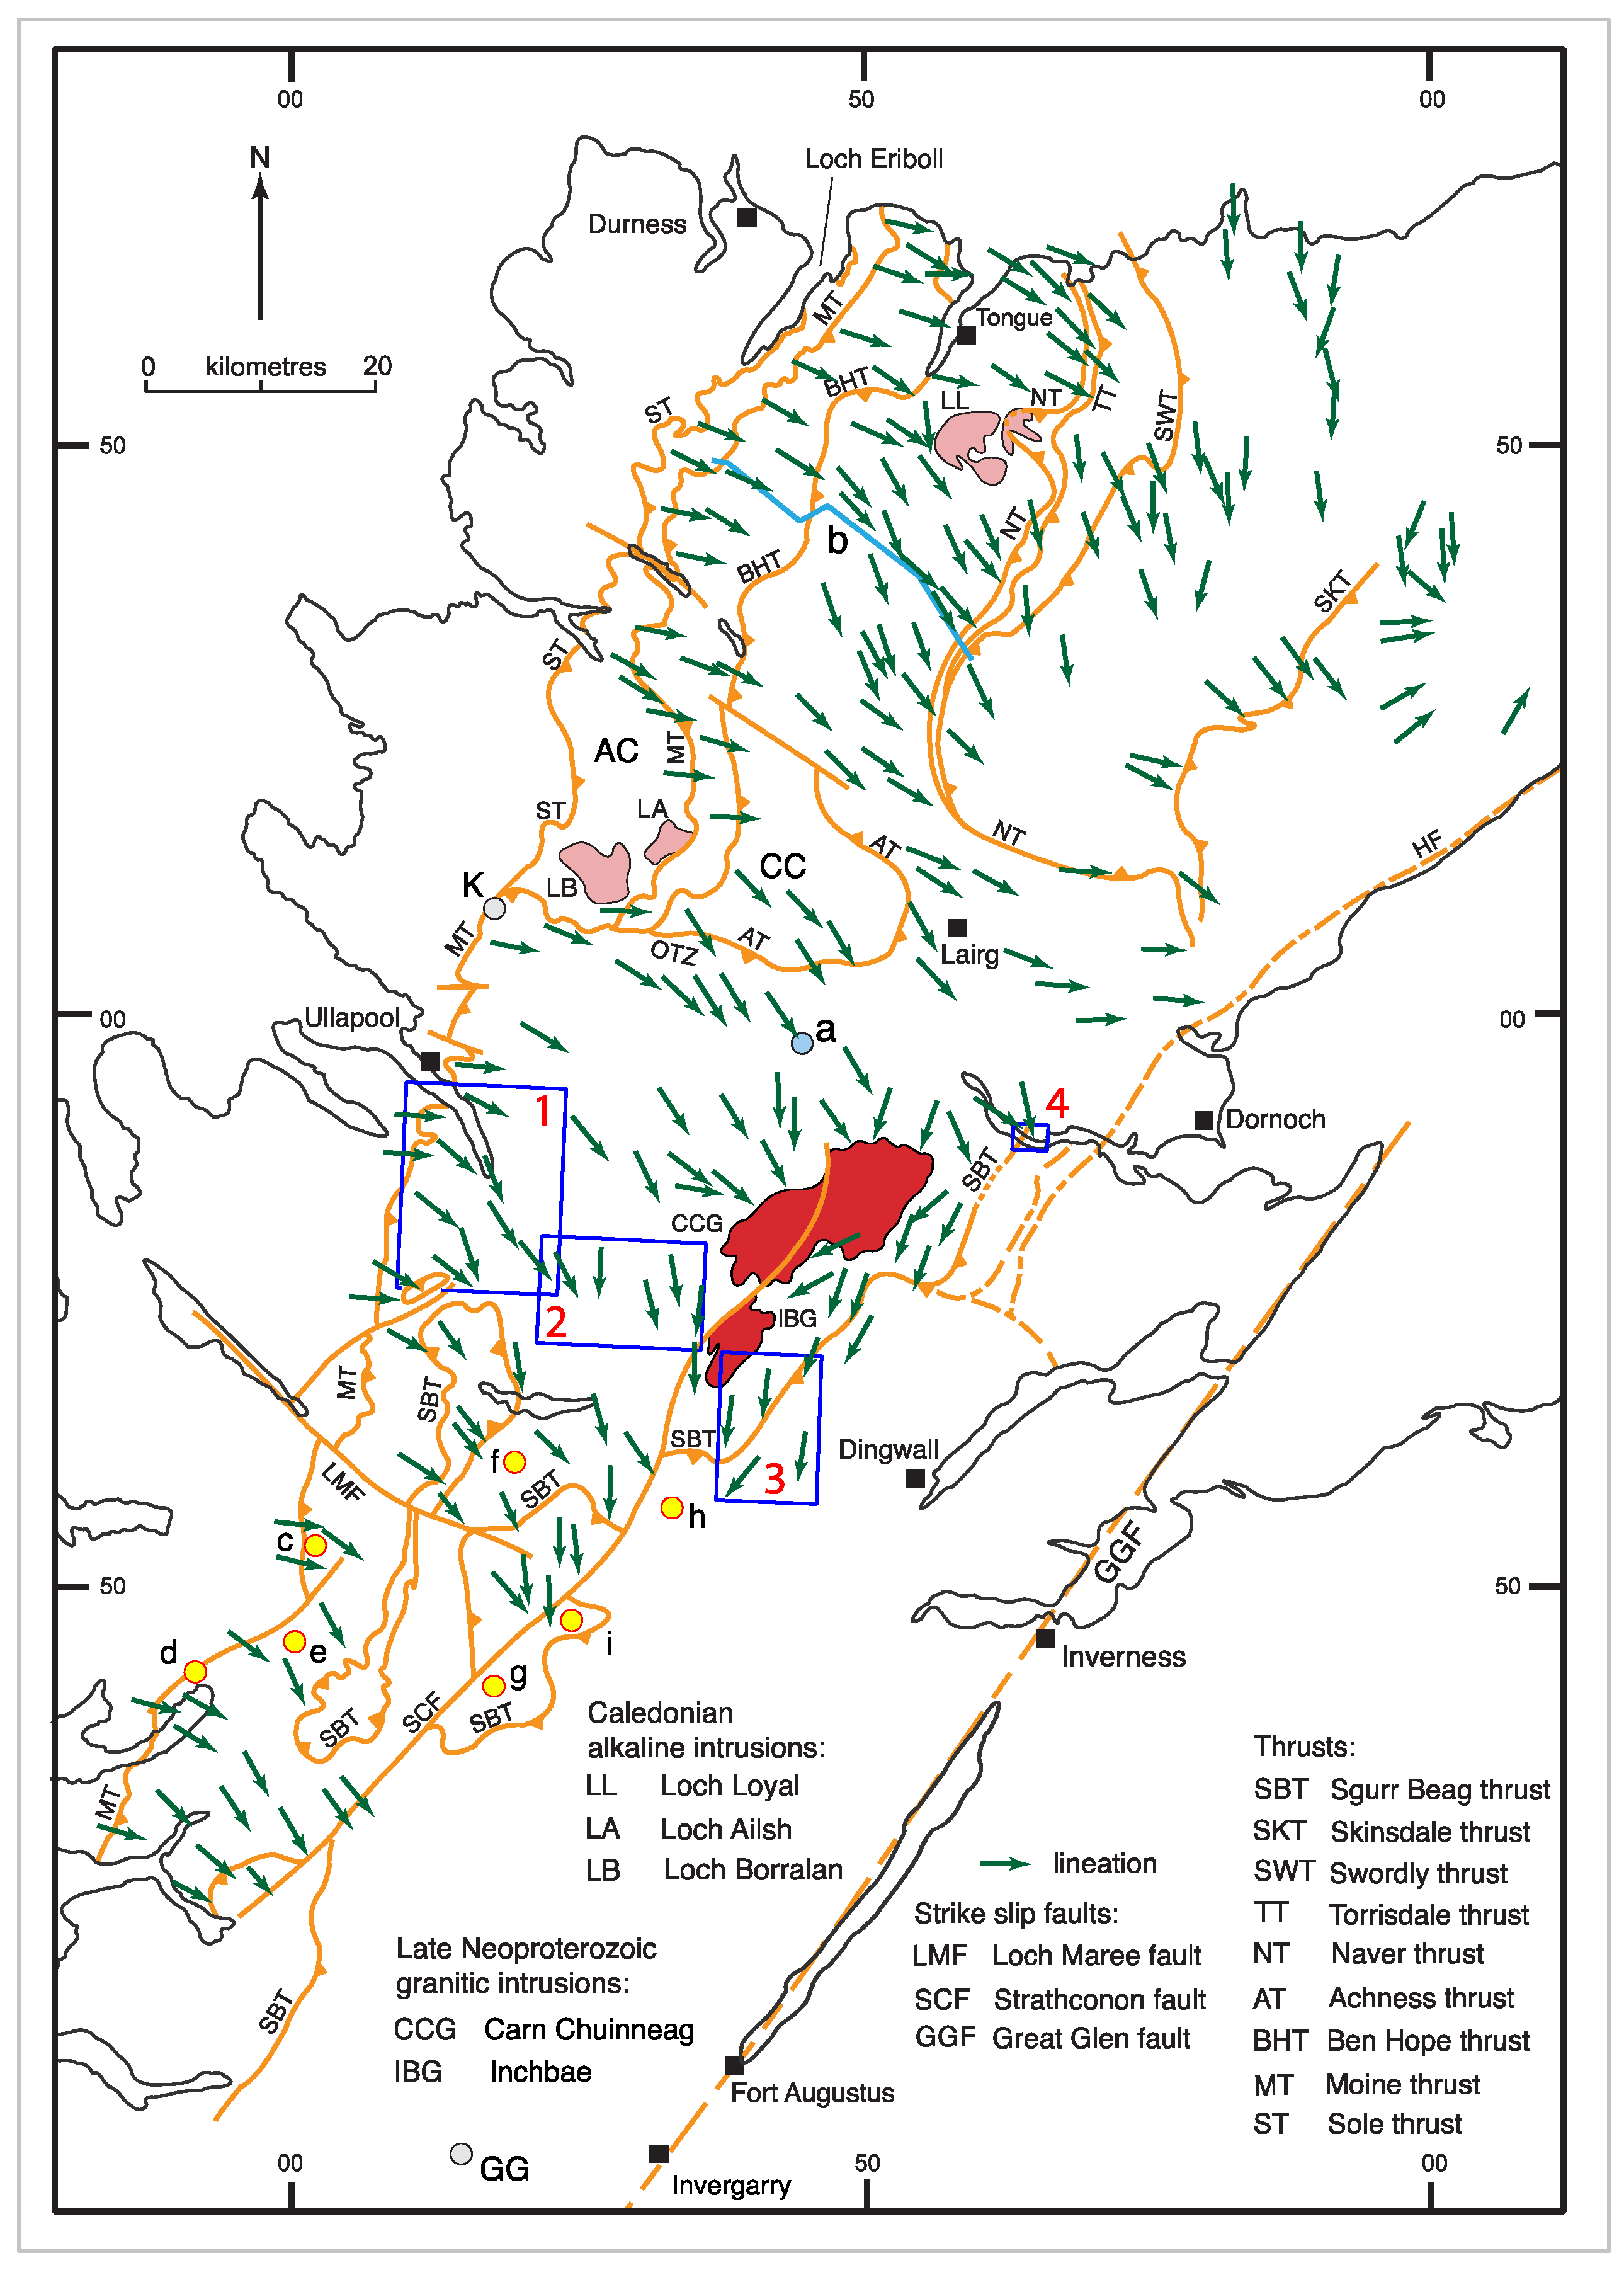
The Caledonian orogen of northern Scotland has historically played a pivotal role in development of our understanding of potential relationships between lineation development/orientation and tectonic transport direction (see historical review by Law and Johnson [6]). In this paper we investigate the transition from W-E, through NW-SE, to N-S trending lineations in an orogen-perpendicular ~45 km-long transect across the Caledonian orogenic wedge in the Northern Highlands of Scotland. This transect extends from the Moine thrust exposed at the foreland edge on the west coast near Ullapool, eastwards across the metasedimentary rocks of the overlying Moine and Sgurr Beag thrust sheets into the high-grade interior of the orogenic wedge exposed in the Ben Wyvis/Rogie Falls area (Figure 1 and Figure 2, boxes 1–3). Quartz c-axis fabrics in these plastically deformed and dynamically recrystallized Moine metasedimentary rocks unequivocally demonstrate that macroscopic mineral lineations have developed parallel to the maximum principal stretch direction in all 52 oriented samples analyzed. Microstructures and c-axis fabrics also unequivocally demonstrate a progressive change from top to the W, through top to the NW, to top to the N shear sense traced from foreland to hinterland across the western part of the Moine thrust sheet. In contrast, microstructures and crystal fabrics in our 10 oriented samples from the uppermost part of the Moine thrust sheet and lowermost part of the overlying Sgurr Beag thrust sheets exposed on the east coast in the Creich Peninsula (Figure 1 and Figure 2, box 4) indicate a top down to the ESE to SSE shear sense.
With the exception of top to the W shearing on the Moine thrust itself, precise dating of the age (or ages) of this shearing remains to be resolved. Here, we summarize and discuss what geological and isotopic age constraints are available, and also consider the potential applicability of tectonic models proposed for the development of arcuate patterns of stretching lineations and transport directions in other orogens.
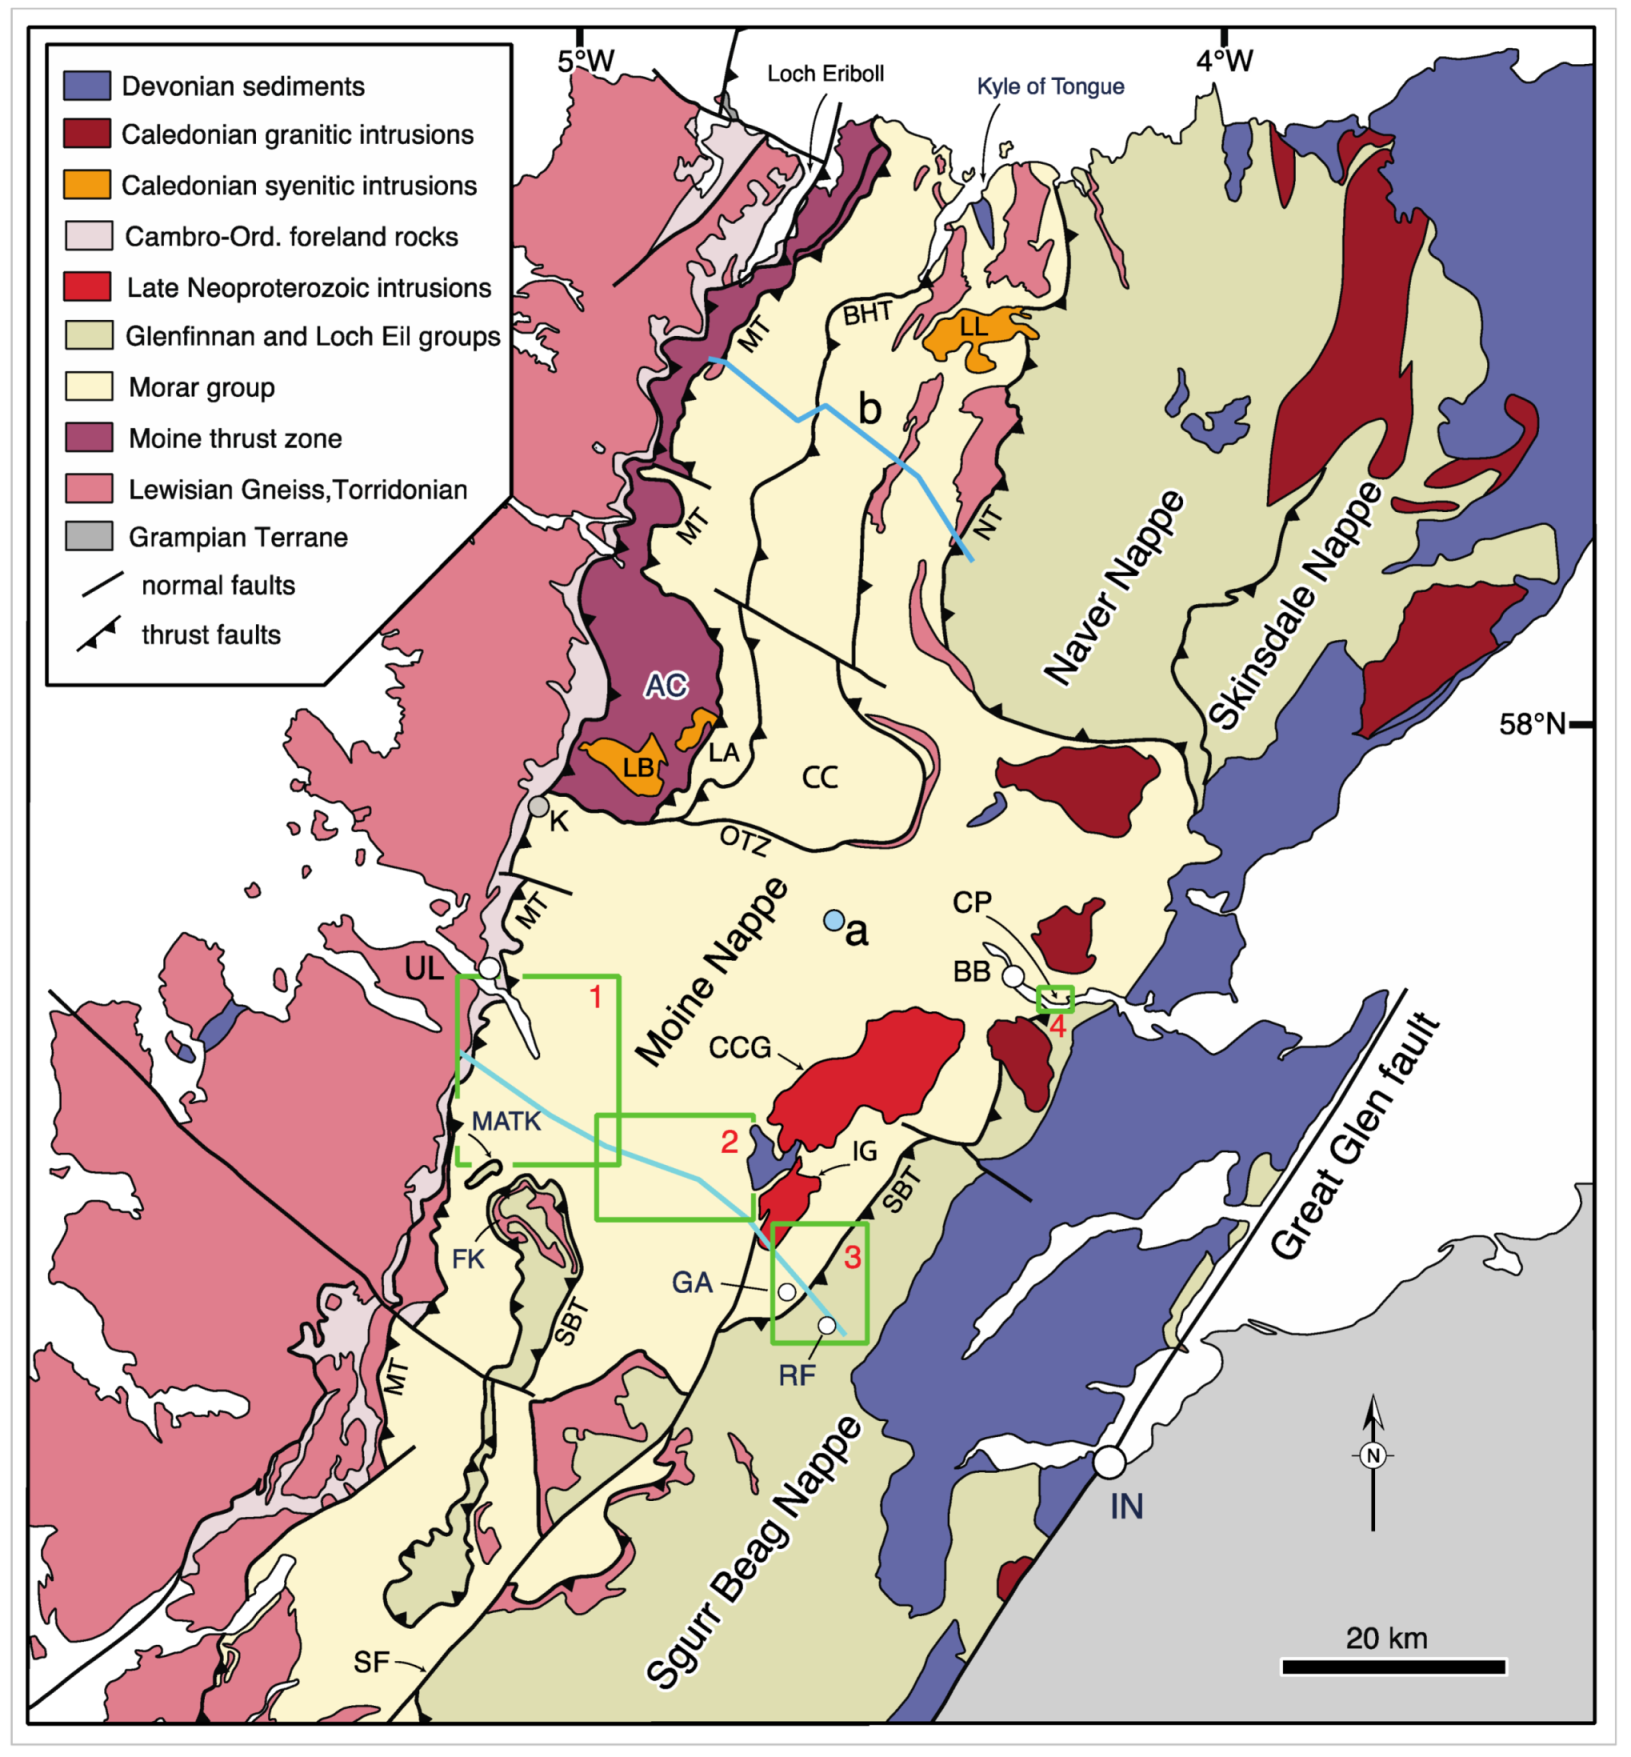
Figure 1. Geological map of northern Scotland showing lithotectonic units and thrust sheets within the Moine Supergroup (Morar, Glenfinnan and Loch Eil Groups) of metasedimentary rocks. Location of sampling transect between Ullapool (UL), Garve (GA) and Rogie Falls (RF) indicated by blue line and positions of detailed geological maps along sampling transect indicated by green boxes 1–3. Position of Creich Peninsula (CP) coastal section indicated by small green box 4. AC, Assynt Culmination; BB, Bonar Bridge; BHT, Ben Hope thrust; CC, Cassley Culmination; CCG, Carn Chuinneag Granite; FK and MATK, Fannich Mountains and Meall an t-Sithe klippen of the Sgurr Beag thrust sheet; IG, Inchbae Granite; K, Knockan Crag; LA, LB and LL, Loch Ailsh, Loch Borralan and Loch Loyal alkaline intrusions; MT, Moine thrust; NT, Naver thrust; OTZ, Oykel Transverse Zone; SBT, Sgurr Beag thrust; SF, Strathconnon fault; (a) location of thermobarometry and isotopic dating sample MT-16-03 described by Mako [16]; (b) location of grain size, quartz petrofabric/garnet-biotite thermometry profile (blue line) described by Francsis [17], Thigpen et al., [18] and Law [19] between the Moine thrust and base of the Naver thrust sheet. Modified from Krabbendam et al., [20], Leslie et al., [21]; Thigpen et al., [22] and Mako et al. [23].
Geosciences 11 00411 g001
Figure 2. Caledonian thrusts and L2 mineral lineations within the Moine rocks of Ross-shire and Sutherland. Modified from data compilation reviewed by Law and Johnson [6] with additional data from Strachan et al. [24] and this study. Location of sampling transect between Ullapool and Rogie Falls and detailed geological maps along sampling transect indicated by blue boxes 1–3. Position of Creich Peninsula coastal section indicated by small blue box 4. AC, Assynt Culmination; CC, Cassley Culmination; GG, Glen Garry; HF, Helmsdale Fault; K, Knockan Crag; OTZ, Oykel Transverse Zone. (a) location of thermobarometry and isotopic dating sample MT-16-03 described by Mako [16]; (b) location of quartz petrofabric/garnet-biotite thermometry profile (blue line) described by Thigpen et al., [18] and Law [19] between the Moine thrust and base of the Naver thrust sheet. Yellow circles, labelled c–i, indicate locations of other petrofabric studies referred to in text: (c) Johnson [25]; (d) Johnson [26]; (e) Langford [27]; (f) Sutton and Watson [28]; (g) Ramsay [29]; (h) Clifford [30]; (i) Fleuty [31].
Geosciences 11 00411 g002

2. Geological Background

The Caledonian Orogen in the Northern Highlands of Scotland is primarily composed of Neoproterozoic Moine metasedimentary rocks, deposited at 980–870 Ma (Cawood et al., [32]; Krabbendam et al., [33] and references therein) and located between the Moine thrust zone to the NW and the Great Glen Fault to the SE (Figure 1). These early Neoproterozoic metasedimentary rocks are cut by variably deformed and metamorphosed igneous intrusions and have been subjected to multiple phases of regional metamorphism and deformation. From oldest to youngest (and structurally from NW-SE) three major stratigraphic divisions are recognized (Figure 1): the Morar Group composed of psammites and subordinate pelites, and the Glenfinnan and Loch Eil groups composed of psammites, pelites and quartzites (see review by Strachan et al., [34]). The total cumulative thickness is c. 10–15 km. The Moine rocks have long been thought to represent an essentially continuous, although tectonically disrupted, succession and were assigned to a single Moine Supergroup [35,36]. However, rocks assigned to the Morar Group in Sutherland were metamorphosed at c. 950–940 Ma [37], whereas the Glenfinnan and Loch Eil groups were deposited after c. 910 Ma [38]. Recently, it has been proposed that the Morar Group, together with the Torridon and Sleat groups below the Moine thrust, belongs to an older Wester Ross Supergroup, and that the Glenfinnan and Loch Eil groups belong to a younger Loch Ness Supergroup [39].
The Moine rocks are cut by a series of originally gently ESE-dipping ductile thrusts, with each thrust sheet having its own distinctive stratigraphic, structural and metamorphic characteristics [40,41]. The Moine thrust separates Morar Group rocks from underlying anchizonal and un-metamorphosed Cambro-Ordovician and older rocks of the Moine thrust zone (Figure 1), while the Sgurr Beag thrust separates the Morar Group from the overlying Glenfinnan Group [42,43]. In the Loch Fannich area the Sgurr Beag thrust sheet is preserved as klippen of down-folded Glenfinnan Group rocks (Figure 1, FK and MATK) now separated by erosion from their main outcrop east of the Strathconnon Fault. In the northern Moine rocks of Sutherland the Naver thrust separates Morar Group rocks from overlying possible Glenfinnan Group rocks referred to as the East Sutherland Moine; however, correlation between the Sgurr Beag and either the Naver or Skinsdale thrusts remains debated [44,45,46]. Numerous smaller scale thrusts are recognized within the major thrust sheets.
Traced eastwards from the Moine thrust zone, metamorphic grade in the Moine rocks increases from greenschist facies in the immediate hanging wall to the Moine thrust, through epidote-amphibolite facies to lower and middle amphibolite facies, with upper amphibolite facies rocks recorded both in the far SW and NE [47]. However, as pointed out by Strachan et al., [41], p. 88, the apparent simplicity of this regional metamorphic zonation is illusory, as isotopic age-dating studies indicate that it is the composite result of multiple episodes of middle Neoproterozoic and Lower Paleozoic metamorphism and deformation. Three main groups of ages (and associated metamorphism and deformation) are traditionally recognized: (1) Knoydartian (~870–720 Ma) recognized primarily in the southern and central Moine on the SE side of the Strathconnon Fault; (2) Grampian (~480–460 Ma, early middle Ordovician) recognized in scattered locations throughout the southern Moine and in higher grade rocks located above and to the east of the Naver and Sgurr Beag thrusts in the northern Moine; (3) Scandian (~445–415 Ma, Silurian) recognized primarily in the Moine thrust Zone and the Moine/Ben Hope and Naver thrust sheets of the northern Moine, plus scattered locations in the southern Moine. The Grampian and Scandian are commonly viewed as separate phases of Caledonian orogenesis, the former resulting from the accretion of a magmatic arc to the Scottish margin of Laurentia, and the later the collision of Baltica and Laurentia and closure of the Iapetus Ocean [48]. However, isotopic ages of 460–445 Ma falling between the traditional Grampian and Scandian groups have recently been documented from scattered locations in both the southern Moine and Moine rocks exposed on the north coast [48,49] indicating a more complex history than previously appreciated.
Fault geometries and microstructural/petrofabric kinematic indicators unequivocally demonstrate that the Moine thrust zone and overlying Moine thrust mylonites are associated with top to the WNW shearing (see historical review by Law and Johnson [6]). In the Assynt region timing of motion on the Moine thrust is partially bracketed by the alkaline Loch Ailsh and Loch Borralan intrusive complexes (Figure 1, locations LA and LB). The Loch Ailsh intrusion is locally mylonitized adjacent to the Moine thrust and has yielded a U-Pb zircon age of 430.6 ± 0.4 Ma, while the later parts of the Loch Borralan complex postdate penetrative shearing and have been dated at 429.2 ± 0.5 Ma [48]. This is consistent with K-Ar and Rb-Sr mica ages from the Loch Broom–Fannich Forest area to the south which indicate that movement on the Moine thrust mylonites commenced at around 440–435 Ma with a cessation of ductile movement at ~430 Ma, although movement may have continued in a less pervasive manner until at least 408 Ma [50,51].
Despite the overwhelming evidence for multiple phases of deformation (thrusting, penetrative shearing and folding and metamorphism) the dominant mineral stretching lineation in the northern Moine metasedimentary rocks displays a remarkably simple map pattern (Figure 2). Adjacent to the Moine thrust the lineation plunges gently to the ESE. Traced eastwards to the higher metamorphic grade rocks of the structurally overlying thrust sheets the lineation trend progressively turns in a clockwise fashion with lineations plunging to the S or SSW in the highest-grade rocks. This lineation is usually referred to as an ‘L2’ structure (e.g., Holdsworth et al., [52,53]; Strachan et al., [41]; Mendum [46]) as, where overprinting relationships are preserved, it is associated with an S2 foliation that postdates early cm-scale isoclinal F1 folds.
In the Kyle of Tongue area on the north coast (Figure 1), Holdsworth [54] and Holdsworth et al., ([52], p. 20–21) have described N-trending mineral lineations in the Ben Hope thrust sheet which are deformed around F2 minor fold hinges and appear to represent a rarely preserved L1 fabric which was tentatively suggested to be of Precambrian age, and possibly formed during the Knoydartian orogenic event (Alsop et al., [55] p. 257), although a Caledonian age is also possible. Holdsworth [54] also noted that these N-trending L1 lineations are coincident with the majority of Caledonian age F2 fold hinges associated with W-vergent folding and thrusting prior to D2 sheath fold-formation and suggested that the later F2 folds initially formed parallel to an older regionally widespread L1 fabric.
Krabbendam et al., [56] have noted that ‘L2’ and ‘S2’ fabrics cannot be correlated across different thrust sheets. Instead, individual thrust sheets such as the Moine, Ben Hope and Achness thrust sheets (Figure 2) have their ‘own’ L2 or S2 fabrics, which are structurally younger than those developed in higher thrust sheets, which is consistent with an overall foreland-propagating thrust sequence.
Adjacent to the Moine thrust, the ESE trending L2 mineral lineation is parallel to the well-documented Scandian age transport direction in the underlying Moine thrust zone. Deformation microstructures and quartz c-axis fabrics in these dynamically recrystallized rocks unequivocally demonstrate that this lineation has developed parallel to the local maximum principal stretching direction during top to the W shearing (see historical review by Law and Johnson, [6]). However, traced eastward into the overlying higher grade metasedimentary rocks only very limited data are currently available on: (a) the kinematic significance of these lineations (e.g., relationship to finite principal strain directions and associated shear sense); (b) how the microstructures and crystal fabrics that developed with these grain shape lineations (and their associated foliations) change with increasing deformation temperature/metamorphic grade; and (c) whether these lineations/foliations are everywhere of essentially the same (Scandian) age or if they becomes progressively older (intermediate Scandian-Grampian or Grampian ages) traced eastwards into the overlying higher metamorphic grade thrust sheets, as suggested, for example, by Kelley and Powell [57] in the Fannich Forest area for the adjacent Moine and Sgurr Beag thrust sheets containing E and SE to S plunging lineations, respectively (Figure 1, locations MATK and FK).

3. Analytical Methods

Oriented samples have been collected both along the Moine thrust exposed between Loch Broom and Dundonnell and along a transect extending southeastwards across the Moine and Sgurr Beag thrust sheets and their along-strike continuation on the Creich Peninsula (Figure 1 and Figure 2). All microstructural and crystal fabric data are reported from thin sections cut perpendicular to foliation and parallel to lineation. For all oriented samples these data are viewed towards the north (W-E trending lineation), northeast (NW-SE lineation) or east (N-S lineation), such that a top to the W, NW or N motion is indicated by the top to the left shear sense. To ensure accuracy of lineation plunge and trend measurements, lineation orientations for all oriented samples were calculated from the pitch of lineation on foliation. Location and structural data for all samples are summarized in Supplementary File S1.

3.1. Quartz Grain Size Analysis

Recrystallized quartz grain sizes were measured optically along the transition from W-E to N-S trending lineation in order to determine if any variation in dynamically recrystallized grain size could be correlated with changing lineation trend and recrystallization mechanism, as such changes may indicate changing deformation conditions such as stress, temperature or strain rate. Variations in grain size were also measured in transects across the Sgurr Beag thrust. One hundred grains were measured in each thin section, with care being taken to avoid parts of the thin sections where recrystallized grain size could be influenced by the presence of other mineral phases such as feldspar and mica; e.g., by grain boundary pinning [17,58,59,60]. Based on the assumption that each grain in thin section could be approximated to an elliptical shape, the long and short dimension of each grain was measured and then the diameter of an equivalent area circle estimated [61,62,63]. This approach proved to be relatively straight-forward in samples dominated by subgrain rotation recrystallization of quartz adjacent to the Moine thrust, but more challenging in hinterland positioned samples dominated by grain boundary migration recrystallization. Arithmetic, geometric and harmonic mean grain sizes were estimated for each sample analyzed. Following Lopez-Sanchez [64], the geometric mean grain sizes are employed here for interpreting deformation conditions. Grain size data are summarized in Supplementary File S2.

3.2. Quartz c-Axis Fabrics and Microstructures

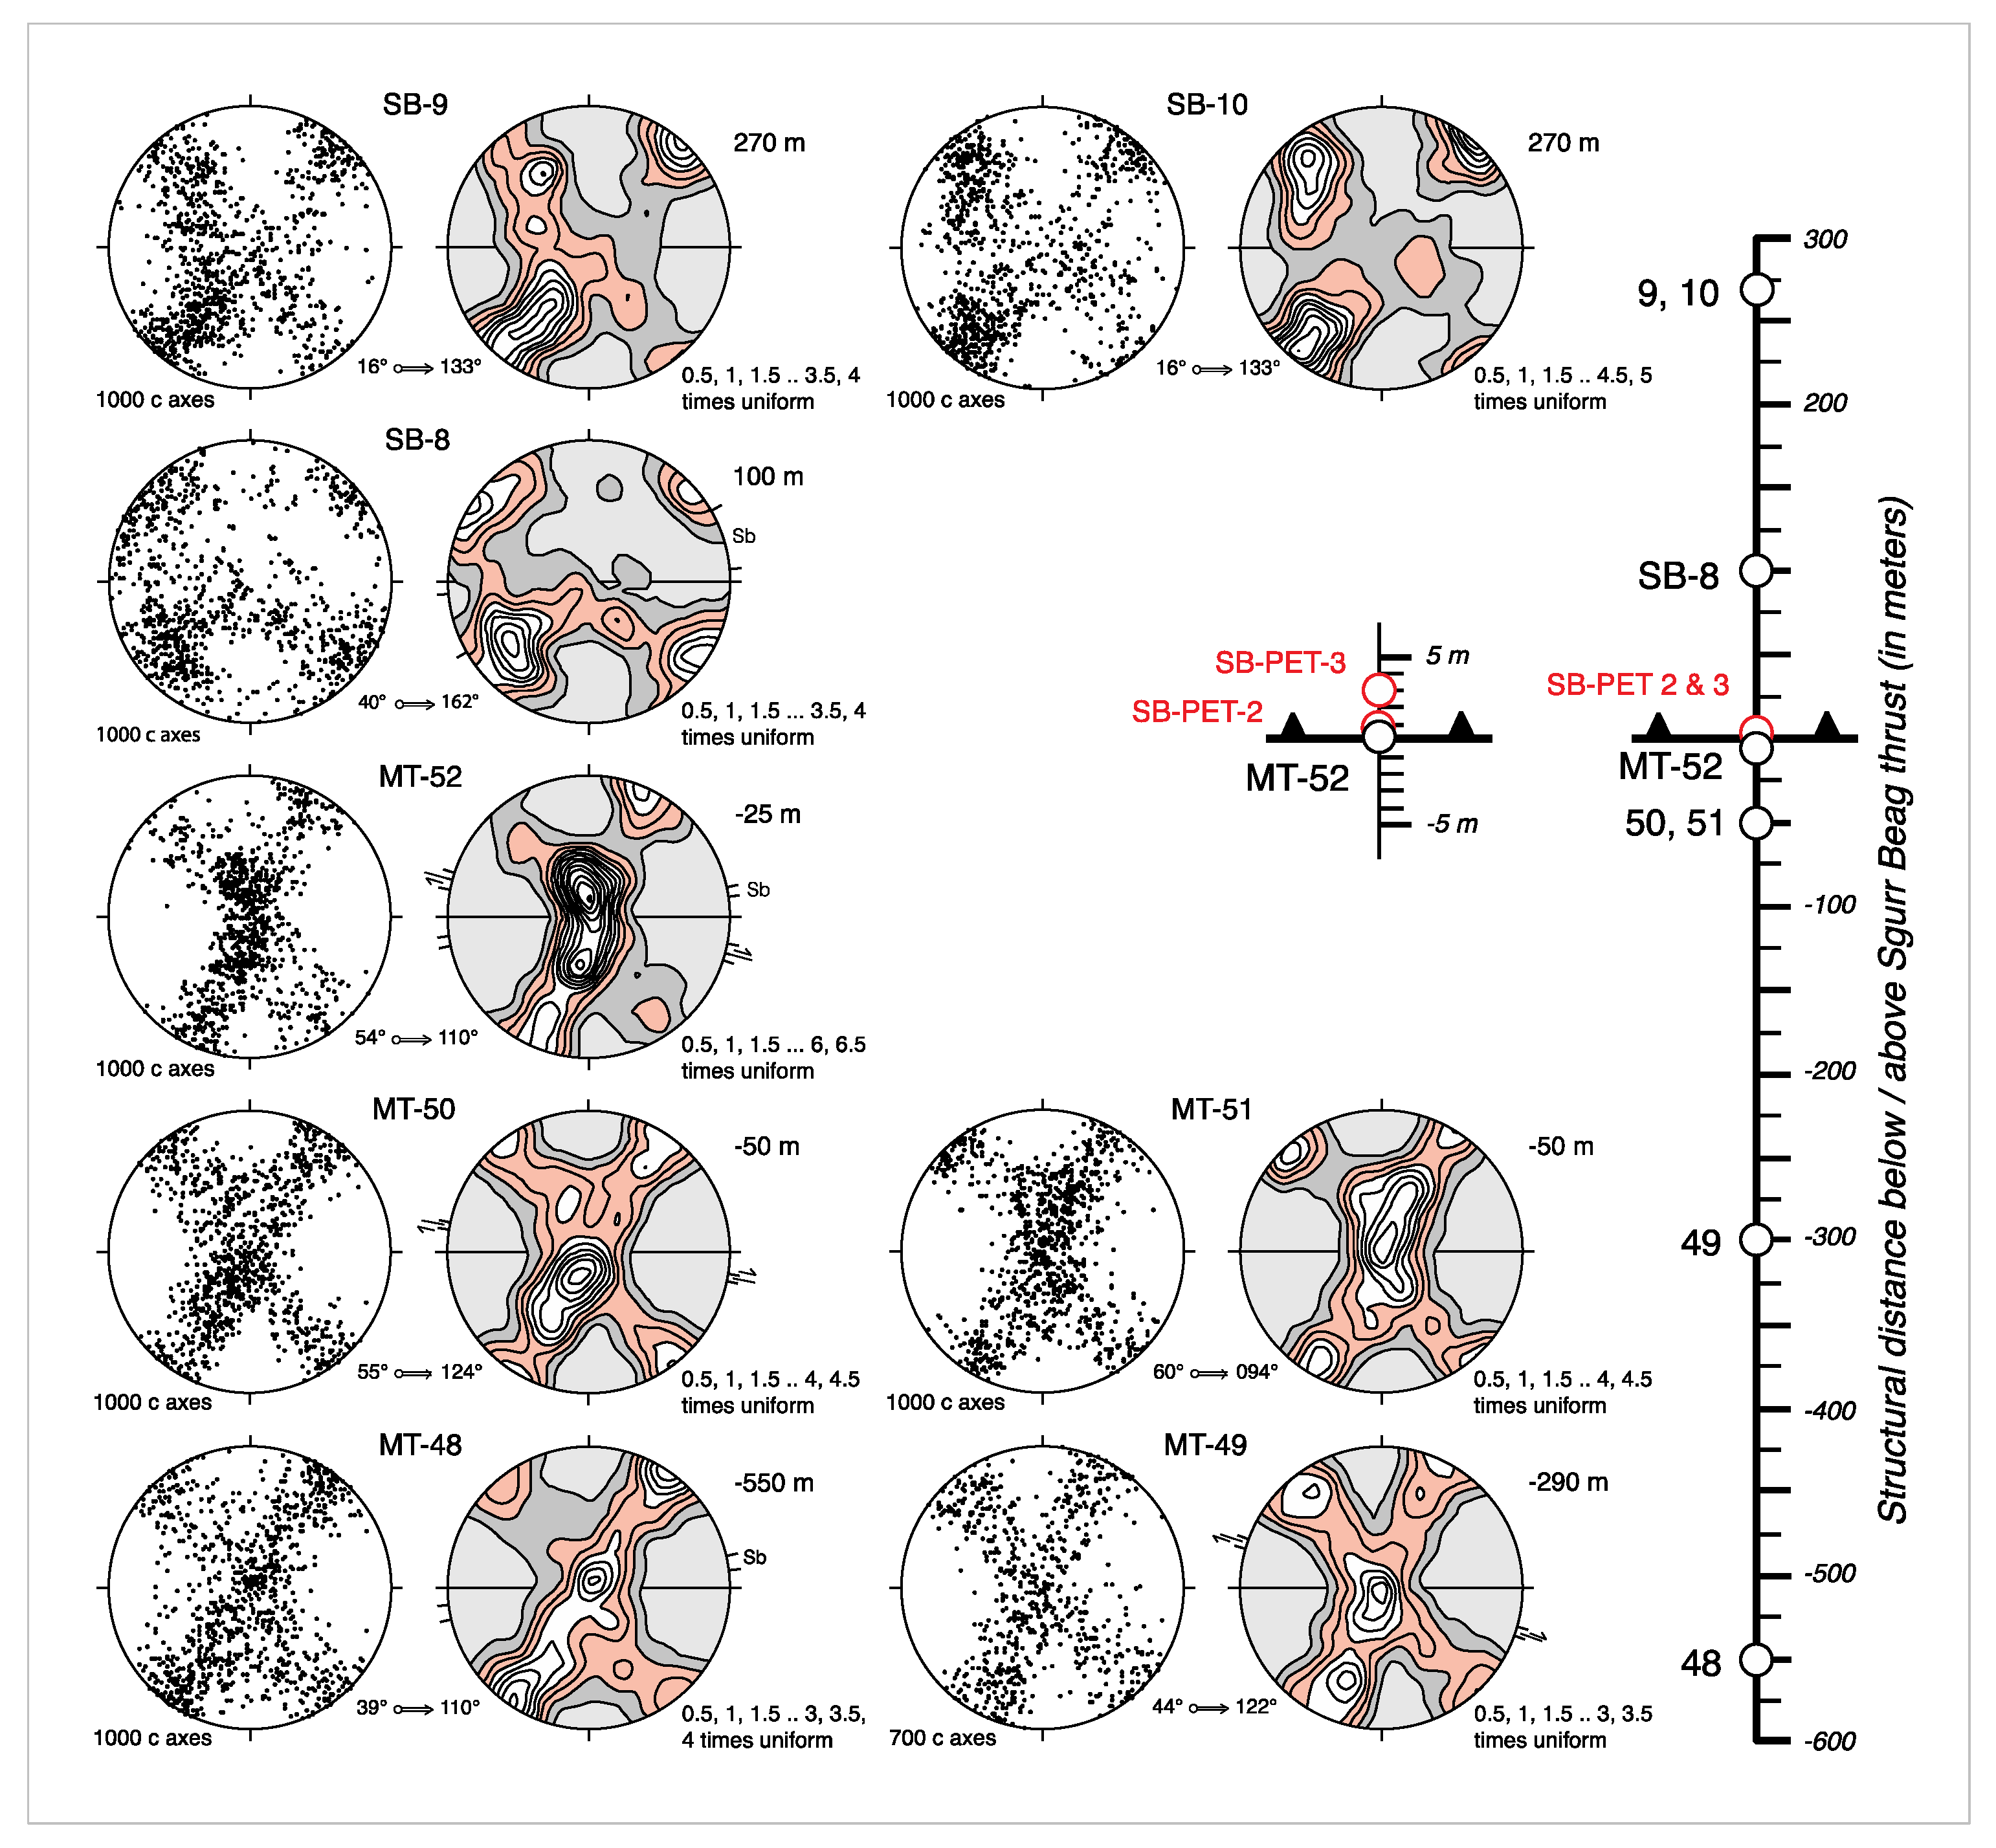
Quartz c-axis fabrics were measured on dynamically recrystallized quartz grains using an optical microscope and Leitz universal stage, with 1000 grains being measured in each sample. Universal stage data were collected using an Excel macro developed by S. Mulcahy, now at Western Washington University. Fabrics were contoured using the Stereoplot software package developed by N. Mancktelow at ETH, Zurich. Fabrics are displayed on lower hemisphere equal-area projections. The measured c-axis fabrics are used to: (a) assess if grain shape lineation in individual samples has developed parallel to the maximum principal stretch direction (X); (b) determine shear sense for individual samples; and (c) assess likely deformation temperature. In all 62 samples analyzed in this study, observed mineral lineations were within 1 or 2° of the orientation of X indicated by the measured c-axis fabric.
Microstructural shear sense indicators such as shear bands, extensional crenulations and alignments (Sb) of elongate dynamically recrystallized quartz grains oriented oblique to macroscopic foliation were also observed in many of the samples analyzed, and the orientation of these shear sense indicators with respect to the c-axis fabrics are shown on the fabric diagram for each sample.

3.3. Subdivisions of Sampling Transect

For descriptive purposes the sampling transect is subdivided in to three contiguous areas (Figure 1 and Figure 2, Areas 1–3) located between the Moine thrust in the west and the Sgurr Beag thrust sheet in the east, with a much smaller scale study area (Area 4) located along strike to the NE of Area 3. This transect across the Caledonian Orogen was chosen because the A832 and A835 roads in Areas 1–3 provide relatively easy access to potential sampling sites between the Moine thrust and the easternmost part of the Sgurr Beag thrust sheet.
Area 1 covers the western part of the Moine thrust sheet and extends from the Moine thrust to the hinge of the Braemore Syncline. This area is characterized by an ~4 km thick structural sequence of Morar Group metasedimentary rocks in which foliation dips gently to the SE subparallel to the underlying Moine thrust, and lineation lying within the foliation changes from W-E to N-S in trend with increasing height above the thrust. Area 2 covers the central part of the exposed Moine thrust sheet and extends from the hinge of the Braemore Syncline to the eastern end of Loch Glascarnoch. In this area, foliation in the metasedimentary rocks is folded about km-scale west-vergent folds that probably detach on the underlying Moine thrust surface [56]. Lineation lying within the foliation retains its N-S trend and is oriented sub-parallel to the km-scale fold hinges which plunge gently to the south. Area 3 covers both the eastern part of the Moine thrust sheet and the overlying Sgurr Beag thrust sheet (Morar and Glenfinnan group rocks, respectively) and extends from Inchbae Lodge through Ben Wyvis and Garve to Rogie Falls. Foliation in Area 3 has a steeper sheet dip to the SE than in Area 1 and lineation in both thrust sheets plunges gently to the S to SSE. Area 4 is located ~30 km along strike to the NE of Area 3 (Figure 1 and Figure 2) and is a small coastal exposure of the uppermost 500 m of the Moine thrust sheet and overlying Sgurr Beag thrust sheet, with lineation plunging to the ESE and SSE, respectively in the two thrust sheets. Due to lack of exposure, the along-strike continuation and position of the Sgurr Beag thrust to the north of Area 4 is unknown.

4. Area 1: Moine Thrust—Hinge of Braemore Syncline

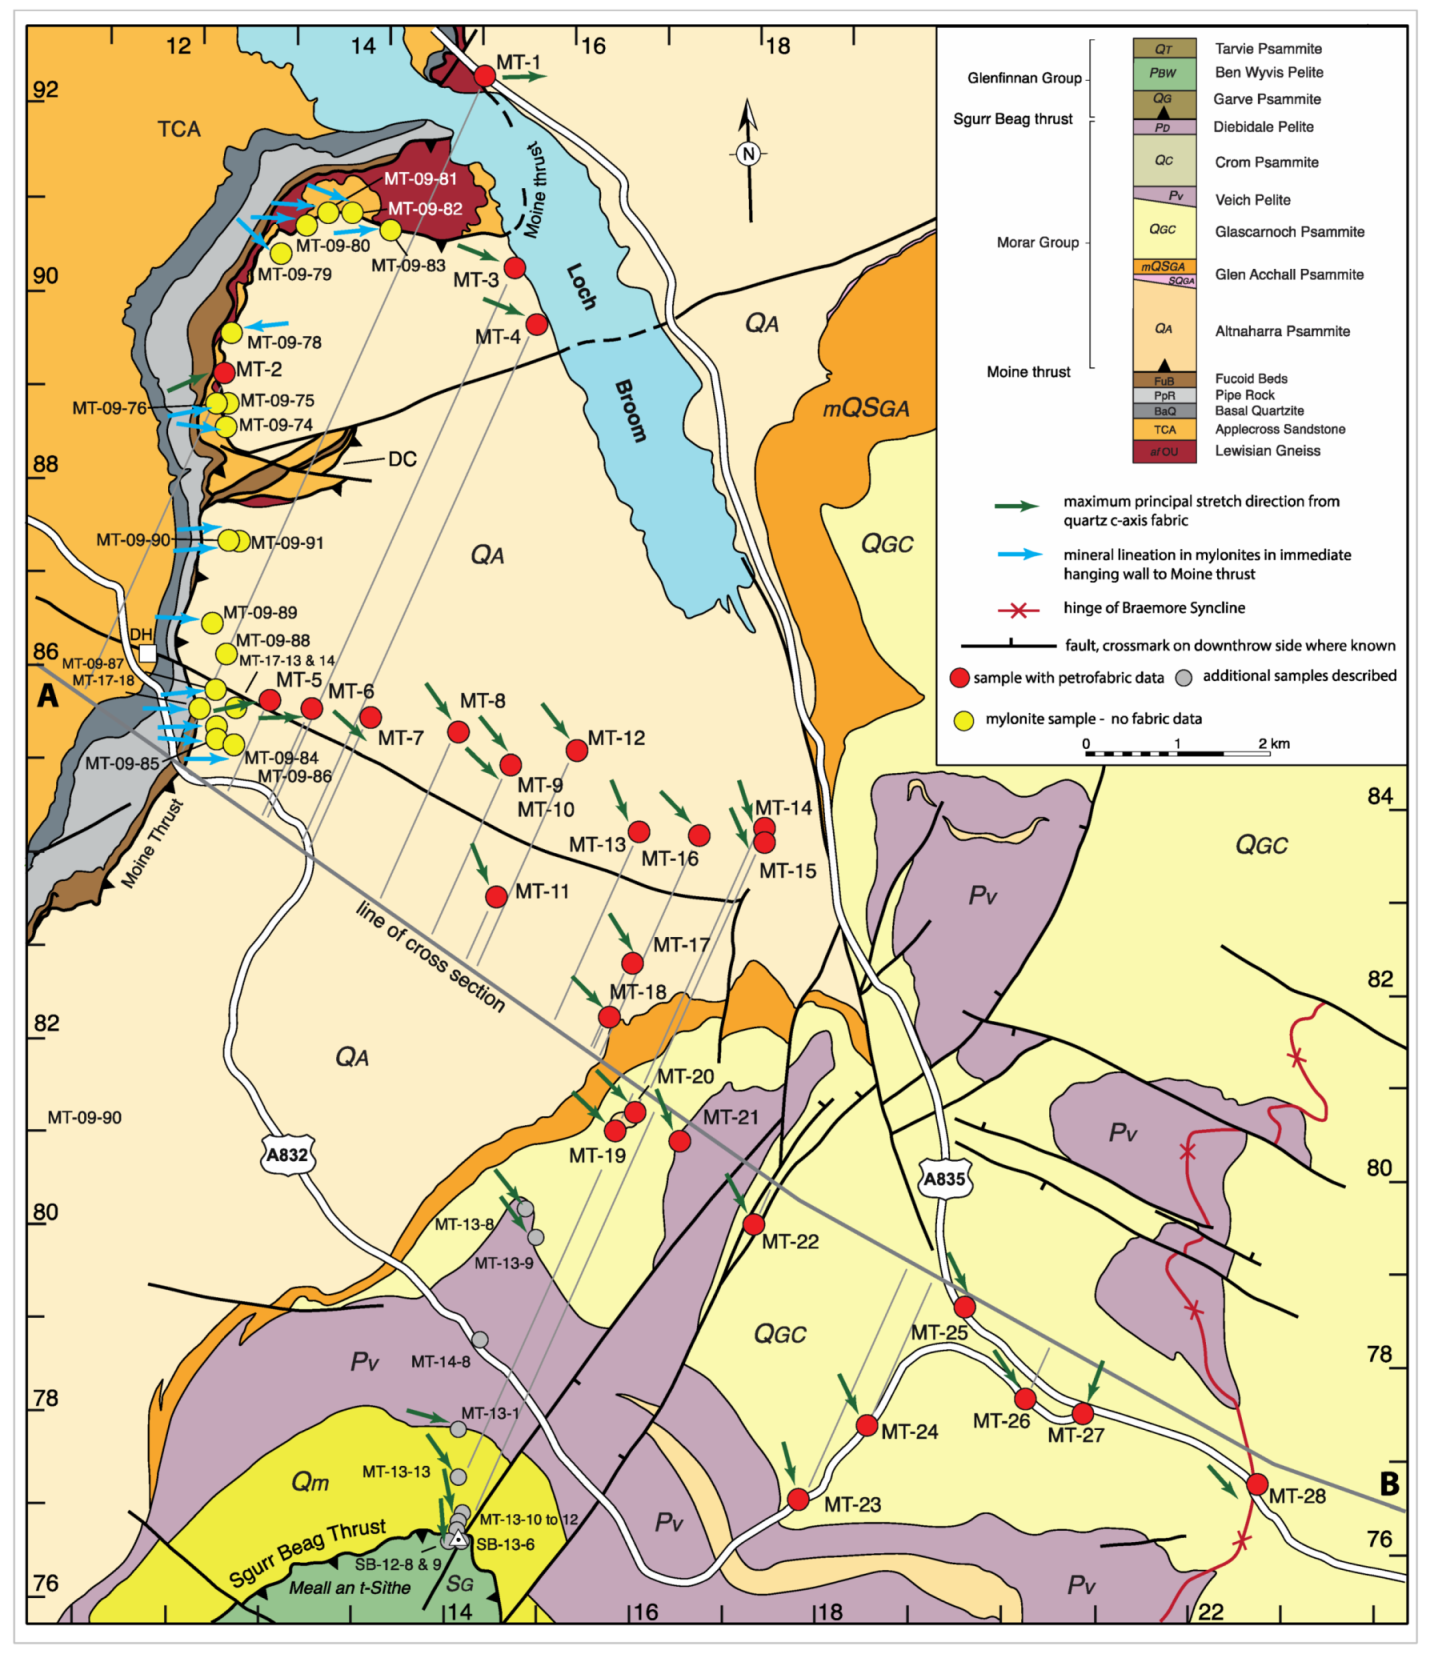
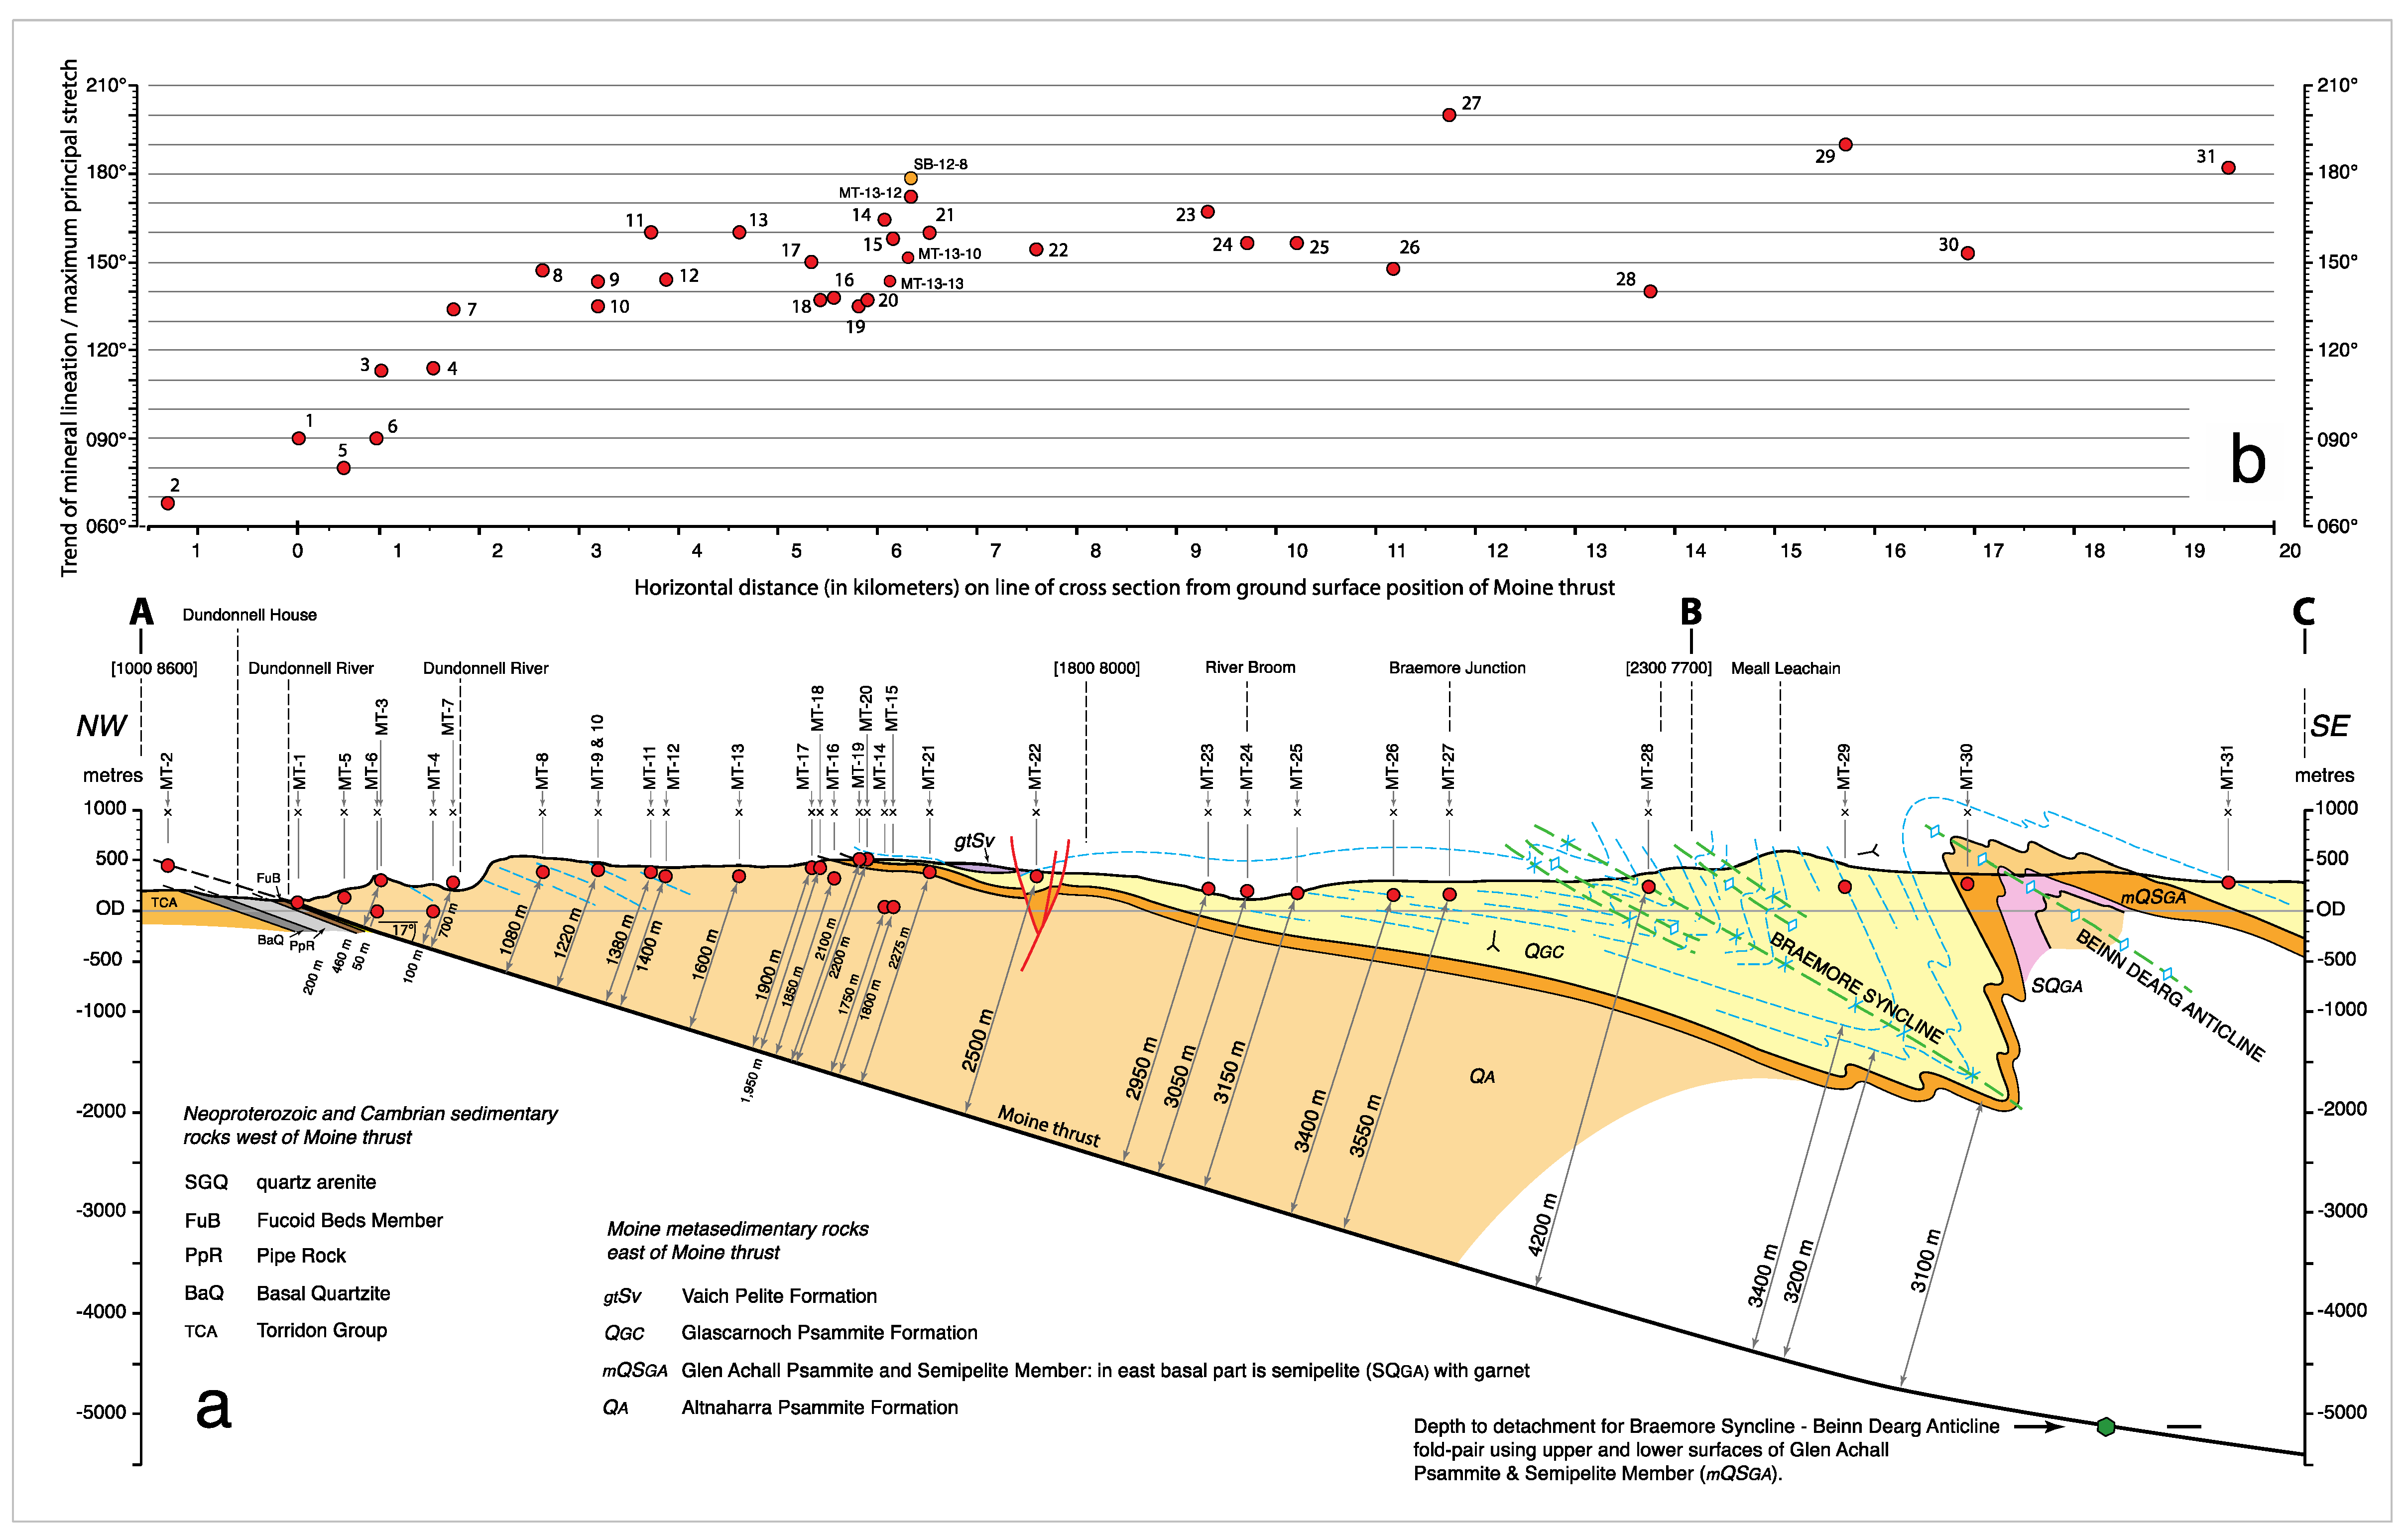
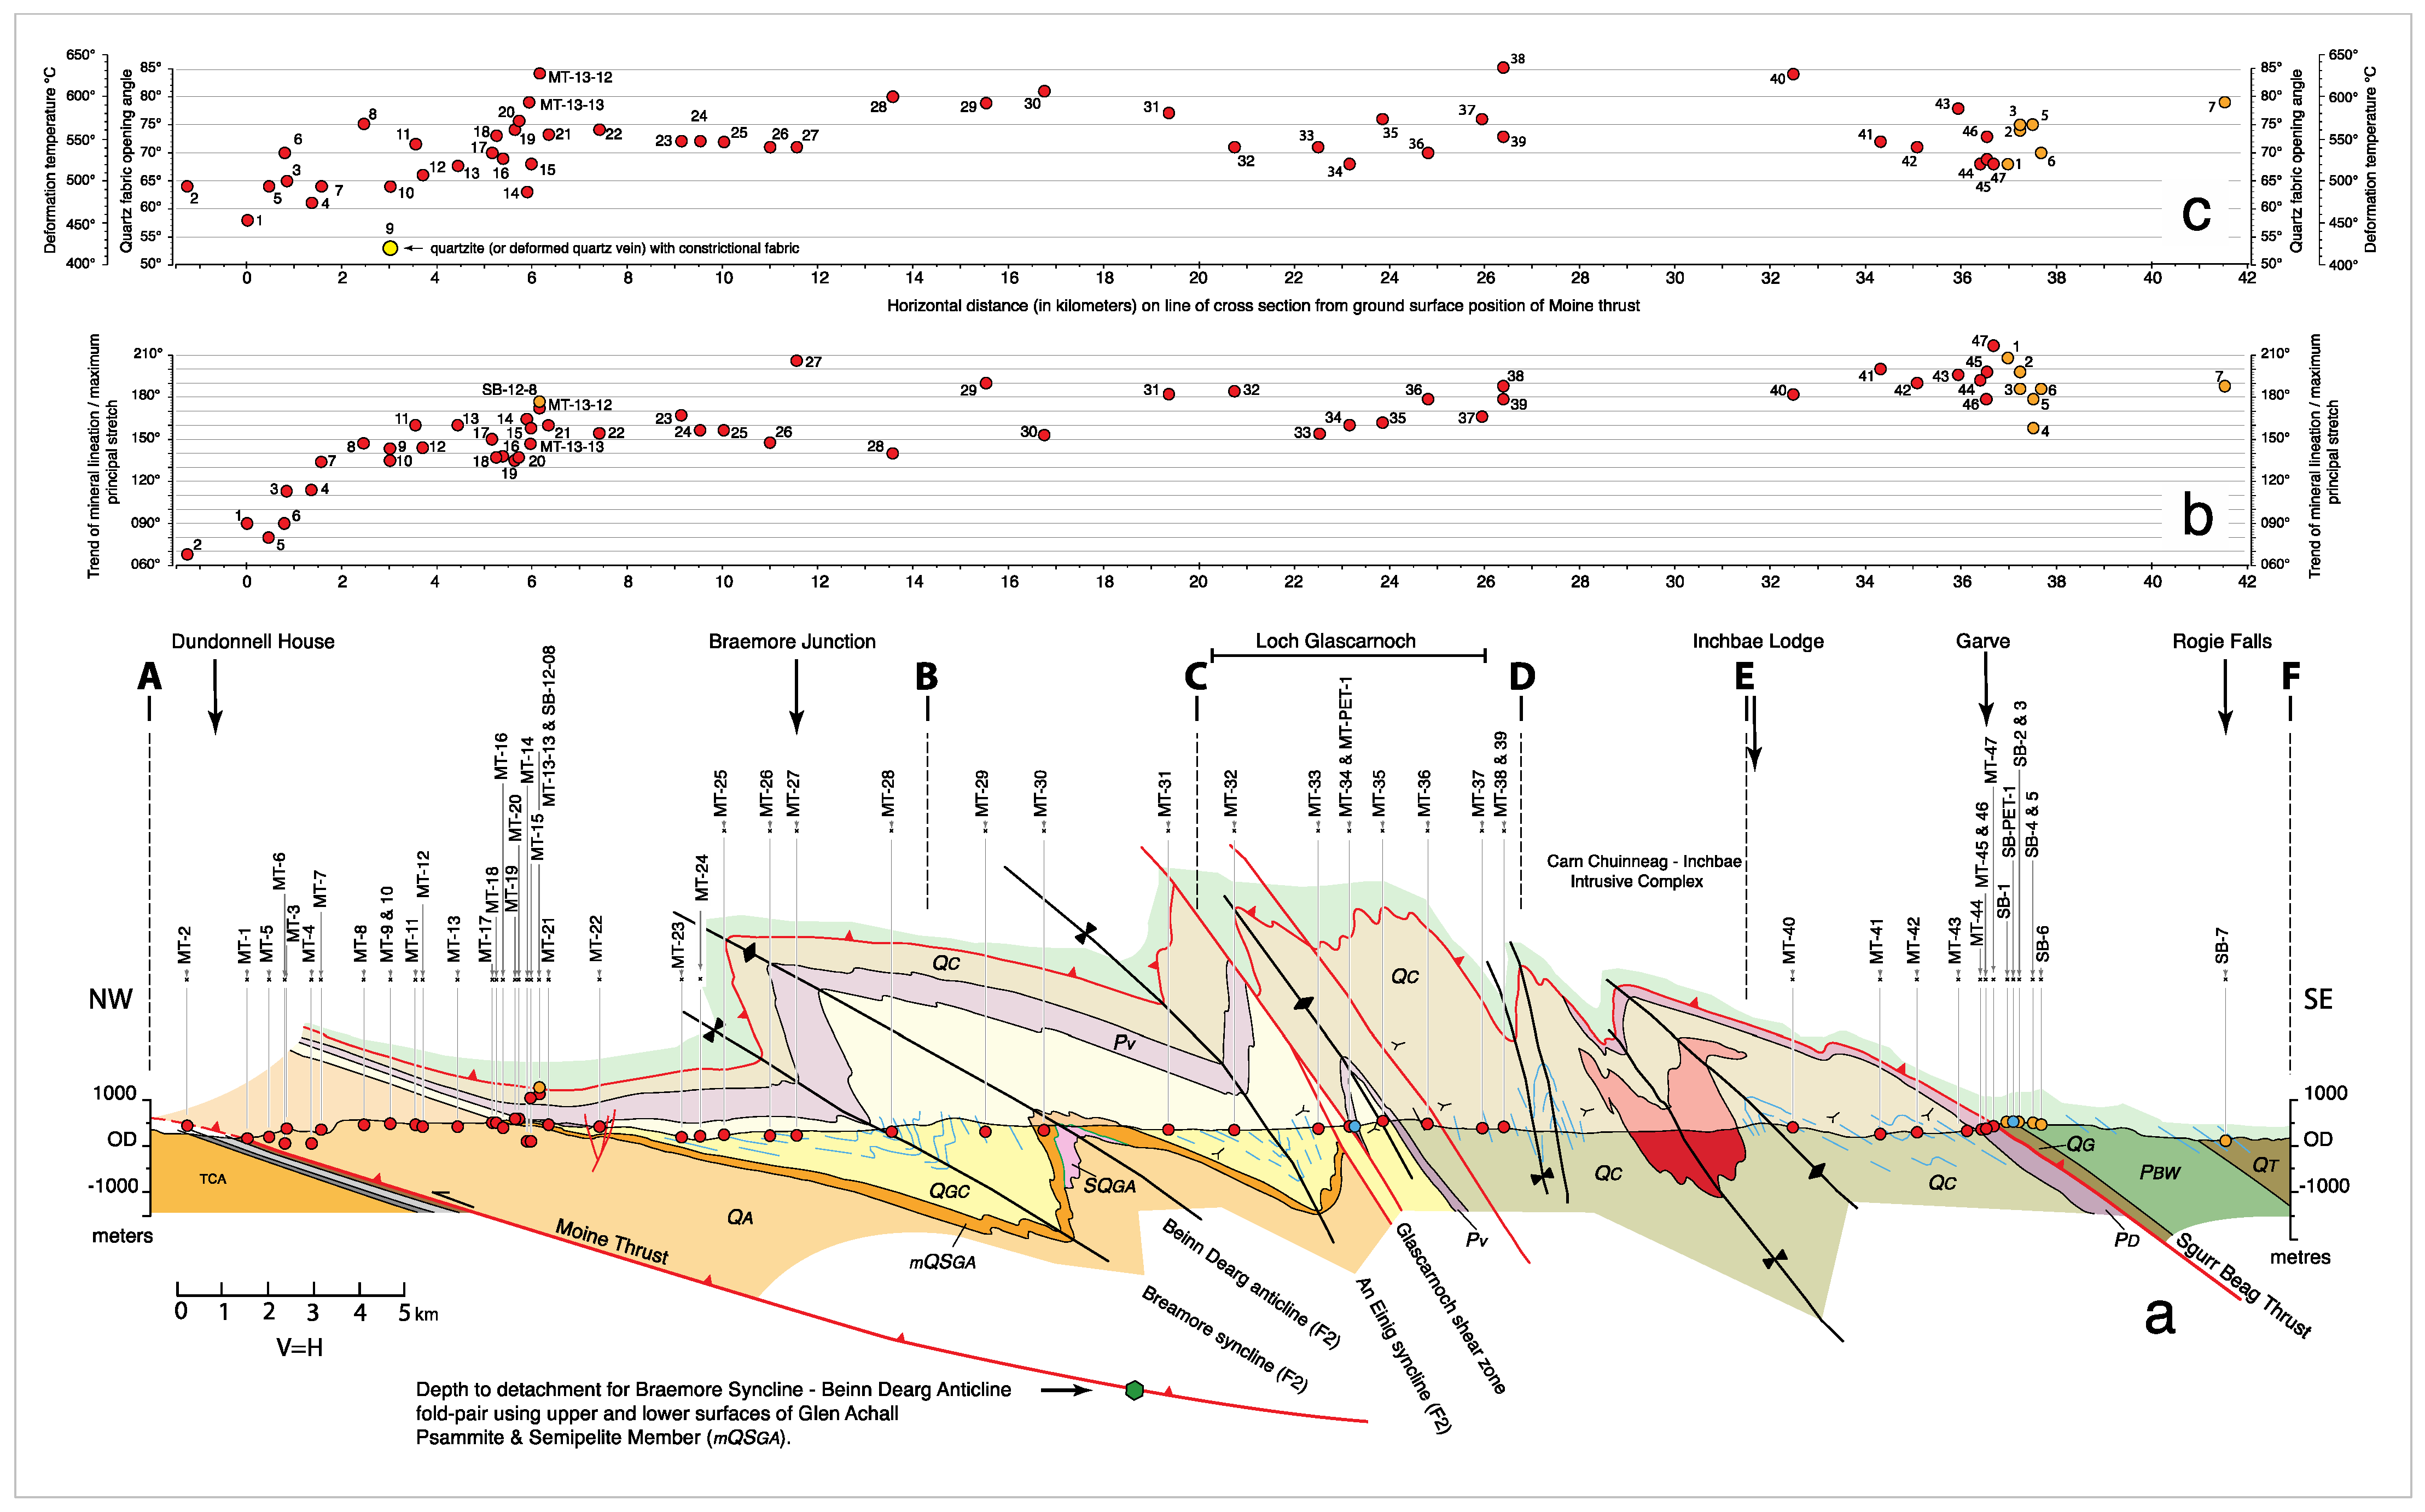
A suite of oriented samples was collected immediately (~1–5 m) above the Moine thrust exposed between the north shore of Loch Broom and near to Dundonnell House (Figure 3, red coded samples MT-1 and 2, plus yellow coded MT-09-74 to 91 series). Further oriented samples were then collected within the overlying Moine thrust sheet along a broad NW-SE transect between the thrust and the hinge of the Braemore Syncline, with sample numbers (MT-1 to MT-28) arranged in order of increasing structural distance above the thrust plane (see cross section in Figure 4). The estimated position of the Moine thrust at depth on this cross section is based on: (a) structure contours on the thrust surface in the western part of Area 1 reported by Elliott and Johnson [65] and Heaverlo [66] and, (b) depth to detachment calculations for the Braemore Syncline/Beinn Dearg Anticline fold-pair using the graphical methods of Epard and Groshong [67] and Bulnes and Poblet [68]. Both construction methods indicate a dip of ~16° to the SE for the thrust surface. Positions of individual samples were projected along-strike (025°) on to the cross section using the structure contours for the Moine thrust reported by Heaverlo [66]. Estimated structural heights of individual samples above the thrust, based on their projected positions on the cross section (Figure 4a), are also summarized in Supplementary File S1. Additional samples were also collected in a transect from the central part of the Moine thrust sheet into the overlying Sgurr Beag thrust sheet exposed on Meall an t-Sithe in the southwestern part of Area 1 (Figure 3).

4.1. Moine Thrust Plane: Dundonnell–Loch Broom

Mylonitic foliation in oriented samples collected close to the underlying Moine thrust is defined by a planar alignment of white mica, chlorite and ribbon-like domains of dynamically recrystallized quartz. Further petrographic and microstructural details are given in the next section of this paper. In most samples collected immediately (1–5 m) above the thrust, mylonitic foliation in the Moine metasedimentary rocks is well preserved with only very limited microstructural evidence (samples MT-09-79, 84 and 90) for later thin section scale fracturing and disruption of the foliation. Intense fracturing and grain size reduction by cataclasis is observed in sample MT-09-76 in which original coarse-grained intergrowths of plastically deformed plagioclase feldspar and quartz are broken up into rectangular fault blocks. These samples may represent slivers of underlying Lewisian gneiss (Figure 3) that have been incorporated into the Moine mylonites during thrusting.
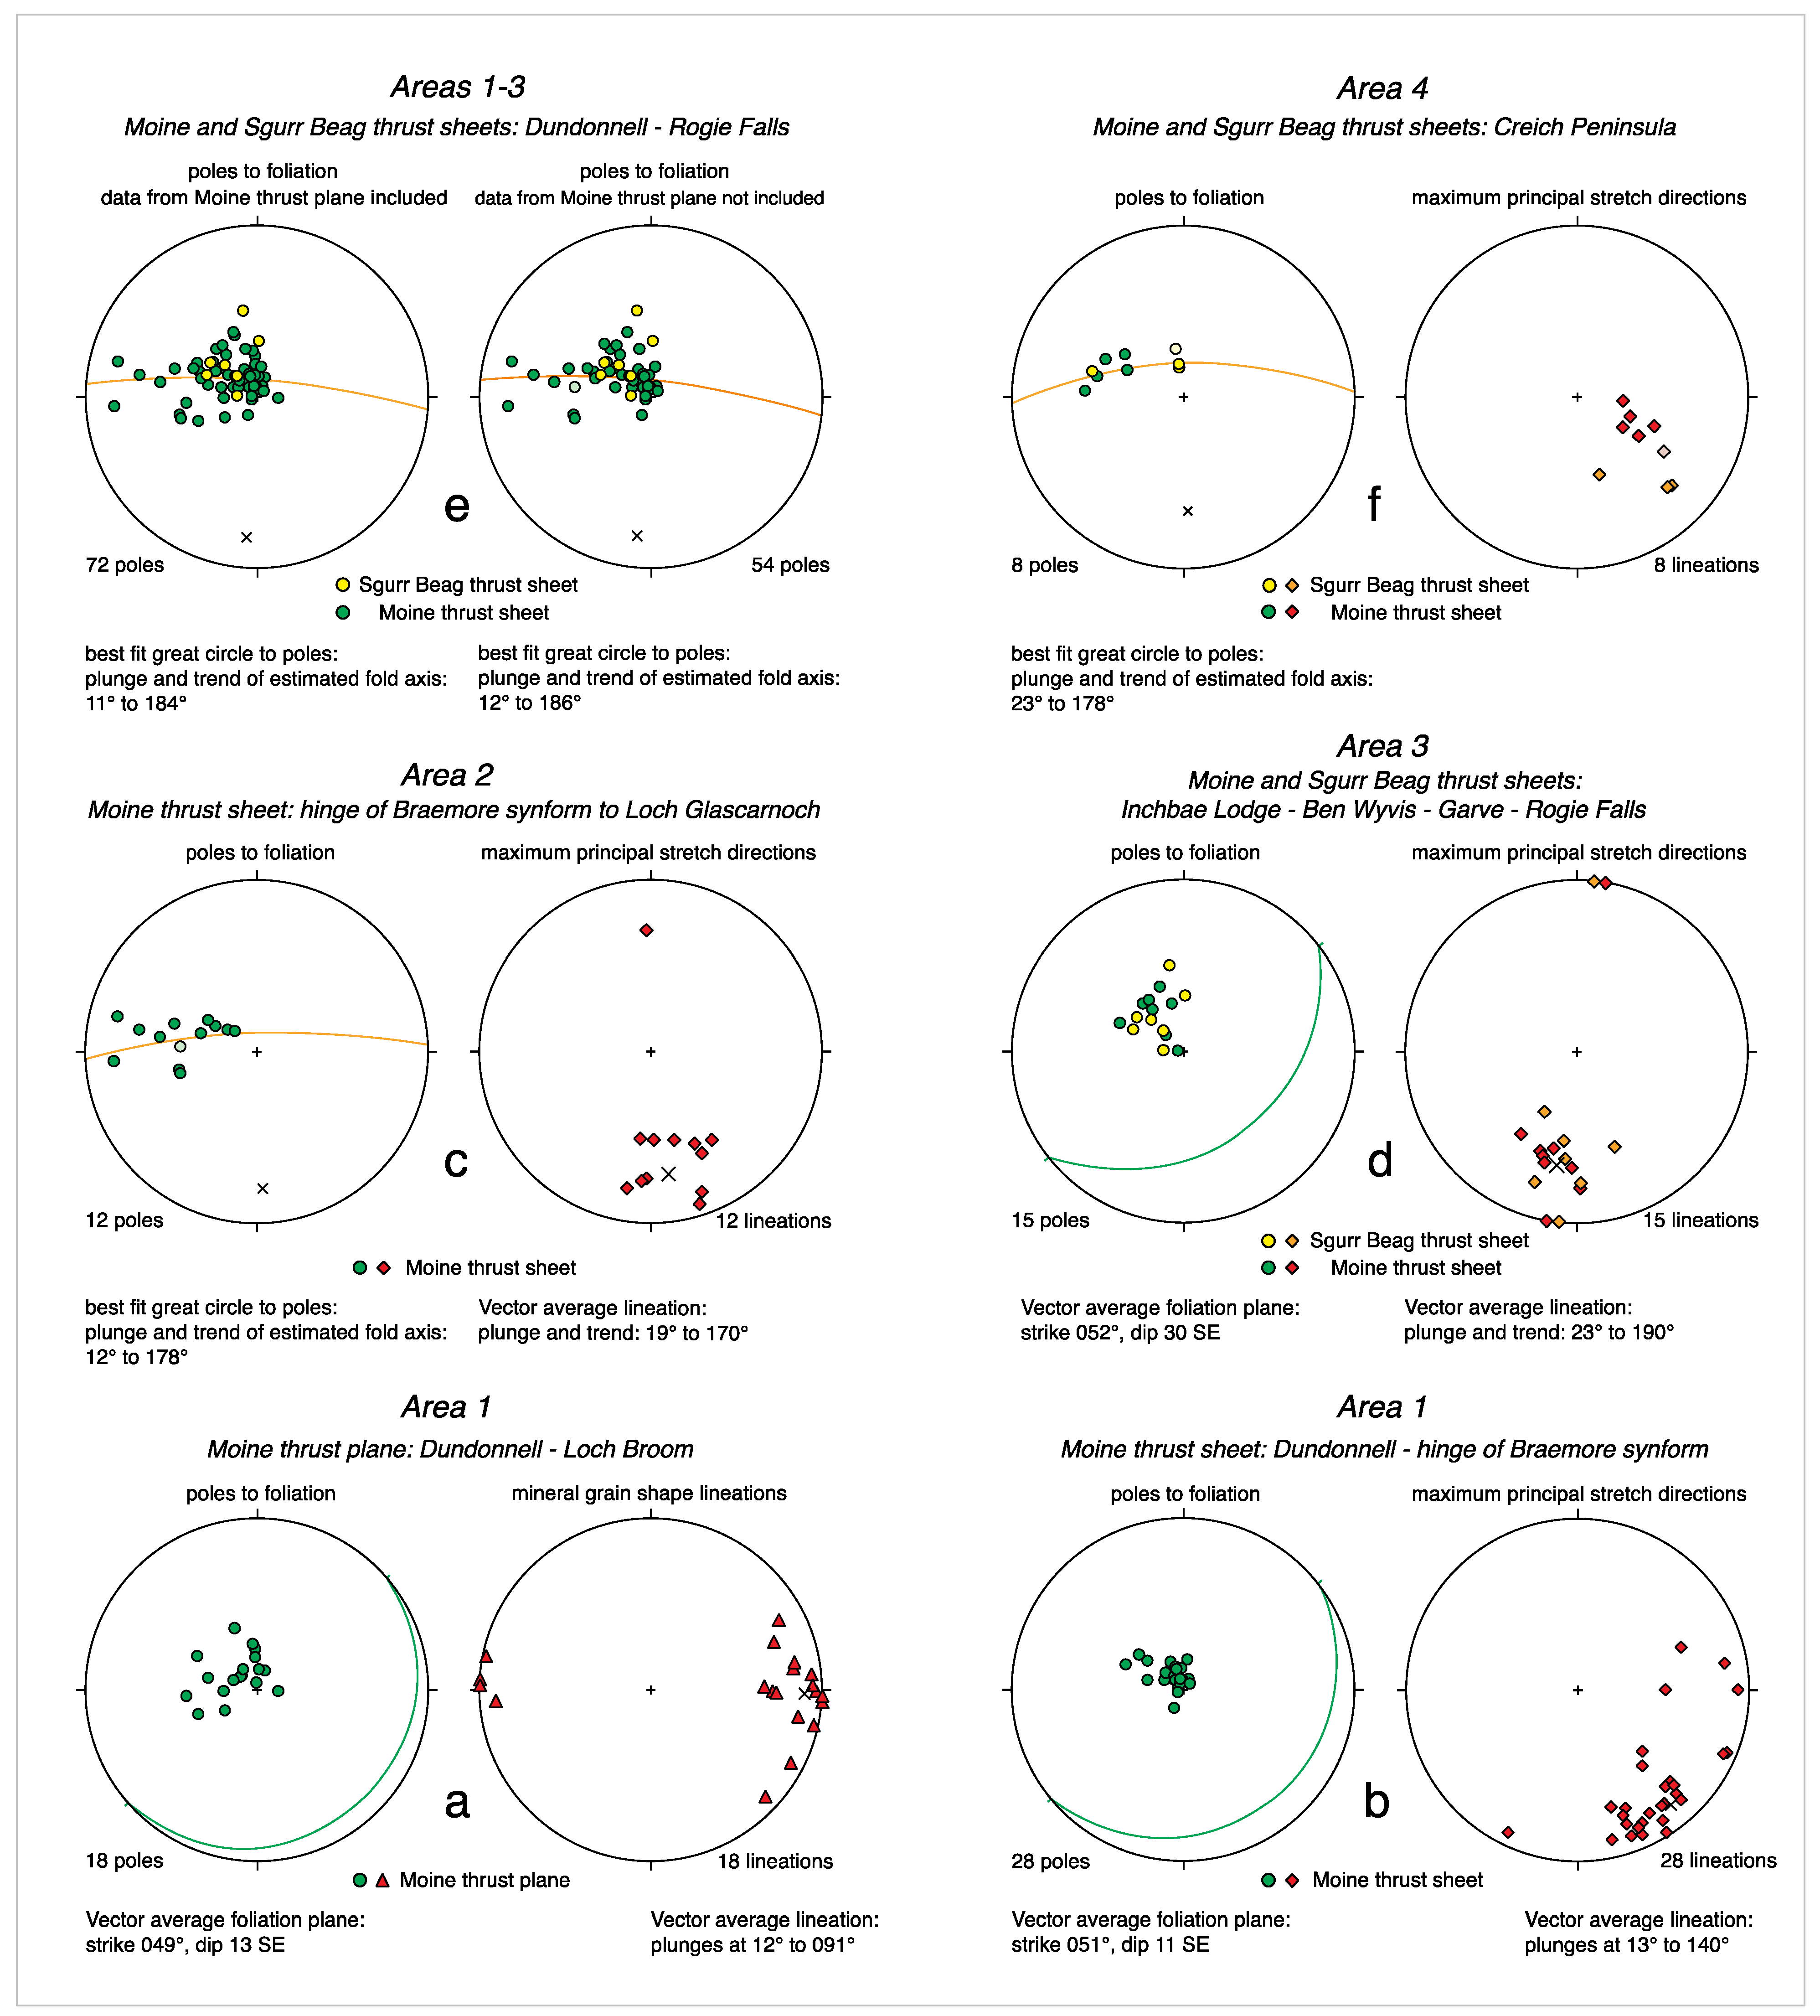
Mylonitic foliation in oriented samples adjacent to the underlying Moine thrust has a vector average strike of 049° and dip of 13° to the SE (Figure 5a) which is very similar to the estimated dip of the thrust plane (16°) at depth beneath Area 1 (Figure 4a). Mineral stretching lineations lying within the foliation vary in trend from 068° to 136° (samples MT-02 and MT-09-79 in most foreland-positioned exposures of Moine thrust (Figure 3 and Figure 4b) with a vector average plunge and trend of 12° towards 091° (Figure 5a).

4.2. Moine Thrust Sheet: Dundonnell–Hinge of Braemore Syncline

Within the ~4 km thick structural sequence of Moine metasedimentary rocks located between the Moine thrust and the hinge of the Braemore Syncline (Figure 4a) foliation dips gently to the SE (vector average strike and dip of 051/11° SE; Figure 5b) subparallel to the underlying Moine thrust, and lineation lying within the foliation changes from W-E to N-S in trend with both increasing height above the thrust and more hinterland-positioned location (Figure 4b). Although beyond the scope of the sampling transect covered in this paper, lineation and maximum principal stretch directions indicated by quartz c-axis fabrics in the uppermost part of the Moine thrust sheet exposed on Meal an t-Sithe at the southwestern corner of Area 1 (Figure 3) also display a progressive swing in lineation trend from SE to SSE to S approaching the overlying klippe of the Sgurr Beag thrust sheet, with lineations/principal stretch directions both in the immediate footwall and hanging wall of the Sgurr Beag thrust trending 178°.

4.2.1. Microstructures and Petrography

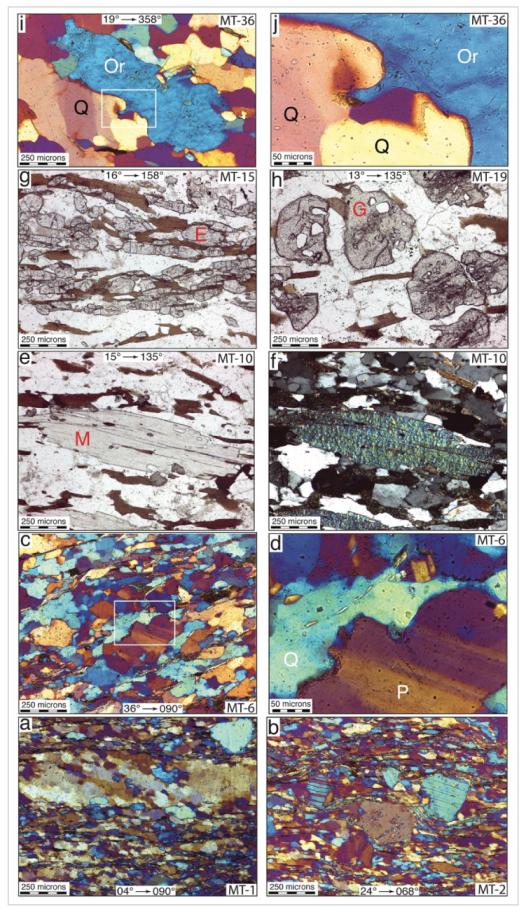
With increasing structural distance above the Moine thrust (and associated transition to more hinterland-positioned locations; see sample locations on cross section in Figure 4) recrystallized quartz grain size increases, feldspars are deformed plastically, grain boundary migration recrystallization microstructures develop in both quartz and feldspar and shape fabrics become less platy and more granular. Microstructures and mineral phases that potentially provide information on changing deformation conditions (e.g., temperature, strain rate) are summarized in Figure 6.
As noted above, immediately (1–5 m) above the Moine thrust the Moine metasedimentary rocks (e.g., samples MT-1 and MT-2) are characterized by a mylonitic foliation that is defined in thin section by a planar alignment of white mica, chlorite and ribbon-like domains of dynamically recrystallized quartz (Figure 7a,b). Microstructures in these ribbons (e.g., samples MT-1, MT-2) indicate that quartz has dynamically recrystallized by subgrain rotation (SGR), with grain size ranging from 40–50 microns (Figure 8a). Microstructural evidence for grain boundary bulging (BLG) recrystallization of quartz is limited to a few quartz-quartz grain boundaries. (e.g., MT-2). Equant to elongate clasts of orthoclase and plagioclase feldspar, together with more equant clasts of epidote in some samples, are scattered throughout the much finer-grained matrix of quartz and white mica which anastomoses around these clasts (Figure 7b). Extensional crenulations and shear bands, plus alignment (Sb) of elongate dynamically recrystallized quartz grains in the quartz ribbons oblique to the mylonitic foliation, are all consistent with a top to the W shear sense.
For quartz, SGR is the dominant recrystallization mechanism in samples MT-1 to MT-5 at ~1–200 m above the thrust and is accompanied by minor amounts of BLG recrystallization between some larger quartz grains in quartz-rich lenses and ribbons. Relative timing of formation of the SGR and BLG microstructures is uncertain. Microstructural evidence for both SGR and grain boundary migration (GBM) recrystallization of quartz is found in samples MT-6 to MT-10 at 460–1220 m above the thrust (Figure 7c,d) with a switch from SGR to GBM being the dominant recrystallization microstructure with increasing distance above the thrust. The size of quartz grains produced by GBM recrystallization is strongly controlled by the local presence of other mineral grains such as mica and feldspar due to grain boundary pinning effects (Figure 7a), but the presence of minute foliation-parallel mica flakes in some of the larger quartz grains (MT-6, Figure 7d) indicates that quartz grain boundaries were able to migrate past at least the smallest second phase particles. At structural distances of 1380–4200 m above the thrust (samples MT-11 to MT-28) GBM appears to be the dominant mechanism by which quartz has recrystallized in mica- and feldspar-rich samples, and occasional ‘dissection’ microstructures between adjacent quartz grains [71], also referred to as ‘left-over grain’ or ‘island grain’ microstructures [72,73], indicate high mobility of quartz grain boundaries (e.g., MT-14 at 1750 m), although patchy extinction and incipient subgrain microstructures are still observed in some larger quartz grains in samples dominated by GBM. The spacing and orientation of micas and feldspar grains continues to control the size and shape of quartz grains, but in almost pure quartz samples (quartzites MT-9 and MT-11) highly mobile grain boundaries have resulted in much coarser grain size and more granular shape fabrics compared with adjacent more mica-rich samples.
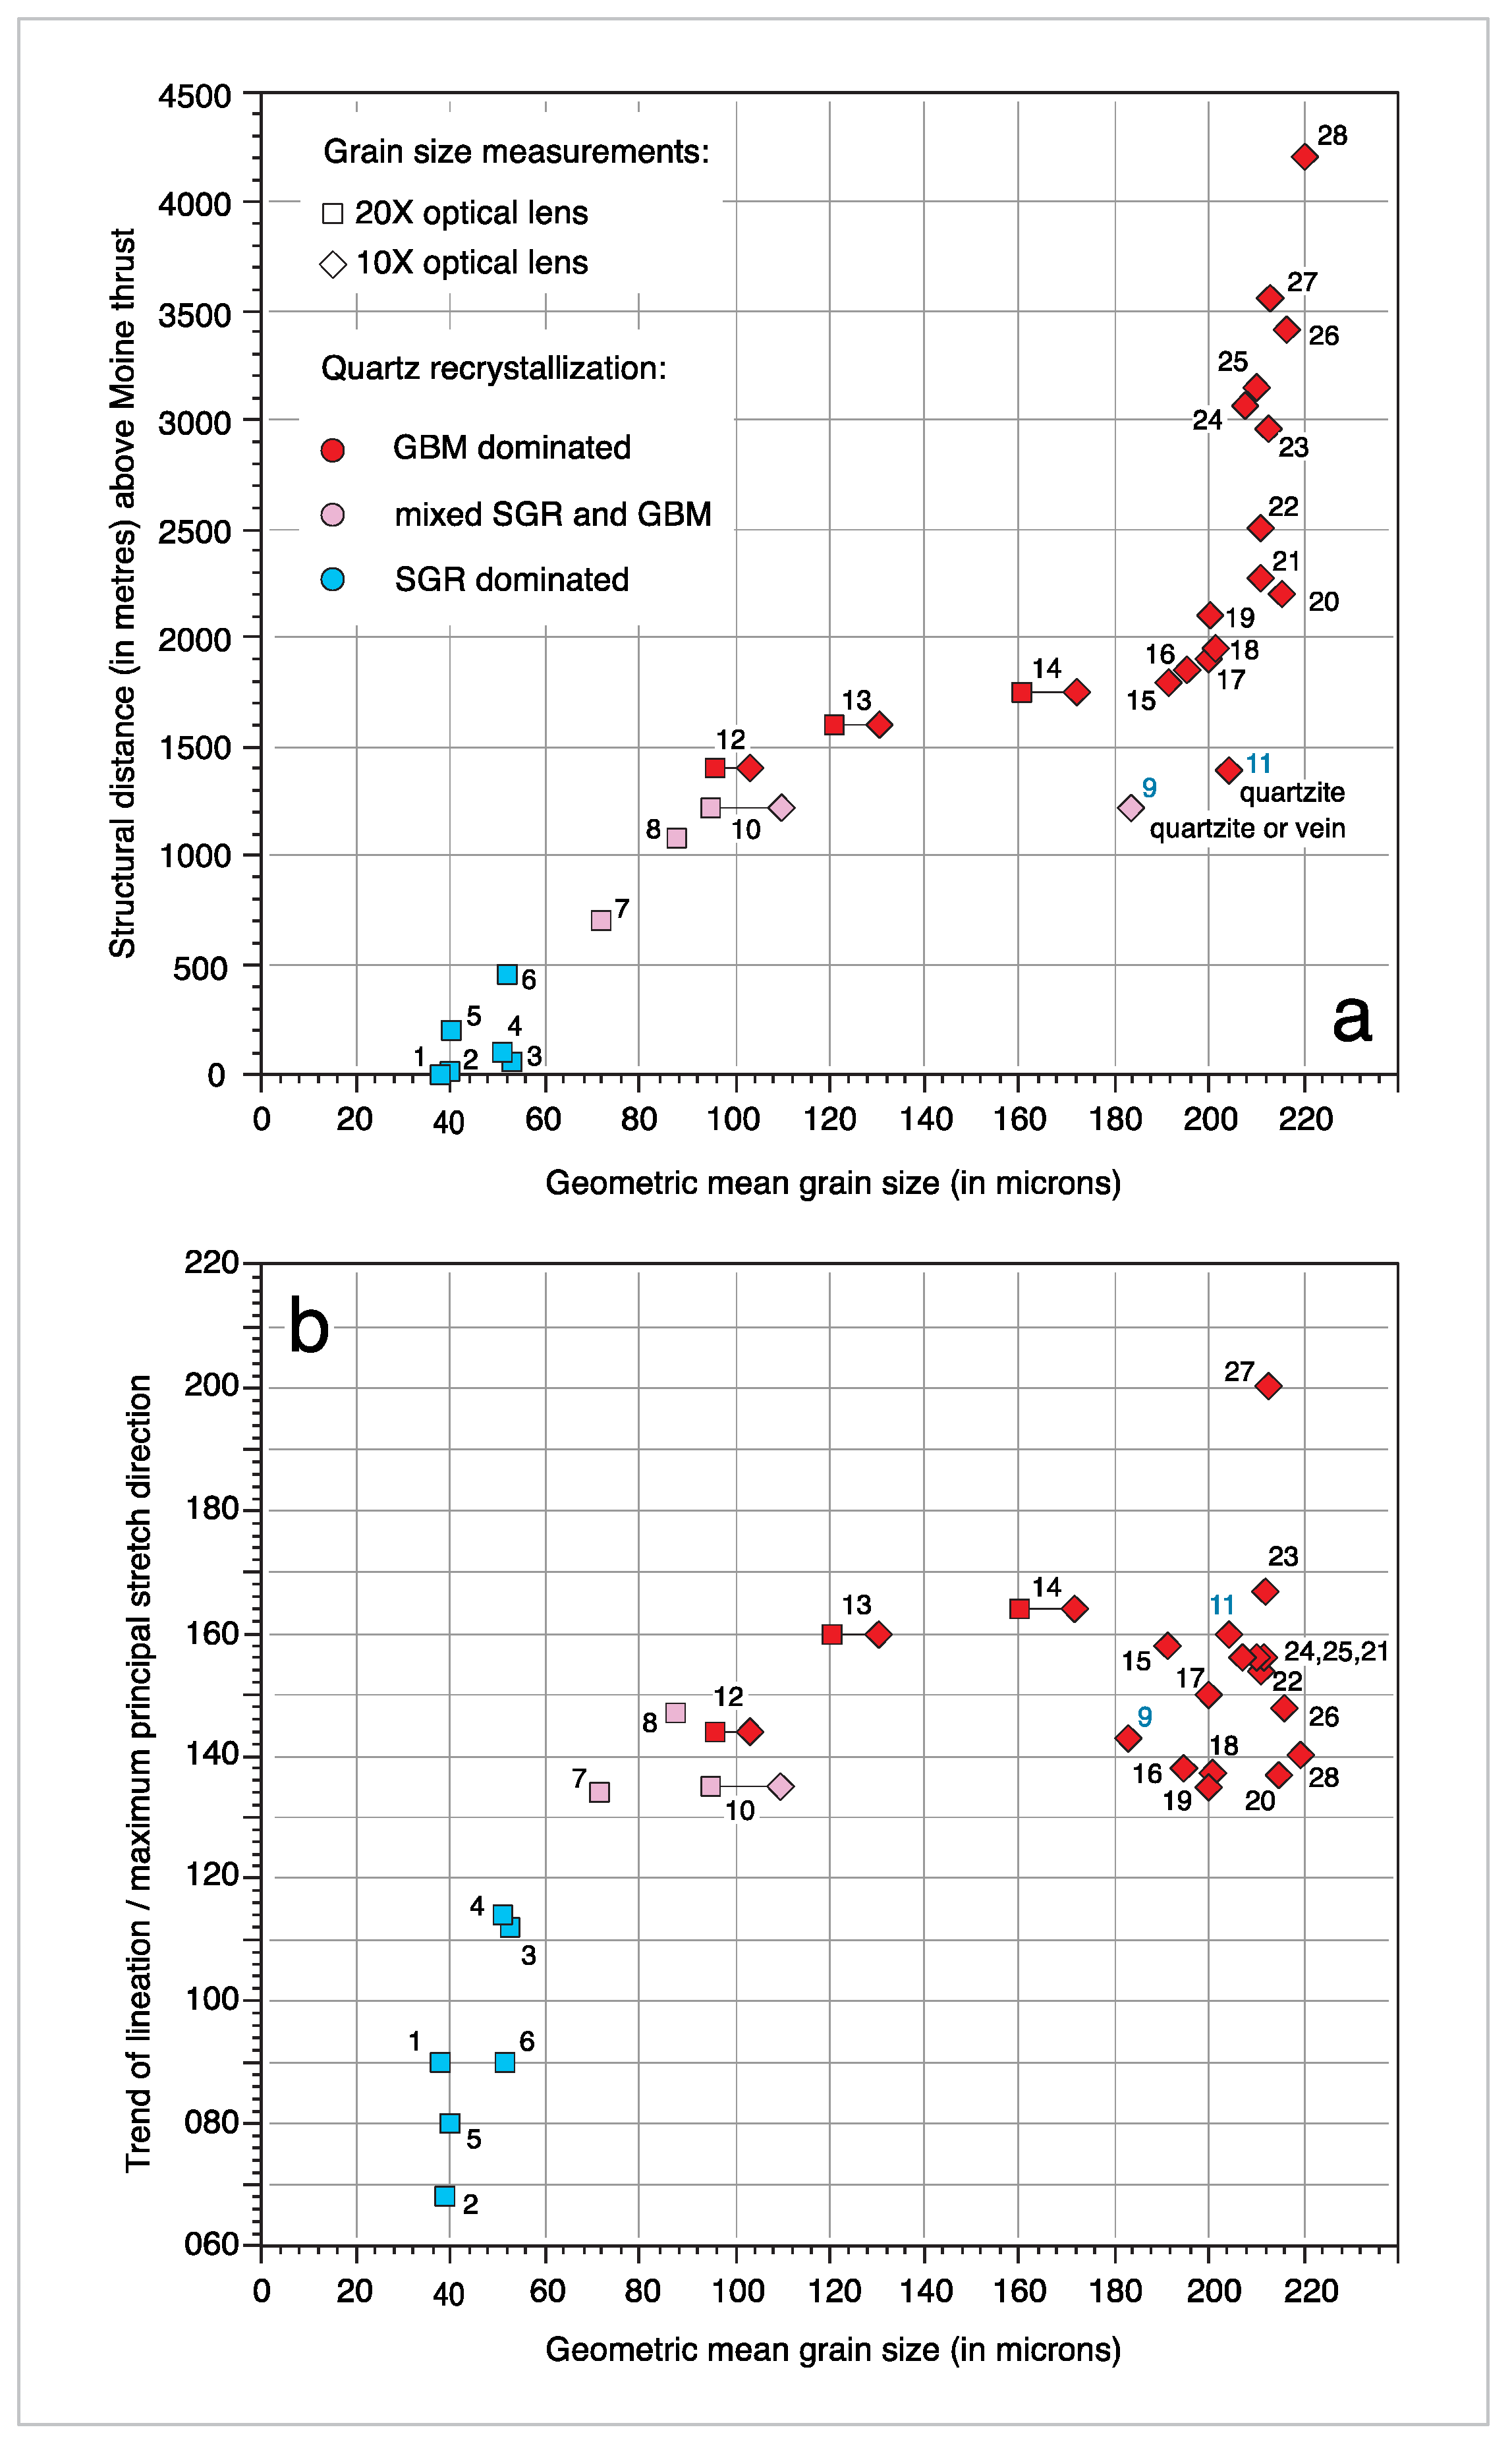
Grain size of recrystallized quartz (measured in quartz-rich domains with minimal grain boundary pinning) increases from 40 to 50 microns immediately above the thrust (samples MT-1 to MT-3) to 220 microns (MT-28) at 4200 m above the thrust (Figure 8a). The most rapid increase in quartz grain size in mica- and feldspar-rich samples is observed between ~1400 m (MT-12) and 1800 m (MT-15) above the thrust where grain size abruptly increases from 100 to 200 microns. This abrupt change in recrystallized grain size coincides with the transition from mixed SGR and GBM to dominant GBM microstructures (Figure 6) and occurs over lineation/maximum principal stretch direction trends ranging from ~135° to 160° (Figure 8b). As will be discussed below, this grain size change may mark the position of a previously unrecognized fault zone. However, an almost identical abrupt change in recrystallized quartz grain size (100–200 microns) and transition in microstructures has previously been documented by Stipp et al., [73,74] in the sheared aureole of the Adamello pluton in the Italian Alps, suggesting that this abrupt change in grain size could be associated with the changing dominant recrystallization mechanisms, rather than marking a change in tectonic regime. At distances greater than 2000 m above the thrust, quartz recrystallized grain size remains fairly constant at 200–220 microns (Figure 8a).
Close to the underlying Moine thrust feldspar behaves rigidly, with equant to elongate clasts composed of single grains of either orthoclase or plagioclase surrounded by an anastomosing matrix of much finer grained quartz and white mica (Figure 7a). The elongate feldspar clasts range from foliation parallel to foliation perpendicular in orientation. No microstructural evidence (e.g., undulose extinction or subgrain development) for crystal plastic deformation has been found in these feldspar clasts which appear to have rotated as rigid objects within the surrounding matrix of plastically deforming and recrystallizing quartz and white mica. At 460 m above the thrust (sample MT-6) smaller clasts of plagioclase exhibit incipient undulose extinction, twin planes in elongate clasts of plagioclase oriented at a high angle to foliation are kinked parallel to foliation, and some plagioclase grains have lobate boundaries against adjacent quartz grains (Figure 7c,d), all indicating at least limited plasticity of feldspar. At 700 m (MT-7) undulose extinction and subgrains are present in orthoclase clasts, and by 1220 m above the thrust (MT-10) orthoclase forms elongate grains oriented parallel to foliation, with lobate boundaries against adjacent quartz grains, and appears to be fully deforming plastically. At ≥1600 m above the thrust (samples MT-13 to MT-28) feldspar and quartz form an interlocking mosaic of grains with grain scale sinuous/lobate grain boundaries indicating high mobility of feldspar and quartz grain boundaries. Myrmekite growth is observed in orthoclase grains in all samples (MT-22 to MT-28) at ≥2500 m above the thrust (Figure 6).
White mica and to a lesser extent chlorite are foliation-defining mineral phases in metasedimentary rocks immediately above the Moine thrust. White mica is present throughout the structural section. Biotite first appears at ~100–150 m above the thrust (samples MT-09-85 and 86, MT-17-13 and 14) forming minute dull red pleochroic intergrowths with white mica and chlorite. Distinct individual grains of foliation-parallel fresh (unaltered) brown-red pleochroic biotite first appear at 460 m above the thrust (Figure 6) in sample MT-6. At higher structural positions biotite is present in most samples, but while being well preserved in some samples (Figure 7e,f) is highly chloritized in other samples suggesting localized fluid flow and alteration at different structural levels.
Epidote is commonly present as a minor mineral phase throughout the structural sequence. Epidote grains are particularly concentrated in quartz-rich layers of samples MT-9 and MT-15 at 1220 and 1800 m, respectively, above the thrust. Individual grains in these samples have anomalous pale-dark blue interference colors and parallel extinction in elongate grains (Figure 7g). Variation in garnet grain shape morphology within the Moine thrust sheet (anhedral) in Area 1, together with the overlying klippen of the Sgurr Beag thrust sheet located to the south (subhedral-euhedral), has been documented by Ashley et al., (2017 [75], their Figure 3). Garnet is rarely observed in samples from the lower part of our structural transect across Area 1. A few euhedral grains with inclusion-rich cores are present in MT-15 and growth of 100–300-micron size equally spaced garnets, many with well-defined crystal faces and large-puddle-like inclusions of quartz (Figure 7h), are prolific in MT-19 at 2100 m above the thrust. Skeletal garnets are present in samples MT-20 to MT-28 at 2200–4200 m above the thrust. These skeletal morphologies could potentially be associated with either resorption of older garnet or incipient growth of new garnet; the absence of reaction products surrounding these skeletal grains suggests that growth of new garnet is the more likely interpretation (Mark Caddick, pers. comm. 2020).

4.2.2. Quartz c-Axis Fabrics and Microstructural Shear Sense Indicators

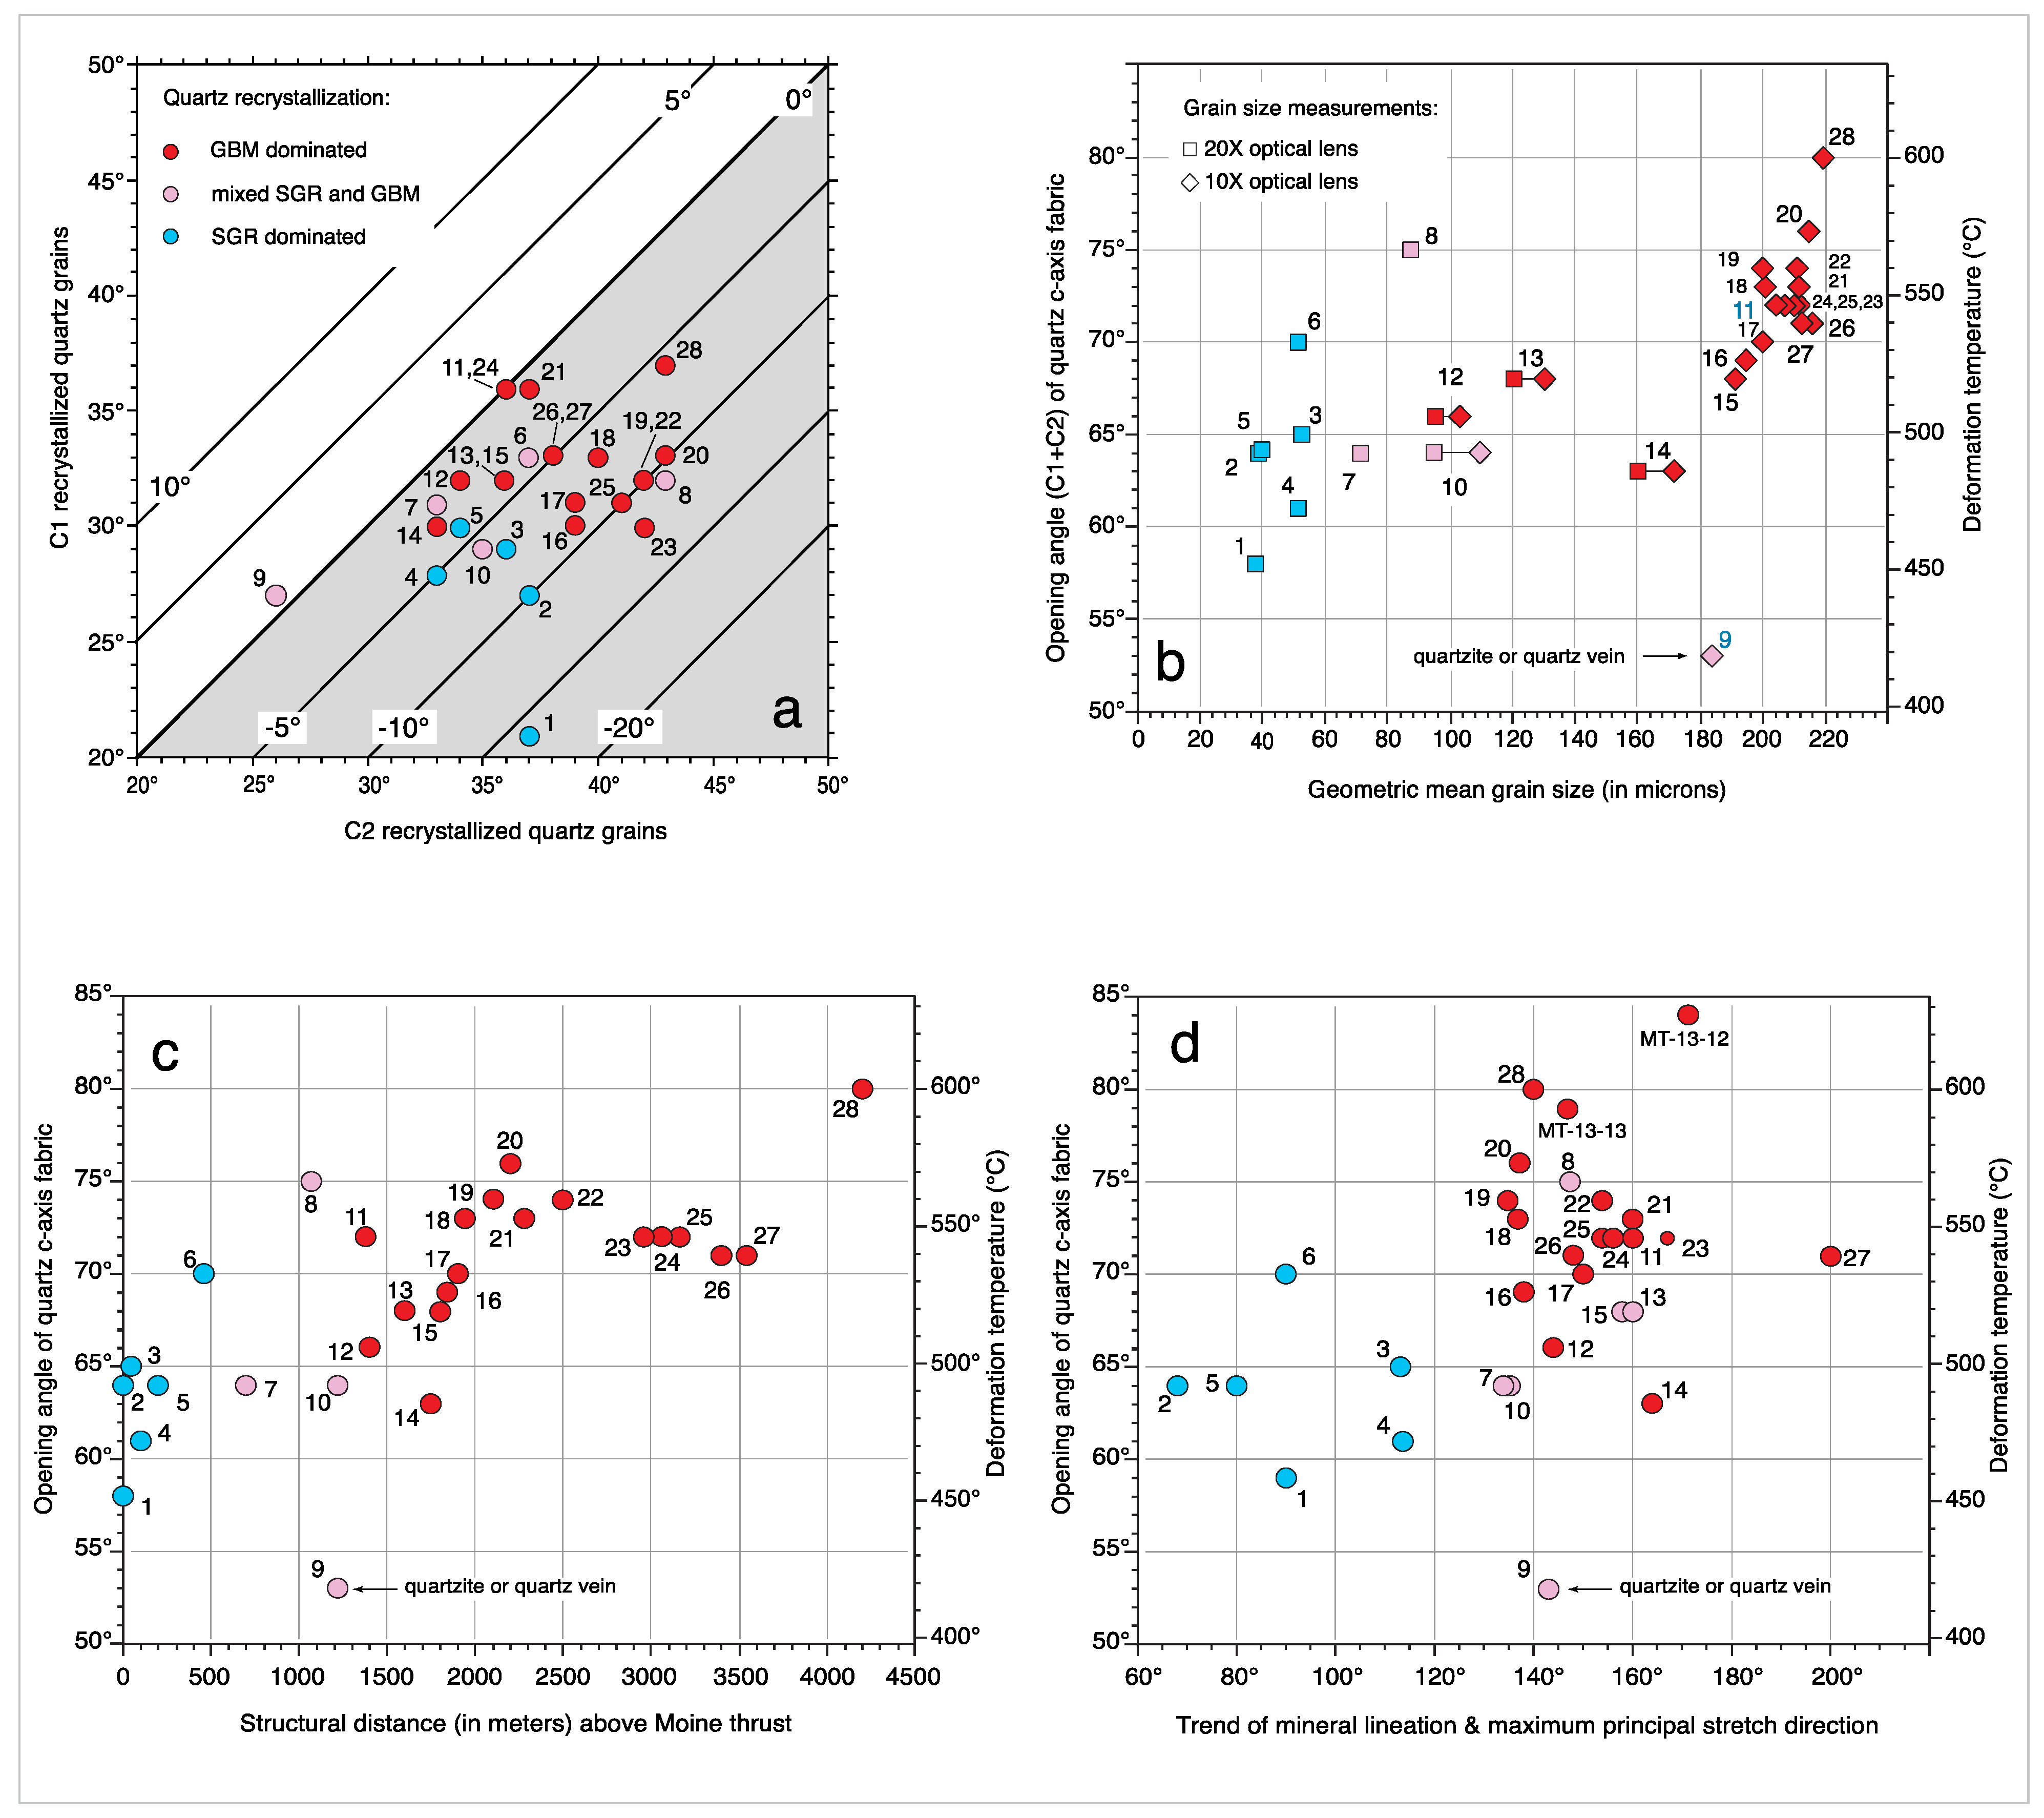
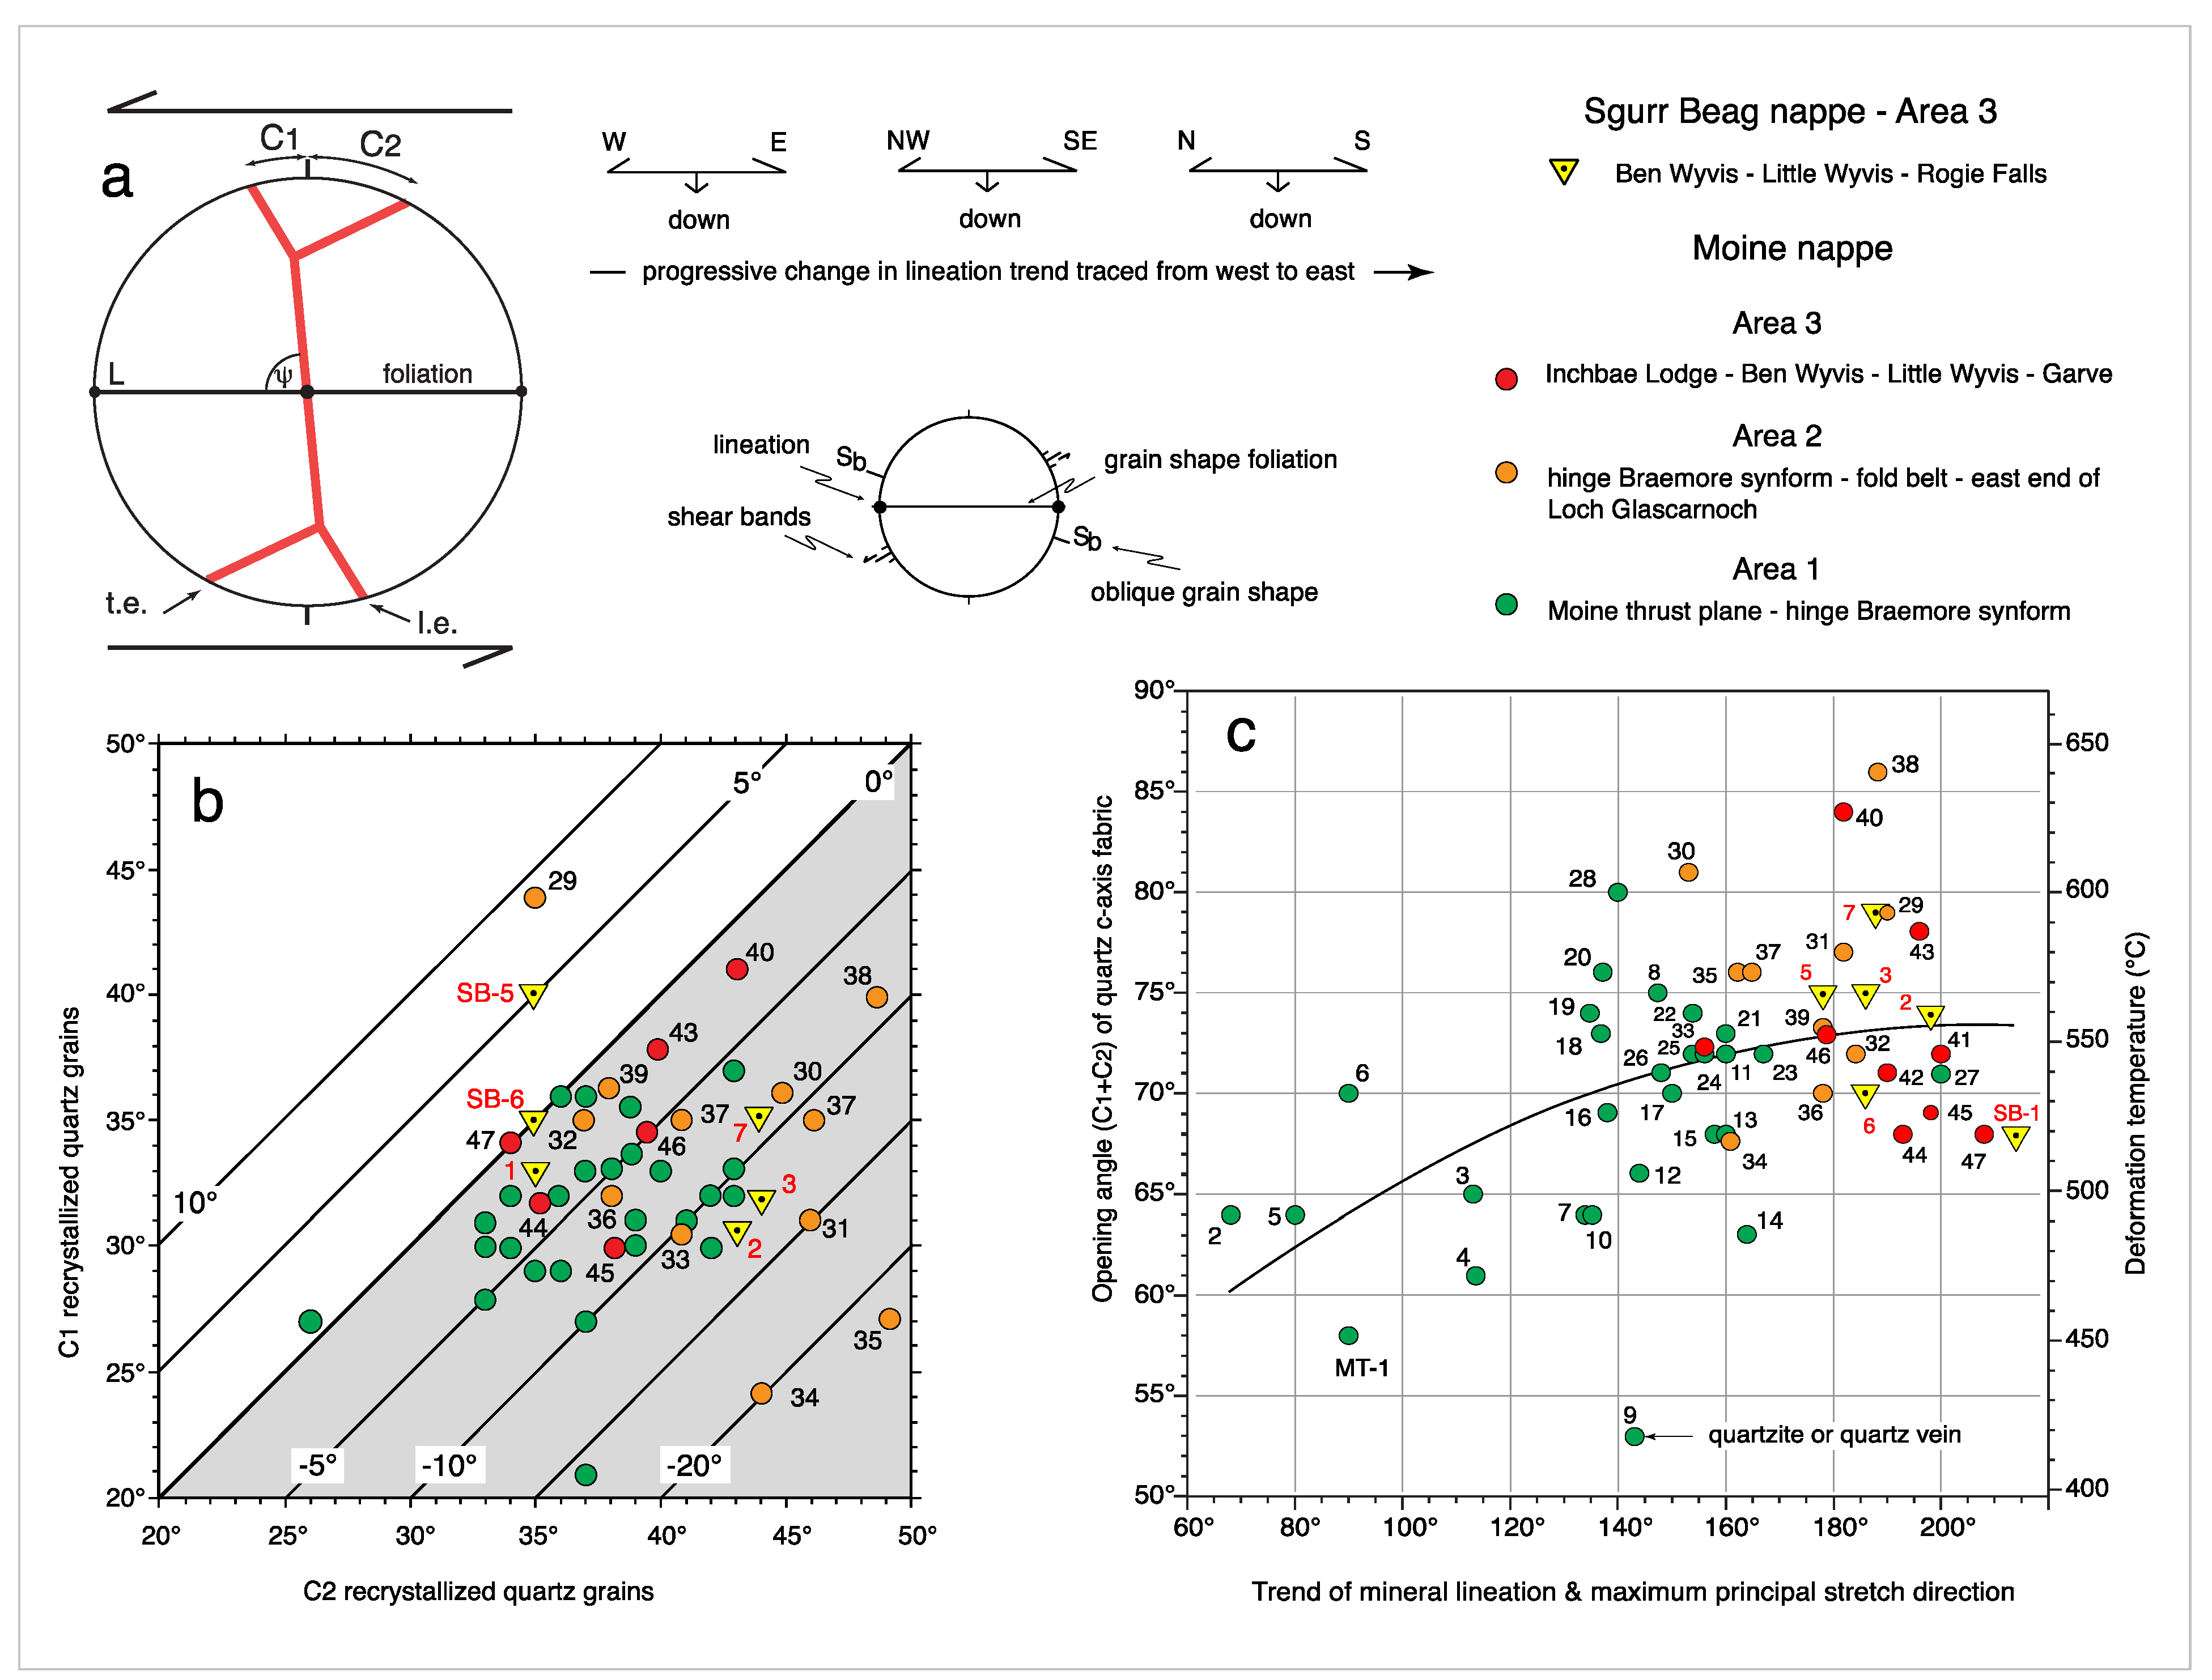
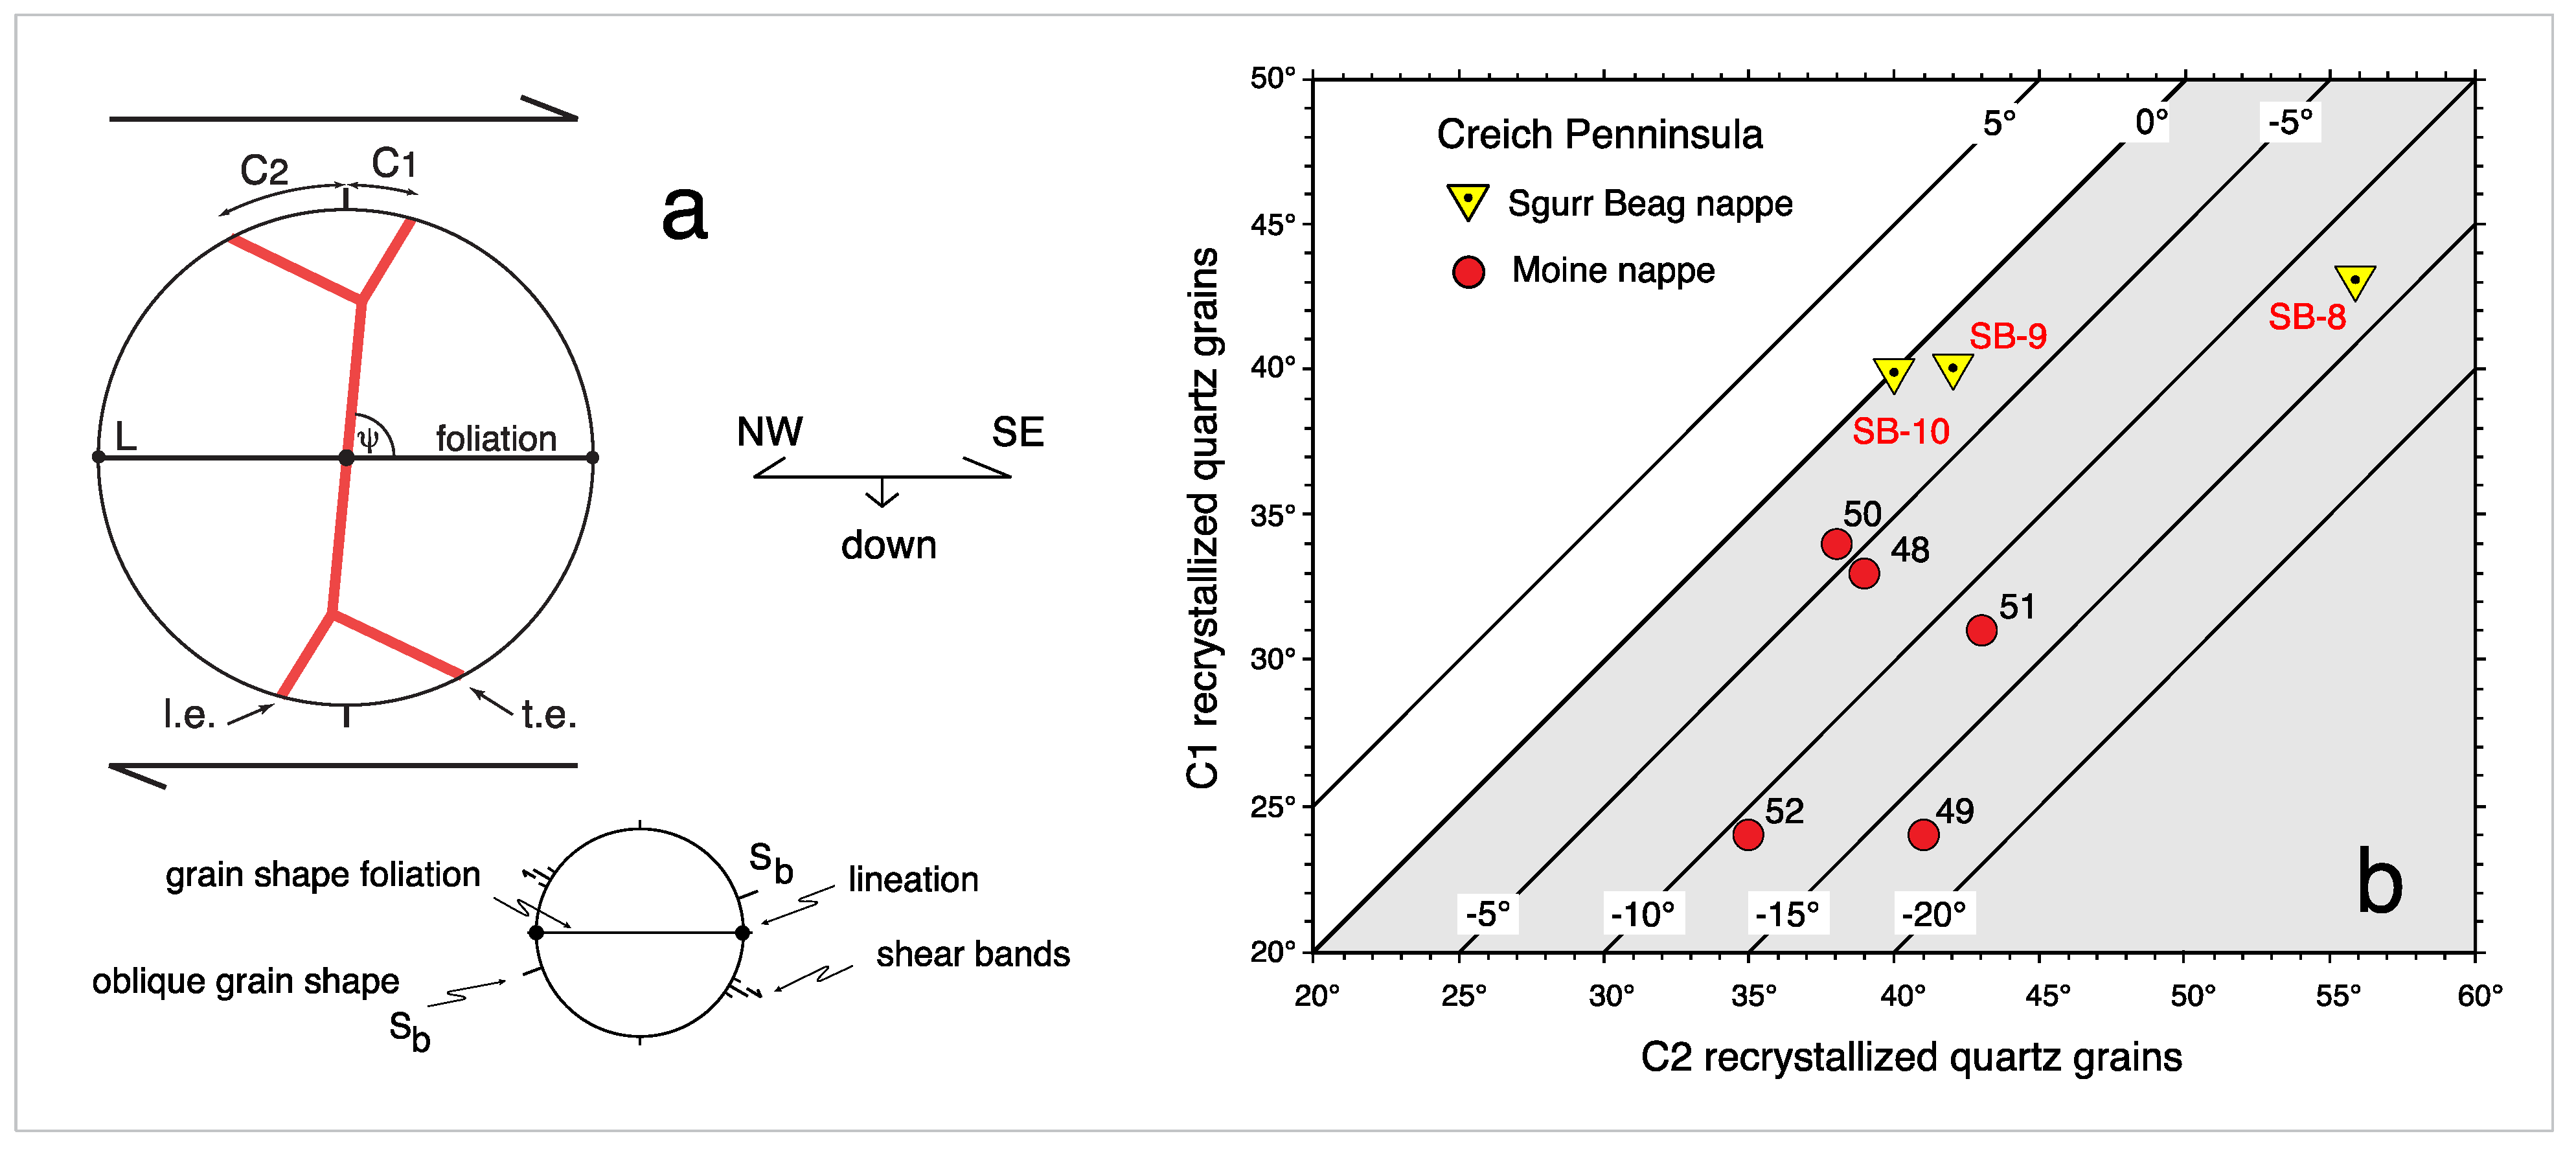
Quartz c-axis fabrics have been measured in samples MT-1 to MT-28 on the transect across Area 1 to: (a) assess if grain shape lineation in individual samples has developed parallel to the maximum principal stretch direction (X); (b) determine shear sense for individual samples; and (c) assess likely deformation temperatures. Both experimental and numerical modelling data [76,77,78,79] indicate that under close to plane strain deformation conditions quartz c-axis fabrics develop orthogonal to X (Figure 9), thereby providing a test of whether observed lineations in individual samples have developed parallel to the local maximum principal stretch direction associated with plastic deformation, dynamic recrystallization and crystal fabric development. Experimental and numerical modelling data [79,80] also indicate that fabric asymmetry (e.g., unequal inclination C1 and C2 of the leading and trailing edges of the cross-girdle fabric, respectively, with respect to pole to foliation Z) may be a reliable shear sense indictor (Figure 9). Similarly, the opening angle (C1 + C2) between the leading and trailing edges may be an indicator of deformation temperature [81,82]; see review by Law [19].
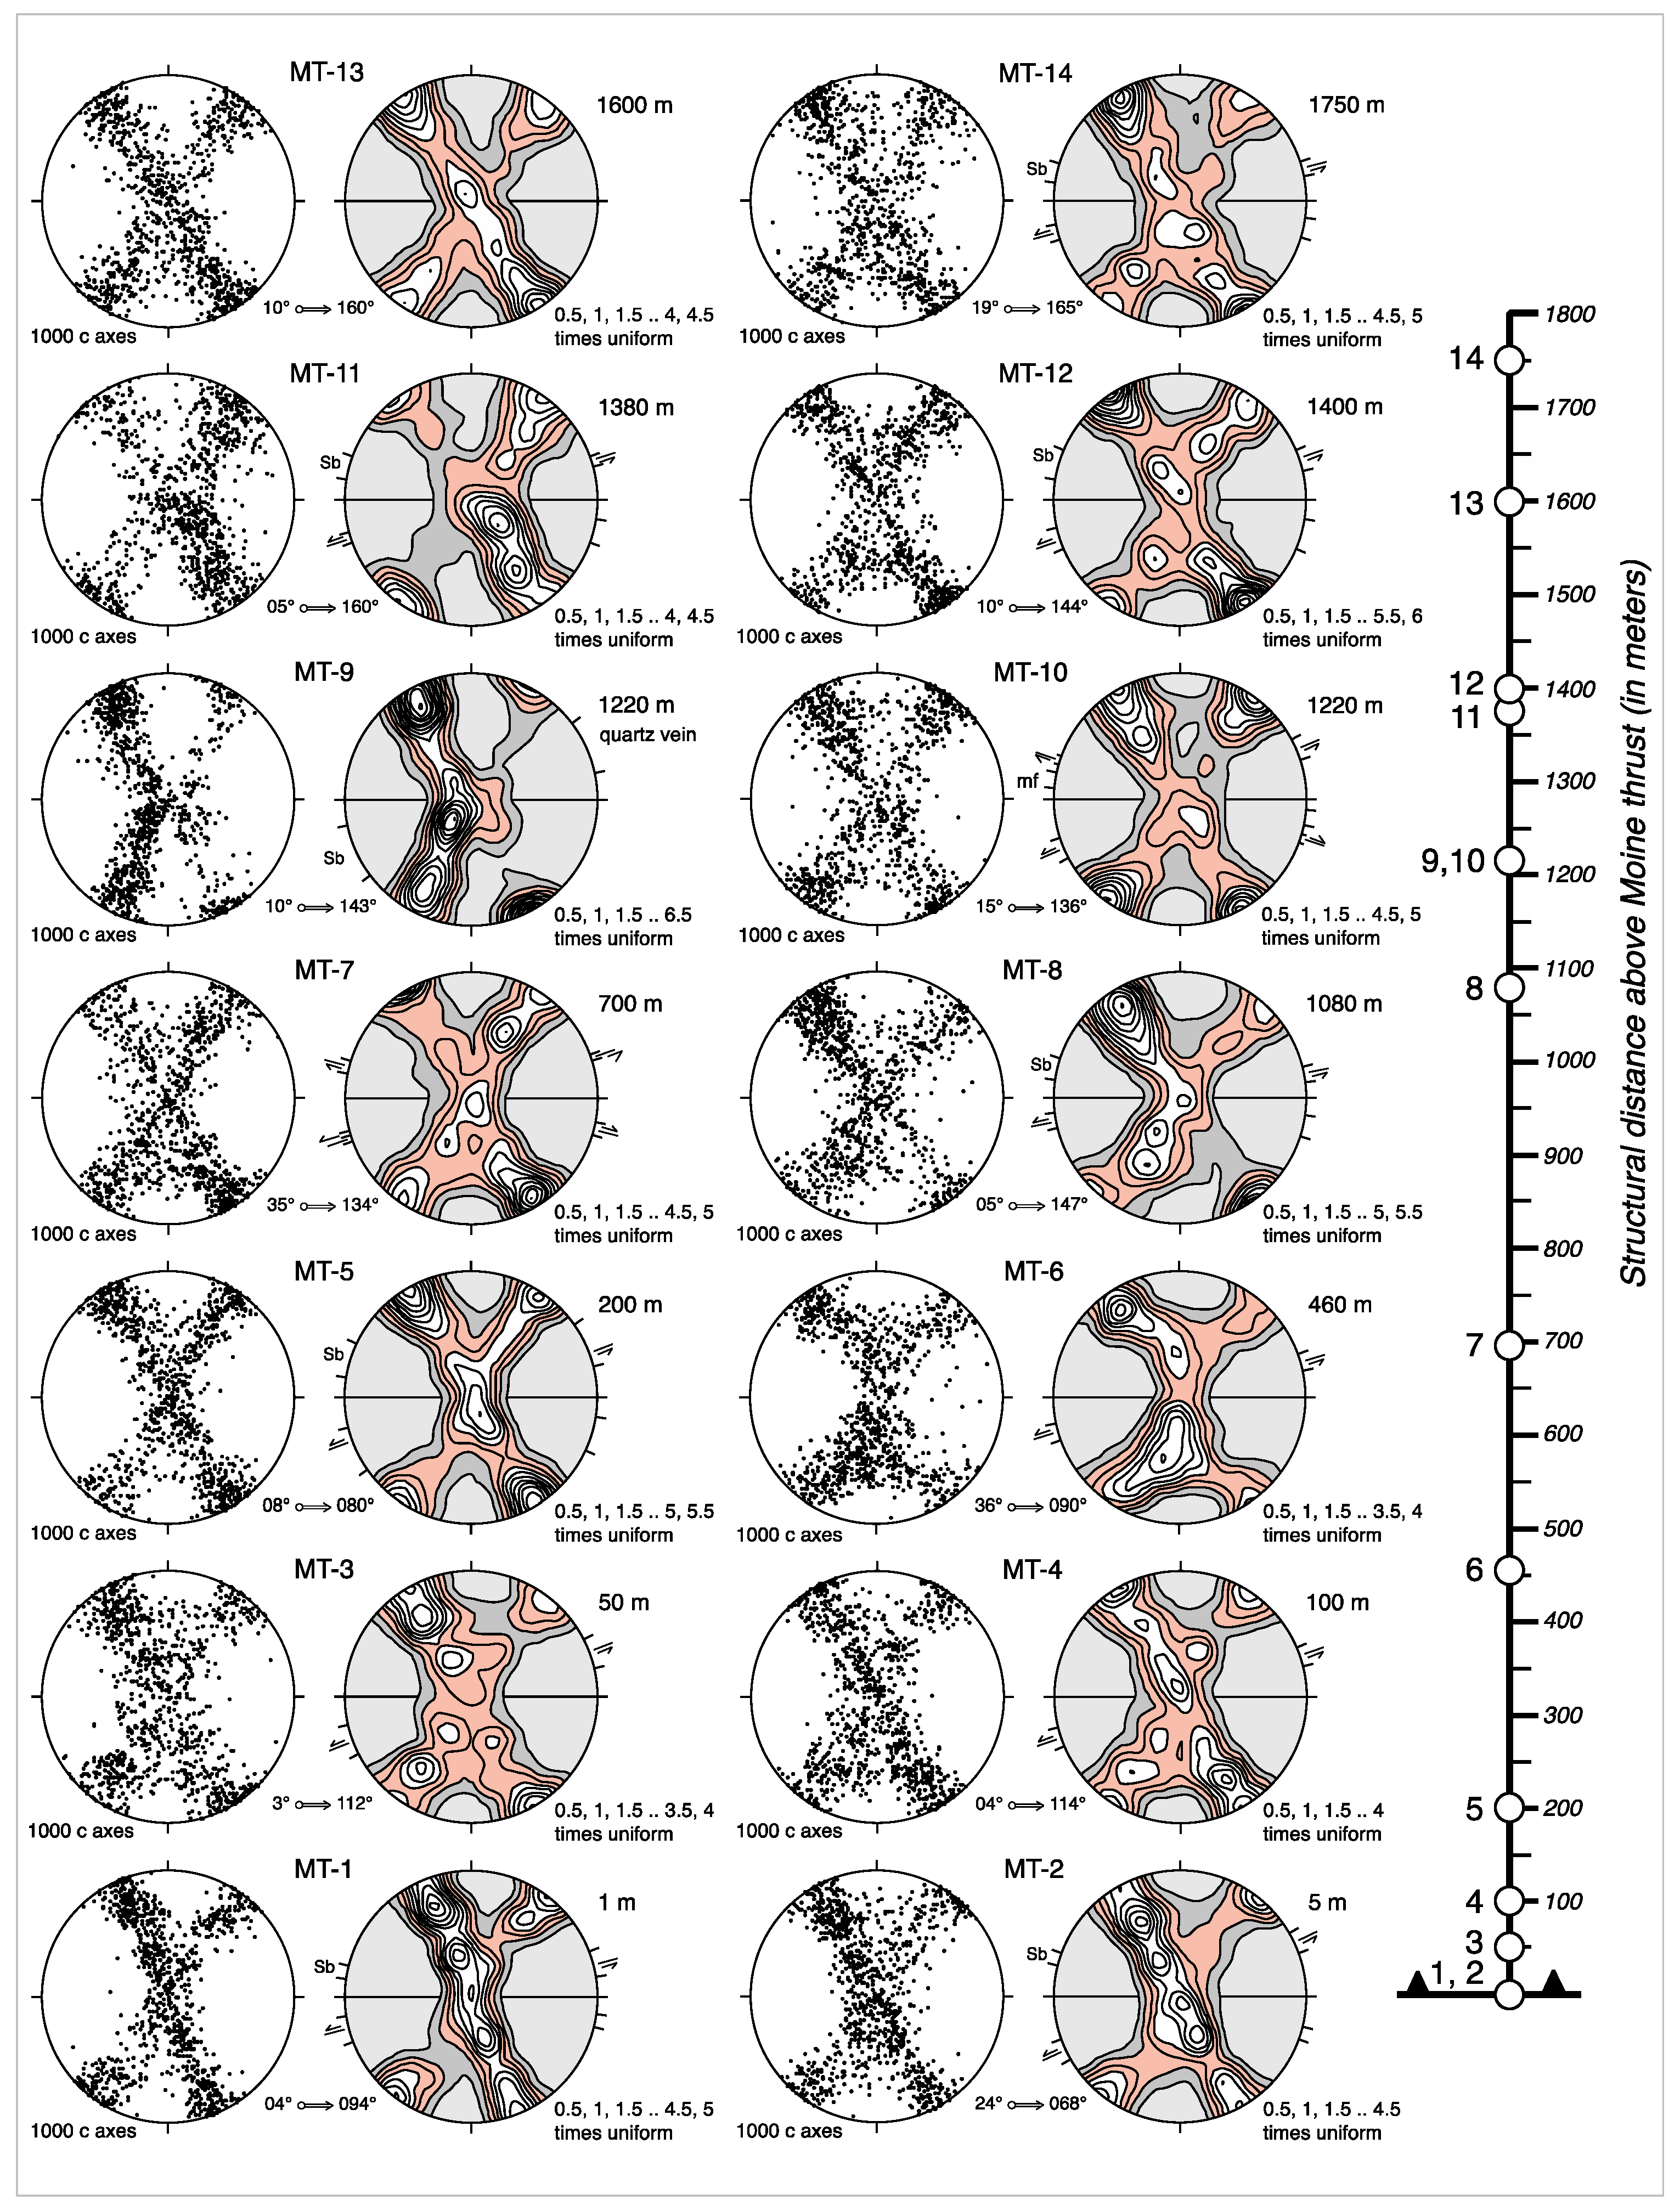
With one possible exception (MT-9, see below) all samples from Area 1 are characterized by cross-girdle c-axis fabrics (Figure 10 and Figure 11) indicating close to plane strain (k = 1) 3D deformation conditions [84]. In all samples mineral lineation is within observation uncertainty (1 or 2°) perpendicular to where the fabric intersects macroscopic foliation (Y direction), indicating that the macroscopic mineral lineation is parallel to the maximum principal stretch direction (X). With the exception of sample MT-9, C1 and C2 angles between the leading and trailing edges of the cross girdle fabrics are, with increasing structural height above the thrust plane, indicative of a progressive change from top to the W, through top to the NW, to top to the N shear senses (Figure 12a). This shear sense interpretation is unequivocally supported by the presence of shear bands/extensional crenulations and oblique alignment (Sb) of elongate dynamically recrystallized quartz grains (Figure 10 and Figure 11) [85,86,87]. These oblique grain shape alignments are particularly obvious in samples dominated by SGR recrystallization of quartz close to the underlying Moine thrust (e.g., samples MT-1 and 2). Alignments of large (2–3 mm) white mica fish oblique to foliation in sample MT-10 also indicate a macroscopic top to the NW shear sense using ‘fish-flash’ criteria [88,89]. Conjugate shear band development was observed in samples MT-7 and 10 (Figure 10), indicating either a locally important pure shear deformation or a domainal distribution of top to the NW and SE shear senses.
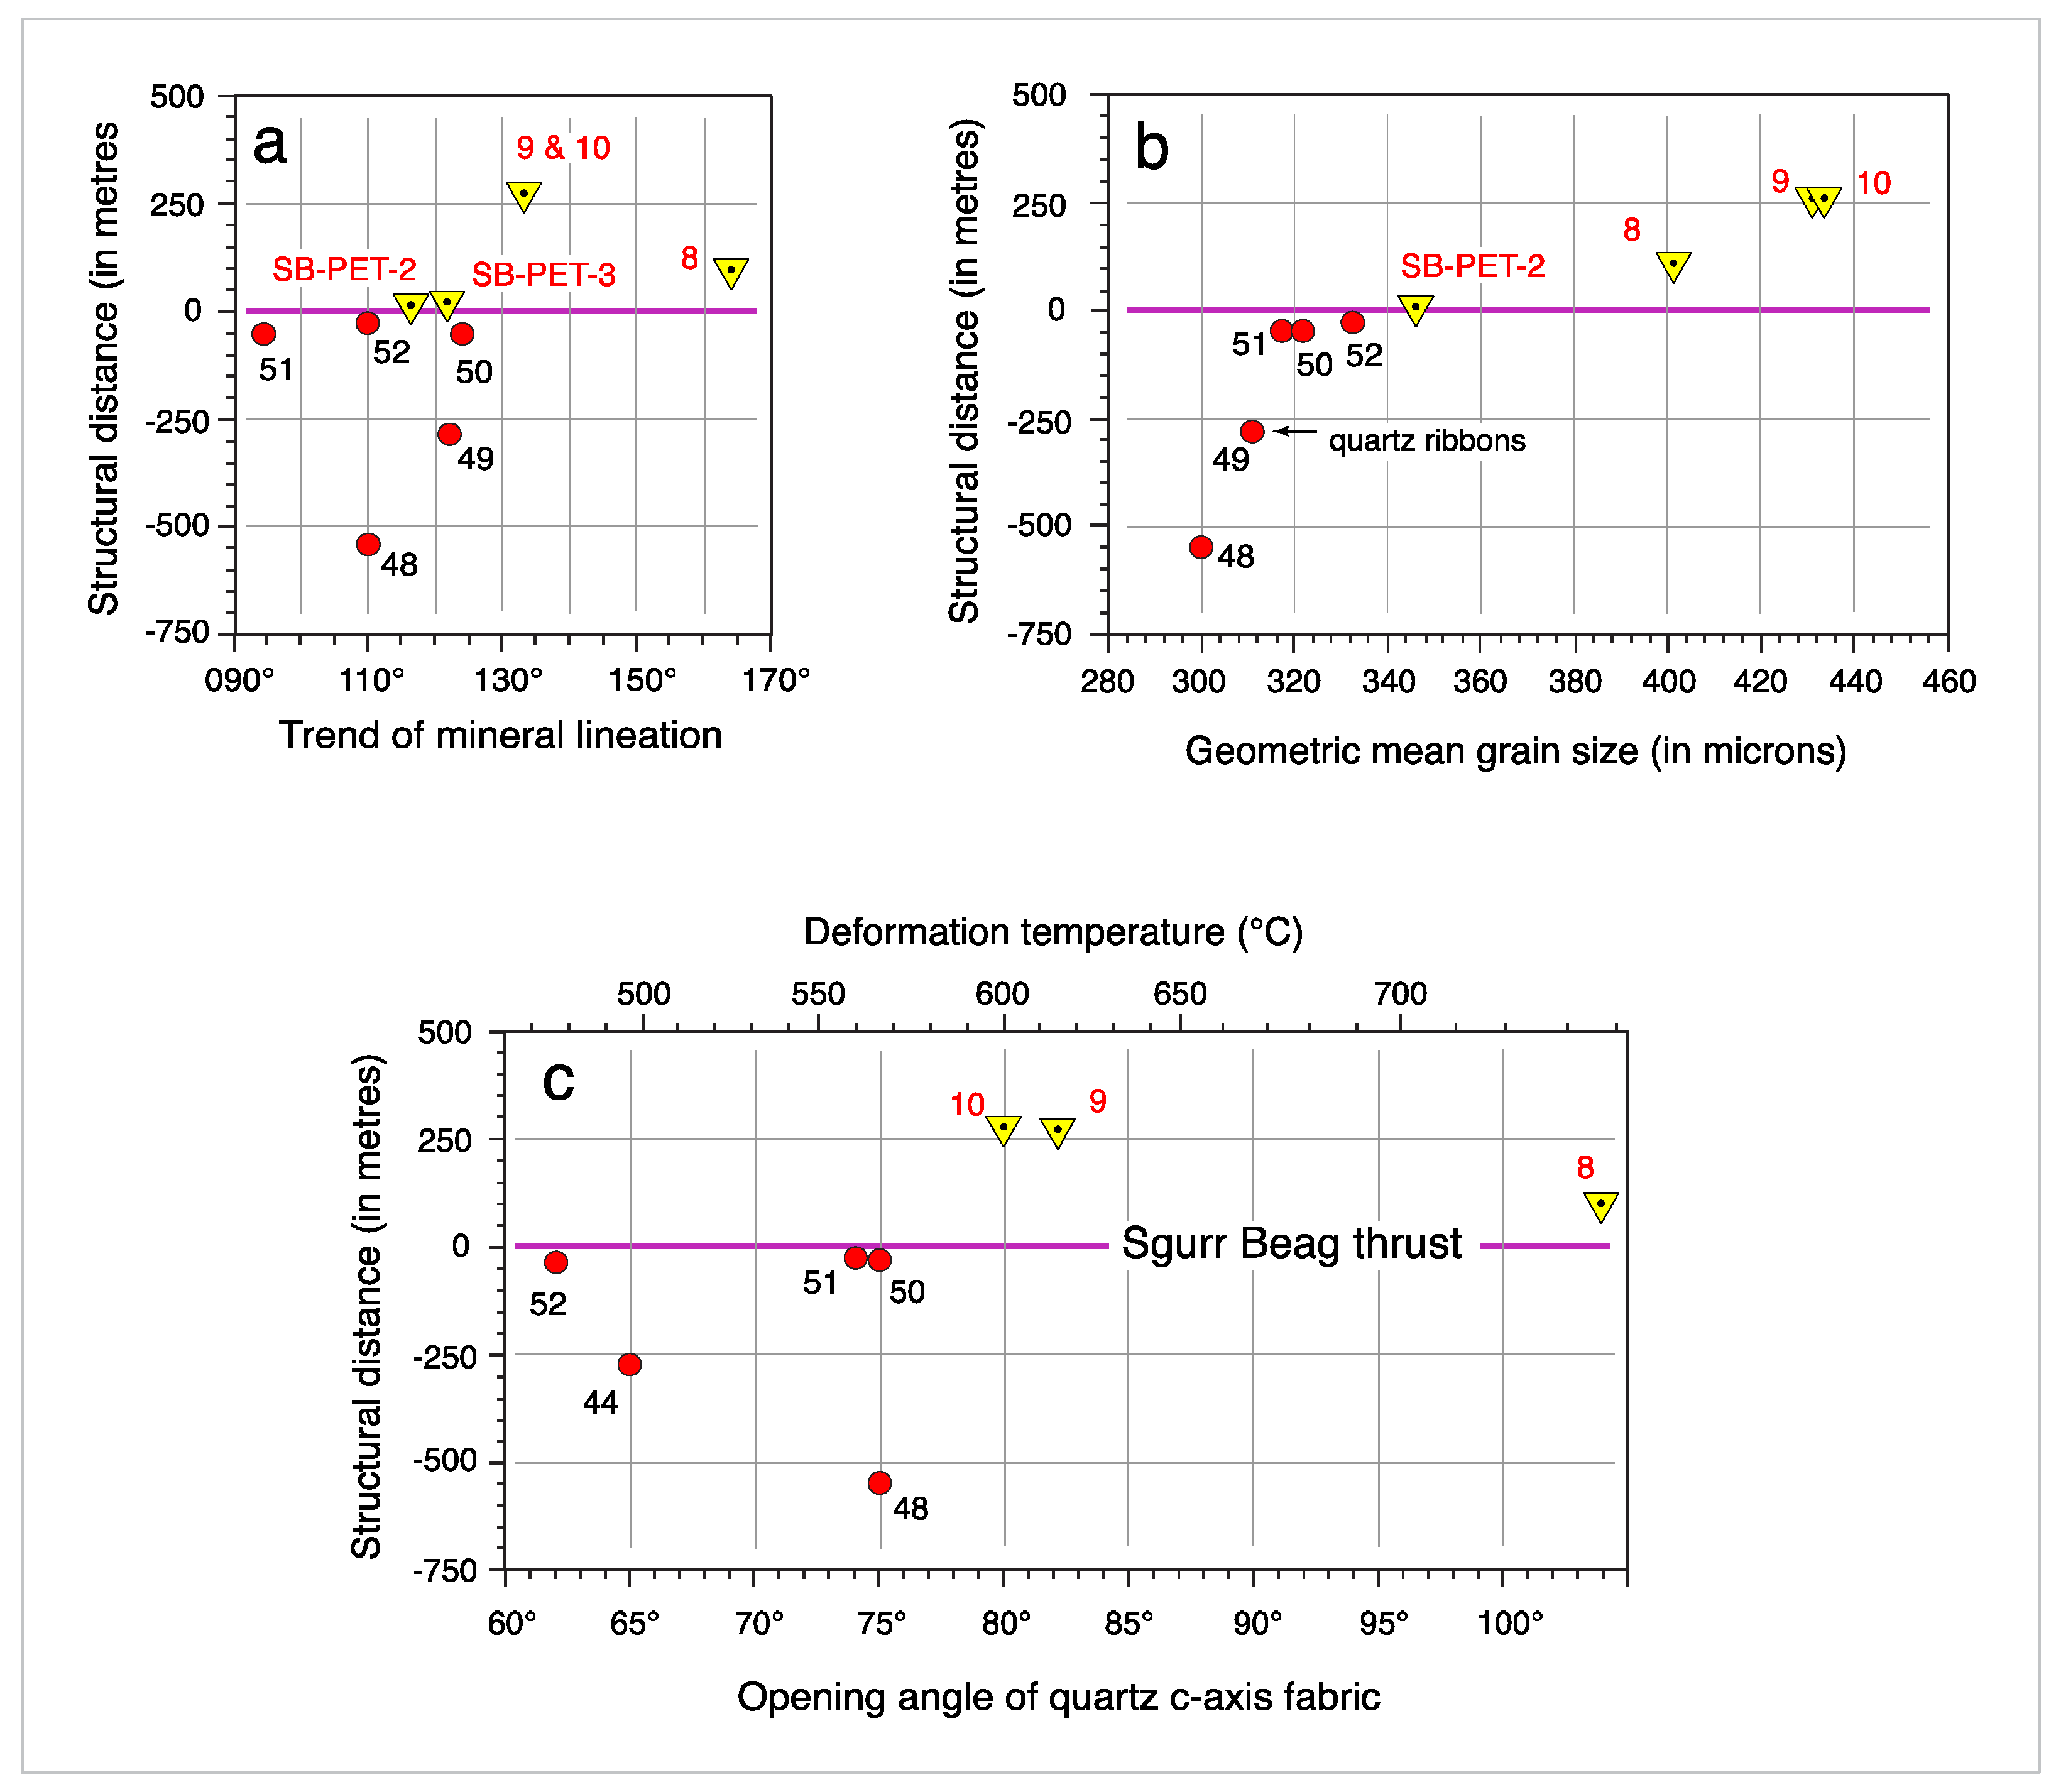
The topology of the cross-girdle fabrics varies with structural position. Close to the Moine thrust (e.g., samples MT-1 and 2) the leading and trailing edges of the fabric intersect between the sample Y and Z directions (Figure 9; Type 1 cross girdle of Lister [90]) with the leading edge forming an almost planar alignment of c-axes passing through the sample Y direction. At greater distances above the thrust (starting with sample MT-5 at 200 m) the leading and trailing edges frequently intersect in the sample Y direction (Type II cross girdle of Lister [90]) potentially indicating higher deformation temperatures, as also indicated by changes in quartz and feldspar microstructures (Figure 6). Fabric opening angles in samples MT-1 to 28 range between 58° and 80° with increasing opening angle broadly correlating with: (1) a change from SGR to GBM dominated quartz recrystallization and increasing recrystallized grain size (Figure 12b), (2) increasing structural distance above the Moine thrust (Figure 12c), and (3) change from W-E to N-S trending lineation/principal stretch direction (Figure 12d).
Taken together with both the change from brittle to plastic deformation of feldspar grains and petrologic changes such as the incoming of biotite, garnet and myrmekite at progressively higher structural levels, these fabric opening angles are considered broadly to reflect increasing deformation temperatures of ~450–580 °C using the linear opening angle thermometer of Faleiros et al., [82]. The transition from SGR to GB recrystallization in quartz has been documented as occurring at ~490–530 °C at natural strain rates of ~10−12 s−1 [73,74], while onset of SGR in feldspar occurs at ~550 °C (Passchier and Trouw [72], p. 260). However, the potential influence of other variables such as increasing strain rate (see review by Law [19]) on these changes in microstructures and crystal fabrics remains to be quantified. Additionally, it should be kept in mind that microstructures and crystal fabrics now preserved at different structural levels above the thrust may have formed at different times. For example, the presence of both (mixed) SGR and GBM microstructures in quartz at ~400–1300 m above the thrust could indicate that both formed at the same time or that the SRG microstructures formed later at lower temperatures and/or faster strain rates. Particularly unexpected were the orthoclase and plagioclase grains with sinuous grain boundaries at structural distances ≥1600 m above the thrust. GBM in feldspars usually occurs at temperatures >800 °C (Passchier and Trouw [72]; but see also Rosenberg and Stünitz [91]) possibly indicating that these microstructures are preserved remnants of an earlier higher temperature deformation.
As noted above, the one major exception to all the above trends is sample MT-9 collected in the same outcrop as MT-10 at 1200 m above the Moine thrust. This is one of only two high quartz content samples (with MT-11) in the transect and, although containing epidote and accessory biotite, could be broadly defined as a quartzite. The linear grain shape fabric in MT-9 is more strongly and pervasively developed than in any other sample in the transect, and the c-axis fabric is transitional between a Type II cross girdle and a small circle girdle centered about the lineation/maximum principal stretch direction, suggesting deformation within the constrictional strain field [83]. Numerical modeling (e.g., Lister and Hobbs [78]) indicates that for a given set of dislocation slip systems (and hence deformation temperatures/strain rate conditions) opening angles in the general constrictional field (∞> k>1) are ~7–10° lower than in plane strain (k = 1) quartz c-axis fabrics produced by dislocation glide, hence offering a simple explanation for the anomalously small opening angle in MT-9 relative to MT-10 from the same outcrop (Figure 12b–d). However, the oblique alignment (Sb) of quartz grains (Figure 11) in this mixed SGR and GBM recrystallization quartzite indicates a top down to the SE shear sense, compounding the anomalous nature of this single quartz-rich horizon.

4.3. Tectonic Interpretation of Microstructures and Quartz c-Axis Fabrics in Area 1

At the base of the Moine thrust sheet in Area 1 the Moine psammites are deformed at ~450 °C into platy mylonites that dip gently to the ESE sub-parallel to the underlying Moine thrust. The most macroscopically platy rocks are at ~1–5 m above the thrust where they are particularly chlorite-rich. Above these mylonites is a ~4 km thick planar zone of shearing in which deformation temperatures increase from ~480–600 °C and gently plunging mineral stretching lineations/maximum principal stretch directions change in trend from E to SSE traced structurally upwards and to the SE (Figure 3, Figure 4 and Figure 12c). This is accompanied by both a change in grain shape fabrics that become less platy and more granular due to the increasing importance of GBM recrystallization of quartz (and apparently feldspar) with increasing deformation temperatures and a change in shear sense from top to the W to top to the N. Additionally, on Meall an t-Sithe at the southern margin of Area 1 (Figure 3) mineral stretching lineations/maximum principal stretch directions in the uppermost part of the Moine thrust sheet progressively change from a SE to SSE to S trend traced upwards into the overlying Sgurr Beag thrust sheet.

4.3.1. Domainal Distribution of Lineation Trends

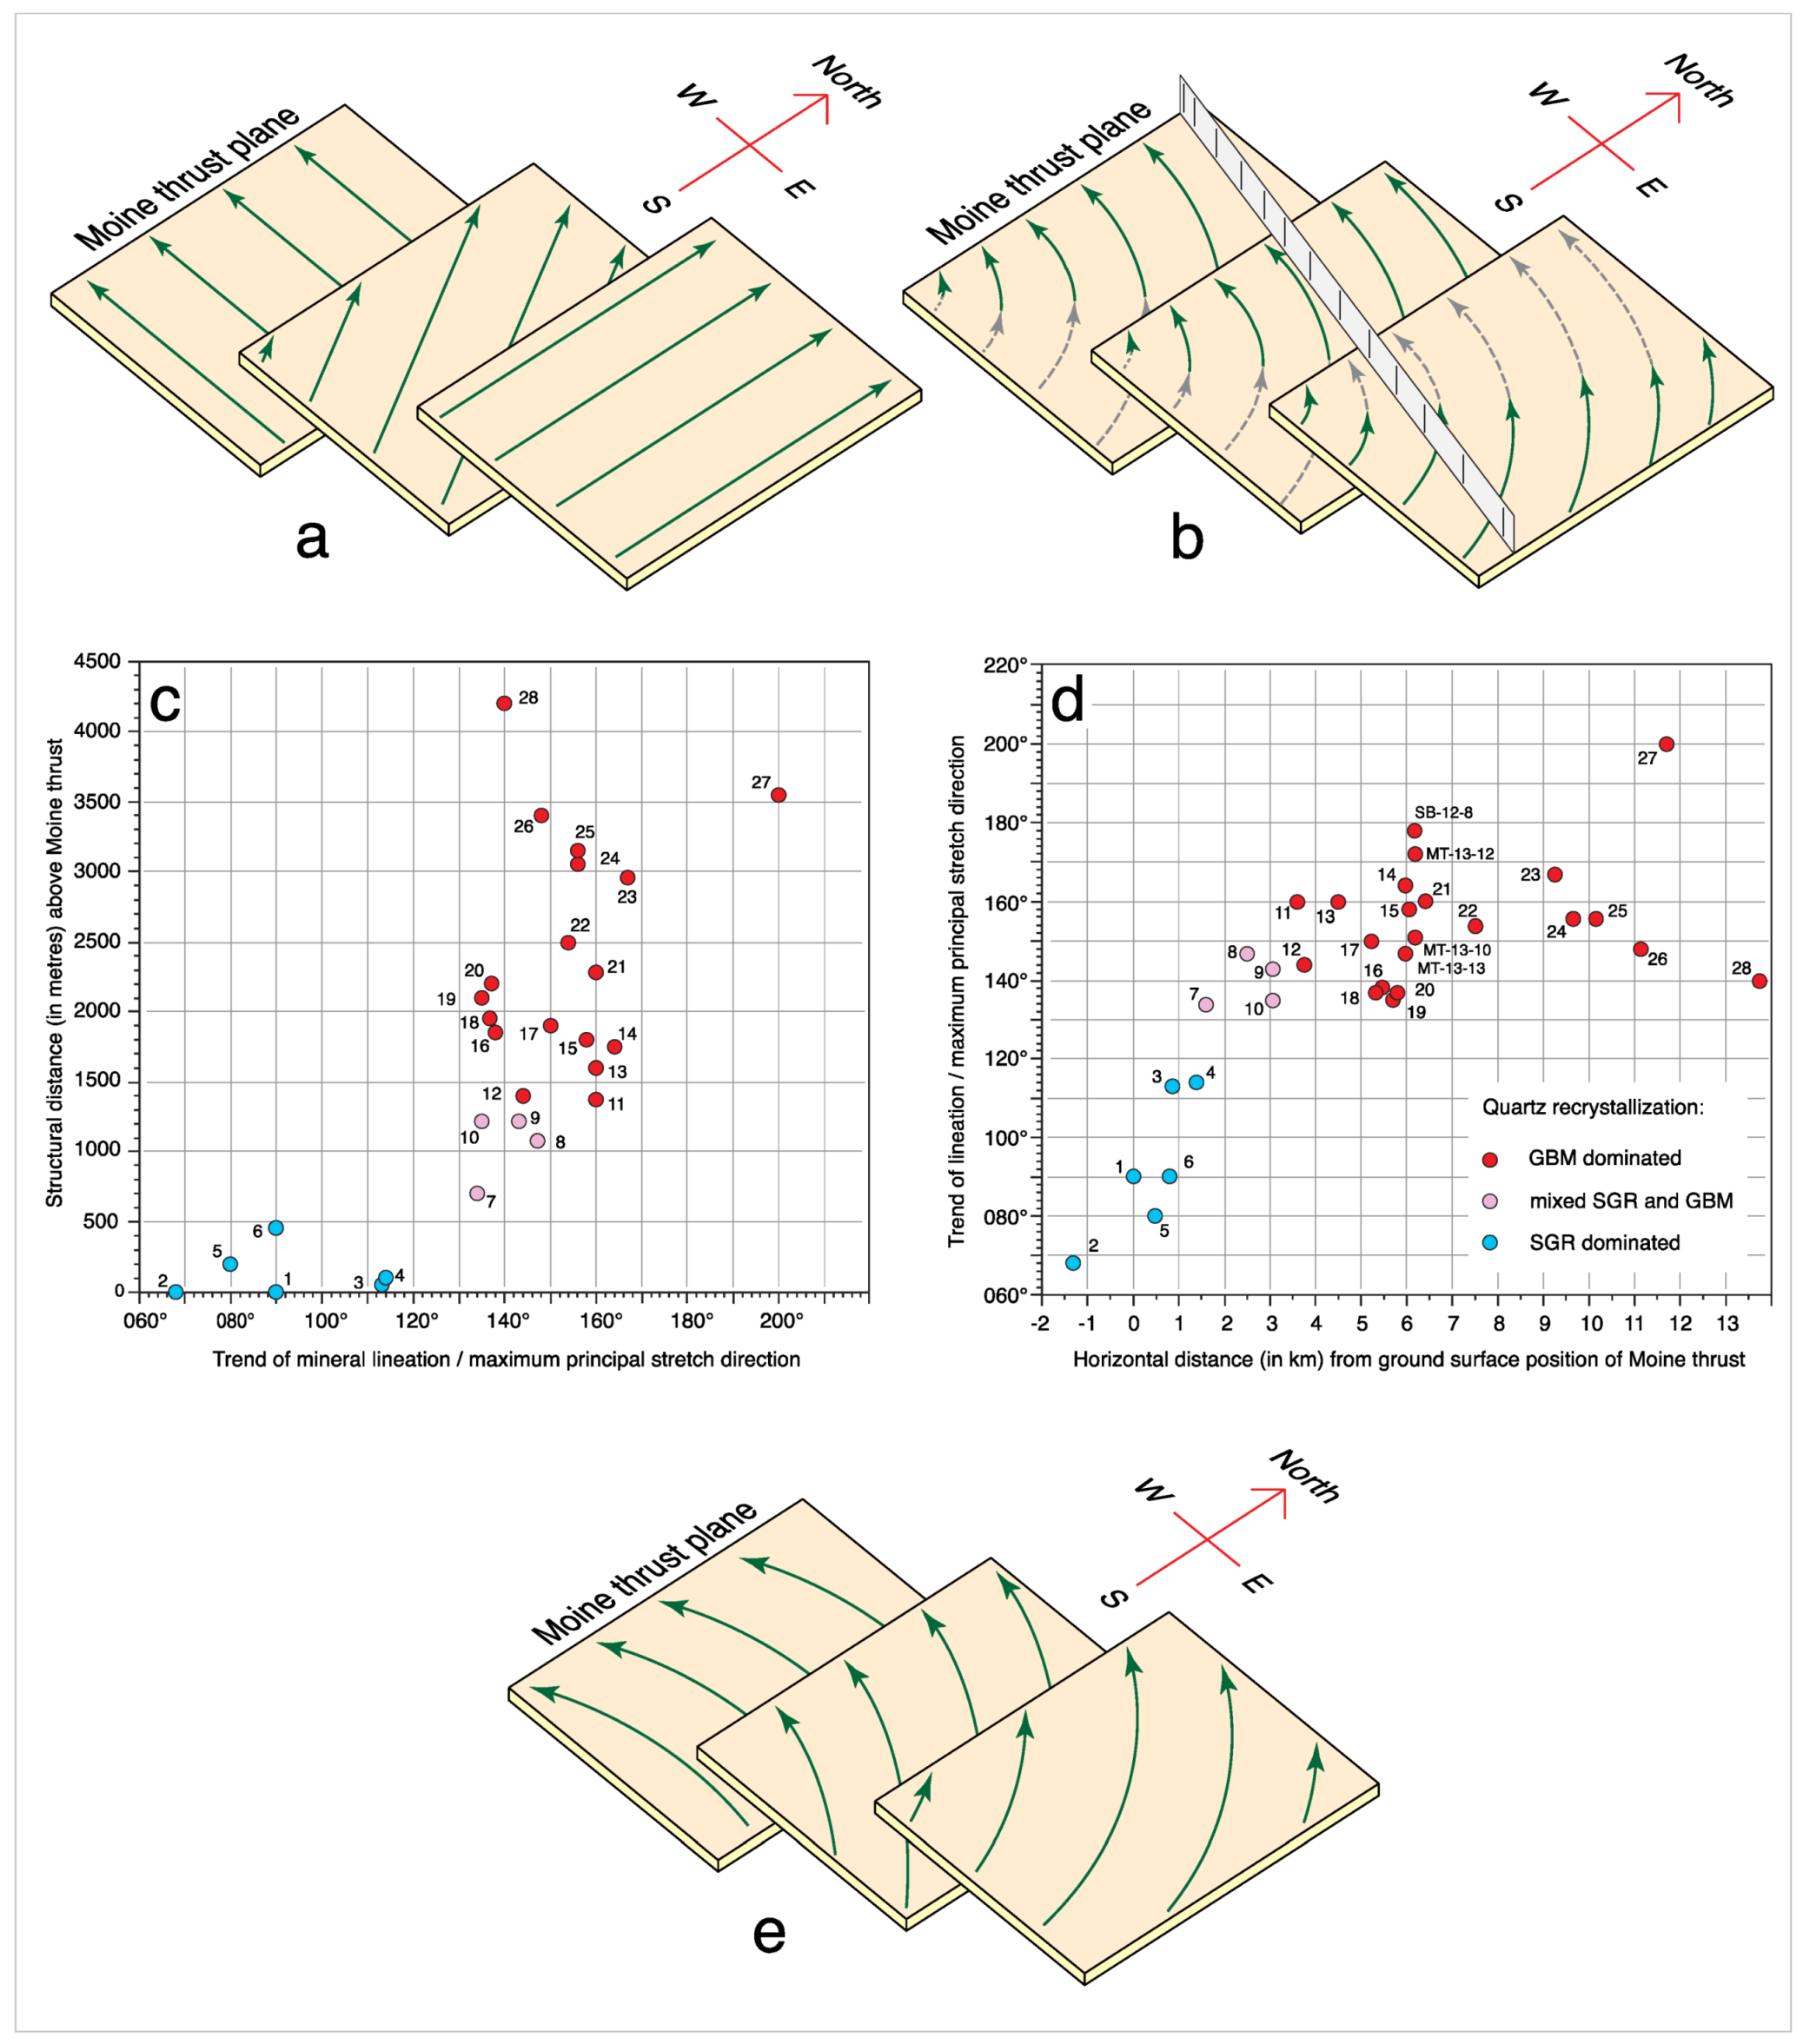
In map view the changing lineation trend in Area 1 defines an arcuate pattern (Figure 3), but from the map pattern alone it is impossible to determine if this arcuate pattern is produced by each structural level having a unique lineation trend that progressively changes in orientation with increasing distance above the thrust plane (Figure 13a) or if each structural level contains a similar pattern of arcuate lineations developed at the km scale (Figure 13b). Additionally, from the map pattern alone it is difficult to determine if a gradual change in lineation trends makes up this arcuate pattern, or if there are abrupt changes in lineation trend, with some orientations being absent. Krabbendam et al., [56], p. 15, have previously argued that there is an abrupt change of lineation trend from ~100° along and immediately above the Moine thrust in this area to 140–150° at higher structural levels, potentially indicating the presence of distinct structural/kinematic regimes associated with different transport directions.
As noted above, mineral lineations in platy mylonites in the immediate hanging wall to the Moine thrust actually vary locally in trend from 068° to 136°, although with a dominance of W-E trending lineations, and a vector average plunge and trend of 12° towards 091° (Figure 3 and Figure 5a). The 090° trending lineations are also measured in sample MT-6 at 400 m above the thrust (Figure 13c). Although lineations/maximum principal stretch directions with a 100–135° trend are relatively rare in the overlying more granular Moine psammites, they do occur in samples MT-3 and MT-4 (trends of 113° and 114°) from the west shore of Loch Broom at estimated distances of 50–100 m above the thrust (Figure 3, Figure 4b and Figure 13c,d). At structural distances of ~1000 to 3500 m above the thrust, samples display a range of lineation trends at any particular structural distance varying from 135 to 165° (Figure 13c). At higher structural levels, lineation from the uppermost part of the Moine thrust sheet and immediately overlying Sgurr Beag thrust sheet exposed on Meall an t-Sithe (Figure 3) trend 144°–179°. The structural distribution of these lineation and inferred transport direction domains is shown schematically in (Figure 13e) in which the lowermost domain represents ~0–500 m above the Moine thrust (080°–115° range in lineation trend); the middle domain ~500–1000 m (090°–135°); and the top domain ~1000–4200 m above the thrust (135°–170°) and extending on through the uppermost part of the Moine thrust sheet into the Sgurr Beag thrust sheet exposed on Meall an t-Sithe (147°–179°). Assuming that the lineations in each domain are of essentially the same age, then the 35°–45° range of lineation trends in each domain would seem to indicate a significant component of rotation associated with thrusting and tectonic transport.

4.3.2. Age of Shearing in Lineation Domains

Both the relative and absolute ages of shearing in the lineation domains have still to be firmly established. In the Fannich Forest area on the southwest border of our Area 1, Kelley [92] and Kelley and Powell [57] argued that deformation fabrics (including quartz c-axis fabrics) associated with top to the N and NW shearing in amphibolite facies rocks of the Sgurr Beag thrust sheet are obliquely overprinted at the western edge of the Meall an t-Sithe klippe (MATK in Figure 1) by greenschist facies shear bands associated with top to the W movement on the underlying Moine thrust mylonites. This interpretation is supported by undeformed pegmatites that cross-cut deformation fabrics associated with the Sgurr Beag thrust but are themselves penetratively deformed traced westwards into the mylonites associated with the underlying Moine thrust [57]. Here, the Sgurr Beag thrust is structurally only 400 m above the Moine thrust plane [93,94]), in contrast to the eastern part of Area 1 where the structural distance between the projected positions of the two thrusts is estimated to increase from c. 3 km to >5 km traced southeastwards towards the hinge of the Braemore Syncline (Figure 14a). At the western edge of the Meall an t-Sithe klippe quartz c-axis fabrics described by Kelley and Powell [57] and Mazza et al., [95] indicate that there is a fairly abrupt change between W-E trending lineations/maximum principal stretch directions associated with top to the W shearing in the mylonites immediately above the Moine thrust and SE trending lineations/stretch directions associated with top to the NW shearing in both the immediate footwall and hanging wall of the overlying Sgurr Beag thrust.
In the northern part of our Area 1 Rb-Sr dating by Freeman et al., [51] of syn-kinematic white mica (phengite) in mylonites immediately above the Moine thrust to the north of the Dundonnell Culmination (Figure 3) yielded ages of c. 429–408 Ma. These mylonite ages are from the structurally lowest transport direction domain schematically shown in (Figure 13e). On petrologic grounds Freeman et al., [51] estimated temperatures and pressures of 400 ± 50 °C and 5–7.5 kbar associated with mylonitization in their samples. In comparison quartz c-axis fabric opening angles in the mylonites immediately above the Moine thrust in our study indicate deformation temperatures of c. 440–500 °C (samples MT-1 to MT-5 at <200 m above the thrust, Figure 12), in broad agreement with both the SGR-dominated recrystallization of quartz [73,74] and the rigid mechanical behaviour of feldspar clasts. These deformation temperatures are considerably lower than the closure temperature of strontium in white mica (c. 550 °C according to Cliff [96]) indicating that the Rb-Sr ages are recording the age(s) of dynamic recrystallization of the mica grains during shearing, rather than cooling. Freeman et al., [51], p. 753, interpreted their Rb-Sr white mica ages as indicating that there was a general cessation of ductile deformation in the mylonites at c. 430 Ma, although deformation (or potentially fluid circulation) continued locally in a less pervasive manner until at least 408 Ma.
Kelley [50] reported K-Ar muscovite and biotite ‘age’ data for both the northern part of our Area 1 and the western edge of the Meall an t-Sithe klippe. Unfortunately, the presence of excess radiogenic argon in these samples led to substantial uncertainties in the interpretation of these data, although the K-Ar mica data do suggest cooling of the immediate hanging wall of the Moine thrust to below c. 300 °C by c. 425 Ma.
40Ar/39Ar ‘ages’ derived from muscovite are generally accepted as providing information on cooling through c. 400 °C [97,98,99] and thus may provide additional thermochronological information on shearing in the area. In order to investigate the suitability of our suite of samples in Area 1 for future 40Ar/39Ar geochronology, a muscovite separate of sample MT-10, collected at 1220 m above the Moine thrust (Figure 3, Figure 4a and Figure 14a), was prepared for 40Ar/39Ar geochronology following the method of Spencer et al., [100]. A full description of analytical methods [101,102,103,104] is given in Supplementary Files S3 and S4. This sample contains the freshest and largest (2–3 mm) muscovite grains in the suite of samples collected in Area 1, with mica fish microstructures consistently indicating a top to the NW shear sense. Two, two- to three-grain aliquots were processed and analyzed. Two aliquots of sample MT-10 yielded plateau dates of 431.6 ± 2.6 Ma (aliquot 1; MSWD = 0.033, includes 87.1% of released 39Ar) and 432.2 ± 1.8 Ma (aliquot 2; MSWD = 0.14, includes 99.7% of released 39Ar), which are statistically indistinguishable from one another and very similar to the white mica Rb-Sr dates of Freeman et al., [51] reported in the underlying basal Moine mylonites.
The incremental release spectra and Ca/K ratio plot for MT-10 (aliquot 2) are presented here in Figure 15. It is important to note that: (1) our release spectra do not indicate the presence of significant excess radiogenic argon, such as interpreted by Kelley [50] for K-Ar dates in the area, and particularly for samples collected at less than ~1.5 km above the Moine thrust [51] and, (2) the Ca/K plot indicates consistent chemistry within the sample, suggesting a single mineral phase without significant alteration by fluids following recrystallization.

4.3.3. Tectonic Significance of Single Grain Feldspar Clasts in the Basal Moine Mylonites

Feldspar microstructures indicate that the relatively low temperature mylonites associated with top to the W shearing at the base of the Moine thrust sheet in Area 1 have not been produced by reworking/retrogression of originally higher temperature rocks now located at higher structural levels in the thrust sheet and associated with top to the NW and N shearing. In the basal mylonites rigid feldspar clasts, composed of single grains of either orthoclase or plagioclase (Figure 7a), have deformed by rotating within their surrounding ductile matrix of dynamically recrystallizing quartz and mica. No internal strain features such as undulose extinction or subgrain formation have been observed in these clasts. In contrast, in most of the overlying 4 km planar section of higher grade Moine rocks, both quartz and feldspar have deformed plastically forming an interlocking network of quartz and feldspar grains with subgrains and sinuous grain boundaries (Figure 7c,d,i,j) suggesting extreme plasticity of both minerals. If the feldspar clasts in the mylonites had formed by mechanical fracturing and breakdown of these higher temperature quartz-feldspar rocks, then they would be expected to be composed of interlocking quartz-feldspar grains in which at least the feldspar grains still contain these earlier higher temperature microstructures. No such microstructures have been observed. This in turn suggests that the basal section of Moine metasedimentary rocks associated with top to the W shearing (lowermost domain in Figure 13e) were originally in a more proximal (foreland) position at a much shallower crustal level than the now overlying higher grade Moine rocks associated with top to the NW and N shearing (upper domain in Figure 13e).
If correct, this line of reasoning would require the presence of a major previously unrecognized fault or shear zone, probably at a structural distance of ~500–1000 m above the Moine thrust (middle domain in Figure 13e), on which originally deeper (hotter) and more hinterland positioned metasedimentary rocks (including most of the Moine thrust sheet and the overlying Sgurr Beag thrust sheet) have been transported laterally to the NW to structurally overlie the shallower (cooler) more foreland positioned metasedimentary rocks that were mylonitized during top to the W shearing on the underlying Moine thrust. Assuming that motion on the Moine thrust is younger than, or at least outlasted NW-directed transport of deeper crustal rocks, this must have occurred: (a) before ~430 Ma when pervasive shearing and dynamic recrystallization of white mica in the mylonites ceased [51] and, (b) far to the east of the current position as WNW-directed slip on the Moine thrust zone (here represented only by the Moine thrust plane itself) and the overlying mylonites at the base of the Moine thrust sheet is thought to be on the order of at least 100 km (Elliott and Johnson [65], p. 95).
This previously unrecognized fault or shear zone may be marked at ground surface by a change in topography between the 300 and 350 m topographic contours in Area 1 between Dundonnell and Loch Broom. Samples MT-6, MT-7 and MT-8 at 460, 700 and 1080 m above the Moine thrust, respectively, are from this topographic break (Figure 4) which could mark the position of a gently eastward dipping thrust fault or shear zone.

5. Area 2—Hinge of Braemore Syncline—East of Loch Glascarnoch

In Area 2 both the Morar Group stratigraphic units of the Moine thrust sheet and the projected positions of the overlying Sgurr Beag thrust sheet are folded about km-scale west-vergent folds [70,105] that are interpreted to detach onto the underlying Moine thrust surface [56]. The Sgurr Beag thrust sheet is also folded about these km-scale folds with the Meall an t-Sithe and Fannich Forest klippen (MATK and FK in Figure 1) being downfolded outliers of the main part of the Sgurr Beag thrust sheet [56,70] preserved further to the southeast in Area 3. These folds are shown on the cross section in Figure 14a that extends from the Moine thrust in the western part of Area 1, through Area 2 to the Sgurr Beag thrust sheet exposed in the eastern part of Area 3. The hinges of these km-scale folds plunge gently to the N or S and axial surfaces increase in dip from ~35° to 60° E traced from west to east [56]. Penetrative strain magnitudes are probably lower than in the same stratigraphic units in Area 1, with sedimentary way-up structures locally preserved [56] and indicating a broadly right way-up sequence of stratigraphic units that are locally overturned on the steeply dipping limbs of the km-scale folds (Figure 14a).
Thirteen oriented samples (MT-28 to 39 plus MT-PET-1) were collected in Area 2 (Figure 14 and Figure 16). Quartz c-axis fabrics from three of these samples (here relabeled as MT-33, 34 and 35) have previously been reported by Mazza et al., [95]. Only the more pelitic samples contain a platy foliation, while grain shape fabrics are dominantly granular in the psammites due to grain boundary migration recrystallization microstructures developing in both quartz and feldspar. Nonetheless, a macroscopic grain shape foliation oriented parallel to color banding can be recognized in all samples, and all samples contain a N-S trending grain shape lineation of variable intensity on the foliation planes. Poles to foliation in the oriented samples define a partial great circle distribution suggesting that foliation has been folded about a fold hinge plunging gently to the S (12° towards 178°; Figure 5c; cf. complete pole to foliation data sets from Areas 1–3 in Figure 5e). Grain shape lineations on the oriented samples plunge gently to the S, sub-parallel to the km-scale fold hinges, and range in trend from 155° to 184° (Figure 14b) with a vector average trend of 19° towards 170° (Figure 5c). Quartz c-axis fabric analyses indicate that all grain shape lineations in the samples analyzed have developed parallel to the maximum principal stretch direction (X) and that the macroscopic foliation is parallel to the XY plane of the finite strain ellipsoid (Figure 9; see below).
Krabbendam et al., [56], p. 12, regarded the grain shape foliation (which they referred to as S2Ac) in Area 2 as being axial planar to the km-scale folds and hence synchronous with formation of the folds and indicating that the folds developed during peak metamorphic conditions. In contrast we argue here that the foliation (and lineation/maximum principal stretch directions) predate formation of these folds. There are four main lines of evidence for this reinterpretation.
(1)
Grain shape foliation is parallel to mapped gently eastward dipping stratigraphic units throughout the >4 km thick structural section in Area 1, and these units are themselves folded about the km scale folds in Area 2 (Figure 4 and Figure 14). Grain shape foliations are, however, oblique to lithological banding in other structural locations such as on the overturned limb of the Bean Dearg Anticline.
(2)
In the hinge zone of the Beinn Dearg Anticline grain shape foliation/lithologic banding is locally folded by tight 10–20 cm scale minor folds with sub-horizontal hinges trending N-S and hinge planes dipping steeply E (e.g., Krabbendam et al., [56], their Figure 6e). Quartz c-axis fabric analysis of sample MT-30 taken from the limb of one of these folds (grid reference NH 25456 74828) demonstrates that the folded foliation is parallel to the local XY plane of the finite strain ellipsoid and that the fold-hinge parallel mineral lineation is itself parallel to the maximum finite stretch direction (X).
(3)
Quartz c-axis fabrics and microstructures in samples taken from the right way-up limbs of the km-scale folds unequivocally indicate a top to the N shear sense, while samples from the overturned limbs (e.g., MT-29 from the locally overturned and steeply dipping limb of the Braemore Syncline–Beinn Dearg Anticline fold pair) indicate a top to the S shear sense. However, unfolding of the km-scale folds results in a common top to the N shear sense for all samples (see Section 5.2 below).
(4)
Throughout Area 2 lineations/maximum principal stretch directions trend N-S sub-parallel to the km-scale fold hinges and are associated with top to the north shear sense indicators. Although examples of fold hinges nucleating in the X direction have been documented both in nature and experimentally [106,107,108,109,110,111], here it seems more reasonable to interpret the folds in terms of deforming an earlier LS fabric in which the linear fabric element was oriented at a high angle to the WNW-directed transport direction on the underlying Moine thrust, and fold hinges developed sub-parallel to this earlier N-S trending lineation. As outlined in Section 2, Holdsworth [54] has previously made a similar interpretation for outcrop scale N-S trending W-verging folds nucleating on older, rarely preserved, N-S trending mineral lineations in the Ben Hope thrust sheet exposed on the north coast in the Kyle of Tongue area (Figure 1).

5.1. Microstructures and Petrography

Microstructures in all samples from Area 2 indicate that both quartz and feldspar have deformed plastically, forming an interlocking mosaic of grains with grain scale sinuous/lobate grain boundaries (spectacularly developed between quartz and plagioclase grains in samples MT-34 and 36) (Figure 7i,j) indicating high mobility of feldspar and quartz grain boundaries. Quartz grain interiors are usually strain free while orthoclase, and, to a lesser-extent plagioclase grains, locally exhibit patchy extinction and subgrain development, suggesting minimum temperatures of ~550–600 °C (Passchier and Trouw [72], p. 260). Orthoclase grains are frequently sericitized, particularly in samples (e.g., MT-29 and 30) located on the vertical fold limbs, while plagioclase grains remain unaltered. Widely varying amounts of white mica and biotite are recorded in the different samples. Biotite remains fresh and highly pleochroic with fox-red colour in some samples but is chloritized in other samples and particularly on the vertical fold limbs. Garnet is present in the more pelitic samples from the western part of Area 2 (MT-29 to MT-34, M-PET-1) and individual grains are euhedral in all samples (Ashley et al., [75], their Figure 3 and Figure 4).
Most samples from Area 2 lack the necessary metamorphic indicator minerals for quantitative PT analyses. However, sample MT-PET-1 from the central part of the area on the north side of Loch Glascarnoch (Figure 16) contains the assemblage muscovite + quartz + plagioclase + biotite + garnet allowing Mazza et al., [92] to estimate a broad range of temperature and pressure values of 550–680 °C and 2.8–7.2 kbar for this sample (referred to as MT-12-10 by Mazza et al., [92]), based on pseudosection modeling. Mazza et al., [95] suggested that more meaningful pressure constraints for this sample may come from the presence of kyanite overprinting andalusite in the aureole of the Carn Chuinneag granite, located approximately 15 km to the NE of Loch Glascarnoch in the upper part of the Moine thrust sheet [112,113,114,115,116,117]. Growth of kyanite is interpreted to be associated with regional metamorphism and fabric development that post-dates intrusion of the granite at c. 594 Ma (Oliver et al., [118], their Figure 2) and may structurally and temporally correlate with the deformation fabrics in our samples from Loch Glascarnoch in Area 2 [56]. Given these observations, the pressure range of MT-PET-1 is further restricted to 4.8–7.2 kbar [95].
To the north of the Carn Chuinneag granite and its contact aureole, kyanite has also been recorded by Mako [16], his sample MT-16-03, in the upper part of the Moine thrust sheet at approximately 25 km to the NE of Loch Glascarnoch (Figure 1 and Figure 2, location a). Lineation in this sample plunges at 47° towards 149°. Detailed petrologic and geochronological analyses (monazite/xenotime) and thermodynamic modeling by Mako [16], p. 85–93, on this sample (composed of quartz, garnet, staurolite, muscovite, biotite, ilmenite, rutile, kyanite, chlorite) suggested it reached peak temperatures and pressures of 670 °C and at least 8 kbar almost simultaneously, and on the retrograde path passed through 620 ± 25 °C at ~416 Ma ± 5 Ma and then 550–600 °C at 5–6 kbar.

5.2. Quartz c-Axis Fabrics and Microstructural Shear Sense Indicators

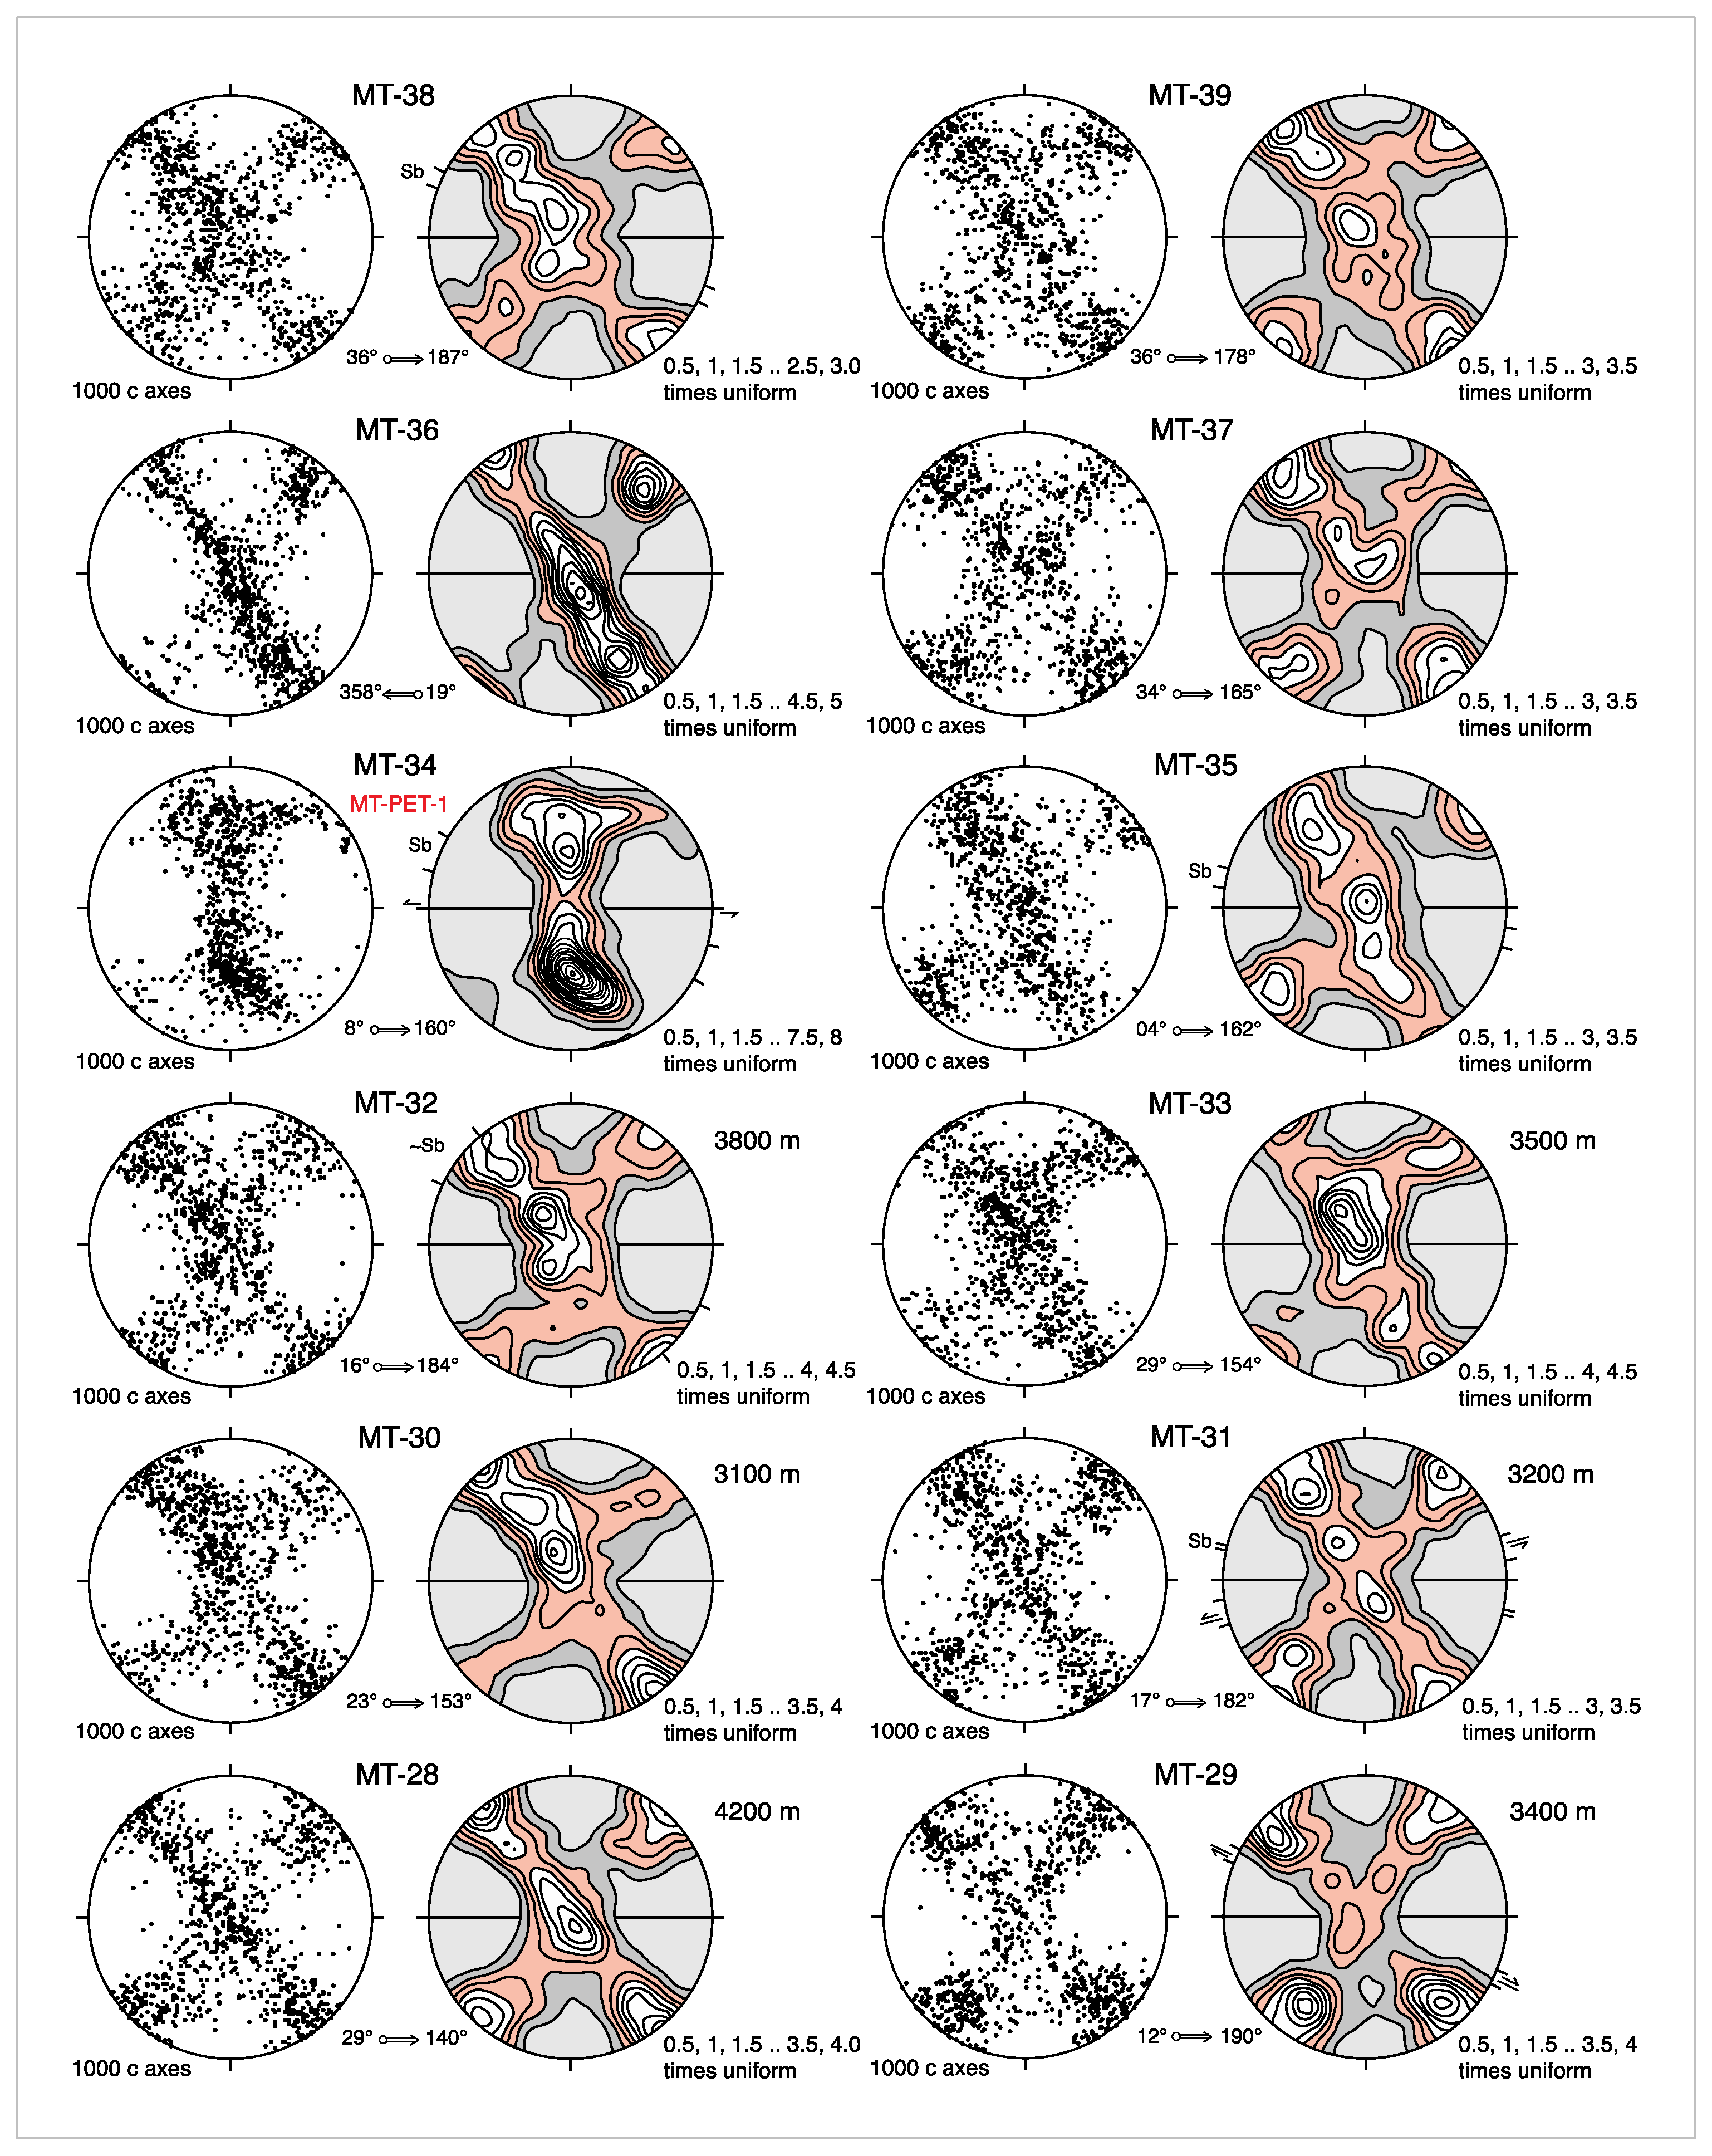
All c-axis fabrics in samples from Area 2 (Figure 17) are cross girdle fabrics indicating approximately plane strain (k = 1) deformation conditions [84], although the fabric from MT-34 is transitional between a cross-girdle and a single-girdle fabric. All measured fabrics demonstrate that the N-S trending mineral lineation is parallel to the maximum principal stretch direction (X). Topologically, the fabrics are dominantly Type II [90] cross-girdle fabrics with the two girdles intersecting in the sample Y direction and creating a Y-axis point maxima of c-axes. Samples MT-32, 33, 35 and 39 have fabrics that are transitional between Type I and II cross-girdles. Fabric opening angles (C1 + C2, Figure 18a) range between 70° and 86°, suggesting deformation temperatures of ~530–640 °C (Figure 14c and Figure 18c) using the linear opening angle thermometer of Faleiros et al., [82]. This inferred range of deformation temperatures is similar to the broad range of likely temperatures (550–680 °C) indicated by quantitative thermobarometry of metamorphic mineral assemblages in sample MT-PET-1 [95].
All quartz c-axis fabrics from samples in Area 2 are asymmetric in terms of the differences in angles C1 and C2 make between the foliation pole (Z) and the leading and trailing edges, respectively of the cross-girdle fabrics (Figure 18a,b). Shear sense interpretation of the C1 versus C2 angles with respect to present day geographic coordinates is complicated by the folding and reorientation of the foliation (but not N-S trending lineation) around the km-scale folds (Figure 14a and Figure 19a). However, on restoration of the folded foliation to an assumed originally flat-lying planar configuration the differences between C1 and C2 angles in all samples are consistent with a top to the north shear sense (Figure 19b). This shear sense interpretation is unequivocally supported by the presence of shear bands/extensional crenulations and oblique alignment (Sb) of elongate dynamically recrystallized quartz grains, including sample MT-29 from the locally overturned and steeply dipping limb of the Braemore Syncline–Beinn Dearg Anticline (Figure 14a), in which the c-axis fabric and microstructures before unfolding appears to indicate a top to the south shear sense (Figure 17).

6. Area 3: Inchbae Lodge—Rogie Falls

In Area 3 both the structurally upper part of the Moine thrust sheet and lower part of the overlying Sgurr Beag thrust sheet are exposed and are defined by stratigraphic units belonging to the upper part of the Morar Group and the lower part of the Glenfinnan Group, respectively (Figure 20). A thin (80–100 m) 1 km long sliver of highly sheared Lewisian (Archaean) orthogneiss (too small to be shown on Figure 20) is present at the base of the Glenfinnan Group rocks defining the local position of the underlying Sgurr Beag thrust [105,119,120,121,122]. The Sgurr Beag thrust and foliations in the area have a general sheet dip of ~30–35° to the SE (Figure 14a). Area 3 extends from the Inchbae Granite (an extension of the Carn Chuinneag Granite; Figure 1) in the NW, through the village of Garve and the mountains of Little Wyvis and Ben Wyvis, to Rogie Falls in the SE. A few kilometres further to the SE the high-grade metasedimentary rocks of the Sgurr Beag thrust sheet are unconformably overlain by Devonian sedimentary rocks (Figure 1).
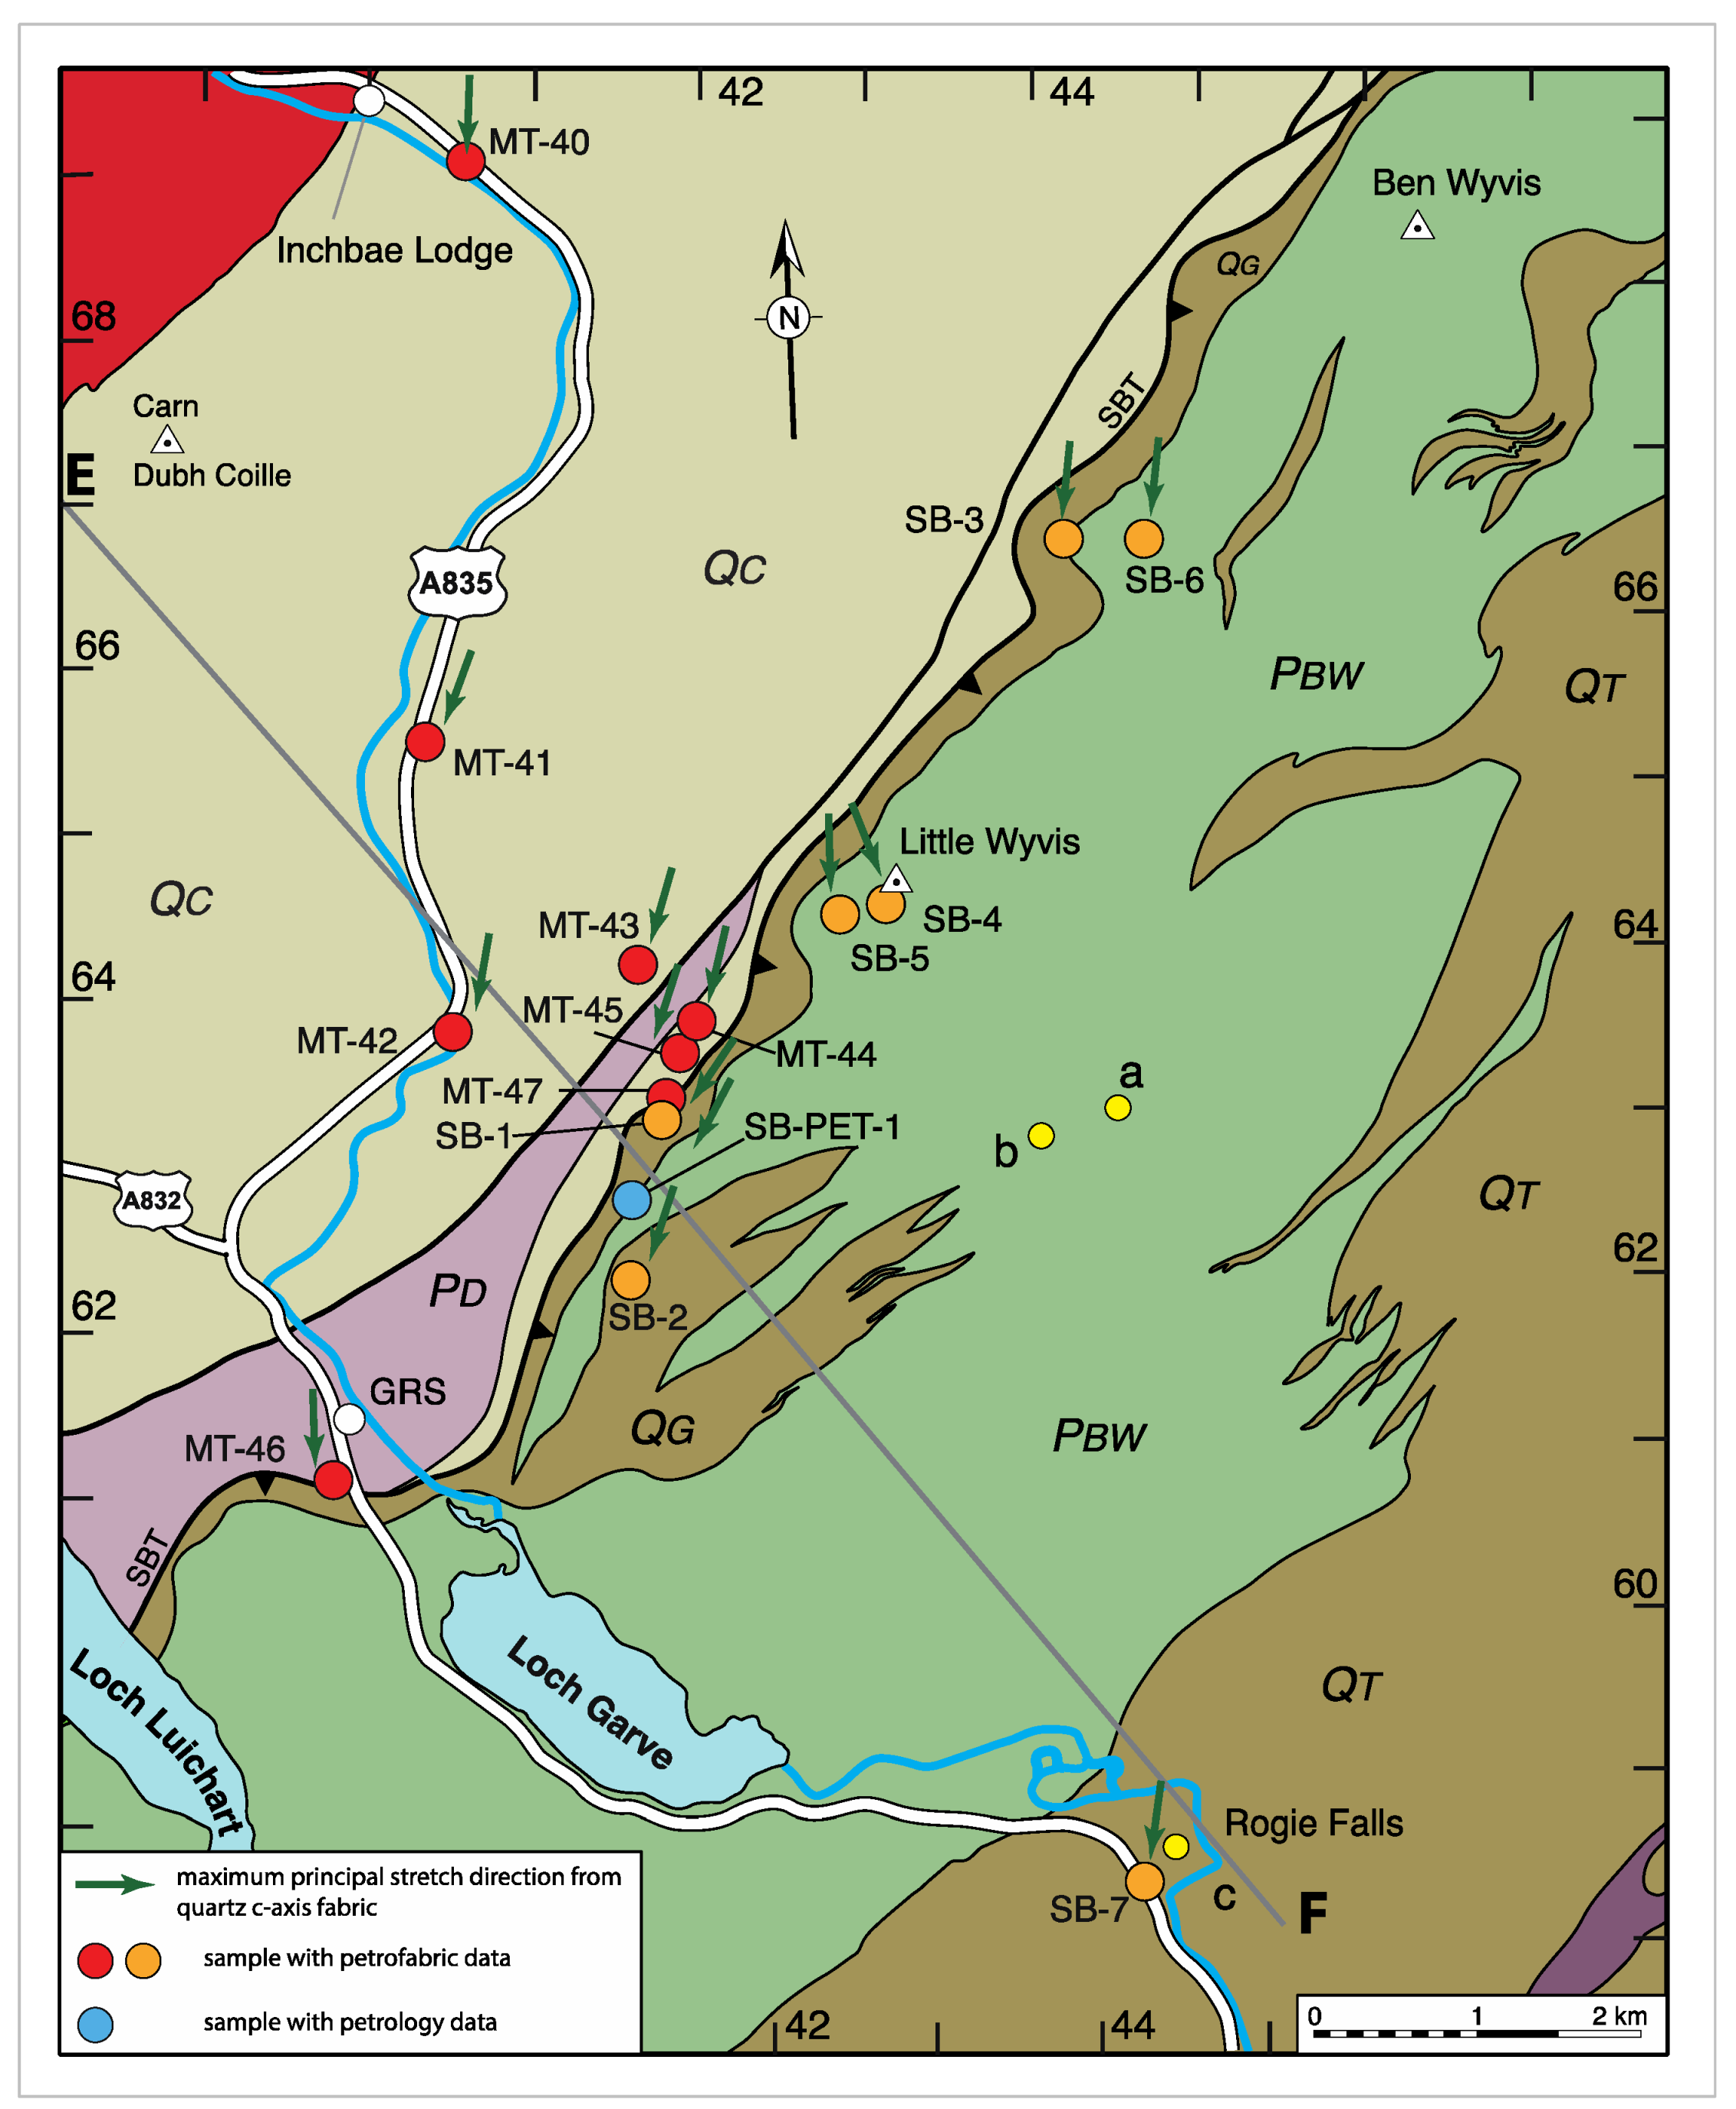
In Area 3, eight oriented samples (MT40 to MT-47) were collected from the Moine thrust sheet, and a further eight samples (SB-1 to SB-7, plus SB-PET-1) were collected in the overlying Sgurr Beag thrust sheet (Figure 20). Samples are numbered with respect to estimated structural distance below or above the Sgurr Beag thrust, with MT numbers increasing towards the overlying thrust and SB numbers increasing with increasing structural distance above the thrust (Figure 21). Grain shape foliations in both sets of samples dip gently to moderately towards the SE, while grain shape lineations on foliation (demonstrated by quartz c-axis fabrics to also be maximum principal stretch directions; see below) plunge gently to moderately to the SSW, with a vector average plunge and trend of 23° towards 190° (Figure 5d). No significant differences in orientation of either foliation or lineation between samples from the two thrust sheets were found (Figure 5d and Figure 21a).
Microstructures from the footwall and hanging wall of the Sgurr Beag thrust located to the SW of Little Wyvis in our Area 3 have previously been described by Rathbone and Harris [120], Grant and Harris [121] and Mazza et al., [95]. Quartz c-axis fabrics have also been described from these locations by Grant and Harris [121] and Mazza et al., [95]. In our current study we have incorporated the samples described by Mazza et al., [95] adjacent to the Sgurr Beag thrust (relabeled as MT-44, 45, 47, SB-1, 2 and SB-PET-1) into our larger scale study of the Moine and Sgurr Beag thrust sheets in Area 3. To ensure continuity with petrofabric analyses reported in our current study, quartz c-axis fabrics were remeasured in the five samples originally described by Mazza et al., [95] and structural distances below/above the Sgurr Beag thrust were recalculated. The precise locations of the three samples described by Rathbone and Harris [120] at 450, 170 and 5 m below the inferred position of the Sgurr Beag thrust were not given. Samples described by Grant and Harris [121] at 200 m below the thrust to a few metres above the thrust are from a linear transect coinciding with our samples MT-44 to SB-1 (Figure 20). In general, our current study confirms and expands upon these earlier studies.
Figure 21. Relationships in Area 3 samples between structural distance below/above the Sgurr Beag thrust and: (a) Trend of mineral lineation/maximum principal stretch direction indicated by quartz c-axis fabrics; (b) Geometric mean recrystallized quartz grain size; (c) Quartz c-axis fabric opening angles (C1 + C2) and deformation temperatures inferred from opening angle (using linear calibration of Faleiros et al., [82]). In (b) note decrease in recrystallized grain size approaching mapped position of Sgurr Beag thrust in both footwall and hanging wall; trends of changing grain size in footwall and hanging wall shown schematically by green curves; RH—arithmetic recrystallized quartz grain sizes estimated by Rathbone and Harris [120] at 450, 170 and 5 m beneath base of sheared Lewisian gneiss and taken to mark position of Sgurr Beag thrust in area to SW of Little Wyvis; corresponding geometric mean grain sizes are probably approximately 10 microns less than arithmetic mean grain sizes. Note also the anomalously small recrystallized quartz grain size in biotite-rich sample MT-40 adjacent to eastern boundary of Inchbae granite (cf. Figure 14 and Figure 19). 10X objective lens used in all grain measurements. Grain size data are summarized in Supplementary File S2.
Geosciences 11 00411 g021

6.1. Microstructures, Petrography and Geochronology

With one exception (MT-40, see next section) microstructures in all samples from the Moine and Sgurr Beag thrust sheets in Area 3 indicate that both quartz and feldspar have deformed plastically, forming an interlocking mosaic of grains with grain-scale sinuous/lobate grain boundaries that indicate high mobility of feldspar and quartz grain boundaries. Island grains [73] are observed in some of the particularly quartz-rich samples (e.g., MT-46 and sheared quartz vein SB-4), indicating extreme mobility of quartz grain boundaries.
Quartz grains are usually strain free, but locally exhibit undulose extinction and incipient deformation bands. Both chessboard extinction and highly sinuous grain boundary bulges are also well developed in some, but not all, quartz grains in SB-4. This is presumably related to early high temperature and later much lower temperature deformation, respectively. Orthoclase grains are frequently weathered while adjacent microcline and plagioclase grains remain unaltered. Thin lenticular/tapering deformation twins are frequently present in microcline and plagioclase grains (e.g., MT-47, SB-1, SB-PET-1, SB-3, 6). Ribbon-like feldspar grains and elongate garnet grains sandwiched between foliation-parallel white mica and biotite laths in samples MT-43 and 46 likely indicate that high temperature dissolution processes may be locally important in forming grain shape fabrics. Widely varying amounts of white mica and biotite are recorded in the different samples. In some samples two generations of white mica are present (e.g., MT-46 and SB-7) with smaller lath-like grains defining the grain shape foliation, while larger more equant grains apparently overprint the grain shape foliation. Biotite remains fresh and highly pleochroic with fox-red colour in most samples but is chloritized in SB-1 located immediately above the Sgurr Beag thrust in a lens-shaped unit of sheared Lewisian gneiss [120,121]. Anhedral garnet is present in more pelitic samples from the uppermost part of the Moine thrust sheet (MT-42, MT-43), while euhedral garnet is present in the Sgurr Beag thrust sheet (SB-PET-1, SB-2 to SB-6); see Ashley et al., [75], their Figure 4.
Recrystallized quartz grain size decreases towards the Sgurr Beag thrust in both the footwall and hanging wall (Figure 21b). Similar trends in recrystallized feldspar grain sizes were also observed but have not been quantified. In the hanging wall, the geometric mean grain size of recrystallized quartz decreases from 460 microns at 2500 m above the thrust (SB-7) to 170 microns at ~100 m above the thrust (SB-1, sheared Lewisian gneiss), with most of the grain size reduction occurring at <500 m above the thrust. In the footwall psammites, recrystallized quartz grain size decreases from 420 microns at 1300 m beneath the thrust (MT-41) to 220 microns at 25 m beneath the thrust (MT-47). It should be emphasized that in both the hanging wall and footwall this reduction in grain size of quartz (and feldspar) occurs entirely within the regime of grain boundary migration (GBM) recrystallization, although subgrain development is also locally observed in both minerals.
In the Moine thrust sheet to the SW of Little Wyvis (Figure 20), Rathbone and Harris [120] reported average recrystallized quartz grain sizes of 340, 270 and 200 microns at 450, 170 and 5 m, respectively, below the base of the sliver of sheared Lewisian taken to mark the position of the Sgurr Beag thrust (Figure 20. This reduction in grain size was interpreted as indicating an increase in strain approaching the overlying thrust, with deformation microstructures associated with thrusting being preserved due to the absence of high-grade metamorphism after motion on the Sgurr Beag thrust ceased [119,120,126].
Most samples from Area 3 lack the necessary metamorphic indicator minerals for quantitative PT analyses. However, sample SB-PET-1 from the Sgurr Beag thrust sheet at ~150 m above the thrust (Figure 20) contains the assemblage (muscovite + quartz + plagioclase + biotite + garnet + monazite + xenotime) allowing Mazza et al., [95] to calculate temperature and minimum pressure values of 595–625 °C and 5.6–7.7 kbar, respectively, for this sample (referred to as SB-12-03A by Mazza et al., [95]), based on pseudosection modeling, and 590 ± 50 °C based on garnet-biotite thermometry.
LA ICPMS geochronology of monazite consistently found in garnet rims, and xenotime consistently found in garnet cores, in this sample both yield exclusively Precambrian (~800–550 Ma) ages, implying significant garnet growth and metamorphism during Knoydartian events; precise timing constraints remain elusive due to Pb-loss or recrystallization [16,95,127]. The Precambrian ages from monazite and xenotime included within garnet, which would also indicate a Precambrian age for garnet core/rim growth based on microstructural relationships, do not provide any direct information on formation of the penetrative grain shape fabric that anastomoses around these garnet grains. PT conditions estimated by Mazza et al., [95] for SB-PET-1 would of course only relate to formation of the grain shape fabric if chemical re-equilibration of the indicator minerals used had occurred during foliation formation.
Long and Lambert [123] carried out pioneering Rb-Sr isotopic analyses of large muscovite books in the Carn Gorm pegmatite located 3 km to the east of SB-PET-1 in the Sgurr Beag thrust sheet (Figure 20, location a), obtaining Precambrian (~750–660 Ma) ages upon which the concept of the Knoydartian orogenic event was, at least in part, originally proposed. Van Breeman et al., [124] carried out more detailed Rb-Sr analyses on muscovites in the pegmatite, obtaining ages of ~700–800 Ma and showing that the oldest ages were obtained from the centers of the muscovite books with younger ages towards the margins of the books. Mineral layering in the Carn Gorm pegmatite trends parallel to foliation in the surrounding country rocks and deformation and recrystallization become stronger towards the pegmatite margins [122] suggesting that shearing and foliation in the surrounding metasedimentary rocks post-dates formation of the pegmatite [128]. U-Pb isotopic studies on zircon and monazite by Cawood et al., [32] in the Carn Gorm pegmatite and adjacent country rocks (Figure 20, location b) have yielded upper and lower intercept ages of 740 ± 8 Ma and 456 ± 4 Ma, indicating Neoproterozoic (Knoydartian) crystallization of the pegmatite followed by late Ordovician reworking. Two monazite fractions in the surrounding metasedimentary country rock yielded a 454 ± 1 Ma age, potentially indicating the timing of foliation development.
A U-Pb age of 468 ± 7 Ma obtained from euhedral titanite grains in a foliated amphibolite with a S-trending mineral lineation (Mako [16], p. 119, Mako et al., [127] their sample SB-G) from Rogie Falls (Figure 20, location c) may help to bracket the timing of foliation development in the Sgurr Beag thrust sheet in Area 3. This age was interpreted as the crystallization age of the protolith mafic intrusion, so foliation development is younger than ~470 Ma, although it is difficult to unequivocally link this age to fabrics in other samples. Nonetheless, as with the other ages mentioned above, it seems likely that the dominant fabrics in this part of the Sgurr Beag thrust sheet are Grampian or younger.

6.2. Quartz c-Axis Fabrics and Microstructural Shear Sense Indicators

Samples from the Moine and Sgurr Beag thrust sheets in Area 3 are characterized by Type II [90] cross-girdle quartz c-axis fabrics, with the only exception being sample SB-4, a sheared quartz vein which has a single girdle fabric (Figure 22). All fabrics are indicative of close to plane strain deformation conditions, and also confirm that the observed S to SSW plunging grain shape lineation in these samples is parallel to the maximum principal finite stretch direction (cf. Figure 9).
Fabric opening angles (C1 + C2, Figure 18a) in both the Moine and Sgurr Beag thrust sheets range between 68° and 84°, suggesting deformation temperatures of ~515–645 °C (Figure 14c and Figure 21c) using the linear opening angle thermometer of Faleiros et al., [82]. This inferred range of deformation temperatures is very similar to the range of likely temperatures indicated by quantitative thermobarometry of metamorphic mineral assemblages in sample SB-PET-1 at 150 m above the Sgurr Beag thrust [95]. Some of the samples with the smallest recrystallized grain sizes close to the thrust (MT-44, 45, 47, SB-1) also have the smallest recorded opening angles (Figure 21c), but no straight-forward correlation has been established between recrystallized grain size and fabric opening angle.
Sample MT-40, a highly foliated pelite with plastically deformed quartz and felspar grains located at ~2100 m beneath the thrust adjacent to the eastern margin of the Inchbae Granite, is a particular anomaly exhibiting the highest observed fabric opening angle (and hence inferred deformation temperature) but also the smallest recrystallized grain size (geometric mean grain size of 173 microns and ranging between 140 and 200 microns at the 1 standard deviation level). In this intensely foliated and lineated sample quartz and feldspar grains are pinned between biotite and white mica laths.
Of the fifteen fabrics obtained in samples from the Moine and Sgurr Beag thrust sheets in Area 3, thirteen indicate a top to the N shear sense in terms of differences in their C1 and C2 angles (Figure 18a,b). This shear sense interpretation is strongly supported by the leading edge of the cross-girdle fabrics (and the single girdle fabric in SG-4) being straighter and more clearly defined than the trailing edge in these samples (Figure 22). A top to the S shear sense is only indicated in SB-5, while the equal C1 and C2 angles in SB-6 would indicate a coaxial pure shear. Microstructural shear sense indicators are rare in these samples. Incipient, poorly defined alignment (Sb) of elongate recrystallized quartz grains in samples MT-42 and SB-6, together with shear bands in MT-43 would indicate a top to the N shear sense, while conjugate shear bands in SB-1 suggest at least a component of bulk pure shear deformation (Figure 22). Quartz c-axis fabrics measured by Grant and Harris [121] at 200 m below the Sgurr Beag thrust to a few meters above the thrust on a linear transect coinciding with our samples MT-44 to SB-1 dominantly indicated a top to the N shear sense. Top to the S or pure shear deformation was indicated by several of their fabrics which they interpreted in terms of likely contemporaneous but more complex flow surrounding a ramp on the thrust surface.

6.3. Tectonic Interpretation of Microstructures and Quartz c-Axis Fabrics in Area 3

Integration of our grain size and fabric data measured on the same samples in Area 3 (Figure 20 and Figure 22) strongly indicates that top to the N motion on at least this segment of the Sgurr Beag thrust must be contemporaneous with the pervasive regional scale top to the N shearing that we have documented in both the central-upper part of the Moine thrust sheet and the overlying Sgurr Beag thrust sheet in Areas 1–3 along a 55 km (restored length) NW-SE oriented sampling transect between Braemore Junction and Rogie Falls (Figure 19b). This shearing is likely to have occurred at temperatures of 530–630 °C (Figure 12b, Figure 14c and Figure 21c), with reduction in recrystallized grain size of quartz (and feldspar) presumably reflecting higher stress levels in the immediate hanging wall and footwall of the active Sgurr Beag thrust. Under experimental conditions recrystallized grain size is inversely proportional to stress magnitude, but independent of other variables such as strain magnitude and strain rate [129,130]. Nonetheless, numerous inter-related feedback loops probably operate during thrusting at elevated temperatures in the ductile middle crust (approximately middle amphibolite facies conditions) with localized higher stress levels leading to faster strain rates and accumulation of higher strains, as originally proposed for the Sgurr Beag thrust in Area 3 by Rathbone and Harris [120] and Rathbone et al., [126].
The age (or likely age range) of this regional top to the N shearing remains to be determined, although numerous previous studies [113,114,115,116,117] have demonstrated that foliation/lineation development in the upper part of the Moine thrust sheet must postdate emplacement of the Carn Chuinneag Granite at 594 ± 11 Ma [118]. In our sample SB-PET-1 from Area 3, ages obtained from monazite and xenotime included within garnet indicate a Precambrian age for garnet core/rim growth based on microstructural relationships [16,95], but do not provide any direct information on the age of the younger penetrative grain shape fabric that anastomose around these garnet grains. However, as noted above, U-Pb analysis by Cawood et al., [32] of two fractions of monazite in the Glenfinnan metasedimentary rocks flanking the Carn Gorm pegmatite 3 km to the east of SB-PET-1 (Figure 20, location b) yielded a 454 ± 1 Ma age. Similarly, a titanite crystallization age of 468 ± 7 Ma was obtained by Mako [16] and Mako et al., [127], their sample SB-G, from a deformed mafic intrusive with a S-trending mineral lineation at Rogie Falls (Figure 20, location c). These data potentially indicate the at least local timing of foliation/lineation development at higher structural levels in the Sgurr Beag thrust sheet. Thus, at least in Area 3 the Sgurr Beag thrust is likely a Grampian or post-Grampian structure with a northward transport direction.

7. Area 4: Creich Peninsula

Area 4 is located ~30 km along strike to the NE of Area 3 (Figure 1 and Figure 2) and contains the most northerly known exposure of the Sgurr Beag thrust separating Morar Group psammites from strongly foliated pelitic schists and gneissose psammites of the Glenfinnan Group [44,131]. This small coastal exposure provides a transect across the uppermost 500 m of the Moine thrust sheet and lowermost 270 m of the overlying Sgurr Beag thrust sheet, with lineation plunging to the ESE and SSE, respectively in the two thrust sheets (Figure 23). An inlier of Lewisianoid gneisses in the Morar psammites in the footwall to the Sgurr Beag thrust may represent either an isoclinal fold core or a sheet of basement rocks that have been interleaved with the Moine cover rocks along a ductile thrust at its base which is referred to by Grant and Harris [121] as the Creich thrust.
Five oriented samples (MT-48 to 52) were collected at 550 to 0.2 m beneath the Sgurr Beag thrust and five samples (SB-PET-2 to 3 and SB-8 to 10) were collected at 0.5 to 270 m above the thrust (Figure 23 and Figure 24). Grain shape foliation in our footwall samples dips at 40–60° towards the ESE, while grain shape lineations on foliation (demonstrated by quartz c-axis fabrics to also be maximum principal stretch directions; see below) plunge down dip to the ESE (Figure 5f and Figure 24a). Grain shape foliation in our hanging wall samples dips at 20–58° towards the ESE–SSE, while grain shape lineations on foliation plunge at 16–25° towards the ESE, and locally at 40° to the SSE.
Quartz c-axis fabrics from samples MT-52 and SB-8 at 0.2 and 100 m below and above the thrust, respectively, have previously been reported by Mazza et al., [95]. PT estimates based on metamorphic mineral assemblages and monazite and xenotime geochronology from sample SB-PET-3 have previously been reported by Mako [16] and Mazza et al., [95]. Here, however, these samples have been relabeled to conform with our system of sample numbering adopted for Areas 1–4. Microstructures from both the footwall and hanging wall of the Sgurr Beag thrust located in our Area 4, together with quartz c-axis fabrics from the footwall (locations close to our samples MT-48 and 52), have also previously been described by Grant and Harris [121]. In general, our current study confirms and expands upon these earlier studies.
Figure 23. Area 4 coastal exposure on the Creich Peninsula of the uppermost part of the Moine thrust sheet and base of the overlying Sgurr Beag thrust sheet. Position of coastal exposure indicated in Figure 1 and Figure 2. (a) Geological map with sample locations; adapted from Strachan and Holdsworth [44], Grant and Harris [121], Strachan et al., [131] and Mazza et al., [95]. (b) Cross section along line A–A’ shown in (a), indicating estimated structural distances of samples below (MT series) and above (SB series) the Sgurr Beag thrust.
Geosciences 11 00411 g023
Figure 24. Relationships in Area 4 samples between structural distance below/above the Sgurr Beag thrust and: (a) Trend of mineral lineation/maximum principal stretch direction indicated by quartz c-axis fabrics; (b) Geometric mean recrystallized quartz grain size; (c) Quartz c-axis fabric opening angles (C1 + C2) and deformation temperatures inferred from opening angle (using linear calibration of Faleiros et al., [82]). Note in (b) that grain size in recrystallized quartz ribbons is given for sheared Lewisianoid sample MT-49; recrystallized quartz grains in matrix are significantly smaller (geometric mean grain size of 180 microns) due to grain boundary pinning by amphibole and mica grains. Additionally, in sample SB-PET-2 only grains in quartz-rich layers were measured; quartz grains in matrix are pinned by micas and smaller. Grain size data are summarized in Supplementary File S2.
Geosciences 11 00411 g024

7.1. Microstructures and Petrography

Microstructures in all samples from the Moine and Sgurr Beag thrust sheets in Area 4 indicate that both quartz and feldspar have deformed plastically, forming an interlocking mosaic of grains with grain scale sinuous/lobate grain boundaries, and indicating high mobility of feldspar and quartz grain boundaries. However, in some samples (e.g., SB-9), exceptionally large (2–4 mm) rounded to elliptical clasts of orthoclase feldspar appear to have behaved rigidly, with the grain shape fabric defined by micas and much smaller (300–500 micron) quartz and feldspar grains anastomosing around the clasts.
Quartz grains are usually strain free, but locally exhibit undulose extinction and tilt walls/subgrain boundaries. Unlike in Area 3, more pronounced internal strain features such as deformation bands are rarely observed in quartz grains from the Moine thrust sheet in Area 4, suggesting the more efficient operation of recovery mechanisms [121]. Ribbon-like domains of recrystallized quartz measuring 500–600 microns in width and locally extending the length of an individual thin section are present in samples MT-49 (sheared Lewisianoid gneiss) and MT-52 (Morar psammite). In Glenfinnan psammite sample SB-10 quartz-rich domains are characterized by foliation-parallel plate-like quartz grains measuring up to 1000 microns in length which have recrystallized internally to form smaller more equant grains with tilt walls oriented parallel to prism and (less commonly) basal planes. Where both sets of tilt walls are present in the same grain, they form incipient chessboard extinction microstructures. Foliation-parallel mica laths within these grains indicate that quartz grain boundaries were highly mobile (GBM 2 regime of Stipp et al., [73,74]). Ribbon-like orthoclase feldspar grains sandwiched between foliation-parallel quartz and white mica and biotite laths in samples MT-48 and MT-51 probably indicate the local importance of high temperature dissolution processes in forming grain shape fabrics. Biotite remains fresh and highly pleochroic with fox-red color in all samples.
Measured in relatively quartz-rich domains where grain boundary pinning should be minimal, recrystallized grain size increases traced structurally upwards from the Moine thrust sheet into the Sgurr Beag thrust sheet (Figure 24b). Similar trends in recrystallized feldspar grain sizes were also observed but have not been quantified. In the footwall geometric mean grain size increases from 300 microns (MT-48) at 550 m beneath the thrust to 332 microns (MT-52) at 0.2 m beneath the thrust. In the hanging wall geometric mean grain size increases more rapidly from 345 microns at 0.5 m above the thrust to 434 microns at 270 m above the thrust. In both the footwall and hanging wall this transition in quartz (and feldspar) grain size occurs entirely within the regime of grain boundary migration (GBM) recrystallization. This grain size transition in Area 4 is in direct contrast with our traverse across the Sgurr Beag thrust in Area 3, where recrystallized grain size decreases towards the thrust in both the footwall and the hanging wall (cf. Figure 21b and Figure 24b).
Pelite samples SB-PET-2 and 3 located at distances of ~0.5 and 3.0 m above the Sgurr Beag thrust, respectively, contain the assemblage quartz + orthoclase + plagioclase + muscovite + biotite + garnet + staurolite + ilmenite + apatite. In SB-PET-3 garnet is commonly retrogressed and replaced by quartz + plagioclase + biotite. Muscovite and biotite define the foliation and predominantly pin quartz grain boundaries. Foliation wraps around larger garnet and feldspar grains, and some of the feldspar augen display undulose extinction, subgrains and lobate grain boundaries. Pseudosection modeling and observed mineral abundances in SB-PET-3 indicates a PT range of 600–615 °C and 5.6–6.1 kbar, while PT conditions indicate by THERMOCALC are 610 ± 50 °C and 5.1 ± 1.4 kbar, and garnet-biotite thermometry indicate temperatures of 660 ± 50 °C [95].
Unlike sample SB-PET-1 from Area 3, SB-PET-3 from Area 4 is extremely monazite-rich with 100+ grains in the matrix of a single thin section and only 3 grains included in garnet [16,95]. Ten xenotime grains (including two included in garnet) were identified in SB-PET-2 and isotope data yielded exclusively Precambrian ages from monazite and xenotime inclusions in garnet. Distinct populations of Knoydartian and Caledonian matrix monazite were identified in SB-PET-2. Scandian monazites gave an intercept age of 420 ± 3 Ma, while a regression of exclusively Precambrian analyses yielded intercept ages of 541 ± 27 Ma and 909 ± 65 Ma [16,95,127]. Monazite-xenotime thermometry using the Scandian matrix monazites yielded temperatures of 610 ± 20 °C using the calibration of Heinrich et al., [132]. Monazite ages were interpreted as being associated with peak or post-peak Scandian temperatures, but Mako [16] and Mazza et al., [95] cautioned that metamorphic conditions, constrained by thermometry and pseudosection analyses, for the Sgurr Beag thrust sheet in Area 4 could be associated with Scandian, Grampian or Knoydartian tectonism.

7.2. Quartz c-Axis Fabrics and Microstructural Shear Sense Indicators

Samples from the Moine thrust sheet in Area 4 are characterized by Type II [90] cross-girdle quartz c-axis fabrics (Figure 25). All fabrics are indicative of close to plane strain deformation conditions, and also confirm that the observed ESE plunging grain shape lineation in these samples is parallel to the maximum principal finite stretch direction (cf. Figure 9). Fabric opening angles (C1 + C2) range between 62° and 75°, suggesting deformation temperatures of ~476–576 °C (Figure 24c) using the linear opening angle thermometer of Faleiros et al., [82]. In sample MT-52 many of the recrystallized grains in the quartz ribbons have their c-axes oriented at a low angle to the sample Y direction, producing an intense Y-axis maxima in the c-axis fabric and indicating at least the local dominance of prism <a> slip.
All samples from the Moine thrust sheet in Area 4 indicate a top down to the ESE shear sense in terms of differences in their C1 and C2 angles (Figure 26). This shear sense interpretation is strongly supported by the leading edge of the cross-girdle fabrics being straighter and more clearly defined than the trailing edge in these samples (Figure 25). This shear sense is also strongly supported by shear bands and extensional crenulations which deflect the main foliation (samples MT-49, 50 and 52) and by the incipient alignment (Sb) of elongate recrystallized quartz grains in samples MT-48 and 52 m (Figure 25).
Unequivocal shear senses are difficult to determine in garnet-rich Glenfinnan pelite samples SB-PET-2 and SB-PET-3 at 0.5 and 3.0 m above the Sgurr Beag thrust. Foliation anastomoses around the large garnet grains in these samples and opposite shear senses are locally produced on opposing sides of the garnet grains. In SB-PET-2 wings of recrystallized quartz and feldspar on the garnets are locally either symmetric or sigma-shaped and indicate top up to the WNW or down to the ESE shear senses in individual cases. In SB-PET-2 shear bands containing white mica and fresh fox-red biotite laths and large (3–10 mm long) white mica ‘fish’ with tails that curve into adjacent shear bands also locally indicate either top up to the WNW or top down to the ESE shear senses, potentially forming conjugate sets, although the top down to the ESE sets are perhaps more widely developed. SB-PET-3 contains significantly higher amounts of feldspar (orthoclase and plagioclase with deformation twins) and lower amounts of quartz than SB-PET-2; top to the WNW shear bands are dominant in this sample.
Quartz c-axis fabrics from the Sgurr Beag thrust sheet in Area 4 are radically different from fabrics in the underlying Moine thrust sheet. In the three samples analyzed the fabrics consist of two dominant point maxima oriented at a high angle to the foliation pole and at up to ~30° to the XZ plane which are connected by small circle distributions of c-axes centered about the lineation (Figure 25; samples SB-8, 9 and 10). Small circle c-axis fabrics centered about the maximum principal stretch direction (colloquially referred to as cleft girdle fabrics) are often regarded as being diagnostic of constrictional strains [84]. However, in these samples both grain shape foliation and lineation are well-developed suggesting approximate plane strain conditions. These double point maxima fabrics are similar to fabrics described by Kruhl and Huntemann [133], Kruhl [81], Morgan and Law [134] and Falleiros et al., [82] from quartzites deformed at high temperatures (~700–1000 °C) and/or under extreme hydrolytic weakening. C1 + C2 fabric opening angles for samples SB-8, 9 and 10 indicate deformation temperatures of 736, 614 and 600 °C (Figure 24c) using the linear opening angle thermometer of Faleiros et al., [82].
Samples SB-9 and 10 have closely similar C1 and C2 angles (Figure 26) suggesting close to pure shear deformation conditions. However, asymmetric sigma-shaped wings of recrystallized quartz on some of the largest feldspar clasts in SB-10 indicate a component of top down to the ESE shearing. In sample SB-8 a strong asymmetry in C1 and C2 angles is also indicative of a top down to the ESE shear sense and this interpretation is supported by the incipient alignment (Sb) of elongate recrystallized quartz grains.

8. Contrasting Interpretation of Microstructures and Quartz c-Axis Fabrics in Area 4 and Areas 1–3

In Area 4, although apparently higher temperature deformation microstructures suggesting reverse sense motion are observed in the hanging wall to the Sgurr Beag thrust, both microstructures and quartz c-axis fabric indicate pervasive top down to the ESE shearing in the uppermost 550 m of the Moine thrust sheet and the lowermost 270 m of the Sgurr Beag thrust sheet in Area 4. A simple potential explanation of these apparently conflicting observations is that original reverse sense motion on the thrust has been overprinted by pervasive normal sense shearing of the hanging wall and footwall rocks while they remained at close to peak temperatures.
Although the sampling transect in Area 4 is admittedly at a much smaller scale than the transects in Areas 1–3, this indicates a major change in tectonic transport direction and movement sense from top to the WNW shearing documented at the base of the Moine thrust sheet in the western part of Area 1 to top to the N shearing we have documented across the upper part of the Moine thrust sheet and overlying Sgurr Beag thrust sheets in Areas 1–3. As mapped (Figure 1), the Sgurr Beag thrust in Area 4 appears to be a straight-forward along strike continuation of the thrust in Area 3, and yet the kinematic frameworks deduced from the microstructures and quartz c-axis fabrics in the two areas are totally different.
In Area 4 recrystallized quartz grain size steadily increases from footwall to hanging wall across the Sgurr Beag thrust (Figure 24b), possibly indicating that the pervasive top down to the ESE shearing postdates the main motion on the thrust which was responsible for placing Glenfinnan Group over Morar Group rocks. In contrast, in Area 3 recrystallized quartz grain size steadily decreases towards the Sgurr Beag thrust both in the footwall and hanging wall (Figure 21b) suggesting that top to the N motion on the Sgurr Beag thrust was synchronous with larger scale top to the N shearing that we have documented as being pervasive in both the upper part of the Moine thrust sheet and the overlying Sgurr Beag thrust sheet.
Dating these shearing events is made more complex by the undoubtedly Precambrian phases of metamorphism in these rocks. As discussed above, top to the N pervasive shearing and associated foliation/lineation development in the Moine thrust sheet in Areas 2 and 3 is known to be younger than the c. 594 ± 11 Ma Carn Chuinneag granite [112,113,114,115,116,117,118]. Within the Sgurr Beag thrust sheet in Area 3, monazite ages of 454 ± 1 Ma in Glenfinnan Group metasedimentary rocks surrounding the Carn Gorm pegmatite [32] provide at least a first hint of the possible age of top to the N shearing which would fall between the classical phases of Grampian and Scandian deformation. In contrast, U-Pb ages of 420 ± 3 Ma from Scandian matrix monazites at the base of the Sgurr Beag thrust sheet in Area 4 [16,95,127] could indicate that top down to ESE shearing is significantly younger and related to the closing stages of Scandian deformation and metamorphism.

9. Tectonic Summary of Areas 1–3 and Regional Context

Our quartz c-axis fabric analyses of Moine metasedimentary rocks in the Moine and Sgurr Beag thrust sheets in Areas 1–4 (Figure 1 and Figure 2) unequivocally demonstrate that macroscopic L2 mineral lineations on foliation planes in all 61 oriented samples analyzed are parallel to the maximum principal stretch direction, indicating they have developed parallel to, and track, the local transport direction.
Microstructures and c-axis fabrics in samples from Area 1 demonstrate a progressive change from top to the W, through top to the NW, to top to the NNW shearing traced southeastward and upwards from the Moine thrust plane over a structural distance (measured perpendicular to the thrust) of ~4200 m (Figure 3 and Figure 4). Further to the east in Area 2 microstructures and fabrics (Figure 17) indicate top to the N shearing that predates formation of km-scale W-vergent folds that are thought to detach on the underlying Moine thrust (Figure 14 and Figure 19a). Further east again in Area 3 microstructures and fabrics (Figure 22) in both the upper part of the Moine thrust sheet and the overlying Sgurr Beag thrust sheet (Figure 14 and Figure 20) indicate top to the NNE shearing. Top to the west shearing in the Moine mylonites immediately above the Moine thrust occurred under upper greenschist facies conditions (~450–500 °C), while top to the NW/N/NNE shearing in the overlying and more hinterland parts of the Moine thrust sheet and overlying Sgurr Beag thrust sheet occurred under lower amphibolite facies conditions (~500–630 °C).
Traced from northwest to southeast across Areas 1–3 the zone of top to the NNW/N/NNE shearing is at least 55 km wide in map view after allowing for restoration of the later km-scale W-vergent folds in Area 2 (Figure 19b), with its easternmost extent unknown as it is overlain by younger Devonian sedimentary rocks. However, even though pervasive top to the N shearing (and top to the W shearing closer to the foreland) is of regional extent across Areas 1–3, preservation of sedimentary structures in relatively low strain parts of the Moine thrust sheet indicate that the Morar Group metasedimentary rocks were stratigraphically right way-up at the regional scale before later W-vergent folding [56]. The originally right way-up configuration of the Morar Group rocks continues northwards from our sampling transect within the Moine thrust sheet [20,56,70,92,116,120,128,135,136,137,138,139] into the Ben Hope thrust sheet exposed on the north coast in the Kyle of Tongue area [52,140] (Figure 1). Sedimentary way-up indicators are only rarely preserved in the Glenfinnan Group rocks of the Sgurr Beag thrust sheet [128,136], but regional scale mapping of their unconformable relationship with underlying Lewisianoid (Archean) inliers and their conformable relationship with the overlying Loch Eil Group (see review by Strachan et al., [34]), suggests that they are broadly right way-up. The pervasive top to the N shearing that we have documented across Areas 1–3 is not therefore thought to have resulted in regional scale recumbent folding and overturning within the Morar and Glenfinnan groups of metasedimentary rocks.

9.1. Frank Coles Phillips and Early Interpretation of Tectonic Transport Directions

The ~90° clockwise change in trend of L2 mineral lineations traced from the Moine thrust eastwards into the overlying Moine and higher thrust sheets has been extensively documented not only in our study Areas 1–3, but over a much wider area extending from the north coast southwards to at least the Strathconon fault (Figure 2), with regional mapping by the British Geological Survey in the 1900s to early 1930s followed by more focused studies of individual areas by university-based geologists (see references and locations summarized in Figure 2 of Law and Johnson [6]). Speculation on the importance of this arcuate pattern of lineations as a potential indicator of changing transport direction within the Moine metasedimentary rocks was probably first made by Frank Coles Phillips who carried out pioneering quartz c-axis fabric analyses on a suite of 31 oriented hand samples [141] collected from the area shown in Figure 2. These fabrics were presented in a geographic reference frame, rather than the sample reference frame (Figure 9) now employed, making their kinematic interpretation more difficult (see review by Law and Johnson [6]).
As with the c-axis fabrics we have described in our Study Areas 1–4 (Figure 10, Figure 11, Figure 17, Figure 22 and Figure 25) Phillips [141] noted that the single and cross-girdle c-axis fabrics in his samples were oriented perpendicular to lineation, but followed the prevailing convention of the time that tectonic transport was oriented parallel to the girdle c-axis fabrics and hence perpendicular to lineation in his individual samples. This led to the conclusion that E-trending lineations in the Moine mylonites in the immediate hanging wall to the Moine thrust were associated with a N-S transport direction, while the S trending lineations to the east were associated with E-W transport, although the sense of motion (e.g., top to the north or south) could not be determined from the fabrics at that time (see historical reviews by Howarth and Leake [142]; Law and Johnson [6]). As outlined above, we now know that girdle c-axis fabrics develop at right angles to the maximum principal finite stretch direction (Figure 9) and hence also at right angles to transport. The original combined lineation and petrofabric data described by Phillips [141] which, supported by a more data intensive study by Crampton [143], extended from the north coast southwards for ~130 km through our Study Areas 1–3, can now be reinterpreted as indicating W-E trending maximum principal stretch directions and associated tectonic transport in the Moine mylonites immediately above the Moine thrust, that progressively swing clockwise around to NW-SE and then N-S trending stretch directions and associated transport traced eastward into the hinterland.
To the south of our Study Areas 1–3 these conclusions are supported by quartz c-axis fabrics (also presented in geographic reference frames) reported from mylonites immediately above the Moine thrust in the Coulin and Lochcarron areas [25,26,27] (Figure 2, locations c-e, respectively; W-E to NW-SE trending maximum principal stretch directions) and further to the southeast in the Scardroy [28], Loch Monar [29], Loch Luichart [30] and Glen Orrin [31] areas (Figure 2, locations f–i, respectively; NW-SE to N-S trending maximum principal stretch directions). Unfortunately, it has proved impossible to deduce shear senses relative to present day geographic coordinates from any of these historical petrofabric data sets [144]. Further to the south of our Study Areas in the Glen Garry region (GG in Figure 2) Holdsworth and Roberts [145] have described N-S trending mineral lineations associated with ‘test tube’ sheath folds which they argued formed parallel to the maximum principal stretch direction. Shear senses in these local D2 structures could not be determined however, and it remained an open question if they formed during top to the N or top to the S tectonic transport.

9.2. Documentation of Shear Senses Associated with Changing Transport Direction

Top to the W shearing associated with E to ESE trending lineations in the mylonites in the immediate footwall and hanging wall to the Moine thrust has been accepted since the early 1880s (e.g., Lapworth [146]; Callaway [147]; Geikie [1]; Peach and Horne [148]; Lapworth [149,150]; Peach et al., [151]) and subsequently confirmed using microstructural and crystal fabric shear sense criteria introduced in the 1970s (see review by Law and Johnson [6]). Within the Moine metasedimentary rocks to the east, however, although the domains of NW-SE and N-S trending lineation (Figure 2) have often been referred to as being associated with northwest and northward-directed transport, shear sense criteria (either macroscopic or microscopic) supporting this interpretation have rarely been described. Important exceptions to this general observation include microstructural and quartz c-axis fabrics studies (for SE plunging lineations) in the upper parts of the Moine thrust sheet and overlying Ben Hope thrust sheet in the Tongue/Ben Hope area to the east of Loch Eriboll [52,152,153,154] and the upper part of the Naver thrust sheet and the overlying Skinsdale thrust sheet surrounding the sheared Strath Halladale Granite [45].
Based on optically measured quartz c-axis fabrics and microstructures, Thigpen et al., [18], their Supplementary File S2, have documented a transition from top to the W to top to the NW shearing traced southeastwards from the Moine thrust across the Moine and Ben Hope thrust sheets into the leading edge of Naver thrust sheet (Figure 1 and Figure 2, transect labelled b). Similarly, on a transect across the Moine thrust sheet into the leading edge of the Ben Hope thrust sheet located ~5 km to the north of the Thigpen et al., [18] transect, Lusk and Platt [155] have recently documented a transition from top to the W to top to the NW shearing, based on microstructures and EBSD-derived quartz c- and a-axis fabrics.
To the best of our knowledge, no previous studies have documented shear senses associated with the domains of N-S trending lineations in the northern part of the Moine and overlying Naver and Swordly thrust sheets (Figure 1 and Figure 2). As mentioned above, further to the south in the Ben Wyvis/Garve area (our Area 3) top to the N shear senses have previously been determined by Grant and Harris [121] and Mazza et al., [95] from the domain of N-S trending lineations in the immediate hanging wall and footwall to the Sgur Beag thrust, based on microstructures and quartz c-axis fabrics. Our new data build on this earlier work, delineating what was originally an at least 55 km wide domain of top to the N shearing (Figure 19b) that extends westwards from Rogie Falls to Braemore Junction (Areas 1–3) where there is then a rapid transition from top to the N shearing through top to the NW to top to the W shearing on the underlying Moine thrust.

9.3. Structural Positions of Changing Transport Directions

In Area 1 the transition from top to the W through top the NW to top to the N shearing occurs close to the Moine thrust in map view, with the associated lineations defining an arcuate map pattern of E to SE to S plunging lineations (Figure 2 and Figure 3). Measured perpendicular to the map trace of the Moine thrust, SE plunging lineations are first recorded at ~2 km from the thrust. This map distance between the Moine thrust and first appearance of SE plunging lineations remains fairly constant traced from Area 1 southwards towards Loch Carron at the southwestern edge of Figure 2.
Traced northwards from Area 1 the map distance between the Moine thrust and first appearance of SE plunging lineations within the Moine thrust sheet increases to ~20 km at Knockan Crag (K in Figure 2). On the north side of the Oykel Transverse Zone in the Cassley Culmination [21] (OTZ and CC in Figure 2) the first appearance of SE plunging lineations is within the lower part of the Ben Hope thrust sheet at ~5 km from the Moine thrust. This map distance gradually increases traced towards the north and near the north coast the first appearance of SE plunging lineations is in the upper part of the Ben Hope thrust sheet at ~20 km from the Moine thrust. This regional scale obliquity in map view between the trace of the Moine thrust and the arcuate pattern of lineations suggest that the arcuate pattern is not, at least in any simple way, related to motion on the underlying Moine thrust.
Alsop et al. [55] (their Figure 9) have interpreted the swing from E to SSE plunging lineations traced eastwards across the Moine, Ben Hope and Naver thrust sheets (Figure 2) in terms of spatially and temporally varying components of simple and pure shear within the internally deforming Caledonian orogenic wedge. Alsop and Holdsworth [156,157] and Alsop et al., [158] have noted that their ‘flow perturbation’ folds (generated by variations in flow within underlying mylonitic high strain zones) ‘follow’ this swing in lineations across the thrust sheets suggesting: (a) lineation must remain parallel to transport as it swings; and (b) the folding they observe of overlying thrusts by ‘flow perturbations’ linked to underlying thrusts indicates a broadly foreland-propagating system.
Compared with the arcuate map pattern of E to SE to S plunging lineations mapped in Areas 1-3, the map pattern of lineations to the north of the Cassley Culmination is developed at a larger scale. Measured perpendicular to the Moine thrust the transition from southeast to south trending lineations occurs at distances of 6–15 km in Areas 1–2 (Figure 3, Figure 4 and Figure 14) within the foreland edge of the Moine thrust sheet, but at a map distance of ~30–40 km traced through the Moine, Ben Hope and Naver thrust sheets in the north (Figure 2). These two arcuate lineation domains are separated from each other by an ~20 km wide WNW-ESE trending band of SE to E trending lineations on the Cassley Culmination (CC in Figure 1 and Figure 2) that extends from the southern part of the Assynt Culmination through Lairg towards the east coast.
These two domains may also represent different crustal levels. Traced from Knockan Crag (Figure 2) southwards the Moine thrust is a brittle fault separating (with the exception of slivers of mylonitic Cambrian quartzite in the Ullapool Valley) [64] locally brecciated Moine mylonites in the hanging wall from brecciated but non-mylonitic rocks in the footwall. In contrast, from southern Assynt northwards the Moine thrust has mylonitic rocks in both its hanging wall and footwall, suggesting a deeper crustal level (see review by Law and Johnson [6]). Similarly, Strachan et al., [23] have suggested the Moine metasedimentary rocks exposed in Sutherland (northern domain) may represent a deeper crustal level than the Moine exposed in Ross-shire and Inverness-shire (southern domain) based on: (a) the focusing of intrusions that are partly mantle-derived along the Naver and Skinsdale thrusts, compared with their absence along the Sgurr Beag thrust; (b) the considerably greater amount of Archean and Paleoproterozoic basement exposed within the Moine thrust sheet in Sutherland. A fourth line of evidence for shallower crustal levels in the south may be the preservation of Neoproterozoic (Knoydartian) xenotime and monazite grains as inclusions in garnet cores and rims within the Sgurr Beag thrust sheet (Areas 1 and 3) [16,95] compared with their only very rare preservation [16,127] in the Naver thrust sheet, suggesting a far more pervasive Scandian age overprinting of any pre-existing Knoydartian signature in the north [95,159].

9.4. Age or Age-Range of Arcuate Lineation Patterns and Their Tectonic Setting

Strachan et al., [24] have recently argued that the arcuate lineation patterns of the type preserved in the Moine could result from one or more of three possible scenarios: (1) reorientation of a linear fabric by a later deformation event; (2) heterogeneity in the magnitude and direction of shear combined with strain partitioning during regional transpression; (3) different generations of lineations associated with separate deformation events.

9.4.1. Reorientation of a Linear Fabric by a Later Deformation Event

Within our Area 1 the first of the above scenarios—later reorientation of an originally constantly trending linear fabric—is most unlikely as the ~90° swing in lineation trend is entirely recorded within the ~4 km thick belt of planar gently dipping Moine mylonites and schists lying directly above the Moine thrust (Figure 4, Figure 5b and Figure 14). As summarized in Figure 13c–e, different ranges of lineation trend are recorded at different structural heights above the thrust in these planar tectonites, indicating that transport direction is changing with structural height. It is geometrically unclear how a distinct episode (or episodes) of superimposed deformation could in practice rotate originally constantly trending lineations through 90° while simultaneously leaving the planar fabrics containing the lineations undistorted.

9.4.2. Heterogeneity in the Magnitude and Direction of Shear—Lineations Associated with One Deformation Event

Viewed at the regional scale, the gradual change in lineation trend without any obvious sudden changes in trend intuitively suggests the operation of a continuous tectonic process, rather than a series of discrete tectonic events. For example, traced from Loch Eriboll southeastwards across the Moine, Ben Hope and Naver thrust sheets the gradual 90° change in lineation trend from E trending on the Moine thrust mylonites to S trending in the Naver thrust sheet suggests that all lineations may be of Scandian age. This interpretation is strongly supported by the pervasive and well documented Scandian metamorphism and deformation in the Naver thrust sheet [16,23,24] that overlaps with, and may have outlasted by several Myr., marginal top to the W thrusting on the Moine thrust at 430 Ma in the Assynt region [48]. Thus, at least in this area, the arcuate lineation pattern may be a ‘snapshot’ of different transport directions, of at least close to contemporaneous Scandian age, operating at different crustal levels.
A remarkably similar arcuate lineation pattern associated with Late Silurian–Early Devonian age northward (orogen-parallel) and northwestward directed tectonic transport has been documented in the Caledonides of NE and SE Greenland [160,161,162,163,164], suggesting that tectonic processes responsible for formation of arcuate lineation patterns may operate at the orogen scale. Soper et al., [165] have argued that such arcuate changes in lineation trend may be due to a gradual change in the strain fields associated with changes in the direction of plate convergence. Dewey and Strachan [166] have argued that such arcuate lineation patterns in the Caledonian Orogen of northern Scotland and East Greenland may be due to a progressive partitioning of deformation into orogen-parallel flow and orogen perpendicular thrusting within a sinistral orogen-scale transpressional tectonic setting. However, the overall approximately plane strain (k = 1) conditions indicated by our cross-girdle quartz c-axis fabrics in Areas 1–3 may be at odds with a transpressional setting as bulk transpression commonly results in non-plane strains; see reviews by Fossen [8], Fossen & Teyssier [167], Dewey et al., [168] and Fossen [169], p. 411.
In the case of our study areas in northern Scotland, if the Moine thrust zone in Area 1 was active until c. 420–415 Ma [51] then brittle upper crustal thrusting along the margin of the orogen (at least to the south of Knockan) may have overlapped with early strike-slip motion on the Great Glen Fault and related structures [24]. However, if, as suggested above, top to the N shearing in the upper part of the Moine thrust sheet and the overlying Sgurr Beag thrust sheet (Areas 2 and 3) occurred at ~470–450 Ma, this clearly predates both documented motion on the Moine thrust zone and any early strike-slip motion on the Great Glen Fault.

9.4.3. Different Generations of Lineations Associated with Separate Deformation Events

In Sutherland the regional scale arcuate map pattern of lineations has traditionally been regarded as a composite of Grampian and Scandian orogenic events. Scandian reworking associated with broadly NW-directed transport is generally regarded as being dominant in the Moine, Ben Hope and Naver thrust sheets, while both field and isotopic evidence suggest that Grampian structures characterized by N-S trending lineations may predominate in the structurally higher Swordly thrust sheet, although no kinematically consistent indicators have been found that might establish the shear sense/transport direction [24]. This interpretation has been extended to the Sgurr Beag thrust sheet on the basis of a 470 ± 2 Ma age for titanites in the West Highland Granitic Gneiss near Fort Augustus [170] (Figure 2). The titanites were aligned within the foliation which carries a N-S trending mineral lineation.
As discussed above, the E-trending lineations and their associated microstructural and crystal fabric indicators of top to the W shearing in the planar Moine metasedimentary rocks immediately above the Moine thrust in our Area 1 are undoubtedly of Scandian (~435–415 Ma) age, given their Rb-Sr white ages of c. 429–408 Ma that were interpreted by Freeman et al., [51] as indicating general cessation of ductile deformation in the mylonites at c. 430 Ma, although deformation may have continued in a less pervasive manner until at least 408 Ma. In contrast, the originally at least ~55 km wide domain of SSE to S to SSW trending lineations and their associated top to the N shear indicators in Areas 1, 2 and 3 (Figure 19b) is demonstrably older as the foliation containing this lineation is folded about west-vergent km-scale folds that appear to detach onto the underlying Moine thrust (Figure 4a and Figure 14a). The grain shape fabrics associated with this top to the N shearing are generally accepted as postdating intrusion of the c. 594 Ma Carn Chuinneag granite. On purely structural grounds these observations could be interpreted in terms of either: (1) a progressive Scandian foreland-propagating sequence (albeit with changing transport directions) in which earlier formed structures are deformed by folds that root into lower, later structures, or (2) spatially and temporally discrete tectonic events associated with top to the N and later top to the W shearing.
U-Pb ages from the Sgurr Beag thrust sheet in Area 3 on monazite in metasedimentary rocks and titanite in a sheared amphibolite with S-trending mineral lineation (Figure 20, locations b and c) of 454 ± 1 Ma and 468 ± 7 Ma, respectively [16,32], may be tentatively interpreted as indicating that the grain shape fabrics associated with top to the N shearing in Area 3 may be of Grampian (~460–480 Ma) or slightly younger age. In this scenario the rare N-trending mineral lineations documented by Holdsworth [54] and Holdsworth et al., [52] in the Ben Hope thrust sheet exposed in the Kyle of Tongue area on the north coast (Figure 1), that are overprinted by Scandian D2 fabrics with SE plunging lineations (see Section 2), could also be of Grampian age.

9.5. Domainal Distribution of Deformation Microstructures and Lineation Trends in Area 1—Tectonic Implications

Plotted in terms of map distance from the trace of the Moine thrust our lineation data for Areas 1–3 suggest a fairly smooth overall transition from E to SE to S trending lineations (Figure 4b, Figure 13d and Figure 14b). Plotting the lineation data in terms of structural height above the thrust, however, indicates a significant variation in trend at specific heights above the thrust (Figure 13c,e). For example, lineation in the mylonites in the immediate hanging wall to the thrust (0–400 m) range from ~070 to 115° in trend, while lineations at 1000–3500 m above the thrust range from 135 to 165° at all structural heights. Within each domain all lineations regardless of trend are associated with the same quartz recrystallization microstructures, indicating that they have formed under similar deformation temperatures. Assuming that the lineations in each domain are of essentially the same age, then the 35–45° range of lineation trends in each domain would seem to indicate a significant component of rotation associated with thrusting and tectonic transport.
There may be an abrupt change in lineation trends between these domains potentially indicating the presence of distinct structural/kinematic regimes associated with different transport directions (Krabbendam et al., [56], p. 15), but we only have one sample from the intervening ground (MT-7 in Figure 13c), making any definitive identification of an abrupt change in transport direction impossible. Certainly, the smooth change from high to relatively low temperature quartz and feldspar recrystallization microstructures traced downwards towards the Moine thrust (Figure 8) would at first sight seem to indicate a progressive change from top to the N to top to the W shearing under progressively lower temperatures—although the potential influence of increasing strain rate on these microstructures must be kept in mind. However, we regard this apparent progressive change in deformation temperature with distance above the thrust as misleading because, as noted above, the grain shape foliation containing the N-S lineations is folded about km-scale folds that detach onto the underlying Moine thrust and may be of Grampian, rather than Scandian, age.
The precise structural distance above the Moine thrust at which potential Grampian age structures transition downwards into undoubted Scandian structures within the gently dipping sequence of Moine metasedimentary rocks in Area 1 (Figure 4a) is uncertain. Arguably the most logical position would be at approximately 500–1500 m above the thrust where lobate quartz-feldspar and feldspar-feldspar grain boundaries first appear (Figure 6). Deformation temperatures inferred from these microstructures are far higher than would be expected given their short distance from the underlying upper greenschist facies Moine mylonites, and therefore they could have formed in an older and unrelated tectonic event at higher metamorphic grade. This structural position also broadly coincides with the transition from mixed SGR-GBM to GBM recrystallization of quartz and a two-fold increase in recrystallized grain size of quartz (Figure 8).
Our 40Ar-39Ar white mica data (Figure 15) indicate that sample MT-10 with a lineation trend of 135° at 1220 m above the Moine thrust in Area 1 was cooling through ~400 °C at c. 432 Ma. These estimates are remarkably similar to findings of Freeman et al., [51] who, based on petrologic and Rb-Sr data, estimated that white micas in the underlying Moine thrust mylonites in Area 1 dynamically recrystallized at temperatures of 400 ± 50 °C at c. 430 Ma, although deformation may have continued locally on the Moine mylonites in a less pervasive manner until at least 408 Ma. These similarities suggest that MT-10 and the basal mylonites were at very similar crustal depths when pervasive top to the W shearing ceased in the basal mylonites at c. 430 Ma.
As discussed above, the presence of only single grain feldspar clasts (Figure 7b) in the relatively low temperature basal Moine mylonites close to the underlying Moine thrust in Area 1, and the absence of clasts composed of interlocking earlier plastically deformed quartz and feldspar grains, indicates that the basal mylonites have not been produced by low temperature reworking of overlying higher temperature tectonites in which such microstructures are common. This suggests that the basal section of Moine metasedimentary rocks associated with top to the W shearing (lowermost domain in (Figure 13e) were originally in a more proximal (foreland) position at a much shallower crustal level than the now overlying higher grade Moine rocks associated with top to the NW and N shearing. This in turn requires the presence of a major previously unrecognized fault or shear zone, probably at a structural distance of ~500–1000 m above the Moine thrust (middle domain in Figure 13e), on which originally deeper and more hinterland positioned metasedimentary rocks (including most of the Moine thrust sheet and the overlying Sgurr Beag thrust sheet) have been transported laterally to the NW to structurally overlie the shallower more foreland positioned metasedimentary rocks that were mylonitized during top to the W shearing on the underlying Moine thrust. In Area 1, the previously unrecognized fault or shear zone within the Moine approximately coincides with the swing from E to SE trending lineations. It remains to be determined if similar microstructural observations and structural interpretations can be made in the immediate hanging wall to the Moine thrust along the entire length of the thrust from the north coast southwards to Skye or if, for example, such microstructures are limited to the ‘brittle’ Moine thrust located from Knockan southwards.

10. Tectonic Summary of Area 4 and Regional Context

In contrast to Areas 1–3, microstructures and quartz fabrics in the small coastal exposure of the Moine and Sgurr Beag thrust sheets in Area 4, located 30 km along strike to the NE of Area 3 (Figure 1 and Figure 2), indicate a top down to the ESE shear sense. Top down to the ESE shearing occurred under uppermost greenschist—lower amphibolite facies conditions (~475–575 °C) in the Moine thrust sheet and lower to possibly upper amphibolite facies conditions (~600–700 °C) in the overlying Sgurr Beag thrust sheet. This shear sense, at least in present day coordinates, suggests normal sense (extensional) motion on the Sgurr Beag thrust, while the presence of apparently hotter rocks in the hanging wall (based on both metamorphic and deformation criteria) suggests reverse sense motion. One simple possible explanation of these apparently conflicting observations is that original reverse sense motion on the thrust has been overprinted by pervasive normal sense shearing of the hanging wall and footwall rocks while they remained at close to peak temperatures.
U-Pb ages of 420 ± 3 Ma from Scandian matrix monazites at the base of the Sgurr Beag thrust sheet in Area 4 [16,95,127] suggest that top down to ESE shearing here is significantly younger than both the top to the N shearing (tentatively interpreted here at 470–450 Ma) on the Sgurr Beag thrust along strike to the south in Area 3 and top to W shearing on the Moine thrust in Area 1 at ~430 Ma, and may be related to the closing stages of Scandian deformation, metamorphism and cooling/exhumation. In the Naver thrust sheet to the north of Area 4 (Figure 1 and Figure 2) Mako et al., [23] have documented peak temperatures of Scandian metamorphism at 425 Ma followed by slow cooling that, possibly promoted by late-stage normal sense faulting near the top of the orogenic wedge [100], accelerated after 420–415 Ma, with exhumation of the Moine metasedimentary rocks and deposition of overlying Emsian age Devonian sediments by 407–403 Ma.
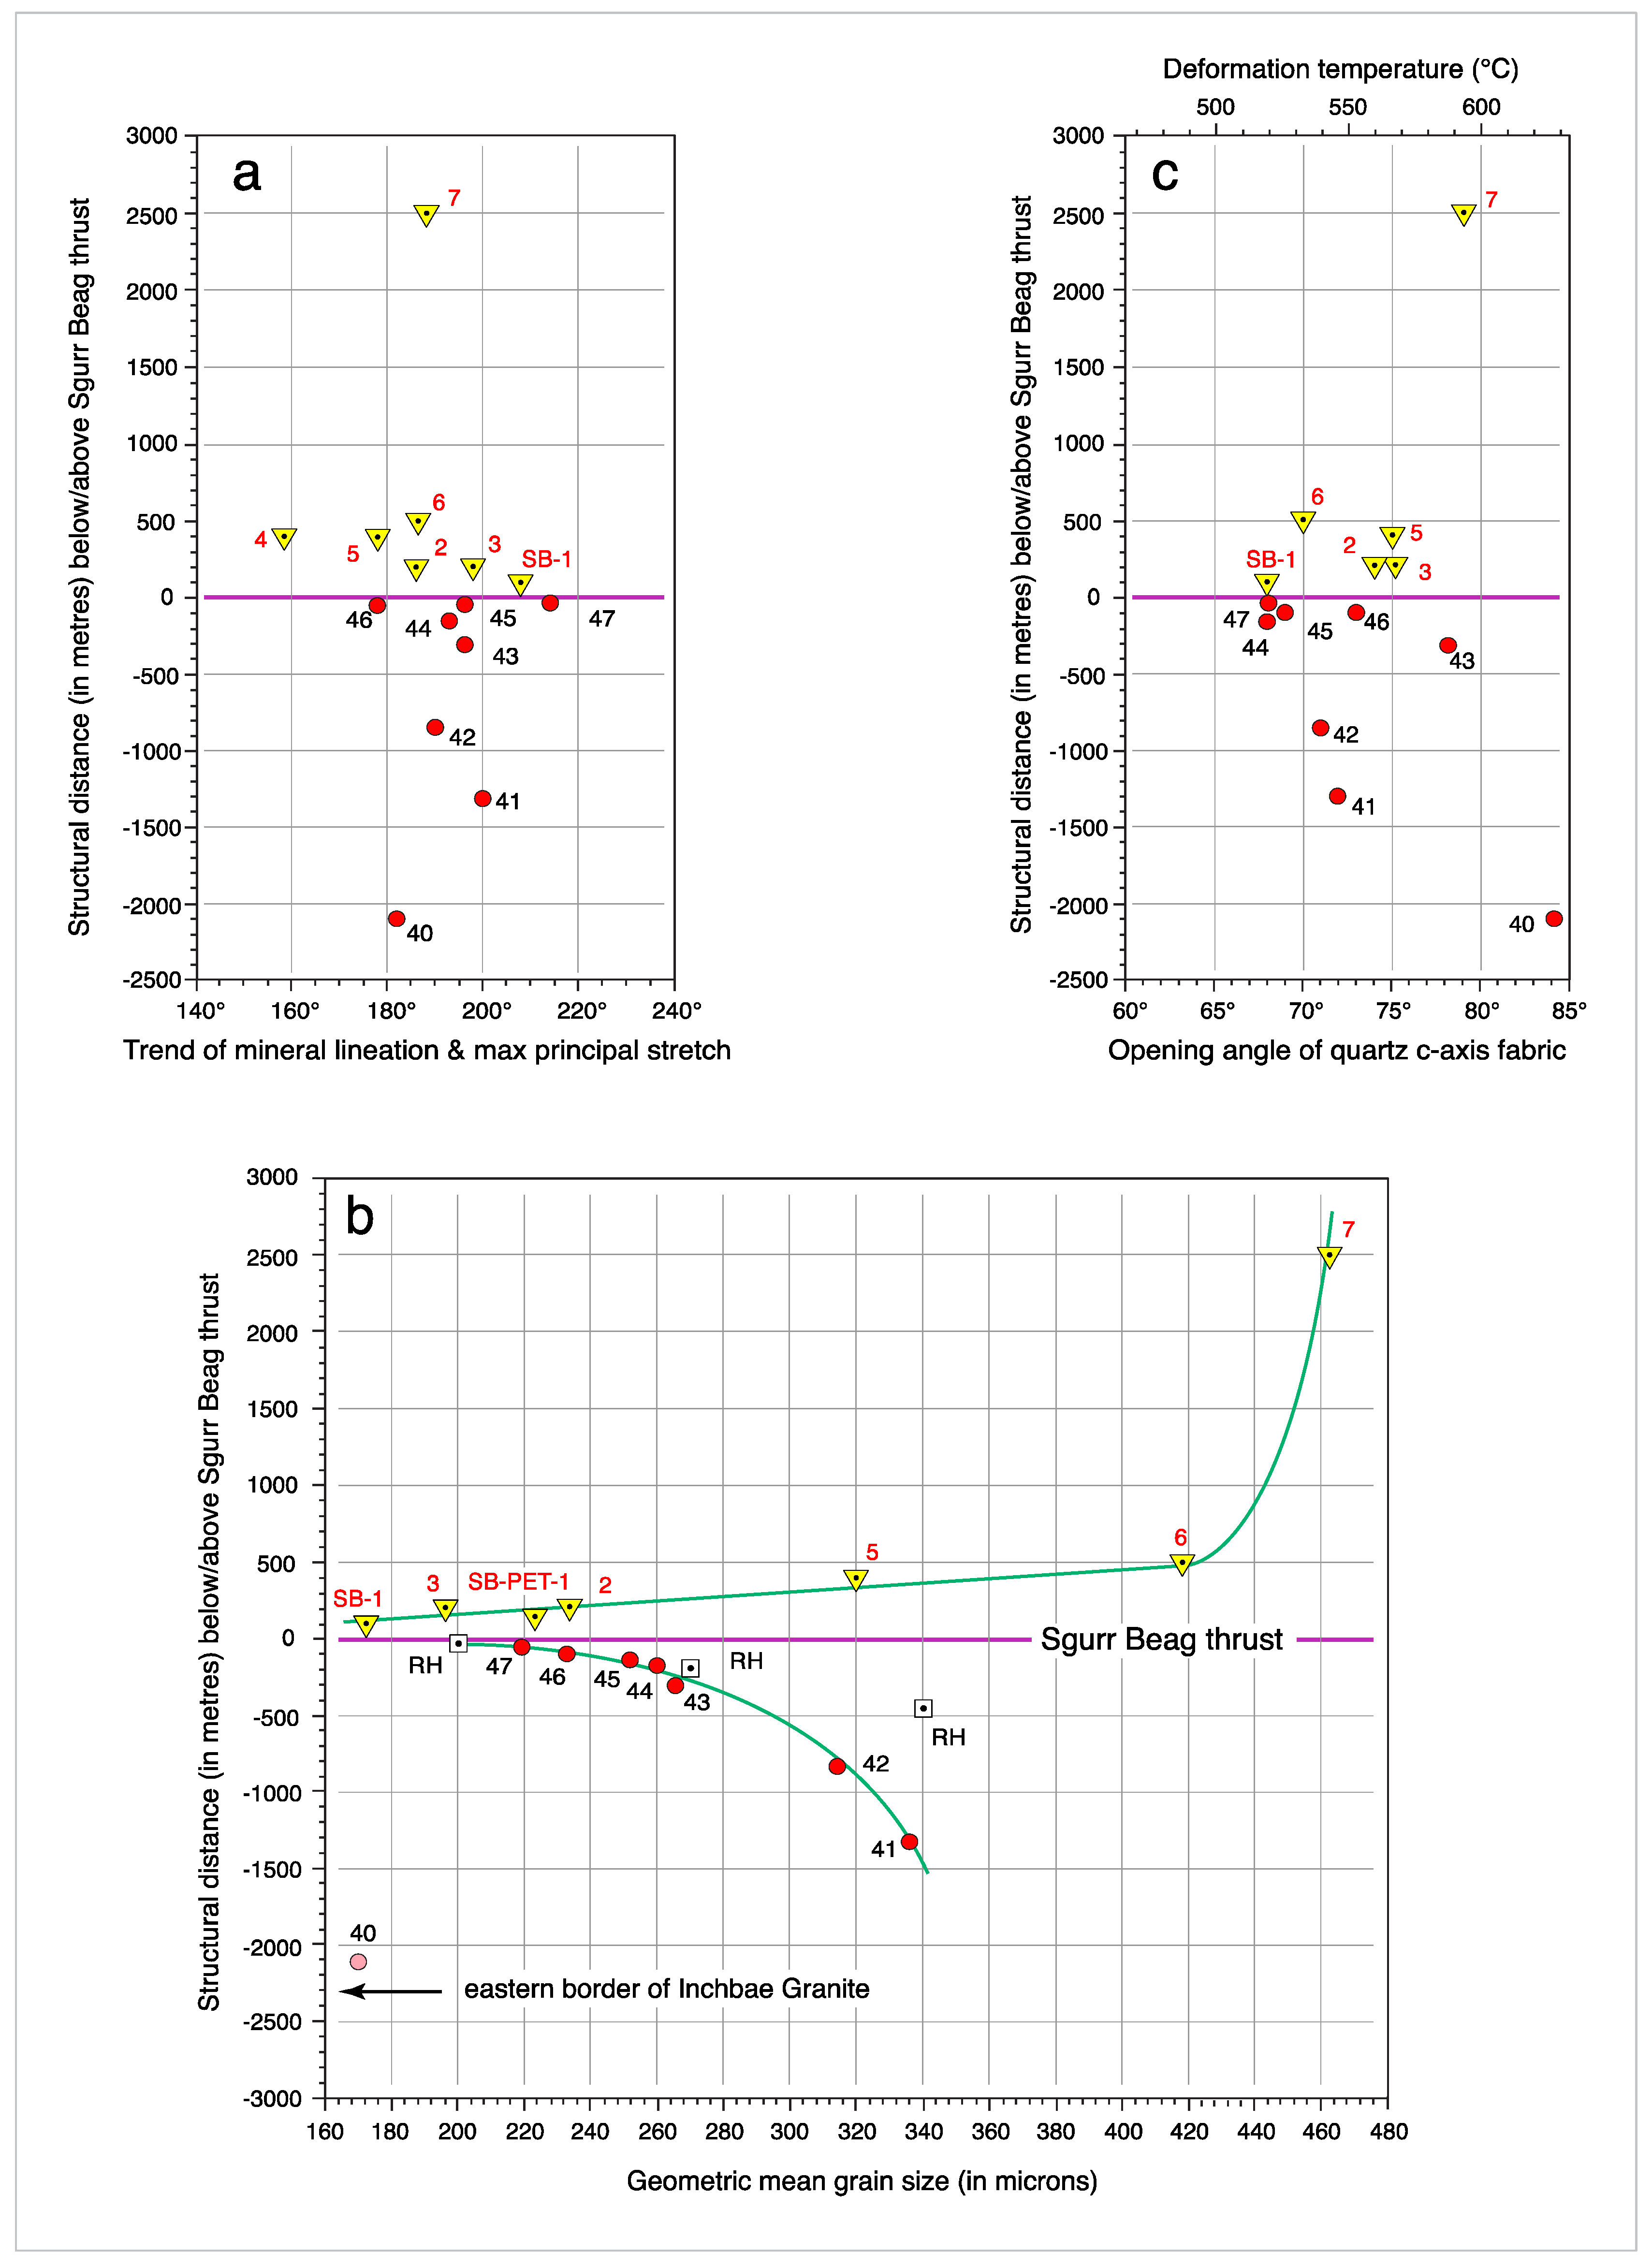
We are aware of only two other sets of structures in the Caledonides of northern Scotland in which a top down to the east (normal sense) of motion has been documented. On the east side of the Kyle of Tongue, Holdsworth [171] has described late brittle ESE-vergent outcrop-scale folds that detach onto ESE-dipping foliation planes that were interpreted to have formed in response to late Caledonian gravity-induced thinning of the orogenic wedge. On the Morar Peninsula to the south of Skye, Powell and Glendinning [172] have documented top down to the east (normal sense) motion in the greenschist facies (chlorite grade) Rhue fault zone. Cross-cutting relationships with dated granitic intrusions indicate that the Rhue fault zone is younger than 425 ± 4.4 Ma, although the absolute age of normal sense motion on this structure is unknown.

11. Conclusions

We report an integrated microstructural and quartz c-axis fabric study from a 45 km long transect across the Caledonian Orogen in northern Scotland that extends from Loch Broom and Dundonnell (Area 1) in the west, through Loch Glascarnoch, Ben Wyvis and Rogie Falls (Areas 2 and 3), to the Creich Peninsula (Area 4) on the east coast. Quartz fabric analyses of Moine metasedimentary rocks in the Moine and Sgurr Beag thrust sheets in our study areas unequivocally demonstrate approximately plane strain deformation conditions for all samples and that mineral grain shape lineations are parallel to the maximum principal stretch direction, indicating they developed parallel to, and track, the local transport direction.
Microstructures and c-axis fabrics in samples from Area 1 demonstrate a progressive change from top to the W, through top to the NW, to top to the NNW shearing traced southeastward and upwards within a ~4 km thick belt of planar, gently dipping Moine mylonites and schists lying directly above the Moine thrust. Further to the east in Area 2 microstructures and fabrics indicate top to the N shearing that predates formation of km-scale W-vergent folds that are thought to detach on the underlying Moine thrust. Further east again in Area 3 microstructures and fabrics in both the upper part of the Moine thrust sheet and the overlying Sgurr Beag thrust sheet indicate top to the NNE shearing. Top to the west shearing in the Moine mylonites immediately above the Moine thrust occurred under greenschist facies conditions, while top to the NW/N/NNE shearing in the overlying and more hinterland parts of the Moine thrust sheet and overlying Sgurr Beag thrust sheet occurred under lower amphibolite facies conditions. Our microstructural data indicate that, at least in the Garve–Ben Wyvis region (Area 3), the Sgurr Beag thrust was active during top to the N shearing. Traced from northwest to southeast across Areas 1-3 the zone of top to the NNW/N/NNE shearing is at least 55 km wide in map view after allowing for restoration of the later km-scale W-vergent folds in Area 2, with its easternmost extent unknown as it is overlain by younger Devonian sedimentary rocks.
Previously published Rb-Sr white mica data indicate that top to the W shearing at c. 430 Ma in mylonites immediately above the Moine thrust in Area 1 is of Scandian age, while U-Pb ages from the Sgurr Beag thrust sheet in Area 3 on matrix monazite in metasedimentary rocks and titanite in a sheared amphibolite of c. 454 and 468 Ma, respectively, are tentatively interpreted as indicating that the grain shape fabrics associated with top to the N shearing may be of Grampian or slightly younger age. Based on microstructural data, we tentatively suggest that the most likely location in Area 1 at which potential Grampian age amphibolite facies structures associated with top to the N shearing transition downwards into undoubted Scandian greenschist facies structures associated with top to the W shearing is at approximately 1000–1500 m above the Moine thrust within the 4 km thick belt of planar gently dipping Moine mylonites and schists lying directly above the thrust surface. Our microstructural data also indicates that the relatively low grade Moine mylonites close to the underlying Moine thrust in Area 1 have not been produced by low temperature reworking of the overlying higher temperature tectonites, suggesting that the basal section of Moine metasedimentary rocks were originally in a more proximal (foreland) position at a much shallower crustal level than the now overlying higher grade Moine rocks associated with top to the NW and N shearing. This in turn requires the presence of a major previously unrecognized fault or shear zone, probably at a structural distance of ~500–1000 m above the Moine thrust, on which originally deeper and more hinterland positioned metasedimentary rocks (including most of the Moine thrust sheet and the overlying Sgurr Beag thrust sheet) have been transported laterally to the NW to structurally overlie the shallower more foreland positioned metasedimentary rocks that were mylonitized during top to the W shearing on the underlying Moine thrust.
In contrast to Areas 1–3, microstructures and quartz fabrics in the small coastal exposure of the Moine and Sgurr Beag thrust sheets on the east coast in Area 4 indicate top down to the ESE shearing under uppermost greenschist–lower amphibolite and lower to possibly upper amphibolite facies conditions, respectively. This shear sense suggests at least local normal sense (extensional) motion on the Sgurr Beag thrust, while the presence of apparently hotter rocks in the hanging wall suggests reverse sense motion. One simple explanation of these apparently conflicting observations is that original reverse sense motion on the thrust has been overprinted by pervasive normal sense shearing of the hanging wall and footwall rocks while they remained at close to peak temperatures. U-Pb ages of c. 420 Ma from Scandian matrix monazites at the base of the Sgurr Beag thrust sheet in Area 4 suggest that top down to ESE shearing here is significantly younger than both the top to the N shearing at c. 470–450 Ma on the Sgurr Beag thrust along strike to the south in Area 3 and top to W shearing at c. 430 Ma, on the Moine thrust in Area 1, and may be related to the closing stages of Scandian deformation, metamorphism and cooling/exhumation.
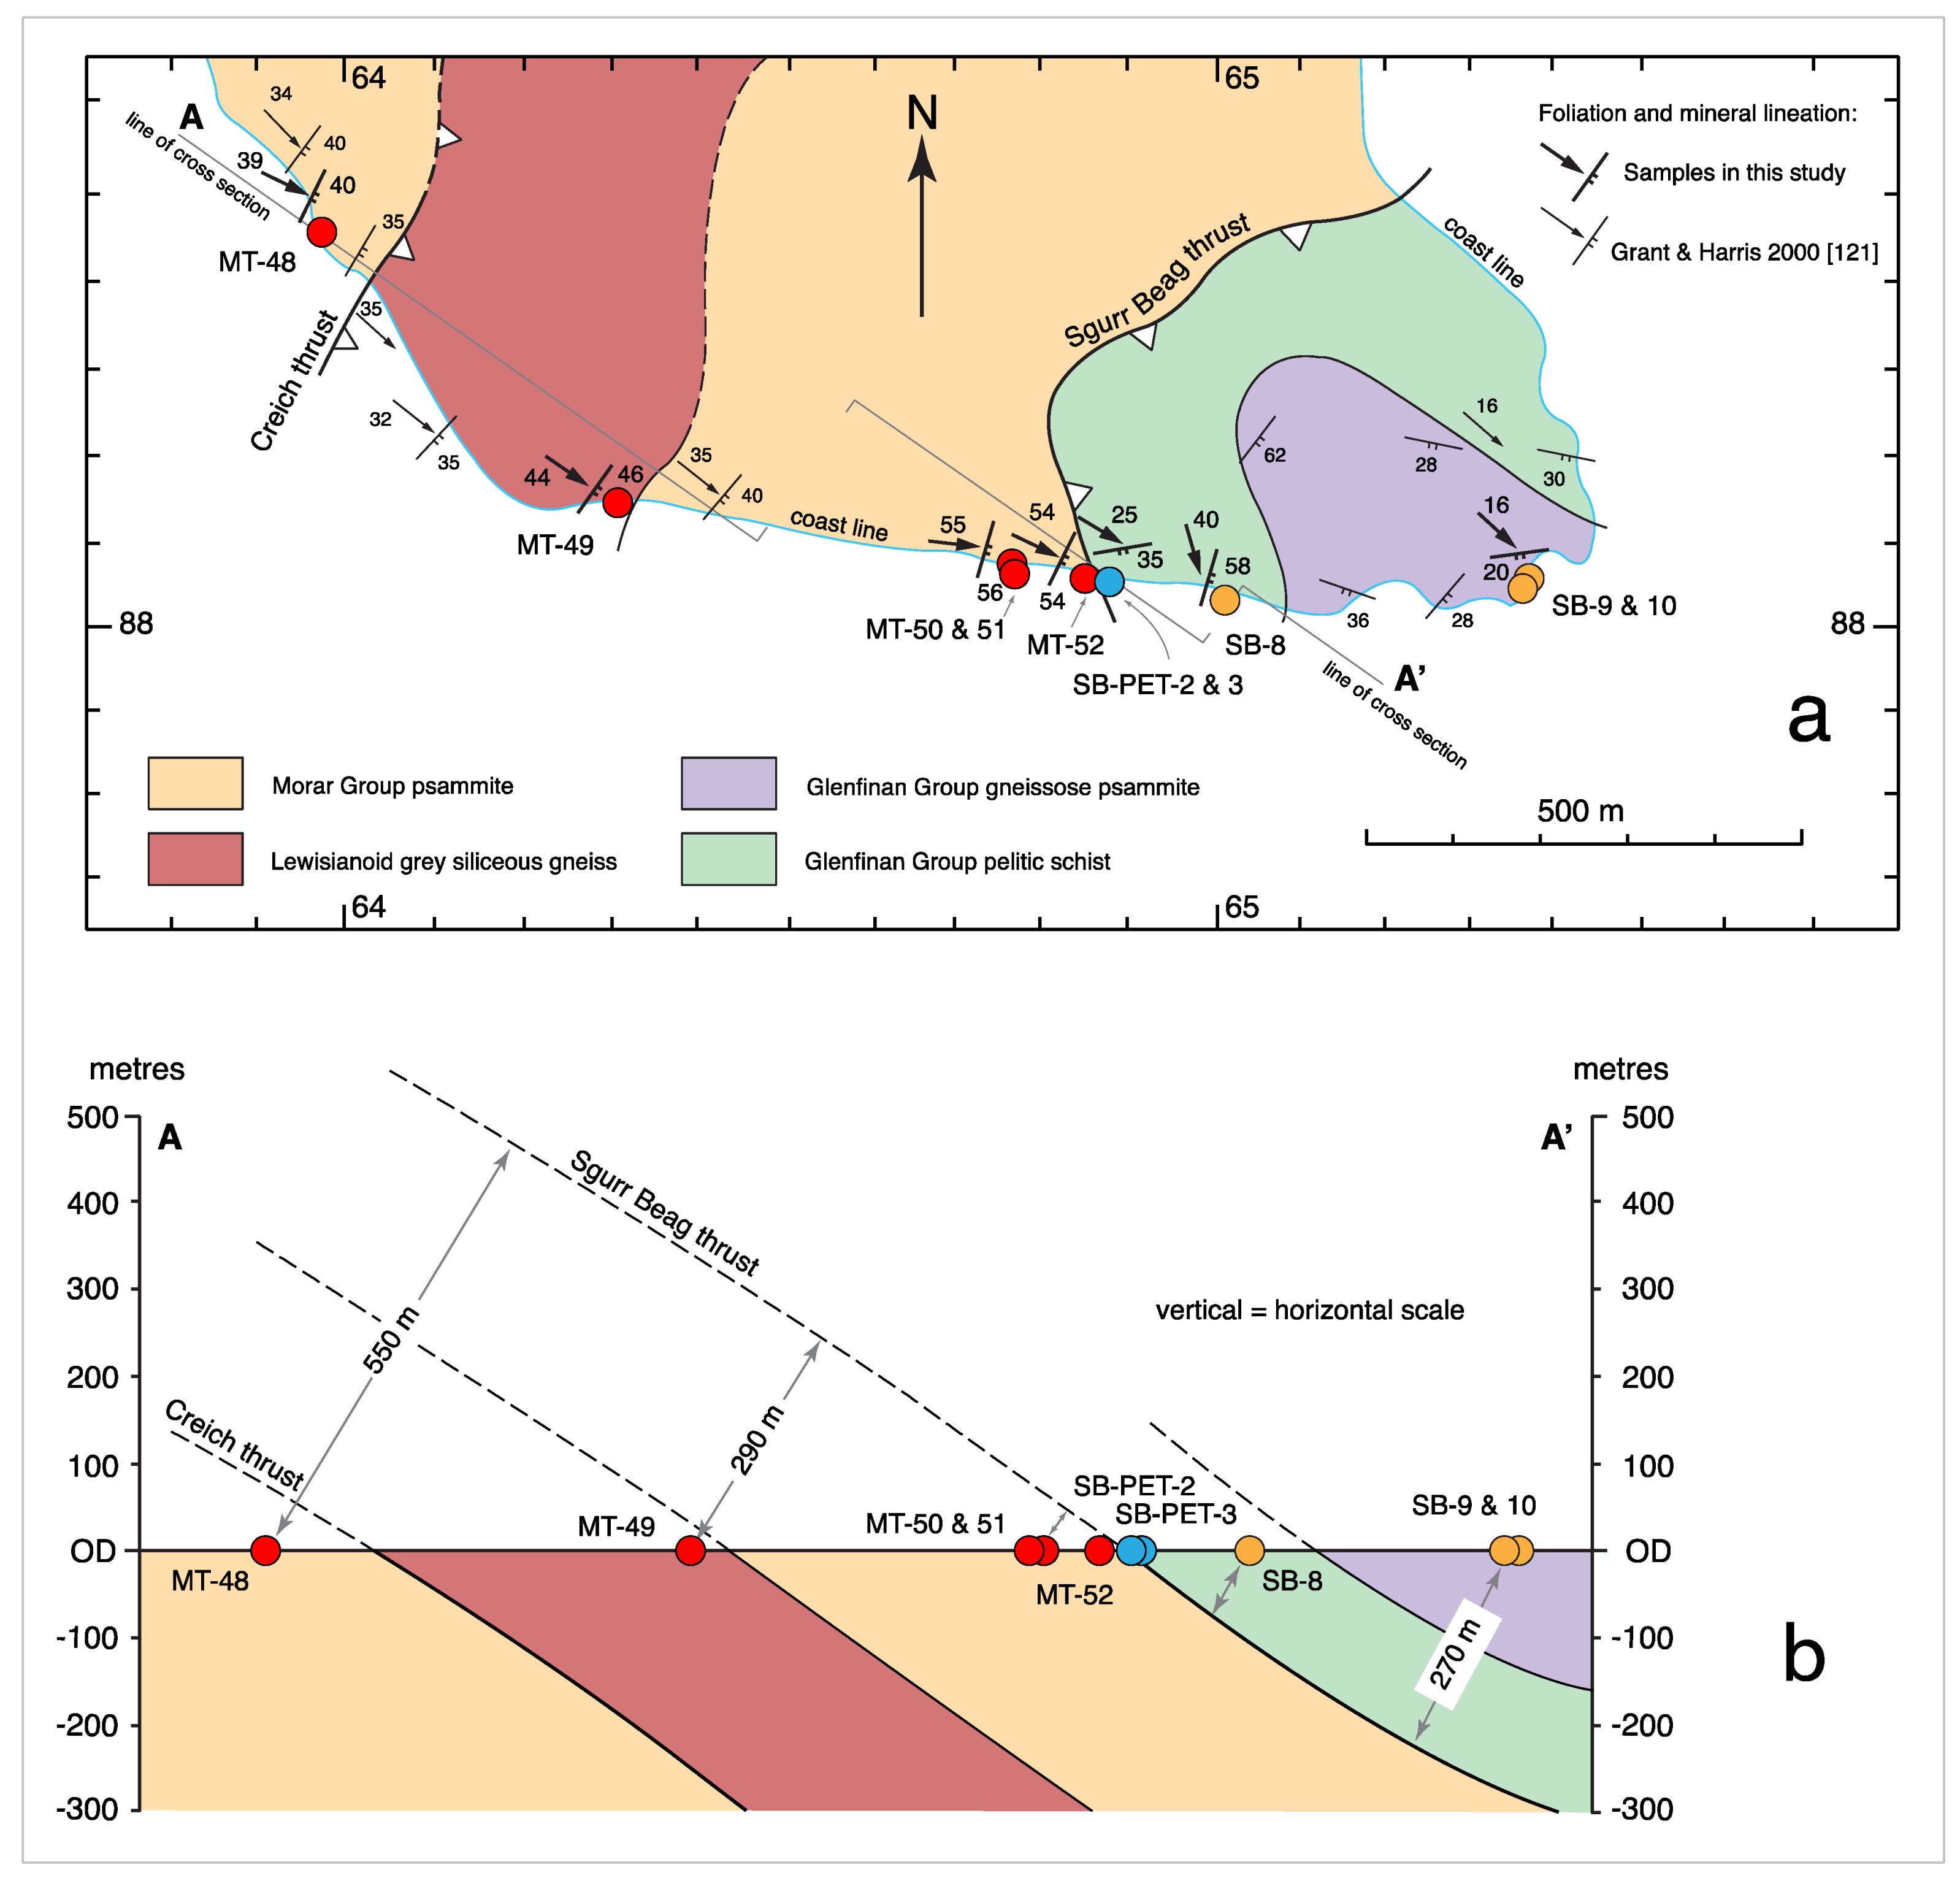
Supplementary Materials

The following are available at https://www.mdpi.com/article/10.3390/geosciences11100411/s1, Supplementary File S1: Location, lineation and foliation orientation, quartz c-axis fabric opening angle, deformation temperature and shear sense data for all samples, plus publication versus field sample numbers, Supplementary File S2: quartz recrystallization regime and recrystallized grain size data for all samples, Supplementary File S3: summary of 40Ar/39Ar analytical methods employed for sample MT-10, Supplementary File S4: 40Ar/39Ar data for sample MT-10.

Author Contributions

Conceptualization, R.D.L.; methodology, R.D.L., J.R.T., M.K. and R.A.S.; validation, R.D.L., S.E.M., C.A.M., B.M.S., K.T.A. and E.F.D.; formal analysis, R.D.L., S.E.M., C.A.M., B.M.S. and E.F.D.; writing—original draft preparation, R.D.L., J.R.T., M.K., B.M.S. and R.A.S.; visualization, R.D.L., J.R.T., M.K. and B.M.S.; supervision, R.D.L.; funding acquisition, R.D.L. All authors have read and agreed to the published version of the manuscript.

Funding

This project was supported by National Science Foundation grants EAR 0538010, EAR 0711207 and EAR 1220138 to R.D.L.

Data Availability Statement

Data are available within the article and in Supplementary Materials.

Acknowledgments

R.D.L. thanks Sean Mulcahy and Neil Mancktelow for software packages facilitating collection and analysis of universal stage data. We thank Summer Brown and Ben Roth for help with sample collection. We also thank Ian Alsop and Bob Holdsworth for their constructive and insightful reviews of an earlier version of the manuscript.

Conflicts of Interest

The authors declare no conflict of interest.

References

  1. Geikie, A. The crystalline rocks of the Scottish Highlands. Nature 1884, 30, 29–31. [Google Scholar] [CrossRef]
  2. Peach, B.N.; Horne, J.; Gunn, W.; Clough, C.T.; Hinxman, L.W.; Teall, J.J.H. The Geological Structure of the North West Highlands; British Geological Survey Memoir, HMSO: Glasgow, UK, 1907; 668p. [Google Scholar]
  3. Cloos, E. Lineation: A Critical Review and Annotated Bibliography; Geological Society of America: Boulder, CO, USA, 1946; Volume 18, 122p. [Google Scholar] [CrossRef] [Green Version]
  4. Anderson, E.M. On lineation and petrofabric structure and the shearing movements by which they have been produced. Q. J. Geol. Soc. Lond. 1948, 104, 99–126. [Google Scholar] [CrossRef]
  5. Kvale, A. Linear structures and their relation to movement in the Caledonides of Scandinavia and Scotland. Q. J. Geol. Soc. Lond. 1953, 109, 51–73. [Google Scholar] [CrossRef]
  6. Law, R.D.; Johnson, M.R.W. Microstructures and crystal fabrics of the Moine thrust zone and Moine nappe: History of research and changing tectonic interpretations. Geol. Soc. Lond. Spec. Publ. 2010, 335, 443–503. [Google Scholar] [CrossRef]
  7. Oldow, J.S.; Bally, A.W.; Lallemant, H. Transpression, orogenic float, and lithospheric balance. Geology 1990, 18, 991–994. [Google Scholar] [CrossRef]
  8. Fossen, H. Linear fabrics in the Bergsdalen Nappes, southwest Norway: Implications for deformation history and fold development. Nor. Geol. Tidsskr. 1993, 73, 95–108. [Google Scholar]
  9. Hatcher, R.D.; Merschat, A.J. The Appalachian Inner Piedmont: An exhumed strike-parallel tectonically forced orogenic channel. Geol. Soc. Lond. Spec. Publ. 2006, 268, 379–413. [Google Scholar] [CrossRef]
  10. Chardon, D.; Gapais, D.; Cagnard, F. Flow of ultra-hot orogens: A view from the Precambrian, clues from the Phanerozoic. Tectonophysics 2009, 477, 105–118. [Google Scholar] [CrossRef]
  11. Farias, P.; Weinberg, R.; Sola, A.; Becchio, R. From crustal thickening to orogen-parallel escape: 120 Myr-long HT-LP evolution recorded by titanite in the Paleozoic Famatinian Backarc, NW Argentina. Tectonics 2020, 39, e2020TC006184. [Google Scholar] [CrossRef]
  12. Roberts, A.G.; Weinberg, R.F.; Hunter, N.J.R.; Ganade, C.E. Large-scale rotational motion within the Main Central Thrust Zone in the Darjeeling-Sikkim Himalaya, India. Tectonics 2020, 39, e2019TC005949. [Google Scholar] [CrossRef]
  13. Malavielle, J.; Dominguez, S.; Lu, C.Y.; Chen, C.T.; Konstantinovskaya, E. Deformation partitioning in mountain belts: Insights from analogue modelling experiments and the Taiwan collisional orogen. Geol. Mag. 2021, 158, 84–103. [Google Scholar] [CrossRef]
  14. Burg, J.P.; Bale, P.; Brun, J.P.; Girardeau, J. Stretching lineations and transport direction in the Ibero-Armorican arc during siluro-devonian collision. Geodin. Acta 1987, 1, 71–87. [Google Scholar] [CrossRef]
  15. Xypolias, P.; Gerogiannis, N.; Chatzara, V.; Papapavlou, K.; Kruckenberg, S.C.; Aravadinou, E.; Michels, Z. Using incremental elongation and shearing to unravel the kinematics of a complex transpressional zone. J. Struct. Geol. 2018, 115, 64–81. [Google Scholar] [CrossRef]
  16. Mako, C.A. Thermal and Metamorphic Evolution of the Northern Highlands Terrane, Scotland. Ph.D. Thesis, Virginia Polytechnic Institute and State University, Blacksburg, VA, USA, 2019. Available online: https://vtechworks.lib.vt.edu/handle/10919/90180 (accessed on 25 September 2021).
  17. Francsis, M.K. Piezometry and Strain Rate Estimates along Mid-Crustal Shear Zones. Master’s Thesis, Virginia Polytechnic Institute and State University, Blacksburg, VA, USA, 2012. Available online: https://vtechworks.lib.vt.edu/handle/10919/32170 (accessed on 25 September 2021).
  18. Thigpen, J.R.; Law, R.D.; Loehn, C.L.; Strachan, R.A.; Tracy, R.J.; Lloyd, G.E.; Roth, B.L.; Brown, S.J. Thermal structure and tectonic evolution of the Scandian orogenic wedge, Scottish Caledonides: Integrating geothermometry, deformation temperatures and conceptual kinematic-thermal models. J. Metamorph. Geol. 2013, 31, 813–842. [Google Scholar] [CrossRef]
  19. Law, R.D. Deformation thermometry based on quartz c -axis fabrics and recrystallization microstructures: A review. J. Struct. Geol. 2014, 66, 129–161. [Google Scholar] [CrossRef]
  20. Krabbendam, M.; Prave, T.; Cheer, D. A fluvial origin for the Neoproterozoic Morar Group, NW Scotland; implications for Torridon Morar Group correlation and the Grenville Orogen foreland basin. J. Geol. Soc. Lond. 2008, 165, 379–394. [Google Scholar] [CrossRef] [Green Version]
  21. Leslie, A.G.; Krabbendam, M.; Kimbell, G.S.; Strachan, R.A. The Oykel Transverse Zone: Linking mullions, regional gravity and large-scale lateral variations in ductile thrust architecture in the Moine Nappe, Northern Highlands, Scotland. Geol. Soc. Lond. Spec. Publ. 2010, 335, 359–381. [Google Scholar] [CrossRef] [Green Version]
  22. Thigpen, J.R.; Law, R.D.; Lloyd, G.E.; Brown, S.J.; Cook, B. Deformation temperatures, vorticity of flow and strain symmetry in the Loch Eriboll mylonites, NW Scotland: Implications for the kinematic and structural evolution of the northernmost Moine thrust zone. Geol. Soc. Lond. Spec. Publ. 2010, 335, 623–662. [Google Scholar] [CrossRef]
  23. Mako, C.A.; Law, R.D.; Caddick, M.J.; Thigpen, J.R.; Ashley, K.T.; Cottle, J.; Kylander-Clark, A. Thermal evolution of the Scandian hinterland, Naver nappe, northern Scotland. J. Geol. Soc. Lond. 2019, 176, 669–688. [Google Scholar] [CrossRef]
  24. Strachan, R.A.; Alsop, G.I.; Ramezani, R.E.; Frazer, R.E.; Burns, I.M.; Holdsworth, R.E. Patterns of Silurian deformation and magmatism during sinistral oblique convergence, northern Scottish Caledonides. J. Geol. Soc. Lond. 2020, 177, 893–910. [Google Scholar] [CrossRef]
  25. Johnson, M.R.W. The structural geology of the Moine thrust zone in Coulin Forest, Wester Ross. Q. J. Geol. Soc. Lond. 1957, 113, 241–266. [Google Scholar] [CrossRef]
  26. Johnson, M.R.W. The structural history of the Moine thrust zone at Locharron, Wester Ross. Trans. R. Soc. Edinb. 1960, 64, 139–168. [Google Scholar] [CrossRef]
  27. Langford, R.L. Deformation in the Moine South-East of Glen Carron, Highland Region, Scotland. Ph.D. Thesis, Kingston University, Kingston, UK, 1980; 236p. Available online: https://eprints.kingston.ac.uk/id/eprint/20477/ (accessed on 25 September 2021).
  28. Sutton, J.; Watson, J.V. The supposed Lewisian inlier of Scardroy, central Ross-shire, and its relations with the surrounding Moine rocks. Q. J. Geol. Soc. Lond. 1953, 108, 99–126. [Google Scholar] [CrossRef]
  29. Ramsay, J.G. Superimposed folding at Loch Monar, Inverness-shire and Ross-shire. Q. J. Geol. Soc. Lond. 1957, 113, 271–308. [Google Scholar] [CrossRef]
  30. Clifford, P. The geological structure of the Loch Luichart area, Ross-shire. Q. J. Geol. Soc. Lond. 1960, 115, 365–388. [Google Scholar] [CrossRef]
  31. Fleuty, M.J. The three fold-systems in the metamorphic rocks of Upper Glen Orrin, Ross-shire and Inverness-shire. Q. J. Geol. Soc. Lond. 1961, 117, 447–479. [Google Scholar] [CrossRef]
  32. Cawood, P.A.; Strachan, R.A.; Merle, R.E.; Millar, I.L.; Loewy, S.L.; Dalziel, I.W.; Kinny, P.D.; Jourdan, F.; Nemchin, A.A.; Connelly, J.N. Neoproterozoic to early Paleozoic extensional and compressional history of east Laurentian margin sequences: The Moine Supergroup, Scottish Caledonides. Geol. Soc. Am. Bull. 2015, 127, 349–371. [Google Scholar] [CrossRef] [Green Version]
  33. Krabbendam, M.; Bonsor, H.; Horstwood, M.S.A.; Rivers, T. Tracking the evolution of the Grenvillian foreland basin: Constraints from sedimentology and detrital zircon and rutile in the Sleat and Torridon groups, Scotland. Precambrian Res. 2017, 295, 67–89. [Google Scholar] [CrossRef] [Green Version]
  34. Strachan, R.A.; Holdsworth, R.E.; Krabbendam, M.; Alsop, G.I. The Moine Supergroup of NW Scotland: Insights into the analysis of polyorogenic supracrustal sequences. Geol. Soc. Lond. Spec. Publ. 2010, 335, 233–254. [Google Scholar] [CrossRef] [Green Version]
  35. Holdsworth, R.E.; Strachan, R.A.; Harris, A.L. Precambrian rocks in northern Scotland east of the Moine thrust: The Moine Supergroup. Geol. Soc. Lond. Spec. Rep. 1994, 22, 23–32. [Google Scholar] [CrossRef]
  36. Soper, N.J.; Harris, A.L.; Strachan, R.A. Tectonostratigraphy of the Moine Supergroup: A synthesis. J. Geol. Soc. Lond. 1998, 155, 13–24. [Google Scholar] [CrossRef]
  37. Bird, A.; Cutts, K.; Strachan, R.; Thirlwell, M.F.; Hand, M. First evidence of Renlandian (c. 950–940 Ma) orogeny in mainland Scotland: Implications for the status of the Moine Supergroup and circum-North Atlantic correlations. Precambrian Res. 2018, 305, 283–294. [Google Scholar] [CrossRef] [Green Version]
  38. Cutts, K.A.; Kinny, D.; Strachan, R.A.; Hand, M.; Kelsey, D.E.; Emery, M.; Friend, C.R.L.; Leslie, A.G. Three metamorphic events recorded in a single garnet: Integrated phase modelling, in situ LA-ICPMS and SIMS geochronology from the Moine Supergroup, NW Scotland. J. Metam. Geol. 2010, 28, 249–267. [Google Scholar] [CrossRef]
  39. Krabbendam, M.; Strachan, R.; Prave, T. A new stratigraphic framework for the early Neoproterozoic successions in Scotland. J. Geol. Soc. Lond. 2021, in press. [Google Scholar] [CrossRef]
  40. Barr, D.; Holdsworth, R.E.; Roberts, A.M. Caledonian ductile thrusting in a Precambrian metamorphic complex: The Moine of NW Scotland. Geol. Soc. Am. Bull. 1986, 97, 754–764. [Google Scholar] [CrossRef]
  41. Strachan, R.A.; Harris, A.L.; Fettes, D.J.; Smith, M. The Highland and Grampian terranes. In The Geology of Scotland; Trewin, N.H., Ed.; The Geological Society London: London, UK, 2002; pp. 81–148. [Google Scholar]
  42. Tanner, P.W.G.; Johnson, G.S.; Smith, D.I.; Harris, A.L. Moinian stratigraphy and the problem of the central Ross-shire Inliers. Geol. Soc. Am. Bull. 1970, 81, 299–306. [Google Scholar] [CrossRef]
  43. Tanner, P.W.G. The Sgurr Beag Slide—A major tectonic break within the Moine of the Western Highlands of Scotland. Q. J. Geol. Soc. Lond. 1971, 126, 435–463. [Google Scholar] [CrossRef]
  44. Strachan, R.A.; Holdsworth, R.E. Basement-cover relationships and structure within the Moine rocks of central and southeast Sutherland. J. Geol. Soc. Lond. 1988, 145, 23–36. [Google Scholar] [CrossRef]
  45. Kocks, H.; Strachan, R.A.; Evans, J.A. Heterogeneous reworking of Grampian metamorphic complexes during Scandian thrusting in the Scottish Caledonides: Insights from the structural setting and U-Pb geochronology of the Strath Halladale Granite. J. Geol. Soc. Lond. 2006, 163, 525–538. [Google Scholar] [CrossRef]
  46. Mendum, J.R. Moine North: Introduction. In Lewisian, Torridonian and Moine Rocks of Scotland; Mendum, J.R., Barber, A.J., Butler, R.W.H., Flinn, D., Goodenough, K.M., Krabbendam, M., Park, R.G., Stewart, A.D., Eds.; Geological Conservation Review Series; Joint Nature Conservation Committee: Peterborough, UK, 2009; pp. 351–367. [Google Scholar]
  47. Winchester, J.A. The zonal pattern of regional metamorphism in the Scottish Caledonides. J. Geol. Soc. Lond. 1974, 130, 509–524. [Google Scholar] [CrossRef]
  48. Goodenough, K.M.; Millar, I.; Strachan, R.A.; Krabbendam, M.; Evans, J.A. Timing of regional deformation and development of the Moine Thrust Zone in the Scottish Caledonides: Constraints from the U-Pb geochronology of alkaline intrusions. J. Geol. Soc. Lond. 2011, 168, 99–114. [Google Scholar] [CrossRef] [Green Version]
  49. Bird, A.F.; Thirlwall, M.F.; Strachan, R.A.; Manning, C.J. Lu–Hf and Sm–Nd dating of metamorphic garnet: Evidence for multiple accretion events during the Caledonian orogeny in Scotland. J. Geol. Soc. Lond. 2013, 170, 301–317. [Google Scholar] [CrossRef]
  50. Kelley, S. The relationship between K-Ar mineral ages, mica grainsizes and movement on the Moine Thrust Zone, NW Highlands, Scotland. J. Geol. Soc. Lond. 1988, 145, 1–10. [Google Scholar] [CrossRef]
  51. Freeman, S.R.; Butler, R.W.H.; Cliff, R.A.; Rex, D.C. Direct dating of mylonite evolution: A multi-disciplinary geochronological study from the Moine thrust zone, NW Scotland. J. Geol. Soc. Lond. 1998, 155, 745–758. [Google Scholar] [CrossRef] [Green Version]
  52. Holdsworth, R.E.; Strachan, R.A.; Alsop, G.I. Geology of the Tongue District; Memoir British Geological Survey, HMSO: Keyworth, UK, 2001; ISBN 0118845489. [Google Scholar]
  53. Holdsworth, R.E.; Alsop, G.I.; Strachan, R.A. Tectonic stratigraphy and structural continuity of the northernmost Moine Thrust Zone and Moine Nappe, Scottish Caledonides. Geol. Soc. Lond. Spec. Publ. 2007, 272, 121–142. [Google Scholar] [CrossRef]
  54. Holdsworth, R.E. The geology and structural evolution of a Caledonian fold and ductile thrust zone, Kyle of Tongue region, Sutherland, northern Scotland. J. Geol. Soc. Lond. 1989, 146, 809–823. [Google Scholar] [CrossRef]
  55. Alsop, G.I.; Cheer, D.A.; Strachan, R.A.; Krabbendam, M.; Kinny, P.D.; Holdsworth, R.E.; Leslie, A.G. Progressive fold and fabric evolution associated with regional strain gradients: A case study from across a Scandian ductile thrust nappe, Scottish Caledonides. Geol. Soc. Lond. Spec. Publ. 2010, 335, 225–274. [Google Scholar] [CrossRef] [Green Version]
  56. Krabbendam, M.; Strachan, R.A.; Leslie, A.G.; Goodenough, K.M.; Bonsor, H.C. The internal structure of the Moine nappe complex and the stratigraphy of the Morar Group in the Fannichs-Beinn Dearg area, NW Highlands. Scott. J. Geol. 2011, 47, 1–20. [Google Scholar] [CrossRef] [Green Version]
  57. Kelley, S.; Powell, D. Relationships between marginal thrusting and movement on major internal shear zones in the northern Highland Caledonides, Scotland. J. Struct. Geol. 1985, 7, 161–174. [Google Scholar] [CrossRef]
  58. Krabbendam, M.; Urai, J.L.; van Vliet, L.J. Grain size stabilisation by dispersed graphite in a high-grade quartz mylonite: An example from Naxos (Greece). J. Struct. Geol. 2003, 25, 855–866. [Google Scholar] [CrossRef]
  59. Song, W.J.; Ree, J.H. Effect of mica on the grain size of dynamically recrystallized quartz in a quartz-muscovite mylonite. J. Struct. Geol. 2007, 29, 1872–1881. [Google Scholar] [CrossRef]
  60. Herwegh, M.; Linckens, J.; Ebert, A.; Berger, A.; Brodhag, S. The role of secondary phases for controlling microstructural evolution in polymineralic rocks: A review. J. Struct. Geol. 2011, 33, 1728–1750. [Google Scholar] [CrossRef]
  61. Heilbronner, R.; Bruhn, D. The influence of three-dimensional grain size distributions on the rheology of polyphase rocks. J. Struct. Geol. 1998, 20, 695–705. [Google Scholar] [CrossRef]
  62. Berger, A.; Herwegh, M.; Schwarz, J.O.; Putlitz, B. Quantitative analysis of crystal/grain sizes and their distributions in 2-D and 3-D. J. Struct. Geol. 2011, 33, 1751–1763. [Google Scholar] [CrossRef]
  63. Lopez-Sanchez, M.A.; Llana-Fúnez, S. An evaluation of different measures of dynamically recrystallized grain size for paleopiezometry or paleowattometry studies. Solid Earth 2015, 6, 475–495. [Google Scholar] [CrossRef] [Green Version]
  64. Lopez-Sanchez, M.A. Which average, how many grains, and how to estimate robust confidence intervals in unimodal grain size populations. J. Struct. Geol. 2020, 135, 104042. [Google Scholar] [CrossRef]
  65. Elliott, D.; Johnson, M.R.W. The structural evolution of the northern part of the Moine thrust zone. Earth Environ. Sci. Trans. R. Soc. Edinb. 1980, 71, 69–96. [Google Scholar] [CrossRef]
  66. Heaverlo, N.D. Using Structure Contours to Analyze Subsurface 3D Fault Geometry along Segments of the Moine Thrust. Master’s Thesis, Virginia Tech, Blacksburg, VA, USA, 2014. Available online: https://vtechworks.lib.vt.edu/handle/10919/48425 (accessed on 25 September 2021).
  67. Epard, J.L.; Groshong, R.H. Excess area and depth to detachment. Am. Assoc. Petrol. Geol. 1993, 77, 1291–1302. [Google Scholar] [CrossRef]
  68. Bulnes, M.; Poblet, J. Estimating the detachment depth in cross sections involving detachment folds. Geol. Mag. 1999, 136, 395–412. [Google Scholar] [CrossRef]
  69. British Geological Survey. Scotland Sheet 101E Ullapool Bedrock; British Geological Survey 1:50,000 Series; British Geological Survey, Keyworth: Nottingham, UK, 2008. [Google Scholar]
  70. British Geological Survey. Scotland Sheet 92E Loch Fannich Bedrock; British Geological Survey 1:50,000 Series; British Geological Survey, Keyworth: Nottingham, UK, 2011. [Google Scholar]
  71. Urai, J.L.; Means, W.D.; Lister, G.S. Dynamic recrystallization of minerals. Geophys. Monogr. Ser. 1986, 36, 161–199. [Google Scholar] [CrossRef]
  72. Passchier, C.W.; Trouw, R.A.J. Microtectonics, 2nd ed.; Springer: New York, NY, USA, 2005. [Google Scholar]
  73. Stipp, M.; Stünitz, H.; Heilbronner, R.; Schmid, S. Dynamic recrystallization of quartz: Correlation between natural and experimental conditions. Geol. Soc. Lond. Spec. Publ. 2002, 200, 171–190. [Google Scholar] [CrossRef]
  74. Stipp, M.; Stünitz, H.; Heilbronner, R.; Schmid, S. The eastern Tonale fault zone: A ‘natural laboratory’ for crystal plastic deformation of quartz over a temperature range of 250 to 700 °C. J. Struct. Geol. 2002, 24, 1861–1884. [Google Scholar] [CrossRef]
  75. Ashley, K.T.; Law, R.D.; Thigpen, J.R. Garnet morphology, distribution in the northern part of the Moine Supergroup, Scottish Caledonides. J. Metam. Geol. 2017, 35, 77–94. [Google Scholar] [CrossRef]
  76. Tullis, J. Preferred orientation of quartz produced by slip during plane strain. Tectonophysics 1977, 39, 87–102. [Google Scholar] [CrossRef]
  77. Lister, G.S.; Paterson, M.S.; Hobbs, B.E. The simulation of fabric development in plastic deformation and its application to quartzite: The model. Tectonophysics 1978, 45, 107–158. [Google Scholar] [CrossRef]
  78. Lister, G.S.; Hobbs, B.E. The simulation of fabric development during plastic deformation of quartzite and its application to quartzite: The effect of deformation history. J. Struct. Geol. 1980, 2, 355–370. [Google Scholar] [CrossRef]
  79. Heilbronner, R.; Tullis, J. Evolution of c-axis pole figures and grain size during dynamic recrystallization: Results from experimentally sheared quartzite. J. Geophys. Res. 2006, 111, B10202. [Google Scholar] [CrossRef]
  80. Lister, G.S.; Williams, P.F. Fabric development in shear zones: Theoretical controls and observed phenomena. J. Struct. Geol. 1979, 1, 283–298. [Google Scholar] [CrossRef]
  81. Kruhl, J.H. Reply: Prism- and basal-plane parallel subgrain boundaries in quartz: A microstructural geothermobarometer. J. Metam. Pet. 1998, 16, 142–146. [Google Scholar] [CrossRef]
  82. Faleiros, F.M.; Moraes, R.; Pavan, M.; Campanha, C. A new empirical calibration of the quartz c-axis opening-angle deformation thermometer. Tectonophysics 2016, 671, 173–182. [Google Scholar] [CrossRef]
  83. Muto, J.; Hirth, G.; Heilbronner, R.; Tullis, J. Plastic anisotropy and fabric evolution in sheared and recrystallized quartz single crystals. J. Geophys. Res. 2011, 116. [Google Scholar] [CrossRef]
  84. Schmid, S.M.; Casey, M. Complete fabric analysis of some commonly observed quartz c-axis patterns. Geophys. Monogr. Ser. 1986, 36, 263–286. Available online: https://agupubs.onlinelibrary.wiley.com/doi/10.1029/GM036p0263 (accessed on 25 September 2021).
  85. Platt, J.P.; Vissers, R.L.M. Extensional structures in anisotropic rocks. J. Struct. Geol. 1980, 2, 397–410. [Google Scholar] [CrossRef]
  86. Means, W.D. The concept of steady-state foliation. Tectonophysics 1981, 78, 179–199. [Google Scholar] [CrossRef]
  87. Lister, G.S.; Snoke, A. S-C mylonites. J. Struct. Geol. 1984, 6, 617–638. [Google Scholar] [CrossRef]
  88. Simpson, C. Determination of movement sense in mylonites. J. Geol. Educ. 1986, 34, 246–261. Available online: https://www.tandfonline.com/doi/abs/10.5408/0022-1368-34.4.246 (accessed on 25 September 2021). [CrossRef]
  89. Reynolds, S.J.; Lister, G.S. Structural aspects of fluid-rock interactions in detachment zones. Geology 1987, 15, 362–366. [Google Scholar] [CrossRef]
  90. Lister, G.S. Crossed-girdle c-axis fabrics in quartzites plastically deformed by plane strain and progressive simple shear. Tectonophysics 1977, 39, 51–54. [Google Scholar] [CrossRef]
  91. Rosenberg, C.L.; Stünitz, H. Deformation and recrystallization of plagioclase along a temperature gradient: An example from the Bergell tonalite. J. Struct. Geol. 2003, 25, 389–408. [Google Scholar] [CrossRef]
  92. Kelley, S.P. Structural and Isotopic Studies of Moine Rocks: Moine Thrust to Sgurr Beag Slide. Ph.D. Thesis, Bedford College, University of London, London, UK, 1984. [Google Scholar]
  93. Kelley, S.P. Meall An T-Sithe and Creag Rainich. In Lewisian, Torridonian and Moine Rocks of Scotland; Mendum, J.R., Barber, A.J., Butler, R.W.H., Flinn, D., Goodenough, K.M., Krabbendam, M., Park, R.G., Stewart, A.D., Eds.; Geological Conservation Review Series; Joint Nature Conservation Committee: Peterborough, UK, 2009; pp. 491–494. [Google Scholar]
  94. Kelley, S.P. Loch a’Bhraoin, Braemore and Loch Broom. In An Excursion Guide to the Moine Geology of the Northern Highlands of Scotland; Excursion 9; Strachan, R.A., Alsop, I., Friend, C.R.L., Miller, S., Eds.; Edinburgh Geological Society and Geological Society of Glasgow: Edinburgh, UK, 2010; pp. 162–175. [Google Scholar]
  95. Mazza, S.E.; Mako, C.; Law, R.D.; Caddick, M.J.; Krabbendam, M.; Cottle, J. Thermobarometry of the Moine and Sgurr Beag thrust sheets, northern Scotland. J. Struct. Geol. 2018, 113, 10–32. [Google Scholar] [CrossRef]
  96. Cliff, R.A. Isotopic dating in metamorphic belts. J. Geol. Soc. Lond. 1985, 142, 97–110. [Google Scholar] [CrossRef]
  97. Harrison, T.M.; Célérier, J.; Aikman, A.B.; Hermann, J.; Heizler, M.T. Diffusion of 40Ar in muscovite. Geochim. Cosmochim. Acta 2009, 73, 1039–1051. [Google Scholar] [CrossRef]
  98. Hodges, K.V. Thermochronology in orogenic systems. In Treatise on Geochemistry, 2nd ed.; Holland, H.D., Turekian, K.K., Eds.; Elsevier: Amsterdam, The Netherlands, 2014; pp. 281–308. [Google Scholar] [CrossRef]
  99. Reiners, P.W.; Carlson, R.W.; Renne, P.R.; Cooper, K.M.; Granger, D.E.; McClean, N.M.; Schoene, B. The K–Ar and 40Ar/39Ar systems. In Geochronology and Thermochronology; Reiners, P.W., Carlson, R.W., Renne, P.R., Cooper, K.M., Granger, D.E., McLean, N.M., Schoene, B., Eds.; Wiley: Hoboken, NJ, USA, 2018; pp. 231–257. [Google Scholar] [CrossRef]
  100. Spencer, B.M.; Thigpen, J.R.; Law, R.D.; Mako, C.; McDonald, C.S.; Hodges, K.V.; Ashley, K.T. Rapid cooling during late stage orogenesis and implications for collapse of the Scandian retrowedge, northern Scotland. J. Geol. Soc. Lond. 2020, 177. [Google Scholar] [CrossRef]
  101. Renne, P.R.; Balco, G.; Ludwig, K.R.; Mundil, R.; Min, K. Response to the comment by W.H. Schwarz et al. on “Joint determination of 40K decay constants and the 40Ar*/40K for the Fish Canyon sanidine, and improved accuracy for 40Ar/39Ar geochronology” by P.R. Renne et al. Geochim. Cosmochim. Acta 2011, 75, 5097–5100. [Google Scholar] [CrossRef]
  102. Lee, J.-Y.; Marti, K.; Severinghaus, J.P.; Kawamura, K.; Yoo, H.-S.; Lee, J.B.; Kim, J.S. A redetermination of the isotopic abundances of atmospheric Ar. Geochim. Cosmochim. Acta 2006, 70, 4507–4512. [Google Scholar] [CrossRef]
  103. Renne, P.R.; Cassata, W.S.; Morgan, L.E. The isotopic composition of atmospheric argon and 40Ar/39Ar geochronology: Time for a change? Quat. Geochronol. 2009, 4, 288–298. [Google Scholar] [CrossRef]
  104. Wendt, I.; Carl, C. The statistical distribution of the mean squared weighted deviation. Chem. Geol. 1991, 86, 275–285. [Google Scholar] [CrossRef]
  105. British Geological Survey. Ben Wyvis, Scotland Sheet 93W, Bedrock & Superficial Deposits; 1:50,000 Geological Map Series; British Geological Survey, Keyworth: Nottingham, UK, 2004. [Google Scholar]
  106. Ellis, M.; Watkinson, A.J. Orogen-parallel extension and oblique tectonics: The relation between stretching lineations and relative plate motions. Geology 1987, 15, 1022–1026. [Google Scholar] [CrossRef]
  107. Klaper, E.M. Quartz c-axis fabric development and large-scale nappe folding (Wandfluhhorn Fold, Penninic nappes). J. Struct. Geol. 1988, 10, 795–802. [Google Scholar] [CrossRef]
  108. Gilotti, J.A.; Hull, J.M. Kinematic stratification in the hinterland of the central Scandinavian Caledonides. J. Struct. Geol. 1993, 15, 629–646. [Google Scholar] [CrossRef]
  109. Mancktelow, N.S.; Pavlis, T.L. Fold-fault relationships in low-angle detachment systems. Tectonics 1994, 13, 668–685. [Google Scholar] [CrossRef]
  110. Grujic, D.; Mancktelow, N.S. Folds with axes parallel to the extension direction: An experimental study. J. Struct. Geol. 1995, 17, 279–291. [Google Scholar] [CrossRef]
  111. Sullivan, W.A. L tectonites. J. Struct. Geol. 2013, 50, 161–175. [Google Scholar] [CrossRef]
  112. Peach, B.N.; Gunn, W.; Clough, C.T.; Hinxman, L.W.; Crampton, C.B.; Anderson, E.M. The Geology of Ben Wyvis, Carn Chuinneag, Inchbae and the Surrounding Country (Sheet 93); British Geological Survey Memoir, HMSO: Edinburgh, UK, 1912; 189p. [Google Scholar]
  113. Tilley, C.E. The role of kyanite in the ’hornfels zone’ of the Carn Chuinneag granite (Ross-shire). Min. Mag. 1935, 24, 92–97. [Google Scholar] [CrossRef]
  114. Harker, R.J. The Metamorphic History of the Carn Chuinneag-Inchbae Massif and Its Environment. Ph.D. Thesis, Cambridge University, Cambridge, UK, 1953. [Google Scholar]
  115. Harker, R.J. Further data on the petrology of the politic hornfelses of the Carn Chuinneag-Inchbae region, Ross-shire, with special reference to the status of almandine. Geol. Mag. 1954, 91, 445–462. [Google Scholar] [CrossRef]
  116. Shepherd, J. The structure and structural dating of the Carn Chuinneag intrusion, Ross-shire. Scott. J. Geol. 1973, 9, 63–88. [Google Scholar] [CrossRef]
  117. Wilson, D.; Shepherd, J. The Carn Chuinneag granite and its aureole. Geol. Soc. Lond. Spec. Publ. 1979, 8, 669–675. [Google Scholar] [CrossRef]
  118. Oliver, G.J.H.; Wilde, S.A.; Wan, Y. Geochronology and geodynamics of Scottish granitoids from the late Neoproterozoic break-up of Rodinia to Palaeozoic collision. J. Geol. Soc. Lond. 2008, 165, 661–674. [Google Scholar] [CrossRef]
  119. Rathbone, P.A. Basement-Cover Relationships in the Moine Series of Scotland with Particular Reference to the Sgurr Beag Slide. Ph.D. Thesis, University of Liverpool, Liverpool, UK, 1980. [Google Scholar]
  120. Rathbone, P.A.; Harris, A.L. Basement-cover relationships at Lewisian inliers in Moine rocks. Geol. Soc. Lond. Spec. Publ. 1979, 8, 101–107. [Google Scholar] [CrossRef]
  121. Grant, C.J.; Harris, A.L. The kinematic and metamorphic history of the Sgurr Beag thrust, Ross-shire, NW Scotland. J. Struct. Geol. 2000, 22, 191–206. [Google Scholar] [CrossRef]
  122. Hyslop, E.K. Carn Gorm. In Lewisian, Torridonian and Moine Rocks of Scotland; Mendum, J.R., Barber, A.J., Butler, R.W.H., Flinn, D., Goodenough, K.M., Krabbendam, M., Park, R.G., Stewart, A.D., Eds.; Geological Conservation Review Series; Joint Nature Conservation Committee: Peterborough, UK, 2009; pp. 451–455. [Google Scholar]
  123. Long, L.E.; Lambert, R.S.J. Rb-Sr isotopic ages from the Moine series. In The British Caledonides; Johnson, M.R.W., Stewart, F.H., Eds.; Oliver and Boyd: Edinburgh, UK, 1963; pp. 217–247. [Google Scholar]
  124. Van Breemen, O.; Pidgeon, R.T.; Johnson, M.R.W. Precambrian and Palaeozoic pegmatites in the Moines of northern Scotland. J. Geol. Soc. Lond. 1974, 130, 493–507. [Google Scholar] [CrossRef]
  125. British Geological Survey. Strathconon, Scotland Sheet 83W, Solid & Drift; 1:50,000 Provisional Series; British Geological Survey, Keyworth: Nottingham, UK, 2001. [Google Scholar]
  126. Rathbone, P.A.; Coward, M.P.; Harris, A.L. Cover and basement: A contrast in style and fabric. Geol. Soc. Am. Mem. 1983, 158, 213–223. Available online: https://pubs.geoscienceworld.org/books/book/168/chapter/4691439/Cover-and-basement-A-contrast-in-style-and-fabrics (accessed on 26 September 2021).
  127. Mako, C.A.; Law, R.D.; Caddick, M.J.; Kylander-Clark, A.; Thigpen, J.R.; Ashley, K.; Mazza, S.E.; Cottle, J. Growth and fluid-assisted alteration of accessory phases before, during and after Rodinia breakup: U-Pb geochronology from the Moine Supergroup rocks of northern Scotland. Precamb. Res. 2021, 355, 106089. [Google Scholar] [CrossRef]
  128. Wilson, D. Structure and Metamorphism of the Ben Wyvis District, Ross-Shire. Ph.D. Thesis, University of Edinburgh, Edinburgh, UK, 1975. Available online: http://hdl.handle.net/1842/14673 (accessed on 25 September 2021).
  129. Stipp, M.; Tullis, J. The recrystallized grain size piezometer for quartz. Geophys. Res. Lett. 2003, 30, 2088. [Google Scholar] [CrossRef] [Green Version]
  130. Stipp, M.; Tullis, J.; Behrens, H. Effect of water on the dislocation creep microstructure and flow stress of quartz and implications for the recrystallized grain size piezometer. J. Geophys. Res. 2006, 111, B042201. [Google Scholar] [CrossRef] [Green Version]
  131. Strachan, R.A.; Holdsworth, B.; Krabbendam, M.; Leslie, G.; Soper, J. Excursion 10: South and Central Sutherland. In An Excursion Guide to the Moine Geology of the Northern Highlands of Scotland; Strachan, R.A., Alsop, I., Friend, C.R.L., Miller, S., Eds.; Edinburgh Geological Society and Geological Society of Glasgow: Edinburgh, UK, 2010; pp. 184–190. [Google Scholar]
  132. Heinrich, W.; Andrehs, G.; Franz, G. Monazite—Xenotime miscibility gap thermometry. I. An empirical calibration. J. Metam. Geol. 1997, 15, 3–16. [Google Scholar] [CrossRef]
  133. Kruhl, J.H.; Huntemann, T. The structural state of the former lower continental crust in Calabria (S. Italy). Geol. Rundsch. 1991, 80, 289–302. [Google Scholar] [CrossRef]
  134. Morgan, S.S.; Law, R.D. Unusual transition in quartzite dislocation creep regimes and crystal slip systems in the aureole of the EJB pluton, California: A case for anhydrous conditions created by decarbonation of adjacent marbles. Tectonophysics 2004, 384, 209–231. [Google Scholar] [CrossRef]
  135. Wilson, G.; Watson, J.; Sutton, J. Current-bedding in the Moine Series of north-western Scotland. Geol. Mag. 1953, 90, 377–387. [Google Scholar] [CrossRef]
  136. Sutton, J.; Watson, J. The structure and stratigraphical succession of the Moines of Fannich Forest and Strath Ban, Ross-shire. Quart. J. Geol. Soc. Lond. 1954, 110, 21–54. [Google Scholar] [CrossRef]
  137. British Geological Survey. Sheet 108W, Ben Hee Bedrock; British Geological Survey Scotland 1:50,000 Series; British Geological Survey, Keyworth: Nottingham, UK, 2009. [Google Scholar]
  138. Bonsor, H.C.; Strachan, R.A.; Prave, A.R.; Krabbendam, M. Fluvial braidplain to shallow marine transition in the early Neoproterozoic Morar Group, Fannich Mountains, northern Scotland. Precambrian Res. 2010, 183, 791–804. [Google Scholar] [CrossRef] [Green Version]
  139. Bonsor, H.C.; Strachan, R.A.; Prave, A.R.; Krabbendam, M. Sedimentology of the early Neoproterozoic Morar Group in northern Scotland: Implications for basin models and tectonic setting. J. Geol. Soc. Lond. 2012, 169, 53–65. [Google Scholar] [CrossRef] [Green Version]
  140. Holdsworth, R.E. The stereographic analysis of facing. J. Struct. Geol. 1988, 10, 219–223. [Google Scholar] [CrossRef]
  141. Phillips, F.C. A fabric study of some Moine schists and associated rocks. J. Geol. Soc. Lond. 1937, 93, 581–620. [Google Scholar] [CrossRef]
  142. Howarth, R.J.; Leake, B.E. The Life of Frank Coles Phillips (1902–1982) and the Structural Geology of the Moine Petrofabric Controversy. Geol. Soc. Lond. Mem. 2002, 23, 1–91. [Google Scholar] [CrossRef]
  143. Crampton, C.B. Petrofabric and Textural Study of the Moine and Cambrian in Sutherland and Ross. Ph.D. Thesis, University of Bristol, Bristol, UK, 1955. [Google Scholar]
  144. Greenawald, D.; Law, R.D. Early quartz fabrics from the Caledonides of northern Scotland: A new look at old data. In Proceedings of the 21st International Conference on Deformation, Rheology and Tectonics, Inverness, UK, 30 April–4 May 2017. [Google Scholar]
  145. Holdsworth, R.E.; Roberts, A.M. Early curvilinear fold structures and strain in the Moine of the Glen Garry region, Inverness-shire. J. Geol. Soc. Lond. 1984, 141, 327–338. [Google Scholar] [CrossRef]
  146. Lapworth, C. The secret of the Highlands. Geol. Mag. 1883, 10, 120–128, 193–199, 337–344. [Google Scholar] [CrossRef] [Green Version]
  147. Callaway, C. Notes on progressive metamorphism. Geol. Mag. 1884, 1, 218–224. [Google Scholar] [CrossRef]
  148. Peach, B.N.; Horne, J. Report on the geology of the North-West of Sutherland. Nature 1884, 31, 31–35. [Google Scholar] [CrossRef] [Green Version]
  149. Lapworth, C. On the close of the highland controversy. Geol. Mag. 1885, 2, 97–106. [Google Scholar] [CrossRef] [Green Version]
  150. Lapworth, C. The highland controversy in British geology: Its causes, course and consequences. In Report of the Fifty-Fifth Meeting of the British Association for the Advancement of Science: Held at Aberdeen in September 1885; John Murray: London, UK, 1886; pp. 1025–1027. Available online: https://archive.org/details/lapworth-1886-reportofbritisha-86brit/mode/2up (accessed on 25 September 2021).
  151. Peach, B.N.; Horne, J.; Gunn, W.; Clough, C.T.; Hinxman, L.W.; Cadell, H.M. Report on the recent work of the Geological Survey in the North-west Highlands of Scotland, based on the field-notes and maps of Messers. Q. J. Geol. Soc. Lond. 1888, 44, 378–441. [Google Scholar] [CrossRef]
  152. Evans, D.J.; White, S.H. Microstructural and fabric studies from the rocks of the Moine nappe, Eriboll, NW Scotland. J. Struct. Geol. 1984, 6, 369–389. [Google Scholar] [CrossRef]
  153. Grant, C.J. The Kinematics and Tectonic Significance of Ductile Shear Zones within the Northern Highland Moine. Ph.D. Thesis, University of Liverpool, Liverpool, UK, 1989. [Google Scholar]
  154. Holdsworth, R.E.; Grant, C.J. Convergence-related ‘dynamic spreading’ in a mid-crustal ductile thrust zone: A possible orogenic wedge model. Geol. Soc. Lond. Spec. Publ. 1990, 54, 491–500. [Google Scholar] [CrossRef]
  155. Lusk, A.D.J.; Platt, J.P. The deep structure and rheology of a plate boundary-scale shear zone: Constraints from an exhumed Caledonian shear zone, NW Scotland. Lithosphere 2020, 2020, 8824736. [Google Scholar] [CrossRef]
  156. Alsop, G.I.; Holdsworth, R.E. The distribution, geometry and kinematic significance of Caledonian buckle folds in the western Moine nappe, northwestern Scotland. Geol. Mag. 1993, 130, 353–362. [Google Scholar] [CrossRef]
  157. Alsop, G.I.; Holdsworth, R.E. Flow perturbation folding in shear zones. Geol. Soc. Lond. Spec. Publ. 2007, 272, 75–101. [Google Scholar] [CrossRef]
  158. Alsop, G.I.; Holdsworth, R.E.; Strachan, R.A. Transport-parallel folds within a mid-crustal Caledonian thrust stack, northern Scotland. J. Struct. Geol. 1996, 18, 783–790. [Google Scholar] [CrossRef]
  159. Kinny, P.D.; Strachan, R.A.; Friend, C.R.L.; Kocks, H.; Rogers, G.; Paterson, B.A. U-Pb geochronology of deformed metagranites in central Sutherland, Scotland: Evidence for widespread late Silurian metamorphism and ductile deformation of the Moine Supergroup during the Caledonian orogeny. J. Geol. Soc. Lond. 2003, 160, 259–269. [Google Scholar] [CrossRef] [Green Version]
  160. Holdsworth, R.E.; Strachan, R.A. Interlinked system of ductile strike slip and thrusting formed by Caledonian sinistral transpression in northeastern Greenland. Geology 1991, 19, 510–513. [Google Scholar] [CrossRef]
  161. Strachan, R.A.; Holdsworth, R.E.; Friderichsen, J.D.; Jepsen, H.F. Regional Caledonian structure within an oblique convergence zone, Dronning Louise Land, NE Greenland. J. Geol. Soc. Lond. 1992, 149, 359–371. [Google Scholar] [CrossRef]
  162. Strachan, R.A.; Chadwick, B.; Friend, C.R.L.; Holdsworth, R.E. New perspectives on the Caledonian orogeny in Northeast Greenland. Geol. Assoc. Can. Spec. Pap. 1995, 41, 303–322. [Google Scholar]
  163. White, A.P.; Hodges, K.V.; Martin, M.W.; Andresen, A. Geologic constraints on middle-crustal behaviour during broadly synorogenic extension in the central East Greenland Caledonides. Geol. Rundsch. 2002, 91, 187–208. [Google Scholar] [CrossRef]
  164. Smith, S.A.F.; Strachan, R.A.; Holdsworth, R.E. Microstructural evolution within a partitioned midcrustal transpression zone, northeast Greenland Caledonides. Tectonics 2007, 26, TC4003. [Google Scholar] [CrossRef]
  165. Soper, N.J.; Strachan, R.A.; Holdsworth, R.E.; Gayer, R.A.; Greiling, R.O. Sinistral transpression and the Silurian closure of Iapetus. J. Geol. Soc. Lond. 1992, 149, 871–880. [Google Scholar] [CrossRef]
  166. Dewey, J.F.; Strachan, R.A. Changing Silurian-Devonian relative plate motion in the Caledonides: Sinistral transpression to sinistral transtension. J. Geol. Soc. Lond. 2003, 160, 219–229. [Google Scholar] [CrossRef]
  167. Fossen, H.; Teyssier, C. Strain modeling of transpressional and transtensional deformation. Norsk Geol. Tidsskr. 1994, 74, 134–145. [Google Scholar]
  168. Dewey, J.F.; Holdsworth, R.E.; Strachan, R.A. Transpression and transtension zones. Geol. Soc. Lond. Spec. Publ. 1998, 135, 1–14. [Google Scholar] [CrossRef]
  169. Fossen, H. Structural Geology, 2nd ed.; Cambridge University Press: Cambridge, UK, 2016. [Google Scholar]
  170. Rogers, G.; Kinny, P.D.; Strachan, R.A.; Friend, C.R.L.; Paterson, B.A. U-Pb geochronology of the Fort Augustus granite gneiss: Constraints on the timing of Neoproterozoic and Paleozoic tectonothermal events in the NW Highlands of Scotland. J. Geol. Soc. Lond. 2001, 158, 7–14. [Google Scholar] [CrossRef]
  171. Holdsworth, R.E. Late brittle deformation in a Caledonian ductile thrust wedge: New evidence for gravitational collapse in the Moine Thrust sheet, Sutherland, Scotland. Tectonophysics 1989, 170, 17–28. [Google Scholar] [CrossRef]
  172. Powell, D.; Glendinning, R.W. Late Caledonian extensional reactivation of a ductile thrust in NW Scotland. J. Geol. Soc. Lond. 1990, 147, 979–987. [Google Scholar] [CrossRef]
Figure 3. Geological map showing position of oriented samples in Area 1 from the western part of the sampling transect across the Moine thrust sheet (box 1 in Figure 1). Red circles indicate location of samples MT-1 to MT-28 with quartz c-axis fabrics described in this paper. Trends of maximum principal stretch directions calculated from quartz c-axis fabrics in individual samples indicated by green arrows. Yellow circles indicate locations of samples collected adjacent to Moine thrust plane without c-axis fabrics. Trends of mineral lineations in platy mylonites directly above Moine thrust indicated by blue arrows. Light gray lines are drawn parallel to structure contours on underlying Moine thrust [65,66] to estimate projected positions on cross section line A-B (Figure 4) of samples with quartz c-axis fabrics. DC, Dundonnell Culmination, DH, Dundonnell House. Geological map and stratigraphic units are modified from British Geological Survey [69,70] and Krabbendam et al., [56]. Qm = Morar Group undivided, likely equivalent to the Crom Psammite; SG = Glenfinnan Group undivided.
Geosciences 11 00411 g003
Figure 4. (a) Cross section along western part of the sampling transect across the Moine thrust sheet in Area 1 and western part of Area 2 (boxes 1 and 2 in Figure 1 and Figure 2). A–B marks extent of cross section in Area 1 (Figure 3). Projected positions of samples on cross section are shown; note that projected positions for individual samples may either be above or below topographic surface on the line of cross section. Estimated structural distances of projected positions of individual samples above Moine thrust are indicated. Depth to detachment for the Braemore Syncline/Beinn Dearg Anticline fold-pair using the graphical methods of Epard and Groshong [67] and Bulnes and Poblet [68] is also indicated. Cross section adapted from British Geological Survey [70] and Krabbendam et al., [56]. For explanation of stratigraphic units see Figure 3. (b) Variation in trend of maximum principal finite stretch directions estimated from quartz c-axis fabrics (and coincident mineral lineations) with horizontal distance along cross section line from ground surface position of Moine thrust; zero position is where cross section intersects mapped position of thrust.
Geosciences 11 00411 g004
Figure 5. Orientations of poles to foliation, mineral grain shape lineations and maximum principal stretch directions indicated by quartz c-axis fabrics within study Areas 1–4 on transect across the Moine and Sgurr Beag thrust sheets (Figure 1). All equal angle, lower hemisphere projections arranged in order of increasing structural height above the Moine thrust. (a) Poles to foliation and grain shape lineations in samples collected adjacent to underlying Moine thrust plane in Area 1(yellow coded MT-09 series samples plus red coded samples MT1 and 2 in Figure 3). Vector average lineation represented by cross. (b) Poles to foliation and maximum principal stretch directions indicated by quartz c-axis fabrics in samples MT-1 to MT-28 (red coded in Figure 3) between the Moine thrust and hinge of the Braemore Syncline in Area 1. (c) Poles to foliation and maximum principal stretch directions in samples MT-28 to MT-39 from the Moine thrust sheet between the hinge of the Braemore Syncline and the east end of Loch Glascarnoch in Area 2. (d) Poles to foliation and maximum principal stretch directions in samples MT-40 to MT-47 and SB-1 to SB-5 from the Moine and Sgurr Beag thrust sheets, respectively between Inchbae Lodge and Rogie Falls in Area 3. (e) Compilation of poles to foliation in the Moine and Sgurr Beag thrust sheets in Areas 1–3. (f) Poles to foliation and maximum principal stretch directions in samples MT-48 to MT-52 and SB-6 to SB-10 from the Moine and Sgurr Beag thrust sheets, respectively, in Area 4 on the Creich Peninsula coastal section.
Geosciences 11 00411 g005
Figure 6. Summary of changing microstructures and petrology with structural distance above the Moine thrust in Area 1.
Geosciences 11 00411 g006
Figure 7. Microstructures from Area 1 (ah) and Area 2 (i,j). All micrographs oriented perpendicular to foliation and parallel to mineral lineation and are viewed towards the north and east; plunge and trend of mineral lineation indicated. Micrographs arranged in order of increasing structural height above Moine thrust. Foliation oriented left to right in (a,b) and (eh), top-right to bottom-left in (c,d), and top-left to bottom-right in (i,j). Cross-polarized light with analyzer plate inserted in (ad,f,i,j); plane polarized light in (e,g,h). (a) Variation in recrystallized grain size of quartz controlled by domanial variation in mica content in sample MT-1. Alignment of elongate relatively large recrystallized grains oblique to foliation in quartz-rich layer indicates top to west (top to left) shear sense. (b) Foliation in sample MT-2 anastomosing around feldspar clasts composed of single grains of plagioclase and orthoclase feldspar. (c,d) Lobate boundaries between plagioclase grain (g) and surrounding quartz grains (Q) in sample MT-6. White box outline in (c) indicates location of (d). Note trail of white mica grains within quartz grain. (e,f) White mica ‘fish’ (M) surrounded by matrix of finer grained quartz and pleochroic fox-red biotite in sample MT-10. Orientation of white mica ‘fish’ with respect to foliation indicates a top to northwest (top to left) shear sense. (g) Equant to dominantly elongate grains of epidote (E) surrounded by quartz and biotite in sample MT-15. (h) Prolific growth of closely spaced garnet grains with puddle-like inclusions of quartz in sample MT-19. (i,j) Elongate orthoclase feldspar grain (Or) oriented parallel to macroscopic foliation in sample MT-36. Boundaries with surrounding quartz grains (Q) are highly lobate indicating widespread grain boundary migration between adjacent orthoclase and quartz grains. White box outline in (i) indicates location of (j).
Geosciences 11 00411 g007
Figure 8. Variation in size of dynamically recrystallized quartz grains between the Moine thrust plane and hinge of the Braemore Syncline (samples MT-1 to MT-28 in Figure 3 and Figure 4); 100 grains measured optically in each thin section using either a 10X or 20X objective lens; separate measurements using 10X and 20X lenses made in MT-10, 12, 13 and 14 to check for reproducibility of geometric mean values. (a) Grain size versus structural height above Moine thrust (Figure 4). (b) Grain size versus trend of mineral lineation/maximum principal stretch direction indicated by quartz c-axis fabric. Grain size data are summarized in Supplementary File S2.
Geosciences 11 00411 g008
Figure 9. Angular relationships predicted by numerical modelling (e.g., Lister et al., [77]; Lister and Williams [80]) and experimental deformation (e.g., Tullis [76], Heilbronner and Tullis [79], Muto et al., [83]) between principal finite stretch directions and cross-girdle quartz c-axis fabric. Projection plane is perpendicular to foliation and parallel to lineation (L). Using sample MT-1 as an example, fabric skeleton (red line) is drawn to determine fabric opening angle (OA) and position of intermediate principal finite stretch direction (Y) on fabric diagram where c-axis fabric intersects foliation. Maximum principal finite stretch direction is oriented in foliation at 90° to Y. Angles C1 and C2 between the pole to foliation (Z) and leading (le) and trailing (te) edges of fabric skeleton, respectively, are used to determine shear sense which may be independently verified by microstructural shear sense indicators such as shear bands and oblique recrystallized grain shape alignments. Fabric opening angle may be used to determine deformation temperature [19,81,82].
Geosciences 11 00411 g009
Figure 10. Optically measured quartz c-axis fabrics from ~4.2 km thick zone of planar zone Moine metasedimentary rocks in Area 1 located between outcrop position of the Moine thrust (samples MT-1 and MT-2) and 1750 m (MT-14) above thrust. Map and projected cross section positions of individual samples are shown in Figure 3 and Figure 4, respectively. Sample numbers arranged in order of increasing structural distance above the projected subsurface position of the Moine thrust (Figure 4). All equal area projections oriented perpendicular to foliation and parallel to mineral lineation/maximum principal stretch direction inferred from c-axis fabric (cf. Figure 9). Plunge and trend of maximum principal stretch direction indicated for each sample, viewing direction progressively changes from towards the N close to Moine thrust, to towards the E with both increasing structural height above thrust plane and increasing down-dip position above Moine thrust. Orientations of shear bands and oblique alignment (Sb) of elongate dynamically recrystallized quartz grains indicated. All fabric asymmetries and microstructures (with the exception of quartz vein MT-9) indicate a top to the W (thrust) shear sense close to the Moine thrust and progressively transition to a top to the N shear sense with increasing structural height and down dip position above the thrust (Supplementary File S1).
Geosciences 11 00411 g010
Figure 11. Optically measured quartz c-axis fabrics from ~4.2 km thick zone of planar zone Moine metasedimentary rocks in Area 1 located at between 1800 m (sample MT-15) above Moine thrust and hinge zone of the Braemore Syncline (MT-28) at 4200 m above thrust. See Figure 10 for details of orientation systems used, fabric projection and orientation of microstructures recorded.
Geosciences 11 00411 g011
Figure 12. Quartz c-axis fabric data from Area 1; samples M-1 to M-28. (a) Relationships in individual samples between C1 and C2 between the leading (le) and trailing (te) edges of the fabric skeleton and pole to foliation (Figure 9); gray area denotes angular range consistent with top to W to top to N shear sense. (b) Relationships between fabric opening angle and geometric mean grain size of dynamically recrystallized quartz; deformation temperatures inferred from opening angle (using linear calibration of Faleiros et al., [82]) are indicated. (c) Relationships between fabric opening angle and structural distance above Moine thrust (Figure 4). (d) Relationships between fabric opening angle and trend of lineation/maximum principal stretch direction indicated by c-axis fabrics (Figure 9). Note much smaller opening angle for sample MT-09 from deformed quartzite with fabric indicating constrictional strain.
Geosciences 11 00411 g012
Figure 13. (a,b) Two alternative end-member interpretations of arcuate map pattern of lineation trends within the ~4.2 km thick planar domain of Moine metasedimentary rocks in immediate hanging wall to the Moine thrust in Area 1 (Figure 2, Figure 3 and Figure 5a,b) and associated shear senses indicated by quartz c-axis fabric asymmetry and microstructures (Figure 10 and Figure 11); arrow heads indicate inferred transport direction. (a) Different uni-directional lineation trends and inferred transport directions at different structural levels above thrust; three levels shown. (b) Similar arcuate pattern of lineation trends and inferred transport directions at all structural levels above thrust; range of lineation trends actually observed in samples collected at the three structural levels shown are indicated by solid green lines; position of cross section in Figure 4 shown schematically. (c,d) Variation in trend of lineation/maximum principal stretch direction in samples MT-1 to MT-28 from Area 1with projected structural distances above Moine thrust and projected horizontal distance from ground surface position of Moine thrust on cross section shown in Figure 4; zero position is where cross section intersects mapped position of thrust (Figure 3). (e) Interpretation of arcuate map pattern of lineation trends based on data in graphs in (c,d). Lowermost domain represents ~0–500 m above thrust (080°–115° range in lineation trend); middle domain ~500–1000 m (090°–135°); top domain ~1000–4200 m above thrust (135°–170°) and extending to at least base of Sgurr Beag thrust sheet exposed on Meall an t-Sith (Figure 3).
Geosciences 11 00411 g013
Figure 14. (a) Cross section along sampling transect (Areas 1–3) across the Moine and Sgurr Beag thrust sheets between Dundonnell House and Rogie Falls. Line of cross section is shown on Figure 1 (map boxes 1–3). (A–C) indicates location of section drawn at larger scale in Figure 4. (A–B) indicates part of cross section located in Area 1, (B–C–D) in Area 2 and (E–F) in Area 3; see Figure 1 for relative positions of Areas 1–3. For explanation of stratigraphic units see Figure 3. Red and orange filled circles indicate projected positions of samples with quartz c-axis fabrics from the Moine and Sgurr Beag thrust sheets, respectively. Blue filled circles indicate positions of samples (MT-PET-1 and SB-PET-1) from the Moine and Sgurr Beag thrust sheets, respectively, with petrology-based thermobarometry and geochronology data. Depth to detachment for the Braemore Syncline/Beinn Dearg Anticline fold-pair using the graphical methods of Epard and Groshong [67] and Bulnes and Poblet [68] is also indicated. (b) Variation in trend of maximum principal finite stretch directions estimated from quartz c-axis fabrics (and coincident mineral lineations) with horizontal distance along cross section line. (c) Variation in quartz c-axis fabric opening angle (C1 + C2 in Figure 9) and deformation temperatures inferred from opening angle (using linear calibration of Faleiros et al., [82]) with horizontal distance along cross section line. Note much smaller opening angle for sample MT-9 (yellow filled circle) from deformed quartzite with c-axis fabric (Figure 10) indicating constrictional strain.
Geosciences 11 00411 g014
Figure 15. 40Ar/39Ar apparent age spectra and Ca/K plot for muscovite in sample MT-10 collected at 1220 m above the Moine thrust in Area 1. Plateau date of 432.2 ± 1.8 Ma is reported for thirteen incremental heating steps (steps 1–13/14) represented by the gray boxes, which comprise 99.7% of radiogenic argon released during the experiment. One step was rejected (step 14/14) but accounted for just 0.3% of released argon and is, therefore, not visible at this scale. Uncertainty box heights are 2δ. Data presented in Supplementary Files S3 and S4.
Geosciences 11 00411 g015
Figure 16. Geological map of Area 2 showing positions of oriented samples in the western-central part of the sampling transect across the Moine thrust sheet (box 2 in Figure 1) between the hinge of the Braemore Syncline (BS; sample MT-28) and the Glascarnoch River which drains eastwards from Loch Glascarnoch (samples MT-38 and MT-39 located 0.5 km to east of Aultguish Inn). Line of cross section (Figure 14) indicated. ORS—Old Red Sandstone. For explanation of all other stratigraphic units see Figure 3. Geological map and stratigraphic units are modified from British Geological Survey [70,105].
Geosciences 11 00411 g016
Figure 17. Optically measured quartz c-axis fabrics from west vergent km-scale fold train in Area 2 between hinge of Braemore Syncline (sample MT-28), east end of Loch Glascarnoch (samples MT-37 to MT-39), and Carn Chuinneag–Inchbae intrusive complex (Figure 1, Figure 14 and Figure 16). Sample numbers arranged in west–east location order. All equal area projections oriented perpendicular to foliation and parallel to mineral lineation/maximum principal stretch direction inferred from c-axis fabric (cf. Figure 9). Plunge and trend of maximum principal stretch direction indicated for each sample. All fabric diagrams viewed towards the E. Orientations of shear bands and oblique alignment (Sb) of elongate dynamically recrystallized quartz grains indicated. With the exception of sample MT-29 located on the inverted limb of the Braemore Syncline–Beinn Dearg Anticline fold pair (cf. Figure 14), all fabric asymmetries (C1 vs. C2) and microstructures indicate a top to the N shear sense (Supplementary File S1). Unfolding of this inverted fold limb produces an original top to the N shear sense for MT-29, consistent with all other samples.
Geosciences 11 00411 g017
Figure 18. Compilation of quartz c-axis fabric data from Area 1 (Moine thrust plane to hinge of Braemore Syncline), Area 2 (hinge of Braemore Syncline to east end of Loch Glascarnoch), and Area 3 (Inchbae Lodge to Ben Wyvis to Grave to Rogie Falls). (a) Explanation of quartz c-axis fabric external asymmetry components. Shear sense inferred from these external fabric asymmetry parameters can be compared with microstructural shear sense indicators such as shear bands and oblique alignment (Sb) of elongate dynamically recrystallized quartz grains. See also Figure 9 for principal finite extension directions inferred from fabric skeleton. (b) Relationship between C1 and C2; grey shaded area indicate where differences between C1 and C2 are compatible with top to the W, NW and N shear sense traced from foreland to hinterland. Sample numbers for the Moine and Sgur Beag thrust sheets in Areas 2 and 3 indicated. For clarity, numbers are omitted from Area 1 samples. (c) Relationships between fabric opening angle (C1 + C2) and inferred deformation temperature (using linear calibration of Faleiros et al., 2016) and trend of mineral lineation/maximum principal stretch direction for samples collected from the Moine thrust sheet (samples MT-1–MT-47) in Areas 1–3 and the Sgurr Beag thrust sheet (samples SB-1–SB-7) in Area 3. Second order best fit polynomial curve to data points shown. Note much smaller opening angle for sample MT-9 from deformed quartzite in Area 1 with c-axis fabric (Figure 10) indicating constrictional strain.
Geosciences 11 00411 g018
Figure 19. (a) Schematic block diagram illustrating pattern of quartz c-axis fabric asymmetry on right way-up and overturned limbs of km-scale west vergent folds (Braemore Syncline, Beinn Dearg Anticline and An Einig Syncline) along cross-section in Figure 14 within the Moine thrust sheet in Areas 1 and 2 between samples MT-21 to west of Braemore Junction and MT-33 at Loch Glascarnoch. Gently plunging mineral lineation is parallel to N-S trending fold hinges. Quartz c-axis fabrics demonstrate that lineation is also parallel to maximum principal finite stretch direction. Fabric asymmetry (plus shear bands and elongate dynamically recrystallized quartz grains oriented oblique to foliation) indicates a structurally top to the north shear sense on right way up folds limbs and a structurally top to the south shear sense on overturned fold limbs. (b) Restoring right way-up and inverted fold limbs to a sub-horizontal tabular body produces a consistent top to north shear sense throughout the Moine and Sgurr Beag thrust sheets in Areas 1–3 between Braemore Junction (sample MT-21) and Rogie Falls (sample SB-7). Tectonic grain shape fabric associated with quartz c-axis fabrics is considered to pre-date the west vergent folds.
Geosciences 11 00411 g019
Figure 20. Geological map showing position of oriented samples from Area 3 in the eastern part of the sampling transect across the Moine and Sgurr Beag thrust sheets (box 3 in Figure 1) between the Carn Chuinneag–Inchbae intrusive complex exposed near Inchbae Lodge (sample MT-40) and Rogie Falls (sample SB-7). Location of samples from the Moine and Sgurr Beag thrust sheets indicated by red and orange filled circles, respectively. Position of southeastern end of cross section shown in Figure 14 indicted by line E–F. SBT—Sgurr Beag thrust; GRS—Garve railway station. Yellow circle labelled a—location of pegmatites used by Long and Lambert [123] and van Breeman et al., [124] for isotopic dating (grid reference NH 443631). Yellow circle labelled b—location of Carn Gorm and samples used by Cawood et al., [32] for isotopic dating (NH 4388 6289). Yellow circle labelled c—location of Rogie Falls amphibolite samples used by Mako [16] for isotopic dating (NH 44277 58455). For explanation of stratigraphic units see Figure 3. Geological map and stratigraphic units are modified from British Geological Survey [105,125] and Hyslop [122].
Geosciences 11 00411 g020
Figure 22. Optically measured quartz c-axis fabrics from the Moine (samples MT-40 to MT-47) and Sgurr Beag (samples SB-1 to SB-7) thrust sheets in Area 3 between Inchbae Lodge and Rogie Falls (Figure 1 and Figure 20). Sample numbers arranged in order of estimated distance below (MT series) and above (SB series) the Sgurr Beag thrust. Sample SB-4 is a sheared foliation-parallel quartz vein; all other samples are Moine metasedimentary rocks. All equal area projections oriented perpendicular to foliation and parallel to mineral lineation/maximum principal stretch direction inferred from c-axis fabric (cf. Figure 9). Plunge and trend of maximum principal stretch direction indicated for each sample. All fabric diagrams viewed towards the E. With the exception of sample SB-5, all fabric asymmetries (C1 vs. C2) a top to the N shear sense (Figure 18b and Supplementary File S1). Orientations of shear bands and oblique alignment (Sb) of elongate dynamically recrystallized quartz grains indicated. All observed shear bands and Sb alignments indicate a top to the N shear sense (Supplementary File S1); conjugate shear bands observed in SB-1.
Geosciences 11 00411 g022
Figure 25. Optically measured quartz c-axis fabrics from the Moine (samples MT-48 to MT-52) and Sgurr Beag (samples SB-8 to SB-10) thrust sheets in Area 4 on the Creich Peninsula coastal exposure (Figure 23). Sample numbers arranged in order of estimated distance below (MT series) and above (SB series) the Sgurr Beag thrust. Plunge and trend of maximum principal stretch direction indicated for each sample. Orientations of shear bands and oblique alignment (Sb) of elongate dynamically recrystallized quartz grains indicated. All fabric asymmetries (C1 vs. C2) and observed shear bands and oblique alignment of elongate recrystallized quartz grains (Sb) oblique to foliation indicate a top down to the SE shear sense (Figure 26 and Supplementary File S1).
Geosciences 11 00411 g025
Figure 26. Compilation of quartz c-axis fabric data from the Moine (samples MT-48 to MT-52) and Sgurr Beag (samples SB-8 to SB-10) thrust sheets in Area 4. (a) Explanation of quartz c-axis fabric external asymmetry components. Shear sense inferred from these external fabric asymmetry parameters can be compared with microstructural shear sense indicators such as shear bands and oblique alignment (Sb) of elongate dynamically recrystallized quartz grains. See also Figure 9 for principal finite extension directions inferred from fabric skeleton. (b) Relationship between C1 and C2; grey shaded area indicate where differences between C1 and C2 are compatible with top down to the SE shear sense.
Geosciences 11 00411 g026
Publisher’s Note: MDPI stays neutral with regard to jurisdictional claims in published maps and institutional affiliations.