Article

A Functional Form for Fine Sediment Interception in Vegetated Environments

Department of Geography, University of California, Berkeley, CA 94720, USA
*
Author to whom correspondence should be addressed.
Geosciences 2021, 11(4), 157; https://doi.org/10.3390/geosciences11040157
Submission received: 11 January 2021 / Revised: 6 March 2021 / Accepted: 18 March 2021 / Published: 1 April 2021
(This article belongs to the Special Issue Ecohydraulics and Ecomorphodynamics)

Abstract

:
The body of literature seeking to evaluate particle interception in vegetated, aquatic environments is growing; however, comparing the results of these studies is difficult due to large variation in flow regime, particle size, vegetation canopy density, and stem configuration. In this work, we synthesize data from these studies and develop a functional form of particle interception efficiency ( η ) as a function of stem Reynolds number ( Re c ), stem diameter, vegetation frontal area, particle–collector diameter ratio, flow velocity, and kinematic viscosity. We develop this functional relationship based on a dimensional analysis and hypothesize that the coefficients would exhibit regimes within different Re c ranges. We test this hypothesis by synthesizing data from 80 flume experiments reported in the literature and in-house flume experiments. Contrary to our hypothesis, data from different Re c ranges follow a single functional form for particle interception. In this form, η varies strongly with collector density and particle–collector diameter ratio, and weakly with Re c and particle–fluid density ratio. This work enables more accurate modeling of the flux terms in sedimentation budgets, which can inform ongoing modeling and management efforts in marsh environments. For example, we show that by integrating the new functional form of particle interception into established models of marsh elevation change, interception may account for up to 60% of total sedimentation in a typical silt-dominated marsh ecosystem with emergent vegetation.

1. Introduction

Sediment–flow–vegetation interactions play crucial roles in governing geomorphological and biological processes of low-gradient aquatic landscapes such as coastal marshes and floodplains [1,2,3]. Sediment transport governs land building and is critical to marsh restoration efforts and sea-level rise models [2,4,5]. The transport of fine sediment, the fraction with the greatest organic matter concentration, is especially important for biological processes such as nutrient provisioning and carbon cycling [6,7,8], representing a key linkage between geomorphology and other disciplines. Examples of this fine particulate organic matter include plant and algae detritus; extracellular polymeric substances (EPS); soil material; and living algal, bacterial, and diatom communities [9,10]. However, understanding and predicting the dynamics of fine sediment is especially challenging because these particles often have porous and irregular structures, they can aggregate (and disaggregate) with other organic and inorganic substances, and the surface properties that govern their stickiness vary with ambient conditions [11,12,13,14].
The processes governing sedimentation budgets for fine sediment are likewise incompletely understood. Sedimentation budgets are composed of the balance between direct fluxes to the bed due to settling, indirect fluxes to the bed following capture by vegetation stems and leaves (i.e., “interception”), and fluxes downstream for particles that remain in suspension. The magnitudes of all of these fluxes are impacted by vegetation, and process-level understanding of these impacts is still developing [7,15,16,17,18,19,20].
Of the vegetation–flow interactions mentioned above, the impact of vegetation on effective settling is best understood. Previous studies have shown that vegetation can enhance settling by producing drag and slowing flow [21,22,23,24]. This settling can increase sediment bed elevation, promote land building, and modify the topography of low-gradient landscapes [2,3,18,25,26]. Vegetation can also enhance turbulence [7,19,27,28,29], decreasing effective settling by promoting re-entrainment of particles from the bed. This can lead to scour and channel formation around discrete vegetation patches [4,30]. Patches of vegetation can also promote settling within their wakes due to reduced velocity [15,31]; interactions between multiple patch wakes can similarly promote settling and thus land building [32]. The balance of drag and turbulent forces—which depend on the flow conditions, vegetation density, and particle morphology—ultimately determines vegetation’s impact on sedimentation due to settling, which can be effectively modeled [27,30,31].
The mechanics of particle interception, and their relationship with flow conditions and vegetation morphology, are comparatively less understood. Sediment models often exclude particle interception entirely [2,4] or base it on single-collector theory [3,26], which is not representative of real-world vegetation canopies. This is a critical gap because particle interception may represent a significant portion of total sedimentation, especially for fine particles. For example, Mudd et al. [3] modeled several marshes in the North Inlet Estuary in South Carolina, U.S., and estimated that up to 74% of total sedimentation in high-velocity flow conditions is due to particle interception. The interception of fine organic particles by vegetation also has important biological implications, such as in the feeding regimes of epiphytic communities that live on vegetation surfaces or the removal of pathogens from the water column [10,33].
Previous studies of particle interception have largely focused on laboratory-based flume experiments, using a wide range of particle types, flow conditions, and either single or multiple collectors to represent vegetation [34,35,36,37,38,39,40]. Some of these experimental setups also included the presence of biofilm, a naturally occurring sticky coating composed of different communities of algae, cyanobacteria, and other microorganisms, which can enhance particle interception by increasing both the effective collector diameter and the likelihood that particles will attach to collectors [34,37,40]. However, it is difficult to directly compare the results of studies with different ranges of parameters or draw generalizable conclusions from a single study with a narrow range of tested parameters. The goal of this study was to reconcile a wide range of experimental data with a functional form for particle interception grounded in a dimensional analysis. We further applied this new functional form to existing marsh elevation models to demonstrate the importance of particle interception in sediment–flow–vegetation dynamics within a real-world setting.

Functional Form for Particle Interception

Particle interception can be represented as capture efficiency ( η (dimensionless)). For cylindrical collectors (i.e., stems), η is the ratio of b (L), the upstream effective width of particle streamlines that will be intercepted by the collector, to d c (L), the collector diameter (Figure 1) [35]. The gross particle interception flux, Q c [ML 2 T 1 ], was then defined by Mudd et al. [3] as
Q c = η C u a h ,
where C (ML 3 ) is the suspended particle concentration, u (LT 1 ) is the flow velocity, a (L 1 ) is vegetation frontal area per unit volume, and h (L) is the length of collectors exposed to flow, which is equal to flow depth in emergent vegetation.
Several previous studies used an experimental flume setup with a single collector to derive an empirical equation for η . Palmer et al. [35] fit an equation based on experimental data from a single-collector flume setup and intermediate collector Reynolds numbers (50 ≤ Re c ≤ 500) as follows:
η = 0.224 Re c 0.718 R * 2.08 ,
where Re c is the collector Reynolds number (dimensionless) and R * is the ratio of the particle to collector diameter (dimensionless). Notably, Equation (2) predicts a positive relationship between η and Re c . Wu et al. [38] took a colloid filtration theory approach to capture efficiency, in which η is a product of the contact efficiency ( η 0 , dimensionless, defined as the proportion of particles in the upstream projected area of the collector that contact the collector) and the attachment efficiency ( α , dimensionless, defined as the proportion of particles that stick to a collector on contact). In their single-collector flume study, they determined the following equation for contact efficiency:
η 0 = 0.0044 Re c 0.94 Pe 0.003 ,
where Pe (dimensionless) is the Péclet number of the particle. In contrast to Equation (2), Equation (3) predicts a negative relationship between η 0 and Re c , and thus a negative relationship between η and Re c .
However, vegetated ecosystems in nature often require consideration of multiple collectors and the ways in which they might interact. In vegetation canopies, wakes from collectors at the front of a patch may divert streamlines from the downstream collectors in a phenomenon known as wake sheltering [31,41]; particles may pass through gaps between the collectors and escape capture. Experimental studies involving multiple collectors have found that at higher Re c numbers ( Re c 50 ), Equation (2) greatly overestimates capture efficiency, in some cases predicting values for η an order of magnitude greater than those observed [34,36]. The equation based on colloid filtration theory, Equation (3), was also shown to overpredict η in multicollector systems [40].
To more accurately reflect real-world conditions, other studies have set up flume experiments with multiple collectors at a range of densities [34,36,37,40]. The experimental setup of Fauria et al. [34] included arrays of synthetic vegetation with naturally grown biofilm and harvested road dust as the suspended sediment. They fit a new equation for particle interception using the general form from Equation (2), and found that when Re c = 55–184 and biofilm is present,
η = 2.06 Re c 1.14 R * 0.65 .
In contrast with Equation (2) but similar to Equation (3), Equation (4) predicts decreasing η with increasing Re c ; this trend has also been observed in other multicollector studies [36,37,40]. However, this empirical formula is based on a narrow range of experimental parameters (e.g., Re c = 55–184, d c = 0.3 cm, and u = 1.8–6), which does not reflect the full breadth of conditions found in vegetated aquatic environments. Additionally, this functional form does not account for other factors that may impact particle interception, notably a and particle density.
In this study, we synthesized multiple published studies of particle interception with multiple collectors and developed a model grounded in a Buckingham–Pi dimensional analysis. We evaluated this model in comparison with previously published models of η (Equations (2) and (4); we were unable to include Equation (3) in our comparison because we did not have Pe values for all data points). Finally, we applied the new synthesis model to a real-world tidal marsh to evaluate the relative importance of particle interception compared with other sedimentation fluxes in typical flows.

2. Materials and Methods

2.1. Hypothesized Functional Form for Particle Interception

We performed a modified Buckingham–Pi dimensional analysis to develop a hypothesized functional form for particle interception. For physical reasons explained below, we expected that η would vary as a function of flow velocity u, vegetation frontal area per unit volume a, flow depth h, collector ( d c ) and particle diameters, and particle and water densities. Using the Buckingham–Pi approach, we developed dimensionless terms with which we expected η to vary. Examining each of those terms in the context of what is known about flow through vegetation, we hypothesized whether their relationship to η would be positive or negative, and, as explained below, modified one of the terms while retaining its dimensionless nature for consistency with physical reasoning.
Given the derived functional form for η , we expected the fitted coefficients (i.e., term weights) to differ across ranges of Re c corresponding to different regimes of flow around cylinders. Previous multicollector studies lend support to this hypothesis, suggesting that the decrease in η with increasing Re c may be less pronounced at Re c > 40 [34,36], the point at which stems begin shedding vortices, than at 5 < Re c < 40 [38]. For the Re c < 40 regime, the stronger negative relationship is likely due to growth in the size of the flow separation bubble and the corresponding attached vortices. With growth in the eddies, the eddy cores, where particles smaller than the eddy scale tend to accumulate [42], move farther from the rear of the collector stem, decreasing the likelihood of attachment via van der Waals forces. For the Re c > 40 regime, the eddies behind plant stems detach, forming a laminar wake (i.e., von Karman vortex street) for 40 < Re c < 150 or a transitional (150 < Re c < 300) to turbulent (300 < Re c < 10,000) wake. In this regime, the streamlines approaching stems have significant vorticity, which we expected would decrease the number of particles that come within the stem’s radius of interception relative to the straight-streamline case of Palmer et al. [35] (Figure 1). However, we hypothesized that Re c would have less of an impact on η than the frequency with which these eddies are shed, which is governed by either smaller stem spacing or scale, rather than Re c [21]. Based on those key physics, we expected η to vary as a strong negative function of Re c from 5 < Re c < 40 and as a weaker negative function of Re c from 40 < Re c < 10,000. We did not consider flows with Re c > 10,000 because aquatic ecosystems generally fall well below this Re c threshold.
We expected that dimensionless canopy density (i.e., a d c ) would govern interception via several mechanisms. First, it would reduce flow velocities in the wake of collectors through drag by a factor of ( ( a h ) ( 1 a d c ) ) 1 / 2 , which would modify the Re c term in the Buckingham–Pi analysis. Canopy density also increases turbulent kinetic energy (TKE), which, given the results of Purich [36], should increase η , as particles are more likely to contact and attach to the sides and back of collectors than in the laminar-flow case. In rigid emergent vegetation, the TKE in stem wakes is proportional to u 2 ( a d c ) 2 / 3 [27]. The velocity dependency would be subsumed by the Re c Buckingham–Pi term, leaving a d c as a separate term with a positive exponent. In flexible vegetation, TKE varies as a more complex function of velocity within and above the canopy, the deflected height of the vegetation, and the solid volume fraction of vegetation [7]. However, Zhang et al. [43] showed that within the stem region of submersed canopies, the TKE, as in rigid emergent canopies, varies monotonically as a function of u 2 ( a d c ) 2 / 3 . Thus, we expected that the simpler representation of the TKE through the Re c Buckingham–Pi term and a d c term in the dimensional analysis would be sufficient to capture the relevant physics of particle capture in both rigid emergent vegetation and the stem region of most flexible vegetation canopies.
We also anticipated a positive relationship between η and the ratio of particle density to water density, P (dimensionless), as more massive particles with greater inertia are more likely to deviate from their streamlines and contact a collector, which promotes particle interception [44]. Finally, we expected η to increase with increasing R * , as larger particles or smaller stems would decrease the distance between particles trapped in eddies and the stems’ radius of interception (here, R * includes additional thickness due to the presence of biofilm, if present).
Altogether, we hypothesized the following functional form for η in systems with multiple rigid or flexible collectors:
η = c 0 Re c a h ( 1 a d c ) c 1 ( a d c ) c 2 P c 3 R * c 4 .
Hereafter, we refer to the terms in this model as: the drag-corrected Re c term ( c 1 ), the TKE term ( c 2 ), the density ratio term ( c 3 ), and the diameter ratio term ( c 4 ); c 0 is the coefficient of proportionality within which the attachment efficiency, assumed to be equivalent across all experiments, is implicit. This form was linearized to facilitate model-fitting:
ln ( η ) = c 0 + c 1 ln Re c a h ( 1 a d c ) + c 2 ln ( a d c ) + c 3 ln ( P ) + c 4 ln ( R * ) .

2.2. Data

We initially curated a dataset with 10 experimental and computational fluid dynamics studies that examined η in real or simulated vegetation; these were the only studies to publish data with all relevant variables included in Equation (6). We excluded studies that only included a single collector, as these experimental setups do not capture interactions between collectors that occur in most real-world systems. After excluding single-collector studies, we were left with four sets of experiments [34,36,37,40], for a total of 80 data points (Table 1). Fauria et al. [34] reported separate η values for 32 particle size bins; we included the three particle size bins with the highest number of particles as three separate data points for each run and discarded data from the other bins due to the relatively small number of particles they contained. All experimental setups included silicone grease, biofilm, or both on the surface of the collectors. The experiments of Wu et al. [40] and Fauria et al. [34] were conducted with flexible, non-cylindrical vegetation; those of Purich et al. [36] and Wingenroth et al. [37] used rigid cylindrical stems.

2.3. Model Fitting and Validation

We fit Equation (6) in R using the caret package [45], parameterized to perform a 5-fold cross-validation. During the cross-validation, the data set was randomly split into five groups, and one group was removed from the training set as a hold out to test the resulting model. The best-performing model of the group was then selected. We next performed a bidirectional stepwise regression on the resulting model using the MASS package [46] and determined which combination of terms best explained the variability in ln ( η ) by comparing the Akaike information criterion (AIC) scores of the alternative models.
To test the hypothesized split in model behavior in different Re c regimes, we analyzed the cross-validated and stepwise-trained model using the segmented package in R [47], which helps determine where the breakpoint(s), if any, are located in the drag corrected Re c term. The unsegmented and segmented models were validated by (1) calculating the AICc score (AIC with a correction for small sample sizes) for each version of the model [48] and (2) completing a 10,000 repetition bootstrap analysis of each model and evaluating the 95% confidence interval of the coefficients and the coefficient of determination ( R 2 ) for each version of the model. The fit from this model was then compared to predicted η values from the models of Palmer et al. [35] and Fauria et al. [34], Equations (2) and (4), respectively. We did not compare our model to Equation (3) because we were unable to determine Pe values for all data points in our training set.

2.4. Integration into Marsh Model

The previously discussed equations for particle capture (i.e., Equations (2), (4), and (6)) describe the capture of particles on collectors such as vegetation stems. In the field, captured particles contribute to overall sedimentation on the bed by sloughing off of collectors in aggregate and sinking to the bed, or when vegetation with captured particles decomposes into organic matter in the soil [18]. Forms for particle interception must be translated through additional models or equations to describe the contribution of interception to bed elevation, total mass flux of sedimentation, etc. Modeling of these sedimentation mechanisms may vary based on the type of environment (e.g., tidal, fluvial, or coastal).
To demonstrate one way in which our proposed functional form (Equation (6) could be used in a real-world situation, we adapted a series of equations describing marsh sedimentation from Mudd et al. [3] to include our model (Appendix A). In Mudd et al. [3], marsh elevation change over time is defined as
ζ s t = Q c / ρ s + Q s / ρ s + O E Cmp ,
where ζ s t (LT 1 ) is the change in marsh surface elevation over time, Q c (ML 2 T 1 ) is the flux of sediment intercepted by marsh vegetation, Q s (ML 2 T 1 ) is the settling flux, ρ s (ML 3 ) is the density of marsh sediment, O (LT 1 ) is the organic material accretion rate due to vegetation production, E (LT 1 ) is the erosion rate (assumed to be zero within the vegetation canopy), and Cmp (LT 1 ) is the compaction rate (assumed to be negligible over a sub-annual time scale). Mudd et al. [3] used Equation (1) to determine Q c and Equation (2) to determine η ; we substituted Equation (2) with the fitted form of Equation (6).
We then applied this modified marsh elevation model to a data set of salt marsh conditions in the North Inlet Estuary in South Carolina from the original in Mudd et al. [3] to demonstrate how the different η prediction methods can impact marsh sedimentation models. We also performed a sensitivity analysis to evaluate under what conditions particle interception might be most important to total sedimentation flux, which has implications for restoration design efforts [49]. To perform this analysis, we applied the modified marsh sedimentation model to a broad range of typical marsh vegetation and flow parameters and estimated the contribution of direct particle interception to total sedimentation. The parameters used for the sensitivity analysis were a = 0.01–0.07 cm 1 [27], u = 10–50 cm s 1 [3], d c = 0.48 cm [27], and d p = 40 μ m [50,51].

3. Results

3.1. Predictive Model for η

Our final fitted form for η is
ln ( η ) = 1.13 0.38 ln Re c a h ( 1 a d c ) 1.54 ln ( a d c ) + 1.00 ln ( P ) + 2.10 ln ( R * ) .
All terms were retained during stepwise regression (Table S1), and these fitted coefficients were relatively stable during bootstrapping (Table 2). In this model, η varies as a negative function of the drag corrected Re c and the TKE terms and as a positive function of the density ratio and diameter ratio terms.
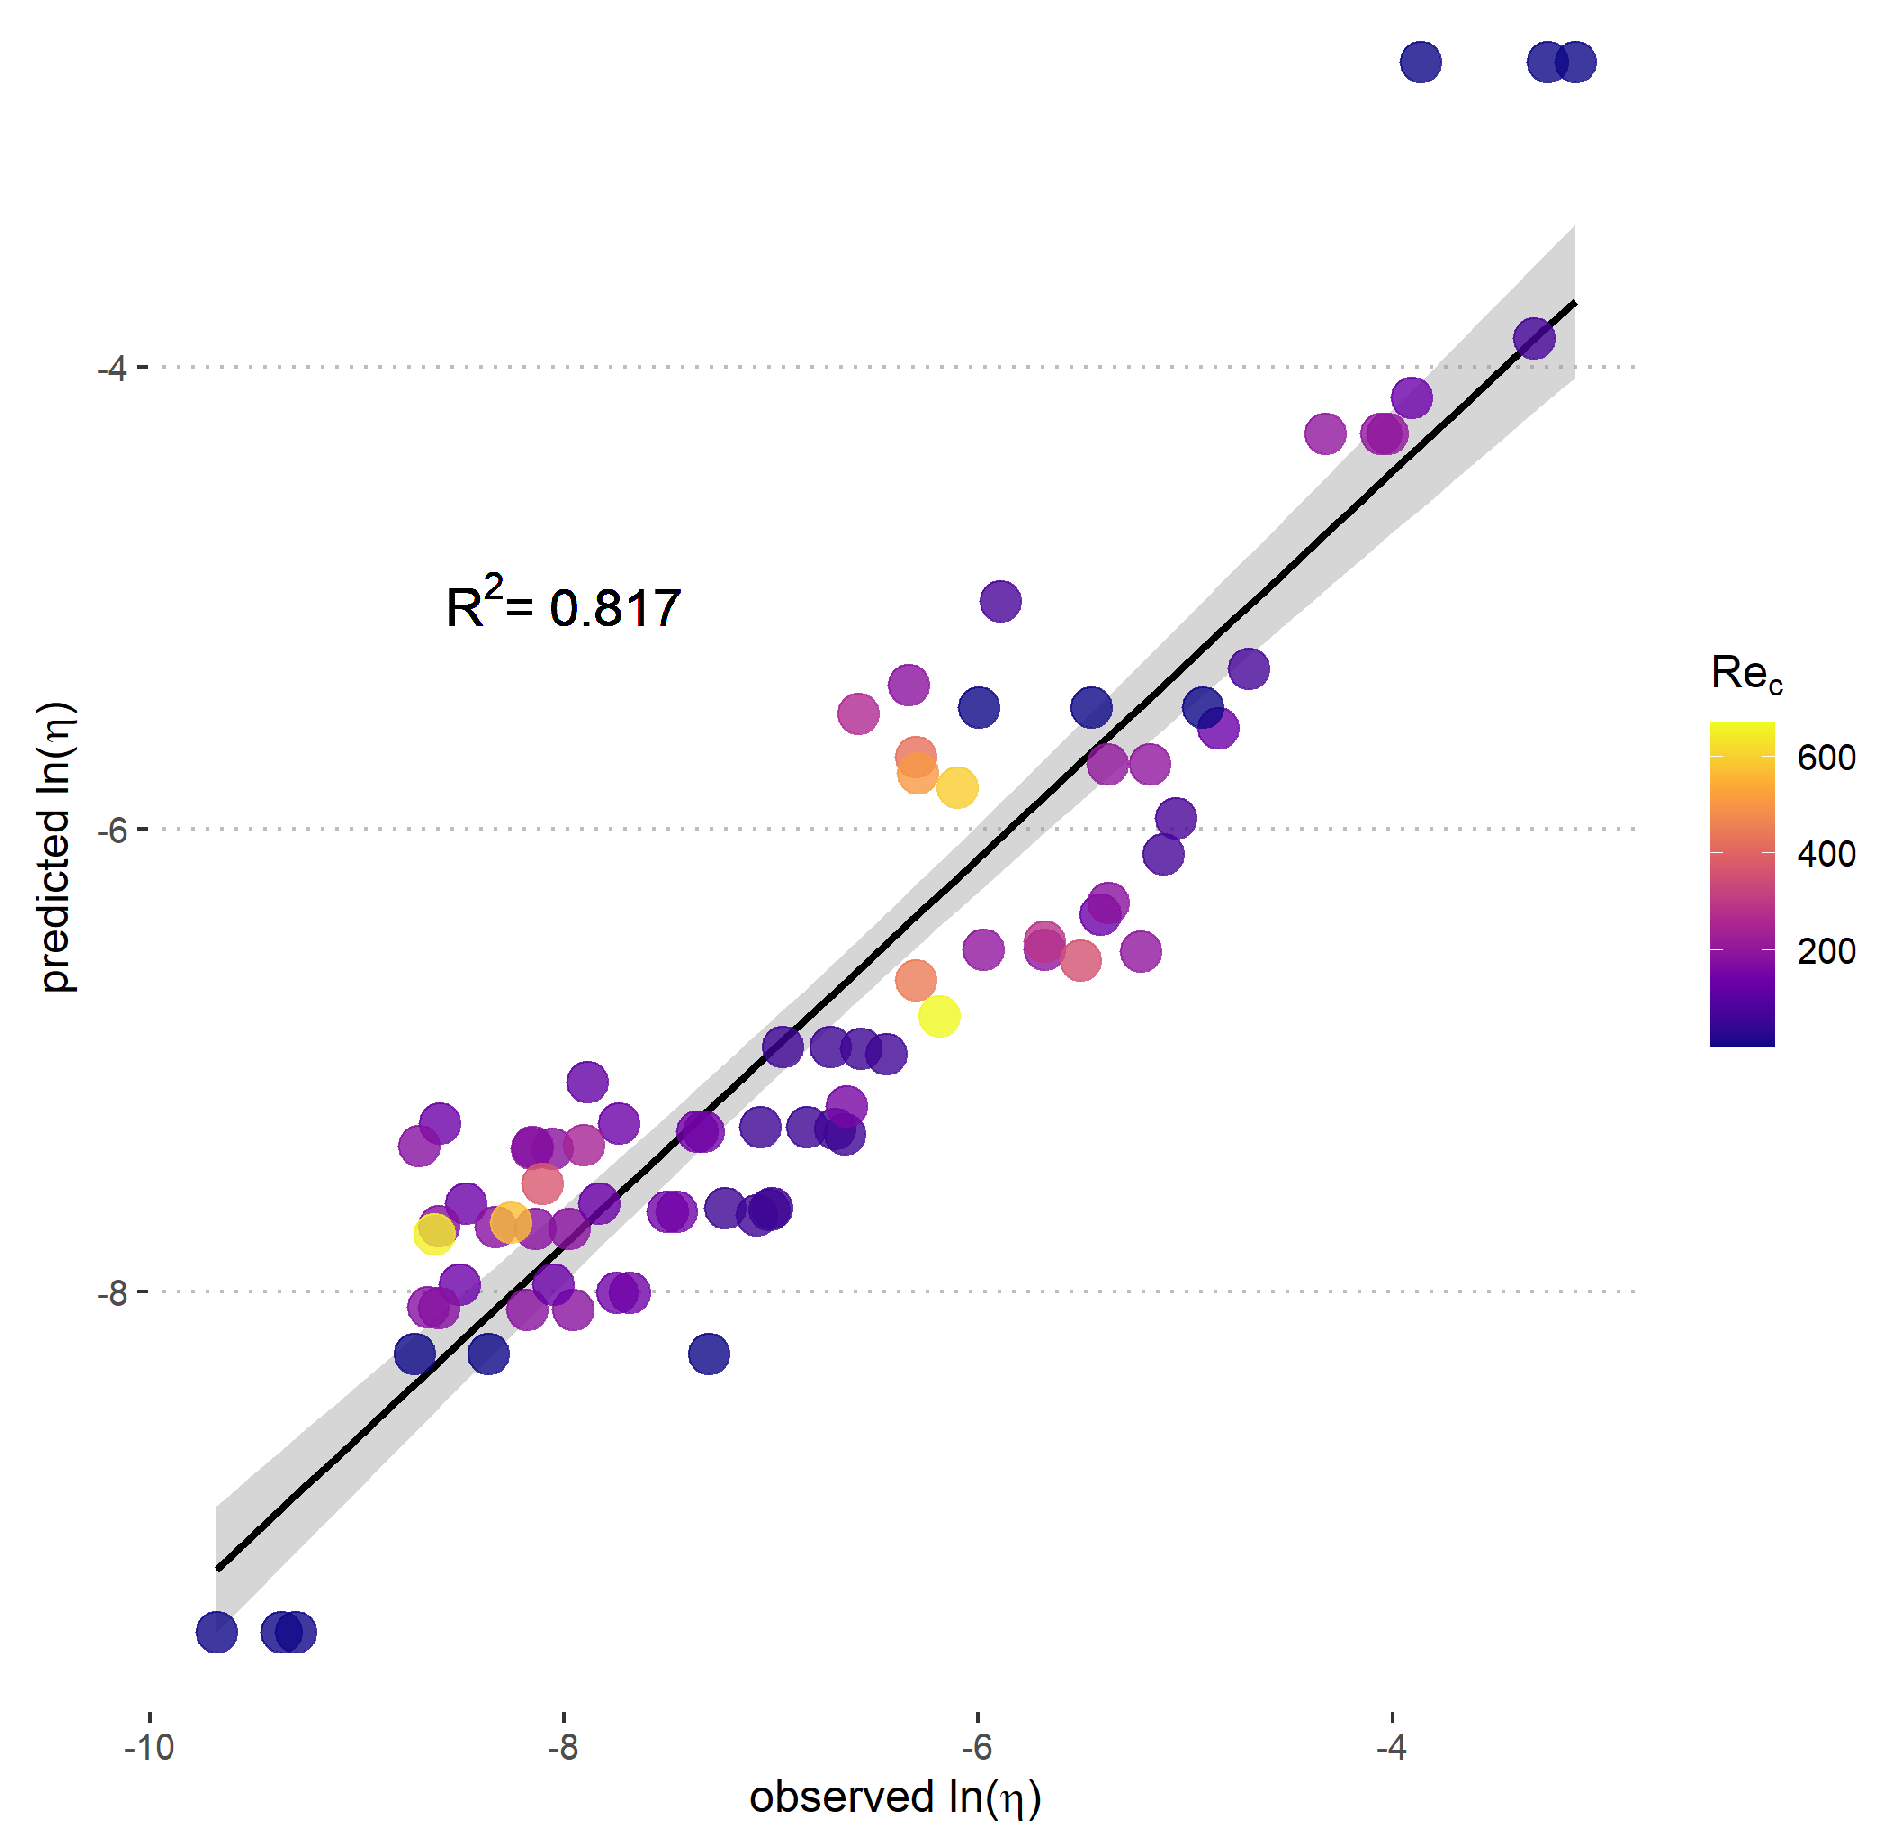
The segmented regression returned two possible points for a split in Re c regime, at 3 and 194. Although models trained on either of these data splits had smaller AICc scores compared with the nonsplit model, both proposed splits also produced unstable coefficients during the bootstrap analysis, including large ranges in magnitude and changing coefficient signs. Thus, the split Re c regime is not defensible given the training data. Use of the single Re c -regime model is further supported by the lack of clear Re c trends in the residuals (Figure 2).
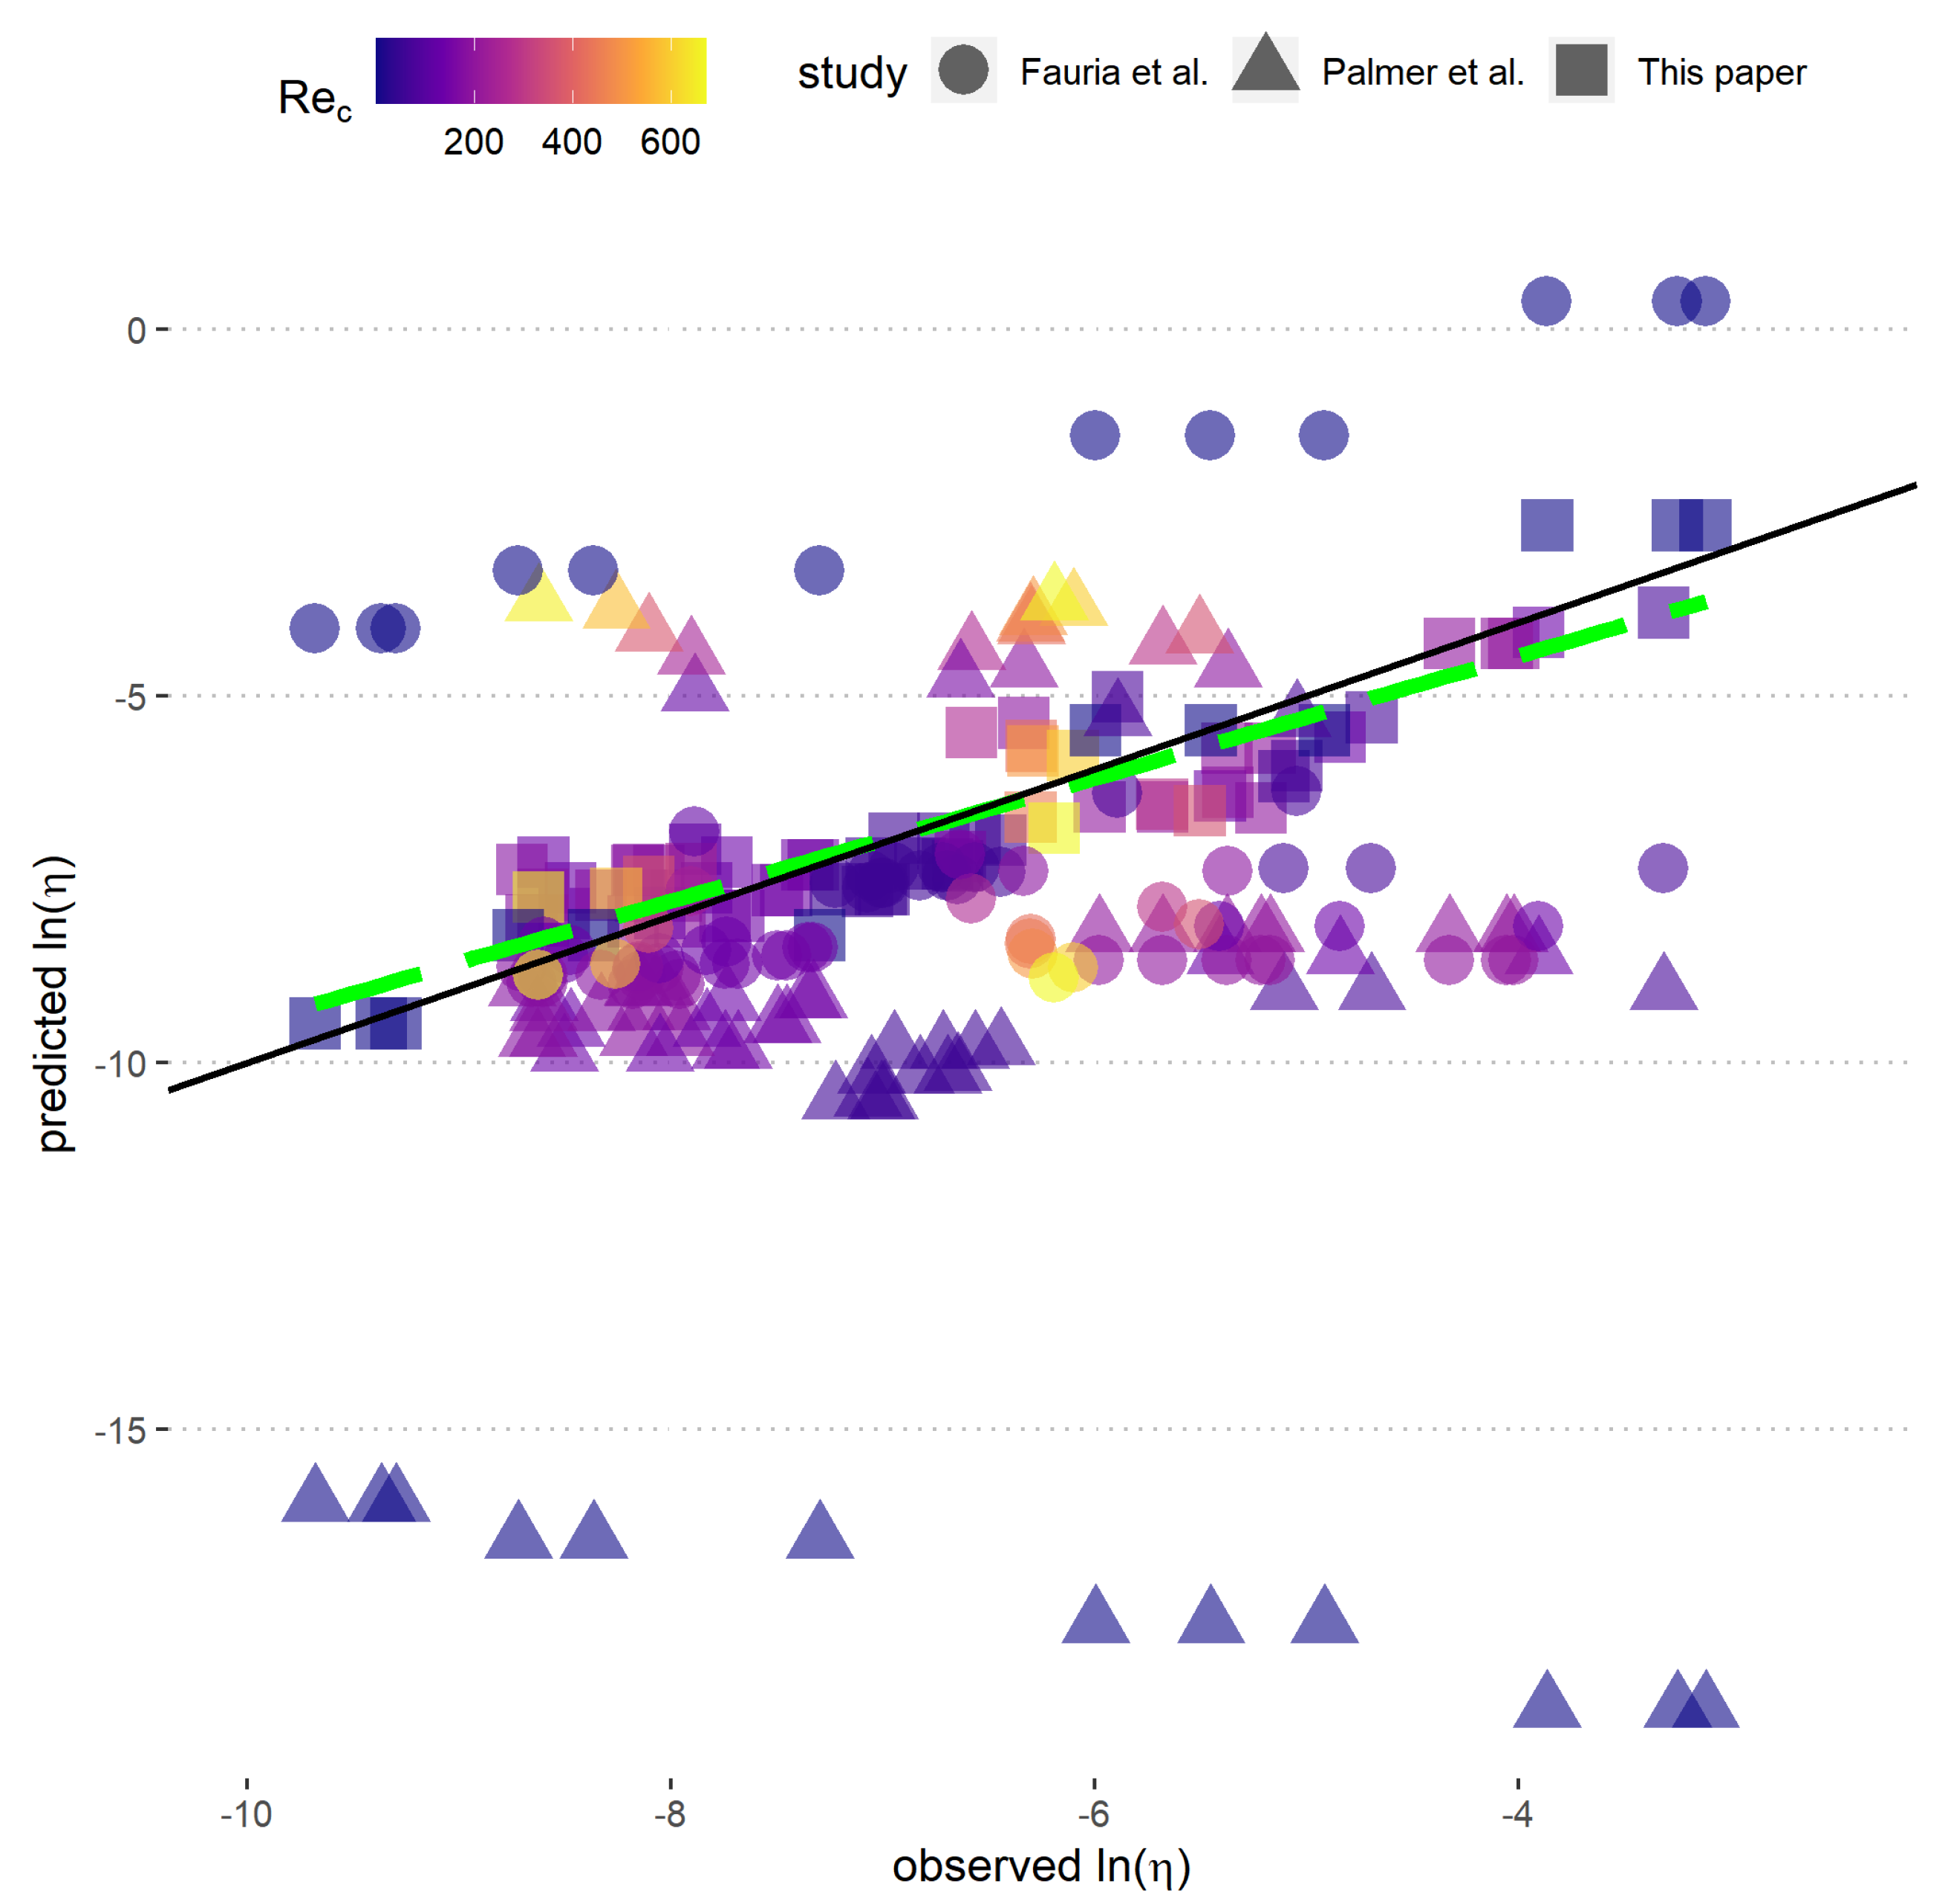
Compared with previously reported models (Equations (2) and (4)), our model had a greater R 2 (0.817 compared with 2.58 × 10 4 and 0.075, respectively) and smaller average residuals (0.68 vs. 5.00 and 2.47, respectively) (Figure 3). In contrast with Equation (4), which returned three predicted particle interception values that were greater than 100%, all predicted η values returned by our model were physically possible.

3.2. Marsh System Model

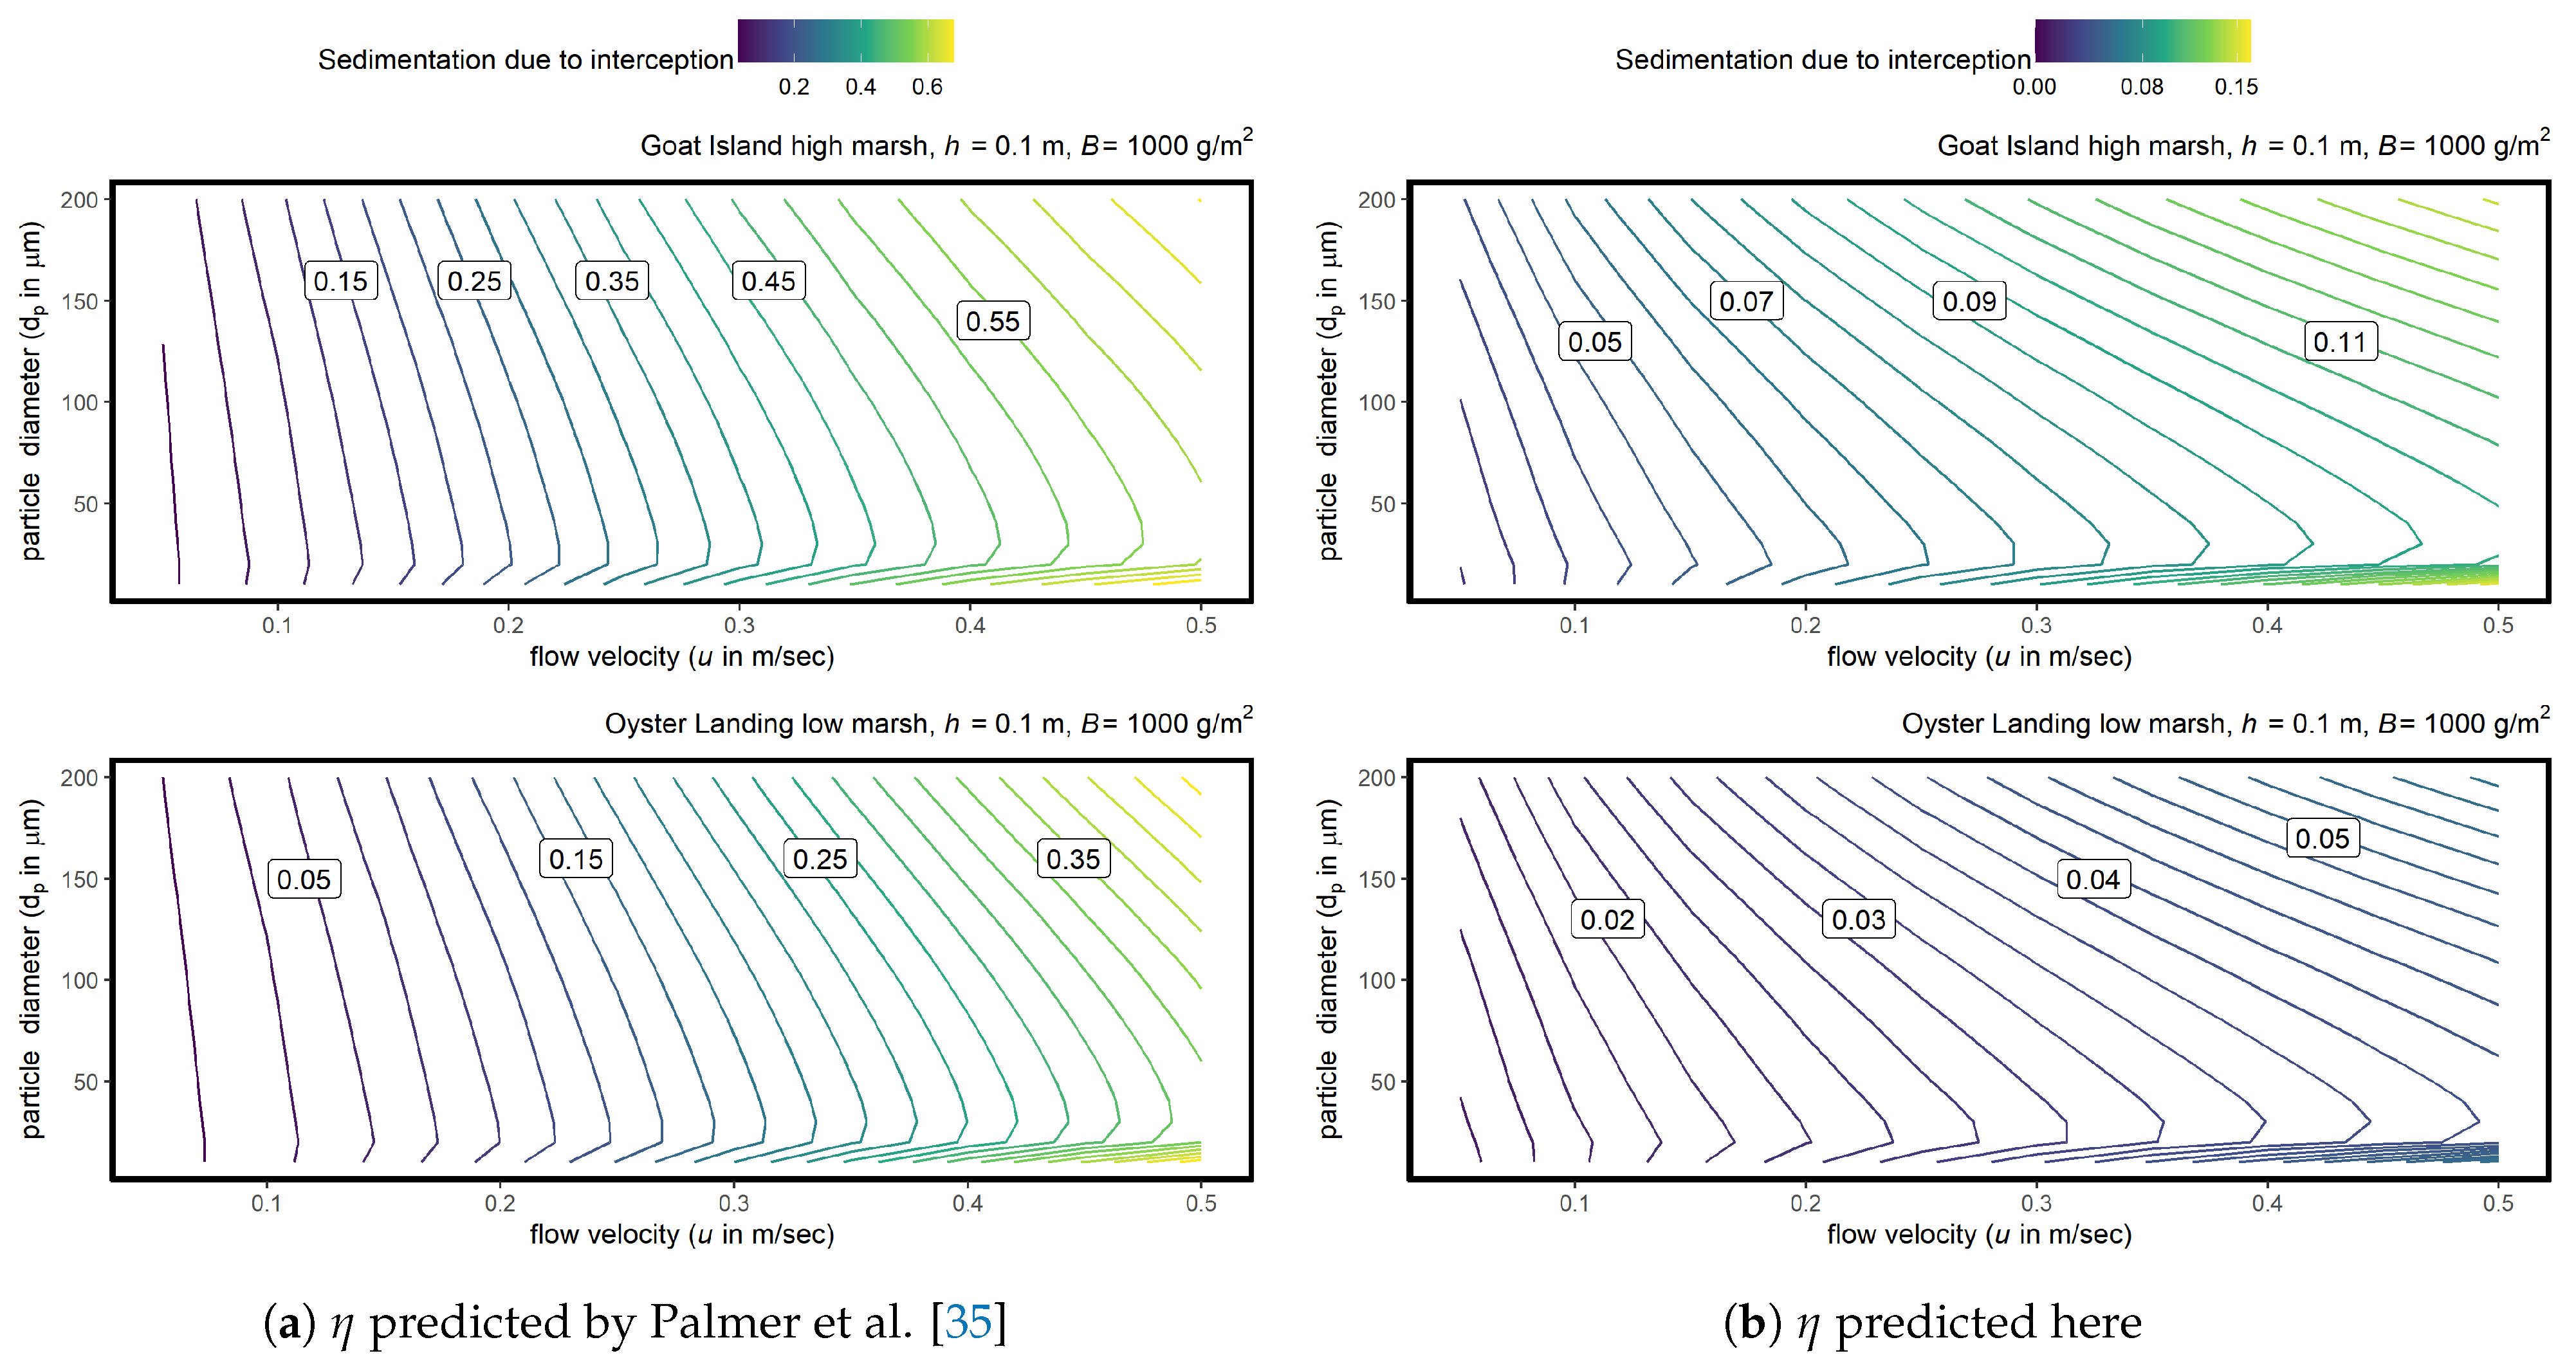
Using the North Inlet Estuary data from Mudd et al. [3] (their Figure 5), we compared sedimentation rates using η as predicted by Equation (2) as in their original analysis and Equation (8) (Figure 4a and Figure 4b, respectively). In contrast with Equation (2), the new functional form predicted a far smaller portion of sedimentation from particle interception (0–16% compared with 2–74% using Equation (2) and less overall sedimentation (8.46 × 10 2 –4.82 × 10 5 vs. 1.31 × 10 3 –1.28 × 10 6 g cm 2 s 1 ). The general pattern in relative sedimentation rate (e.g., that particle interception represents a larger portion of sedimentation in systems with higher velocities and finer particle sizes) was consistent across both predicted forms of η .
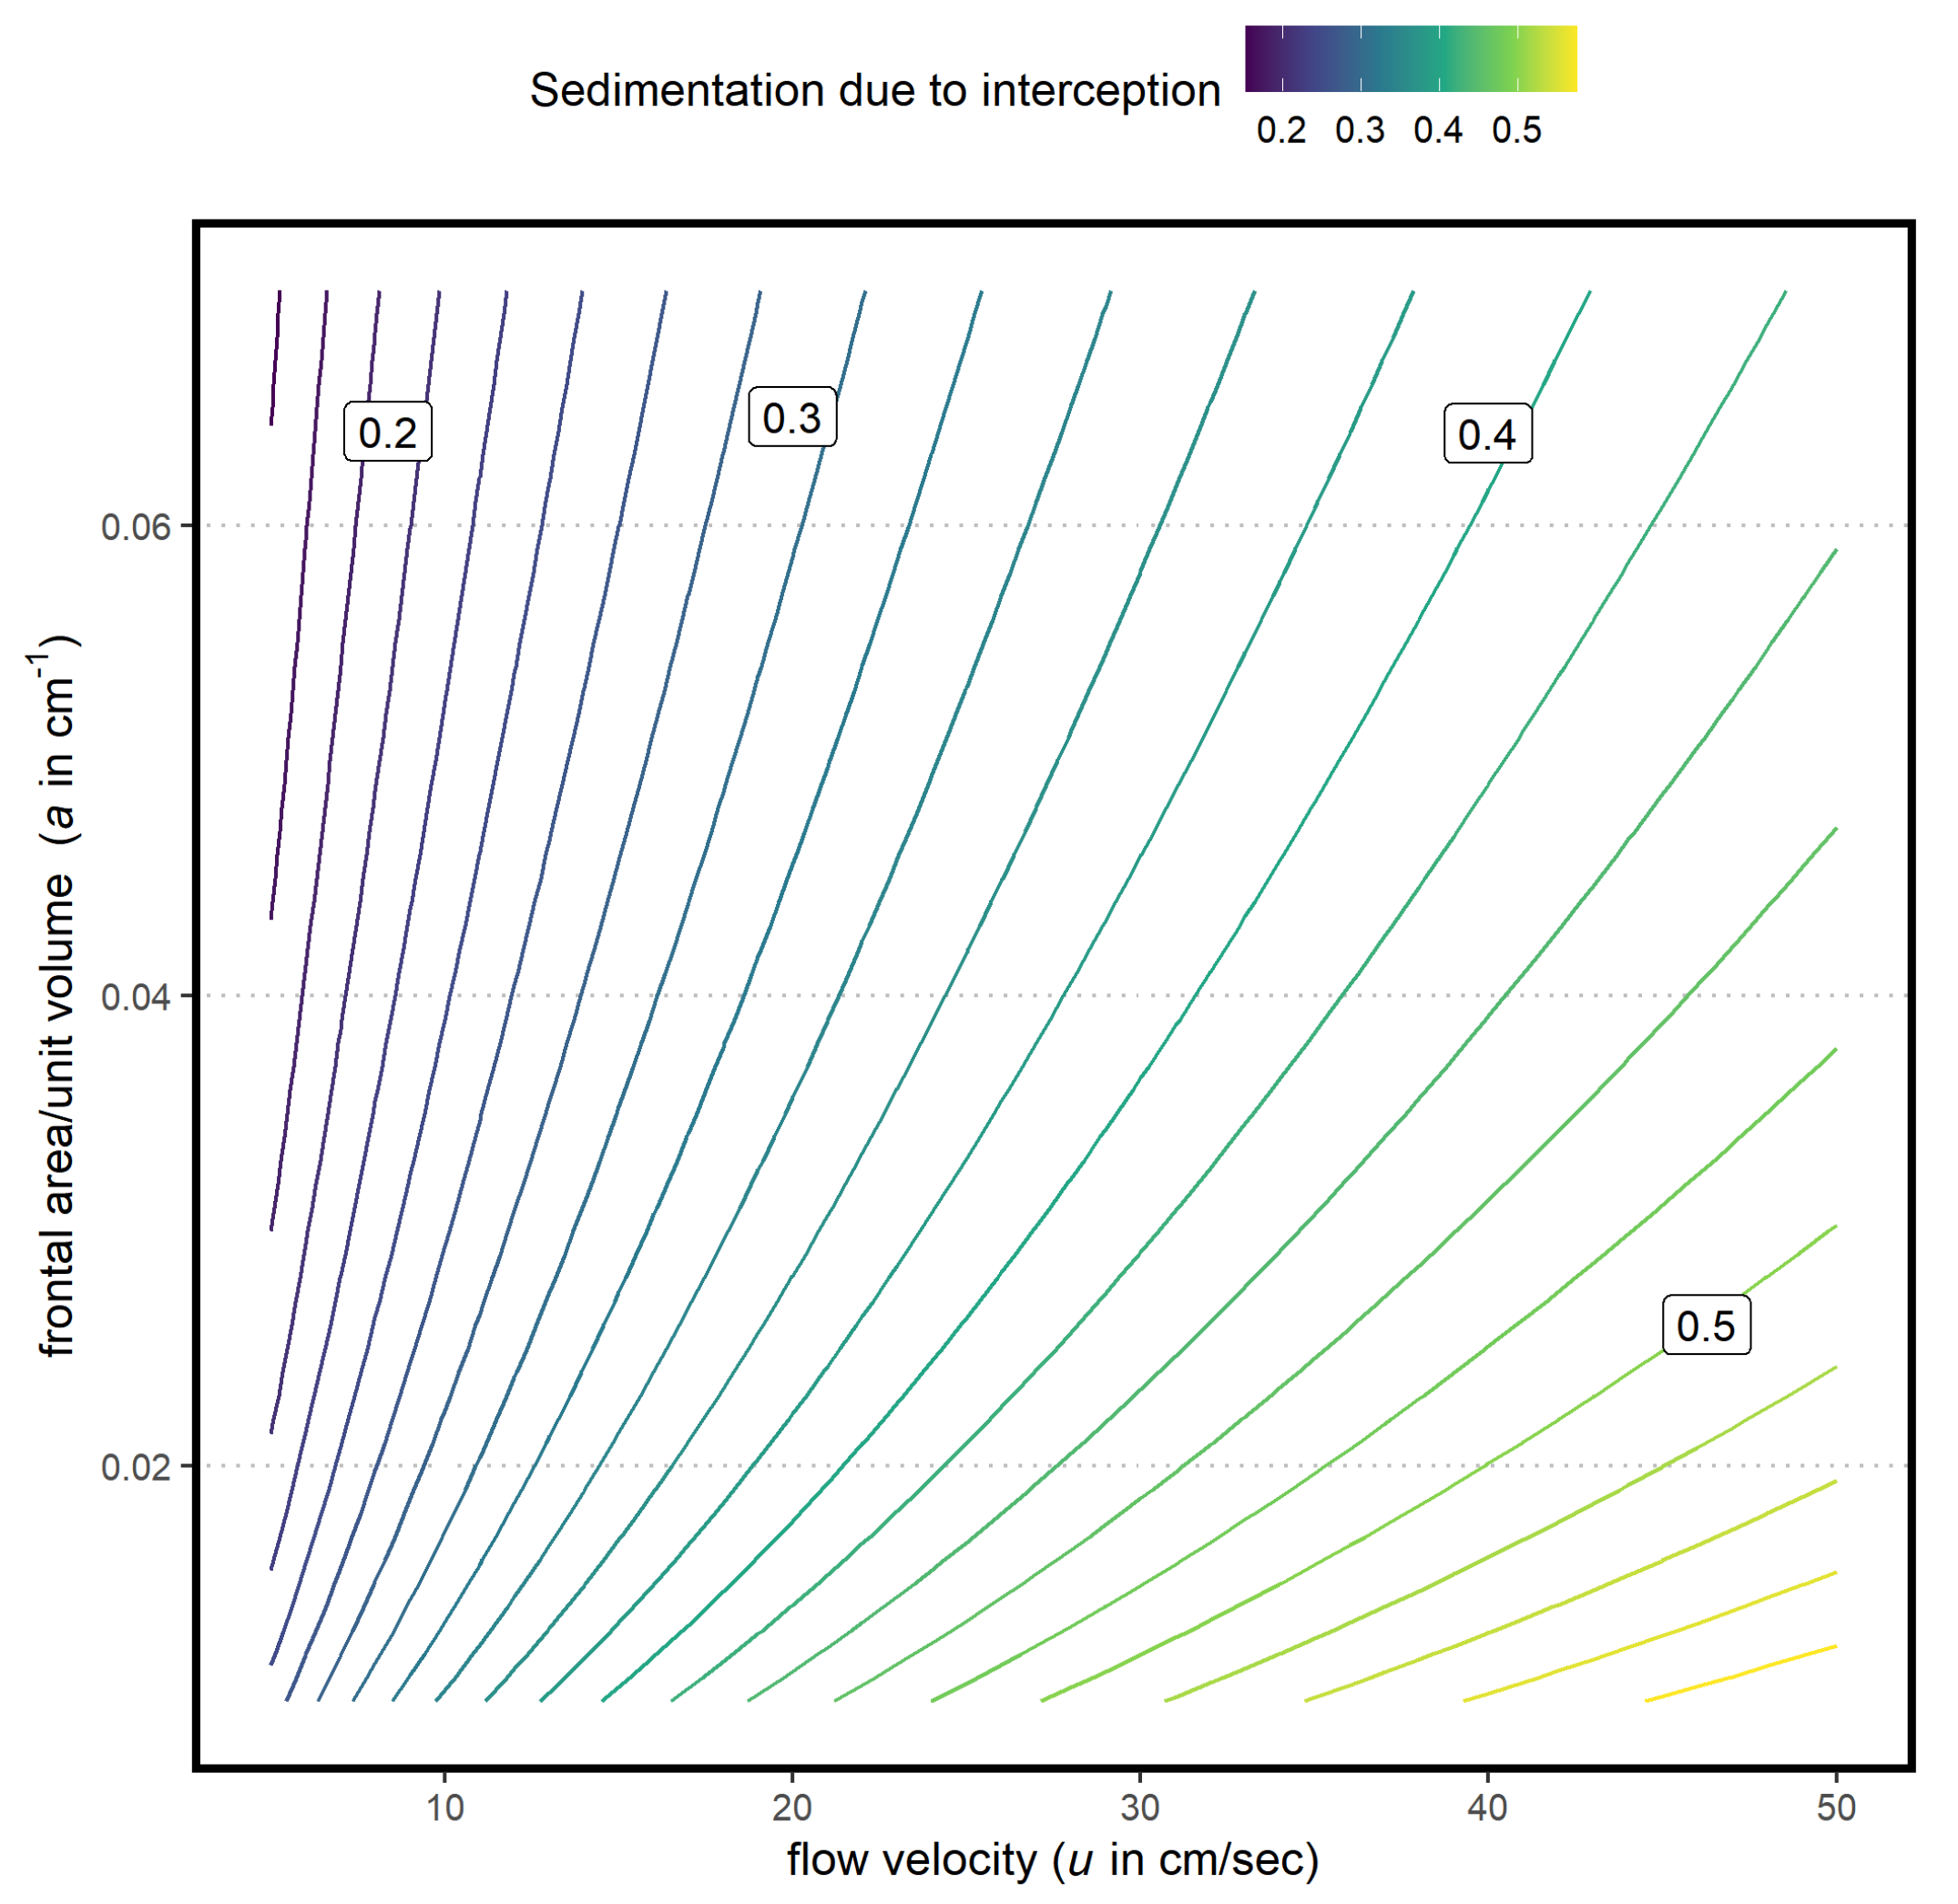
Over the wider range of vegetation canopy characteristics covered by our second data set of typical marsh flow and vegetation conditions (Figure 5), Q c exceeded Q s when u was greater than ∼30 cm/s and a was lower than ∼0.025 cm 1 . As this data set simulates constant d p , Q s stayed relatively constant. Thus, total sedimentation was greatest in higher u and lower a conditions, where Q c represents the greatest portion of total sedimentation.

4. Discussion

4.1. Functional Form

As hypothesized in Section 2.1, η varies under Equation (8) as a negative function of the drag-corrected Re c term and a positive function of the density ratio and diameter ratio terms. We attribute the negative relationship with Re c to the growth in the flow separation bubble and eddies in the wake with increasing Re c , followed by their detachment and the transition to turbulent flow, all of which decrease the chance that particles will contact collectors. The positive relationship with the density ratio term likely reflects the inertial energy of higher-density particles and their greater likelihood of impacting the collector surfaces. The positive relationship with the diameter ratio term likely reflects the decreased distance between particles trapped in eddies and the stems’ radius of interception for larger particles or smaller stems.
We initially hypothesized that greater TKE would increase the likelihood that particles would contact the sides and backs of collectors, resulting in higher η than a system with straight particle streamlines. However, under Equation (8), η actually varies as a strong negative function of the TKE term. This result may be attributable to several phenomena: First, all data included in this analysis were obtained from experimental setups with multiple collectors, where wakes from adjacent collectors can impact others within the vegetation field. Turbulent wakes may have the net effect of deflecting streamlines away from downstream collectors [31], reducing the total probability that a particle can contact a collector. In addition, shearing in the vicinity of stems may have caused re-entrainment of particles that had previously been intercepted, violating our assumption that the ratio between contact efficiency and capture efficiency (i.e., η 0 / η ) remained constant across all experiments.
Our fitted functional form also did not statistically support the split Re c regime, which we predicted would occur at Re c 40 . This was likely influenced by the relatively small training data set and the sample-size-limited subsets created by the tested Re c splits. However, the lack of a statistically defensible split may also result in part from the relatively low magnitude of the Re c term compared with other terms, particularly the diameter term. Regardless, a single functional form for η in all Re c conditions has the benefits of greater ease of use and simpler integration into real-world modeling efforts.
Though our model was fit to data from studies covering only a portion of realistic stem diameters, Reynolds numbers, and other parameter values, our literature review revealed no reason to expect the physics behind the model to differ in other natural settings with similar types of vegetation from those used in the calibration dataset; however, we expected that the model would overestimate capture in highly flexible vegetation canopies, as discussed in Section 4.2. Additionally, it is possible that as the pool of available flume study data expands, the optimized value of the model coefficients may shift (Equation (8)). Notably, although we did not find a statistically defensible split in the Re c regime in our study as discussed above, one may become clear with a wider range of training data.

4.2. Role of Vegetation Morphology

Although many aspects of flow–vegetation interactions are represented in the functional form of Equation (8), more refinement is needed to address others, most notably the impact of vegetation morphology and type. The key physics in the model are based on nearly cylindrical, smooth collectors that behave nearly rigidly. Several aspects of the dynamics of flow through flexible vegetation arrays are missing from this model. First, reconfiguration of flexible vegetation stems by progressive bending and streamlining at high Reynolds numbers reduces drag [18,27]—an effect that would be captured by the Re c term in the dimensional analysis, though likely with a different exponent than that derived for rigid vegetation with an equivalent architecture. Second, the TKE within flexible vegetation is functionally more complex than the representation in our model through the Re c and TKE terms; the TKE in flexible submersed canopies is also a function of velocity within and above the canopy and the height of the reconfigured vegetation. As discussed by Zhang et al. [43], the scaling relationship for the TKE in rigid canopies provides an acceptable estimate within certain regions of submersed canopies and with certain stem scaling relative to velocity perturbations, but even so, a different fitted model coefficient would be expected to apply to rigid and flexible canopies. Third, the bending and reconfiguration of flexible vegetation with increasing Reynolds number would reduce the effective frontal area of the patch and hence the area available for capture [7,52].
Despite two out of four of the datasets on which the model was calibrated and tested being derived from experiments on flexible vegetation, the model provided a good fit across the range of data points. Some of the scatter present within the fitted relationship (Figure 2) may be attributable to the presence of both rigid and flexible vegetation within the calibration data when, arguably, the different physics of flow through these two types of canopies would call for different fitted exponents. However, this potential source of error in the results appears to be small relative to the variability in η arising from the physics captured by the model. Nonetheless, we expect that in highly flexible canopies with significant bending, or in flow conditions that induce monami (i.e., waving) of stems, an additional source of turbulence, deviations from our fitted model would be more substantial.
Other complexities of real-world vegetation, such as irregularities in stem cross-sectional shape, a branching morphology, or within-patch heterogeneity in diameter [53,54] could induce additional deviations from the predictions of our model. Additionally, collectors exhibiting a rougher texture on some or all of their surfaces may increase η by providing additional surface area for particles to contact [33]. Surface roughness also increases drag and TKE, which suppress η [35], so additional experiments on collectors with morphological complexities are required to elucidate those conflicting influences on particle interception. Another area of particular interest for future study is the influence of biofilm on particle interception. We do not yet understand how morphological differences (e.g., thickness, roughness, and ciliation) between different communities of algae, cyanobacteria, and other microorganisms that collectively compose biofilm can influence the terms in Equation (8). This represents an area of opportunity for further improvements, perhaps through categorizing different types of biofilm characteristics and fitting new intercept values for each.

4.3. Comparison with Previous Models

Unlike Equation (2 but in agreement with Equations (3) and (4) and the observations of Wingenroth et al. [37], our functional form predicts a negative relationship between η and Re c , consistent with physical understanding, as discussed above. When comparing the predicted η values from our model and previously published functional forms (Equations (2) and (4)), our model performs far better at predicting particle interception in multicollector systems. The superior performance over Equation (2) is likely attributable to the derivation of that equation from single-collector data and the positive relationship between Re c and η estimated by that equation [35]. Though Equation (4) is based on a multicollector experimental configuration, it does not always accurately predict η for other experimental setups and parameter spaces, despite it positing a negative relationship between Re c and η [34]. We attribute the much greater R 2 and smaller residuals of our model (Figure 3) to the greater range in parameter space in the training data, and the inclusion of new terms (i.e., particle–fluid density ratio and TKE), which should impact overall interception due to the physics discussed in Section 2.1.

4.4. Application to Marsh Models

As demonstrated in Figure 4a,b, major differences exist between Equations (2) and (8); models that rely on Equation (2) may significantly overestimate the contribution of sedimentation from interception, and thus overall sedimentation. This is of particular concern given the importance of sedimentation in estimating resilience to sea-level rise and floods in marsh environments such as the system described in Mudd et al. [3]. Some of this gap between the original and modified versions of the Mudd model could be attributed to how the model addresses TKE. The original version only captured TKE through upward motion due to turbulence, w u p , which inhibits gravitational settling (Appendix A). Substituting Equation (2) with Equation (8) is a more holistic approach to turbulence as it explicitly addresses the impact of the TKE on particle interception through the TKE term in Equation (8).
A comparison of the different sedimentation fluxes within the Mudd model further elucidated the relative importance of the sedimentation mechanism under a given set of conditions. Both forms for predicting η (Equations (2) and (8)) demonstrated the same trend in Q c relative to d p and u, suggesting that particle interception is of the greatest importance in high-velocity conditions and/or for especially fine particles that may not otherwise contribute to sedimentation via settling. During our sensitivity analysis (where particle diameter ( d p ) was held constant), variability in marsh sedimentation was mostly driven by changes in Q c . Although particle interception represents a minority share of total sedimentation for much of the parameter space, Q c exceeds Q s in high velocity (u) and low frontal area (a) conditions (Figure 5).
This information can potentially help inform wetland design or restoration efforts across a variety of systems (coastal, tidal, fluvial, etc.) where the goal is to maximize sedimentation and substrate elevation. For instance, if vegetation will be manually introduced into a proposed restoration site, choosing a species with greater-diameter stems (to maximize the diameter ratio term in Equation (8) and low overall frontal area (to minimize the TKE term) may allow managers to leverage particle interception to increase overall sedimentation. Insights such as these can be expanded and refined as the pool of available training data continues to grow, especially with studies examining a broader range of vegetation (see Section 4.2).

5. Conclusions

In this study, we proposed a new functional form for predicting η based on key physics in vegetation–flow interactions and a data synthesis. This form was derived from a Buckingham–Pi-based dimensional analysis, and we fit this model using 80 data points across four different laboratory-based flume experiments (Table 1). Based on our analysis, η varies as: a weak negative function of drag-corrected Re c , a strong negative function of collector density, a weak positive function of particle–fluid density ratio, and a strong positive function of particle–collector diameter ratio. Our hypothesized Re c regime split was not statistically defensible; thus, we presented a uniform model for the range of Re c values typically found in vegetated aquatic environments. After integrating this new functional form into existing models for marsh elevation [3], we further demonstrated that our model may help avoid overprediction of particle interception, and provided an example of how this model can be used by resource managers looking to maximize sedimentation in wetland restoration efforts.
Our goal for presenting this new functional form was two-fold: First, we hope that this easy-to-use model (which outperforms existing forms for particle interception in the literature) can be integrated into crucial real-world modeling efforts. This may be especially important for the study of pressing global problems (such as estimating the ability of coastal marshes to outpace sea level rise or the construction of treatment wetlands to remove suspended parasites or contaminants sorbed to fine sediment) where the role of flow–vegetation interactions is still poorly understood. Further, our hope is that future flume- and field-based study of particle interception can continue to inform this work. As more experimental data across a wider range of flow, vegetation, and particle variables become available, this functional form can be further refined and applied to the study of vulnerable and ecologically and economically important environmental systems.

Supplementary Materials

The following are available online at https://www.mdpi.com/article/10.3390/geosciences11040157/s1, Table S1: Stepwise Regression Results.

Author Contributions

Conceptualization, L.L.; methodology, L.L. and S.S.; software, S.S.; validation, S.S. and J.W.; formal analysis, S.S.; investigation, S.S. and J.W.; resources, J.W.; data curation, S.S. and J.W.; writing–original draft preparation, S.S.; writing–review and editing, L.L. and J.W.; visualization, S.S.; supervision, L.L.; project administration, L.L.; funding acquisition, L.L. All authors have read and agreed to the published version of the manuscript.

Funding

This research was supported by the National Science Foundation (award EAR-1455362) and by a Moore Foundation Data-Driven Discovery Investigator Award to LL. S.S. received funding support through Environment and Society: Data Sciences for the 21st Century, a National Science Foundation-funded National Research and Traineeship program at the University of California-Berkeley.

Institutional Review Board Statement

Not applicable.

Informed Consent Statement

Not applicable.

Data Availability Statement

All data and code used in this analysis available at the project’s repository: https://gitlab.com/esdl/flume-synthesis (accessed on 11 January 2021).

Acknowledgments

We thank Elle Chen, Katrina Ginsberg, Aaron Hurst, Colin Keating, Justin Nghiem, Danielle Satin, Yayla Sezinger, Nicole Ulakovic, and Candace Yee for their work on the BRAT flume experiments, and Sheila Trampush for her assistance with the marsh elevation model.

Conflicts of Interest

The authors declare no conflict of interest.

Abbreviations

The following notations are used in this manuscript:
avegetation frontal area per unit volume (L 1 )
α attachment efficiency (dimensionless)
bwidth of particle streamlines that interact with a collector (L)
Csuspended particle concentration (ML 3 )
Cmpcompaction rate (LT 1 )
d c collector diameter (L)
d p particle diameter (L)
Eerosion rate (LT 1 )
η particle capture efficiency (dimensionless)
η 0 particle contact efficiency (dimensionless)
hlength of collectors exposed to flow (L)
Oorganic material accretion rate (LT 1 )
Pratio of particle to collector density (L)
PePéclet number (dimensionless)
Q c particle capture flux due to interception (ML 2 T 1 )
Q s particle capture flux due to settling (ML 2 T 1 )
R * ratio of particle to collector diameter (dimensionless)
Re c collector Reynold’s number (dimensionless)
uflow velocity (LT 1 )
ζ s t change in marsh elevation surface over time (LT 1 )

Appendix A. Marsh Sedimentation Equations

To model sedimentation due to interception ( Q c ) and settling ( Q s ), we modified a series of equations depicting marsh elevation change presented by Mudd et al. [3]. Total elevation change is given by Equation (7) and particle flux due to interception is described by Equation (1). Whereas Mudd et al. used Equation (2) to predict η , we used our fitted model, Equation (8).
The particle flux due to settling is given by
Q s = ( w s w u p ) C ,
where w s (LT 1 ) is the gravitational settling in turbulence-free water and w u p (LT 1 ) is the upward motion caused by turbulence. w s can be described by
w s = v d p 1 4 A F 2 / m + 4 d p 3 [ P 1 ] 3 F v 2 1 / m 1 2 A F 1 / m m ,
where A, F, and m (dimensionless coefficients dependent on the particle material and shape) were reported by Camenen [55] as 38, 3.55, and 1.12, respectively, for silt particles.
w u p is the product of the von Karman constant ( K v k , taken as 0.4) and the shear velocity ( u * (LT 1 )). u * can be defined as
u * = 0.20 k ρ f ,
where 0.20 is a constant of proportionality, k (L 2 T 2 ) is the turbulent energy per unit mass of water, and ρ f (ML 3 ) is the density of the fluid. Nepf [22] described k as
k = α k 2 u 2 ( C D a d c ) 2 / 3 ,
where C D (dimensionless) is the depth-averaged drag coefficient in a collector field and α k is a coefficient reported to be 0.9 by Nepf [22]. Note that α k is unit-dependent, and is only valid when Equation (A4) is evaluated in meters.
The drag coefficient can be defined in several ways. To match the original methodology from Mudd et al. [3], we used the following form of C D for our analysis in Figure 4:
C D = 2 α 0 v u μ B λ + χ + ζ γ μ π 4 B β + λ ,
where α 0 , χ , and ζ are empirical coefficients from Tanino and Nepf [21]; B (ML 2 ) is biomass; and, λ , γ , and β are empirical coefficients from Mudd et al. [3] (Table A1). As Equation (A5) requires multiple site-specific empirical values, we used a more general form of C D for our analysis in Figure 5:
C D = 2 α 0 Re c + α 1 ,
where, as per Tanino and Nepf [21], α 1 can further be defined as
α 1 = 0.46 + ( 3.8 ϕ ) ,
where ϕ (dimensionless) is the solid volume fraction.
Table A1. Empirical coefficients used for calculating C D across sites.
ValueGoat Island High MarshOyster Landing Low MarshAll Applicable Sites
α 0 --11
χ --0.46
ζ --3.8
μ 0.000660.0019-
λ 0.550.12-
γ 0.290.18-
β 0.400.53-

References

  1. Fagherazzi, S.; Marani, M.; Blum, L.K. Introduction: The coupled evolution of geomorphological and ecosystem structures in salt marshes. In The Ecogeomorphology of Tidal Marshes, Coastal and Estuarine Studies; American Geophysical Union: Washington, DC, USA, 2004; pp. 1–4. [Google Scholar]
  2. Larsen, L.G.; Harvey, J.W. How vegetation and sediment transport feedbacks drive landscape change in the Everglades and wetlands worldwide. Am. Nat. 2010, 176, E66–E79. [Google Scholar] [CrossRef] [Green Version]
  3. Mudd, S.M.; D’Alpaos, A.; Morris, J.T. How does vegetation affect sedimentation on tidal marshes? Investigating particle capture and hydrodynamic controls on biologically mediated sedimentation. J. Geophys. Res. Earth Surf. 2010, 115. [Google Scholar] [CrossRef] [Green Version]
  4. Olliver, E.A.; Edmonds, D.A.; Shaw, J.B. Influence of Floods, Tides, and Vegetation on Sediment Retention in Wax Lake Delta, Louisiana, USA. J. Geophys. Res. Earth Surf. 2020, 125. [Google Scholar] [CrossRef]
  5. Fagherazzi, S.; Kirwan, M.L.; Mudd, S.M.; Guntenspergen, G.R.; Temmerman, S.; D’Alpaos, A.; Koppel, J.V.D.; Rybczyk, J.M.; Reyes, E.; Craft, C.; et al. Numerical models of Salt Marsh Evolution: Ecological, Geomorphic, and Climatic Factors. Rev. Geophys. 2012, 50. [Google Scholar] [CrossRef]
  6. Huang, Y.H.; Saiers, J.E.; Harvey, J.W.; Noe, G.B.; Mylon, S. Advection, dispersion, and filtration of fine particles within emergent vegetation of the Florida Everglades. Water Resour. Res. 2008, 44. [Google Scholar] [CrossRef] [Green Version]
  7. Zhang, J.; Lei, J.; Huai, W.; Nepf, H. Turbulence and Particle Deposition Under Steady Flow Along a Submerged Seagrass Meadow. J. Geophys. Res. Ocean. 2020, 125. [Google Scholar] [CrossRef]
  8. Harvey, J.W.; Noe, G.B.; Larsen, L.G.; Nowacki, D.J.; McPhillips, L.E. Field flume reveals aquatic vegetation’s role in sediment and particulate phosphorus transport in a shallow aquatic ecosystem. Geomorphology 2011, 126, 297–313. [Google Scholar] [CrossRef]
  9. Simon, M.; Grossart, H.P.; Schweitzer, B.; Ploug, H. Microbial ecology of organic aggregates in aquatic ecosystems. Aquat. Microb. Ecol. 2002, 28, 175–211. [Google Scholar] [CrossRef] [Green Version]
  10. Yallop, M.L.; Paterson, D.M.; Wellsbury, P. Interrelationships between rates of microbial production, exopolymer production, microbial biomass, and sediment stability in biofilms of intertidal sediments. Microb. Ecol. 2000, 39, 116–127. [Google Scholar] [CrossRef] [PubMed]
  11. Grabowski, R.C.; Droppo, I.G.; Wharton, G. Erodibility of cohesive sediment: The importance of sediment properties. Earth-Sci. Rev. 2011, 105, 101–120. [Google Scholar] [CrossRef]
  12. Lundkvist, M.; Grue, M.; Friend, P.L.; Flindt, M.R. The relative contributions of physical and microbiological factors to cohesive sediment stability. Cont. Shelf Res. 2007, 27, 1143–1152. [Google Scholar] [CrossRef]
  13. Salant, N.L. ‘Sticky business’: The influence of streambed periphyton on particle deposition and infiltration. Geomorphology 2011, 126, 350–363. [Google Scholar] [CrossRef]
  14. Winterwerp, J.C.; van Kesteren, W.G. Introduction to the Physics of Cohesive Sediment in the Marine Environment; Elsevier: Amsterdam, The Netherlands, 2004. [Google Scholar]
  15. Hu, Z.; Lei, J.; Liu, C.; Nepf, H. Wake structure and sediment deposition behind models of submerged vegetation with and without flexible leaves. Adv. Water Resour. 2018, 118, 28–38. [Google Scholar] [CrossRef] [Green Version]
  16. Liu, X.; Zeng, Y.; Huai, W. Modeling of Interactions Between Floating Particles and Emergent Stems in Slow Open Channel Flow. Water Resour. Res. 2018, 54, 7061–7075. [Google Scholar] [CrossRef]
  17. McCombe, D.; Ackerman, J.D. Collector motion affects particle capture in physical models and in wind pollination. Am. Nat. 2018, 192, 81–93. [Google Scholar] [CrossRef]
  18. Larsen, L.G. Multiscale flow-vegetation-sediment feedbacks in low-gradient landscapes. Geomorphology 2019, 334, 165–193. [Google Scholar] [CrossRef]
  19. Tinoco, R.O.; Coco, G. A laboratory study on sediment resuspension within arrays of rigid cylinders. Adv. Water Resour. 2016, 92, 1–9. [Google Scholar] [CrossRef]
  20. Coco, G.; Zhou, Z.; Maanen, B.V.; Olabarrieta, M.; Tinoco, R.; Townend, I. Morphodynamics of tidal networks: Advances and challenges. Mar. Geol. 2013, 346, 1–16. [Google Scholar] [CrossRef]
  21. Tanino, Y.; Nepf, H. Laboratory Investigation of Mean Drag in a Random Array of Rigid, Emergent Cylinders. J. Hydraul. Eng. 2008, 134, 34–41. [Google Scholar] [CrossRef]
  22. Nepf, H.M. Drag, turbulence, and diffusion in flow through emergent vegetation. Water Resour. Res. 1999, 35, 479–489. [Google Scholar] [CrossRef]
  23. Yager, E.M.; Schmeeckle, M.W. The influence of vegetation on turbulence and bed load transport. J. Geophys. Res. Earth Surf. 2013, 118, 1585–1601. [Google Scholar] [CrossRef]
  24. Elliot, A. Settling of Fine Sediment in a Channel with Emergent Vegetation. J. Hydraul. Eng. 2000, 126, 570–577. [Google Scholar] [CrossRef]
  25. Temmerman, S.; Govers, G.; Wartel, S.; Meire, P. Modelling estuarine variations in tidal marsh sedimentation: Response to changing sea level and suspended sediment concentrations. Mar. Geol. 2004, 212, 1–19. [Google Scholar] [CrossRef]
  26. D’Alpaos, A.; Lanzoni, S.; Marani, M.; Rinaldo, A. Landscape evolution in tidal embayments: Modeling the interplay of erosion, sedimentation, and vegetation dynamics. J. Geophys. Res. Earth Surf. 2007, 112. [Google Scholar] [CrossRef] [Green Version]
  27. Nepf, H.M. Flow and Transport in Regions with Aquatic Vegetation. Annu. Rev. Fluid Mech. 2012, 44, 123–142. [Google Scholar] [CrossRef] [Green Version]
  28. Tinoco, R.O.; Coco, G. Observations of the effect of emergent vegetation on sediment resuspension under unidirectional currents and waves. Earth Surf. Dyn. 2014, 2, 83–96. [Google Scholar] [CrossRef] [Green Version]
  29. Follett, E.; Nepf, H. Particle Retention in a Submerged Meadow and Its Variation Near the Leading Edge. Estuaries Coasts 2018, 41, 724–733. [Google Scholar] [CrossRef]
  30. Hopkinson, C.S.; Morris, J.T.; Fagherazzi, S.; Wollheim, W.M.; Raymond, P.A. Lateral Marsh Edge Erosion as a Source of Sediments for Vertical Marsh Accretion. J. Geophys. Res. Biogeosci. 2018, 123, 2444–2465. [Google Scholar] [CrossRef]
  31. Kondziolka, J.M.; Nepf, H.M. Vegetation wakes and wake interaction shaping aquatic landscape evolution. Limnol. Oceanogr. Fluids Environ. 2014, 4, 106–119. [Google Scholar] [CrossRef]
  32. Meire, D.W.; Kondziolka, J.M.; Nepf, H.M. Interaction between neighboring vegetation patches: Impact on flow and deposition. Water Resour. Res. 2014, 50, 3809–3825. [Google Scholar] [CrossRef] [Green Version]
  33. Searcy, K.E.; Packman, A.I.; Atwill, E.R.; Harter, T. Capture and retention of Cryptosporidium parvum oocysts by Pseudomonas aeruginosa biofilms. Appl. Environ. Microbiol. 2006, 72, 6242–6247. [Google Scholar] [CrossRef] [PubMed] [Green Version]
  34. Fauria, K.E.; Kerwin, R.E.; Nover, D.; Schladow, S.G. Suspended particle capture by synthetic vegetation in a laboratory flume. Water Resour. Res. 2015, 51, 9112–9126. [Google Scholar] [CrossRef]
  35. Palmer, M.R.; Nepf, H.M.; Pettersson, T.J.R. Observations of particle capture on a cylindrical collector: Implications for particle accumulation and removal in aquatic systems. Limnol. Oceanogr. 2004, 49, 76–85. [Google Scholar] [CrossRef] [Green Version]
  36. Purich, A. The Capture of Suspended Particles by Aquatic Vegetation. Ph.D. Thesis, University of Western Australia, Crawley, Australia, 2006. [Google Scholar]
  37. Wingenroth, J.; Yee, C.; Nghiem, J.A.; Larsen, L. Effects of Stem Density and Reynolds Number on Fine Sediment Interception by Emergent Vegetation. Geosciences 2021, 11, 136. [Google Scholar] [CrossRef]
  38. Wu, L.; Gao, B.; Muñoz-Carpena, R. Experimental analysis of colloid capture by a cylindrical collector in laminar overland flow. Environ. Sci. Technol. 2011, 45, 7777–7784. [Google Scholar] [CrossRef]
  39. Wu, L.; Gao, B.; Muñoz-Carpena, R.; Pachepsky, Y.A. Single collector attachment efficiency of colloid capture by a cylindrical collector in laminar overland flow. Environ. Sci. Technol. 2012, 46, 8878–8886. [Google Scholar] [CrossRef]
  40. Wu, L.; Muñoz-Carpena, R.; Gao, B.; Yang, W.; Pachepsky, Y.A. Colloid filtration in surface dense vegetation: Experimental results and theoretical predictions. Environ. Sci. Technol. 2014, 48, 3883–3890. [Google Scholar] [CrossRef] [PubMed]
  41. Nepf, H.M. Vegetated Flow Dynamics Introduction: Scales of Morphology and Flow in a Tidal Marsh. Coast. Estuar. Stud. 2004, 59, 137–163. [Google Scholar]
  42. Durham, W.M.; Climent, E.; Barry, M.; De Lillo, F.; Boffetta, G.; Cencini, M.; Stocker, R. Turbulence drives microscale patches of motile phytoplankton. Nat. Commun. 2013, 4, 2148. [Google Scholar] [CrossRef] [Green Version]
  43. Zhang, Y.; Tang, C.; Nepf, H. Turbulent Kinetic Energy in Submerged Model Canopies Under Oscillatory Flow. Water Resour. Res. 2018, 54, 1734–1750. [Google Scholar] [CrossRef]
  44. Espinosa-Gayosso, A.; Ghisalberti, M.; Ivey, G.N.; Jones, N.L. Density-ratio effects on the capture of suspended particles in aquatic systems. J. Fluid Mech. 2015, 783, 191–210. [Google Scholar] [CrossRef] [Green Version]
  45. Kuhn, M. Caret: Classification and Regression Training. 2020. Available online: https://cran.r-project.org/package=caret (accessed on 11 January 2021).
  46. Venables, W.; Ripley, B. Modern Applied Statistics with S, 4th ed.; Springer: Berlin, Germany, 2002. [Google Scholar]
  47. Muggeo, V.M. Interval estimation for the breakpoint in segmented regression: A smoothed score-based approach. Aust. N. Z. J. Stat. 2017, 59, 311–322. [Google Scholar] [CrossRef]
  48. Hurvich, C.; Tsai, C.L. Regression and Time Series Model Selection in Small Samples. Biometrika 1989, 76, 297–307. [Google Scholar] [CrossRef]
  49. Oosterlee, L.; Cox, T.J.S.; Vandenbruwaene, W.; Maris, T.; Temmerman, S.; Meire, P. Tidal Marsh Restoration Design Affects Feedbacks Between Inundation and Elevation Change. Estuaries Coasts 2018, 41, 613–625. [Google Scholar] [CrossRef]
  50. Amos, C.L.; Bergamasco, A.; Umgiesser, G.; Cappucci, S.; Cloutier, D.; Denat, L.; Flindt, M.; Bonardi, M.; Cristante, S. The stability of tidal flats in Venice Lagoon - The results of in-situ measurements using two benthic, annular flumes. J. Mar. Syst. 2004, 51, 211–241. [Google Scholar] [CrossRef]
  51. Bradley, P.; Morris, J. Physical characteristics of salt marsh sediments: Ecological implications. Mar. Ecol. Prog. Ser. 1990, 61, 245–252. [Google Scholar] [CrossRef]
  52. Carr, J.A.; D’Odorico, P.; McGlathery, K.J.; Wiberg, P.L. Spatially explicit feedbacks between seagrass meadow structure, sediment and light: Habitat suitability for seagrass growth. Adv. Water Resour. 2016, 93, 315–325. [Google Scholar] [CrossRef] [Green Version]
  53. Harvey, M.; Bourget, E.; Ingram, R.G. Experimental evidence of passive accumulation of marine bivalve larvae on filamentous epibenthic structures. Limnol. Oceanogr. 1995, 40, 94–104. [Google Scholar] [CrossRef]
  54. Tinoco, R.O.; San Juan, J.E.; Mullarney, J.C. Simplification bias: Lessons from laboratory and field experiments on flow through aquatic vegetation. Earth Surf. Process. Landf. 2020, 45, 121–143. [Google Scholar] [CrossRef]
  55. Camenen, B. Simple and general formula for the settling velocity of particles. J. Hydraul. Eng. 2007, 133, 229–233. [Google Scholar] [CrossRef]
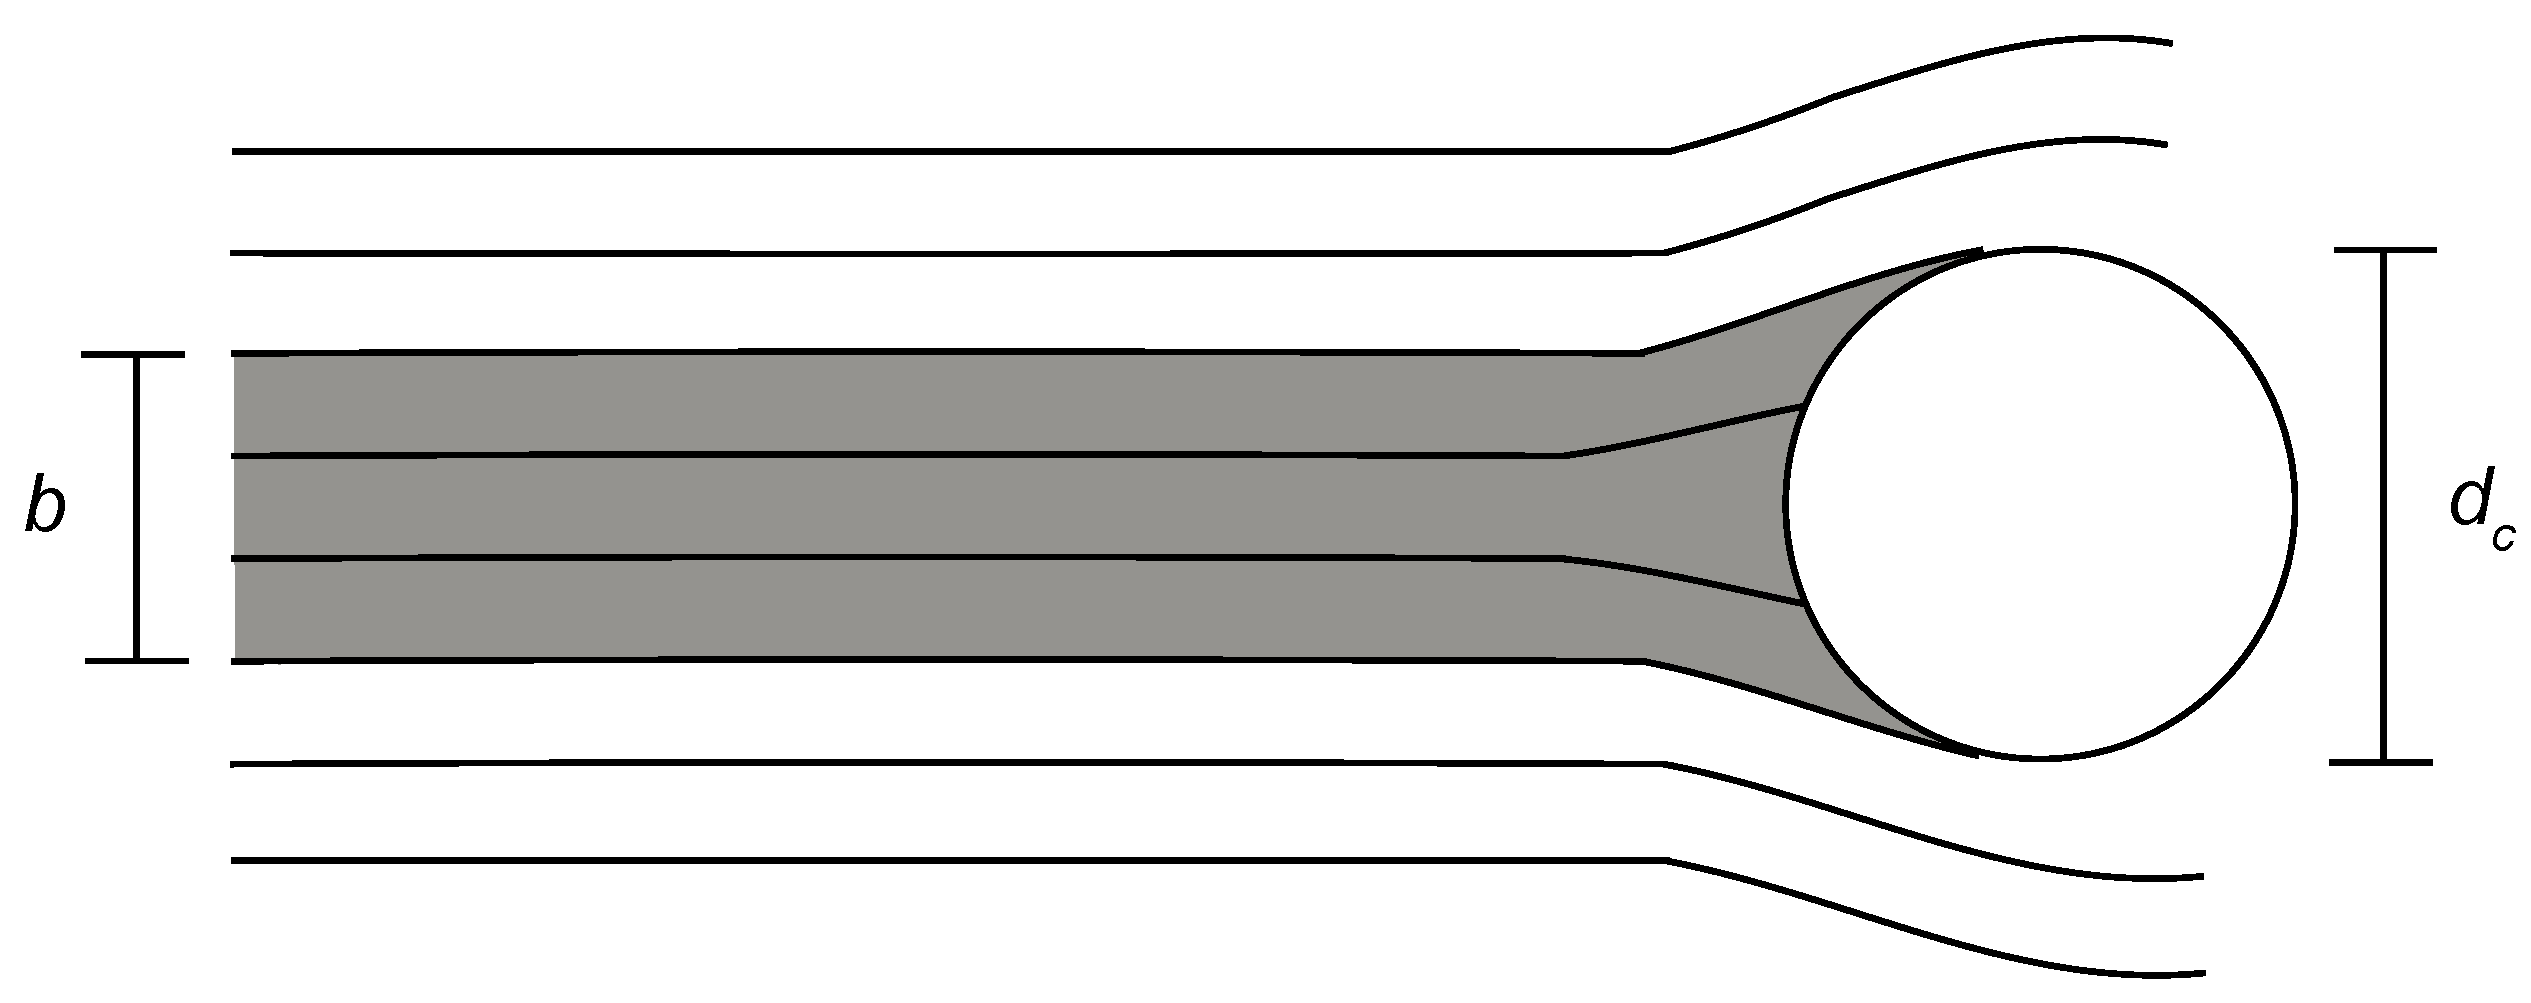
Figure 1. Plan view of the theoretical definition of capture efficiency, η , as the ratio of the effective width of the particle streamlines that will be intercepted by a collector, b, to collector diameter, d c . Modified from Palmer et al. [35].
Geosciences 11 00157 g001
Figure 2. Observed ln( η ) for all data points (n = 80) compared with ln( η ) predicted by Equation (8). Data points are colored by collector Reynolds number.
Geosciences 11 00157 g002
Figure 3. Observed ln( η ) for all data points compared with ln( η ) predicted by the models presented in Palmer et al. [35], Fauria et al. [34], and here. The solid black line is a 1:1 line; the dashed green line is the regression line of observed ln( η ) values vs. ln( η ) values predicted by the proposed model.
Geosciences 11 00157 g003
Figure 4. Fraction of sedimentation due to particle interception (Q c /[Q c + Q s ]) using the form for η from (a) the Palmer et al. [35] model and (b) the proposed method (Equation (8) for the North Inlet Estuary, South Carolina (data from Mudd et al. [3]). High marsh refers to a site with higher estimated vegetation density (a = 0.087 cm 1 ), and low marsh refers to a site with lower estimated vegetation density (a = 0.047 cm 1 ). Our model predicted less particle interception (0–16% compared with 2–74% in the Palmer et al. formulation) and less total sedimentation (8.46 × 10 2 –4.82 × 10 5 vs. 1.31 × 10 3 –1.28 × 10 6 g cm 2 s 1 ), although both estimated that particle interception would be greatest in systems with small (∼15–25 μ m ) particles and high velocity.
Geosciences 11 00157 g004
Figure 5. Estimated portion of sedimentation due to interception for 40 μ m particles under typical marsh vegetation and flow conditions. Although Q c < Q s for much of the parameter space, interception dominated in high flow, low collector density conditions.
Geosciences 11 00157 g005
Table 1. Summary of training data used to fit the functional form presented in this paper. Re c , Reynolds number.
PaperData Points Re c RangeParticle Size (m)Frontal Area/Unit Volume (cm 1 )
Purich [36]1871–6572310.06–0.25
Wu et al. [40]120.02–1.21.050.002–0.1
Fauria et al. [34]3655–1849.9–13.80.06
Wingenroth et al. [37]1467–200320.008–0.039
Table 2. Fitted model coefficients, outer bounds of the 95% confidence interval from a 10,000 repetition bootstrap analysis, and standardized (or beta) coefficients. c 0 is the intercept, c 1 is the drag-corrected Re c term, c 2 is the total kinetic energy (TKE) term, c 3 is the density ratio term, and c 4 is the diameter ratio term.
c 0 c 1 c 2 c 3 c 4
Min−3.88−0.55−1.710.331.79
Fitted−1.13−0.38−1.541.002.10
Max1.21−0.17−1.361.492.50
Standard1.29−0.47−1.350.241.57
Publisher’s Note: MDPI stays neutral with regard to jurisdictional claims in published maps and institutional affiliations.