Abstract
The article provides new data about characteristics of the organic matter and mineralogical composition of the Cape Muostakh sediments related to intense permafrost degradation (thermoerosion processes). The sedimentary material has been investigated by X-ray diffraction, GC-MS, IRM-GC-MS, pyrolysis–gas chromatography–mass spectrometry (Py-GC-MS), and Rock-Eval pyrolysis. Variable distribution of the total organic carbon content over the coast cliff is established. The minimum content of the organic carbon occurs at the cliff level of 5 m above sea level, and the maximum is located on the top of the cape cliff. The practical absence of unsaturated compounds indicates the intense destruction of the ice complex deposits that occurred at the level of 5 m of the Cape Muostakh cliff. The minimum organic carbon, aliphatic compounds, and the increase of the δ13C indicates the loss of hydrogen-enriched organic matter, while condensed carbon structures remain in sediment. Aromatic compounds of both plant and petroleum origin were identified in all sediments, except in the sediment sample collected at the cliff level of 5 m. Unsaturated fatty acids were detected only in the sediments of the upper cliff levels. The novel hopenes and hopane were detected and they predominantly occur in the upper layers of the cape cliff.
1. Introduction
Northern circumpolar soils store huge amounts of global soil organic carbon (∼1300 Pg) with its greater part being perennially frozen (∼800 Pg) [1]. With amplified global warming these vast carbon reservoirs become increasingly susceptible and heavily affect the modern biogeochemical cycle. This remobilized material can be buried in shelf sediments, transported towards deeper basins, or degraded providing a potential positive feedback to climate warming and causing severe ocean acidification [2]. Therefore, sources and fate of the terrigenous carbon (terrOC) upon its translocation to the East Siberian Arctic shelf (ESAS), the largest and the shallowest shelf of the World Ocean, has been the subject of growing interest in recent years [3,4,5,6,7].
Particularly vulnerable to thaw remobilization are the late-Pleistocene ice-rich coastal deposits known as the Yedoma Ice Complex that extend for ~7000 km along the East Siberian Arctic coastline. In recent decades, the Yedoma Ice Complex retreat rate has been increasing by 1.5–2 times (up to 20 m/yr; see [8]) due to the combined effect of increasing wave and wind erosion resulting from summer sea-ice extent decline, longer and warmer thawing seasons, and the rising sea level [8,9,10,11]. Massive release of remobilized carbon from the Yedoma Ice Complex is considered as a major source (>57 ± 2%, r ∼44 ± 10 Tg C y−1) of terrOC on the ESAS already exceeding marine and top-soil terrestrial contributions [7], and this process is expected to further increase due to accelerating coastal retreat rates [8,12,13,14]. To better understand how the organic matter (OM) frozen in Yedoma deposits will contribute to the Arctic carbon cycle, it is necessary to provide deeper insights into the molecular composition of Yedoma OM accumulated during the late Pleistocene and Holocene and to recognize its geochemical evolution during the past. Major progress has been made in constraining OM composition stored in permafrost at the molecular level using lipid biomarker analysis [15,16,17], humic substances analysis performed by 13C-NMR spectroscopy method [18,19,20], and characterization of water-extractable organic matter [21]. However, there are few comprehensive studies of the organic matter of Arctic coastal sediments. This study focuses on both extractable and non-extractable portions of the OM. A suite of traditional molecular lipid markers (alkanes, alkenes, terpenoids, and aromatic compounds) along with a set of macromolecular markers revealed by Py-GC-MS analysis were applied in order to trace a degradation state of OM freeze-locked in Yedoma deposits. Rock-Eval parameters, total organic carbon (TOC, wt%), stable carbon isotope ratios (δ13C of TOC), grain size, and mineral composition were also determined for the bulk samples. This comprehensive geochemical study provides new data about the sources and degradation state of Yedoma organic matter and attempts to distinguish special molecular fingerprints of the “old” OM enhancing our knowledge on the involvement of the permafrost-sequestered OM in the Arctic carbon cycle.
2. Materials and Methods
2.1. Study Area
The Bykovsky Peninsula (Figure 1) is located in the northern margin of the Siberian mainland, approximately 50 km south-east of the Lena River delta, extending between 71°40′–71°80߰ N and 129°00′–129°30′ E. Cape Muostakh, the southeastern end of the Bykovsky Peninsula, is located approximately 20 km from northeast of Tiksi, a harbor town. The climate is characterized by long, cold winters interrupted by short summers, with mean temperatures from −31.3 °C in January to 7.8 °C in July. The peninsula represents the erosional remains of a former extended accumulation plain with elevations reaching up to 45 m a.s.l. and lies within the zone of continuous permafrost from 500 to 600 m thick [22]. The Bykovsky Peninsula is underlain by Ice Complex deposits (ICD) composed of organic- and ice-rich silty sediments and exhibits large rates of coastal retreat due to periodic storms and intense thermal erosion of the ICD [8,23,24].
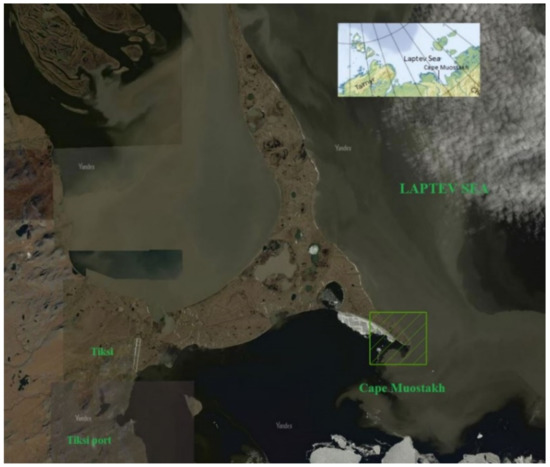
Figure 1.
Cape Muostakh, Bykovsky Peninsula (image from Yandex map service [https://yandex.ru/maps/], accessed on 20 December 2020). The study area is in hatching box.
2.2. Sampling
Samples used for this study (except the “KV1” sample) were collected from 1, 5, 11, 15, 20, and 21.5 m above sea level from the coastal cliff vertical profile at the Cape Muostakh, Bykovsky Peninsula during the expedition in October 2015. A KV1 sample was taken from a debris cone located about 15 m to southeast from the cliff. All samples were kept frozen during the transportation and were stored at −18 °C in the freezer until analyzed. Prior to analysis samples were thawed for 24 h at room temperature and oven-dried at 40 °C. The lithological description of the samples, as well as the content of total organic carbon (TOC) and its isotopic composition (δ13C) are represented in Table S1.
2.3. Grain Size and Mineralogical Analysis
The grain size analysis was performed on a Vibratory Sieve Shaker AS 200 machine. Dried samples were separated by mechanical sieving into sand, sortable silt, fine silt, and clay fractions (>0.063 mm, 0.063 mm and 0.01 mm, 0.01 mm and 0.002 mm, and <0.002 mm, respectively) and were calculated as the sums of the percentages. Since the sample from the site at 21.5 m above sea level (a.s.l.) is represented by a peat material, we did not perform grain-size analysis for it. The bulk mineralogical composition of the sediments was determined by X-ray diffraction (XRD) on a Rigaku Ultima IV diffractometer. Bulk samples were crushed and grained gently in McCrone mill to a particle size less than 10 µm. Clay fractions (<2 µm) were collected from aqueous dispersion, suspending it in a water column and oriented samples were prepared by drying the dispersed clay on to glass slides. Samples were examined by XRD in air-dried and ethylene glycol solvated states to identify mixed-layer phase. The XRD-patterns were measured using Cu (copper), X-ray tube voltage—40 kV, current—30 mA, power—1.2 kW, shooting speed 1°/min, step 0.02°, shooting angles 2Θ from 3° to 65°. Quantitative mineralogical analyses for the bulk samples were performed by Rietveld analysis [25] using an integrated X-ray power diffraction software (PDXL) and Siroquant software [26] and clay fraction interpreted according to recommendations given in literature [27]. In addition, sand and sortable silt fractions were separately examined with a POLAM-L-211 binocular microscope.
2.4. Rock-Eval Analysis
Rock-Eval analysis of sediment samples was performed on Rock-Eval 6 Turbo (Vinci Technologies) following the method as described by [28,29]. The Rock-Eval 6 Turbo is equipped with a flame ionization detector (FID) for monitoring the amounts of hydrocarbons, and two IR cells for monitoring the amounts of CO and CO2 from pyrolysis and oxidation, respectively. Calibration using a standard sample provided by the instrument developer is performed daily. The certainty of the analysis results from the Rock-Eval 6 Turbo instrument is ensured by verification according with the IFP 160,000 standard. About 30–40 mg of dried and homogenized sample was used for Rock-Eval (RE) analysis at the Arctic Carbon lab, Tomsk Polytechnic University. Firstly, a sample was heated at 300 °C for 3 min to generate the S1 peak representing the volatile and semi-volatile hydrocarbons. Further, the sample was heated from 300 °C to 650 °C at a rate of 25 °C/min, yielding the S2 peak representing thermal decomposition products from solid organic matter. The S3 peak corresponds to the amount of CO2 generated from organic matter during the initial isothermal heating step and the programmed heating phase up to 400 °C (Figure S1). The temperature of the S2 peak maximum depends on type and thermal maturity of the sedimentary organic matter, and is converted to Tmax ( °C). The CO2 generated between 400 °C and 650 °C corresponds to the thermal decomposition of carbonate minerals. The Rock-Eval 6 instrument also records the amount of CO generated during pyrolysis and attributes various proportions to organic carbon and mineral sources depending on sample temperature (see [29] for details). The amount of pyrolyzable organic carbon is determined by combining the S1, S2, and S3 contributions according to a pre-defined formula [29]. Mineral carbon is determined from the high temperature portions of the CO (S3´CO peak) and CO2 (S3´ CO2 peak) pyrolysis curves. Following pyrolysis, samples are transferred to the oxidation furnace of the instrument where they are heated from 300 °C to 850 °C at a rate of 20 °C/min evenly and held at final temperature for 8 min under air flow to determine the amount of residual organic carbon from S4(CO2) and S4(CO) peaks (300–650 °C), and oxidation mineral carbon from S5 peak of CO2 generated during 650–850 °C oxidation (Figure S2). The TOC is the sum of the productive and residual organic carbon. Similarly, MinC (%) is the sum of the pyrolysis and oxidation mineral carbon calculated according to [28,29] expressed as weight percentage (wt%) of carbon present in the bulk sediment.
2.5. Stable Isotope Analysis (δ13C)
Stable carbon isotope (δ13C) analysis was performed using a Delta V Advantage isotope mass spectrometer (Thermo Fisher Scientific), connected to a Flash 2000 elemental analyzer using the ConFlo IV interface. Prior to analysis samples were acidified with HCl to remove carbonates. The analytical error did not exceed ±0.15‰ based on triplicate analyses of the same sample. The values of the carbon isotopic composition are given as the δ13C values relative to the international standard VPDB. The reliability of the measurement results was controlled by the standards IAEA NBS-22 (mineral oil) with δ13C vPDB = −30.03‰ and IAEA-CH-7 (polyethylene) having δ13C vPDB = −32.15‰.
2.6. Biomarker Analysis: Solvent Extractable Lipids
Dried and homogenized samples were sieved and ~30–40 g of fine-grained sediment (fraction < 0.063 mm) was placed in a Soxhlet apparatus. Activated copper powder was added to remove sulfur. Also, anhydrous Na2SO4 was added for water removal. Extraction of OM from the samples was performed by chloroform until the solution was completely discolored (at least 20 h). An insoluble residue (“asphaltenes”) was isolated from the obtained total extract using petroleum ether (in a ratio of 30:1 by volume) during the day (similar to [30]). The purified total lipid extract was divided by the method of the column liquid-adsorption chromatography (CLAC) on the activated silica. The non-polar hydrocarbon fraction (aliphatic fraction) was eluted with petroleum ether, the aromatic fraction with petroleum ether and toluene in the ratio of 6:1 (vol.), whereas the polar fraction was desorbed by ethanol:toluene in the ratio of 1:1 (vol.). The fractionation procedure was repeated for each sample at least twice. Also, blank experiments were conducted to identify and account for contaminants.
All fractions were then analyzed by gas chromatography-mass spectrometry (GC-MS) on a Bruker SCION 436 GC TQ instrument using HP-1MS quartz capillary column (length 30 m, internal diameter 0.25 mm, film thickness 0.25 μm) with a temperature profile of initially 40 °C followed by a ramp of 5 °C min−1 until reaching 150 °C and then by a ramp of 3 °C min−1 until reaching 310 °C and holding at final temperature for 20 min. Carrier gas (helium) speed was 1.1 mL/min and injection volume was 1 μL. Measurements were carried out both in Scan (m/z range 50–500) and SIM modes at 70 eV. The transfer-line was kept at 260 °C and the ion source was kept at 270 °C. Components identification was performed by detailed study of the mass spectra and their comparison with NIST 14 library and literature data. Quantification was performed using commercially available standards (tetracosane-d50, eicosanoic acid-d35, 2-hexadecanol, and some hopenes provided by “Chiron”). Each sample was run at least in triplicate.
2.7. Biomarker Analysis: Non-Extractable Organic Components (NEOC)
Dried solvent-extracted sediments were analyzed using pyrolysis–gas chromatography–mass spectrometry (Py-GC-MS). All measurements were performed using a Bruker SCION 436 GC TQ system interfaced to a CDS-5150 Pyroprobe. Initially, a blank experiment was carried out to assess and eliminate the pollution. A quartz wool was calcined at 450 °C for 30 min to eliminate the contaminants peaks. Then 15–20 mg of sample was placed in a quartz tube and pyrolyzed at 700 °C for 20 s in a helium flow. The pyrolysis products entered an GC-MS system through a heated transfer-line (350 °C). The oven and GC-MS injector temperature were set at 350 °C. The oven was programmed from 40 °C (held for 5 min), before being heated to 250 °C at a rate of 4 °C/min, then heated to 300 °C at 20 °C/min and held at a final temperature for 1 min. Each sample was run at least three times.
The results of Py-GC-MS are the relative concentrations of furfurals, alkylbenzenes, nitriles, phenols, pyridines, and other groups of the compounds calculated on the sum of all identified peaks of the components [31,32,33]. Furfurals are products of the degradation of polysaccharides, alkylbenzenes are most common in soils and are formed under anaerobic conditions, and nitriles are derived from polypeptides and indicate a well-humified environment [31,34]. Phenol is a key component of lignin; therefore, it can be used as a marker of the pyrolysis products of terrigenous material, and pyridine is a product of destruction of the organic matter of the marine origin primary productivity. Other classes of compounds were evaluated in a similar manner as in the work [34]. The relative concentrations are not directly related to the actual concentration of the determined compounds; however, this approach allow us to compare the sets of the most abundant compounds in the samples.
3. Results and Discussion
3.1. Characterization of the Profile on a Bulk Level
3.1.1. Grain Size and Mineral Composition
Grain size composition is overall dominated by the sand fraction reaching up to 91% wt. in the lowest horizons (from 0 to 5 m a.s.l.), the clay content reaches up to 53% wt. Silt content varies from 3 to 15% wt. Sorting varies from 1.6 to 3.98%, which indicates poorly sorted clayey sediments and very poor sorted sandy layers (Figure 2).
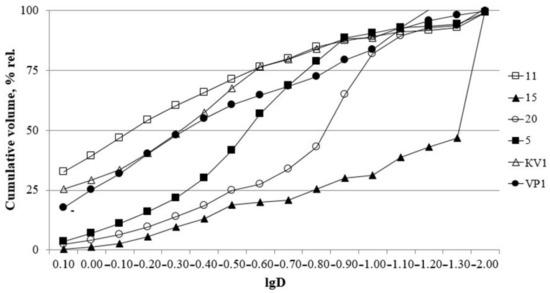
Figure 2.
Cumulative curves. D—particle diameter, mm.
Preliminary investigation of mineral composition by the optical microscope allowed to identify the grains of quartz (transparent, non-rounded, sometimes with iron scurfs and films), plagioclase (weathered, non-rounded), and fragments of pre-existing rocks (igneous and metamorphic) (Figure 3a,b).

Figure 3.
Mineral composition of sand fraction studied with a binocular microscope: (a) Grains of quartz (Q), plagioclase (PI), chlorite (Cl), pyroxenes (Dp), amphiboles (Avg), ilmenite (I1) (Sample «11»); (b) grains of quartz (Q), sphene (sph), garnet (gr), and ferrous fragments of rocks (Sample «11»); (c) chitinous debris from insects, grains of biotite (Bi), clays, and fragments of rocks (Sample «VP1»).
The sands are enriched by chlorite and mica, which are highly weathered and sericitized muscovite varieties and chloritized biotite grains. Accessory minerals are represented by non-rounded grains of amphiboles and pyroxenes; garnet, sphene, and epidote grains were identified as well (Figure 3b). Insect chitin remains were observed in all samples (Figure 3c).
According to the XRD data, sediments are mainly composed of quartz and feldspar reaching up to 55% and 30% wt., accordingly (Figure 4, Table S2). Feldspars are generally represented by plagioclase (average ~ 26% wt.), whereas a content of potassium feldspar (PF) in the sediments is generally low (average ~ 6% wt.). Illite concentration fluctuates between 11 and 19% wt.
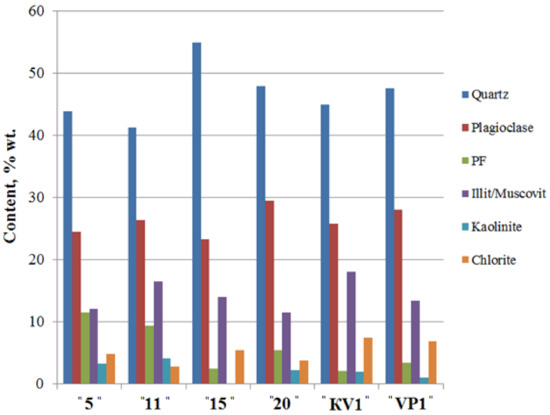
Figure 4.
The bulk mineral composition of the sediments of the Cape Muostakh, the Bykovsky Peninsula. PF—potassium feldspar.
Clay minerals (Figure 5; Table S3; see X-ray diagrams in the Supplementary Materials) are represented by kaolinite, chlorite, and illite, and their total content does not exceed 27% wt. Mixed-layered Illite/Smectite (I/S) were found in samples taken from 11 and 20 m a.s.l., as well as in “VP1” and “KV1” samples.
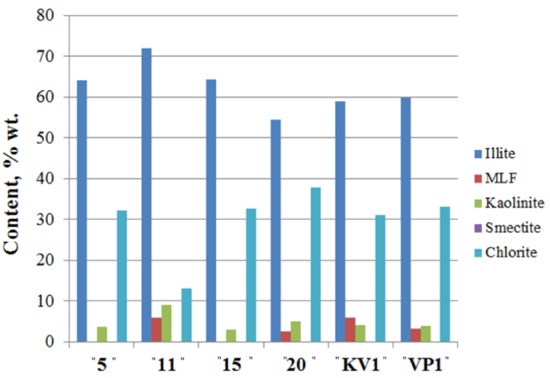
Figure 5.
Clay mineral assemblages in the sediments of the Cape Muostakh, the Bykovsky peninsula. I/S is the mixed layered Illite/Smectite.
Along the cliff profile, with a decrease of clay minerals content, there is an increase of the quartz content and a sharp decrease in the relative content of kaolinite, and vice versa. Namely, with the increase of the proportion of the clay minerals, we observed the decrease of the quartz content, but among the clay minerals, amount of the kaolinite increases (Figure 4 and Figure 5). Moving down the cliff, we observed a decrease of chlorite amount and an increase of illite, kaolinite and I/S contents reaching their maxima at 11 m above sea level. The same results of mineral composition were reported for the bottom sediments of Buor-Khaya Bay [35].
3.1.2. Sedimentary Organic Matter Characterization
The analysis of the bulk sediment gives us a representation of the sediment content and the general patterns of changes associated with the destruction of the ice complex deposits of the Laptev Sea coast. In this regard, sediments in the cliff section vary greatly in both lithology and total organic carbon content (TOC). The highest TOC value was found in the upper layer, which is represented by the peat (sample “21.5”). The sand layer under the peat also has elevated concentration of the TOC (5.35% wt.). Further down the section, layers of the pelitic aleurite and sand are located. In the range of the cliff levels from 17.5 to 2.5 m, they have the lowest TOC values (0.96–2.02% wt.). The “VP1” sample, located at the bottom of the cliff, (wave-cut niche) and the “KV1” sample (debris cone) have higher TOC content (2.75–2.96% wt.). It is possible that the increased TOC of these two samples is associated with thermodenudation and erosion processes of the cliff, because of which the sedimentary material “slides” from the upper organic-rich horizons and mixes with the sediments of the lower cliff layers with the depleted organic material (see Figure 6, Table 1) [12,13]. It happens at an intensive rate on the shores, entirely composed of ice complex deposits and previously it was noted in works [36,37,38].
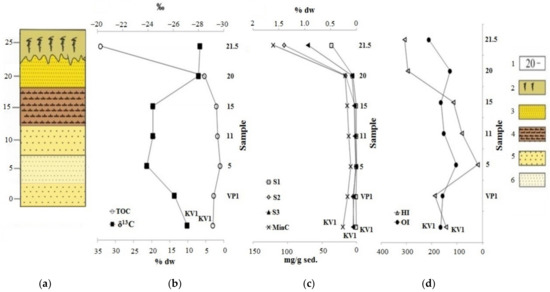
Figure 6.
Change of parameters by cliff: (a) Lithologic column; (b) results of the determination of the total organic carbon (TOC) and its isotopic composition (δ13C); (c,d) data from the Rock-Eval pyrolysis. Legend: 1—above sea level, m; 2—sod-peat cover; 3—fine sand; 4—pelitic aleurite; 5—coarse sand; 6—medium sand.

Table 1.
Rock-Eval (pyrolysis) results and carbon isotopic composition of the samples.
On the other hand, this can be explained by the variable input of organic matter during the formation of sediments during the Middle and Late Pleistocene and Holocene, as well as erosion and oxidation of organic matter during sea level fluctuations. Different dynamics of sedimentary material input can be noted based on the data of the XRD analysis (Figure 4 and Figure 5). The highest terrigenous inflow of sedimentary material was observed during the formation of sediments of the cliff level 15 and 20 m, which is in accordance with [41]. Clay minerals, most likely formed in situ, are more common at 5 and 11 m of the cliff. At the same time, increase of TOC content in sediments was observed relative to the plagioclase and decrease relative to the illite content (Figures S3 and S4). This may indicate that organic carbon was accumulated by the removal of large debris particles by river runoff containing peat residues and was simultaneously diluted with other minerals, including clay fraction. This is an unusual deposition pattern of organic carbon because it is commonly adsorbed on clay particles. Granulometry data indirectly indicate the same fact (the predominance of coarse structures in the section of the cliff). On the other hand, the accumulation of organic material is most likely possible under these conditions, since due to hydrodynamic sorting, only large particles remain near the coast [4]. At the same time, correlations between relict aromatic compounds (Table 2) are observed relative to plagioclase, and there are not the same correlations for oil derived aromatic compounds (or mixed origin, for example, alkylbiphenyls, phenylphenanthrene, pyrene, triphenylene, phenanthrene, dibenzothiophene, benzonaphthiophene), which indicates a different way of their precipitation (aeolian route). In addition, based on the Py-GC-MS data, sediment sample “5” has a less terrigenous input of the organic matter compared to the other sediments (Table 3). Almost all the Rock-Eval parameters vary according to the change of the total organic carbon content, specifically they increase to the top of the cliff (sample “21.5”) and the minimum of all parameters falls on the sample collected at a height of 5 m. A second minimum on the 20 m level is observed for oxygen index parameter. All samples have very high OI values (Figure 7, Table 1), which may indicate an intense oxidation of OM. According to the isotopic composition analysis, organic matter (OM) of samples “5”, “11”, and “15” have a slight shift towards marine genesis, if we consider the range of the values from −25.0 to −24.0 ‰ as the boundary range between marine and terrigenous organic matter [9,42].

Table 2.
The concentrations of the identified components, and biomarker ratios according to the results of GC-MS analysis.

Table 3.
Composition of the pyrolysis products of the Cape Muostakh sediments.
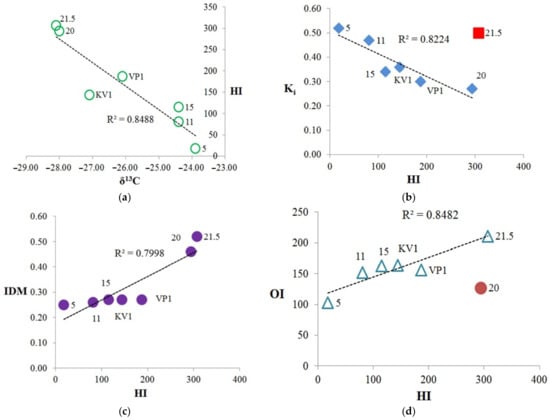
Figure 7.
The relationships between Rock-Eval parameters, isotopic composition, and Ki: (a) isotopic composition (δ13C) vs. hydrogen index (HI); (b) Ki vs. hydrogen index (HI), with sample “21.5” falls out from trend, Ki represents the (Pr + Ph)/(nC17 + nC18) ratio; (c) diagenetic maturity index (IDM) vs. HI; (d) oxygen index (OI) vs. HI, while sample “20” falls out from trend.
A fairly clear correlation is observed between carbon isotopic composition and the hydrogen index (HI) (Figure 7a), thus, the greater number of the saturated aliphatic structural fragments in the OM corresponds to more depleted the isotopic composition of the OM. Also, we can note the positive correlation between hydrogen index and TOC, except for the sample “21.5” (Figure S5). The highest δ13C falls on the sample collected at the cliff level 5 m, which has the lowest TOC and hydrogen index (HI). It is likely that OM at the cliff level 5 m includes a certain amount of OM of marine origin and it can be assumed that the OM of this sediment sample was subjected to stronger external influences, possibly oxidation and water-washing out due to the erosion processes (minimum HI, TOC). This is also traced by the parameters Ki (Table 2) and diagenetic maturity index (IDM) (Table 1), which are the highest and lowest values, respectively, for this sample. It should be noted that sample “11” also has a high Ki value and a relatively low value of the IDM index. In general, we can conclude, according to Table 1 and Figure 7, that the KV1, VP1, 5, 11, and 15 samples have a greater degree of diagenetic transformation than “20” and “21.5” samples. The most labile OM refers to the peat layer (21.5 m; Tmax = 322 °C), and the most resistant to the sample collected at the level of 5 m (Tmax = 433 °C). The high Ki value for the sample “21.5” can be explained by bacterial activities on the processing of organic matter in the peat layer, for example the biodegradation of oils leads to an increase of Ki index [43]. Therefore, this sample falls out from the trend of the dependence Ki vs. HI common for other samples (Figure 7b). The hydrogen index, in turn, is proportional to the index of diagenetic maturity (Figure 7c). Hence, we can assume that the more diagenetically transformed OM has higher Ki index, and lower IDM and HI parameters. Thus, the most transformed are the samples selected at the levels 5, 11 and 15 m. In this case, sample “5” is more degraded, which can also be traced by the minimum values of the CPI and OEP parameters (3.94 and 3.60 respectively, Table 2) (see [5] and references therein). Sample “KV1” is a “mixture” of the upper and lower horizons, therefore it is located approximately in the center of the trends on the Figure 7a–c. Except for the sample “20”, there is a positive correlation between the HI and OI parameters (Figure 7d). That is, with an increase in the number of aliphatic hydrogen-saturated structural fragments in OM, the proportion of oxygen-containing structural fragments also increases.
3.2. Composition and Sources of the Extractable Organic Matter
Analysis of the composition of soluble organic matter was carried out with a preliminary division of the total lipid extract into individual fractions, which were subsequently analyzed using the GC-MS. The use of various types of biomarkers and corresponding coefficients helps to describe in more detail the characteristics of organic matter of sediments and to trace its evolution in connection with erosion processes. As a result, we can see more pronounced differences between sediment samples at the molecular level. In particular, the accumulation of OM in sediment sample “20” (as well as sample “5”) occurred under more reducing conditions (Pr/Ph = 0.78 and Pr/Ph = 0.38, respectively, see Table 2) compared with the other samples. Therefore, the oxygen index of these samples is slightly lower (Figure 8c), and sample “20” falls out from the general trend shown in Figure 8d. It is likely that, generally, OM was deposited under anoxic conditions, since Pr/Ph ratio for all samples does not exceed 3 (Table 2) [44], and the parameter has a minimal value (0.38) for a sample collected at the level 5 m, which may indicate sea level fluctuations in the past [45]. We observed a good correlation between the OI and the Pr/Ph coefficient, which characterize the redox conditions of sedimentation (Eh). As the oxygen index increases, Pr/Ph ratio also grows (Figure 8a). The accumulation of organic matter occurred in a more oxidizing environment for the samples “21.5” and KV1 (due to the mixing of the peat layer with other horizons). As Eh increase, the proportion of even n-alkanes (E/O) increases relative to odd n-alkanes, which are markers of terrestrial vegetation (A/B index) (Figure 8b). Even n-alkanes reach a maximum concentration in a sample collected at the cliff level 5 m, which confirms the conclusion that this sample is more degraded. This is also in agreement with the Pr/C17 and Ph/C18 ratios, which showed the maximal values in sample “5” (Table 2). Conversely, OEP index increase over the cliff section, while Eh decrease (Figure 8c). The Σ(C17-C19)/Σ(C27-C31) ratio and C/D index, which characterize the relative content of low molecular weight n-alkanes that are markers of hydrobionts and bacterial activity [46,47], have low values compared with those for the bottom sediments of the Laptev Sea and other areas of the Eastern Arctic [45,46,48,49], and reach maximums in samples “11” and “21.5” (Table 2). Alongside, there is a positive correlation between these coefficients and the Ki index, which may indicate some contribution of marine OM (sample “5”, “11”) or intense bacterial activity in sediments (sample “21.5”).
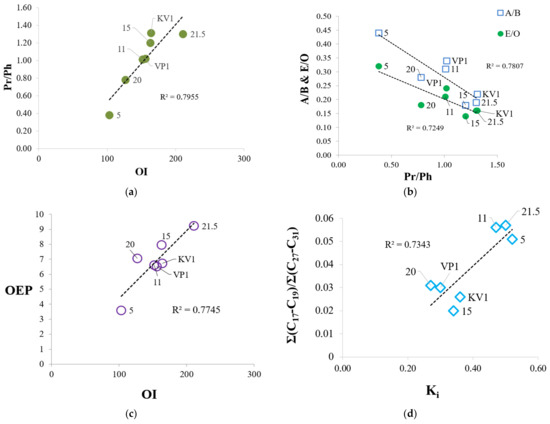
Figure 8.
Relationships between Rock Eval parameters and biomarker coefficients determined from GC-MS analysis: (a) Relationship between OI and Pr/Ph; (b) dependence of A/B and E/O parameters on Pr/Ph; (c) dependence between OEP oddness index and OI oxygen index; (d) relationship between proportion of low-molecular alkanes (Σ(C17-C19)/Σ(C27-C31)) and Ki index (Ki = (Pr + Ph)/(nC17 + nC18)).
According to the CLAC, aliphatic hydrocarbons and particularly the polar compounds predominate in the extractable part of the OM of the sediment samples. Aromatic compounds are present in a smaller amount and are completely missing in the sediment sample collected at the level 5 m. The maximum amount of insoluble residue and the minimum content of the polar fraction were detected on the samples collected from the cliff level 21.5 m and 5 m (Table S4). Alkenes were identified in all samples, except for the sample collected at the level of 5 m. The content of the alkenes is small and does not exceed 13% of the content of alkanes (Table 2). There are several hypotheses on the origin of alkenes in sediments, but the most common is the assumption of their biochemical nature (microbial activity, including the processing of allochthonous n-alkanes) [50,51,52,53] and another hypothesis of their formation as a result of the diagenetic reduction of the unsaturated fatty acids by cleavage of the carboxyl group [54], for example, this is actual for the C16–C20 alkenes, which were found in sediments of Lake Lugu (China) [55]. In our case, the distribution of alkenes is similar to that of the distribution of alkanes in all samples, favoring the first theory of their origin. On the other hand, the distribution of the monounsaturated fatty acids is completely different, with the predominance of the low molecular weight components, while in most samples (except 20 and 21.5) these acids are actually absent (Figure 9a,b). The content of organic carbon, its isotopic composition, CPI, OEP, and the concentration of n-alkanes are similar to [56], where a 31.5 m long core drilled on the Bykovsky Peninsula was studied. Only in the peat layer (21.5 m a.s.l.) is TOC much higher, and the concentration of n-alkanes is elevated in samples studied here. Similar values of the TOC, CPI, and δ13C were observed in [57].
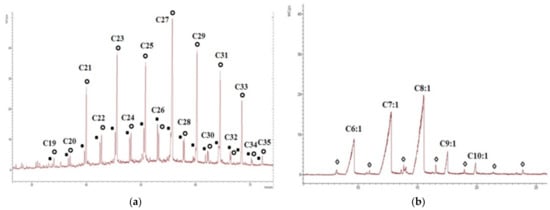
Figure 9.
Chromatograms of the aliphatic and polar fractions of the sample “21.5”: (a) The distribution of n-alkanes and n-alkenes in the aliphatic fraction (m/z 57), where black dots denote alkenes, open circles denote alkanes); (b) the distribution of monounsaturated fatty acids (m/z 73) in the polar fraction, where open rhombuses indicate the saturated fatty acids.
Also, it is worth noting the predominance of even n-alkenes in samples “11” and “15”, probably due to the additional contribution of marine OM [58]. In general, the concentrations of the alkanes and alkenes change accordingly with TOC, their minimum values fall on sample “5”. The complete absence of alkenes at the cliff level of 5 m suggested intense oxidation of the organic matter of this sample, probably as a result of fluctuations of sea level during the Holocene transgression (5000–4000) and, probably, mostly due to the surges phenomena at which sea level rises by 5–7 m [45]. These phenomena contributed to intensive oxidation and washing out of the OM in the sediment at this level. A small number of alkenes at the cliff levels of 11 m and 15 m (less than 1.5% relative to the content of alkanes) should also be noted. This may indicate the fact that at these levels, oxidation of the organic matter also occurred during transgression [45].
Interestingly, the distribution of terpenoids in the m/z 191 chromatogram (Figure 10) in all sediments of the Cape Muostakh do not contain the Ts, moretane, hop-17(21)-ene, hop-21(22)-ene, diplopterol, but it is enriched by unsaturated terpenoids (Table 3), as compared to the bottom sediments of the Laptev Sea, collected in the expedition in 2011 (Figure S7) [48]. However, at the same time, unknown hopenes Uh1, Uh2, Uh3 and hopane UH, identified in the sediments of the Muostakh cliff, were not found in the bottom sediments of the Laptev Sea [48]. Here it should also be noted that as well unlike the bottom sediments of the Laptev Sea, there is no relationship between the A/B and C/D parameters (Figure S8), which is evidence of the uneven accumulation of organic matter and strong different degrees of bacterial activity at the different cliff levels. Unsaturated terpenoids are completely missing at the cliff level 5 m, but only partially missing on 11 m and 15 m (there are Tm-ene, oleanen-18, oleanen-13(18), taraxerene, C31 homohopene, Uh1, Uh2, Uh3, neohop-13(18)-ene). The concentrations of the remaining terpenoids vary according to the TOC and have the minimal values at the levels of 5, 11, 15 m. Along with the absence of the alkenes this fact additionally suggest that the intensive oxidation of the organic matter occurred in the sediment on the cliff level of 5 m. To a lesser degree, this process occurred at the levels 11 m and 15 m, since part of the unsaturated compounds is preserved (Table 2). It is also worth noting that on the previously mentioned horizons, oxidized forms of triterpenoids are more common. We have found novel unknown C30 hopenes (Uh1, Uh2, and Uh3, Table 2, Figure S9) and an unknown hopane (UH, Table 2, Figure S9) in the aliphatic fraction of OM. The mass spectra of the hopenes Uh1, Uh2, Uh3, and hopane UH are shown in Figure S9. These hopenes are mainly present in the upper levels of the cliff (20 and 21.5 m). An interesting fact is the presence of the unidentified hopene Uh3 and hopane UH (Figure 10) only at the cliff level 20 m; in turn, α-tocopherol, is naturally found only in the upper peat layer (21.5 m), and the marker of angiosperm plants oleanane was found in both upper layers (20 and 21.5 m).
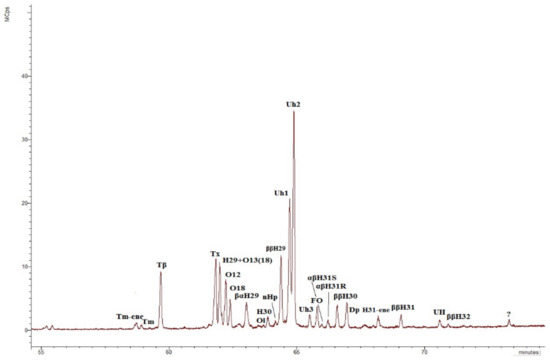
Figure 10.
Chromatogram m/z 191 of the aliphatic fraction of the sediment sample collected at the cliff level of 20 m. Tm-ene—17α(H)-22,29,30-tris-norhop-(17,21)-ene; Tm—17α(H)-22,29,30-trisnorhopane; Tβ—17β (H)-22,29,30-trisnorhopane; Tx –taraxerene (D:A-Friedolean-14-ene); H29—17α(H), 21β(H)-30-norhopane; O13(18)—olean-13(18)-ene; O12—olean-12-ene; O18—olean-18-ene; βαH29—17β(H), 21α (H)-30-norhopane (normoretane); Ol—oleanane; H30—17α(H), 21β(H) C30 hopane; nHp—neohop-13(18)-ene; ββH29—17β(H), 21β(H)-30-norhopane; Uh1—unidentified C30 hopene №1 (unknown hopene); Uh2—unidentified C30 hopene № 2 (unknown hopene); Uh3—unidentified C30 hopene №3 (unknown hopene); FO—D:A-Friedolean-6-ene; αβH31S and αβH31R—C31 17α(H), 21β(H) homohopanes 22S and 22R epimers, respectively; ββH30—C30 17β(H), 21β(H)-hopane; Dp—diploptene (C30 hop-22(29)-ene); H31-ene—C31 homohop-30-ene; ββH31—C31 17β(H), 21β(H)-homohopane; UH—unidentified hopane (unknown hopane); ββH32—C32 17β(H), 21β(H)-homohopane.
Alkylbenzenes found in the investigated sediments are mainly phenylalkanes (m/z 91, see Figure 11), and C16, C17 n-alkylbenzenes, and alkyltoluenes are also present in the sediments [59].
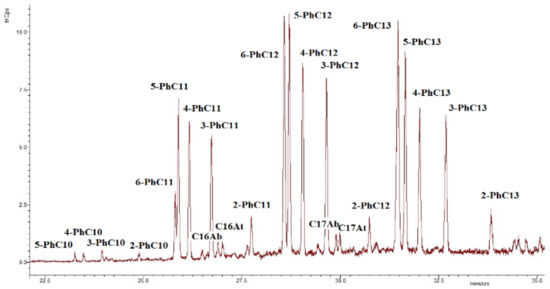
Figure 11.
The chromatogram m/z 91 of the aromatic fraction of the sediment sample collected at the debris cone zone (KV1). Ph—designation of the phenyl radical; Ab—designation of the alkylbenzene; At—designation of the alkyltoluene.
The origin of the phenylalkanes is probably related to the marine genesis (archaea [44]) or the bacterial genesis in the case of the sediment samples at the levels 20 and 21.5 m and the sediment sample of the debris cone [60,61]. On the other hand, we cannot exclude the anthropogenic factor [44,62,63]. It is seen that, along with relict alkylnaphthalenes (eudalene, cadalene, nor-cadalene), which are the products of the dehydrogenation of the sesquiterpenoids [64] or diagenetic aromatization of the carotenoids, and retene, which is the product of the diagenetic transformation of the higher terrestrial vegetation terpenoids [65], polyaromatic hydrocarbons (PAHs) of the petroleum origin are also present (Table 2) [63]. Their source is probably associated with the anthropogenic pollution [65,66,67] due to the relatively close sampling location of the Tiksi port (about 27 km) (Figure 1). The MPI index and methyldibenzothiophene (MDBT) index are characteristic for mature fossil fuel OM. The wave-cut niche contains a smaller set of these components and in lower amounts, but they are most fully represented at the levels of the cliff 11 and 15 m, which probably indicates a predominant air route of the input of these compounds into the sediments (pyrogenic source). In general, the concentrations of the oil PAHs are close to the background [67], except for the slight excess in the peat layer (21.5 m level). Note that at the cliff level of 5 m, aromatic compounds are completely missing, probably due to "washing out" one part of them from this level and binding of their second part (relict and pyrogenic aromatics) into the condensed insoluble part of the organic matter of the sediment (NEOC). Fatty acids were identified in the polar fractions of the most sediment samples, with a maximum on C16, which is characteristic for the terrigenous OM, but in the sample “VP1”, the distribution maximum falls on the C22 acid (Figure S10). In the distribution of the n-alcohols, the maximum occurs at C26, C28, and in the series of n-aldehydes at C24, C26 homologues (Figure S10). In the series of methylketones, homologues of C27 and C29 predominate (Figure S10). In the series of the monounsaturated n-fatty acids (MuFA), the maximum distribution occurs at C8 (Figure 9b). At the same time, MuFA are actually missing in the most samples, except for the upper levels of the cliff 20 and 21.5 m. Most likely, these low molecular weight MuFAs have a bacterial genesis. The source of the fatty acids and alcohols with dominance of C22–C24 homologues is usually marine biota, and the contribution of this source is clearly visible in the wave-cut niche zone. However, the main contribution, apparently, falls on the organic matter of the terrestrial vegetation [68]. n-Aldehydes with a maximum at C24 and C26 and methylketones with a maximum at C25, C27, and C29 originate from terrestrial vegetation (a products of biosynthesis) [69,70]. The source of methylketones can be microbial oxidation of alkanes [71,72], or as an alternative it can be beta-oxidation of the fatty acids followed by subsequent decarboxylation [73]. Methylketones in sediments can also be directly generated from vegetation and phytoplankton [74,75]. In our case, the distribution of methylketones has a difference compared to the distribution of n-alkanes due to the shift of the maximum to the high molecular region and is clearly different from the fatty acid distribution (Figure S11). Presumably, methylketones were directly generated from vegetation to the sediments, but a contribution from the microbial processing of alkanes is also likely. The minimum of their content (as well as other biomarkers) occurs at the cliff levels 5, 11, and 15 m. There is a slight shift to increase of the 6,10,14-trimethylpentadecan-2-one (Ik, see Table 2) content in the “5” sample compared to the "11". High molecular weight homologues predominate in the distribution of the methylketones and aldehydes, and this pattern is characteristic for all samples. Using the content of the aldehydes, alcohols, methylketones, and acids in the sediments, we can draw a conclusion about the different degree of diagenetic and erosion alteration along the cliff; we observed the fact that these compounds are depleted on the levels 5, 11, and 15 m. This indicates intense erosion processes affecting these levels. In particular, aldehydes are completely absent at the cliff level 5 m, which additionally indicates the more degraded organic matter. As more labile biomarkers, fatty acids (compared to the alkanes) were also used for determining the degree of the organic matter diagenetic transformation ([5] and references therein). Using the FA/alkane ratio we can evaluate this degree (Table 2). The minimum value of FA/alkanes ratio falls on the sediment samples “5” and “11”, and the maximum is for the sediments, collected from the top cliff levels, confirming that the organic matter on the 5 and 11 m cliff level are more transformed compared to the 20 and 21.5 m. The values of this parameter for all samples are low compared to those measured for surface sediments [5,15,76]. The ratio of high molecular weight (HMW) acids to HMW alkanes (HMWFA/HMWA) is even lower because the distribution of fatty acids does not correspond to the distribution of n-alkanes (Table 2, Figures S10–S12 for comparison) and HMWFA are present in rather small quantities. This indicates that all samples have a relatively high degree of diagenetic transformation of the organic matter. Next, we can point to the fact that the samples “5” and “11" are the most degraded, as can be clearly seen from Figure 12a,b, where a good correlation is shown between the parameters of the OM diagenetic maturity index (IDM) and the ratio of fatty acids to alkanes.
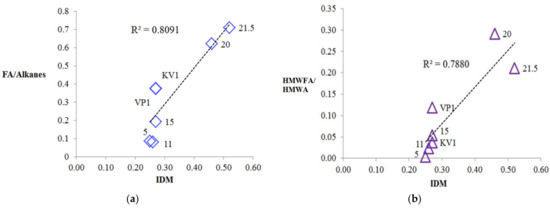
Figure 12.
Relationships between IDM index and indexes based on relation fatty acids to n-alkanes: (a) Correlation between IDM and FA/Alkanes ratio; (b) correlation between IDM and high molecular weight n-fatty acids (HMWFA)/high molecular weight n-alkanes (HMWA) ratio.
In general, the distribution of methylketones with maxima at C27 and C29 (Figures S10 and S11) is similar to that for peat samples [73] and this distribution pattern is characteristic for all studied samples. This may indirectly serve as evidence of the transfer of the organic material from the upper level of the cliff to the lower ones as a result of erosion processes. Furthermore, it could be the result of the organic matter input from the peat vegetation during the formation of these sediments [41,45]. It is interesting to note the actual missing of the even n-alcohols and n-aldehydes and the predominance of their high-molecular homologues in all the sediment samples.
3.3. Non-Extractable Organic Components (NEOC) of the Sediments
The pyrolysis–gas chromatography–mass spectrometry (Py-GC-MS) is a fast and reliable method for studying macromolecular organic components in sediments [31,32,33,34,77,78]. Using this method, we can obtain information about the composition of macromolecular organic components that are not extracted by organic solvents (NEOC– non-extractable organic compounds). NEOC contains macromolecular constituents such as lignin, proteins, cellulose, and their decomposition products [34]. The amount of NEOC in the sediments organic matter is much greater than that content of extractable one (Table 1, see the parameter S1 vs. S2, according to the Rock-Eval data).
The Py-GC-MS analysis is not assigned to identify all organic compounds in sediments but using this method it is possible to obtain new information on the composition of the insoluble OM to show the difference between samples [31]. Pyrolysis products contain hundreds of components, and the peaks of the most intense of them (see Figures S13–S19) are identified and summarized in Tables S5–S10. Pyrolysis products have a similar composition of the components with those analyzed in [3,31,39,40], but we also identified furan, benzofuran, pyrrole, indole, indene and their methyl derivatives, acids, alcohols, and other oxygen-containing compounds. A smaller number of components were formed during pyrolysis of the sample collected at the level 5 m. The pyrolysis products of the samples “20” and “21.5” comprise more oxygen-containing components compared with the other samples. The results of the calculation of the group composition of the pyrolysis products are given in Table 3.
A sample collected at the 5 m level of the cliff contains the greatest amount of the aromatic hydrocarbons (56.79%) in the pyrolysis products. This fact suggests that the NEOC in this sample is composed mainly of the condensed aromatic structures formed as a result of intensive oxidation of OM, while here it is important to note the actual missing of aromatic hydrocarbons in the extractable OM (see Table S4). At the levels 11 and 15 m, an increased content of aromatic hydrocarbons is also observed, which may indicate that erosion oxidation of the OM in these samples also occurred, but to a lesser extent as compared with sample “5”. Consequently, as a result of erosion alteration and diagenetic processes, aromatic hydrocarbons have passed into the insoluble part of the organic matter, as evidenced by the reverse trends between the content of the aromatic compounds (aromatic content determined by CLAC method and the sum of the identified aromatic compounds by GC-MS method) and the number of aromatic compounds released by the Py-GC-MS (Figure S20a,b). The relatively high content of the nitriles in these samples also indicates intense processes of the OM conversion. Sample “5” contains the lowest number of phenols (markers of the terrigenous plant OM), which also were probably “washed out” during the wave and wind erosion effects on this level of the cliff. Furfurals, which are the products of the destruction of the polysaccharides, are missing at the level 5 m, whereas another minimum of their content falls on 15 m. Alkylbenzenes are distributed relatively evenly in the section of the cliff. The maximum of their content falls on the sample of the debris cone (“KV1”). It should be noted that only sulfur-containing components, benzothiophene and dibenzothiophene, are present at the cliff level 5 m. This is additional evidence of a greater diagenetic transformation of the 5 m level sediment, since no sulfur compounds were found in the extractable organic matter of this sample. While all sulfur in other samples remained in the extractable part of the OM, in sediment from level of 5 m, part of the sulfur passed into stable structural fragments of insoluble organic matter, such as benzothiophene and dibenzothiophene. The presence of these compounds may indicate older deposits at the cliff level of 5 m compared to the rest along the cliff section. In the pyrolysis products of the upper-layer cliff samples, terpenoid components were detected. The lipid components (alkanes, alkenes, acids, alcohols) naturally increase to the upper levels of the cliff closer to the peat layer but are also enriched in wave-cut sample. Cycloalkanes (-alkenes) have a maximum in the samples collected at the cliff level 20 m, while their absence in the peat layer (21.5 m) is noteworthy. Cyclopentenones (and furanes) are the products of the polysaccharide pyrolysis ([32,34] and references therein). The maximum content of cyclopentenones is observed at the cliff levels 11 and 15 m. Furanes and other oxygen-containing compounds are distributed relatively evenly and reach a maximum in the wave-cut zone. All of these changes in NEOC composition testify to the uneven accumulation of the OM (various conditions of its accumulation) and the varying degree of the influence of external factors on the OM during its formation and preservation. Relatively good correlations are observed between the composition of the Py-GC-MS pyrolysis products and the Rock-Eval parameters (Table 4, Figure 13a–d). Using the Phenol/Pyridine ratio from Py-GC-MS, we can conclude that the sediment sample “5” is "less terrigenous" compared to the others, which is consistent with GC-MS and RE data (see Figure 8b,d). We can also indicate a positive trend between the content of aromatic hydrocarbons and the isotopic composition of the sediments (Figure S21). The reverse tendency was observed for high-molecular DOM (dissolved organic matter) in the Mississippi river plume [32].

Table 4.
The group composition of the Py-GC-MS pyrolysis products and parameters of the Rock-Eval analysis of sediment samples.
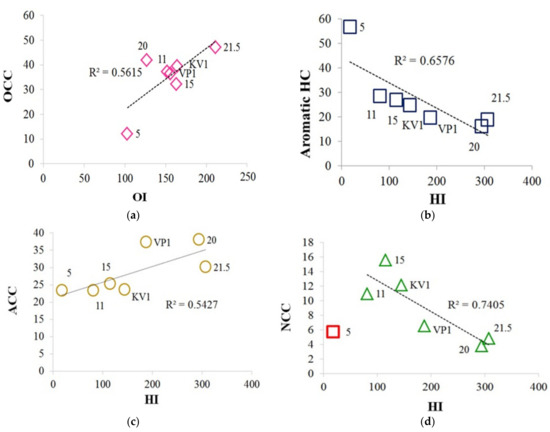
Figure 13.
Correlations between the composition of the Py-GC-MS pyrolysis products and the Rock-Eval parameters: (a) Relationship between the oxygen-containing compounds (OCC) and the oxygen index (OI); (b) relationship between the content of the aromatic HC and the hydrogen index (HI); (c) relationship between the aliphatic-containing compounds (ACC) and the hydrogen index (HI); (d) relationship between the nitrogen-containing compounds (NCC) and the hydrogen index (HI); sample “5” falls out from the trend.
3.4. Analysis of the Results by the Principal Component Method
The data characterizing the Cape sediments, obtained by various analytical methods, were subjected to the principal component analysis (PCA), giving two main components (PC1 and PC2). As can be seen from Figure 14a, samples of the debris cone (“KV1”) and the peat layer (21.5 m) are located separately from the group of other samples (“5”, “11”, “15”, “20”, “VP1”) on the graph. It can be assumed that the erosion processes of the coast affected the OM of the peat layer and the debris cone in the less degree, and it may also be important that the debris cone sample represent a mixture of upper and lower horizons, so erosion processes could affect its organic matter to an uneven degree (Figure 14a). According to the data analysis, the main loadings in PCs correspond to the results of determining the composition of the soluble part of the organic matter (lipids) using the GC-MS method, particularly the components of the polar fraction. If we only consider the results of the pyrolytic methods of analysis (methods that characterize mainly NEOC), we will see a slightly different picture (Figure 14b).
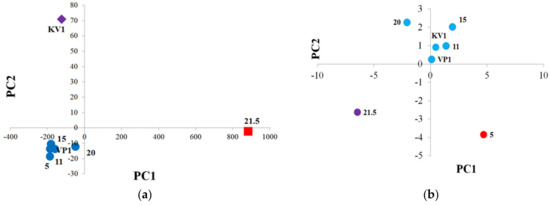
Figure 14.
PCA of the sediment samples of the Cape Muostakh: (a) PCA with including all parameters—purple rhombus means sample "KV1", red square means sample "21.5", other samples are marked with dark blue circles (“5”, “11”, “15”, “20”, “VP1”); (b) PCA with including only the results of the pyrolytic methods of analysis—purple circle means sample "21.5", red circle means sample "5", other samples are marked with blue circles (“11”, “15”, “20”, “VP1”, “KV1”).
In such a case, apart from the main group of the samples, “21.5” and “5” are already located on the graph separately. This is probably due to the fact that the OM of the peat layer is more “fresh” (less transformed), and the OM of the sample collected from the level 5 m was most subjected to external environmental influences, i.e., more transformed. In this case, the loads of the model are distributed approximately evenly over the investigation parameters, most of which are related to the data of the Py-GC-MS analysis. Further, we can note that sample “20” is somewhat separated from the “KV1”, “VP1”, “5”, “11”, “15” group of samples, due to its characteristic composition of the insoluble part of the OM (closer to the peat layer sample).
4. Conclusions
Sediment materials selected from the outcrops of the Cape Muostakh (Laptev Sea coast) were characterized by different physicochemical methods. For the coast sediments in the Arctic region, a detailed description of the mineralogical composition of the samples was given; the qualitative and quantitative composition of soluble and insoluble organic matter was studied, and changes in these compositions during the diagenetic transformation of the sediments were related to the erosional destructive processes of the Laptev Sea coast. OM of the samples selected from the cliff of the Cape Muostakh showed a different degree of the diagenetic transformation. The most transformed OM due to the erosion processes is located at the cliff levels 5 and 11 m. The organic matter of the peat layer of the cliff is less diagenetically transformed. The different content of the organic matter in section of the Cape Muostakh cliff is the result of both processes, which are the different conditions of material sedimentation and the erosion processes of cliff destruction. As a result of the thermodenudation and thermoerosion processes, OM from the levels 5 m and 11 m “migrated” to the underlying cliff layers and to the wave-cut zone. OM of the 5 m cliff level does not contain alkenes and aromatic compounds in its soluble part as a result of their transition into the insoluble part, in which, according to the pyrolytic chromatography-mass spectrometry analysis (Py-GC-MS), the content of aromatic components is the greatest. This is attributed to intense erosion processes on the coast of the Cape Muostakh, which caused that part of the sediment material to have “slipped” into the underlying horizons (and mixed with them), and the rest was strongly transformed by diagenetic processes. The area of the debris cone and the section of the peat layer of the cliff are less affected by diagenetic transformation (as well as erosion influence). Aromatic components were found in most of the outcrop sediments. Some of these compounds have a vegetation and pyrogenic source and many of them are presumably associated with the anthropogenic input. Also, the range of the terpenoids was identified in the sediments. Some of them found in the Laptev Sea bottom sediment are missing in the Muostakh sediments. It is important to note that unsaturated terpenoids along with alkenes were actually absent at the cliff level 5 m, so that is the additional evidence of the intense erosion treatment processes of this sediment material. Novel unidentified C30 hopanoids were found mainly in the upper layers of the cliff. In general, the concentrations of most compounds increase to the top of the cliff (to the 20 and 21.5 m). Unusual correlations between mineralogical composition and total organic carbon were found. We observe a positive trend between TOC and plagioclase and negative trend TOC relative to the illite in clay composition. This fact may indicate that organic matter predominantly accumulated on large debris particles by river runoff.
Supplementary Materials
The following are available online at https://www.mdpi.com/2076-3263/11/2/83/s1, Figure S1: Rock-Eval pyrograms of the sample «20». The red line corresponds to the oven heating curve. The blue line (a) is the flame ionization detector signal (mV) in the analysis process. The pink line (b) is the signal from the infrared cell that detects the amount of CO and CO2; Figure S2: Rock-Eval pyrograms of the sample «20». The red line on pyrograms corresponds to the oven heating curve. The green and pink lines are the signals from the infrared cell that detects the amount of CO and CO2; Figure S3: Relationship between TOC and plagioclase content in mineralogical composition; Figure S4: Relationship between TOC and Illite content in the clay (size) fraction; Figure S5: Relationship between hydrogen index (HI) and TOC. Sample “21.5” falls out from the trend; Figure S6: Molecular weight distribution of n-alkanes (sample “KV1”). Scheme for calculating A/B and C/D parameters is shown. (a) A, the sum of n-alkane peaks on the even envelope (highlighted in blue); B, the sum of the peaks of high-molecular n-alkanes, which are markers of land plants, on the odd envelope—C23, C25, C27, C29, C31, C33, C35 (highlighted in green). (b) C, the sum of the peaks of low-molecular n-alkanes on the even envelope C14–C18 (highlighted in purple); D, the sum of the peaks of high-molecular n-alkanes on the even envelope C19–C34 (highlighted in yellow); Figure S7: Chromatogram m/z 191 of the Laptev Sea sediments collected in 2011year expedition (non-polar fraction of the total lipid extract). Ts—18α(H)-22, 29, 30-trisnorneohopane; Tm-ene—17α(H)-22, 29, 30-trisnorhop-(17,21)-ene; Tm—17α(H)-22, 29, 30-trisnorhopane; Tβ—17β(H)-22, 29, 30-trisnorhopane; H29—17α(H), 21β(H)-30-norhopane; Hp17—C30 hop-17(21)-ene; Hp21—hop-21(22)-ene; βαH29—17β(H), 21α(H)-30-norhopane (normoretane); Ol—oleanane; H30—17α(H), 21β(H) C30 hopane; nHp—C30 neohop-13(18)-ene; ββH29—17β(H),21β(H)-30-norhopane; M—17β(H), 21α(H)-hopane (moretane); C30 hopene—unknown C30 hopene; FO—D:A-friedolean-6-ene; αβH31S i αβH31R—C31 17α(H), 21β(H) homohopanes 22S and 22R epimers respectively; ββH30—C30 17β(H), 21β(H)-hopane; Diploptene—(C30 hop-22(29)-ene); Hp21—C30 hop-21(22)-ene; αβH32S and αβH32R—C32 17α(H), 21β(H) bishomohopanes 22S and 22R epimers respectively; ββH31—C31 17β(H), 21β(H)-homohopane, Diplopterol—hopane-22-ol; Figure S8:Absence of correlation between A/B and C/D parameters for the studied sediments; Figure S9: Mass spectra of the unidentified triterpenoids; Figure S10: Distribution of the various biomarkers in the polar fraction of the sample collected in the zone of the wave-cut niche (VP1): (a) distribution of the fatty acids (m/z 60); (b) distribution of the alcohols (m/z 83); (c) distribution of the aldehydes (m/z 82); (d) distribution of the methylketones (m/z 59); Figure S11: Comparison of the distributions of n-alkanes (a, m/z 57), methylketones (b, m/z 59) and fatty acids (c, m/z 60) for the “KV1” sample. Here we can observe the certain similarities between distributions of n-alkanes and the methylketones (slight shift to the high-molecular area in the methylketones distribution), but there is no resemblance between fatty acids distribution and the methylketones distribution. Ik is the 6,10,14-trimethylpentadecan-2-one; Figure S12: TIC chromatogram of the aliphatic fraction of the sample «15». n-Alkanes are labeled according to the number of carbon atoms in the molecule. Pr—pristane, Ph—phytane; Figure S13: Pyrogram of the total ion current (TIC) of the “KV1” sample. The numbers indicate the component peaks. (Identification is given in Table S5); Figure S14: Pyrogram of the total ion current (TIC) of the “VP1” sample. The numbers indicate the component peaks. (Identification is given in Table S5); Figure S15: Pyrogram of the total ion current (TIC) of the “5” sample. The numbers indicate the component peaks. (Identification is given in Table S6); Figure S16: Pyrogram of the total ion current (TIC) of the “11” sample. The numbers indicate the component peaks. (Identification is given in Table S7); Figure S17: Pyrogram of the total ion current (TIC) of the “15” sample. The numbers indicate the component peaks. (Identification is given in Table S8); Figure S18: Pyrogram of the total ion current (TIC) of the “20” sample. The numbers indicate the component peaks. (Identification is given in Table S9); Figure S19: Pyrogram of the total ion current (TIC) of the “21.5” sample. The numbers indicate the component peaks. (Identification is given in Table S10); Figure S20: Relationship between different parameters which characterize aromatic hydrocarbons distribution in sediments: (a) Relationship between relative content of the aromatic hydrocarbons (Aromatic HC) determined by Py-GC-MS analysis and yield of the aromatic fraction, determined by CLAC (AF); (b) interrelation between Aromatic HC and the sum of the identified aromatic compounds in the extractable OM (ACEOM). Peat sample (21.5) falls out from the general trend; Figure S21: Relationship between relative content of the aromatic hydrocarbons (Aromatic HC) determined by Py-GC-MS and isotopic composition (δ13C) of the samples; Figure S22: TIC chromatogram of the aromatic fraction of the sample «15». P—phenanthrene, MP—methylphenanthrene, DMP—dimethylphenanthrene; Re—retene; TrP—triphenylene; Figure S23: TIC chromatogram of the «polar» fraction of the sample «15». «C16» (for example) means number of the carbon atoms in the molecule: FA—fatty acid; Alc—alcohol; Mk—methylketone; Table S1: Characteristics of the samples from the Cape Muostakh, Bykovsky Peninsula; Table S2: The results of X-ray diffraction analysis of bulk sediment; Table S3: The results of X-ray diffraction analysis. (Clay component analysis); Table S4: The yields of fractions obtained by column liquid-adsorption chromatography (CLAC); Table S5: Components identified by the Py-GC-MS in samples “KV1” and “VP1”; Table S6: Components identified by the Py-GC-MS in sample “5”; Table S7: Components identified by the Py-GC-MS in sample “11”; Table S8: Components identified by the Py-GC-MS in sample “15”; Table S9: Components identified by the Py-GC-MS in sample “20”; Table S10: Components identified by the Py-GC-MS in sample “21.5”.
Author Contributions
A.A.G.—conceptualization, investigations, methodology, visualization, verification, writing, and manuscript preparation; I.V.G.—supervision, conceptualization, project administration, and methodology; I.P.S., N.E.S., and A.K.M.—conceptualization, project administration, resources, and funding; A.G.Z.—formal analysis and data curation; M.V.S.—XRD mineralogical analysis and investigations; N.V.O.—investigations, methodology, and verification; E.V.G.—visualization and funding; A.S.R.—collection and preparation of samples and conceptualization; M.A.V.—stable isotope analysis of organic carbon (δ13C); O.V.D.—organization of expedition and project coordination. All authors have read and agreed to the published version of the manuscript.
Funding
This research was funded by the Tomsk Polytechnic University Competitiveness Enhancement Program (VIU-OG-215/2020).
Institutional Review Board Statement
Not Applicable.
Informed Consent Statement
Not Applicable.
Data Availability Statement
The data presented in this study are available in Supplementary Materials.
Acknowledgments
The authors are grateful to Ivan V. Goncharov and Alexey K. Mazurov for organizing Arctic research at Tomsk Polytechnic University, ideas, methodological support, which was an invaluable contribution to this research. We also wish to thank Stanislav S. Novikov and the team of the laboratory of geochemistry and reservoir oils of JSC “TomskNIPIneft” for technical and methodology support. Authors thank three anonymous reviewers for their constructive comments, which led to significant improvement of the manuscript.
Conflicts of Interest
The authors declare no conflict of interest.
References
- Hugelius, G.; Strauss, J.; Zubrzycki, S.; Harden, J.W.; Schuur, E.A.G.; Ping, C.-L.; Schirrmeister, L.; Grosse, G.; Michaelson, G.J.; Koven, C.D.; et al. Estimated stocks of circumpolar permafrost carbon with quantified uncertainty ranges and identified data gaps. Biogeosciences 2014, 11, 6573–6593. [Google Scholar] [CrossRef]
- Semiletov, I.; Pipko, I.; Gustafsson, Ö.; Anderson, L.G.; Sergienko, V.G.; Pugach, S.; Dudarev, O.; Charkin, A.; Gukov, A.; Bröder, L.; et al. Acidification of East Siberian Arctic Shelf waters through addition of freshwater and terrestrial carbon. Nat. Geosci. 2016, 9, 361–365. [Google Scholar] [CrossRef]
- Tesi, T.; Semiletov, I.; Hugelius, G.; Dudarev, O.; Kuhry, P.; Gustafsson, O. Composition and fate of terrigenous organic matter along the Arctic land−ocean continuum in East Siberia: Insights from biomarkers and carbon isotopes. Geochim. Cosmochim. Acta 2014, 133, 235–256. [Google Scholar] [CrossRef]
- Tesi, T.; Semiletov, I.; Dudarev, O.; Andersson, A.; Gustafsson, Ö. Matrix association effects on hydrodynamic sorting and degradation of terrestrial organic matter during cross-shelf transport in the Laptev and East-Siberian shelf seas. J. Geophys. Res. Biogeosci. 2016, 121, 731–752. [Google Scholar] [CrossRef]
- Bröder, L.; Tesi, T.; Salvado, J.A.; Semiletov, I.P.; Dudarev, O.V.; Gustafsson, Ö. Fate of terrigenous organic matter across the Laptev sea from the mouth of the Lena River to the deep sea of the Arctic interior. Biogeosciences 2016, 13, 5003–5019. [Google Scholar] [CrossRef]
- Bröder, L.; Tesi, T.; Andersson, A.; Semiletov, I.; Gustafsson, Ö. Bounding the role of cross-shelf transport and degradation in land-ocean carbon transfer. Nat. Commun. 2018, 9, 806. [Google Scholar] [CrossRef]
- Vonk, J.E.; Sánchez-García, L.; van Dongen, B.E.; Alling, V.; Kosmach, D.; Charkin, A.; Semiletov, I.P.; Dudarev, O.V.; Shakhova, N.; Roos, P.; et al. Activation of old carbon by erosion of coastal and subsea permafrost in Arctic Siberia. Nature 2012, 489, 137–140. [Google Scholar] [CrossRef]
- Grigoriev, M.N.; Vasiliev, A.A.; Rachold, V. Siberian Arctic Coasts: Sediment and Organic Carbon Fluxes in Connection with Permafrost Degradation, 2004 Fall Meeting; American Geophysical Union: St. Francisco, CA, USA, 2004; Volume 85. [Google Scholar]
- Semiletov, I.P. Destruction of the coastal permafrost ground as an important factor in biogeochemistry of the Arctic Shelf waters. Trans. (Dokl.) Russ. Acad. Sci. 1999, 368, 679–682. [Google Scholar]
- Solomon, S.; Qin, D.; Manning, M.; Chen, Z.; Marquis, M.; Averyt, K.B.; Tignor, M.; Miller, H.L. (Eds.) Climate Change 2007: The Physical Science Basis; Cambridge University Press: Cambridge, UK, 2007. [Google Scholar]
- Fritz, M.; Vonk, J.; Lantuit, H. Collapsing Arctic coastlines. Nat. Clim. Chang. 2017, 7, 6–7. [Google Scholar] [CrossRef]
- Günther, F.; Overduin, P.; Baranskaya, A.; Opel, T.; Grigoriev, M. Observing Muostakh Island disappear: Erosion of a ground-ice-rich coast in response to summer warming and sea ice reduction on the East Siberian shelf. Cryosphere 2013, 7, 4101–4176. [Google Scholar]
- Günther, F.; Overduin, P.; Sandakov, A.V.; Grosse, G.; Grigoriev, M.N. Short- and long-term thermo-erosion of ice-rich permafrost coasts in the Laptev Sea region. Biogeosciences 2013, 10, 4297–4318. [Google Scholar] [CrossRef]
- Are, F.E. Thermo-Abrasion of Sea Coasts; Nauka: Moscow, Russia, 1980; 159p. (In Russian) [Google Scholar]
- Karlsson, E.S.; Charkin, A.; Dudarev, O.; Semiletov, I.; Vonk, J.E.; Sanchez-Garcia, L.; Andersson, A. Carbon isotopes and lipid biomarker investigation of sources, transport, and degradation of terrestrial organic matter in the Buor-Khaya Bay, SE Laptev sea. Biogeosciences 2011, 8, 1865–1879. [Google Scholar] [CrossRef]
- Strauss, J.; Schirrmeister, L.; Mangelsdorf, K.; Eichhorn, L.; Wetterich, S.; Herzschuh, U. Organic matter quality of deep permafrost carbon—A study from Arctic Siberia. Biogeosciences 2015, 12, 2227–2245. [Google Scholar]
- Kusch, S.; Winterfeld, M.; Mollenhauer, G.; Höfle, S.T.; Schirrmeister, L.; Schwamborn, G.; Rethemeyer, J. Glycerol dialkyl glycerol tetraethers (GDGTs) in high latitude Siberian permafrost: Diversity, environmental controls, and implications for proxy applications. Org. Geochem. 2019, 136, 103888. [Google Scholar] [CrossRef]
- Polyakov, V.; Abakumov, E.V. Humic acids isolated from selected soils from the Russian Arctic and Antarctic: Characterization by two-dimensional 1H- 13C HETCOR and 13C CP/Mas NMR Spectroscopy. Geosciences 2020, 10, 15. [Google Scholar] [CrossRef]
- Lodygin, E.D.; Beznosikov, V.A.; Vasilevich, R.S. Molecular composition of humic substances in tundra soils (13C-NMR spectroscopic study). Eurasian Soil Sci. 2014, 47, 400–406. [Google Scholar] [CrossRef]
- Zherebker, A.; Podgorski, D.C.; Kholodov, V.; Orlov, A.A.; Yaroslavtseva, N.V.; Kharybin, O. The molecular composition of humic substances isolated from yedoma permafrost and alas cores in the eastern Siberian Arctic as measured by ultrahigh resolution mass spectrometry. J. Geophys. Res. Biogeosci. 2019, 124, 2432–2445. [Google Scholar] [CrossRef]
- Heslop, J.K.; Winkel, M.; Walter Anthony, K.M.; Spencer, R.G.M.; Podgorski, D.C.; Zito, P.; Kholodov, A.; Zhang, M.; Liebner, S. Increasing organic carbon biolability with depth in Yedoma permafrost: Ramifications for future climate change. J. Geophys. Res. Biogeosci. 2019, 124, 2021–2038. [Google Scholar] [CrossRef]
- Yershov, E. (Ed.) Geocryology of the USSR; Nedra: Moscow, Russia, 1989; pp. 1–5. [Google Scholar]
- Grigoriev, M.N.; Kunitsky, V.V.; Chzhan, R.V.; Shepelev, V.V. On the variation in geocryological, landscape and hydrological conditions in the Arctic zone of East Siberia in connection with climate warming. Geogr. Nat. Resour. 2009, N2, 5–12. [Google Scholar] [CrossRef]
- Schirrmeister, L.; Schwamborn, G.; Overduin, P.P.; Strauss, J.; Fuchs, M.C.; Grigoriev, M. Yedoma Ice Complex of the Buor Khaya Peninsula. Biogeosciences 2017, 14, 1261–1263. [Google Scholar] [CrossRef]
- Bish, D.L.; Post, J.E. Quantitative mineralogical analysis using the Rietveld fullpattern fitting method. Am. Mineral. 1993, 78, 932–940. [Google Scholar]
- Taylor, J.C. Computer programs for standardless quantitative analysis of minerals using the full powder diffraction profile. Powder Diffract 1991, 6, 2–9. [Google Scholar] [CrossRef]
- Hillier, S. Quantitative analysis of clay and other minerals in sandstones by X-ray powder diffraction (XRPD). Int. Assoc. Sedimentol. Spec. Publ. 2003, 34, 213–251. [Google Scholar]
- Lafargue, E.; Marquis, F.; Pillot, D. Rock-Eval 6 Applications in hydrocarbon exploration, production, and soil contamination studies. Oil Gas Sci. Technol. 1998, 53, 421–437. [Google Scholar] [CrossRef]
- Behar, F.; Beaumont, V.; Penteado, H.L.B. Rock-Eval 6 Technology: Performance and Developments. Oil Gas Sci. Technol. 2001, 56, 111–134. [Google Scholar] [CrossRef]
- Stapel, J.G.; Schwamborn, G.; Schirrmeister, L.; Horsfield, B.; Mangelsdorf, K. Substrate potential of last interglacial to Holocene permafrost organic matter for future microbial greenhouse gas production. Biogeosciences 2018, 15, 1969–1985. [Google Scholar] [CrossRef]
- Guo, L.; Semiletov, I.; Gustafsson, Ö.; Ingri, J.; Andersson, P.; Dudarev, O.; White, D. Characterization of Siberian Arctic coastal sediments: Implication for terrestrial organic carbon export. Glob. Biogeochem. Cycles 2004, 18. [Google Scholar] [CrossRef]
- Guo, L.; White, D.M.; Xu, C.; Santschi, P.H. Chemical and isotopic composition of high-molecular -weight dissolved organic matter from the Mississippi River plume. Mar. Chem. 2009, 114, 63–71. [Google Scholar] [CrossRef]
- White, D.; Beyer, L. Pyrolysis-gas chromatography/mass spectrometry and pyrolysis-gas chromatography/flame ionization detection analysis of three Antarctic soils. J. Anal. Appl. Pyrolysis 1999, 50, 63–76. [Google Scholar] [CrossRef]
- Sparkes, R.B.; Selver, A.D.; Gustafsson, Ö.; Semiletov, I.P.; Haghipour, N.; Wacker, L.; Eglinton, T.I.; Talbot, H.M.; van Dongen, B.E. Macromolecular composition of terrestrial and marine organic matter in sediments across the East Siberian Arctic Shelf. Cryosphere 2016, 10, 2485–2500. [Google Scholar] [CrossRef]
- Chuvilin, E.M.; Bukhanov, B.A.; Tumskoy, V.E.; Shakhova, N.E.; Dudarev, O.V.; Semiletov, I.P. Thermal conductivity of bottom sediments in the region of Buor-Khaya Bay (Shelf of the Laptev Sea). Earth Cryosphere 2013, 17, 32–40. [Google Scholar]
- Pizhankova, E.I. Thermodenudation in the coastal zone of the Lyakhovsky Island (interpretation of aerospace images). Earth Cryosphere 2011, 15, 61–70. [Google Scholar]
- Tumskoy, V.E. Peculiarities of cryolithogenesis in Northern Yakutia (middle Neopleistocene to Holocene). Earth Cryosphere 2012, 16, 12–21. [Google Scholar]
- Grigoriev, M.N.; Kunitsky, V.V. Ice complex of the Arctic coasts of Yakutia as a sediment source on the continental shelf. In Hydrometeorological and Biogeochemical Research in the Arctic Region; Vladivostok Dalnauka Press, Arctic Regional Centre: Vladivostok, Russia, 2000; Volume 2, pp. 109–116. [Google Scholar]
- Melenevskii, V.N.; Leonova, G.A.; Konyshev, A.S. The organic matter of the recent sediments of Lake Beloye, West Siberia (from data of pyrolytic studies). Russ. Geol. Geophys. 2011, 52, 583–592. [Google Scholar] [CrossRef]
- Melenevskii, V.N.; Saraev, S.V.; Kostyreva, E.A.; Kashirtsev, V.A. Diagenetic transformation of organic matter of the Holocene Black Sea sediments according to pyrolysis data. Russ. Geol. Geophys. 2017, 58, 225–239. [Google Scholar] [CrossRef]
- Slagoda, E.A. Cryolithogenic Deposits of the Laptev Sea Coastal Plain: Lithology and Micromorphology; Publishing and Printing Centre «Express»: Tyumen, Russia, 2004; 119p. (In Russian) [Google Scholar]
- Galimov, E.M.; Kodina, L.A. Study of Organic Matter and Gases in Sedimentary Strata of the World Ocean; Nauka Press: Moscow, Russia, 1982; 228p. (In Russian) [Google Scholar]
- Goncharov, I.V. Oil Geochemistry in West Siberia; Nauka Press: Moscow, Russia, 1987; 125p. (In Russian) [Google Scholar]
- Peters, K.E.; Walters, C.C.; Moldowan, J.M. The Biomarker Guide, 2nd ed.; Part I, Biomarkers and Isotopes in the Environmental and Human History and Part II Biomarkers and Isotopes in Petroleum Exploration and Earth History; Cambridge University Press: Cambridge, UK, 2005. [Google Scholar]
- Dudarev, O.V.; Charkin, A.N.; Shakhova, N.E.; Mazurov, A.K.; Semiletov, I.P. Modern Litomorphogenesis on the Eastern Arctic Shelf of Russia; Tomsk Polytechnic University Press: Tomsk, Russia, 2016; 192p. [Google Scholar]
- Petrova, V.I.; Batova, G.I.; Kursheva, A.V.; Litvinenko, I.V. Geochemistry of organic matter of bottom sediments in the rises of the central Arctic Ocean. Russ. Geol. Geophys. 2010, 51, 88–97. [Google Scholar] [CrossRef]
- Van Dongen, B.E.; Semiletov, I.P.; Weijers, J.W.H.; Gustafsson, Ö. Contrasting lipid biomarker composition of terrestrial organic matter exported from across the Eurasian Arctic by the five great Russian Arctic rivers. Glob. Biogeochem. Cycles 2008, 22. [Google Scholar] [CrossRef]
- Grinko, A.A.; Goncharov, I.V.; Shakhova, N.E.; Gustafsson, Ö.; Oblasov, N.V.; Romankevich, E.A.; Zarubin, A.G.; Kashapov, R.S.; Chernykh, D.V.; Gershelis, E.V.; et al. Sediment organic matter in areas of intense methane release in the Laptev Sea: Characteristics of Molecular Composition. Russ. Geol. Geophys. 2020, 61, 456–477. [Google Scholar]
- Vetrov, A.A.; Romankevich, E.A. The Organic Carbon Cycle in the Russian Arctic Seas; Springer: Berlin, Germany, 2004; 331p. [Google Scholar]
- Damste, J.S.S.; Rijpstra, W.I.S.; Coolen, M.J.L.; Schouten, S.; Volkman, J.K. Rapid sulfurization of highly isoprenoid (HBI) alkenes in sulfidic Holocene sediments from Ellis Fjord, Antarctica. Org. Geochem. 2007, 38, 128–139. [Google Scholar] [CrossRef]
- Wakeham, S.G.; Damste, J.S.S.; Kohnen, M.E.L.; de Leeuw, J.W. Organic sulfur compounds formed during early diagenesis in Black Sea sediments. Geochim. Cosmochim. Acta 1995, 59, 521–533. [Google Scholar] [CrossRef]
- Fubara, E.P.; Ekpo, B.O.; Ekpa, O.D.; Marynowski, H.L. Predominances and source implications of even n-alkenes in surface sediments from coastal areas of Niger Delta, Nigeria. Int. J. Basic Appl. Sci. 2012, 12, 68–79. [Google Scholar]
- Grimalt, J.O.; Albaigés, J. Characterization of the depositional environments of the Ebro Delta (western Mediterranean) by the study of sedimentary lipid markers. Mar. Geol. 1990, 95, 207–224. [Google Scholar] [CrossRef]
- Volkman, J.K.; Barrett, S.M.; Blackburn, S.I.; Mansour, M.P.; Sikes, E.L.; Gelin, F. Microalgal biomarkers: A review of recent research developments. Org. Geochem. 1998, 29, 1163–1179. [Google Scholar] [CrossRef]
- Zhang, Y.; Su, Y.; Liu, Z.; Chen, X.; Yu, J.; Di, X.; Jin, M. Long-chain n-alkenes in recent sediment of Lake Lugu (SW China) and their ecological implications. Limnologica 2015, 52, 30–40. [Google Scholar]
- Jongejans, L.L.; Mangelsdorf, K.; Schirrmeister, L.; Grigoriev, M.N.; Maksimov, G.M.; Biskaborn, B.K.; Grosse, G.; Strauss, J. N-alkane characteristics of thawed permafrost deposits below a thermokarst lake on Bykovsky peninsula, Northeastern Siberia. Front. Environ. Sci. 2020. [Google Scholar] [CrossRef]
- Sanchez-Garcia, L.; Vonk, J.E.; Charkin, A.N.; Kosmach, D.; Dudarev, O.V.; Semiletov, I.P.; Gustafsson, Ö. Characterization of three regimes of collapsing Arctic Ice Complex Deposits on the SE Laptev Sea Coast using biomarkers and dual carbon isotopes. Permafr. Periglac. Process. 2014, 25, 172–183. [Google Scholar] [CrossRef]
- Gelpi, E.; Oró, J.; Shcneider, H.J.; Bennett, E.O. Olefins of high molecular weight in two microscopic algae. Science 1986, 161, 700–702. [Google Scholar] [CrossRef]
- Antipenko, V.R. Thermal Transformations of High-Sulfur Natural Asphaltite: Geochemical and Technological Aspects; Nauka Press: Novosibirsk, Russia, 2013; 184p. (In Russian) [Google Scholar]
- Ellis, L.; Langworthy, T.A.; Winans, R.E. Occurrence of phenylalkanes in some Australian crude oils and sediments. Org. Geochem. 1996, 24, 57–69. [Google Scholar] [CrossRef]
- Ellis, L.; Winans, R.E.; Langworthy, T.A. Biological sources for phenylalkane hydrocarbons. In Proceedings of the 212th ASC National Meeting, Orlando, FL, USA, 25–30 August 1996. [Google Scholar]
- Eganhouse, R.P. Long-chain alkylbenzenes: Their analytical chemistry, environmental occurrence and fate. Int. J. Enviromental Anal. Chem. 1986, 26, 241–263. [Google Scholar] [CrossRef]
- Wakeham, S.G.; Schaffner, C.; Giger, W. Polycyclic aromatic hydrocarbons in Recent lake sediment—I. Compounds having anthropogenic origins. Geochim. Cosmochim. Acta 1980, 44, 403–413. [Google Scholar] [CrossRef]
- Bendoraitis, J.G. Hydrocarbon of Biogenic Origin in Petroleum-Aromatic Triterpenes and Bicyclic Sesquiterpenes; Tissot, B., Biener, F., Eds.; Editions Technip; Advances in Organic Geochemistry: Paris, France, 1974; pp. 209–224. [Google Scholar]
- Wakeham, S.G.; Schaffner, C.; Giger, W. Polycyclic aromatic hydrocarbons in Recent lake sediment—II. Compounds derived from biogenic precursors during early diagenesis. Geochim. Cosmochim. Acta 1980, 44, 415–429. [Google Scholar]
- Marinovski, L.; Pieta, M.; Janeczek, J. Composition and source of polycyclic aromatic compounds in deposited dust from selected sites around the Upper Silesia, Poland. Geol. Q. 2004, 48, 169–180. [Google Scholar]
- Petrova, V.I.; Batova, G.I.; Kursheva, A.V.; Litvinenko, I.V.; Savinov, V.M.; Savinova, T.N. Geochemistry of polycyclic aromatic hydrocarbons in the bottom sediments of the eastern Arctic shelf. Oceanology 2008, 48, 196–203. [Google Scholar] [CrossRef]
- Fukushima, K.; Ishiwatari, R. Acid and alcohol compositions of wax esters in sediments from different environments. Chem. Geol. 1984, 47, 41–56. [Google Scholar] [CrossRef]
- Prahl, F.G.; Pinto, L.A. A geochemical study of long-chain n-aldegydes in Washington coastal sediments. Geochim. Cosmochim. Acta 1987, 51, 1573–1582. [Google Scholar] [CrossRef]
- Guang-Guo, Y.; Pu, F. Origin of ketones in sediments of Qinghai Lake. Sci. China Chem. 1993, 36, 237–241. [Google Scholar]
- Volkman, J.K.; Gillan, F.T.; Johns, R.B.; Eglinton, G. Sources of neutral lipids in a temperate intertidal sediment. Geochim. Cosmochim. Acta 1981, 45, 1817–1828. [Google Scholar] [CrossRef]
- Cranwell, P.A.; Egliton, G.; Robinson, N. Lipids of aquatic organisms as potential contributors to lacustrine sediments. Org. Geochem. 1987, 11, 513–527. [Google Scholar] [CrossRef]
- Hernandez, M.E.; Mead, R.; Peralba, M.C.; Jaffe, R. Origin and transport of n-alkane-2-ones in a subtropical estuary: Potential biomarkers for seagrass-derived organic matter. Org. Geochem. 2001, 32, 21–32. [Google Scholar] [CrossRef]
- Wenchuan, Q.; Dickman, M.; Sumin, W.; Ruijin, W.; Pingzhong, Z.; Jianfa, C. Evidence for an aquatic plant origin of ketones found in Taihu Lake sediments. Hydrobiologia 1999, 397, 149–154. [Google Scholar] [CrossRef]
- Rieley, G.; Collier, R.J.; Jones, D.M.; Eglinton, G. The biogeochemistry of Ellesmere Lake, U.K.-I: Source correlation of leaf wax inputs to the sedimentary lipid record. Org. Geochem. 1991, 17, 901–912. [Google Scholar] [CrossRef]
- Vonk, J.E.; Sánchez-García, L.; Semiletov, I.; Dudarev, O.; Eglinton, T.; Andersson, A.; Gustafsson, Ö. Molecular and radiocarbon constraints on sources and degradation of terrestrial organic carbon along the Kolyma paleoriver transect, East Siberian Sea. Biogeosciences 2010, 7, 3153–3166. [Google Scholar] [CrossRef]
- Xu, C.; Guo, L.; Dou, F.; Ping, C.-L. Potential DOC production from size-fractionated Arctic tundra soils. Cold Reg. Sci. Technol. 2009, 55, 141–150. [Google Scholar] [CrossRef]
- Sparkes, R.B.; Dogrul Selver, A.; Bischoff, J.; Talbot, H.M.; Gustafsson, Ö.; Semiletov, I.P.; Dudarev, O.V.; van Dongen, B.E. GDGT distributions on the East Siberian Arctic Shelf: Implications for organic carbon export, burial and degradation. Biogeosciences 2015, 12, 3753–3768. [Google Scholar] [CrossRef]
Publisher’s Note: MDPI stays neutral with regard to jurisdictional claims in published maps and institutional affiliations. |
© 2021 by the authors. Licensee MDPI, Basel, Switzerland. This article is an open access article distributed under the terms and conditions of the Creative Commons Attribution (CC BY) license (http://creativecommons.org/licenses/by/4.0/).