Article

Development of a New Type of Geodiversity System for the Scoria Cones of the Chaîne des Puys Based on Geomorphometric Studies

by
Fanni Vörös
1,2,*,
Márton Pál
1,
Benjamin van Wyk de Vries
3 and
Balázs Székely
4
1
Doctoral School of Earth Sciences, ELTE Eötvös Loránd University, Pázmány P. sétány 1/C, H-1117 Budapest, Hungary
2
Institute of Cartography and Geoinformatics, ELTE Eötvös Loránd University, Pázmány P. sétány 1/A, H-1117 Budapest, Hungary
3
Laboratoire Magmas et Volcans, Observatoire du Physique du Globe de Clermont, Université Clermont, Auvergne, IRD, UMR6524-CNRS, 63178 Aubiere, France
4
Department of Geophysics and Space Science, ELTE Eötvös Loránd University, Pázmány P. sétány 1/C, H-1117 Budapest, Hungary
*
Author to whom correspondence should be addressed.
Geosciences 2021, 11(2), 58; https://doi.org/10.3390/geosciences11020058
Submission received: 30 December 2020 / Revised: 24 January 2021 / Accepted: 25 January 2021 / Published: 29 January 2021
(This article belongs to the Special Issue Geomorphology, Geoheritage, Geoparks and Geotourism in Volcanic Areas)

Abstract

:
The aesthetic beauty of a landscape is an integral value reflected in artistic inspiration. Science, in contrast, tries to quantify the landscape using various methods. Of these, geodiversity indices have been found to be a useful approach, and this geomorphological diversity is characterized through derivatives made from digital terrain models (DTM). While these methods are useful, they have a drawback that the value of some landscape features may be underestimated if they have regular forms. For example, the aesthetic and scientific attractiveness of our study area, the Chaîne des Puys (Auvergne, France), a UNESCO World Heritage site, is strongly related to the distinctive small volcanoes, but despite being an outstanding element of the landscape, the scoria cones do not stand out well in geodiversity indices. This is because they have almost symmetrical conical forms and regular slopes that score low in the available geodiversity methods. We explore this problem and investigate how to overcome the low geodiversity performance of these distinctive landscape elements. We propose a modified approach for scoria cones using the normal input layers but adapted to the cone geometry. The modified indices are easy to compute and consider the uniformity and symmetry of larger landscape elements that form scientifically integral and aesthetically vital components of the landscape. The method is applicable to the tens of thousands of small monogenetic volcanoes in the hundreds of volcanic fields around the world, and could be extended to other volcanic features, such as domes. It would be possible to use the method to study larger volcanoes, as they often share and replicate the small-scale monogenetic morphology considered here.

1. Introduction

If a person is asked about their opinion on a certain natural environment, such as a view of a landscape, many aspects may arise in their answer. These aspects will depend on their previous experience and their cultural and social background. Some landscape environments will be considered as pleasant for many, whereas certain features would be preferred as a matter of this preformed taste. Because of this personal, cultural vision, many philosophers, aesthetes, and researchers of various disciplines have tried to formulate general properties of landscape that “measure” the beauty of the environment. Despite many efforts, it is still a matter of debate as to what descriptors should be used to categorize landscape quality. Some decades ago, in an attempt to bring order and quantify landscape, geoscientists developed the quantitative approach of geodiversity (the process is presented in, for example, Gray [1]). This is an analogue of the well-known and heavily researched biodiversity.
In most of the various geodiversity approaches [2,3,4,5], the evaluation requires the integration of many data types concerning the geomorphology, hydrology, paleontology, and pedology of the area in question.
Initial geodiversity methods followed those of biodiversity by establishing a manual table of features, with factors such as relief, soils, surface water, and landscape structure (anthropic intervention) [1,2]. This approach has been complemented by more quantitative methods, which seek to include all aspects of the lithosphere (e.g., abiotic). In general, many subindices of geodiversity are calculated at a certain scale, and even though the result can be considered useful, the procedure cannot be generalized to achieve an all-round, world-wide applicability, because of the varying resolution of the input layers.
A hierarchical approach has been developed using points (or particles), elements, places and landscapes [3], to move towards a geodiversity index that links soil, hydrology, geomorphology, and landscape in one value. Geological survey data have been used [4] to incorporate aspects such as lithological, paleontological, mineralogical, and hydrogeological diversity into the index. It has been acknowledged that specific geological/geomorphological features may be undervalued with the quantitative methods, such as river features, that tend to be broad, flat, or smooth features, and so may not have a large topographic imprint. This problem can be overcome in the Amazon basin by developing targeted geodiversity factors to include into the index [5], an approach that is developed here for volcanic cones.
This particular reason for the unsuccessful generalization is clearly related to the geometry of the landforms. Certain elements of the landscape, such as cliffs, wind-blown forms, canyons created by continuous erosion, etc., are very characteristic landforms, but they are very different in terms of geomorphometry [1,5]. Even if they are generally considered as highlights of the landscape, there are so many differences in the various factors that their individuality can be missed during quantification.
Their intrinsic geometric nature of such landforms should be included if we want to achieve a high geodiversity score for all features that are significant. In a nutshell, some features, due to the symmetry and smoothed forms (e.g., Figure 1a), are undervalued when irregularity and roughness factor weigh strongly. The diversity of symmetry needs also to be taken into account, as does smoothness, when it is related to the continuity of a distinct landform.
Volcanic edifices (stratovolcanoes, scoria cones and other volcanic structures) are often considered as landmarks, and iconic features. In certain countries where active or dormant volcanoes characterize the area (e.g., in Japan, Indonesia, and South America), it is clear that these geometric forms, with their various symmetries, define the backbone of the aesthetic value of the landscape. Even in low-relief countries (e.g., Hungary, Czech Republic, Poland) where remnants of volcanic edifices serve as landmarks in the flat surroundings, they are often related to vineyards and other agricultural and cultural features. Thus, the touristic value of these geological/geomorphic features is very high (Figure 1b). A volcanic field with many volcanoes arranged in specific patterns, such as our study area the Chaîne des Puys (Auvergne, France), has additional value to be preserved, that is partly why this area has been selected as a UNESCO World Heritage Site.
A site that has so much to offer to visitors would be expected to perform well in geodiversity assessments. However, this is not the case here: the components that are used in the index calculations have typically low or even zero values, so in contrast they do not result in high index scores.
This observation led us to study the possibilities of developing some subindices to explore and bring out the formerly hidden geodiversity of such features. Our previous geomorphometric studies on scoria cones [7,8] resulted in descriptive values that can be used as components of geodiversity (e.g., [1]). For the subindices, we consider the symmetry of the edifices scoring for the specific volcanic shape as well as the asymmetry of certain scoria cones that is considered as an increase in geodiversity. The spatial arrangement of the cones adds further variability, and this is also taken into consideration in the design of the scoring.
We consider this research as a pilot project to improve the performance of indices, and further study areas should be considered and tested to tailor the geomorphometric derivatives to achieve a valuable and overall representation of the full geodiversity.

2. Materials and Methods

2.1. Geodiversity Overview

Natural heritage is one of the most important renewable resources of the Earth. The biotic and abiotic components form the ecosystem that support our existence, and the landscape is the stage where it all happens (Murray Gray, pers. comm.). The concept of biological diversity or biodiversity became a matter of debate in the 1980s [9,10,11]. The definition formed during the Rio Summit of 1992 is used by the UN Convention on Biological Diversity, describing biodiversity as ‘the variability among living organisms from all sources including, inter alia, terrestrial, marine and other aquatic ecosystems and the ecological complexes of which they are part; this includes diversity within species, between species and of ecosystems’ [12]. Due to the complex geological, geomorphological and soil features of abiotic nature, the term ‘geodiversity’ was introduced. Gray [1] defined it as ‘the natural range (diversity) of geological (rocks, minerals, fossils), geomorphological (landform, processes) and soil features. It includes their assemblages, relationships, properties, interpretation and systems’. After some refinements (e.g., [3,13]), Gray [14] added that geodiversity is considered as the backbone of geoheritage, valuing abiotic nature, and geoconservation and shows a strong connection to modern society. The Chaîne des Puys has been recognized as an area of great geodiversity (e.g., [15]).
Quantitative geodiversity assessment models have evolved with the concept of geodiversity. They mainly use cartographic and spatial database sources to calculate an index score of an evaluated area [2,3,4,5]. In most cases, national coverage data sources were available to the authors. These types of data are mainly processed with various GIS software products.
Importantly, these methods have been mainly used on large territories with mostly small-scale spatial information (e.g., coarse national datasets). Due to this, smaller geodiversity elements (e.g., individual landforms) have been missed from the evaluation. Our aim was to solve this issue, concentrating on the case of volcanic fields with scoria cones.

2.2. Scoria Cones and Their Role in the Landscape

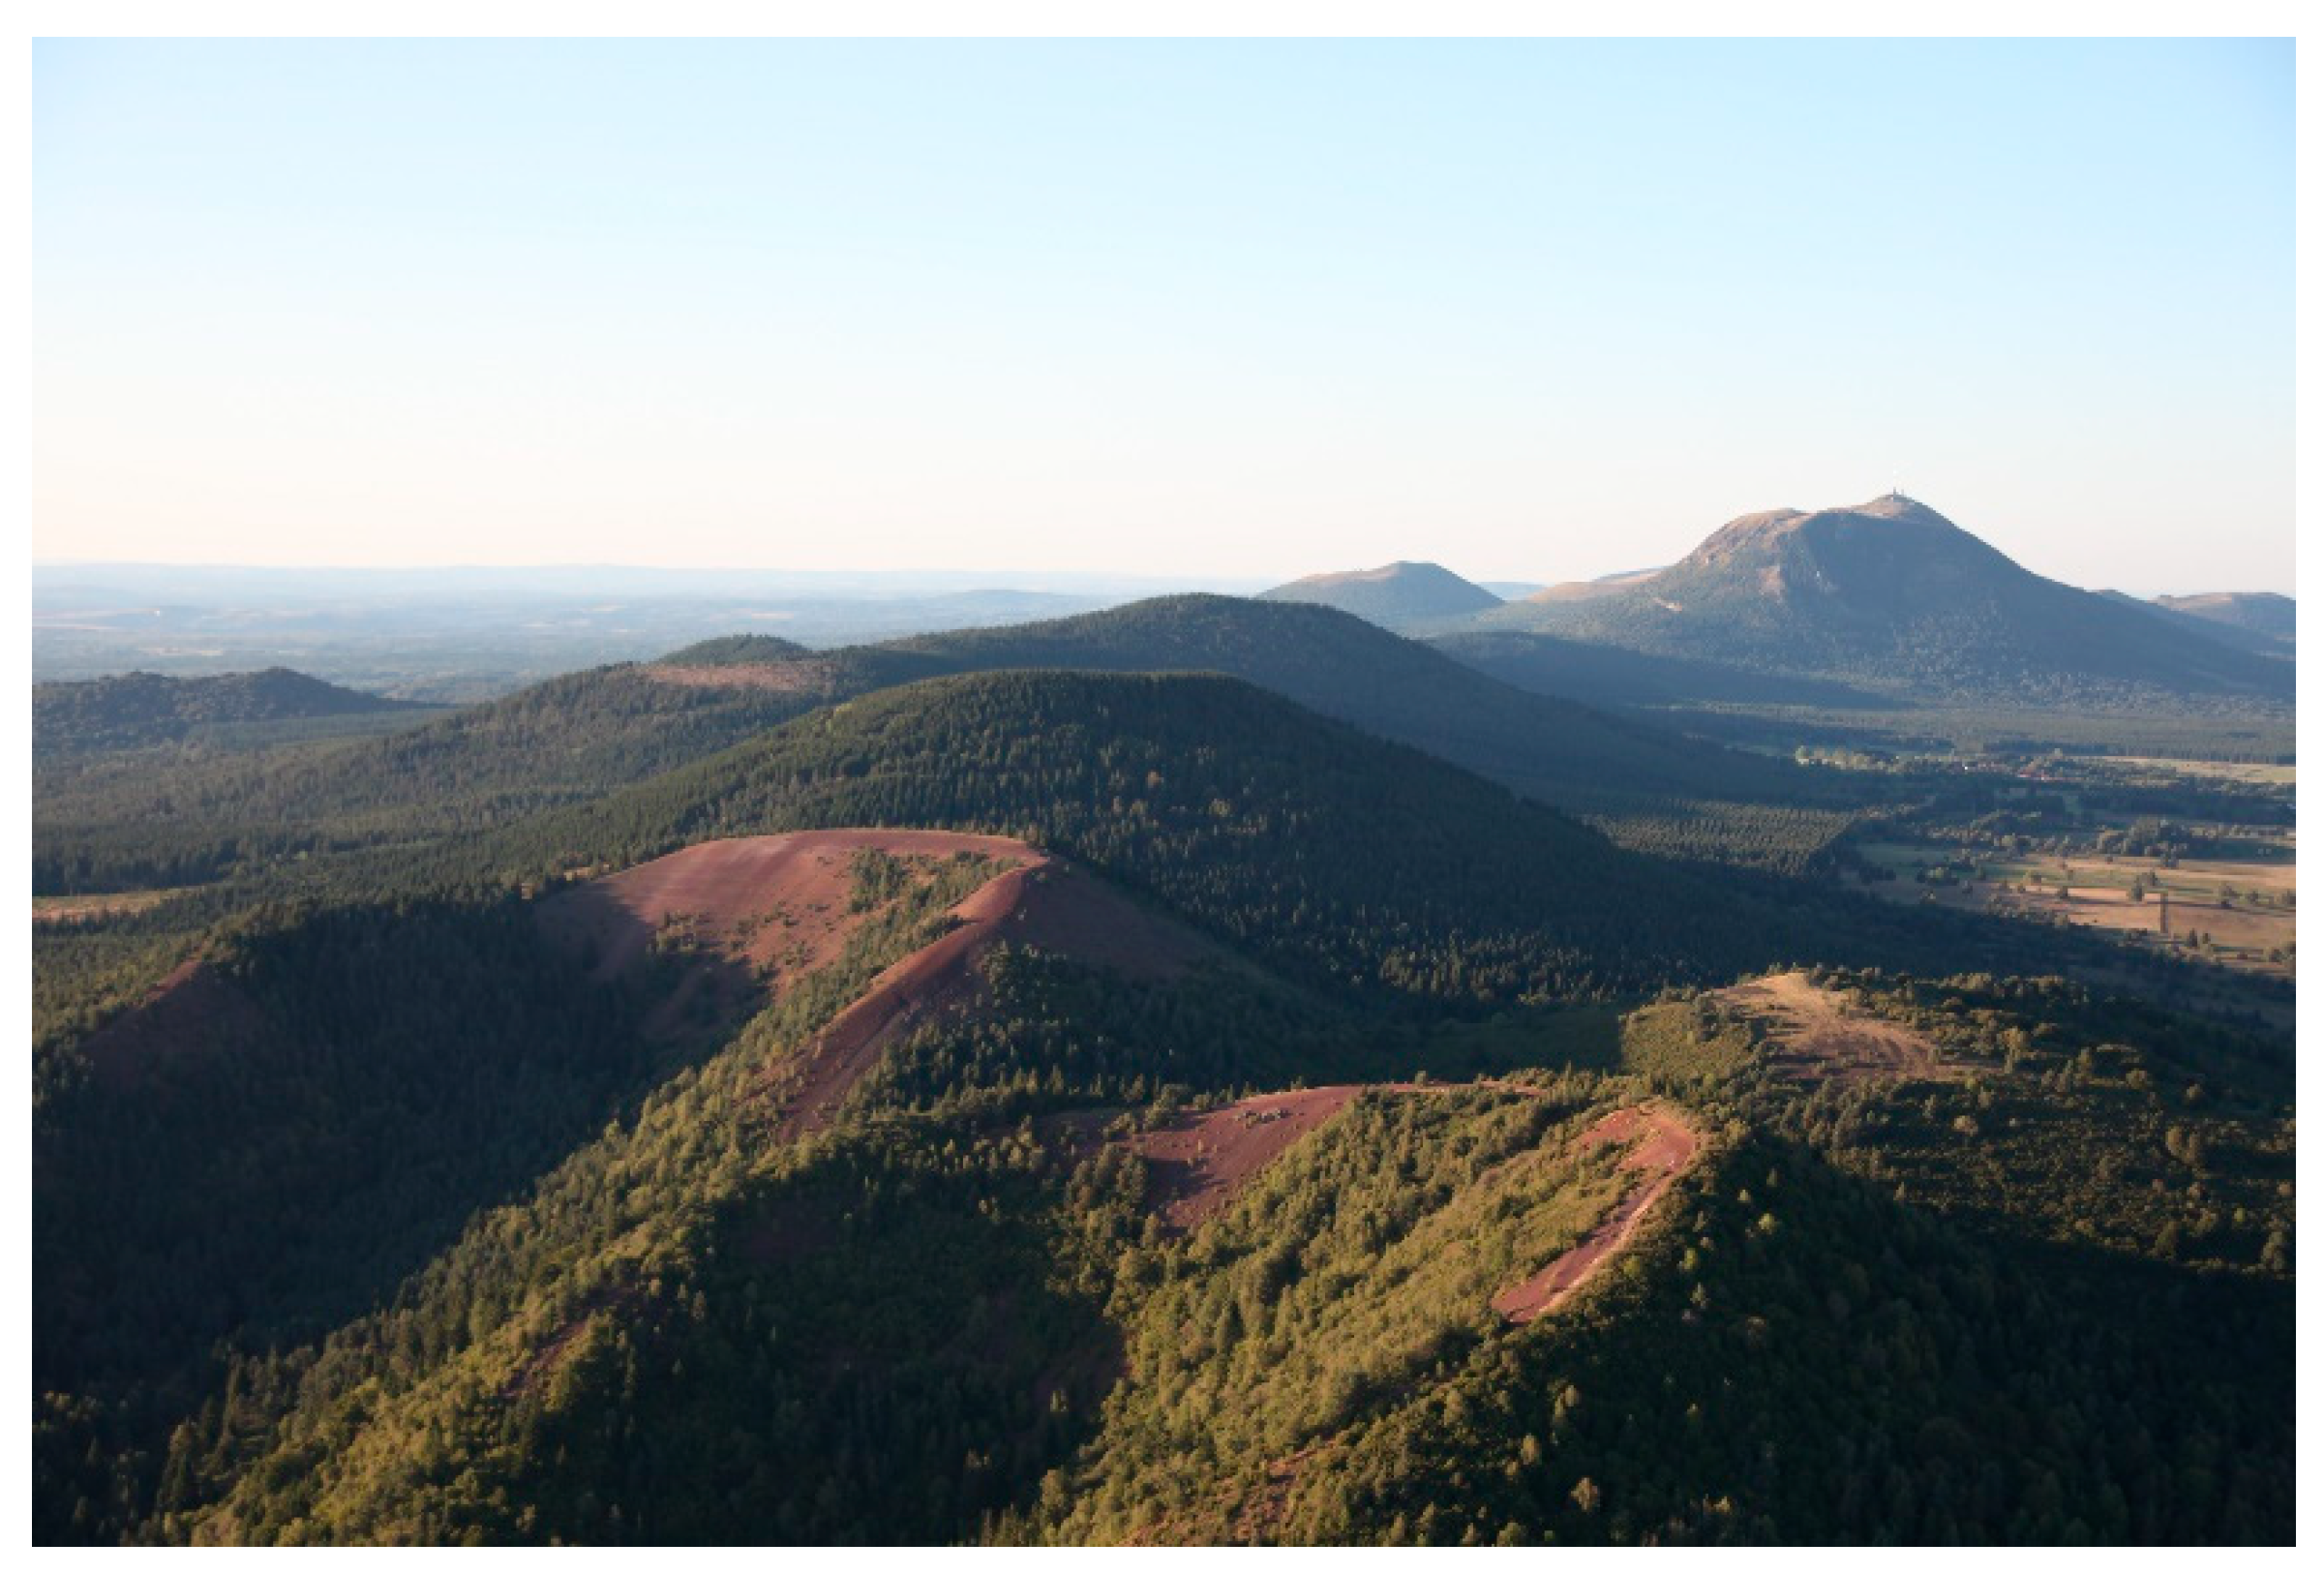
Scoria cones are the most basic and smallest [16,17] volcanic structures. They are mostly made of scattered pyroclastic fragments, thrown out during explosions from one or more craters. Larger fragments fall, roll down and accumulate on the slopes, while smaller ones can be carried by the wind before settling. Cones also grow from the inside, by magma intrusion [18], and effuse lava flows that often lead to breached craters [19]. The great majority of scoria cones are monogenetic forms: they erupt once, and during that eruption the entire volcanic structure is formed, then they go extinct. They are relatively small, usually 30–300 m high, but some can reach a height of up to 700 m, with a maximum diameter of a few hundred meters [20]. Their average slope angle is 20–30°, which decreases with the age of the cone (Figure 2). The youngest and simplest, ‘ideal’ cones are approximately regular, near circular and symmetrical shapes. Any kind of asymmetry can be caused by volcanic processes (e.g., lava flows, different types of explosion) and post-eruptive effects (e.g., erosion). In addition, asymmetry may come from irregularities of the eruption geometry—for example, if it is formed along a fissure, or due to prior slopes or prevailing winds. In this case, the cone itself will be intact but will be elongated, elliptical at the base.

2.3. Previous Geomorphometric Studies on Scoria Cones

Colton’s work [21] was a seminal paper on volcanic scoria cone areas. In his pioneering work, he classified the basalt cones and lava flows of the San Francisco Volcanic Field into different classes based on the extent of their destruction and weathering. Porter [20] identified volcanic parameter relationships of morphometric significance as a result of research in Hawaii (including fresh scoria cones from Mauna Kea), which were later used for several comparative analyses in other areas.
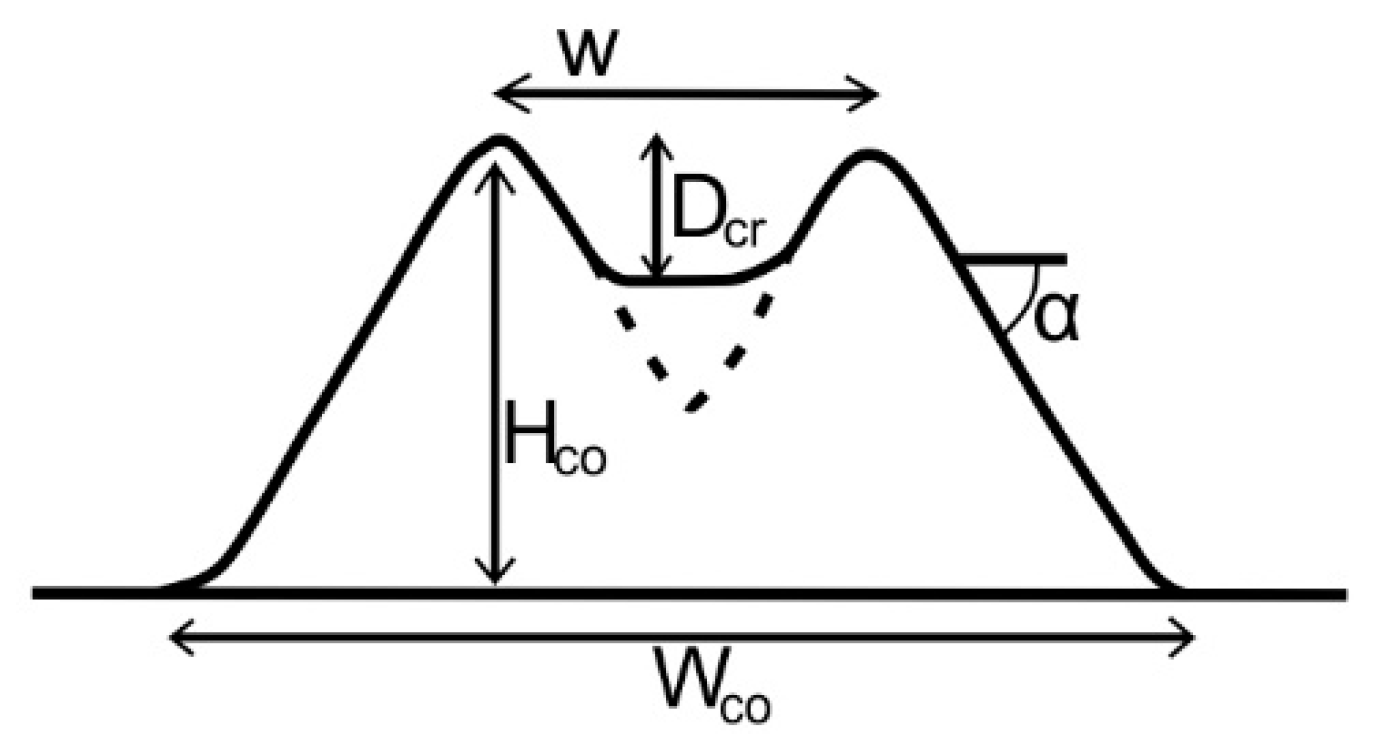
Settle examined parameters of six volcanic areas (Mauna Kea-Hawaii, Mount Etna-Italy, Kilimanjaro-Tanzania, San Francisco Volcanic Field (SFVF)-Arizona, Paricutín-Mexico, Nunivak Island-Alaska), including average volume, cone height, and diameter [22]. Comparative studies similar to Porter’s were conducted by Wood [16,17], and remain milestones in volcanic morphometry. Extensive geometric measurements were performed on the scoria cones of the San Francisco Volcanic Field to demonstrate that simple morphological studies could infer the approximate age of the cones. Wood studied the destruction processes of cones, which are either erosion or other mass movements. After studying several volcanic areas similar to the San Francisco Volcanic Field (Nevada, Oregon, Italy, Réunion), he claimed that the cone height (Hco), height-to-diameter (Wco) ratio, and slope angles (α) decrease over time, while the ratio of crater diameter (Wcr) to cone diameter (Wco) (Figure 3) does not change with decay. In 1976, the United States Geological Survey (USGS) began geothermal exploration in Arizona. In doing so, more than 650 volcanic cones were distinguished by Tanaka et al. [23] in the San Francisco Volcanic Field. The paleomagnetism of the scoria cones was investigated, age determination was made by the K/Ar method, and petrological and stratigraphic studies were done. During these studies, the migration of volcanic activity was determined. They also studied the possible pattern of the location of the cones in the area and the volume of erupted material. Using these studies, the San Francisco Volcanic Field was compared with six other volcanic areas, and the motion of the North American Plate was also inferred. Following Wood, major comparative morphometric studies were performed by Hooper and Sheridan [24]. Surface erosion processes were modeled on an ideal scoria cone. Their modeling was based on the following parameters: height, height to diameter ratio (Hco/Wco), crater depth to crater diameter ratio (Hcr/Wcr), and cone slope angle. According to them, the basis of relative age determination with comparative morphology is the study of morphological parameters that continuously decrease over time. Tibaldi [25] analyzed the relationships between the morphology and spatial distribution of pyroclastic cones and tectonics, with the help of aerial stereophotos, topographic maps and field measurements.
From the 2000s, digital terrain models (DTM) became the bases for morphometric research. With the help of these, Favalli and co-authors [26] examined the parameter changes due to lava flows in scoria cone fields and stated that the height of scoria cones settling on a volcanic slope (layered or shield volcano side) should be calculated differently. Fornaciai et al. [27] examined the parameters of 21 volcanic areas with 2, 10, and 30 m resolution DTMs.

2.4. The Chaîne des Puys

The Chaîne des Puys (CdP) is located in central Auvergne, near Clermont-Ferrand (France), in the south of the Massif Central. There are about 100 eruption centers in this predominantly Quaternary scoria cone area. There are 48 distinct scoria cones, 8 lava domes, and 15 maars are distributed in a north–south direction over a distance of about 40 km. Older cones are covered by younger ones, and there are a few outlying vents. Basalt, trachybasalt, and trachyandesite cones can be found in the area, and the domes are predominantly trachyte. The basement geology of the area of the Chaîne des Puys dates back over 360 million years, with rift-related volcanism starting about 20 million years ago, whereas the Chaîne des Puys volcanism is young: the youngest scoria cone is ~7000 years old, while the oldest is ~100,000 years [28].
Twenty-six scoria cones were processed in this study—they are located around Puy de Dôme, which is the highest volcano in the area. Its formation was caused by the eruption of a lava dome from a shallow intrusion 10,800 years ago [29,30,31]. Fully developed in terms of tourism, the top can be attained by foot or with a cog railway. The summit is a touristic site offering numerous entertainment and edutainment services such as paragliding or visiting the Clermont Observatory of Terrestrial Physics, and a museum for the roman settlement of the site.

2.5. LiDAR Data

One of the most accurate methods of surface mapping and terrain modeling is laser scanning based on Light Detection and Ranging (LiDAR) technology; this uses a pulsed laser light (UV, visible or near-infrared wavelength) and then determines its distance from the instrument. LiDAR owes its very good resolution to the short wavelength of light relative to radar. Altitude data (reaching decimeter accuracy by proper post-processing) are most easily generated using a laser scanner installed on an aircraft. The global positioning system (GPU) and inertial measurement unit (IMU) on board measure the route, spatial and temporal coordinates, and attitude of the aircraft. Very often, an accuracy of ~10 m in the field is not enough: real-time kinematic (RTK) GPS was created for this purpose. Users can acquire centimeter-level position accuracy in real time with the help of carrier-phase differential GPS positioning [32]. Through the processing of the positional and attitude data, the trajectory of the aircraft is reconstructed; consequently, the 3-D coordinates of the reflecting target are determined using the instantaneous position of the aircraft and the source-to-target two-way travel time (TWT). The processing results in a point cloud, containing the calculated positions of all reflecting targets, including the canopy, built structures, and, in the case of dense imaging, some points of the ground surface in areas covered with vegetation. With proper post-processing filtering of the point cloud, the ground surface can also be reconstructed [33].
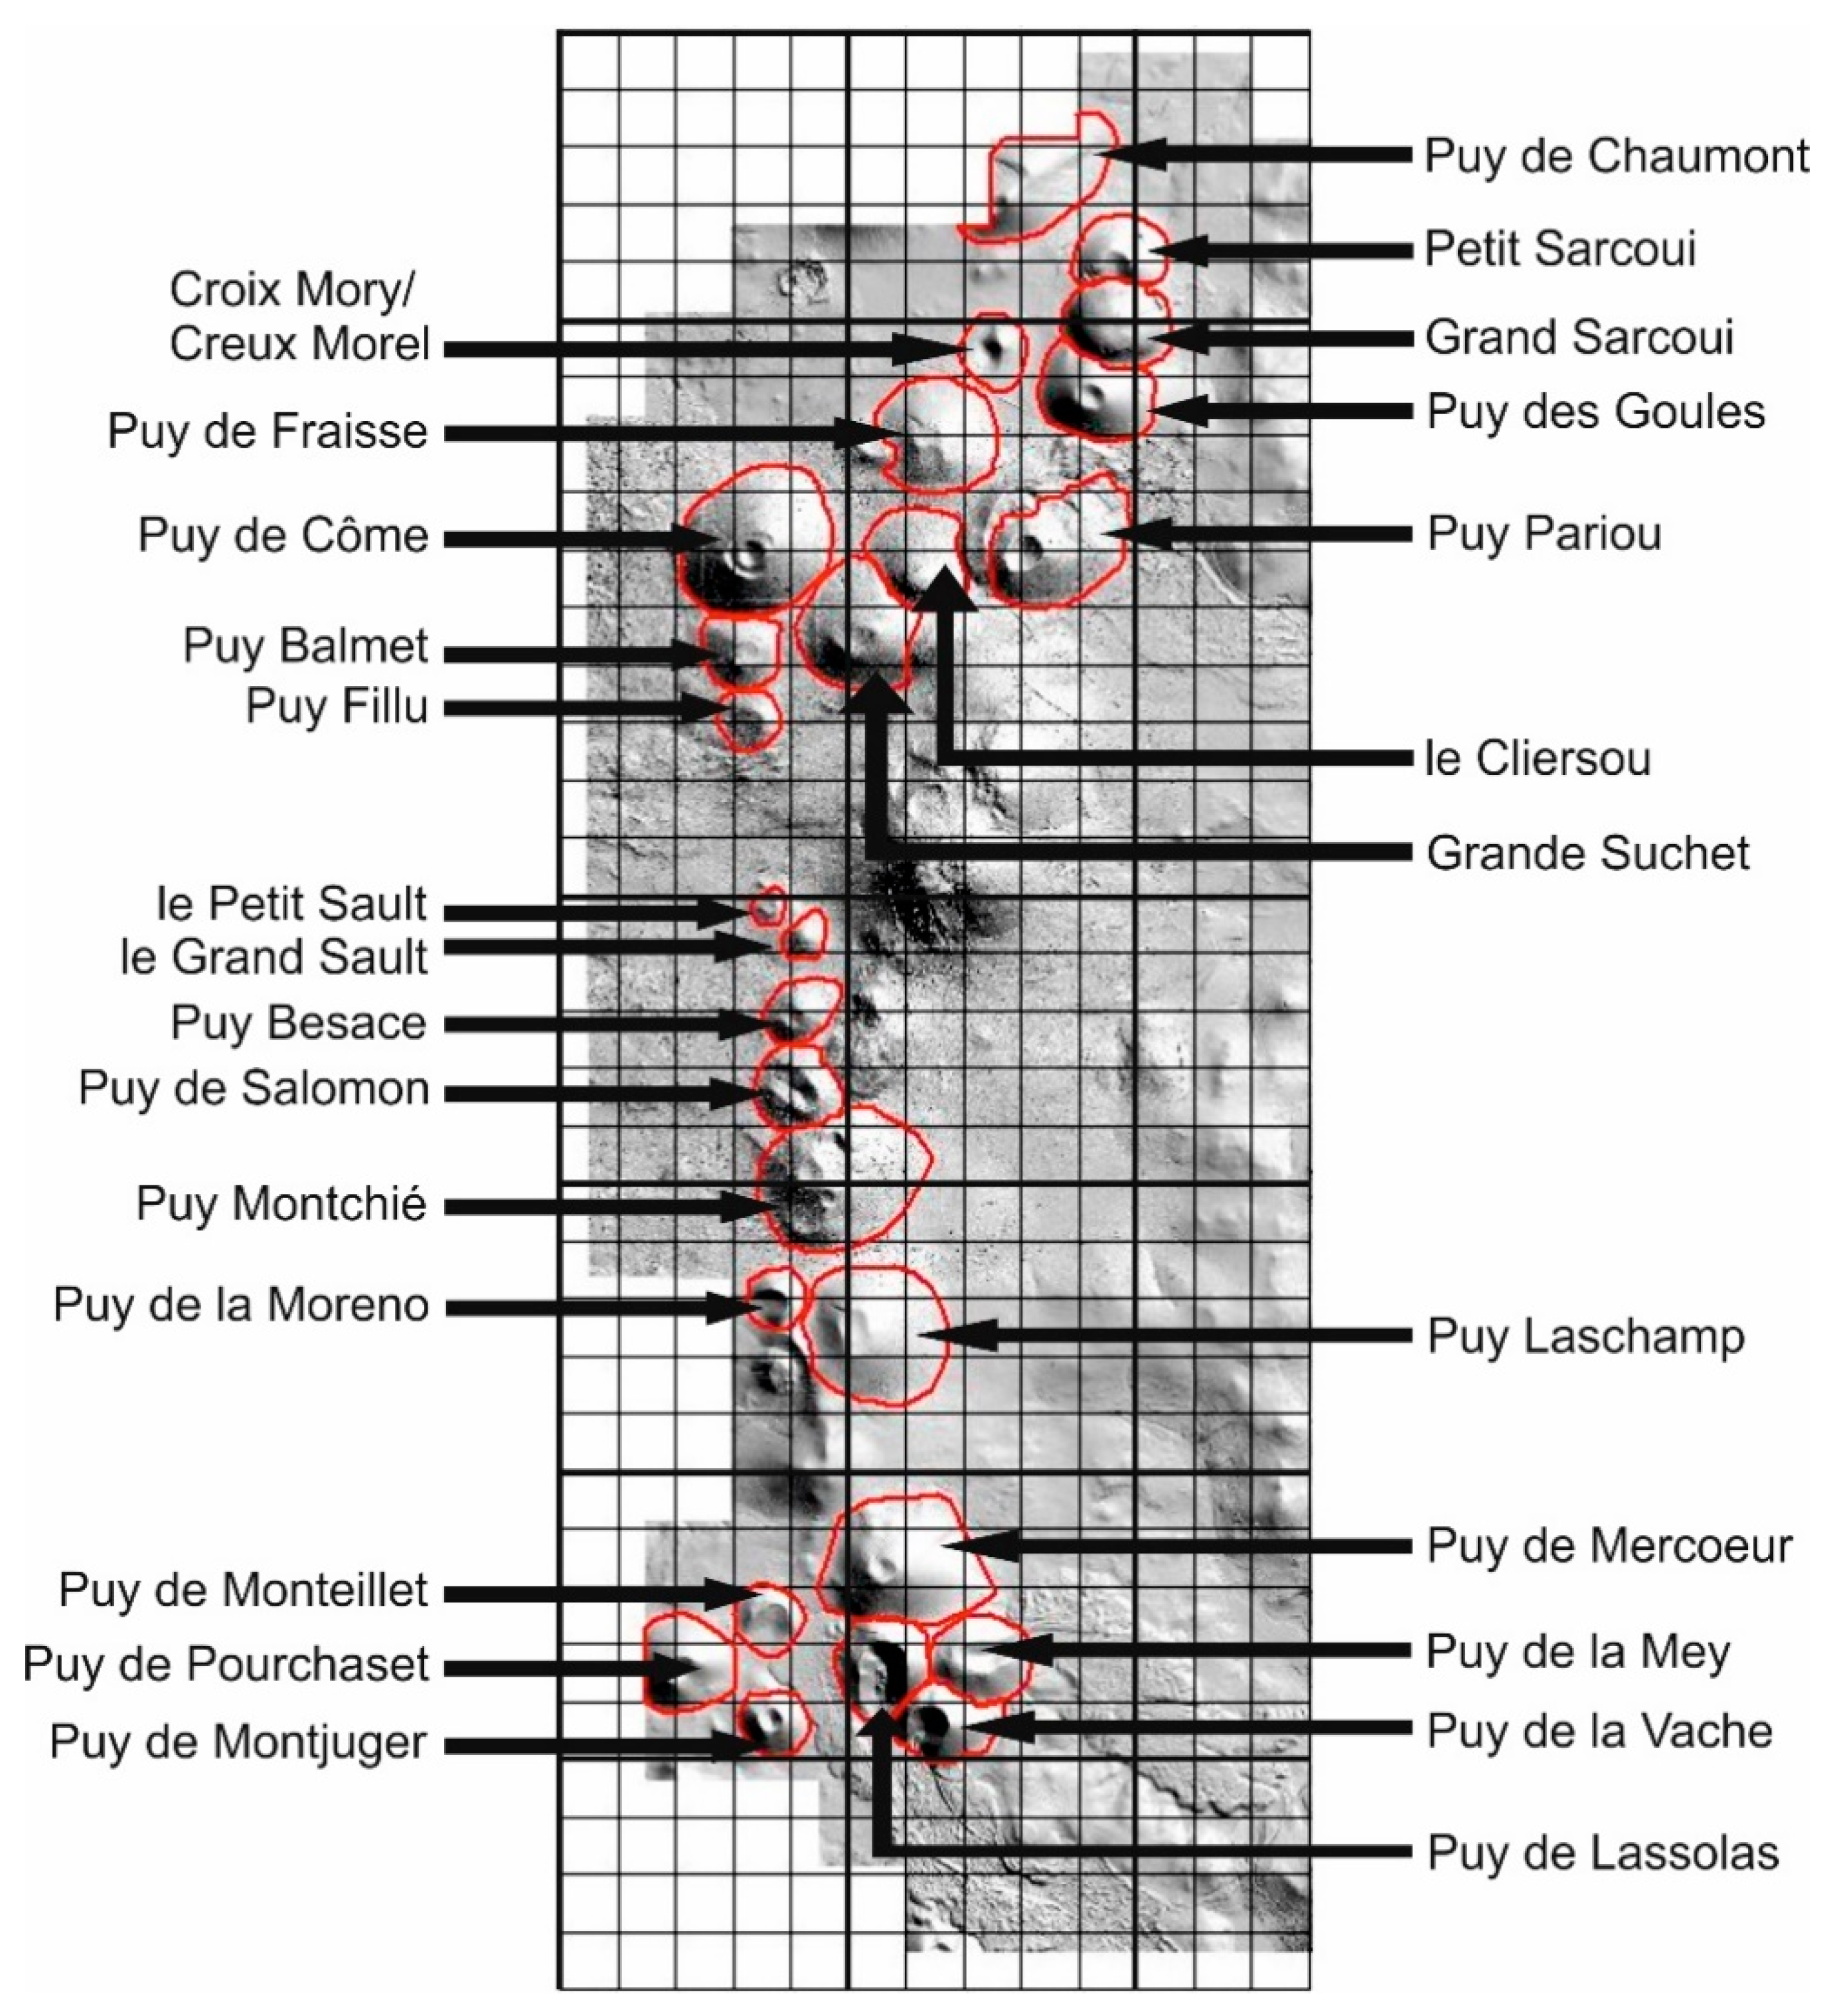
The research area was Puy de Dôme and its surrounding scoria cones (Figure 4). Two types of LiDAR data were available for this area: in the central part, a 0.5 m resolution dataset was used (LiDARVERGNE from the CRAIG open dataset: [34]), while in the more distant parts, the DTM had 5 m resolution (LiDAR Clermont Metropole [34]). Both resolutions provide a dense point cloud that gives an image of a surface showing a detailed microtopography. The ca. 30 m resolution Shuttle Radar Topographic Mission (SRTM) data are available in the area, but this, being a digital surface model, may considerably differ from the ground surface in forested areas. Furthermore, the resolution of this dataset is low in relation to our objects.
In the statistical assessments of DTM tests, it is a common problem that the results may depend on the resolution of the input data. If the evaluation contains calculations about slope angle this is especially true, the derivative of the lower resolution DTMs tends to underestimate steeper slopes. In the case of volcanic edifices, the slope distribution is a key feature to describe the cone, because the slopes are related to the type and age of the cone. Statistical studies always face this problem: examining the study area at different resolutions, it has been seen that the slope angle values derived from the lower resolution DTMs are further (smaller) from the values actually measured [35].
We therefore use the highest resolution datasets only, which provides us with 26 edifices, 24 scoria cones, and two lava domes, which have similar morphometry to scoria cones [36], to be examined (shown in Figure 4). Puy de Dôme and Petit Puy de Dôme is a distinct complex morphological landform [31]. We decided not to have it in the analysis, as we are concentrating on simple scoria cones. Puy de Dôme also has a certain human infrastructure (cog railway, summit buildings) that has modified parts of its original morphometry.

2.6. Calculation of Geodiversity Indices: Traditional Approach

The quantitative methodology of this study is mainly based on Pereira et al. [4]. There is a modified version (e.g., [5]), but the original framework suits our purposes for volcanic areas. During the assessment process, various subindices are determined. These represent geodiversity elements: geology, geomorphology (relief and hydrology), pedology, paleontology, and mineral occurrences. The sum of these is the geodiversity index of a certain area. During the evaluation, only open access software (QGIS 3.16.0 [QGIS.ORG, Grüt, Switzerland] and GRASS GIS 7.8.4 [Grass Development Team, OR, USA]) was used to ensure reproducibility.
The first step was to slice up the area into a grid of 500 m × 500 m square cells. This resolution was chosen because of the characteristics of the sample area: the main geomorphological features (scoria cones) can be analyzed and highlighted this way. We tried other cell resolutions as well: the choice of the 500-m cell size is a result of integration of widely varying resolution of the input layers; a higher resolution introduces local effects of some input components.
The geological subindex was calculated using the 1:50,000-scale vector geological map of France [37]. It contains lithological/stratigraphical units. The number of different units in a grid cell is considered the subindex. The vector dataset was converted to a raster image (‘Rasterize’ tool in QGIS), and the ‘Variety’ attribute of the ‘Zonal statistics’ tool presented the amount of different raster values in a certain overlaid grid cell.
The pedological subindex was calculated with the use of European Soil Database v2.0 [38]. The process was similar to the geological index: after rasterization, the different values were counted in each cell. As this data source is small-scale (1:5,000,000), it does not have a large effect on the final geodiversity index.
As paleontological features are not common in volcanic areas, the value of this subindex is 0 in every grid cell. Mineral occurrences were searched for in the EGDI Mineral Resources Map [39], although no feature was recorded within the sample area.
The geomorphological subindex is the composition of relief and hydrological indices. Queries were made to obtain watercourse features and lakes in the territory from OpenStreetMap database with overpass turbo. Only a few cells were affected by this. The relief index was formerly produced with the use of geomorphological maps. The different morphostructural units were recorded as scores in each cell. As we lack a good large-scale geomorphological map of the area, the concept of geomorphons [40] was applied. The geomorphon theory uses 8-tuple patterns of the visibility neighborhood to detect pixel values and delineate terrain forms in the eight principal directions to a certain point. Search radius and flatness threshold parameters can be changed—they affect the complexity of form recognition. By analyzing DEMs this way, we can delineate 10 different form types (Figure 6b). The r.geomorphon plugin of GRASS GIS was used to produce the geomorphons raster. The relief index (derived from geomorphons) is the number of the different form types in one cell (calculated alike geological and pedological subindices). The sum of relief and hydrological values is the geomorphological subindex.

2.7. Input for the Calculation of the Proposed Geodiversity Component: Sectorization

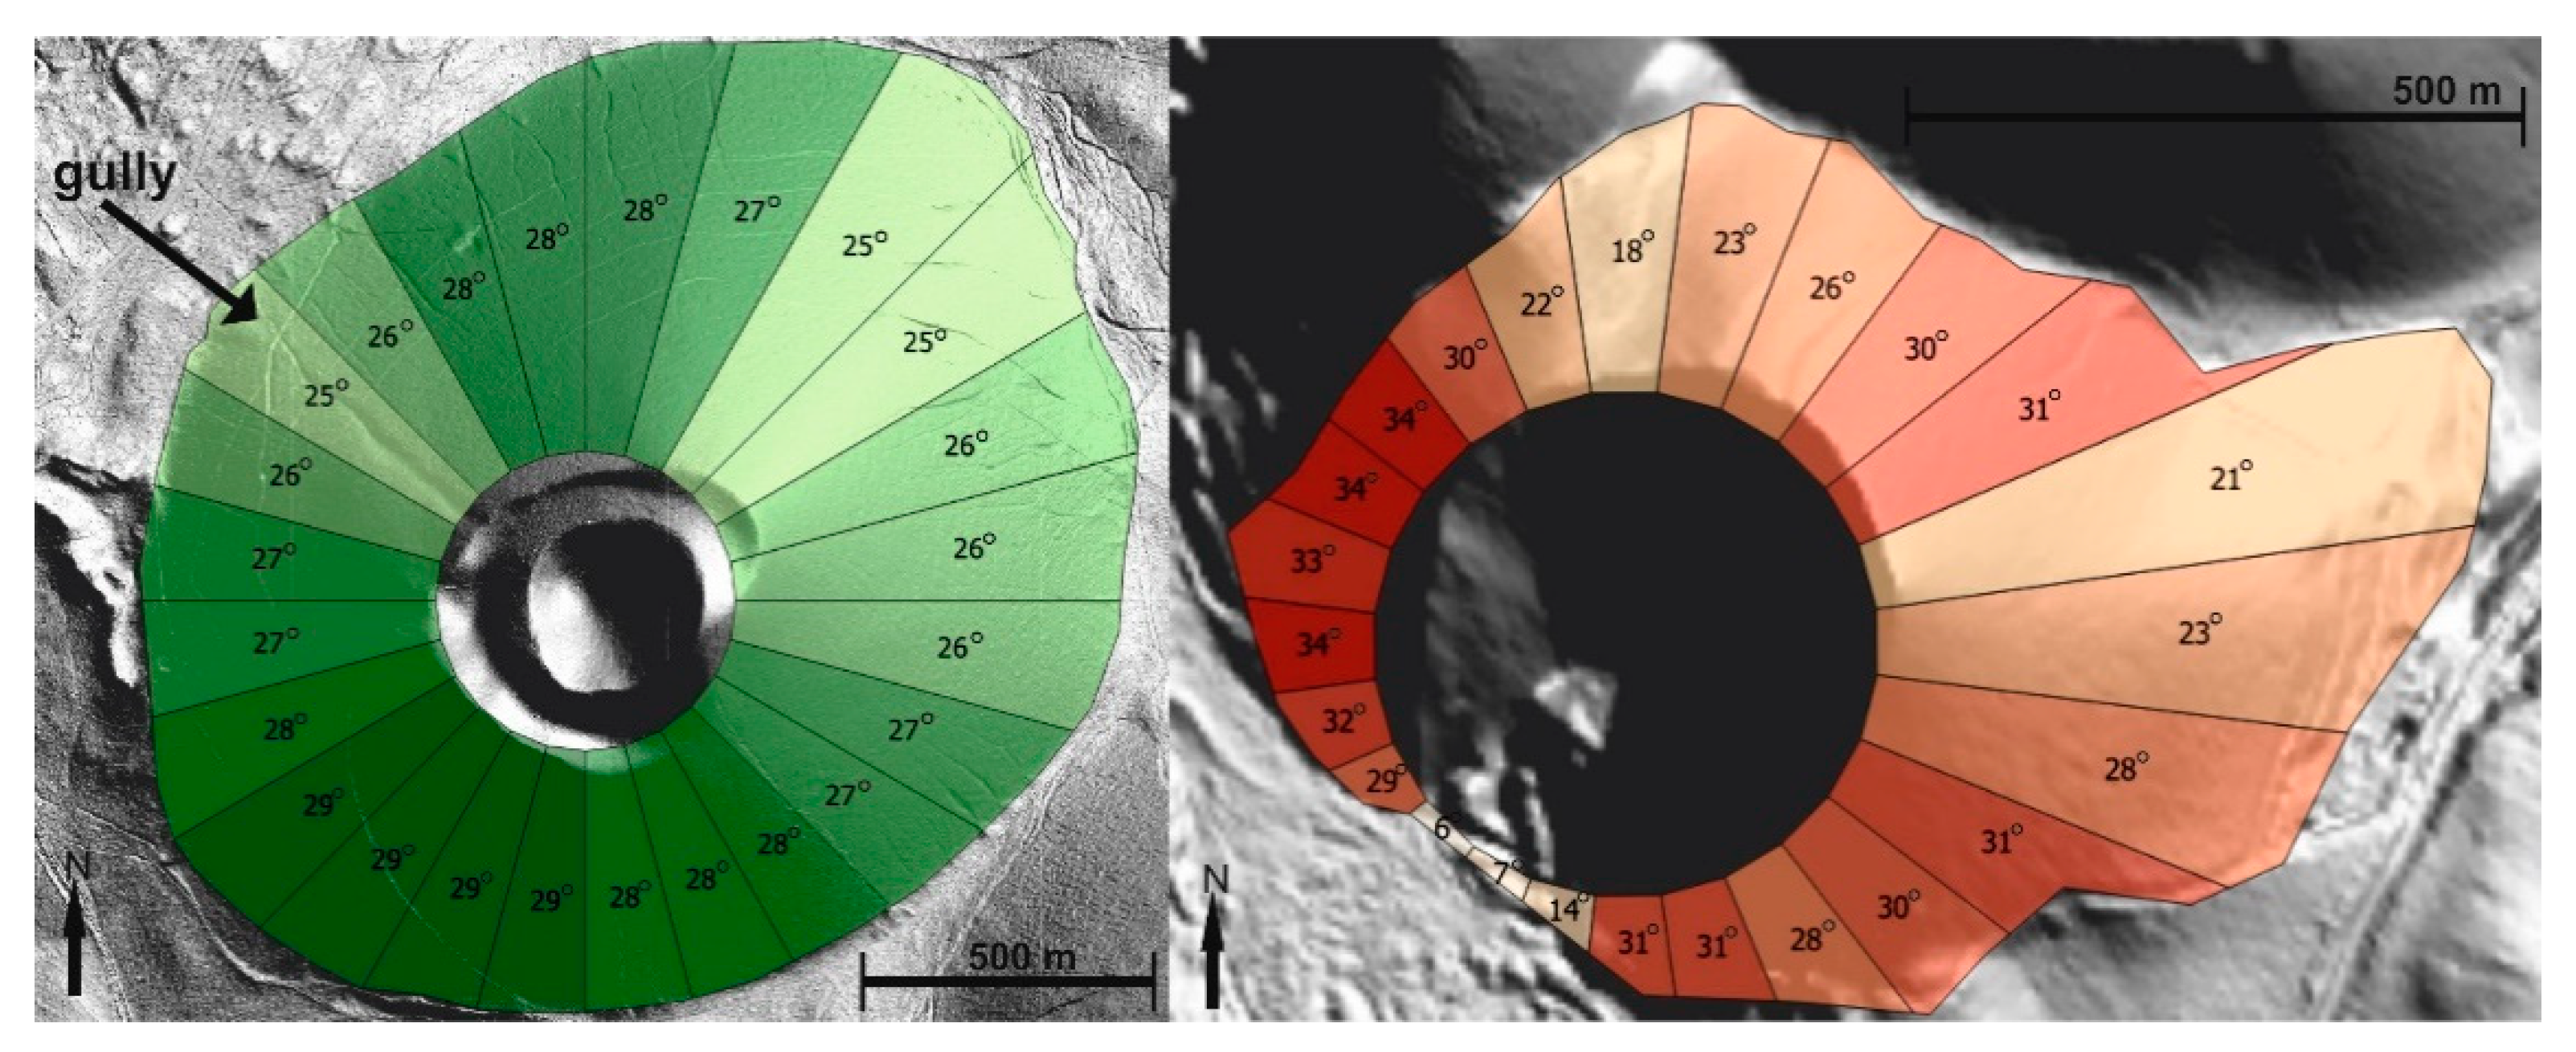
Based on the previous studies (2.3.), scoria cones can be best described by their slope angles. One way is to examine the average (and other calculated) values of the entire cone and then compare them. This method accounts for the symmetry and the degradation of the edifice (often related to the age of the cone). In order to include the potential asymmetry of the features (a potential source of increased geodiversity), a scoria cone was characterized with further derivative values: the area of the cone was radially divided into several sectors. The sectorization made it possible to detect characteristic values that cannot be represented with a single number—e.g., depressions, protrusions, collapses. The presence of a crater plays a significant role in the calculations (if the cone has it): the slope values are greatly influenced by the crater, but the appearance/shape of the cone are less, so it is advisable to omit the crater from the calculations. The blanking radius was kept constant in order to facilitate the automated data processing. In the case of an ideal, circular cone, a doughnut-shaped mask is applied to the DTM: the middle is omitted from the calculations. The sectors were designated in the radial direction at 15° increments, so a cone is described with 24 sectors. The first sector points to the north, or in the case of a cone with an open crater, towards the heading of this opening. Multiple statistics of slope values were calculated for each sector—the median was the most expressive for the present study. These median values were then grouped into angle ranges: G0: 0–2°, G1: 2–4°, and so on up to G19. For illustration, we present two different cones (Figure 5): Puy de Côme and Puy de la Vache. In Puy de Côme, we can see median values between 24° and 30°, meaning that G12–14 are presented here. The values are relatively balanced; it is an intact, regular cone. A radial depression, a small gully can be seen in the NW: the smaller slope value compared to the surrounding sectors shows this. In contrast, at Puy de la Vache, slope angle values range widely: medians are between 5° and 35° (groups between G2 and G16). These G groups provided the basis for the new subindex, the volcano index (Table 1). So, for example, group G12 (24–26° values included) means “12” in the calculations.

3. Results

The minimum and maximum values of the various subindices are listed in Table 1.
Panel (a) of Figure 6 shows the high-resolution terrain model available from the area, making comparison easier, dots added in (c) aid with the location of features as well. The 8-tuple pattern recognition theory of geomorphons helps to delineate the specific geomorphological features of the Chaîne des Puys. Owing to this pixel-based categorization method, 10 different landform types can be distinguished (Figure 6b). There is a visible correlation between the DEM and the geomorphon map—the classification is exclusively based on the elevation data and two variables: search radius and flatness threshold. The chosen size of the radius is determined by the DEM resolution and the flatness variable is set to filter out ‘noise’ or small irregularities. In our case, the geomorphon map is considered as a geomorphological map as all recognizable landform patterns are present and thus can be applied in the assessment process.
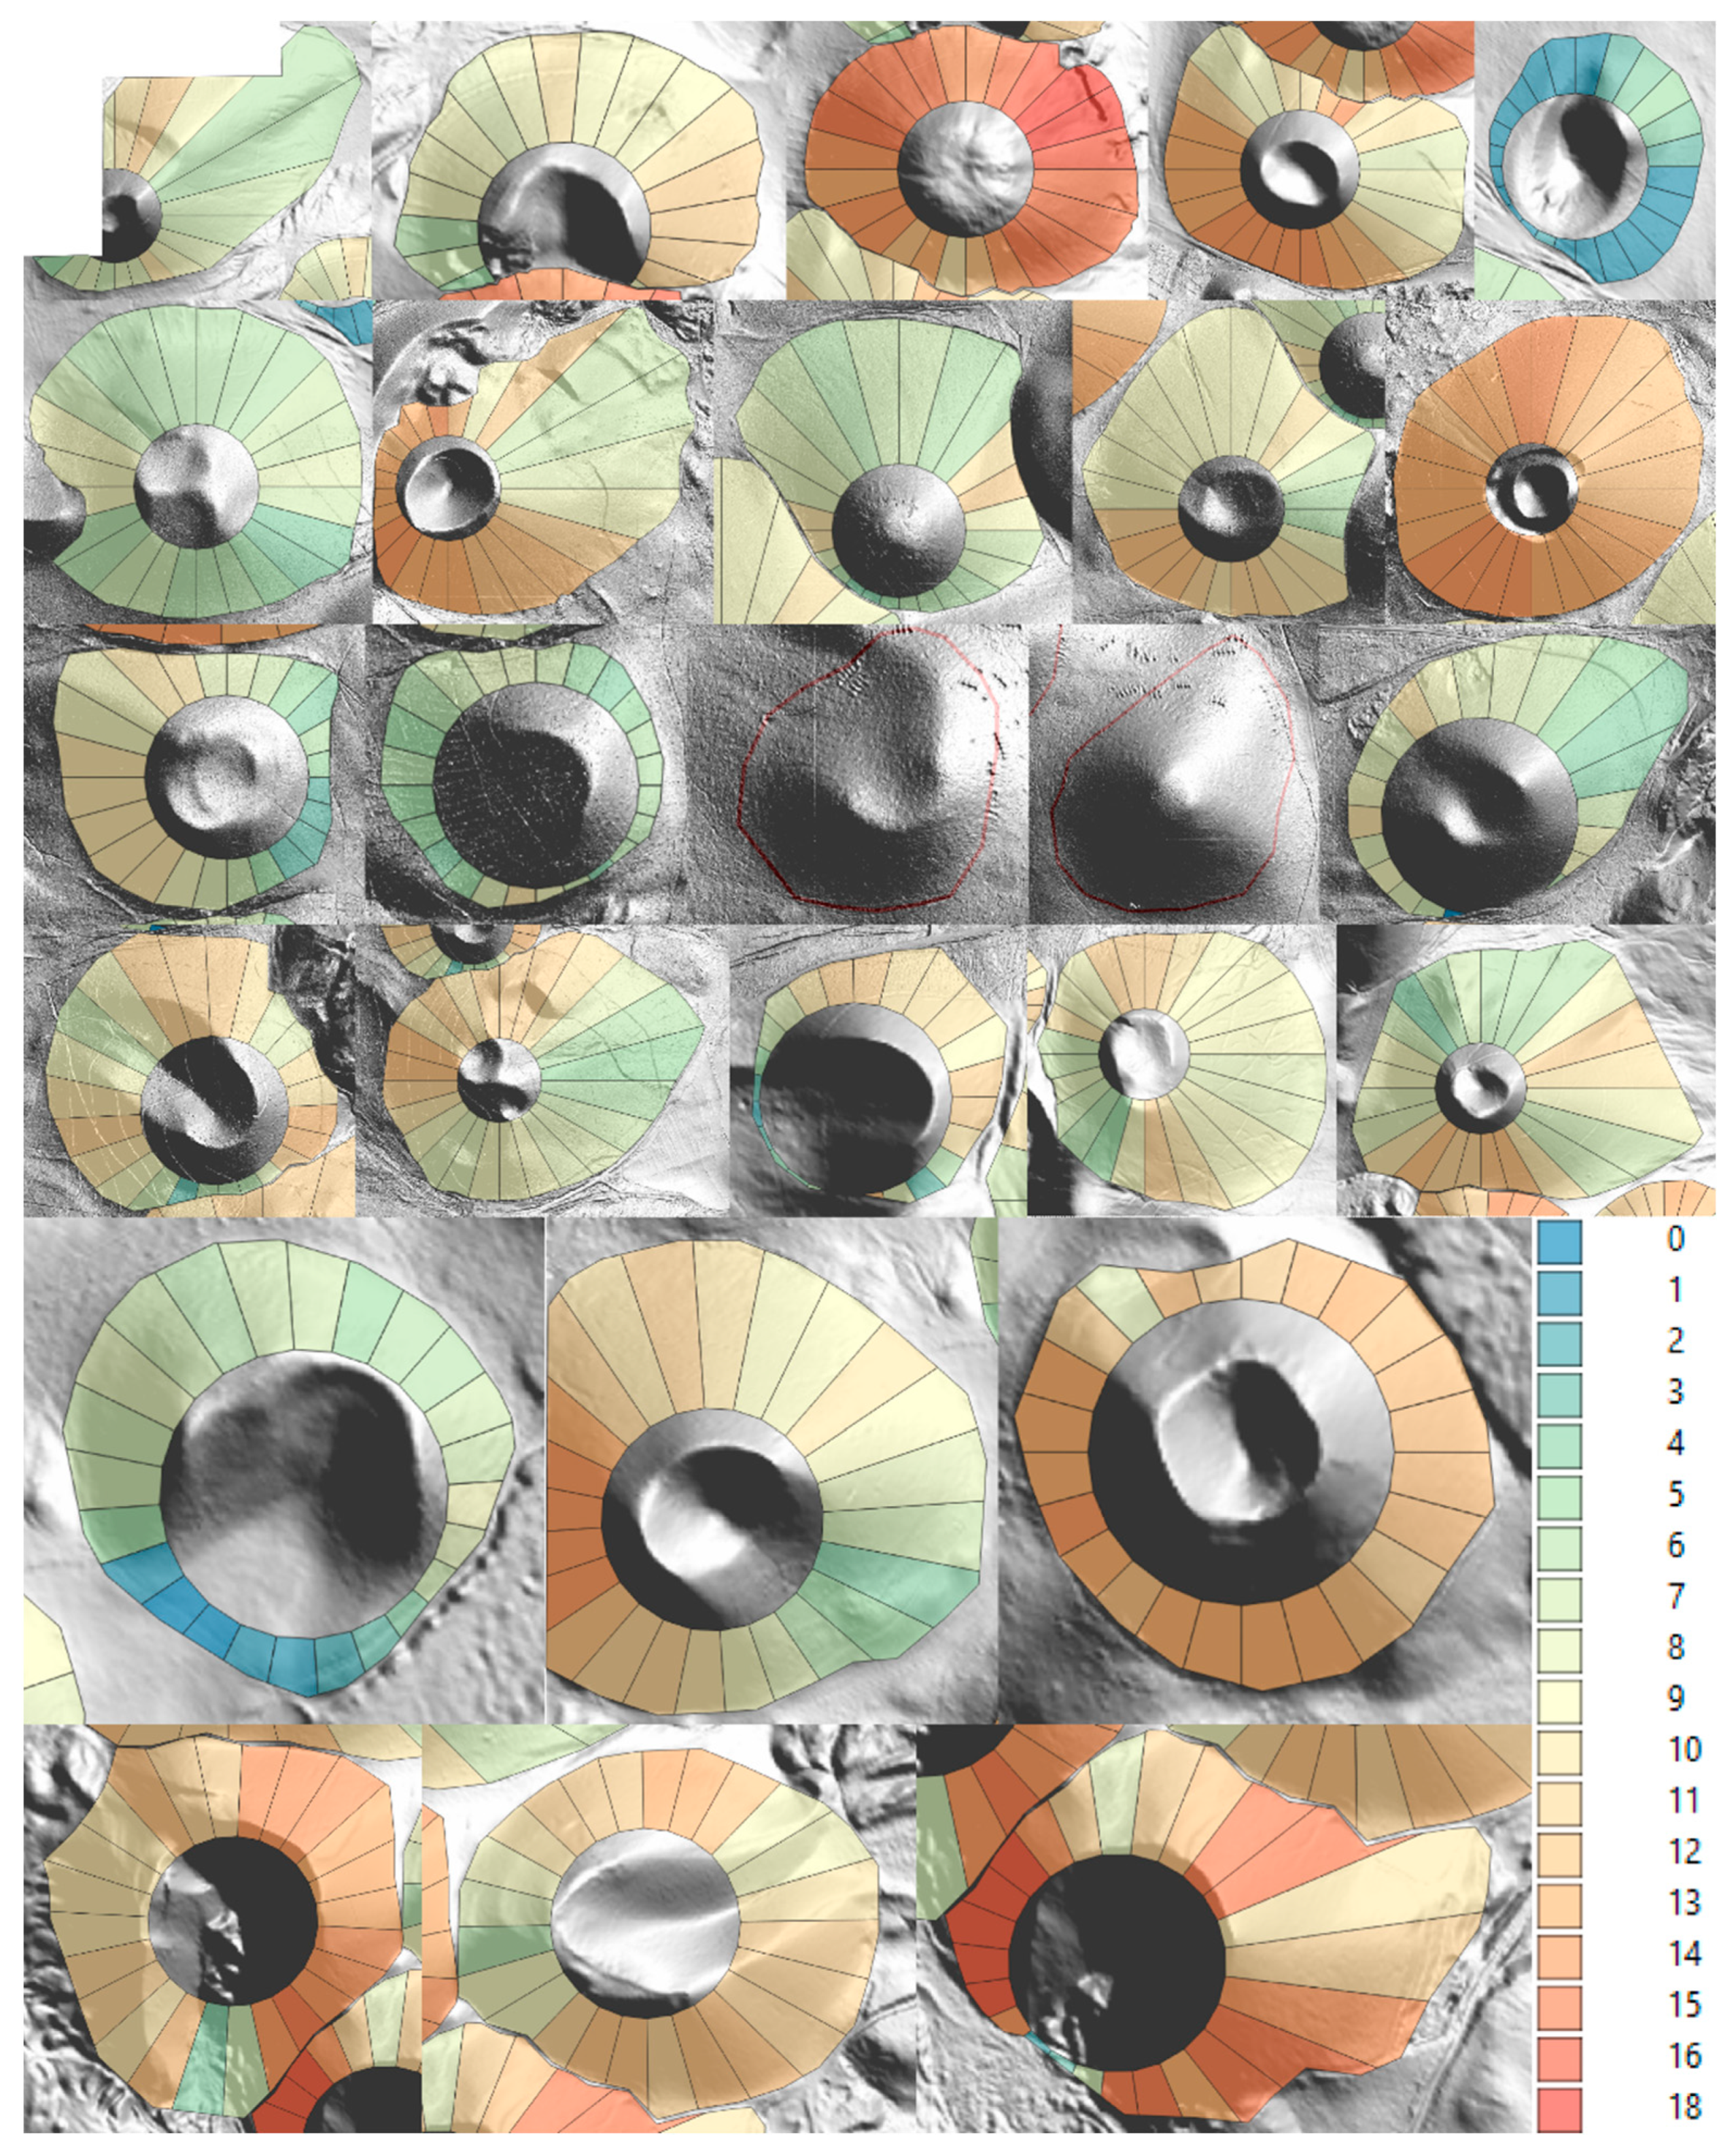
In Figure 7, we can see all the examined cones with their sectors. Twenty-four were large enough, with respect to the data resolution to do the sectorization. Two of them were too small for further processing considering the chosen 300 m resolution.
In Figure 7, the median slope values are already converted to the aforementioned slope groups. Bluish tones indicate low slope groups, while reddish colors indicate steeper areas. The high variation in colors means an irregular cone shape.
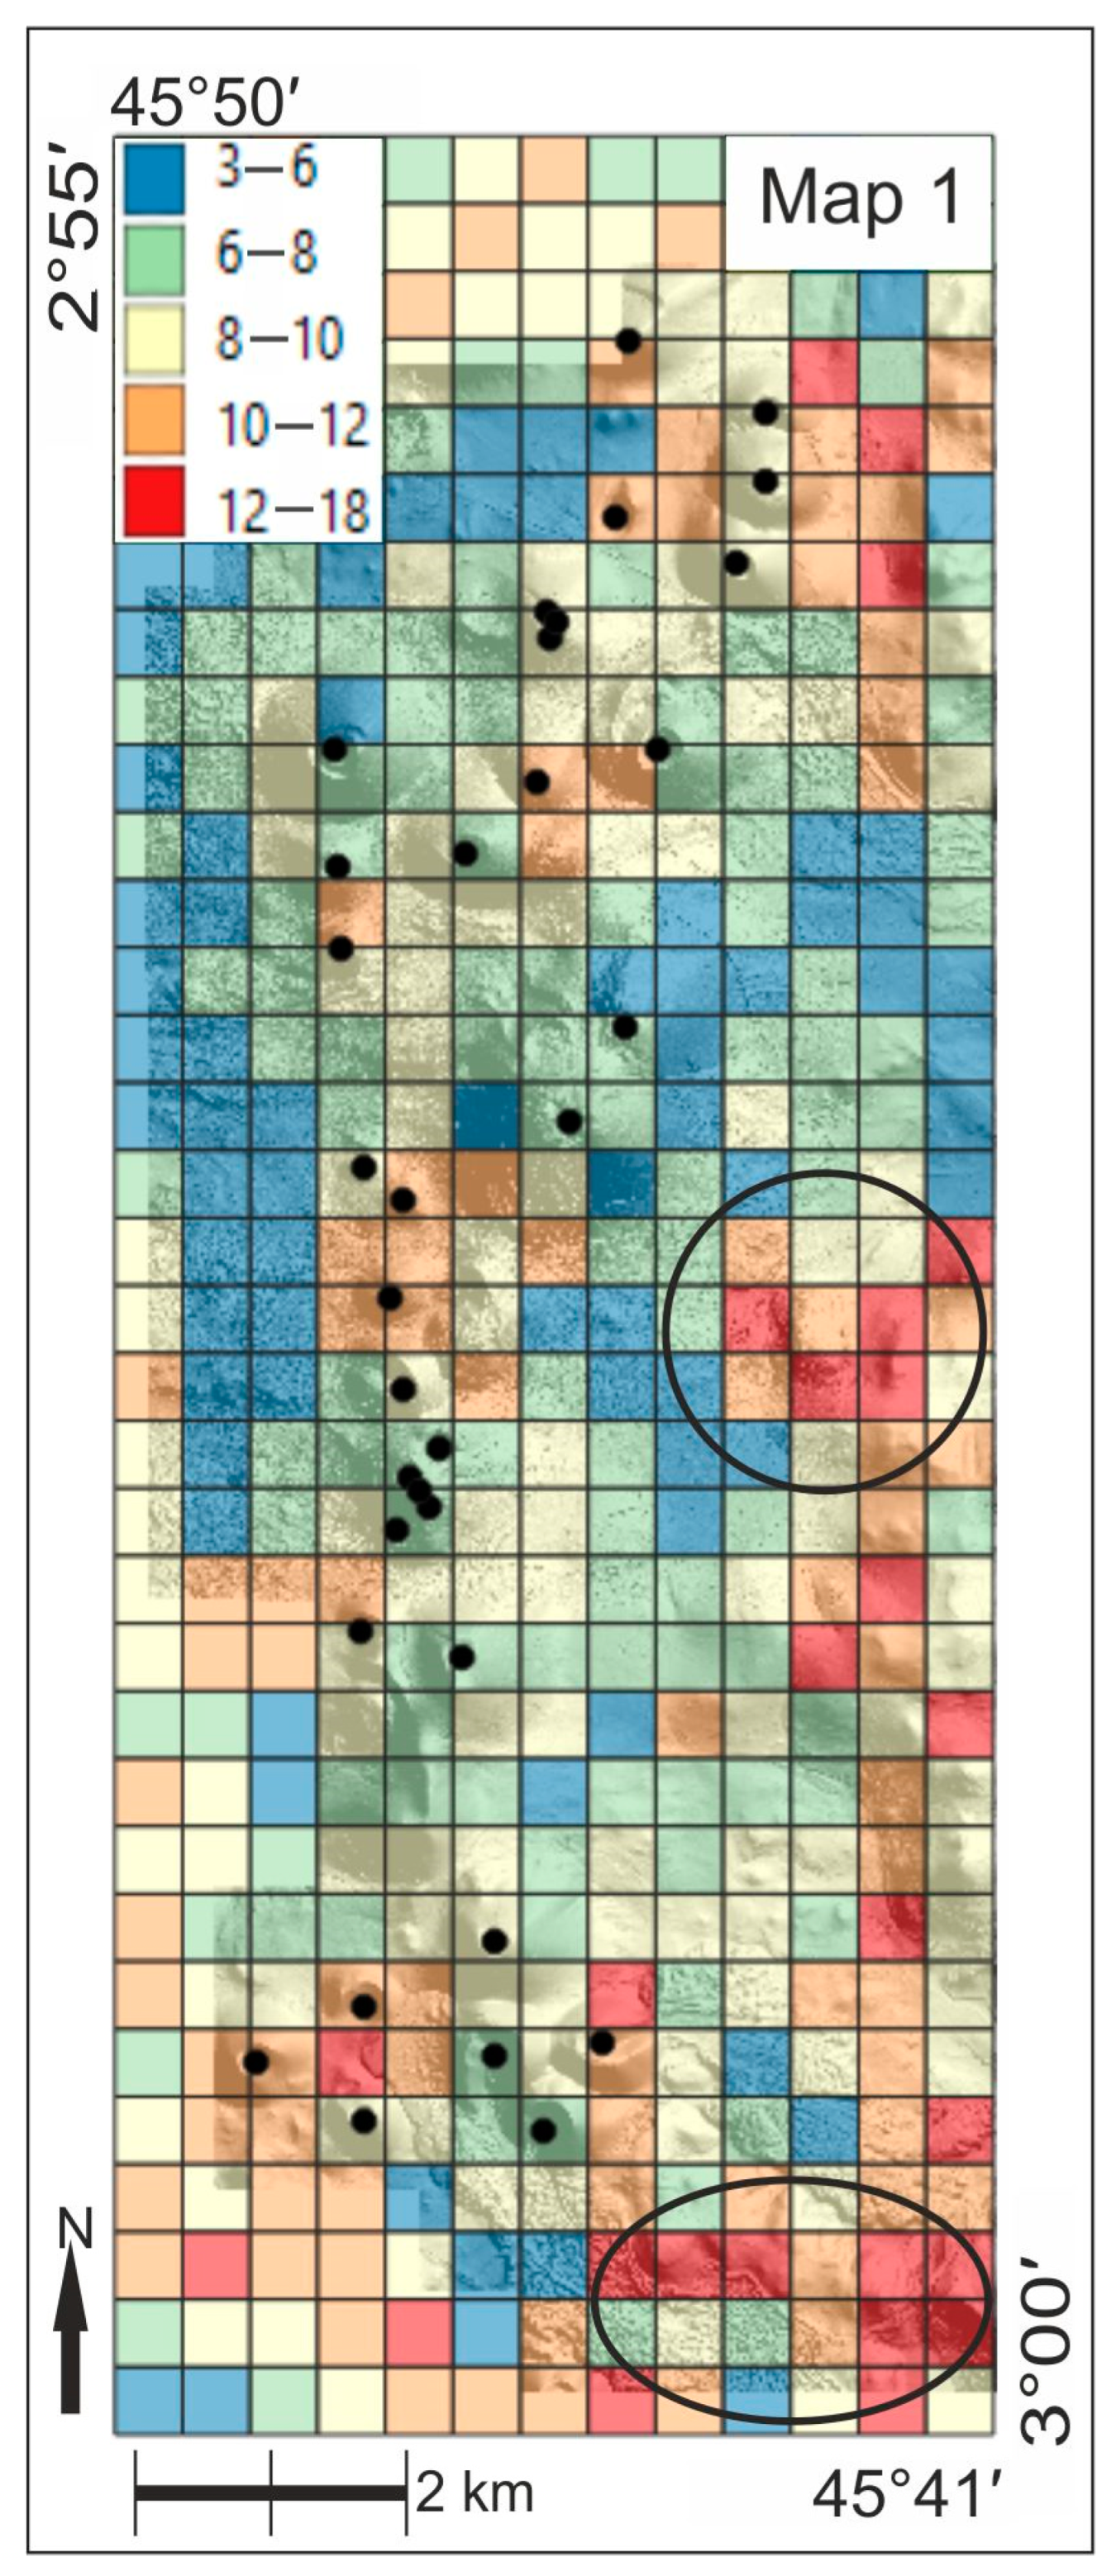
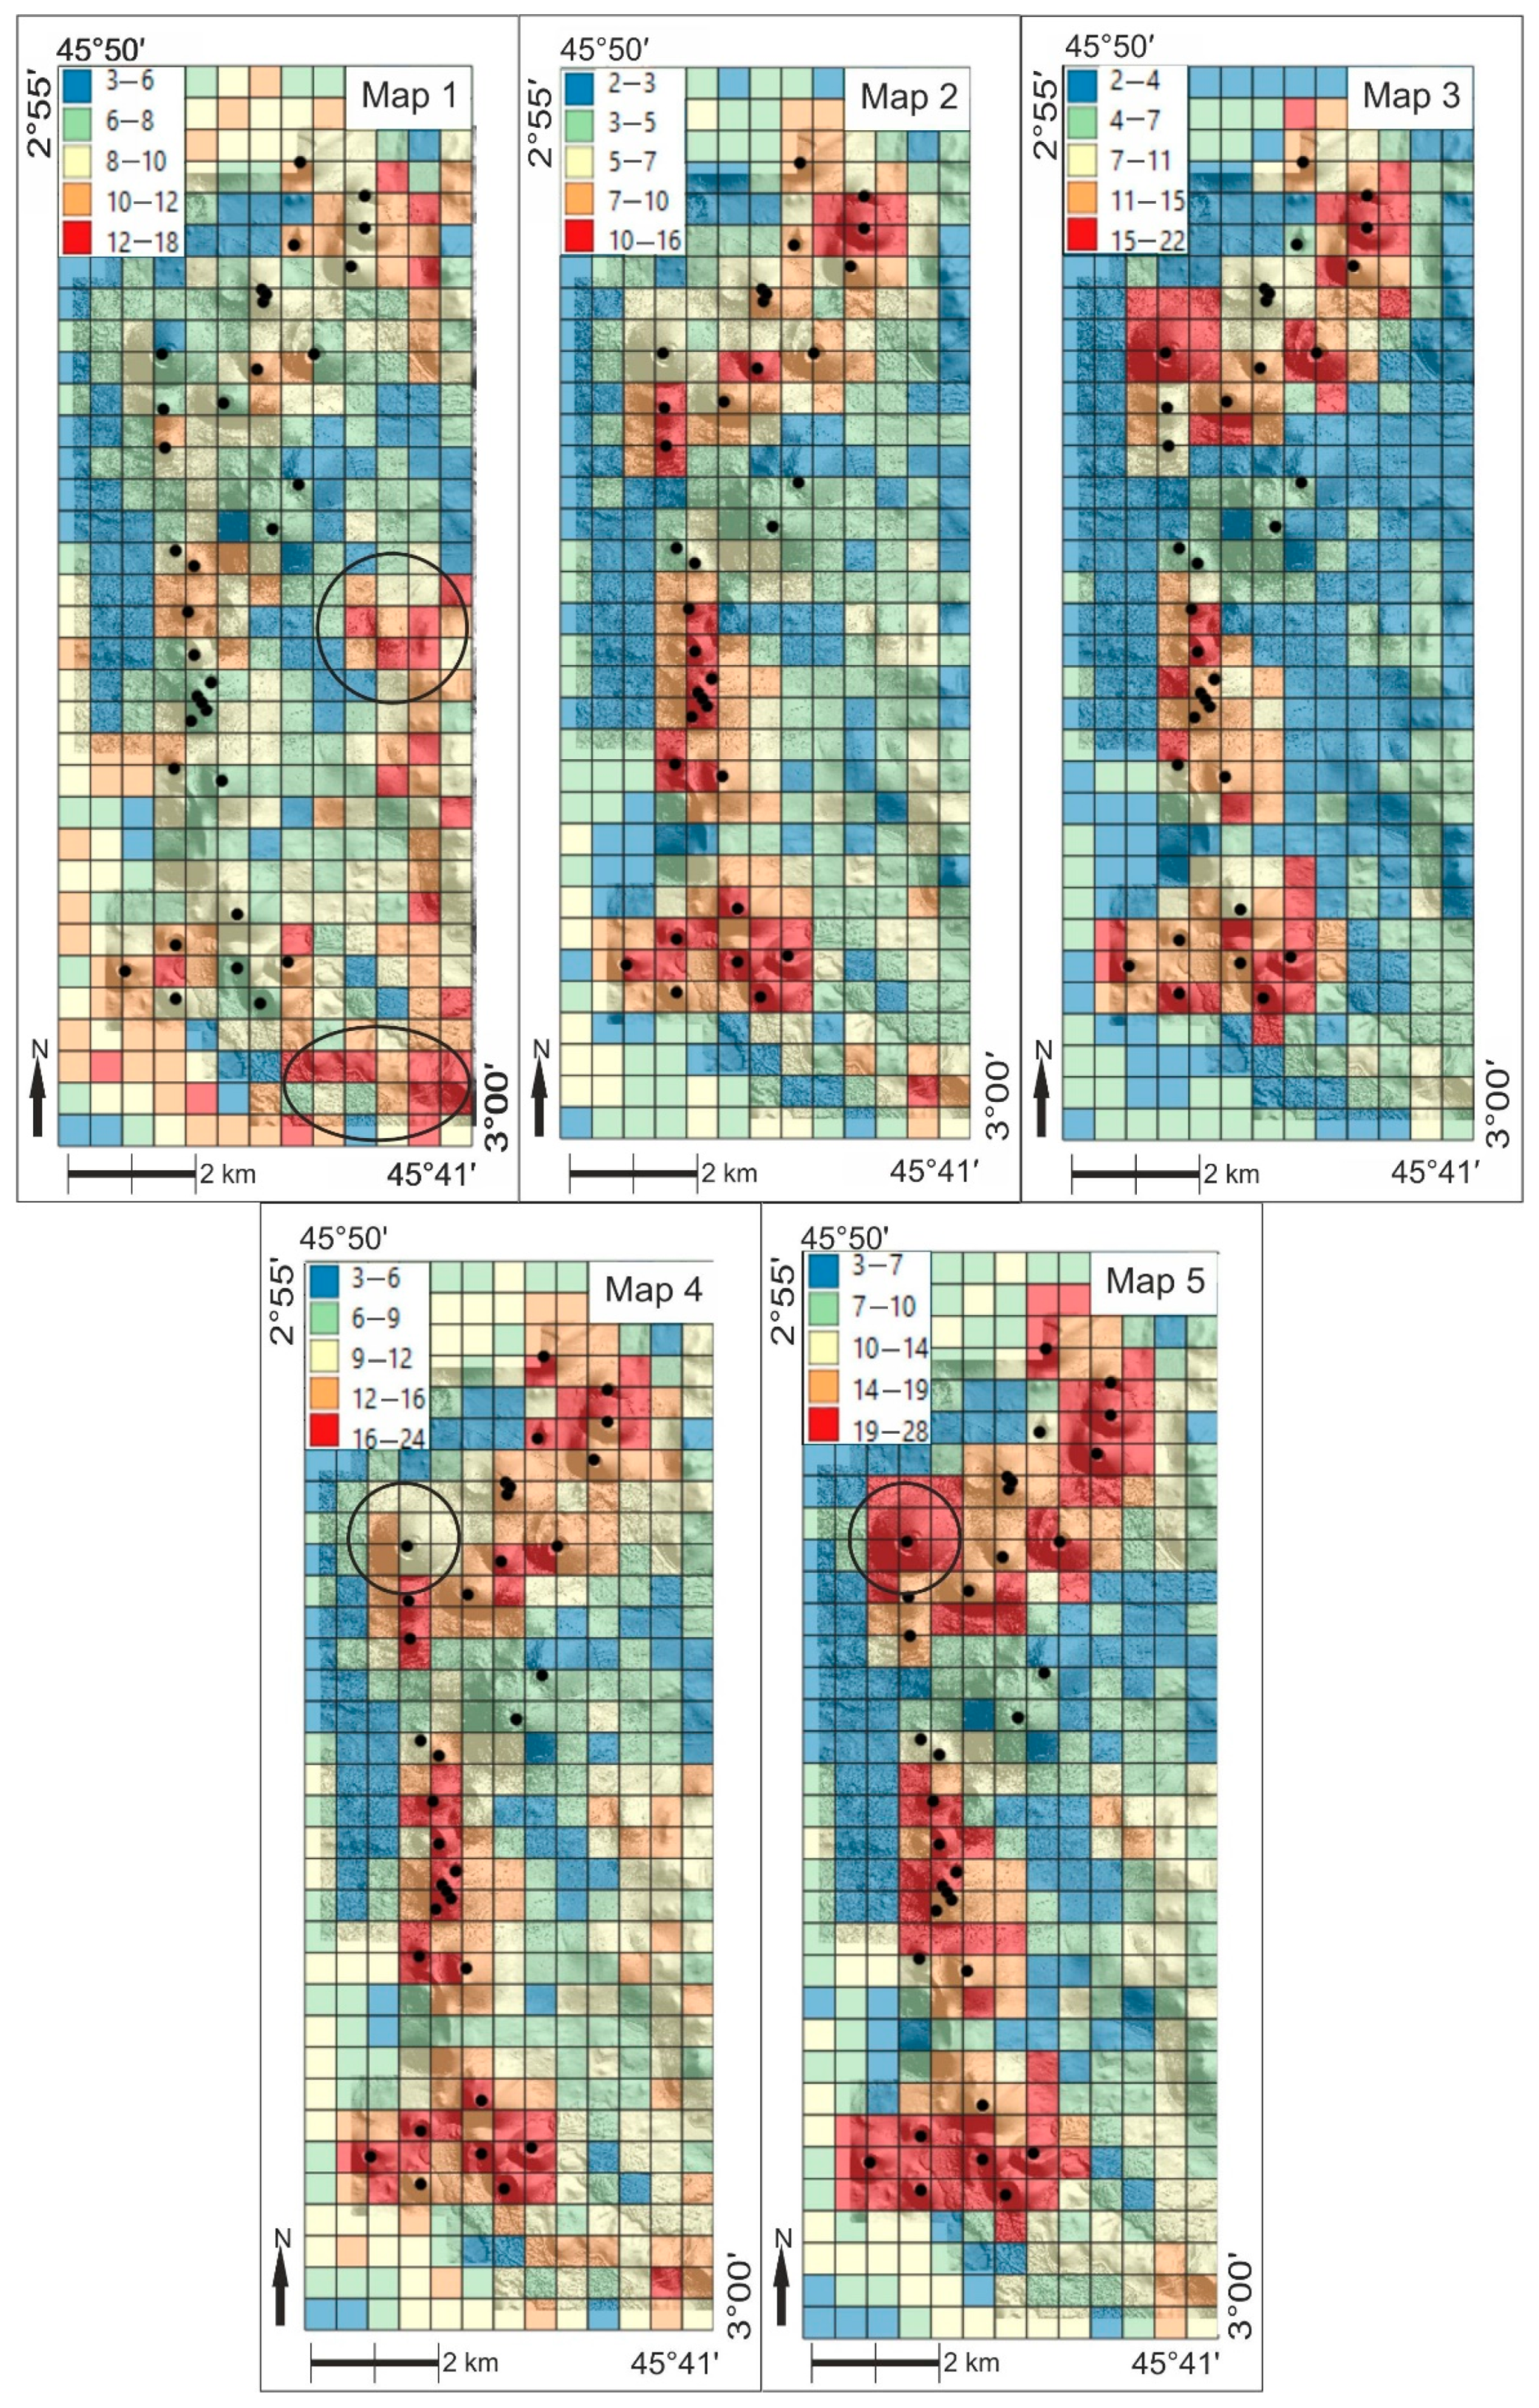
The final geodiversity map can be seen in Figure 8. The maximum value in the geodiversity map is 18, while the minimum is 3. Clusters were calculated by a natural breaks classification method [41]. It is shown that for this method, the areas of higher geodiversity are located to the southern and eastern part, in which no scoria cones are found (in Figure 8, see circled). These are areas of granitic basement topography. The scoria cones can be detected on the map by their outlines, but these areas have very low values.
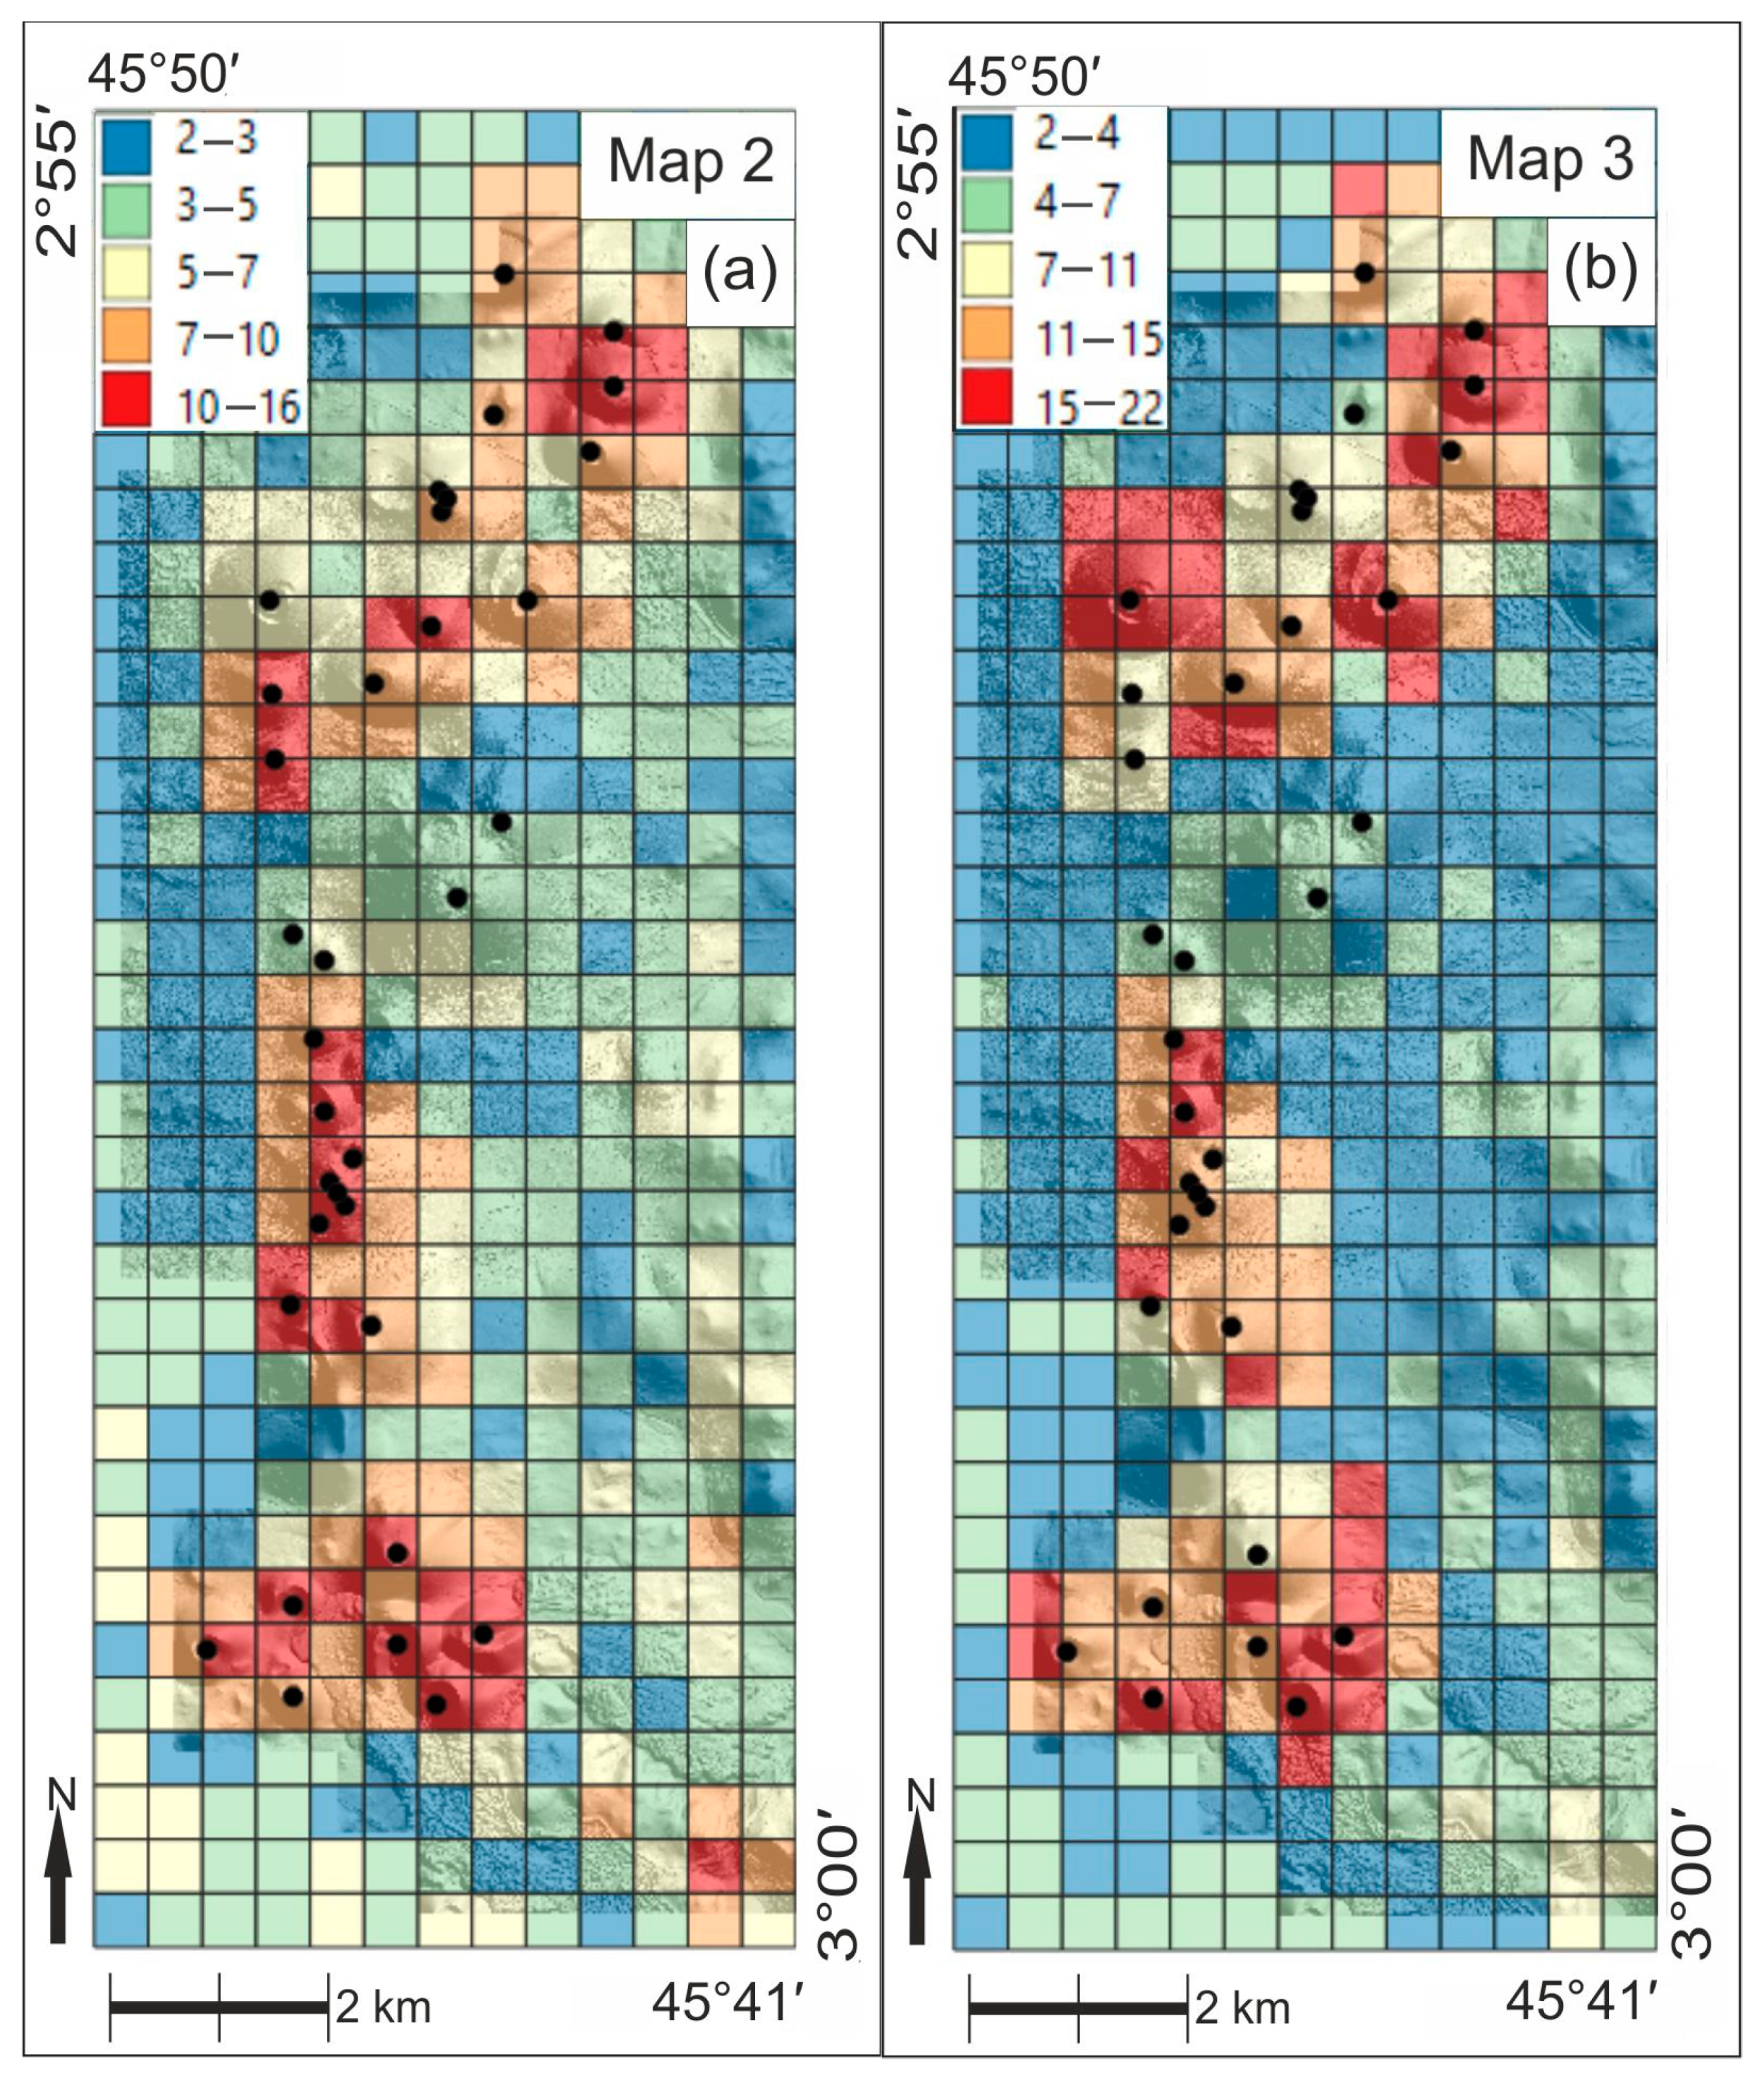
In order to raise the score of the scoria cones on the geodiversity map, we added two new subindices. These are intended to detect structures of interest for visitors in volcanic areas such as the Chaîne des Puys. The first value shows if there is a cone in a certain cell. It has a value of 0 or 1. The other value was calculated from the median of the sectors. In one case, we looked at the number of different sectors in a certain cell (Figure 9a), and in the other case, we calculated the median of sector values in a certain cell (Figure 9b). Numbers of the cone presence value were added to these. In both cases, the scoria cones appear on the maps.
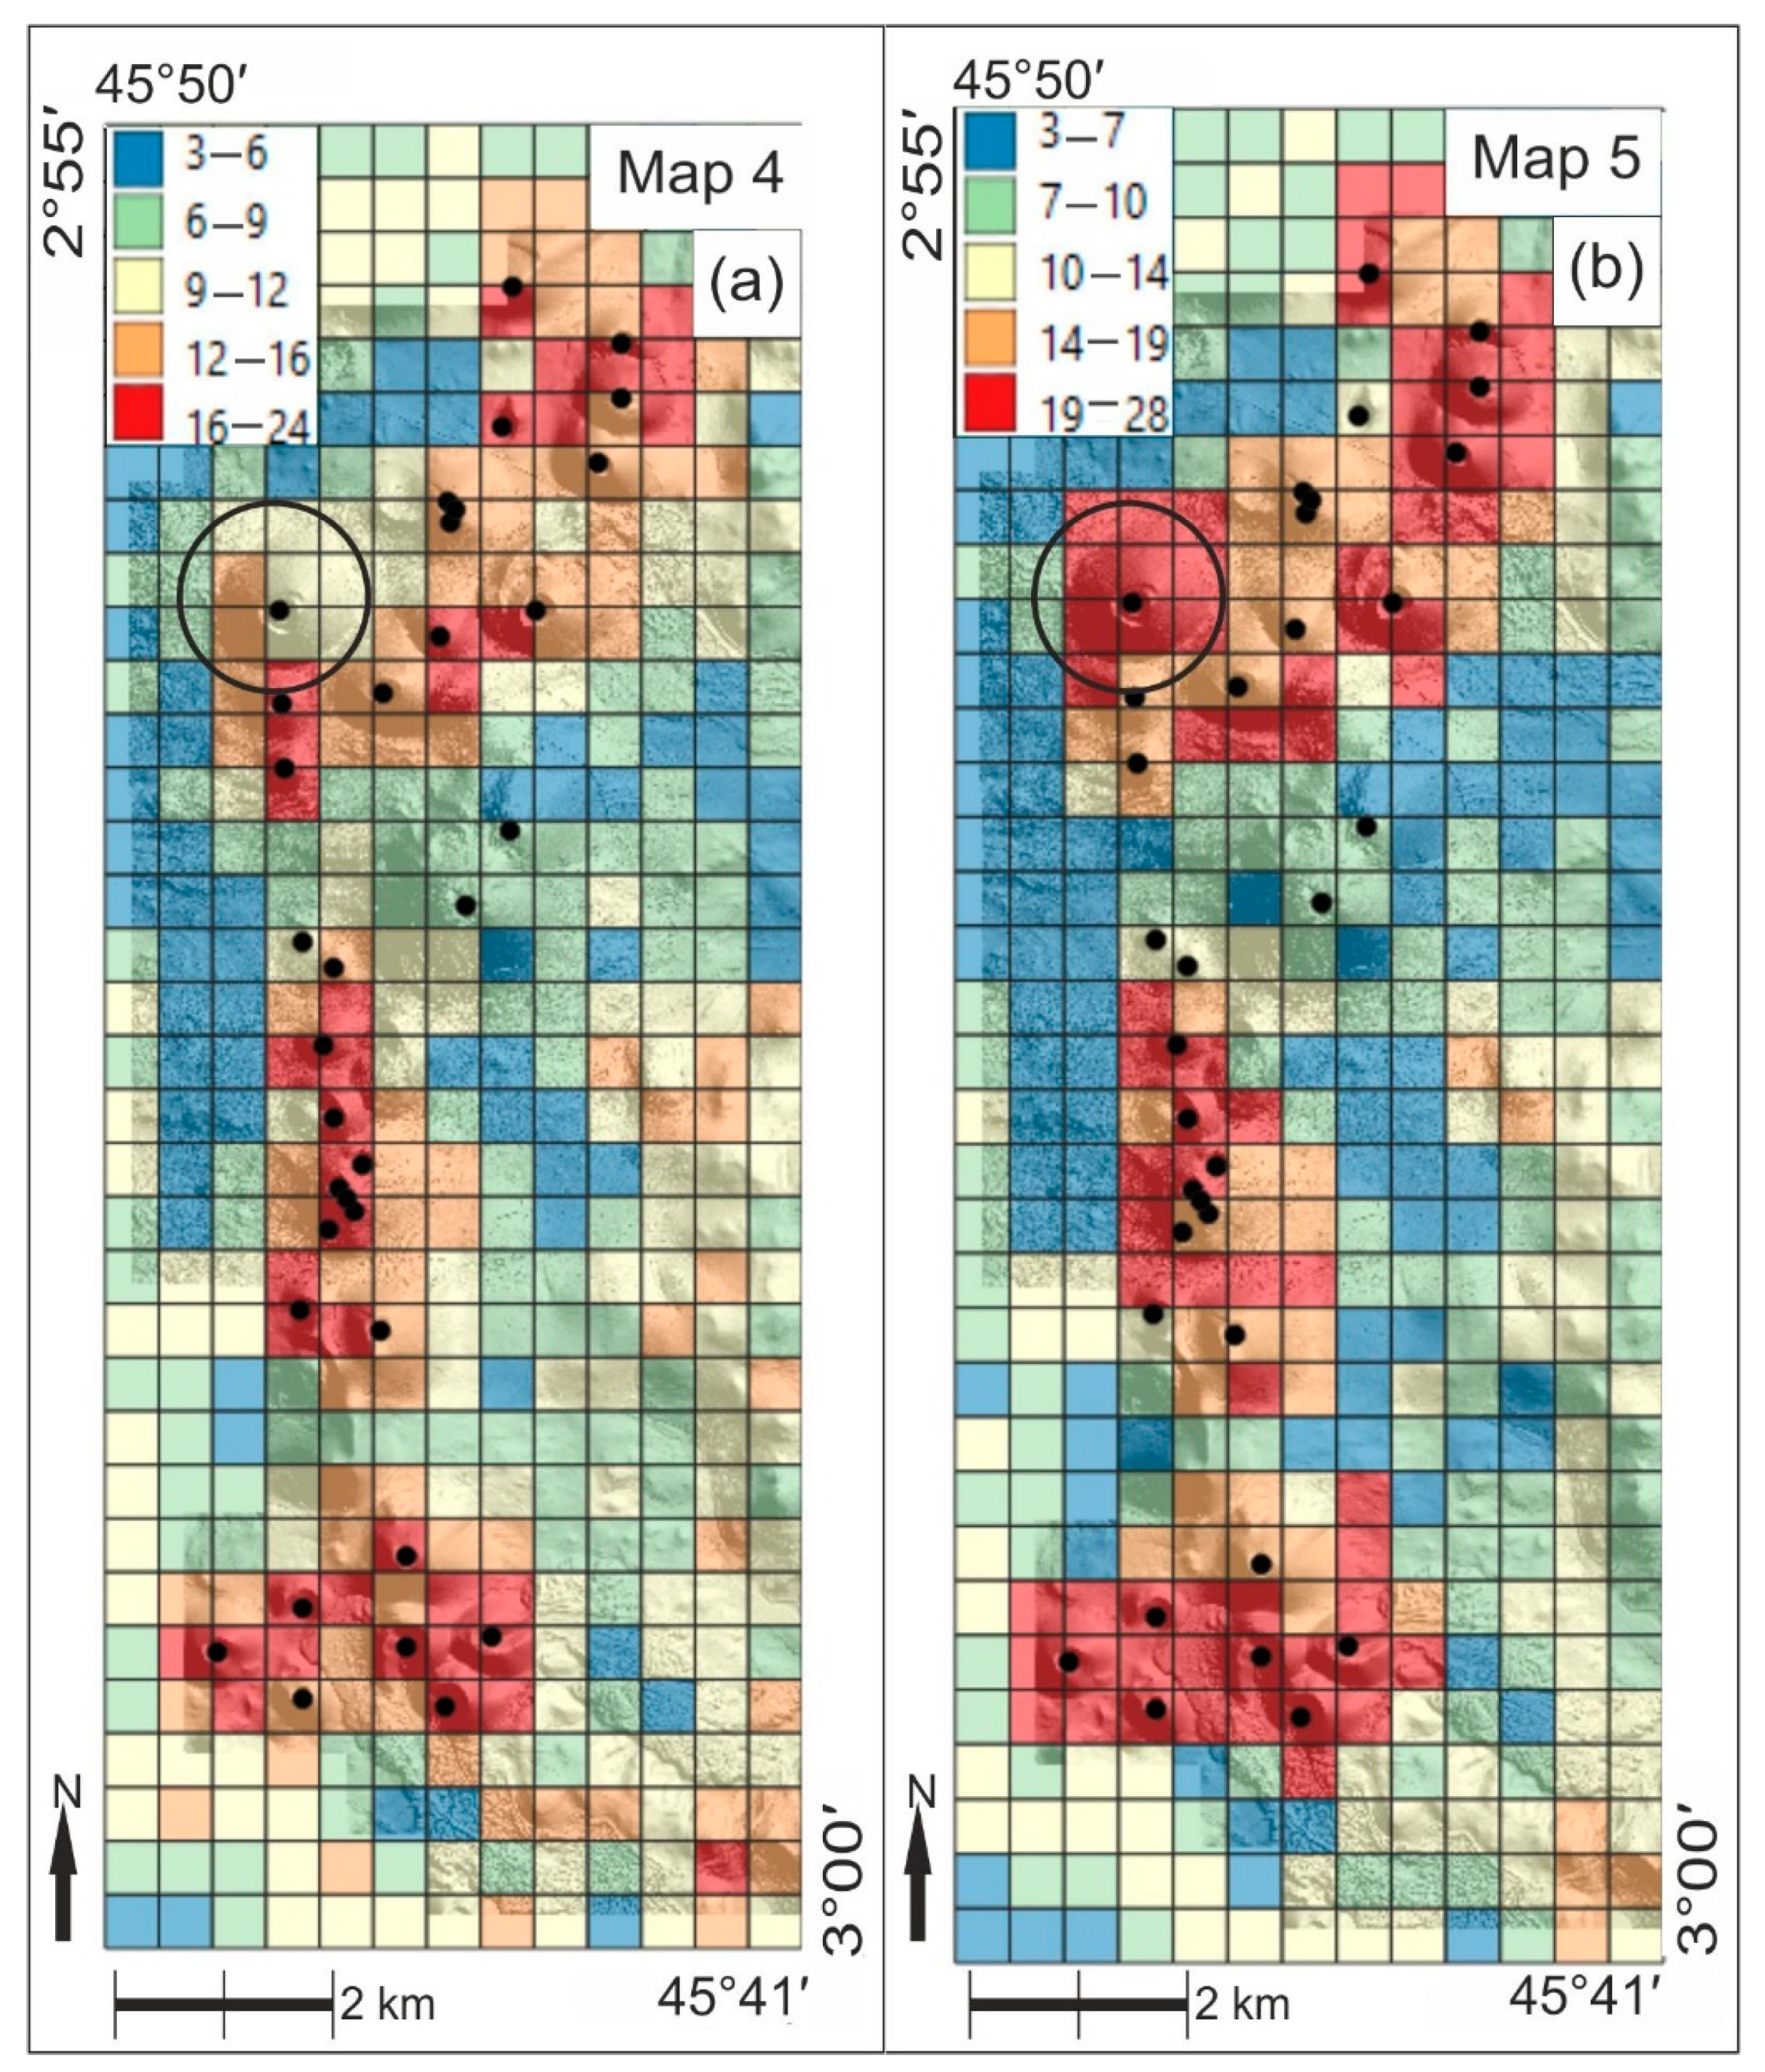
We also examined what map we would get in the case of adding the abovementioned new subindices to the original methodology supplemented with geomorphons. The chain of cones also appears here, and the areas outside have become much more diverse owing to the geomorphons (Figure 10).
We emphasize that Puy de Côme, which is an intact, regular cone (black circle), is suppressed in Map 4, whereas Map 5 enhances it like other volcanic features. The difference between the two maps is that to create Map 4, the number of different sectors were calculated. Based on Figure 5 left panel, Puy de Côme has slope values from 25° to 29°, which fall into groups G12–13 and 14. Thus, in terms of symmetry, it does not add much value to the subindex. In contrast, for Map 5, median slope values were used. As it is also a relatively steep cone, it stands out nicely from its surroundings based on these values.
The minimum and maximum values of the various subindices (original and the new) are listed in Table 2 according to Maps 1–5. The total possible minimum and maximum range shows the changes between the different maps. As we did not calculate the maximum value from all the subindices, we did not reach the maximum values shown here in either case.

4. Discussion

For comparison, an index map (Figure 11) is compiled using the figures (Map 1–Map 5).
Despite the high aesthetic values that are attributed to various volcanic forms of this geoheritage site of Chaîne des Puys, the attempt to describe this by standard geodiversity analysis is unsatisfying (see Map 1). The reasons for this are:
  • The subindex for paleontological diversity is obviously zero, as there are no fossils in volcanic rocks (not presented here);
  • The geological subindex due to the small-scale base material is mapped as rather uniform for the whole scoria cone (some lava flows may add variability at places), and consequently the geological subindex will also be very low;
  • Due to the formation of the cones, the slopes are uniform as well; this way, the major geomorphic descriptors, the geomorphons, will not vary considerably (Figure 11, cf. Figure 6b).
Examining Figure 12, several observations can be made. In the case of the Chaîne des Puys, the spatial arrangement, an essential element of the chain, is a very important landscape characteristic. However, in the original geodiversity map (supplemented with geomorphons), the scoria cones are clearly characterized by low values (Figure 12a1,b1), whereas on Map 2, 4 and 5, these features are represented with higher geodiversity indices. The panels of Figure 11 indicate that the introduction of volcano-specific subindices increased the geodiversity index in the presence of the scoria cones, but the original geodiversity in other areas is kept as well. No suppression can be observed in the non-volcanic areas.
Owing to the fact that our additional subindex for volcanic areas is just an addition to the well-established, globally applied geodiversity calculation; the additional subindex does not influence the geodiversity increase caused by non-volcanic features, i.e., the proposed combination preserves both volcanic and non-volcanic features of the landscape. The new volcanic subindex produces the most significant change where two or more volcanic forms touch each other. This is also valid from a theoretical point of view: these areas are characterized by varying footwall slopes, resulting in landscape complexity, and thus in the potential for aesthetic values and even suitability for recreational purposes.
Examining these aspects, we conclude that the best method to use is that in which the geomorphology subindex values were calculated with the addition of two variables to the original methodology plus geomorphons. The two extra elements are cone presence in a certain cell (score 0 or 1) and the median of sector values in a certain cell (Map 5).
In consequence, a more general statement can also be formulated: the proposed “volcanic” subindex seems to partially solve the low performance of volcanic cones in geodiversity calculations. As we consider both the uniform slopes (for the symmetry) and the presence of asymmetry (via the sectorial approach), the subindex accounts for:
  • the conical shapes with uniform slopes that are described by slope categories.
  • the asymmetry, either due the original volcanogenic processes or post-volcanic collapses, other mass movements, or erosional features.
  • the chains of partly overlapping conical forms, parasite cones, etc.
The use of median values of the slope angles makes the subindex robust: man-made features including quarries, road cuts, and other disturbances in the homogenous slopes do not influence the index values considerably.

5. Conclusions

  • The proposed geodiversity subindex performs well in highlighting the volcanic cones and volcanic chains.
  • The resulting (integrated) geodiversity index works both in the volcanic field and outside.
  • Resolution issues should be solved; however, if high-resolution LiDAR DTM is available, this problem is subordinate.
  • Further studies are needed in other volcanic fields of the world for verification; however, we propose that the modified method is robust and can already be generally used.
  • Further modifications for other special landform types, such as faults, sand dunes, and karst, could be incorporated.
The last point shows that standard geodiversity analysis on DTMs can miss important elements, but with a first step of landform identification, modified approaches can solve this. This also opens up the window to link quantitative analysis with aesthetic appreciation.

Author Contributions

Conceptualization, B.S.; methodology, software M.P. and F.V.; validation, M.P., F.V. and B.v.W.d.V.; formal analysis, B.v.W.d.V.; investigation ALL; resources, B.v.W.d.V., M.P. and F.V.; writing—original draft preparation, ALL; writing—review and editing, B.v.W.d.V. and F.V.; visualization, M.P. and F.V.; supervision, B.S. All authors have read and agreed to the published version of the manuscript.

Funding

This research was partly conducted under the framework of UNESCO IGCP project 692–“Geoheritage for Geohazard Resilience”. B.v.W.d.V. received support from the Agence Nationale de la Recherche of the French Government, through the programme ‘investissements d’Avenir’ (16-IDEX-0001 CAP 20-25) and F.V. was supported by the ÚNKP-20-3 New National Excellence Program of the Ministry for Innovation and Technology from the source of the National Research, Development and Innovation fund.

Conflicts of Interest

The authors declare no conflict of interest. The funders had no role in the design of the study; in the collection, analyses, or interpretation of data; in the writing of the manuscript, or in the decision to publish the results.

References

  1. Gray, M. Valuing and Conserving Abiotic Nature; John Wiley & Sons, Ltd.: Hoboken, NJ, USA, 2004; ISBN 0470848952. [Google Scholar]
  2. Kozłowski, S. Geodiversity. The concept and scope of geodiversity. Prz. Geol. 2004, 52, 833–837. [Google Scholar]
  3. Serrano, E.; Ruiz-Flaño, P. Geodiversity: A theoretical and applied concept. Geogr. Helv. 2007, 62, 140–147. [Google Scholar] [CrossRef]
  4. Pereira, D.I.; Pereira, P.; Brilha, J.; Santos, L. Geodiversity assessment of Paraná State (Brazil): An innovative approach. Environ. Manag. 2013, 52, 541–552. [Google Scholar] [CrossRef] [PubMed] [Green Version]
  5. De Paula Silva, J.; Rodrigues, C.; Pereira, D.I. Mapping and Analysis of Geodiversity Indices in the Xingu River Basin, Amazonia, Brazil. Geoheritage 2015, 7, 337–350. [Google Scholar] [CrossRef] [Green Version]
  6. Balaton-Felvidék—Wikipédia. Available online: https://hu.wikipedia.org/wiki/Balaton-felvidék (accessed on 29 December 2020).
  7. Székely, B.; Vörös, F. Studying the distributions of DTM derivatives of cinder cones: A statistical approach in volcanic morphometry. EGU Gen. Assem. 2020, 10465. [Google Scholar] [CrossRef]
  8. Vörös, F.; van Wyk de Vries, B.; Guilbaud, M.-N.; Székely, B. Comparative geomorphometric analysis of scoria cones of Chaîne desPuys (France) and Sierra Chichinautzin (Central México). EGU Gen. Assem. 2018, 20, 1163. [Google Scholar]
  9. Soulé, M.E.; Wilcox, B.A. Conservation Biology: An Evolutionary-Ecological Perspective; Sinauer Associates Inc.: Sunderland, MA, USA, 1980; ISBN 978-0-87893-800-1. [Google Scholar]
  10. Wilcox, B.A. In situ conservation of genetic resources: Determinants of minimum area requirements. Natl. Park. Conserv. Dev. 1984, 639–647. [Google Scholar] [CrossRef]
  11. Tangley, L. A New Plan to Conserve the Earth’s Biota. Bioscience 1985, 35, 334–337. [Google Scholar]
  12. Minelli, A.; Bonato, L. Diversity of Life. In eLS; John Wiley & Sons, Ltd.: Chichester, UK, 2012; pp. 1–7. ISBN 9780470015902. [Google Scholar]
  13. Gray, M. Geodiversity: The origin and evolution of a paradigm. Geol. Soc. Lond. Spec. Publ. 2008, 300, 31–36. [Google Scholar] [CrossRef]
  14. Gray, M. Geodiversity: The Backbone of Geoheritage and Geoconservation; Elsevier Inc.: Amsterdam, The Netherlands, 2018; ISBN 9780128095423. [Google Scholar]
  15. De Vries, B.V.W.; Hagos, M.; Guilbaud, M. Geoheritage, Geodiversity and natural landscape enhanced and protected through anthropogenic activity: A case study using the Chaîne des Puys and Limagne Fault, Afar and Mexico City. EGU Gen. Assem. Conf. Abstr. 2015, 17, 15542. [Google Scholar]
  16. Wood, C.A. Morphometric analysis of cinder cone degradation. J. Volcanol. Geotherm. Res. 1980, 8, 137–160. [Google Scholar] [CrossRef]
  17. Wood, C.A. Morphometric evolution of cinder cones. J. Volcanol. Geotherm. Res. 1980, 7, 387–413. [Google Scholar] [CrossRef]
  18. Van Wyk de Vries, B.; Márquez, A.; Herrera, R.; Granja Bruña, J.L.; Llanes, P.; Delcamp, A. Craters of elevation revisited: Forced-folds, bulging and uplift of volcanoes. Bull. Volcanol. 2014, 76, 875. [Google Scholar] [CrossRef]
  19. Németh, K.; Kereszturi, G. Monogenetic volcanism: Personal views and discussion. Int. J. Earth Sci. 2015, 104, 2131–2146. [Google Scholar] [CrossRef]
  20. Porter, S.C. Distribution, morphology, and size frequency of cinder cones on mauna kea volcano, hawaii. Bull. Geol. Soc. Am. 1972, 83, 3607–3612. [Google Scholar] [CrossRef]
  21. Colton, S.H. The basaltic cinder cones and lava flows of the San Francisco Mountain volcanic field. Mus. N. Ariz. Bull. 1937, 10, 1–49. [Google Scholar]
  22. Settle, M. The structure and emplacement of cinder cone fields. Am. J. Sci. 1979, 279, 1089–1107. [Google Scholar] [CrossRef]
  23. Tanaka, K.L.; Shoemaker, E.M.; Ulrich, G.E.; Wolfe, E.W. Migration of Volcanism in the San-Francisco Volcanic Field, Arizona. Geol. Soc. Am. Bull. 1986, 97, 129–141. [Google Scholar]
  24. Hooper, D.M.; Sheridan, M.F. Computer-simulation models of scoria cone degradation. J. Volcanol. Geotherm. Res. 1998, 83, 241–267. [Google Scholar] [CrossRef]
  25. Tibaldi, A. Morphology of pyroclastic cones and tectonics. J. Geophys. Res. Solid Earth 1995, 100, 24521–24535. [Google Scholar] [CrossRef]
  26. Favalli, M.; Karátson, D.; Mazzarini, F.; Pareschi, M.T.; Boschi, E. Morphometry of scoria cones located on a volcano flank: A case study from Mt. Etna (Italy), based on high-resolution LiDAR data. J. Volcanol. Geotherm. Res. 2009, 186, 320–330. [Google Scholar] [CrossRef]
  27. Fornaciai, A.; Favalli, M.; Karátson, D.; Tarquini, S.; Boschi, E. Morphometry of scoria cones, and their relation to geodynamic setting: A DEM-based analysis. J. Volcanol. Geotherm. Res. 2012, 217–218, 56–72. [Google Scholar] [CrossRef]
  28. Boivin, P.; Besson, J.C.; Briot, D.; Camus, G.; de Goër, A.; Gourgaud, A.; Labazuy, P.; de Larouzière, D.; Livet, M.; Mergoil, J.; et al. Volcanologie de la Chaîne des Puys, Carte et Fascicule. 2004. Available online: https://www.esrifrance.fr/iso_album/p10_11.pdf (accessed on 30 December 2020).
  29. Miallier, D.; Pilleyre, T.; Sanzelle, S.; Boivin, P.; Lanos, P. Numéro 4 Revised chronology of the youngest volcanoes of the chaîne des puys (french Massif central), Quaternaire. Quat. Rev. l’Assocation Fr. l’étude Quat. 2012, 23, 283–290. [Google Scholar] [CrossRef]
  30. Miallier, D.; Boivin, P.; Deniel, C.; Gourgaud, A.; Lanos, P.; Sforna, M.; Pilleyre, T. La dernière éruption sommitale du Puy de Dôme (Chaîne des Puys, Massif central français), il y a environ 10 700 ans. Comptes Rendus Geosci. 2010, 342, 847–854. [Google Scholar] [CrossRef]
  31. Petronis, M.; van Wyk de Vries, B.; Garza, D. The Leaning Puy de Dôme (Auvergne, France) tilted by shallow intrusions. Volcanica 2019, 2, 161–186. [Google Scholar] [CrossRef]
  32. Langley, R.B. RTK GPS. GPS World 1998, 9, 70–75. [Google Scholar]
  33. Kraus, K.; Pfeifer, N. Determination of terrain models in wooded areas with airborne laser scanner data. ISPRS J. Photogramm. Remote Sens. 1998, 53, 193–203. [Google Scholar] [CrossRef]
  34. 2011_site_puy_de_dome_lidarverne-Fichiers-Drive Opendata du CRAIG. Available online: https://drive.opendata.craig.fr/s/opendata?path=%2Flidar%2Fautres_zones%2F2011_site_puy_de_dome_lidarverne (accessed on 29 December 2020).
  35. Vörös, F.; van Wyk de Vries, B.; Székely, B. Geomorphometric descriptive parameters of scoria cones from different dtms: A resolution invariance study. In Proceedings of the 7th International Conference on Cartography and GIS, Sozopol, Bulgaria, 18–23 June 2018; pp. 603–612. [Google Scholar]
  36. Shields, J. The Morphometry of the Chaine des Puys; Université Blaise Pascal: Clermont-Ferrand, France, 2010. [Google Scholar]
  37. Cartes Géologiques Départementales à 1/50 000 (Bd Charm-50); Bureau de Recherches Géologiques et Minières (French Geological Survey): Orléans, France, 2004.
  38. ESDAC European Soil Database v2.0. Available online: https://esdac.jrc.ec.europa.eu/ (accessed on 29 December 2020).
  39. EuroGeoSurveys Mineral Resources Map. Available online: http://www.europe-geology.eu/mineral-resources/mineral-resources-map/ (accessed on 29 December 2020).
  40. Jasiewicz, J.; Stepinski, T.F. Geomorphons—A pattern recognition approach to classification and mapping of landforms. Geomorphology 2013, 182, 147–156. [Google Scholar] [CrossRef]
  41. Jenks, G.F. The Data Model Concept in Statistical Mapping. Int. Yearb. Cartogr. 1967, 7, 186–190. [Google Scholar]
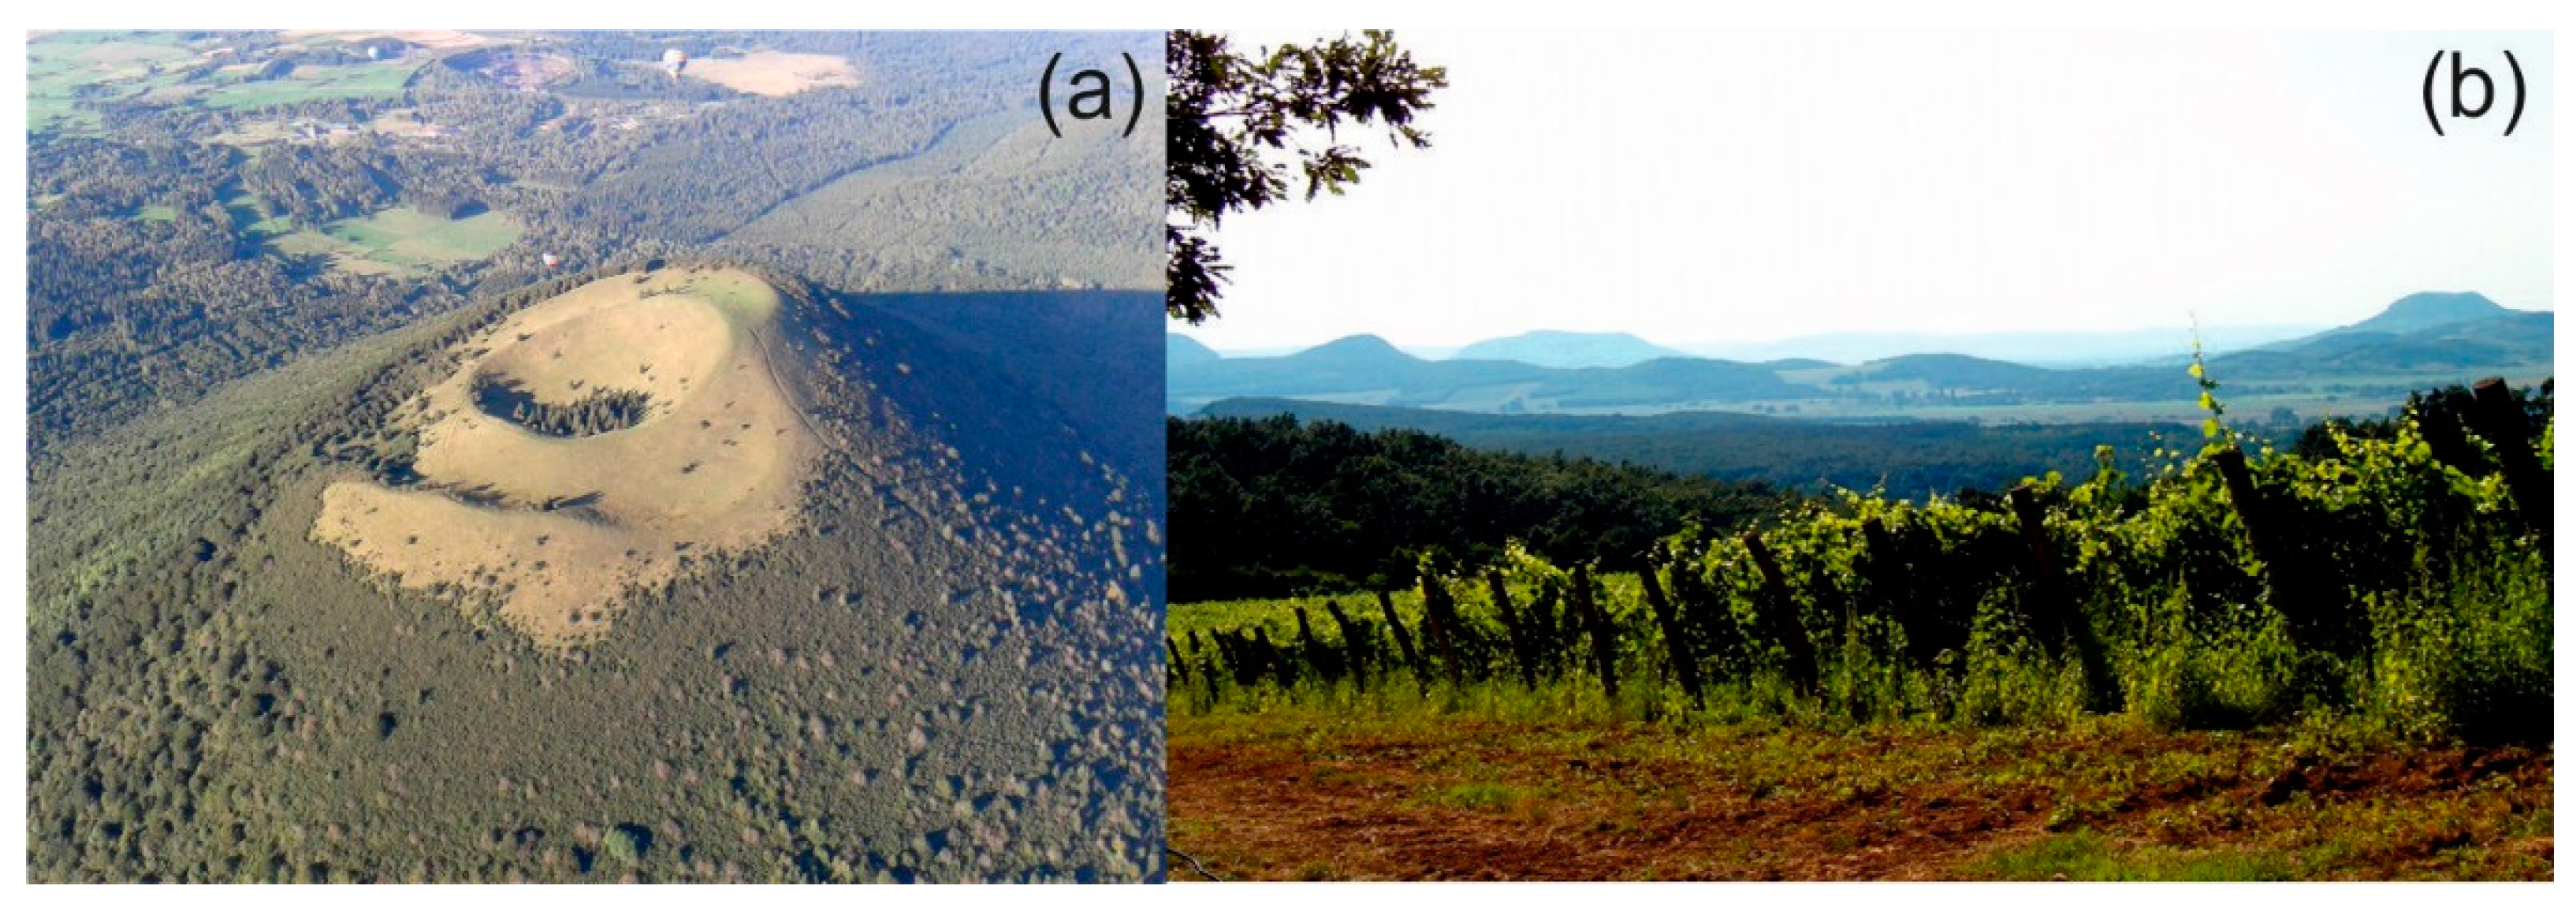
Figure 1. (a) A simple, regular scoria cone: Puy de Côme in Chaîne des Puys, Auvergne, France. (b) View of Balaton Uplands, Hungary: vineyards planted on the slopes of Pleistocene scoria cones. Source: [6].
Geosciences 11 00058 g001
Figure 2. Chain of scoria cones in the Chaîne des Puys volcanic area.
Geosciences 11 00058 g002
Figure 3. Relationships between volcanic parameters. Wcr = crater width, Dcr = crater depth, Hco = cone height, Wco = basal width of cone, α = maximum slope angle (based on [20]).
Geosciences 11 00058 g003
Figure 4. Shaded Light Detection and Ranging (LiDAR) digital terrain models (DTM) of the study are shown with the 500 m × 500 m data grid (described in Section 2.6). Thematic data were determined for every cell. Source of the DTM: [34]. Red outlines are indicating the extents of the studied scoria cones.
Geosciences 11 00058 g004
Figure 5. Sectoral division of Puy de Côme (left panel) and Puy de la Vache (right panel): values represent degrees (median slope angles of each sectors).
Geosciences 11 00058 g005
Figure 6. (a) Shaded relief map for orientation. (b) Geomorphons. (c) Geomorphological subindex produced from these data. Black dots indicate the scoria cone centers.
Geosciences 11 00058 g006
Figure 7. The examined 24 + 2 scoria cones in sectoral divisions. Values represent the groups derived from median values.
Geosciences 11 00058 g007
Figure 8. Geodiversity map of the examined area (Map 1). The values were calculated according to the original method [4] but with the use of geomorphons. Black dots indicate the scoria cone centers. The oval indicate basement areas with high geodiversity values.
Geosciences 11 00058 g008
Figure 9. Geodiversity maps of the examined area. (a) Geomorphology subindex values were calculated with the addition of two variables: cone presence in a certain cell (score 0 or 1) and the number of different sectors in a certain cell (Map 2). (b) Geomorphology subindex values were calculated with the help of two variables: cone presence in a certain cell (score 0 or 1) and the median of sector values in a certain cell (Map 3). Black dots indicate the scoria cone centers.
Geosciences 11 00058 g009
Figure 10. Geodiversity maps of the examined area. (a) Geomorphology subindex values were calculated with the addition of two variables to the original methodology plus geomorphons: cone presence in a certain cell (score 0 or 1) and the number of different sectors in a certain cell (Map 4). (b) Geomorphology subindex values were calculated with the addition of two variables to the original methodology plus geomorphons: cone presence in a certain cell (score 0 or 1) and the median of sector values in a certain cell (Map 5). Black dots indicate the scoria cone centers.
Geosciences 11 00058 g010
Figure 11. Comparison of the calculated geodiversity maps (see above).
Geosciences 11 00058 g011
Figure 12. Two example areas of the examined area: (a) Puy de Côme and its surrounding area (top row); (b) Puy de Montchié (bottom row) and its surrounding area. The numbers refer to the map (Figure 8, Figure 9 and Figure 10) from which the cutout was made (see above).
Geosciences 11 00058 g012
Table 1. The minimum and maximum values of the various subindices.
SubindexMinimumMaximum
geological18
pedological12
mineral/paleontological00
geomorphologicalrelief19
hydrology01
volcano index018
Table 2. Summary table of the used minimum and maximum subindices. The original values (Map 1) [4] are supplemented by the new subindex we created.
SubindexMap 1Map 2Map 3Map 4Map 5
geological1–81–81–81–81–8
pedological1–21–21–21–21–2
mineral/paleontological00000
geomorphologicalrelief1–9001–91–9
hydrology0–10–10–10–10–1
volcano indexcone existence00–10–10–10–1
number of different sectors00–1100–110
median of sectors000–1600–16
total (possible minimum–possible maximum)3–202–232–283–323–37
Publisher’s Note: MDPI stays neutral with regard to jurisdictional claims in published maps and institutional affiliations.