Article

Laboratory Measurements to Image Endobenthos and Bioturbation with a High-Frequency 3D Seismic Lander

1
Leibniz Institute for Baltic Sea Research Warnemünde, 18119 Rostock, Germany
2
Institute of Geosciences, Christian-Albrechts-Universität zu Kiel, 24118 Kiel, Germany
*
Author to whom correspondence should be addressed.
Geosciences 2021, 11(12), 508; https://doi.org/10.3390/geosciences11120508
Submission received: 15 October 2021 / Revised: 3 December 2021 / Accepted: 7 December 2021 / Published: 10 December 2021
(This article belongs to the Collection Early Career Scientists’ (ECS) Contributions to Geosciences)

Abstract

:
The presented 3D seismic system operates three transducers (130 kHz) from a stationary lander and allows non-destructive imaging of small-scale objects within the top decimeters of silty sediments, covering a surface area of 0.2 m2. In laboratory experiments, samples such as shells, stones, and gummy worms of varied sizes (down to approx. 1 cm diameter) could be located in the 3D seismic cube to a depth of more than 20 cm and differentiated by a reflected amplitude intensity and spatial orientation. In addition, simulated bioturbation structures could be imaged. In a practical application, the system allows to determine the abundance of endobenthos and its dynamic in muddy deposits in-situ and thus identify the intensity of local bioturbation.

1. Introduction

Benthic organisms change the seafloor in diverse ways to adjust it to their habitat demands. They can infiltrate the seafloor to a variable depth and create structures of short-term (e.g., burrows, [1]) and long-term existence (e.g., shell fragments, [2]). Most benthic macrofauna lives in the uppermost 10 cm of the subsurface [3], and active bioturbation is strongest in this depth interval. By reworking the sediment, bioturbation is a key process in exchange processes at the water-sediment interface [4].
The physical sampling of macrofauna is conducted by invasive methods, using various kinds of grabs, dredges, and corers in sedimentary habitats [5,6]. For quantitative macrofaunal analysis, material recovered by grabs is sieved, and most information on the spatial arrangement is lost. For cores, the vertical resolution is controlled by the scaling of potential subsamples, while information on the horizontal arrangement is mostly lost. Further disturbances from before taking a core until transportation to the laboratory and handling there are summarized by [7]. Resin casts and in situ sediment profile imaging can resolve the spatial structure of the endobenthos [8,9]. However, both methods disturb the seafloor habitat and capture only small areas. Extracting sediment and transport to the laboratory is also necessary for X-radiography [10] and CT scans [11,12,13]. Besides invasive sampling methods, imaging techniques are a valuable tool to investigate benthic organisms. Technological improvements in recent years make camera equipment of high-resolution applicable in marine environments [14]. In situ imaging of epibenthos is conducted using video techniques and software for image analysis and classification [15,16]. For endobenthos, optical imaging methods allow only indirect detection, e.g., in the form of burrow casts and pits [17].
Hydroacoustic surveys by multibeam echo sounders and side-scan sonar aim to measure the bathymetry and the backscatter strength of the seafloor [18]. Backscatter maps mostly correlate to abiotic seafloor properties such as sediment grain size [19]. However, recent developments aim to derive biotic parameters from acoustic data [20,21,22,23,24,25]. The backscatter level depends, besides the physical seafloor properties itself, on the incidence angle and frequency of the acoustic wave. It includes scatter at the seafloor-water interface and a volume scatter part as the acoustic wave propagates into the subsurface. Buried objects, including endobenthos, impact volume scatter [2,10]. Besides surface scatter, volume backscatter can become the major contributor to the backscatter strength [26], but hydroacoustic surveys cannot easily detect individual objects contributing to volume scatter. Meanwhile, non-destructive acoustic remote sensing is an actively developing field of research that allows the establishment of time series, e.g., to investigate seasonal changes.
3D reflection seismic systems designed to study the subsurface increased in the resolution during the last decades [27,28]. Now they range from industrial standards with mile-long streamers to small, individual 3D sub-bottom profiling systems with a decimeter resolution. The latter systems are sufficient for the detection of objects in a decimeter scale for special engineering or archeological surveys [29,30,31]. However, even very high-resolution 3D seismic systems cannot resolve the cm-scale structures, e.g., of biological origin. In principle, the detection of buried, cm-sized objects by high-frequency acoustic transducers in the upper decimeters of a sediment substrate is possible. Objects of previous investigations included, e.g., gas bubbles of up to 6 mm diameter down to 6 cm sediment depth targeted at 1.0–2.27 MHz [32], clams and artificial worm tubes targeted at 1.6 MHz along with 2D profiles with a horizontal resolution of 20 mm [33], clams buried in glass beads of different size investigating the effect of grain size on the signal at 1 MHz [34], lotus roots with a diameter of 2.5–3 cm at 100 kHz [35], including seasonal monitoring [36], the effect of artificial burrows and worm tubes on sound speed and attenuation at 100–400 kHz [37], artificial cylinders as a substitute for telecommunications cables targeted with a 75 kHz sweep at sample spacing of 2–5 cm [38], and trawl marks targeted with a parametric array of 40 transducers at 30–300 kHz [39]. If applied to biological and biogeochemical studies, these non-invasive methods minimize the risk of relocating endobenthic structures during measurement, prevent disturbance during transportation, and preserve unstable sediment surfaces. In addition, they allow surveying a larger number of stations, which is important given the high spatial heterogeneity in shallow-water sedimentary settings.
In this proof-of-concept laboratory study, we evaluate if a stationary high frequency 3D seismic system with three 130 kHz acoustic transducers can detect cm-scale structures and bioturbation traces in marine mud.

2. Materials and Methods

2.1. 3D Seismic Lander System

Three identical, uncalibrated transducers (type Benthowave 7652, 15° opening angle at −3 dB) are the basic elements of a newly designed 3D seismic system, which was developed to be installed on a seafloor-lander system (Figure 1). The transducers were mounted with a fixed distance of 15 cm to each other and a grazing angle of 90° to the seafloor. Two programmable step motors move the transducer array. The central control unit, an Intel NUC, controls the position of 2 step motors via an USB-RS232 converter and activates the transducer via relay control. An AD/DA converter records the acoustic signal with a sampling rate of 3 MHz. The system was powered by 2 rechargeable batteries and can be mounted to a lander module or mooring, allowing future field studies. In the laboratory experiments, the transducers were operated at a frequency of 130 kHz, generating a signal form of 2 sine periods. Shot points were located on a square 2.5 mm grid, covering a total surface area of 45 cm × 45 cm. At each shot point, 20 repeated measurements were conducted and later stacked to enhance the signal-to-noise ratio. The signal record length was 1500 μs. A delay of 200 μs was required after signal transmission to switch the transducer into the receiving mode. Measuring the entire volume required 2.5 h, resulting in a data set recorded in SEGY format of 5.91 GB.

2.2. Test Setup

A plastic box with 21 cm thick layer of soft sediments was placed in a plastic tank of ca. 0.6 m3 (dimensions of the tank were 1.2 × 0.8 × 0.65 m) filled with purified water at a temperature of 17.5 °C for the laboratory experiments. The homogeneous sediment, with a median grain size of around 32 µm in the range of silt, was collected by repeated grab sampling from an offshore basin (Mecklenburg Bay, western Baltic Sea) at approximately 20 m water depth in 2018 and sieved through a 2 mm-mesh size to remove coarse components such as living mussels and shell hash that would have interfered with our experiments. The 3D seismic system was mounted on top of the plastic tank. The transducers were placed at a distance of 30 ± 2 cm to the sediment surface (Figure 1). The system designed to run autonomously from a battery pack was contained in a waterproof housing.
Buried objects of assorted size and material were used in the experimental setups. The objects included single, empty seashells (2.7–3.7 cm diameter), stones (1.0–5.5 cm length), and fruit gummy worms (11.5 cm length, 0.7 cm diameter). The form and size of the gummy worms resembled common annelids, e.g., the lugworm Arenicola marina. Gummy worm length extended to approximately 13 cm and diameter to approximately 1.05 cm after contact with water over a time of 3 h, while density decreased from 1 g/cm3 to 0.7 g/cm3. Parameters to describe variations in placement considered during the experiment series included depth below the sediment surface, distance to the next object, vertical overlap of objects, and, in the case of asymmetrical seashells, the orientation of the object. Objects were placed in the inner 30 cm × 30 cm of the measured area. In the case of stones and shells, objects were placed at least one day before measuring to allow the sediment to settle following placement. The measurements involving fruit gummy worms were conducted immediately after the placement to avoid expansion and disintegration. Other setups with no objects included different depths of manual sediment disturbance. Bioturbation of the sediment was simulated either by manual disturbance or by pushing a spatula to various depths into the sediment. In total, we measured 26 different setups over 4 months, during which noticeable compaction of the substrate took place. Sediment resuspension during object exchange with the following deposition outside the sediment box contributed to a decrease in sediment thickness and a slight increase in the distance between transducer and sediment surface.

2.3. Processing

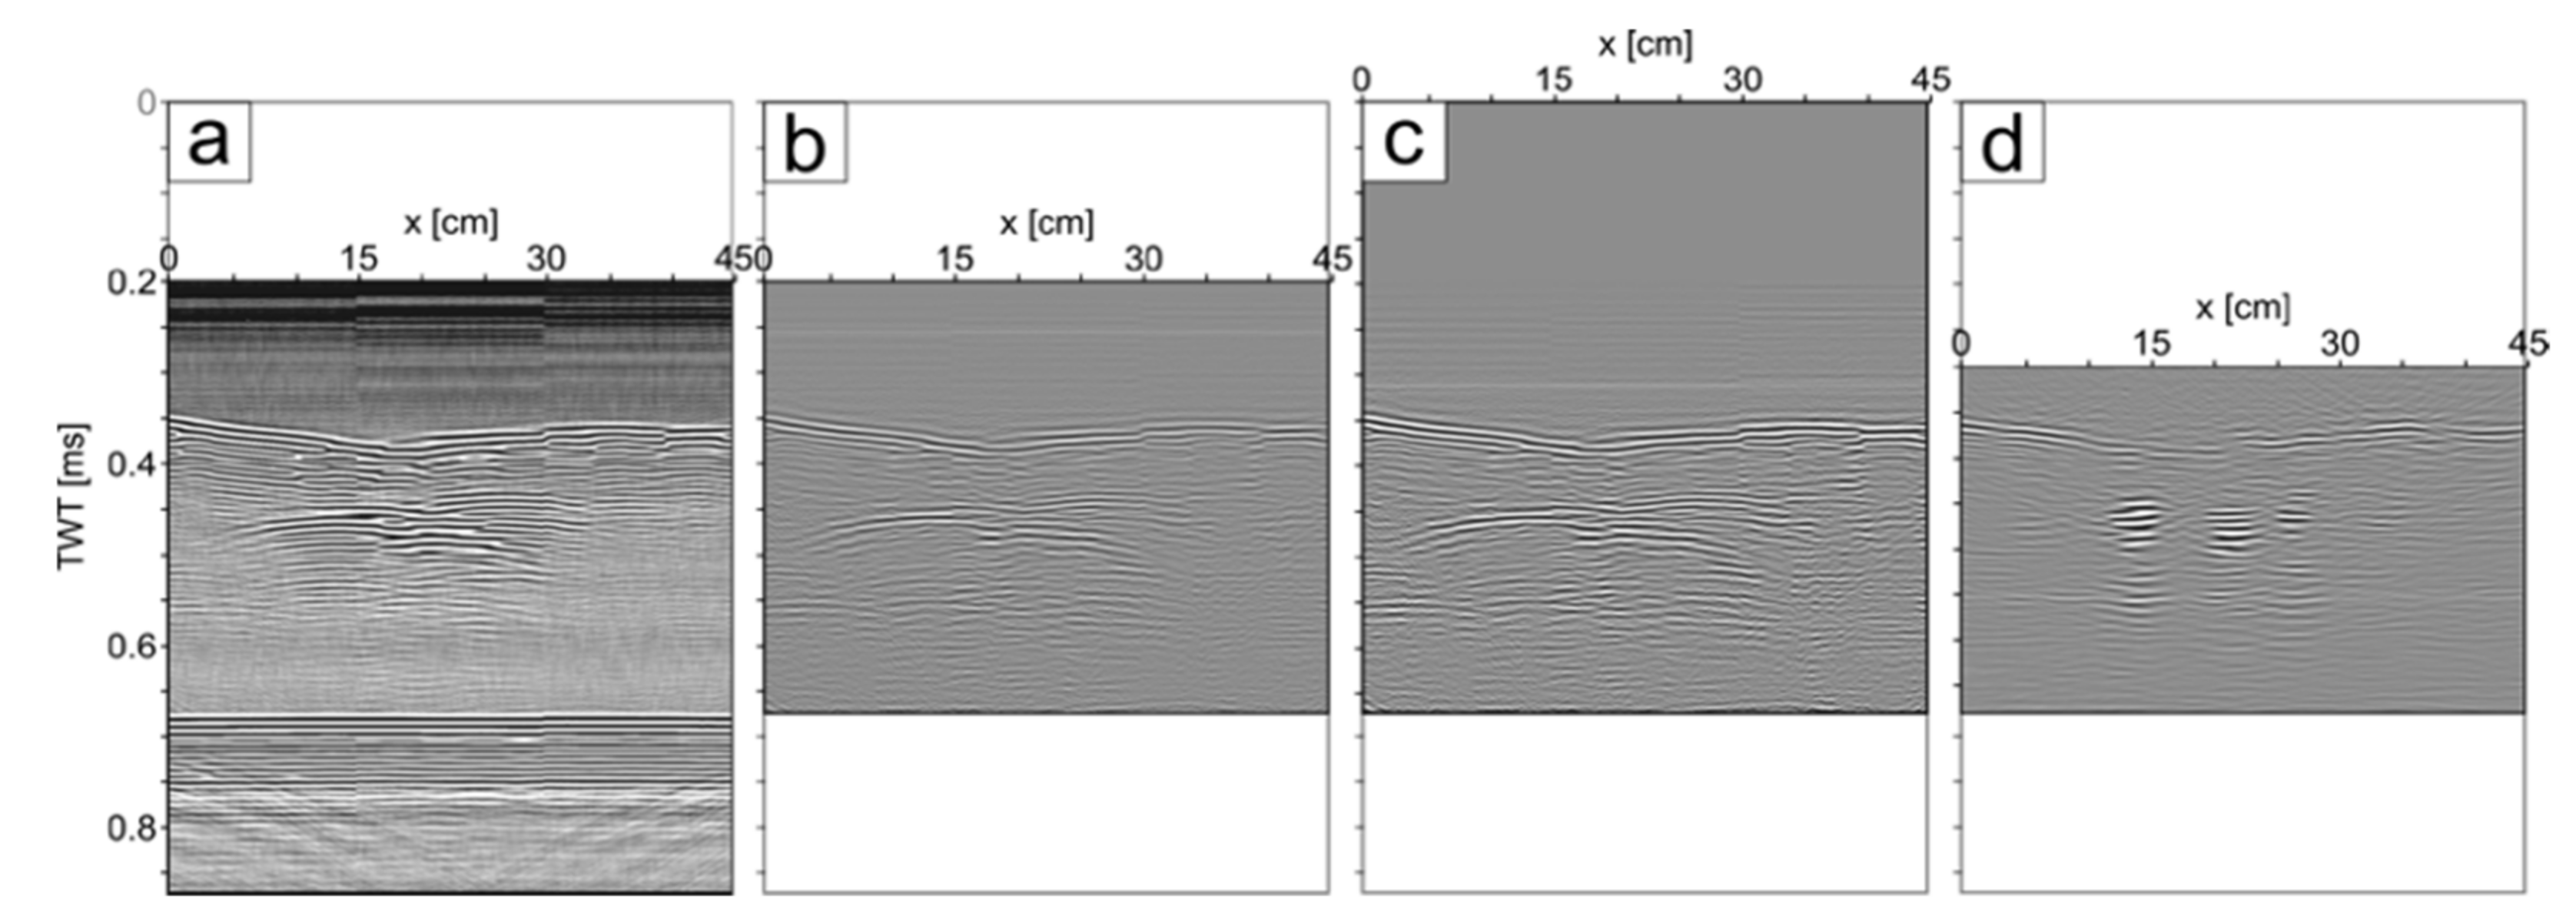
Processing of the seismic data uses functions from the open-source package Seismic Unix [40]. A visualization of the following processing steps is displayed in Figure 2. Processing included the reading of SEGY files, stacking of 20 shots per trace, and cutting the data to 0.68 ms TWT (two-way travel time) in order to remove the box bottom indicated by very high-amplitude reflections. After applying an automatic gain correction to the traces, a deconvolution (Wiener predictive error filtering) with later bandpass filtering (trapezoidal corner frequencies at 60, 90, 140, 280 kHz) was used to improve the vertical resolution and suppress the effect of reverberation. The dataset was imported to MATLAB by using the function of the open-source package SegyMAT [41]. The traces were padded with zeros from the start of recording to 0.2 ms, and trace normalization was applied. Bulk shifting of one transducer’s traces by 2 sample intervals compensated for a small inaccuracy in the construction and ensured the continuous alignment of reflectors. A 3D Stolt migration, assuming a constant sound velocity of 1480 m/s was applied to improve the lateral resolution. Details on the theory and application of the 3D Stolt migration were given by [42]. The theoretical limit of vertical resolution for the experimental setting was 0.28 cm, while the lateral resolution of the seismic data prior to migration was determined by the first Fresnel zone [43], with a radius of ca. 4.1 cm at the sediment surface and decreased after migration of the data. The data cube was exported back to the SEGY format and imported to IHS Kingdom software for visualization.
To measure the reflectivity in a specified zone, the root mean-squared (RMS) amplitude was calculated as the square root of the sum of squared amplitude divided by the number of samples within a specified window. The computation of the RMS amplitude was performed for different time intervals along the traces.

3. Results

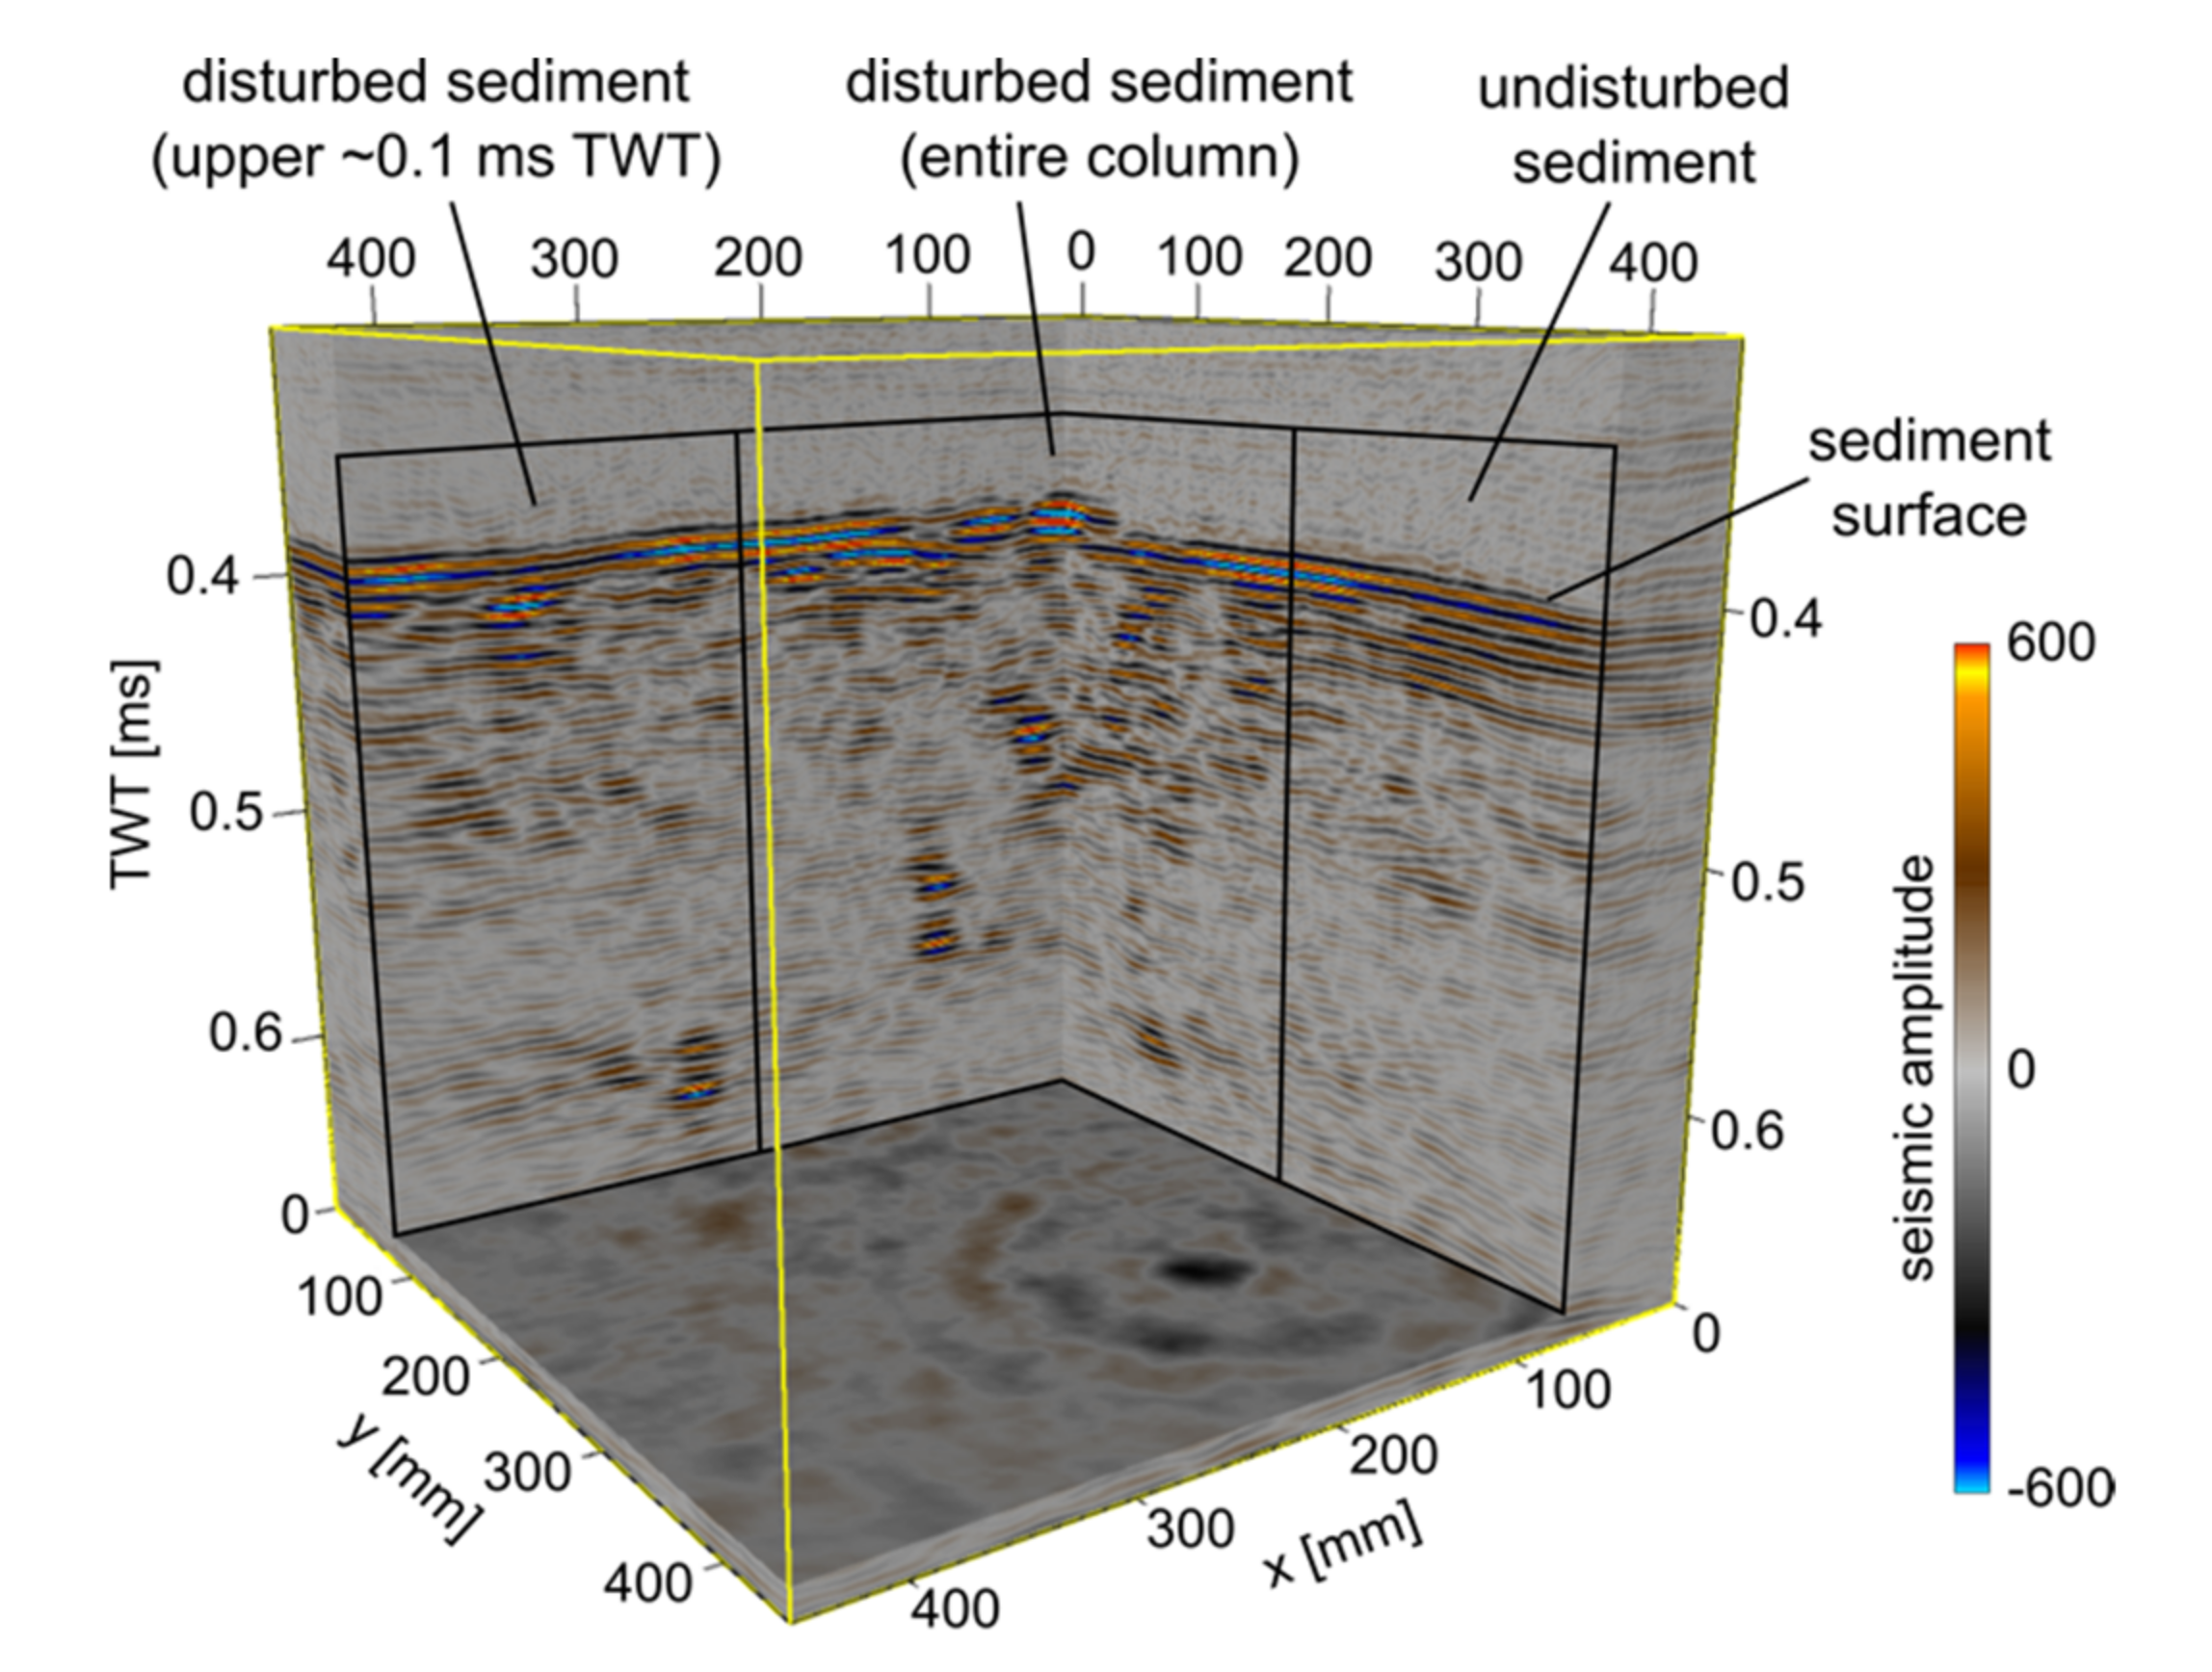
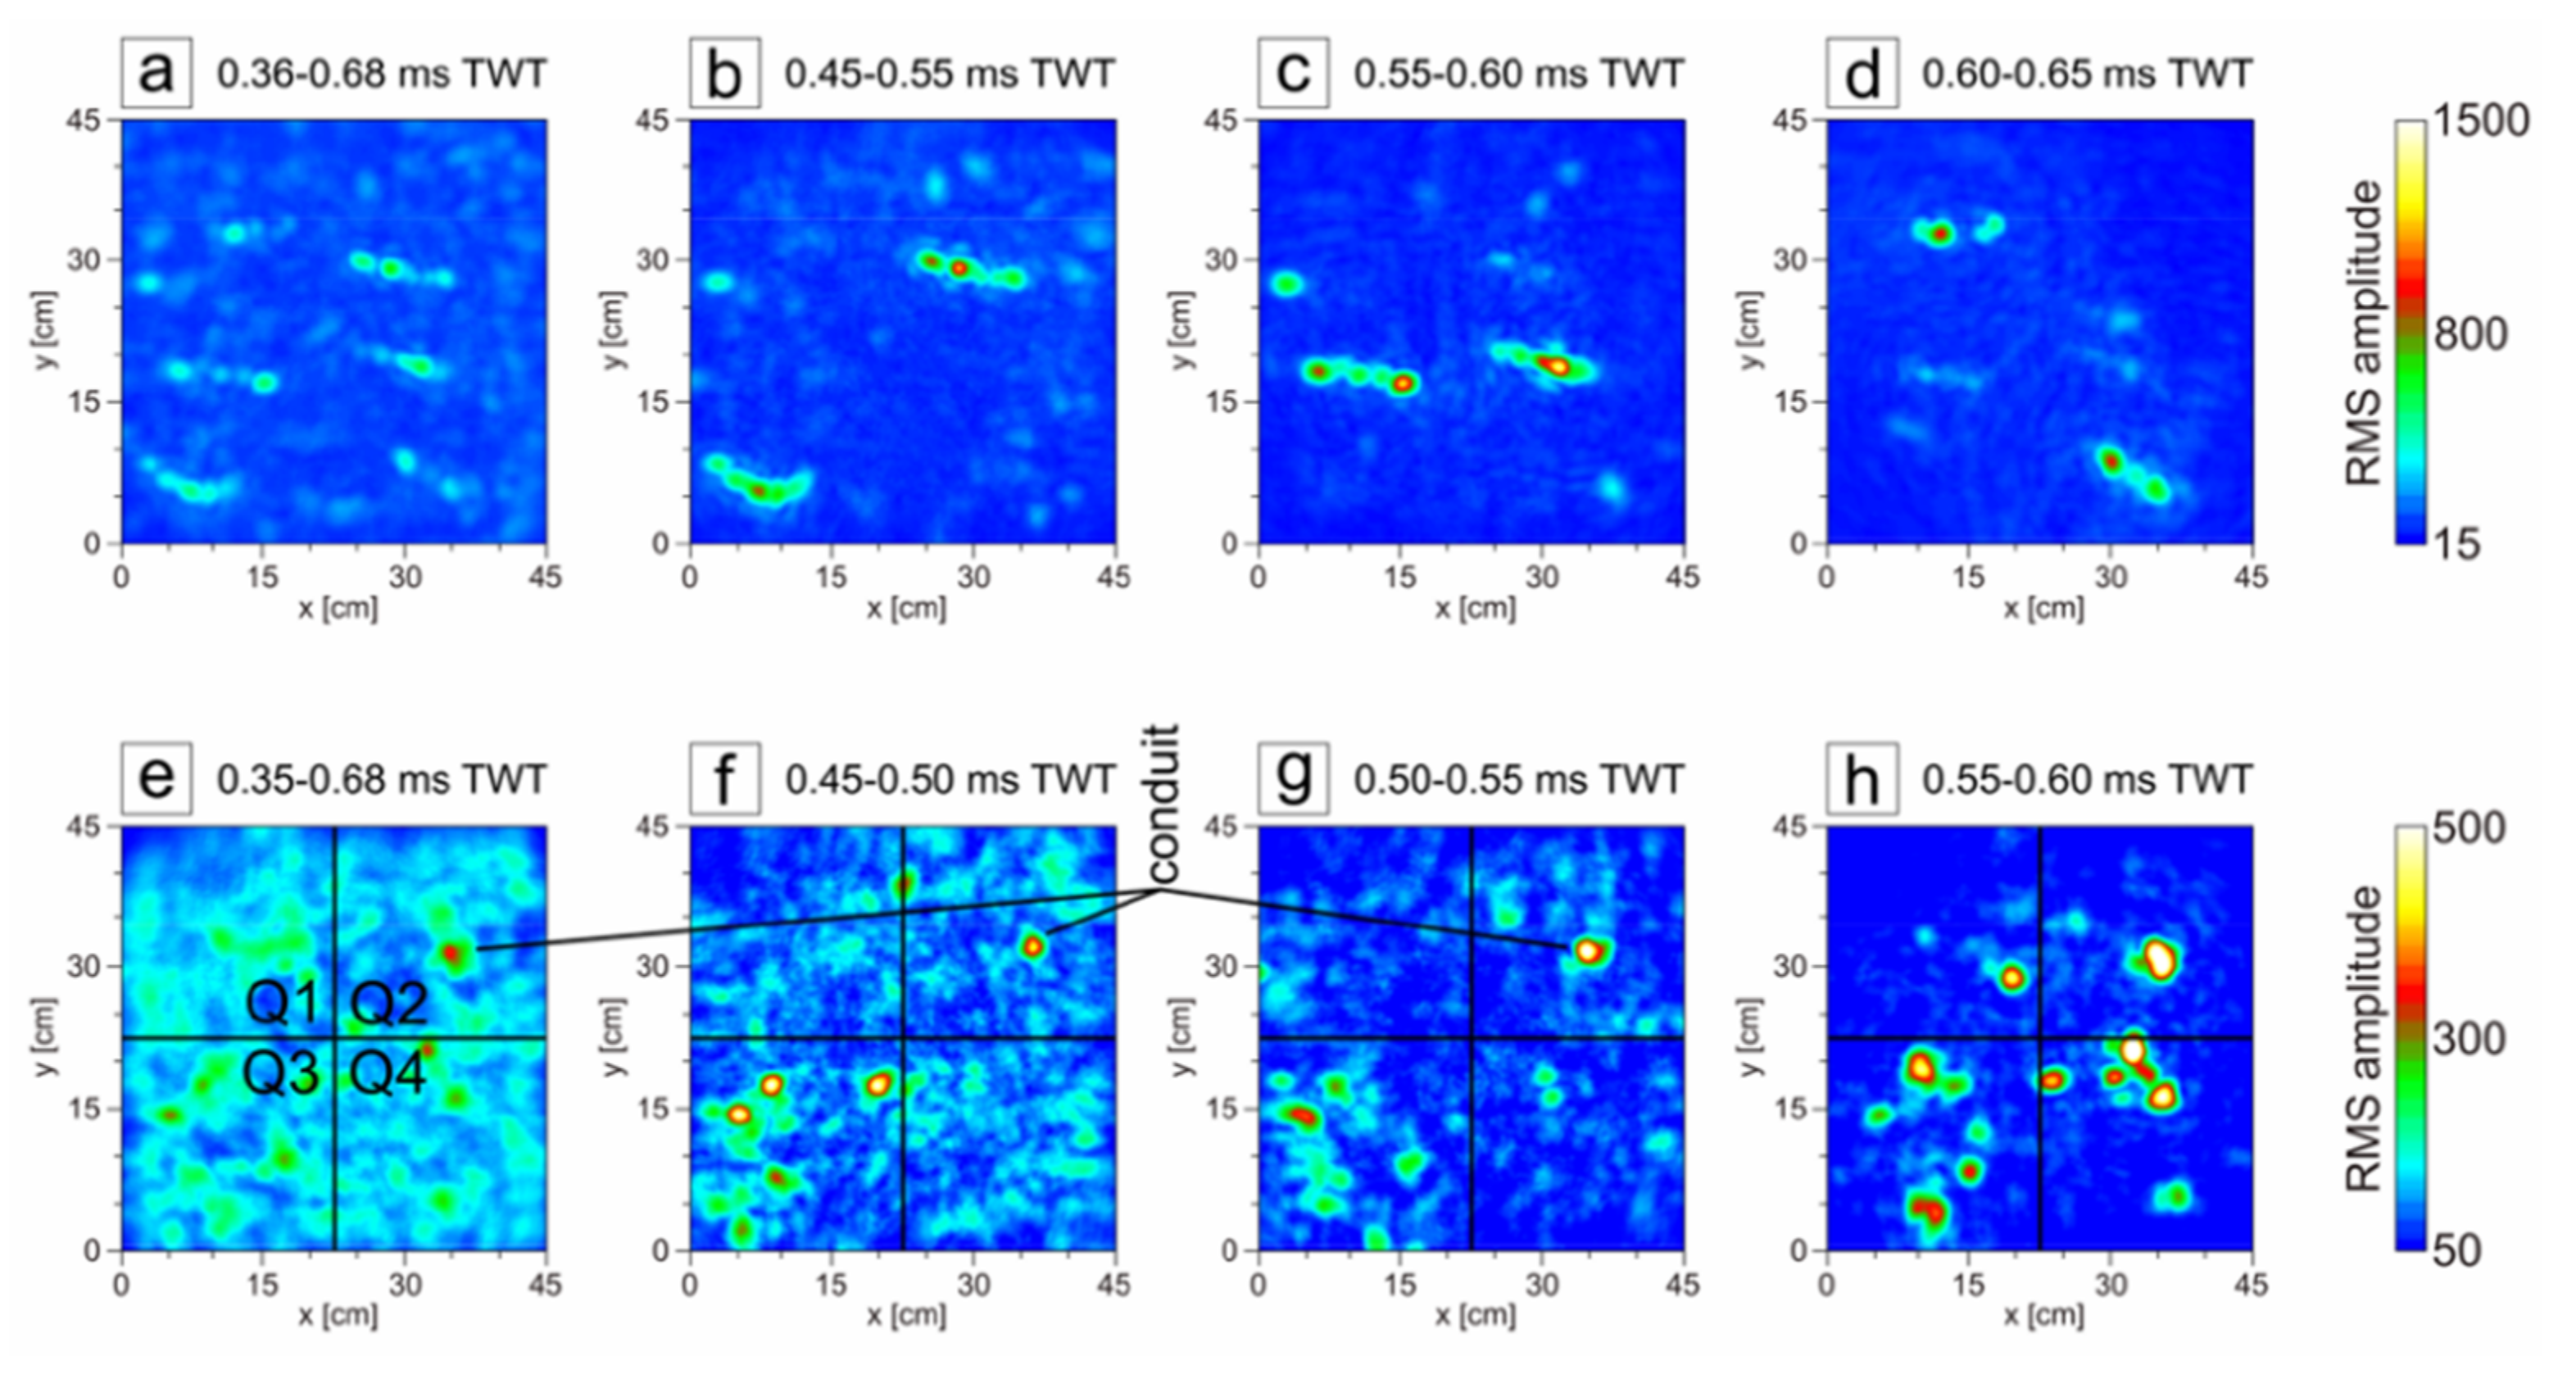
All seismic volumes showed a set of strong amplitude reflectors at the sediment surface at about 0.3 m (0.4 ms TWT) below the transducers. Undisturbed sediments showed a continuous, high-amplitude reflector at the sediment surface and a homogeneous, transparent appearance below (Figure 3). In contrast, disturbed sediments showed medium to high-amplitude reflectors at the sediment surface (Figure 3). These reflectors were not continuous. Disrupted low-amplitude reflections were present below the sediment boundary in disturbed sediments. For one experiment setup, distinct parts of the sediment were manually disturbed to different depths. The different disturbance in the sediment was observed in the amplitude data (Figure 3), and vertical conduits existed where the spatula was pushed vertically into the sediment. The conduits were imaged by plots of RMS amplitudes for different time slices (Figure 4e–h). Compared to a largely undisturbed sediment column, the disturbances affected both mean RMS amplitudes and its standard deviations (Table 1).
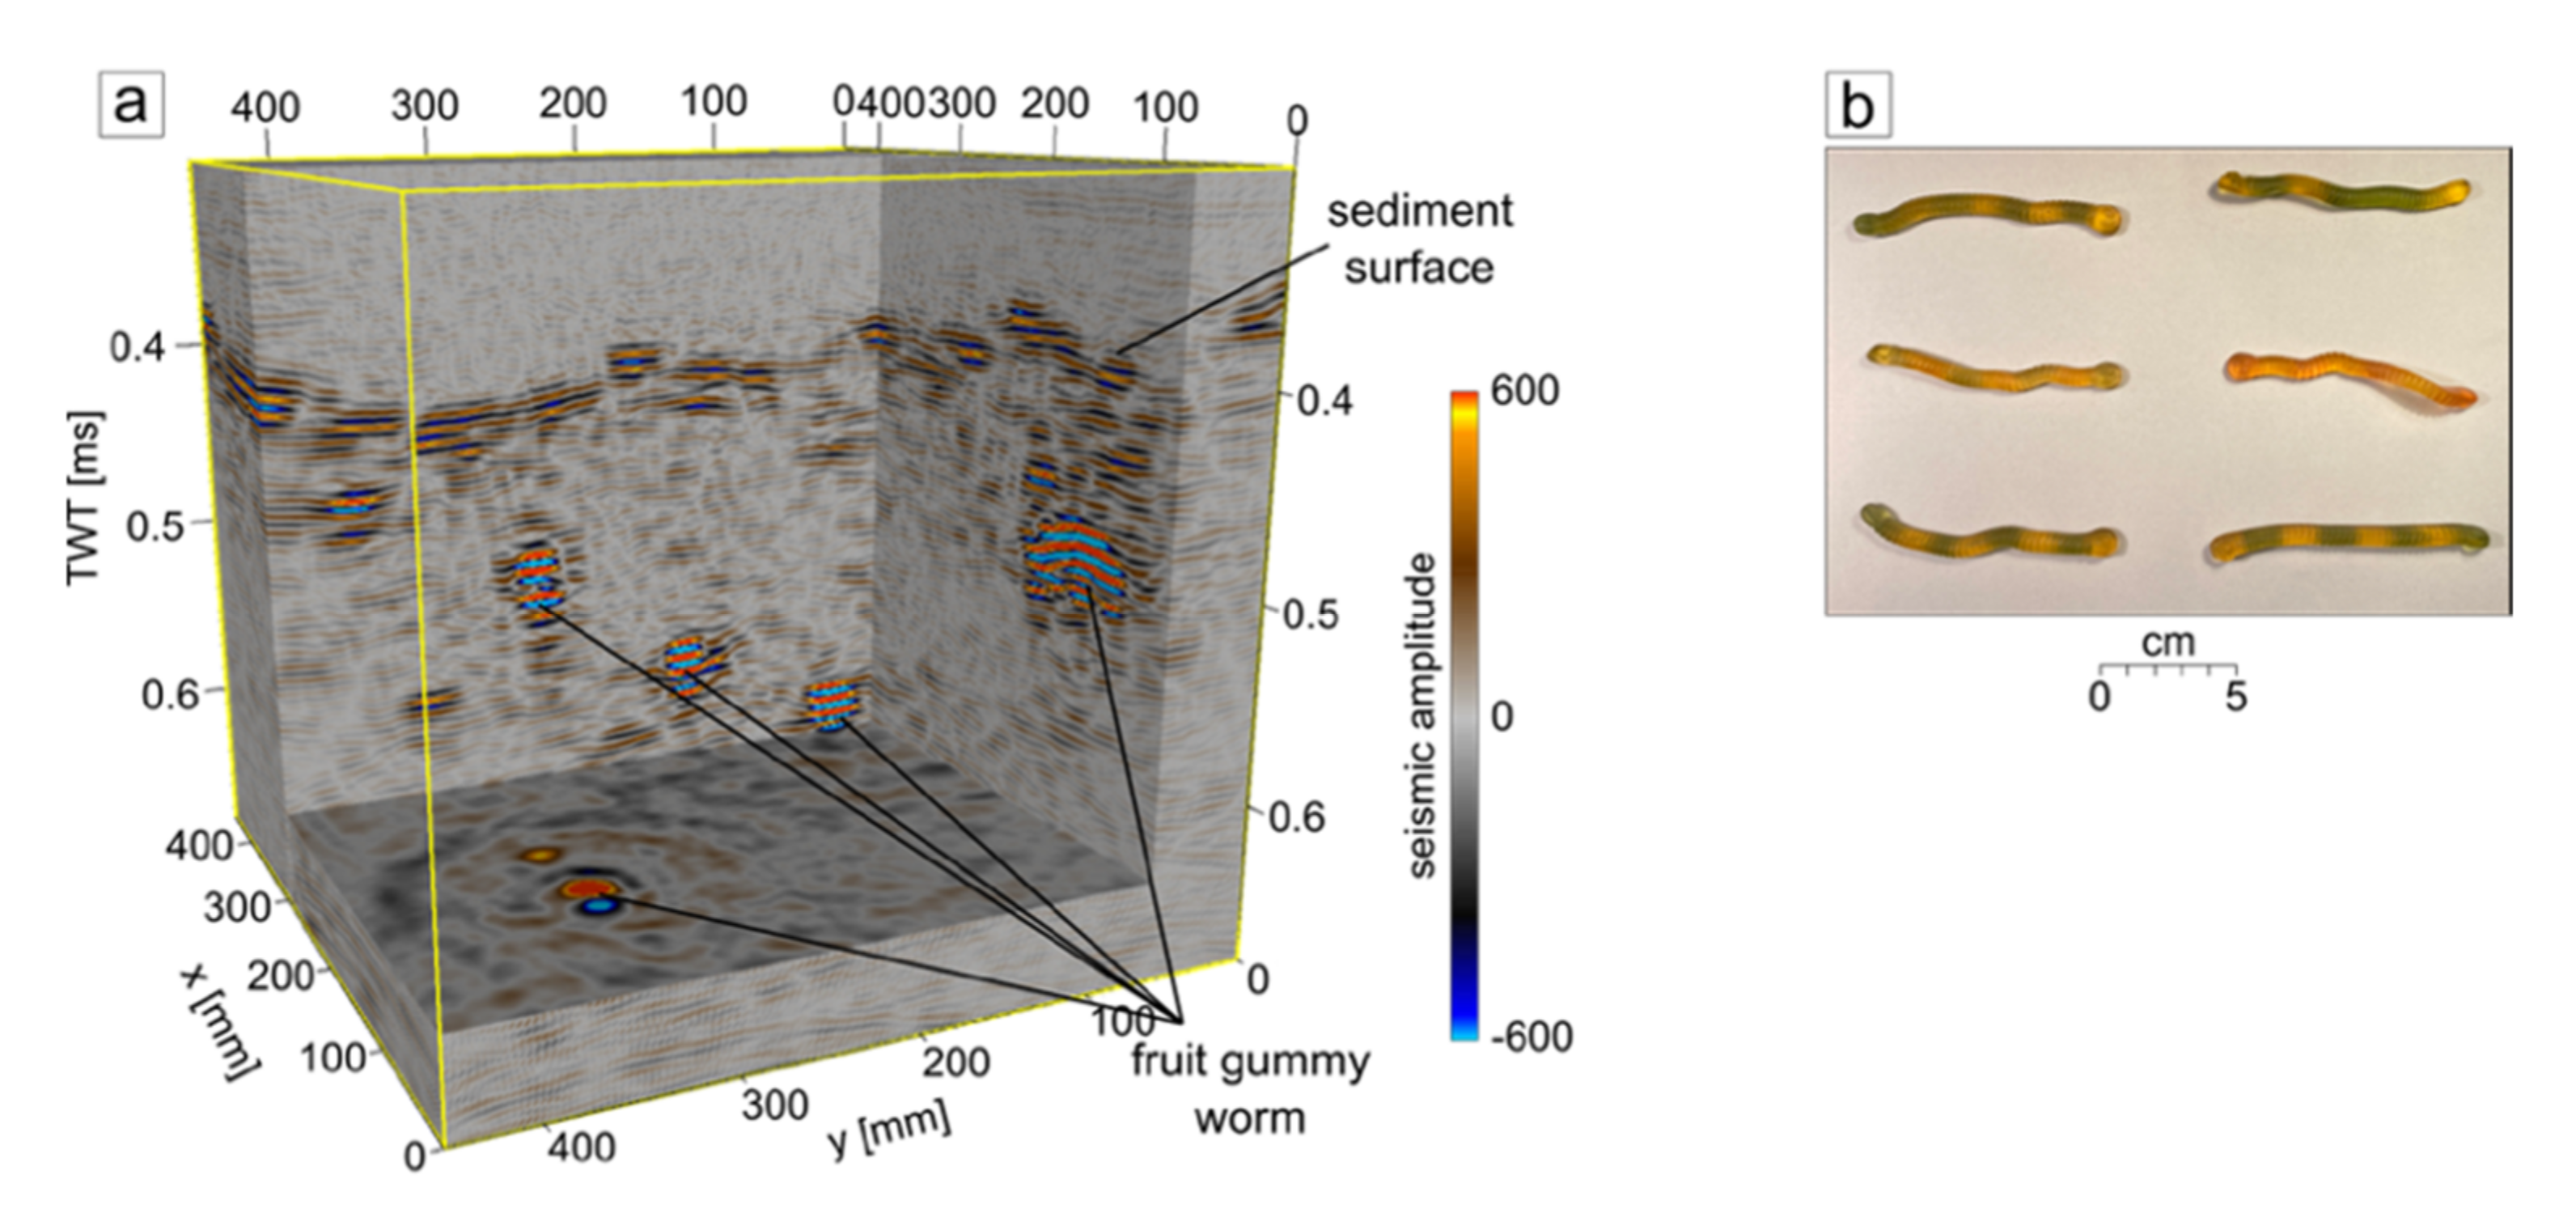
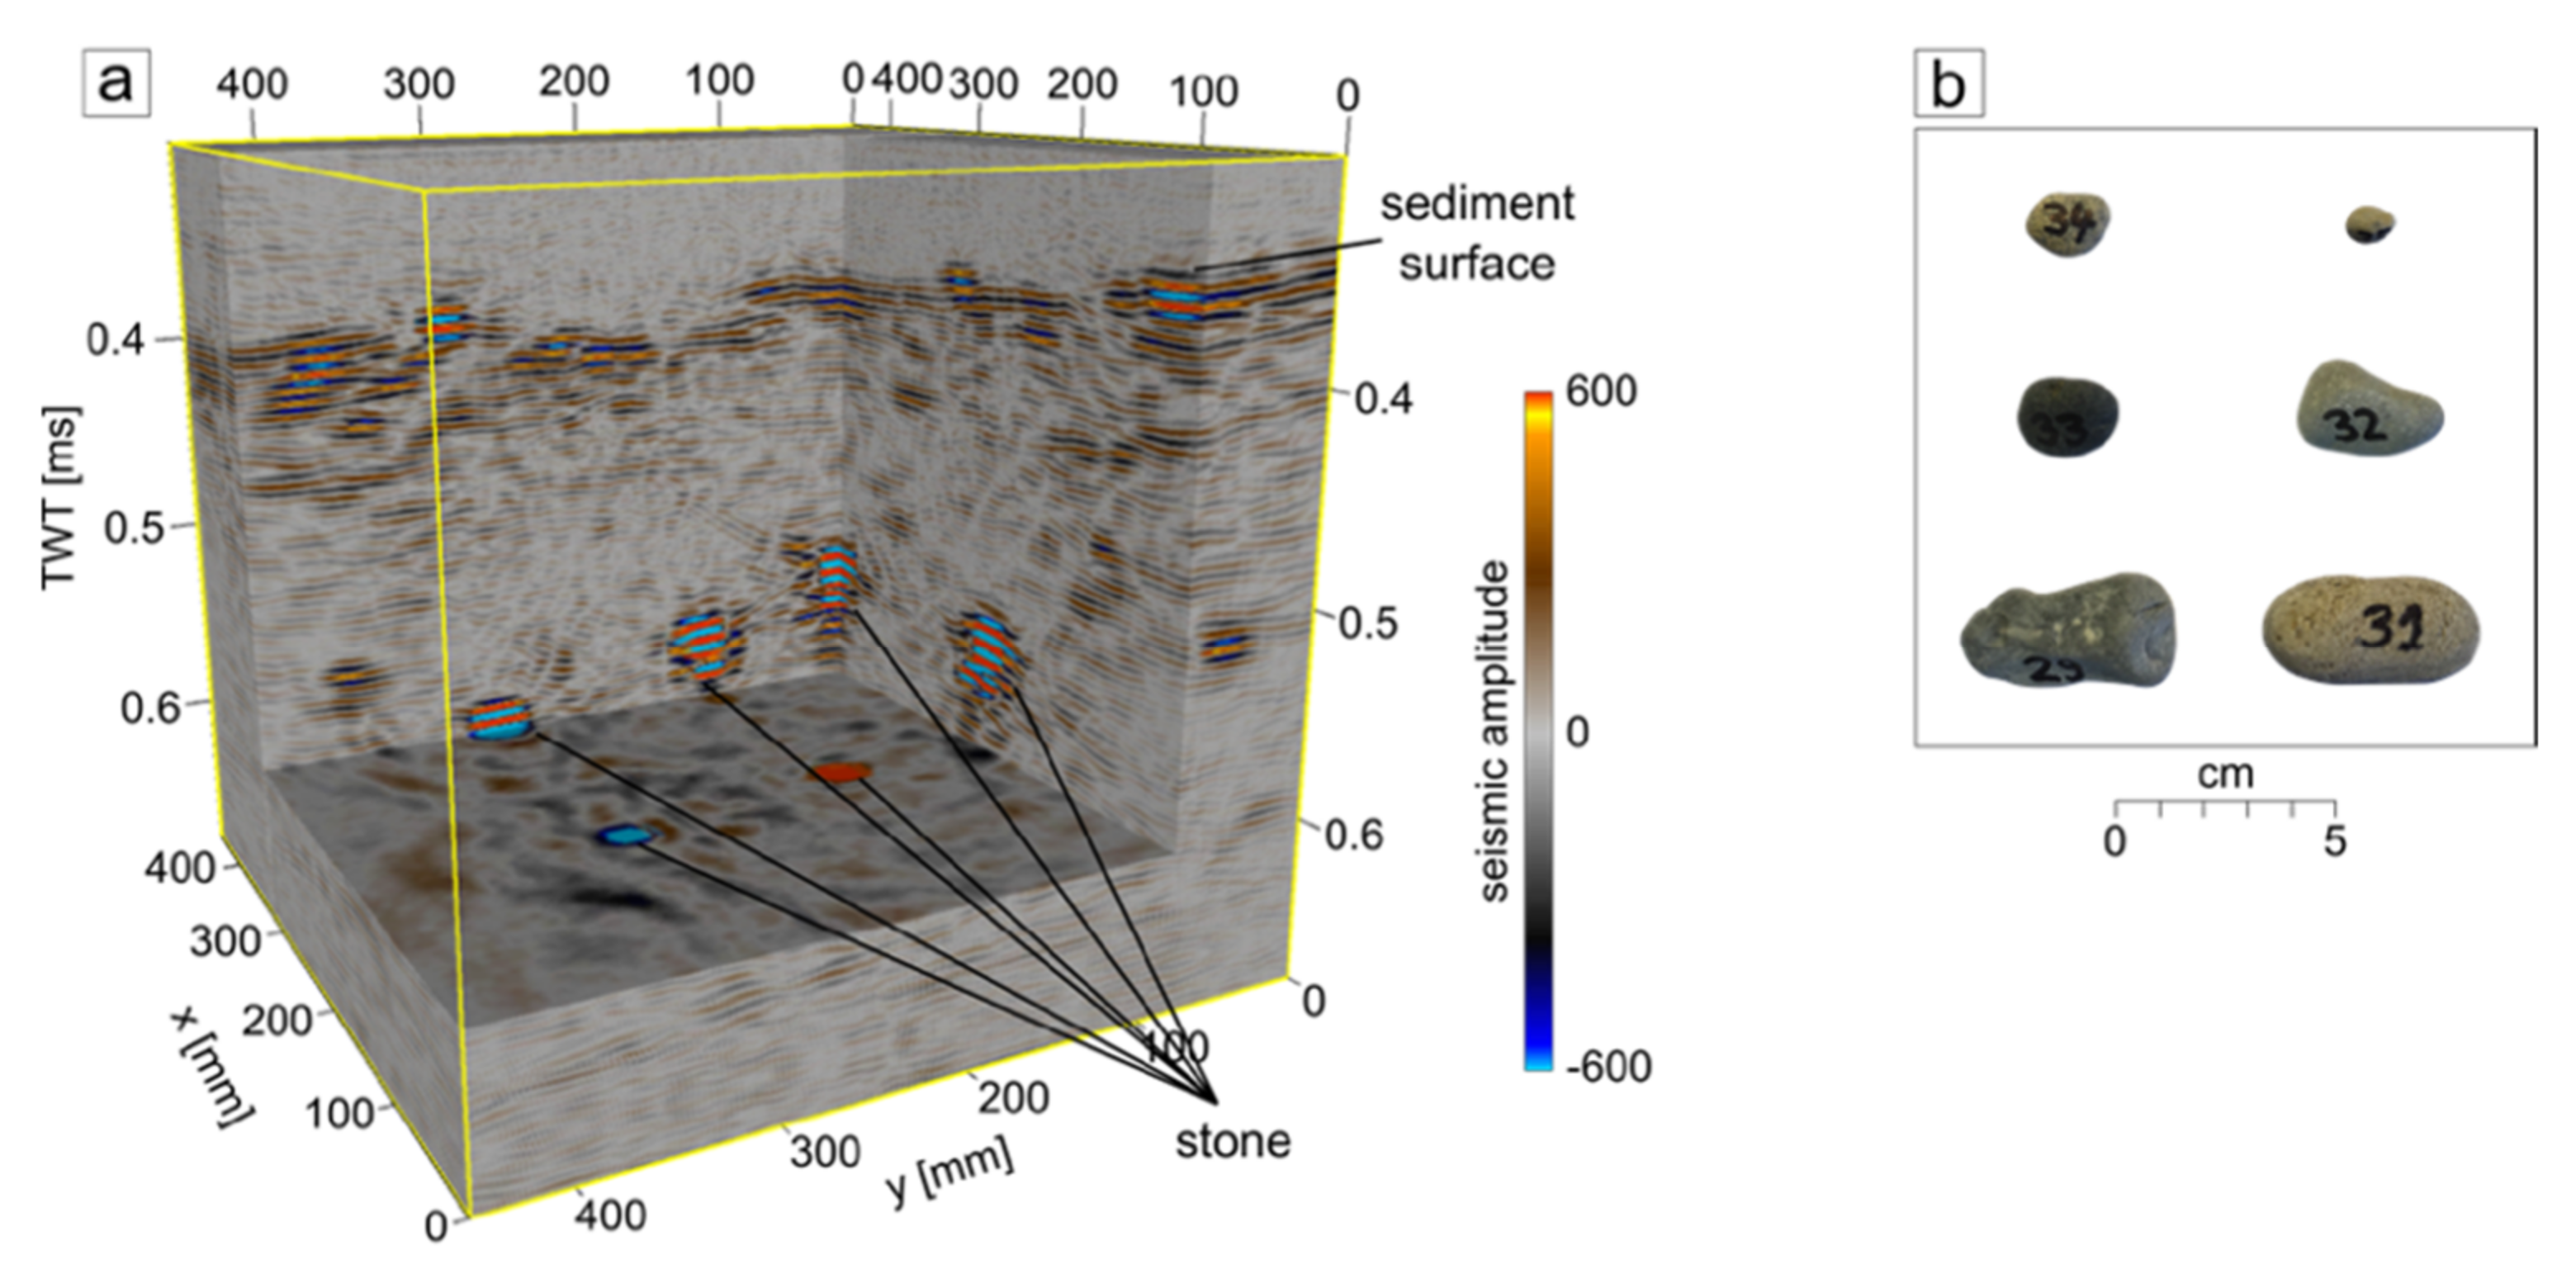
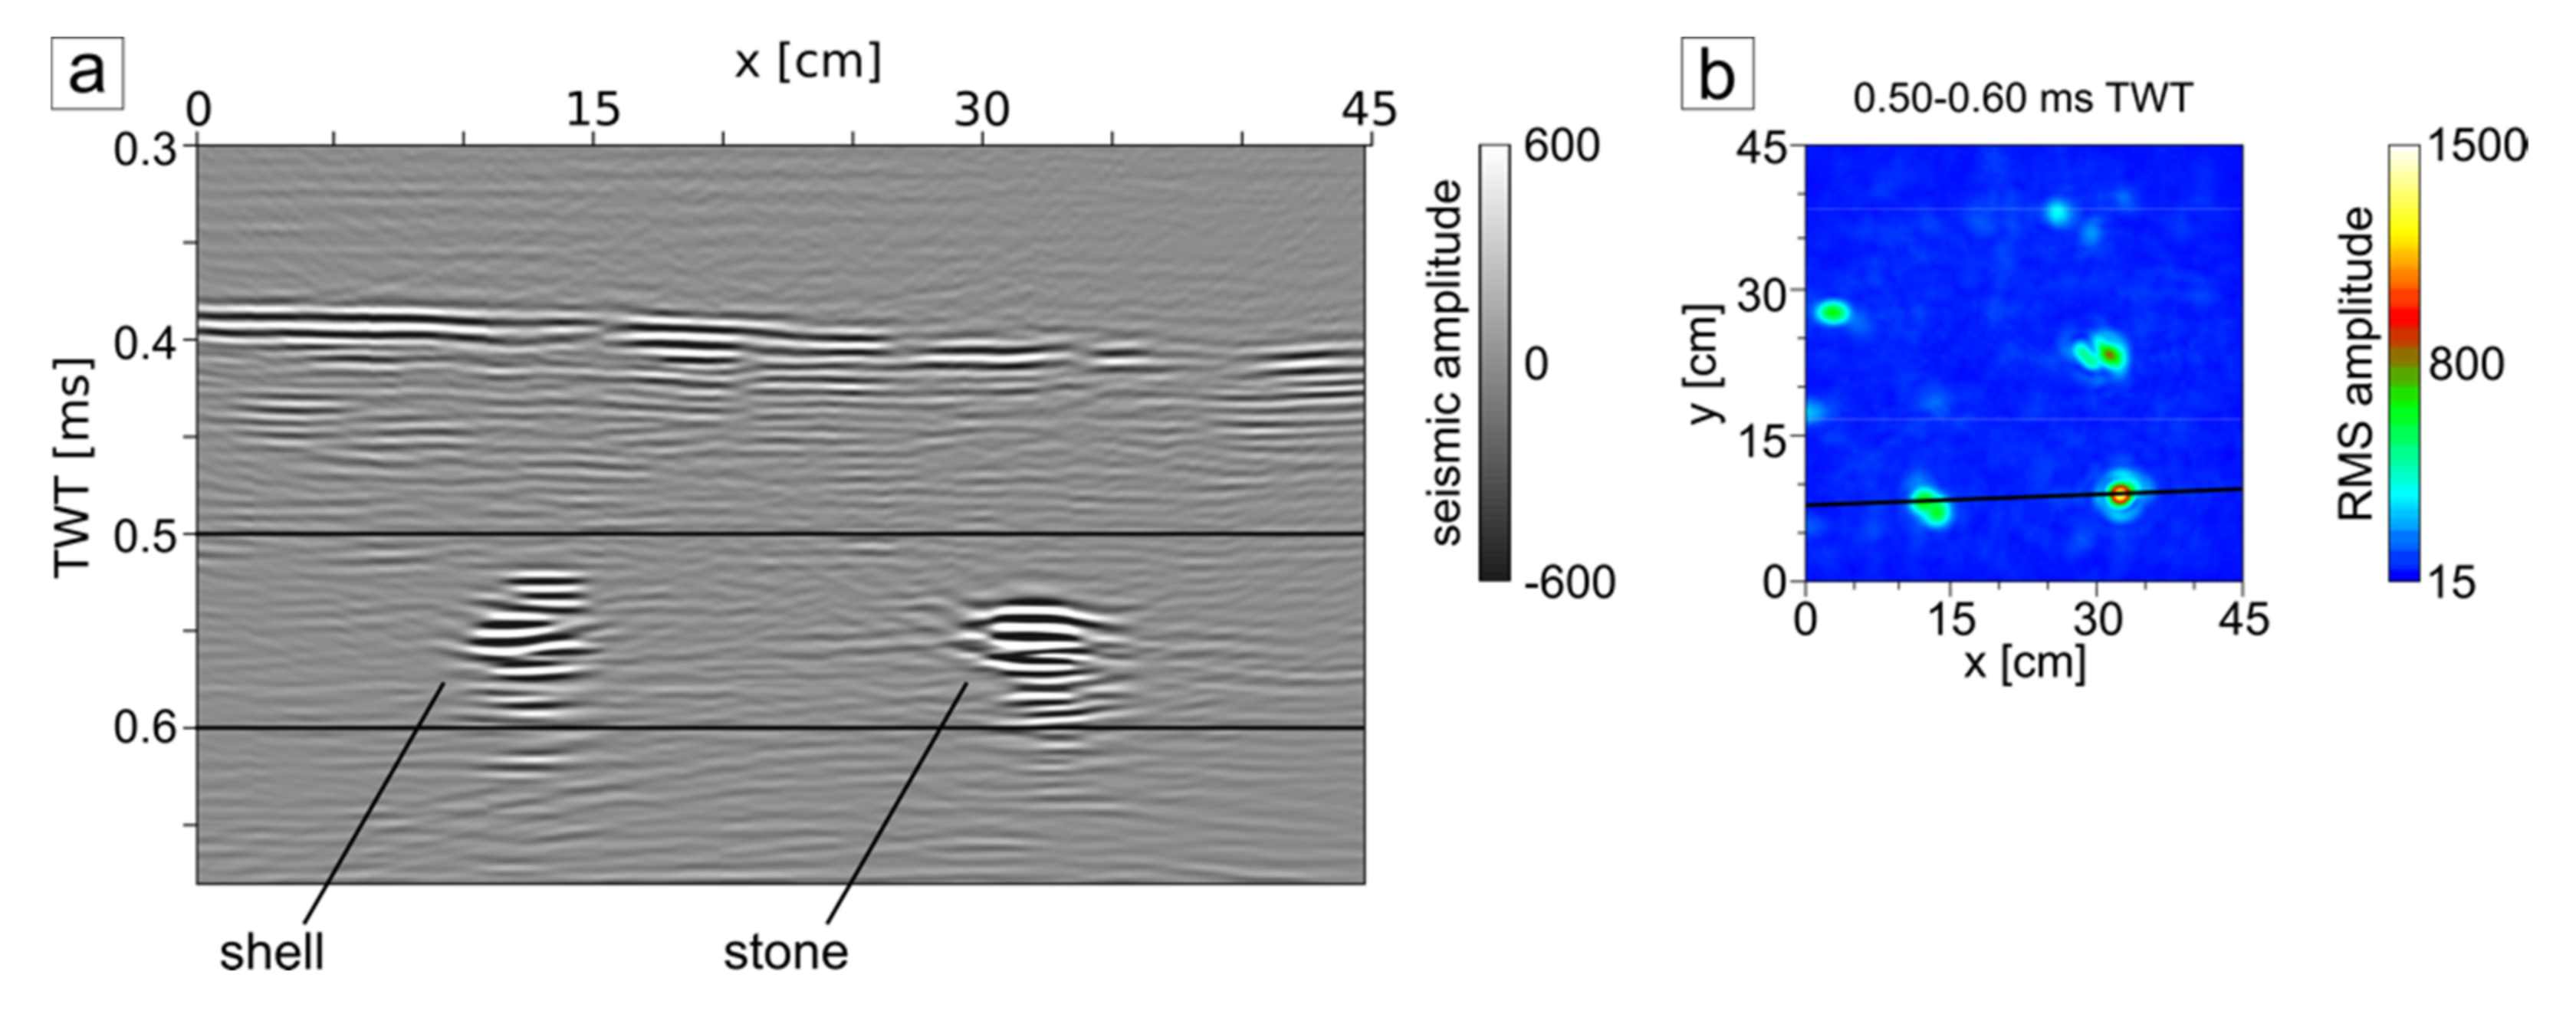
Objects buried in the sediment appear as a sequence of high-amplitude reflections with sharp lateral limits. Sequences of ellipsoidal reflections reflect the locations of fruit gummy worms (Figure 5), while stones (Figure 6) and shells (Figure 7) have a circular reflection pattern. Stones are recognized by high-amplitude reflections, which are compact and symmetrical. In comparison, the reflection pattern of single shells with the outside facing up have a lower amplitude compared to stones of similar size (an example is shown in Figure 8). Shell reflectors are often asymmetrical.
The reflections of each object occurred over an extended time interval exceeding the object’s size, and a weaker, narrower reflection followed the first reflector sequence. Therefore, it is difficult to measure the vertical extension and orientation of objects (Figure 6 and Figure 7).
The horizontal extension of the reflector sequences was a better indicator of length or diameter of buried objects for relative comparison. At the same time, absolute values still showed wider deviations from the dimensions of stones and shells measured prior to burial. In case of the fruit gummy worms (Figure 5), the lengths of the reflectors, measured linearly between both ends, showed good agreement with the length measured prior to the experiment. However, a coincidental correction of reflector length is possible due to bends of flexible worms, and the worm diameter of 0.8 cm to 1.0 cm was overestimated in the lateral dimension. The directional orientation of six worms buried horizontally in different depths was accurately imaged and can well be observed in RMS plots (Figure 4).

4. Discussion

The identification of individual buried bivalves is of importance as they act as biodiffusors that have a marked impact on biogeochemical fluxes. However, they are typically found at sediment depths of 4 to 10 cm [3] and thus not easily accessible by optical remote sensing techniques. Mussel shells as small as 1 cm, which was the minimum size of tested objects, could be repeatedly detected with the considered setups. This is sufficient to image species of interest such as Arctica islandica, Abra alba, Limecola balthica, Mya arenaria, Cerastoderma glaucum, and Phaxas pellucidus, which have individual sizes of up to 6.5 cm, 2 cm, 2 cm, 4 cm, 2 cm, and 4 cm, respectively [44]. These species frequently occur in the Baltic Sea basins, which form our target investigation site. The sediment in the basins is composed of silt and clay particles with high organic contents [45], corresponding to our test setup. High-amplitude reflections in all measured seismic cubes image the bottom of the sediment box, the tank bottom, and eventually the air below. Therefore, the penetration depth at 130 kHz is greater than the sediment thickness in the laboratory experiment (21 ± 2 cm), which is sufficient for practical application in fine-grained deposits of Baltic Sea basins. The maximum penetration depth for the experimental setup needs further examination in future field studies. In the experiments, object detection was more difficult in the uppermost centimeters (e.g., Figure 4a,e). The inevitable exchange of object between the measurements causes artifacts in the sediment column, such as conduits, water inclusions, and changes in the sediment surface topography, which appear as noise in seismic imaging. The noise level can reach an amplitude strength similar to some objects’ amplitude, and detangling it from the objects of interest remains to be solved.
Next to the direct imaging of endobenthic life, the tracing of bioturbation is of interest. Such activity modifies sediment properties and alters the redistribution of pollutants and biogeochemical fluxes [46]. Burrowing organisms move organic material to the lower part of their burrows and transport oxygen-rich seawater into anoxic zones of the sediment column [3], increasing, for example, oxygen uptake by a factor of 2 [47]. It was not possible to test in the field yet whether bioturbation traces left by the organisms can be detected, and their burrowing mechanisms cannot be reproduced in the laboratory. In nature, bioturbation traces have a wide range of appearances, ranging from U-shaped burrows with 1–2 mm in diameter (Arenicolites) to up to 1 m long, branching structures (Zoophycos) with diameters of up to 20 mm [48]. Imaging the displacement of soft sediments by manually disturbing the substrate and mapping the location of fruit gummy worms with a diameter of less than 1 cm demonstrated that in-situ mapping of some types of bioturbation traces is possible. Again, due to the impact of topography and noise level in the uppermost centimeters of the sediment, simulated bioturbation traces are better visible towards the center and the base of the seismic cube. The fruit gummy worms could be distinguished from sediment disturbance by higher amplitudes, despite a composition similar to water. It cannot be expected that the results will match those of more sophisticated laboratory techniques such as CT scans [13], but the presented method may allow obtaining repeated in-situ measurements of bioturbation intensity that could not be obtained by common sampling techniques. Table 1 and Figure 4 show that simulated bioturbation traces affect both mean RMS amplitudes and the corresponding standard deviations in time slices where they occur when compared to sequences of largely undisturbed sediment. The disturbed sediments (Table 1, Q3) show on average 25.5% higher values for time slices below the sediment surface compared to undisturbed sediments (Table 1, Q1), but only 5% higher values considering the entire sediment column, including the effects caused by the sediment surface. The fact that this impact is measurable implies that it will be possible to determine the local bioturbation intensity based on high-resolution 3D seismic. For future field studies, a better distinction between bioturbation and other objects in the shallow subsurface is required.
The results of this study suggest that the spatial orientation and location of different objects can be distinguished. Regarding the distinction between objects required, e.g., to determine the bioturbation intensity, stones are generally registered with higher amplitudes in the laboratory setting (Figure 8), with approximately double intensity compared to shells of a similar size. However, the impact of shell orientation on the amplitude strength needs to be considered. In the laboratory experiment, the inside of the valve was placed downwards, while living mussels are often oriented upright with their umbo pointing up (e.g., Arctica Astarte, Cerastoderma), while others are orientated horizontally (e.g., Macoma, Abra), and some have a siphon reaching towards the sediment surface (e.g., Mya) [44]. This might change the reflection pattern as the edges of the shell show a different echo due to diffraction effects [49]. The soft body parts of the living mussel, enclosed by the shell valves, represent an additional interface for the acoustic signal to interact with. Living mussels filter the water and emit gaseous nitrous oxide [50], which results in additional material interfaces. These interfaces are likely to affect the reflection patterns, hence a differentiation between shells and living mussels might be possible. The amplitude of fruit gummy worms is generally similar to or lower than the amplitude of the shells, but the distinction is possible based on the geometries of the objects that are recognized in the seismic cubes (Figure 4). Some bright spots in the worm’s amplitude (Figure 4) might trace back to the air enclosed in the fruit gummy or to small gas bubbles attached to their surface, which could remain as the dissolution of the worms required a short time interval between burial and measurement. Based on the shape and amplitude, a distinction between the fruit gummy worms and simulated bioturbation structures is difficult. For the purpose of deriving an index for bioturbation intensity, i.e., a sort of bioturbation potential, a distinction between the organisms and the traces they leave might, however, not be required. Nevertheless, the differentiation between objects and structures as well as the impact of coarser sediments, remain topics for future work [34]. Reverberations and (to a lesser extent) unknown seismic velocities obstruct qualitative measurements of the vertical size of objects. To improve the vertical resolution and reduce the overestimation of vertical object size, higher bandwidth chirp signals are to be used in future field studies [51]. The assumed constant sound velocity for the 3D Stolt migration also limits the accuracy in the horizontal directions. The interpretation of seismic volumes could further be improved using seismic attributes, which have been employed with great success in the geological interpretation of the 3D seismic data, for example, to recognize faults and chimneys. Albeit obviously of a much larger scale, these features are comparable in structure to the traces left by endobenthic life forms [52].

5. Conclusions

A stationary high-frequency seismic system can locate objects down to 1 cm in size buried in the mud in laboratory conditions. Through the ability to resolve objects in the centimeter range and penetration of at least 20 cm in a fine-grained substrate, the system can complement the ground validation of a ship-based acoustic survey. Potential applications also include (but are not limited to) time-series of bioturbation intensity and mussel abundance and complement to the analysis of sediment cores. Further work will focus on field applications, improvement of object differentiation, and the implementation of different waveforms.

Author Contributions

Conceptualization, P.F., M.L.Z., and D.W.; methodology, I.S., D.W., P.F., and M.S.; software, D.W., M.S., and I.S.; formal analysis, I.S., P.F., D.W., and M.G.; investigation, I.S.; data curation, P.F.; writing—original draft preparation, I.S. and P.F.; writing—review and editing, D.W., M.S., M.L.Z., and M.G.; visualization, I.S.; project administration, M.L.Z. and P.F.; funding acquisition, M.L.Z. and P.F. All authors have read and agreed to the published version of the manuscript.

Funding

This research within the project SeaFloorScan was funded by “Wehrtechnische Dienststelle für Schiffe und Marine Waffen, Maritime Technologie und Forschung (WTD71)” (funding number E/E71Z/H695/FF080). Part of this work resulted from the BONUS ECOMAP project (funding number 03F0768B), supported by BONUS (Art 185), funded jointly by the EU and the Federal Ministry of Education and Research of Germany (BMBF), the National Centre for Research and Development of Poland (NCBR), and the Innovation Fund Denmark (Innovationsfonden).

Data Availability Statement

The data presented in this study are stored on dedicated servers at the Leibniz Institute for Baltic Sea Research Warnemünde and are available on request from the corresponding author.

Acknowledgments

We thank Gerald Nickel for his great support in constructing and operating the experimental setup. We thank Felix Gross and our student assistants for their help during the project. We thank IHS for providing the Kingdom software through their University Grant Program. We thank the reviewers for their helpful comments.

Conflicts of Interest

The authors declare no conflict of interest.

References

  1. Von Ziegelmeier, E. Beobachtungen über den Röhrenbau von Lanice conchilega (Pallas) im Experiment und am natürlichen Standort. Helgoländer Wissenschafltiche Meeresunters 1952, IV, 107–129. [Google Scholar] [CrossRef] [Green Version]
  2. Lyons, A.P. The Potential Impact of Shell Fragment Distributions on High-Frequency Seafloor Backscatter. IEEE J. Ocean. Eng. 2005, 30, 843–851. [Google Scholar] [CrossRef]
  3. Michaud, E.; Desrosiers, G.; Mermillod-Blondin, F.; Sundby, B.; Stora, G. The functional group approach to bioturbation: II. The effects of the Macoma balthica community on fluxes of nutrients and dissolved organic carbon across the sediment–water interface. J. Exp. Mar. Biol. Ecol. 2006, 337, 178–189. [Google Scholar] [CrossRef]
  4. Kauppi, L.; Bernard, G.; Bastrop, R.; Norkko, A.; Norkko, J. Increasing densities of an invasive polychaete enhance bioturbation with variable effects on solute fluxes. Sci. Rep. 2018, 8, 7619. [Google Scholar] [CrossRef]
  5. Eleftheriou, A. Methods for the Study of Marine Benthos; John Wiley & Sons: Hoboken, NJ, USA, 2013. [Google Scholar]
  6. Jørgensen, L.L.; Renaud, P.E.; Cochrane, S.K.J. Improving benthic monitoring by combining trawl and grab surveys. Mar. Pollut. Bull. 2011, 62, 1183–1190. [Google Scholar] [CrossRef]
  7. Dück, Y.; Lorke, A.; Jokiel, C.; Gierse, J. Laboratory and field investigations on freeze and gravity core sampling and assessment of coring disturbances with implications on gas bubble characterization. Limnol. Oceanogr. Methods 2019, 17, 585–606. [Google Scholar] [CrossRef]
  8. Shinn, E.A. Burrowing in Recent Lime Sediments of Florida and the Bahamas. J. Paleontol. 1968, 42, 879–894. [Google Scholar]
  9. Rhoads, D.C.; Germano, J.D. Characterization of Organism-Sediment Relations Using Sediment Profile Imaging: An Efficient Method of Remote Ecological Monitoring of the Seafloor (RemotsTM System). Mar. Ecol. Prog. Ser. 1982, 8, 115–128. [Google Scholar] [CrossRef]
  10. Pouliquen, E.; Lyons, A.P. Backscattering from bioturbated sediments at very high frequency. IEEE J. Ocean. Eng. 2002, 27, 388–402. [Google Scholar] [CrossRef]
  11. Dufour, S.C.; Desrosiers, G.; Long, B.; Lajeunesse, P.; Gagnoud, M.; Labrie, J.; Archambault, P.; Stora, G. A new method for three-dimensional visualization and quantification of biogenic structures in aquatic sediments using axial tomodensitometry. Limnol. Oceanogr. Methods 2005, 3, 372–380. [Google Scholar] [CrossRef]
  12. Pennafirme, S.F.; Machado, A.S.; Lima, I.; Suzuki, K.N.; Lopes, R.T. Viability of microcomputed tomography to study tropical marine worm galleries in humid muddy sediments. In Proceedings of the 2013 International Nuclear Atlantic Conference—INAC 2013, Recife, Brazil, 24–29 November 2013. [Google Scholar]
  13. Rosenberg, R.; Grémare, A.; Duchêne, J.C.; Davey, E.; Frank, M. 3D visualization and quantification of marine benthic biogenic structures and particle transport utilizing computer-aided tomography. Mar. Ecol. Prog. Ser. 2008, 363, 171–182. [Google Scholar] [CrossRef]
  14. Chang, A.; Jung, J.; Um, D.; Yeom, J.; Hanselmann, F. Cost-effective Framework for Rapid Underwater Mapping with Digital Camera and Color Correction Method. KSCE J. Civ. Eng. 2019, 23, 1776–1785. [Google Scholar] [CrossRef]
  15. Gomes-Pereira, J.N.; Auger, V.; Beisiegel, K.; Benjamin, R.; Bergmann, M.; Bowden, D.; Buhl-Mortensen, P.; De Leo, F.C.; Dionísio, G.; Durden, J.M.; et al. Current and future trends in marine image annotation software. Prog. Oceanogr. 2016, 149, 106–120. [Google Scholar] [CrossRef]
  16. Beisiegel, K.; Darr, A.; Gogina, M.; Zettler, M.L. Benefits and shortcomings of non-destructive benthic imagery for monitoring hard-bottom habitats. Mar. Pollut. Bull. 2017, 121, 5–15. [Google Scholar] [CrossRef] [PubMed]
  17. Solan, M.; Germano, J.D.; Rhoads, D.C.; Smith, C.; Michaud, E.; Parry, D.; Wenzhöfer, F.; Kennedy, B.; Henriques, C.; Battle, E.; et al. Towards a greater understanding of pattern, scale and process in marine benthic systems: A picture is worth a thousand worms. J. Exp. Mar. Biol. Ecol. 2003, 285–286, 313–338. [Google Scholar] [CrossRef]
  18. Brown, C.J.; Smith, S.J.; Lawton, P.; Anderson, J.T. Benthic habitat mapping: A review of progress towards improved understanding of the spatial ecology of the seafloor using acoustic techniques. Estuar. Coast. Shelf Sci. 2011, 92, 502–520. [Google Scholar] [CrossRef]
  19. Dartnell, P.; Gardner, J.V. Predicting Seafloor Facies from Multibeam Bathymetry and Backscatter Data. Photogramm. Eng. Remote Sens. 2004, 70, 1081–1091. [Google Scholar] [CrossRef] [Green Version]
  20. Heinrich, C.; Feldens, P.; Schwarzer, K. Highly dynamic biological seabed alterations revealed by side scan sonar tracking of Lanice conchilega beds offshore the island of Sylt (German Bight). Geo-Mar. Lett. 2016, 37, 289–303. [Google Scholar] [CrossRef]
  21. Schimel, A.C.G.; Brown, C.J.; Ierodiaconou, D. Automated Filtering of Multibeam Water-Column Data to Detect Relative Abundance of Giant Kelp (Macrocystis pyrifera). Remote Sens. 2020, 12, 1371. [Google Scholar] [CrossRef]
  22. Czechowska, K.; Feldens, P.; Tuya, F.; De Esteban, M.C.; Espino, F.; Haroun, R.; Schönke, M.; Otero-Ferrer, F. Testing Side-Scan Sonar and Multibeam Echosounder to Study Black Coral Gardens: A Case Study from Macaronesia. Remote Sens. 2020, 12, 3244. [Google Scholar] [CrossRef]
  23. Feldens, P.; Schulze, I.; Papenmeier, S.; Schönke, M.; Von Deimling, J.S. Improved Interpretation of Marine Sedimentary Environments Using Multi-Frequency Multibeam Backscatter Data. Geosciences 2018, 8, 214. [Google Scholar] [CrossRef]
  24. Held, P.; Von Deimling, J.S. New Feature Classes for Acoustic Habitat Mapping—A Multibeam Echosounder Point Cloud Analysis for Mapping Submerged Aquatic Vegetation (SAV). Geosciences 2019, 9, 235. [Google Scholar] [CrossRef] [Green Version]
  25. Janowski, L.; Trzcinska, K.; Tegowski, J.; Kruss, A.; Rucinska-Zjadacz, M.; Pocwiardowski, P. Nearshore Benthic Habitat Mapping Based on Multi-Frequency, Multibeam Echosounder Data Using a Combined Object-Based Approach: A Case Study from the Rowy Site in the Southern Baltic Sea. Remote Sens. 2018, 10, 1983. [Google Scholar] [CrossRef] [Green Version]
  26. Lurton, X.; Lamarche, G.; Brown, C.; Lucieer, V.; Rice, G.; Schimel, A.; Weber, T. Backscatter Measurements by Seafloor-Mapping Sonars: Guidelines and Recommendations. 2015, p. 200. Available online: https://niwa.co.nz/static/BWSG_REPORT_MAY2015_web.pdf (accessed on 8 December 2021).
  27. Planke, S.; Erikson, F.N.; Berndt, C.; Mienert, J.; Masson, D.G. P-Cable High-Resolution Seismic. Oceanography 2009, 22, 85. [Google Scholar] [CrossRef]
  28. Marsset, B.; Missiaen, T.; De Roeck, J.M.; Noblem, M.; Versteeg, R.J.; Henriet, J.P. Very high resolution 3D marine seismic data processing for geotechnical applications. Geophys. Prospect. 1998, 46, 105–120. [Google Scholar] [CrossRef]
  29. Wilken, D.; Wunderlich, T.; Hollmann, H.; Schwardt, M.; Rabbel, W.; Mohr, C.; Schulte-Kortnack, D.; Nakoinz, O.; Enzmann, J.; Jürgens, F.; et al. Imaging a medieval shipwreck with the new PingPong 3D marine reflection seismic system. Archaeol. Prospect. 2019, 26, 211–223. [Google Scholar] [CrossRef]
  30. Wilken, D.; Wunderlich, T.; Feldens, P.; Coolen, J.; Preston, J.; Mehler, N. Investigating the Norse Harbour of Igaliku (Southern Greenland) Using an Integrated System of Side-Scan Sonar and High-Resolution Reflection Seismics. Remote Sens. 2019, 11, 1889. [Google Scholar] [CrossRef] [Green Version]
  31. Gutowski, M.; Malgorn, J.; Vardy, M. 3D sub-bottom profiling—high resolution 3D imaging of shallow subsurface structures and buried objects. In Proceedings of the OCEANS 2015—Genova, Genova, Italy, 18–21 May 2015; pp. 1–7. [Google Scholar] [CrossRef]
  32. Wildman, R.A.; Huettel, M. Acoustic detection of gas bubbles in saturated sands at high spatial and temporal resolution: Acoustic detection of bubbles in sand. Limnol. Oceanogr. Methods 2012, 10, 129–141. [Google Scholar] [CrossRef]
  33. Orr, M.H.; Rhoads, D.C. Acoustic imaging of structures in the upper 10 cm of sediments using a megahertz backscattering system: Preliminary results. Mar. Geol. 1982, 46, 117–129. [Google Scholar] [CrossRef]
  34. Suganuma, H.; Mizuno, K.; Asada, A. Application of wavelet shrinkage to acoustic imaging of buried asari clams using high-frequency ultrasound. Jpn. J. Appl. Phys. 2018, 57, 07LG08. [Google Scholar] [CrossRef]
  35. Mizuno, K.; Liu, X.; Katase, F.; Asada, A.; Murakoshi, M.; Yagita, Y.; Fujimoto, Y.; Shimada, T.; Watanabe, Y. Automatic non-destructive three-dimensional acoustic coring system for in situ detection of aquatic plant root under the water bottom. Case Stud. Nondestruct. Test. Eval. 2016, 5, 1–8. [Google Scholar] [CrossRef] [Green Version]
  36. Mizuno, K.; Yu, Z.; Murakoshi, M.; Suganuma, H.; Asada, A.; Fujimoto, Y.; Takahashi, Y.; Shimada, T. Survey of the Lotus Root Habitats in the Sediment Using Acoustic Coring System. In Proceedings of the 2018 OCEANS-MTS/IEEE Kobe Techno-Oceans, Kobe, Japan, 28–31 May 2018; pp. 1–5. [Google Scholar]
  37. Dorgan, K.M.; Ballentine, W.; Lockridge, G.; Kiskaddon, E.; Ballard, M.S.; Lee, K.M.; Wilson, P.S. Impacts of simulated infaunal activities on acoustic wave propagation in marine sediments. J. Acoust. Soc. Am. 2020, 147, 812–823. [Google Scholar] [CrossRef]
  38. Leighton, T.G.; Evans, R.C.P. The detection by sonar of difficult targets (including centimetre-scale plastic objects and optical fibres) buried in saturated sediment. Appl. Acoust. 2008, 69, 438–463. [Google Scholar] [CrossRef]
  39. Schwinghamer, P.; Guigne, J.Y.; Siu, W.C. Quantifying the impact of trawling on benthic habitat structure using high resolution acoustics and chaos theory. Can. J. Fish. Aquat. Sci. 1996, 53, 288–296. [Google Scholar] [CrossRef]
  40. Stockwell, J.W. The CWP/SU: Seismic Un∗x package. Comput. Geosci. 1999, 25, 415–419. [Google Scholar] [CrossRef]
  41. Thomas, M.H.; SegyMAT. Zenodo. Available online: http://doi.org/10.5281/zenodo.1305289 (accessed on 8 December 2021).
  42. Stolt, R.H. Migration by fourier transform. Geophysics 1978, 43, 23–48. [Google Scholar] [CrossRef]
  43. Yilmaz, Ö. Seismic Data Analysis: Processing, Inversion, and Interpretation of Seismic Data; Society of Exploration Geophysicists: Houston, TX, USA, 2001. [Google Scholar]
  44. Zettler, M.L.; Alf, A. Bivalvia of German Marine Waters of the North and Baltic Seas; ConchBooks: Harxheim, Germany, 2021. [Google Scholar]
  45. Tauber, F.; Lemke, W.; Endler, R. Map of Sediment Distribution in the Western Baltic Sea (1: 100,000), Sheet Falster—Mon. Dtsch. Hydrogr. Z. 1999, 51, 27. [Google Scholar] [CrossRef]
  46. Nickell, L.A.; Black, K.D.; Hughes, D.J.; Overnell, J.; Brand, T.; Nickell, T.D.; Breuer, E.; Harvey, S.M. Bioturbation, sediment fluxes and benthic community structure around a salmon cage farm in Loch Creran, Scotland. J. Exp. Mar. Biol. Ecol. 2003, 285-286, 221–233. [Google Scholar] [CrossRef]
  47. Michaud, E.; Desrosiers, G.; Mermillod-Blondin, F.; Sundby, B.; Stora, G. The functional group approach to bioturbation: The effects of biodiffusers and gallery-diffusers of the Macoma balthica community on sediment oxygen uptake. J. Exp. Mar. Biol. Ecol. 2005, 326, 77–88. [Google Scholar] [CrossRef]
  48. Wetzel, A.; Werner, F.; Stow, D. Bioturbation and Biogenic Sedimentary Structures in Contourites. Dev. Sedimentol. 2008, 60, 183–202. [Google Scholar] [CrossRef]
  49. Stanton, T.K.; Chu, D. On the acoustic diffraction by the edges of benthic shells. J. Acoust. Soc. Am. 2004, 116, 239–244. [Google Scholar] [CrossRef] [PubMed] [Green Version]
  50. Stief, P.; Poulsen, M.; Nielsen, L.P.; Brix, H.; Schramm, A. Nitrous oxide emission by aquatic macrofauna. Proc. Natl. Acad. Sci. USA 2009, 106, 4296–4300. [Google Scholar] [CrossRef] [PubMed] [Green Version]
  51. Lurton, X. An Introduction to Underwater Acoustics: Principles and Applications, 2nd ed.; Springer Science & Business Media: Chichester, UK, 2010. [Google Scholar]
  52. Gay, A.; Mourgues, R.; Berndt, C.; Bureau, D.; Planke, S.; Laurent, D.; Gautier, S.; Lauer, C.; Loggia, D. Anatomy of a fluid pipe in the Norway Basin: Initiation, propagation and 3D shape. Mar. Geol. 2012, 332–334, 75–88. [Google Scholar] [CrossRef]
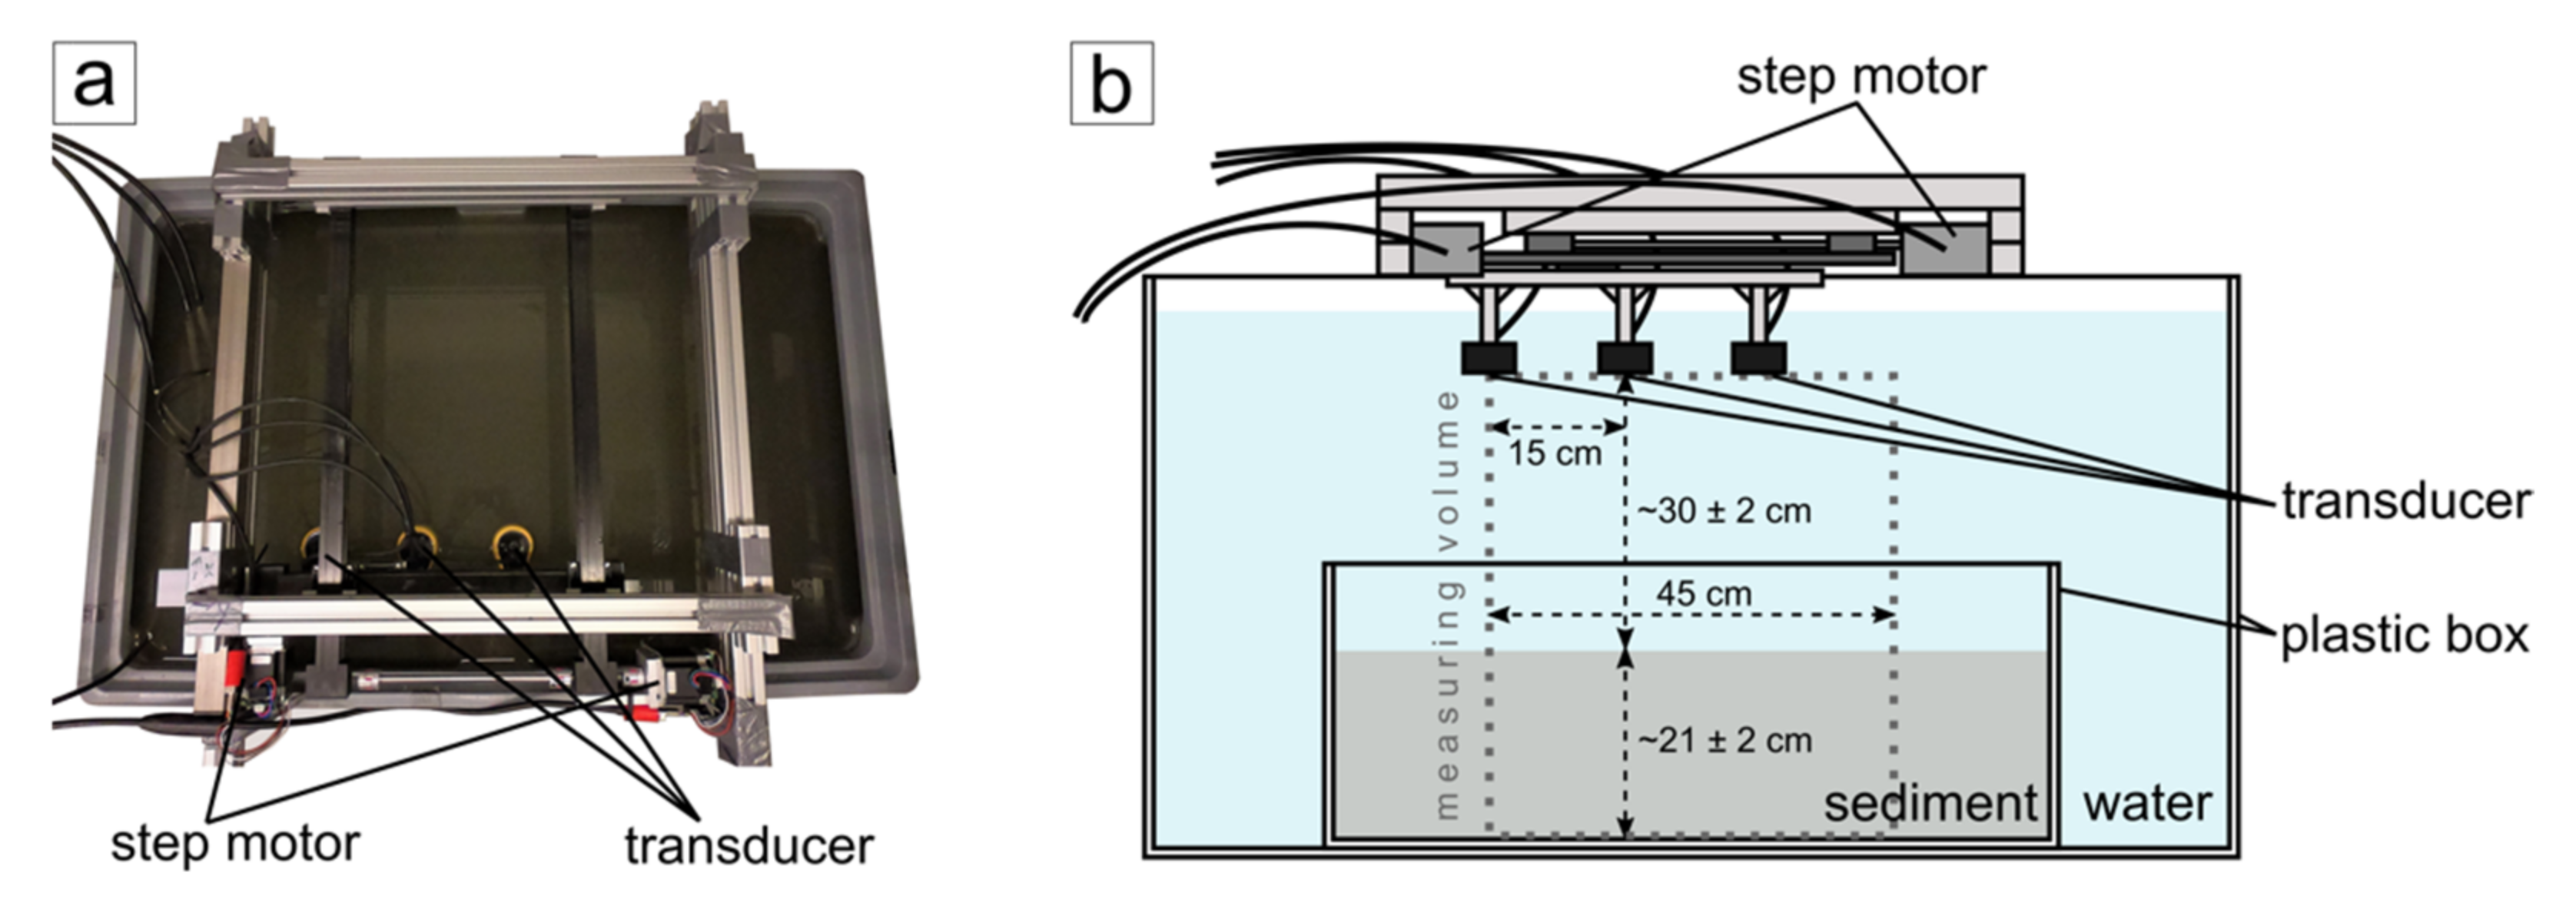
Figure 1. (a) Top-down photography of the test tank. The box filled with the substrate is not visible due to suspension in the water column. (b) The experimental setup consists of three transducers and two-step motors mounted on top of a water tank. The plastic box containing the buried test object is located 30 cm below the transducers and is filled with a 21 cm thick sediment layer.
Geosciences 11 00508 g001
Figure 2. Seismic profile after different processing steps. (a) Raw data cut at TWT (two-way travel time) = 0.885 ms (first 0.2 ms not recorded). In x-direction, a tripartite segmentation due to recording with three transducers is noticeable by differences in water column noise and a small trace shift at x = 15 cm and x = 30 cm. (b) Cutting the traces at TWT= 0.68 ms removes the reflections of the box bottoms. Gain and bandpass filters are applied to the data, and deconvolution attenuates reverberation effects. (c) The initial 0.2 ms of the traces are padded with zeros, and trace normalization is applied. (d) Data following 3D migration. Reflections of three shells are visible, starting at TWT = 0.45 ms. Reflections at x = 13 cm and 21 cm are found at the shell’s center, while the reflection at x = 26 cm is on a shell’s edge. Later figures in this study only show data in the relevant range of TWT = 0.3–0.68 ms.
Geosciences 11 00508 g002
Figure 3. Seismic volume shows the reflections of varying manual disturbances in the soft sediment. Undisturbed sediment (right) is characterized by continuous high-amplitude reflectors at the surface and a transparent appearance below. The reflectors of the sediment surface of disturbed parts (middle and left) show interruptions and variations in amplitude strength. Reflections of disturbed sediment below appear discontinuous, with limits partly sharp, partly fading into transparency with varying strength of amplitude. This pattern ceases below 0.5 ms TWT where only the upper sediment layer was disturbed. To some extent, random reflector fragments appear due to the object exchange from previous experiments.
Geosciences 11 00508 g003
Figure 4. RMS amplitudes are calculated as volume attribute in different depths. (ad) The data cube (Figure 5) includes six fruit gummy worms at different depths. The section including the entire sediment layer (a) shows the location and orientation of all six objects and the reflection of the sediment surface. Shorter time sections (bd) allow for a more detailed display of only the two fruit gummy worms in the respective depth. (eh) The data cube (see also Figure 3) is characterized by disturbances of variable extent in the sediment layer. The RMS amplitude, including the entire sediment column (e) shows little differences between the four quadrants. Shorter sections of increasing depth (fh) provide a different pattern in the quadrants. Continuously highest amplitudes appear in the lower-left quadrant (Q3), where disturbances affect the entire sediment column. The constant lateral patch of high amplitudes in the upper right quadrant (Q2), marked as conduit, corresponds with the intersection point of the spatula pushes.
Geosciences 11 00508 g004
Figure 5. (a) Seismic volume showing the reflections of fruit gummy worms in 0.45 to 0.65 ms TWT depth. Five of six gummy worms buried during the experiment are visible. The gummy worm to the right is measured along its long axis. Its vertical extension is measured with 0.02 ms TWT (1.5 cm at 1500 m/s water sound velocity) and its length with 40 shot points (10 cm with 2.5 mm shot point distance). (b) Photography of the fruit gummy worms showing the plan view of the configuration they are buried in (the average worm is 11.5 cm in length and 0.7 cm wide). Due to their flexibility, buried worms might show small humps.
Geosciences 11 00508 g005
Figure 6. (a) Seismic volume showing the appearance of six stones in 0.5 to 0.65 ms TWT depth. All stones appear as high-amplitude reflections, with sharp lateral limits. Initially, all stones were placed in approximately the same depth, but heavier stones subsided. (b) Photography of the stones in the schematic configuration they are buried in. The diameters of stones are 1.9 × 1.5 × 0.9 cm and 1.1 × 1.0 × 0.8 cm (upper row), 2.3 × 2.8 × 1.6 cm and 3.2 × 2.2 × 1.0 cm (middle row), 4.7 × 2.5 × 1.8 cm, and 4.9 × 2.5 × 1.7 cm (lower row).
Geosciences 11 00508 g006
Figure 7. (a) Seismic volume showing the reflections of nine shells (of which eight are visible in this section) buried with (center to center) a spacing of 5 cm in 0.42–0.55 ms TWT depth. This setup was left to rest for two months before measuring. The shells appear as high-amplitude reflections below the reflections of the sediment surface. Due to the sharp limits of their reflectors, all shells can be well distinguished. (b) Photography of shells in the schematic configuration they are buried in. All shells are of medium size, with a measured length of 2.7 to 3.4 cm, a width of 2.9 to 3.7 cm, and a height of 1.0 to 1.1 cm.
Geosciences 11 00508 g007
Figure 8. (a) Seismic profile showing the reflections of a shell (with outside facing upward) and a stone of comparable size. Amplitudes of the stone reflections are higher than the reflections of the shell, which appears to be more diffuse. The location of the seismic profile is indicated in (b). (b) RMS amplitudes of the corresponding time range (depth is indicated in (a)), showing a much higher amplitude for the stone than for the shell. The diameter measured in the time slice is 2.5–4.0 cm for the shell (2.9 × 3.2 × 1.0 cm), and 3.0–3.4 cm for the stone (3.2 × 2.2 × 1.0 cm).
Geosciences 11 00508 g008
Table 1. Mean of RMS amplitude (standard deviation) in all quadrants (Q1–4) of RMS amplitude time slices (Figure 4e–h).
Time Slice
[ms TWT]
Q1
(Undisturbed)
Q2
(Spatula Cross)
Q3
(Disturbed)
Q4
(Disturbed < 0.1 ms TWT)
0.35–0.68123.3 (27.7)119.5 (32.1)129.9 (32.2)128.6 (26.0)
0.45–0.5091.5 (27.3)100.5 (35.3)113.6 (60.3)99.9 (27.9)
0.50–0.5570.1 (22.5)80.1 (43.4)92.3 (44.2)67.8 (22.5)
0.55–0.6056.4 (36.0)68.2 (61.0)84.4 (60.6)75.7 (75.5)
Publisher’s Note: MDPI stays neutral with regard to jurisdictional claims in published maps and institutional affiliations.