1. Introduction
Material selection for geothermal equipment is a crucial parameter to consider when constructing an Organic Rankine Cycle (ORC) geothermal power plant. The heat exchanger transfers heat energy from the geothermal power source to the organic fluid within the closed loop of the ORC, boiling it. The organic fluid in its vapour form is then used to transfer the energy to the turbines of the ORC plant, generating electricity, before being condensed to repeat the continuous cycle. Geothermal environments differ between locations and the material selection for the heat exchanger needs to be tailored for each environment. The geothermal fluids can be challenging for heat exchanger materials due to high velocity, abrasive particles, reactive gasses such as H
2S, and in some cases salinity [
1,
2].
The focus of the current study is to investigate heat exchange plate candidates, metals, and metal alloys which are more prone to local corrosion rather than uniform corrosion. Local corrosion is often associated with metals and metal alloys forming natural passivation layers, which protect the surface of the metal. The performance of the metals and alloys is often dependent on its natural initial passivation layer and its ability to re-passivate if it gets attacked during operation. Alloying elements such as Cr and Mo form protective oxides at the metal surface [
3]. Furthermore, the amount of Cr and Mo within the alloy is often used for ranking the alloys with pitting resistance equivalent number (PRE) [
4].
Oxygen is rarely present within the geothermal fluid of heat exchange systems and if it is, special precautions need to be taken [
5]. Gasses such as CO
2 and H
2S are common in geothermal environments [
2,
6].
The surface area and thermal conductivity of the heat exchanger plates are crucial for optimising the efficiency of the heat transfer. Scaling and corrosion often result in insulating layers forming on the surface of the plates, which reduce the heat transfer efficiency from the geothermal fluid. Scaling and corrosion are therefore important to avoid or minimize.
There are three main failure mechanisms of a heat exchanger: leakages, blocking due to deposits, and material thinning [
7]. The main reasons for material thinning are erosion and corrosion. Erosion is caused by mechanical abrasion which results in mechanical removal of the surface material. Erosion depends on fluid velocity and the presence of abrasive particles in the fluid [
7]. There is a correlation between material hardness and erosion resistance [
8]. To minimize maintenance costs, production downtime, and part replacement in geothermal power plants, it is important to study the corrosion, erosion, and scaling issues affecting the various equipment in contact with the geothermal brine and to acquire a better understanding of how to ensure the sustainability of the plants. In the case of ORC power plants, the main equipment in contact with the geothermal brine are heat exchangers.
The majority of geothermal power plants, and especially those that run on the ORC principle, operate at low or medium temperatures, below 200 °C. This is reflected in the demonstration sites of the MEET H2020 project (Multidisciplinary and multi-context demonstration of Enhanced geothermal systems exploration and Exploitation Techniques and potentials) to which this study is dedicated, such as Soultz-sous-Forêts, Grásteinn, Cazaux, Chaunoy, and Krauma. Various corrosion and scaling studies have been conducted at Soultz-sous-Forêts where the geothermal fluid is quite saline, corrosive, and tends to form scales which accumulate naturally occurring radioactive materials [
9,
10,
11,
12]. Ledésert et al. [
13] studied the scaling formation at Soultz-sous-Forêts when the reinjection temperature of the geothermal fluid was reduced from 70 °C to 40 °C. They concluded that the scaling formation observed was not influenced by the alloy of the heat exchanger material.
In recent years, several material experiments have been conducted at supercritical temperatures [
14,
15] where the conditions vary significantly from standard geothermal plants. For geothermal power plants operating at a low or medium temperature a few studies have been published [
16,
17,
18] but no review paper is available. For a tailored material selection, a common evaluation method is to expose material candidates in the actual geothermal environment. It is recommended for material evaluation that the samples be tested for as long as possible although commonly it is based on the convenience of the plant operators [
19]. Frequently, test durations range from a month and upwards. The exposure time is short compared to the lifetime of the material but gives an indication of the performance of the material in the actual environment. The most common method to evaluate exposed materials for geothermal applications is with weight loss measurements using standard ASTM G1-03, which estimates uniform corrosion. However, the materials evaluated in this study are more prone to local corrosion.
Metal and metal alloys forming natural passivation layers are more often affected by local corrosion than uniform corrosion. The passivation layer is locally broken, resulting in the direct electrical contact of the metal with the fluid. The fluid can either be in liquid or vapour form depending on the temperature and pressure. Geothermal fluids usually contain ions which increase their conductivity which can accelerate corrosion [
2]. Furthermore, Cl ions in connection with oxygen and water have been reported to assist with the breakdown of the passivation layer of stainless steel resulting in corrosion [
20]. For example, 316L stainless steel has been reported to have low performance in humid and oxygen rich environments; however, it has been successfully used in oxygen free CO
2 brines at temperatures as high as 150 °C [
21].
The 316L and 304L are some of the most used and studied materials in the geothermal industry and are widely used in heat exchangers [
5]. Nickel alloys have shown promising results in the S rich environment and Ti and its alloys in an oxygen rich environment [
5,
22]. However, due to the lower hardness of pure Ti, its alloys are often preferred for the geothermal environment [
23,
24]. Furthermore, from the oil and gas industry it is reported that the main failure mechanism of Ni-based alloy is from hydrogen embrittlement [
25]. It has been reported by Karlsdóttir et al. [
14] that the most corrosive resistant material tested for geothermal heat exchange application in superheated geothermal steam was Inconel 625 and Ti-alloy (Ti gr. 7). Furthermore, the group reported that 254SMO had a corrosion rate of 0.001 mm/year measured according to ASTM G1-03 [
14], which is in line with results from the same group’s measuring in simulated superheated geothermal conditions’ corrosion rate of 0.001 mm/year [
26]. Therefore, 254SMO has been recommended to be used by the Icelandic geothermal industry [
10]. However, due to its cost it is not as commonly used in geothermal environments [
27] as other cheaper materials such as 316L, for example.
The pH of the fluid is an important factor for determining the lifetime of components and 316L is, for example, not recommended to be used at a pH lower than 3.2 [
28] where superaustenitic steels, such as 254SMO, can be a good option [
29]. For geothermal applications, stainless steels and Ni-alloys are recommended to have a minimum of 3% Mo [
30]. However, high levels of Mo could result in more risk for inducing segregation, the formation of hard and brittle phases within the material, which could initiate cracks and voids during exposure [
31]. The grain size of steel can be crucial as smaller grain size can reduce interdenritic segregation as well as the chances of high temperature cracking [
32]. Inclusions are common within stainless steels and have been reported to be found in 254SMO [
31,
32] and 316 [
33]. The inclusions can be a preferential place for crack development at the subsurface of the material [
33]. Inclusions can create geometric discontinuities where stress and strain can accumulate [
34]. Moreover, for surfaces with a passive layer, an inclusion might act as an initiation site for pitting [
35].
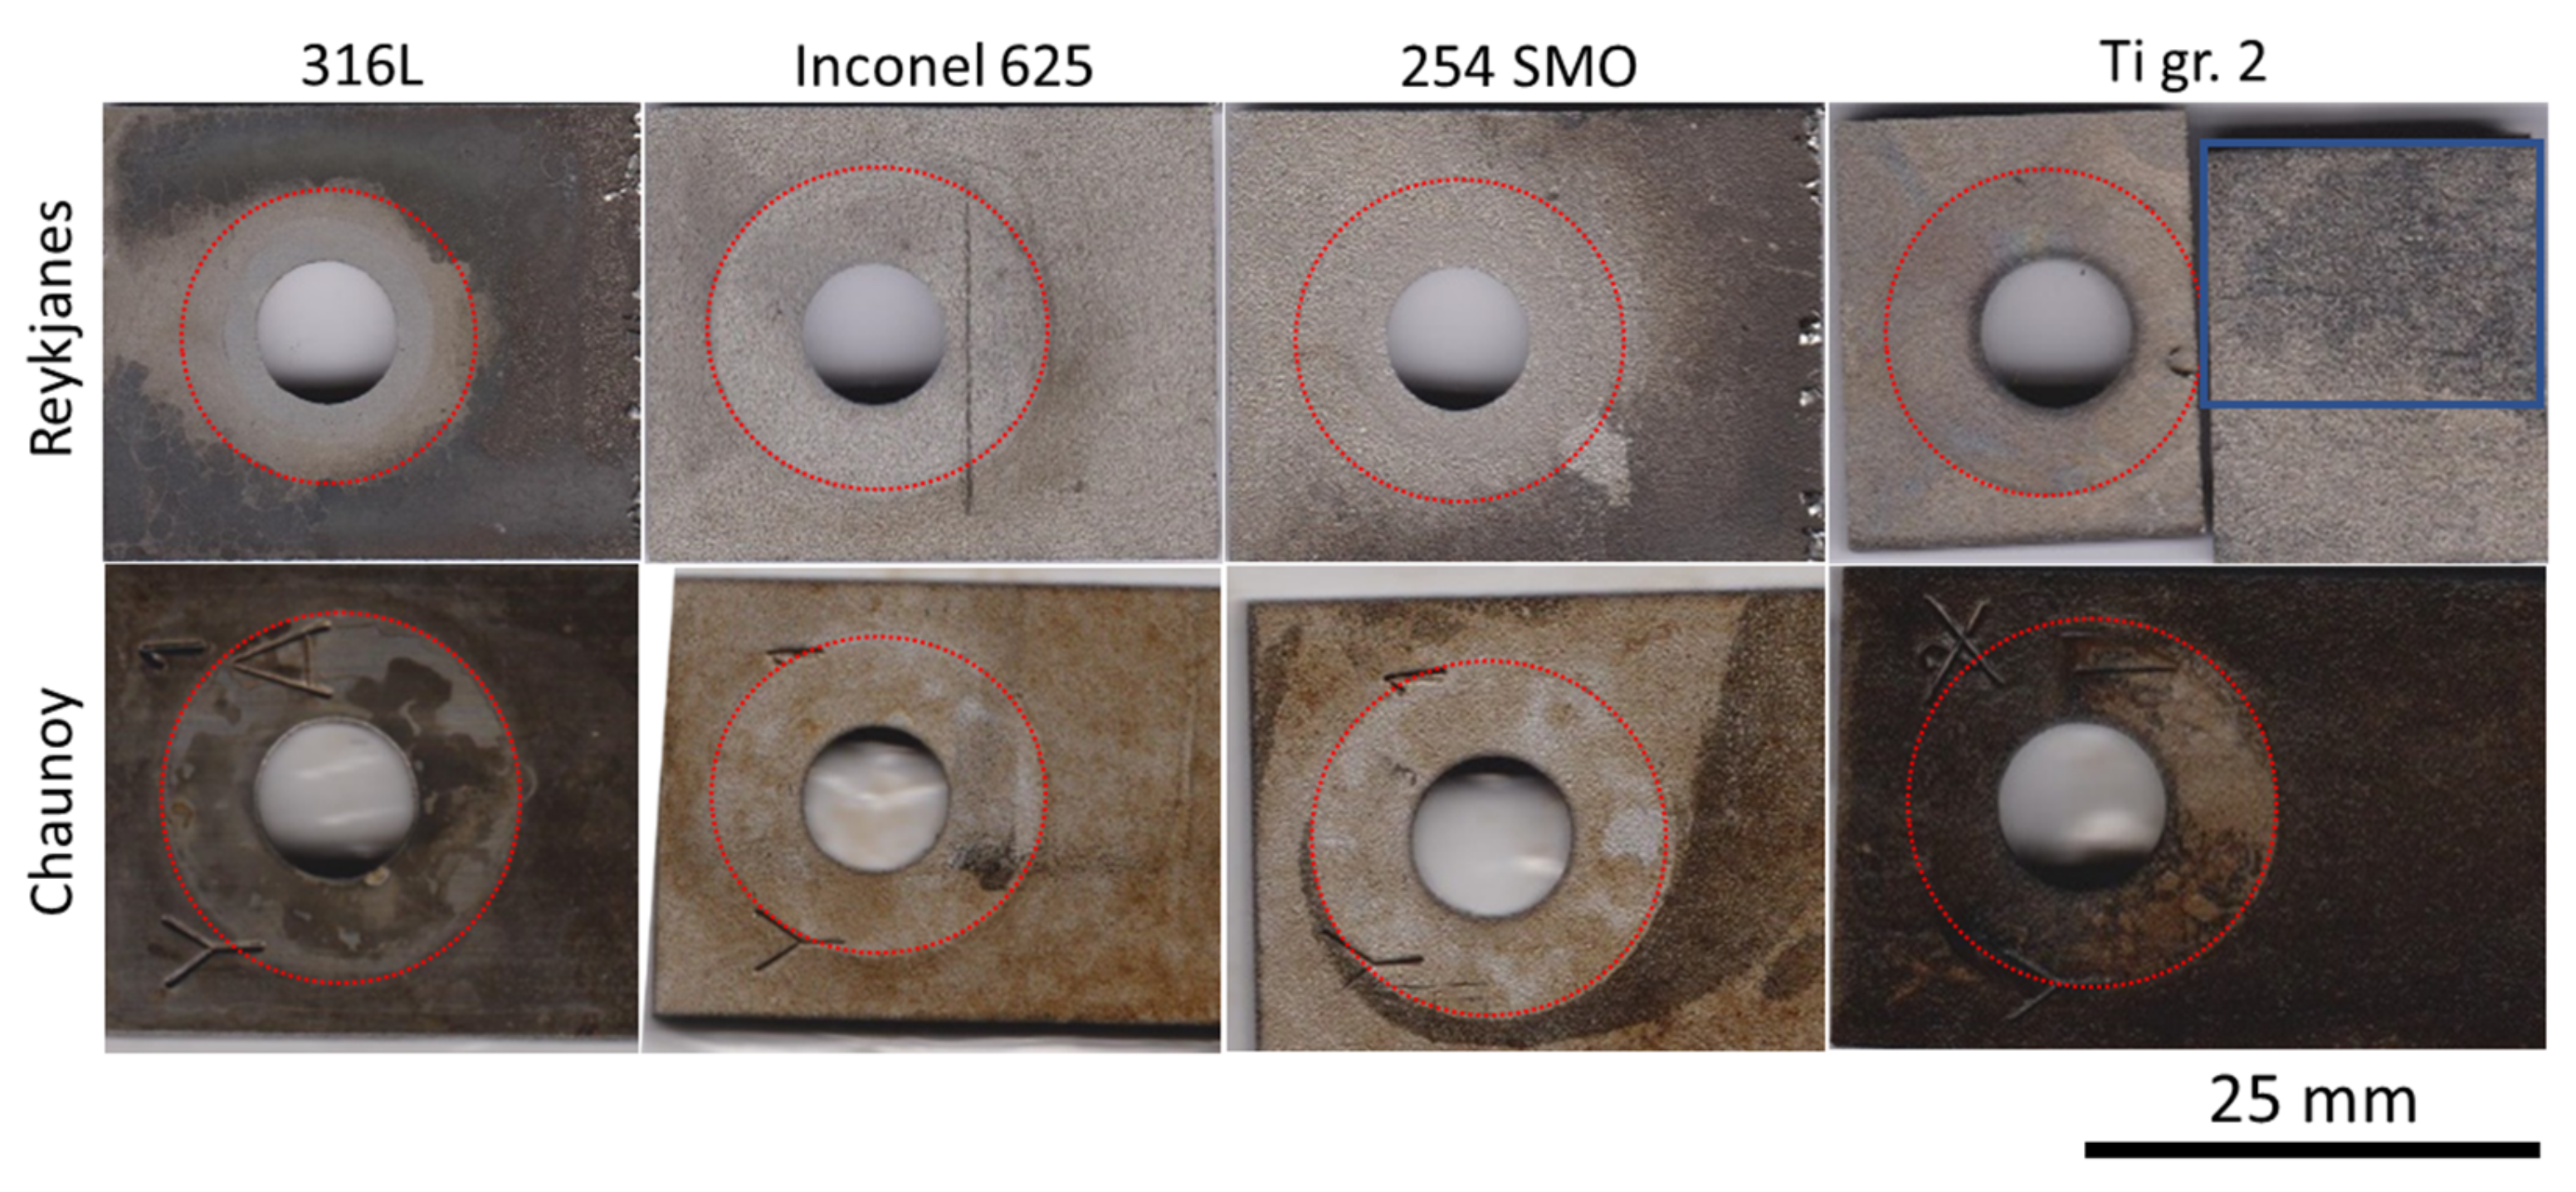
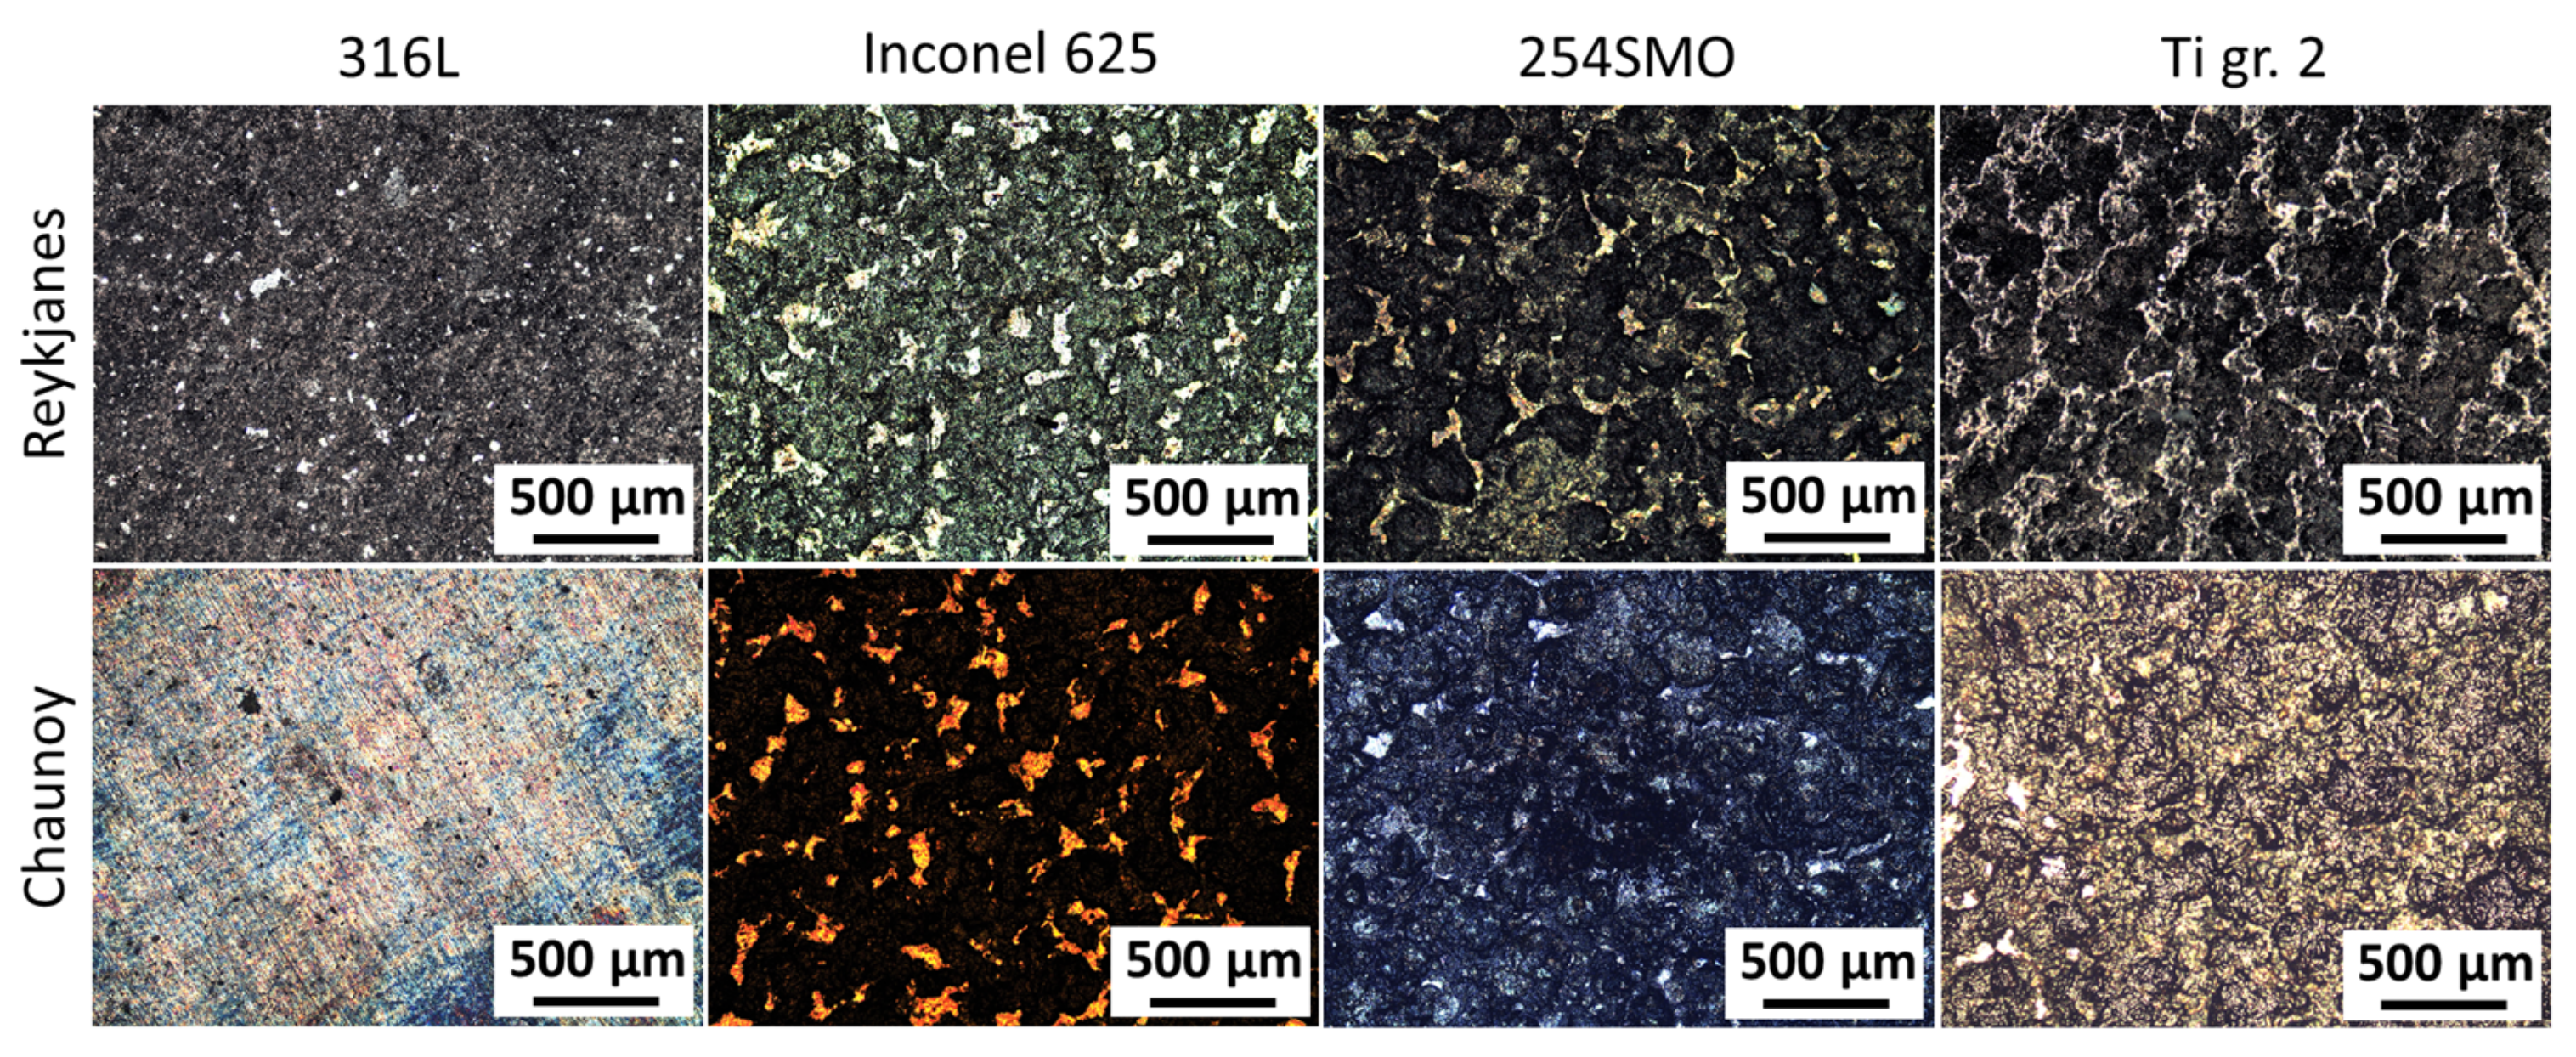
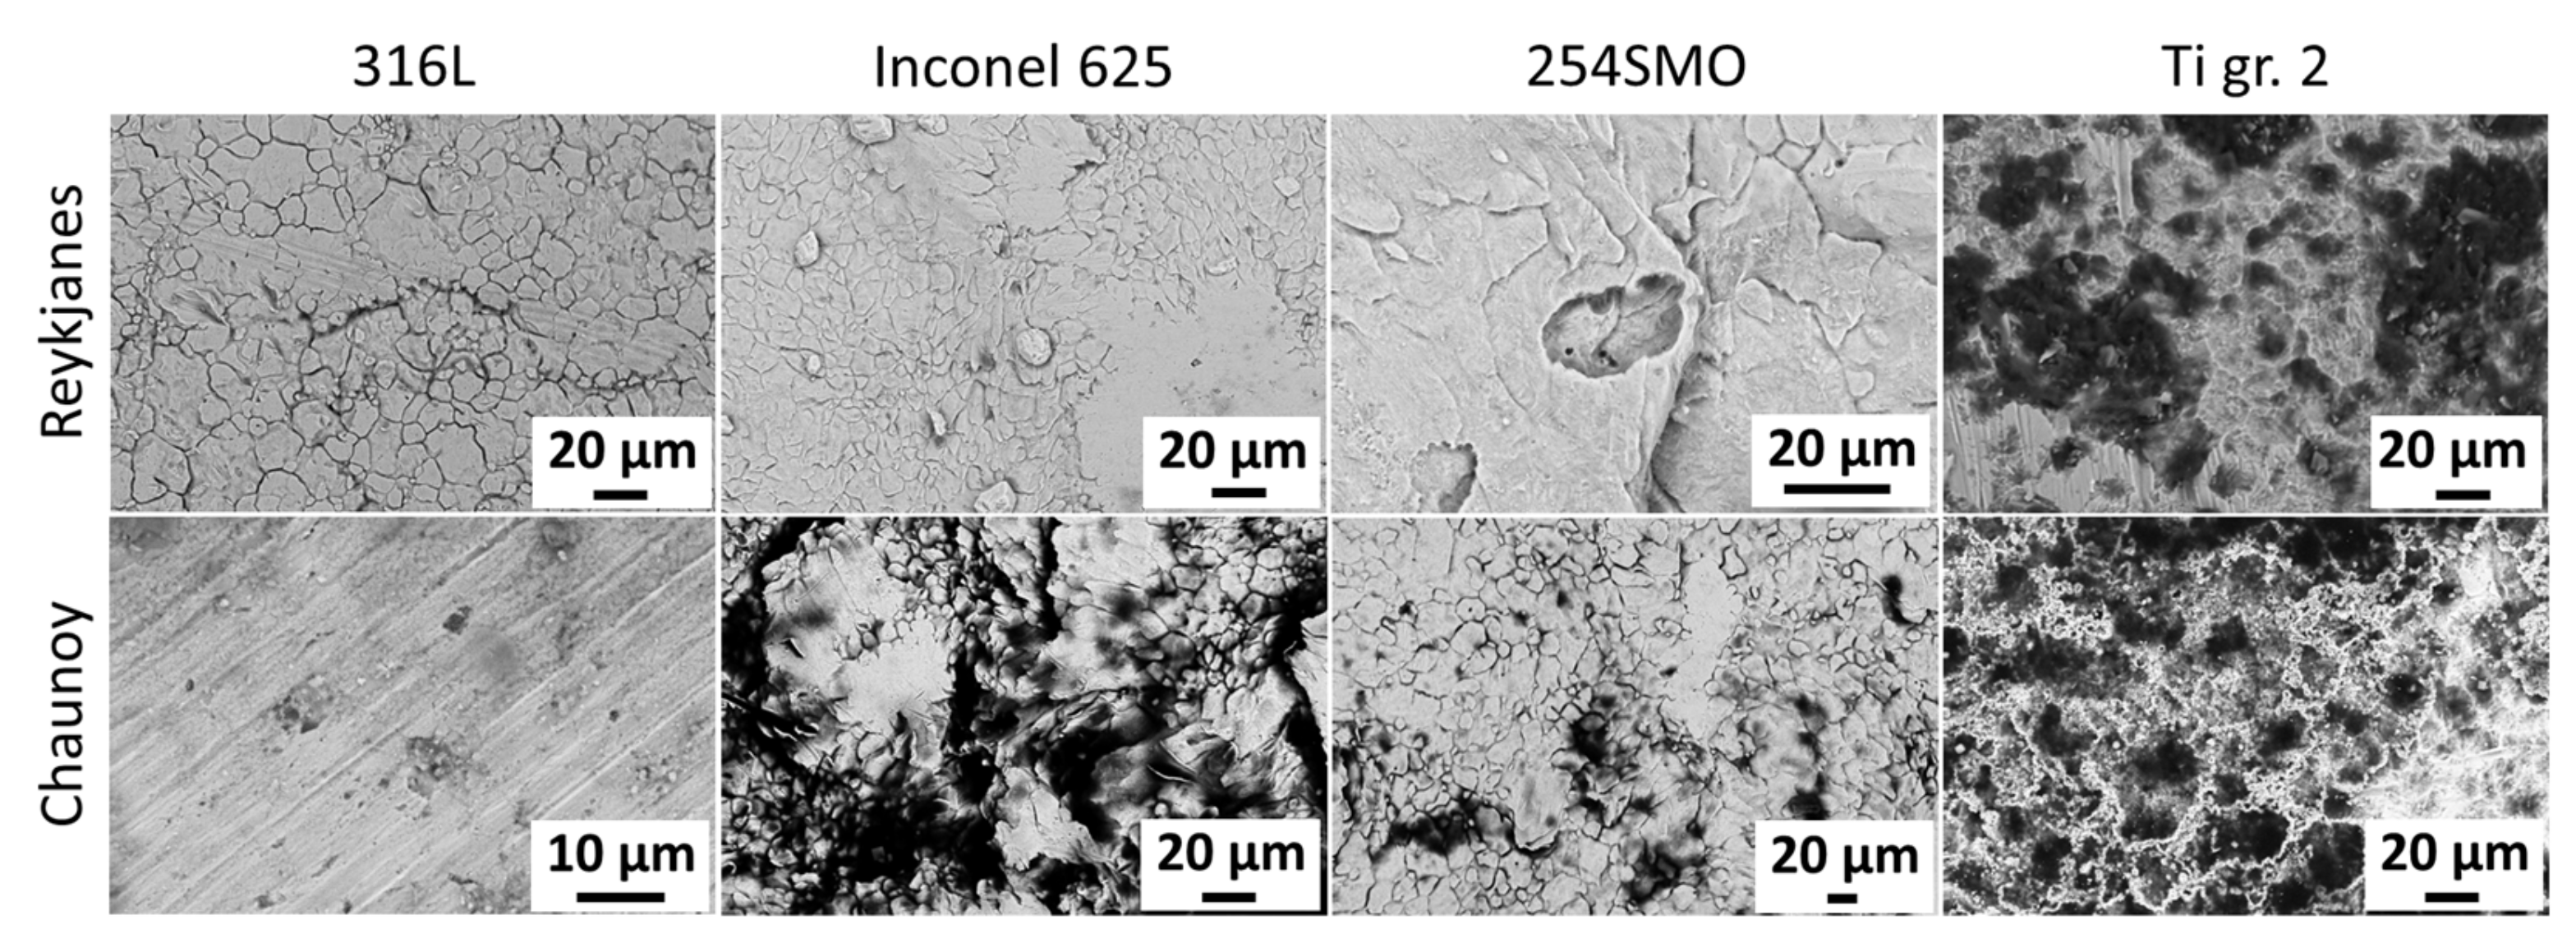
To identify suitable materials for heat exchangers in low-temperature volcanic and sedimentary ORC power plants, four metal samples were exposed in two different geothermal environments, namely at high salinity locations in Reykjanes, Iceland and Chaunoy, France. The effects on the coupons were then examined macro- and microscopically. The selected materials consisted of stainless steels 316L (EN 1.4404) and 254SMO (EN 1.4547), nickel alloy Inconel 625 (EN 2.4856), and titanium grade 2 (EN 3.7035). All these materials are reported to be used in the geothermal industry [
29]. In general, failure during the plate heat exchange operation accrues in the weakest points of the material. Additionally, the materials studied here are more prone to local corrosion than uniform corrosion. Therefore, the main interest of this study is to investigate the most affected areas of the exposed materials and report on the observed local corrosion. The testing period was one and four months, respectively, for Reykjanes and Chaunoy, while the expected lifetime of a heat exchanger is around 20–30 years. All samples tested were affected by the exposure, including 254SMO and Inconel 625. Further investigation is needed to determine the development of the defects found after the exposure.
1.1. Geological Context
1.1.1. Reykjanes
Iceland began to form in Tertiary (16 Ma) [
36] and is considered to be the product of anomalously high volcanism related to the interaction of the divergent plate boundaries on the Mid-Atlantic Ridge (MAR) and the Iceland mantle plume [
37]. The MAR cuts across Iceland in a roughly SW-NE trending direction and at the crest of it is where the most vigorous magmatic activity occurs. Thus, numerous active volcanic systems can be found along the ridge axis [
38]. The Reykjanes Peninsula, in SW Iceland, is a continuation of the median fault zone of the MAR and continues as Reykjanes Ridge offshore SW of Iceland. The Peninsula is formed of hyaloclastite ridges and basaltic lavas [
39]. The oldest lavas on the surface are from the Late Pleistocene age while the youngest are from the Holocene [
40]. Furthermore, the area is intensely fractured with normal faults and extension fractures, within a narrow belt, along with eruptive fissures lying perpendicular to those extensional rifts [
39,
41]. There are four distinct volcanic systems on the Reykjanes Peninsula, from west to east: Reykjanes, Krísuvík, Brennisteinsfjöll, and Hengill fissure swarms [
42,
43], see
Figure 1.
The Reykjanes fissure swarm, which the Reykjanes geothermal field is a part of, is at least 45 km in length, where 30 km are on land [
44]. The Reykjanes geothermal field is at the SW tip of the Peninsula and is one of the smallest geothermal areas in Iceland. It is about 1–1.5 km
2, based on the geothermal features displayed on the surface [
39]. The heat source of the Reykjanes geothermal field is thought to be dykes, thin sills, and/or a sheeted dyke complex. At a 5.5–6 km depth, a brittle-ductile transition marks the bottom of potential permeability, hence, the base of the hydrothermal system [
45]. The chemical composition of the high-temperature hydrothermal fluid derives from the interaction of seawater with basaltic rocks made up mostly by hyaloclastite, volcanic breccias, and tuffaceous units to a depth of 1000 m [
46]. Observations from the 2054 m deep well, RN-10, shows that at increased depths the stratigraphy consists predominantly of pillow basalts and formations exhibit relatively high porosity and low permeability with aquifers that are related to fractures along sub-vertical dyke intrusions [
47]. The chemical composition of the liquid phase of the geothermal brine in well RN-29 at Reykjanes geothermal powerplant was measured by Iceland GeoSurvey (ÍSOR) in 2014 [
48] and is shown in
Table 1.
1.1.2. Chaunoy
The Keuper Triassic sediments were deposited during an extensional phase that induced the subsidence of the Paris basin [
49]. The sediments were deposited in a continental environment, ranging from alluvial (west of the basin) to evaporitic (east of the basin) [
50]. The maximum subsidence occurred east of Chaunoy while, to the west, the basin overlapped gently with the armorican variscan massif [
51]. The Chaunoy reservoir is part of the Chaunoy sandstone, a Carnian-Norian lithostratigraphic formation due to a second-order Scythian-Carnian cycle of tectonic origin [
52,
53]. It lies conformably on reddish dolomitic shales deposited in a coastal plain [
51]. The Chaunoy oil field (
Figure 2A), located 50 km south-east of Paris, is the largest oil field of the Paris basin [
54]. It is a broad north-south anticline structure 15 km long and 5 km wide, with a faulted eastern flank [
51,
55]. The average thickness of the reservoir is approximately 66 m [
51,
55]. It developed in the distal part of alluvial deposits. Small ribbon channel deposits are interbedded with a flood plain and lacustrine deposits. The channel amalgamation occurred during periods of low accommodation, producing highly heterogeneous sand sheets [
51]. During higher accommodation periods, channels became progressively isolated within flood plain mudstones. Finally, lacustrine mudstones were deposited, creating a vertical permeability barrier. Then, the decrease in accommodation induced a strong pedogenetic alteration responsible for dolocrete and groundwater dolomite. The amalgamation rate varied with cyclic lake-level variations, which directly controlled the reservoir geometry [
51]. Due to this history, the reservoir is strongly heterogeneous. An upper siliciclastic/dolomitic member can be divided into two units with porous conglomeratic channels interfingered with cemented lagoonal dolomites. A lower siliciclastic member shows four heterogeneous sand sheets (7 m thick), which have been correlated across the field. Each of them is made up of stacked single channel sequences. The sand sheets are separated by extensive lacustrine and flood plain mudstone layers acting as permeability barriers. Bourquin et al. [
56] presented a high-resolution sequence stratigraphy of the Chaunoy reservoir. The maximum net oil pay is 25 m with a 11 m average [
51], in which the thickness of each reservoir unit ranges from 1 m to 5 m. In this field, the well spacing, 600 m in average, is larger than the channel width [
51,
54] which does not allow for a complete understanding either of the structure or of fluid flows as well-to-well correlations are hypothetical. The Liassic shales located directly above the Triassic reservoir constitute the oil source rock [
51].
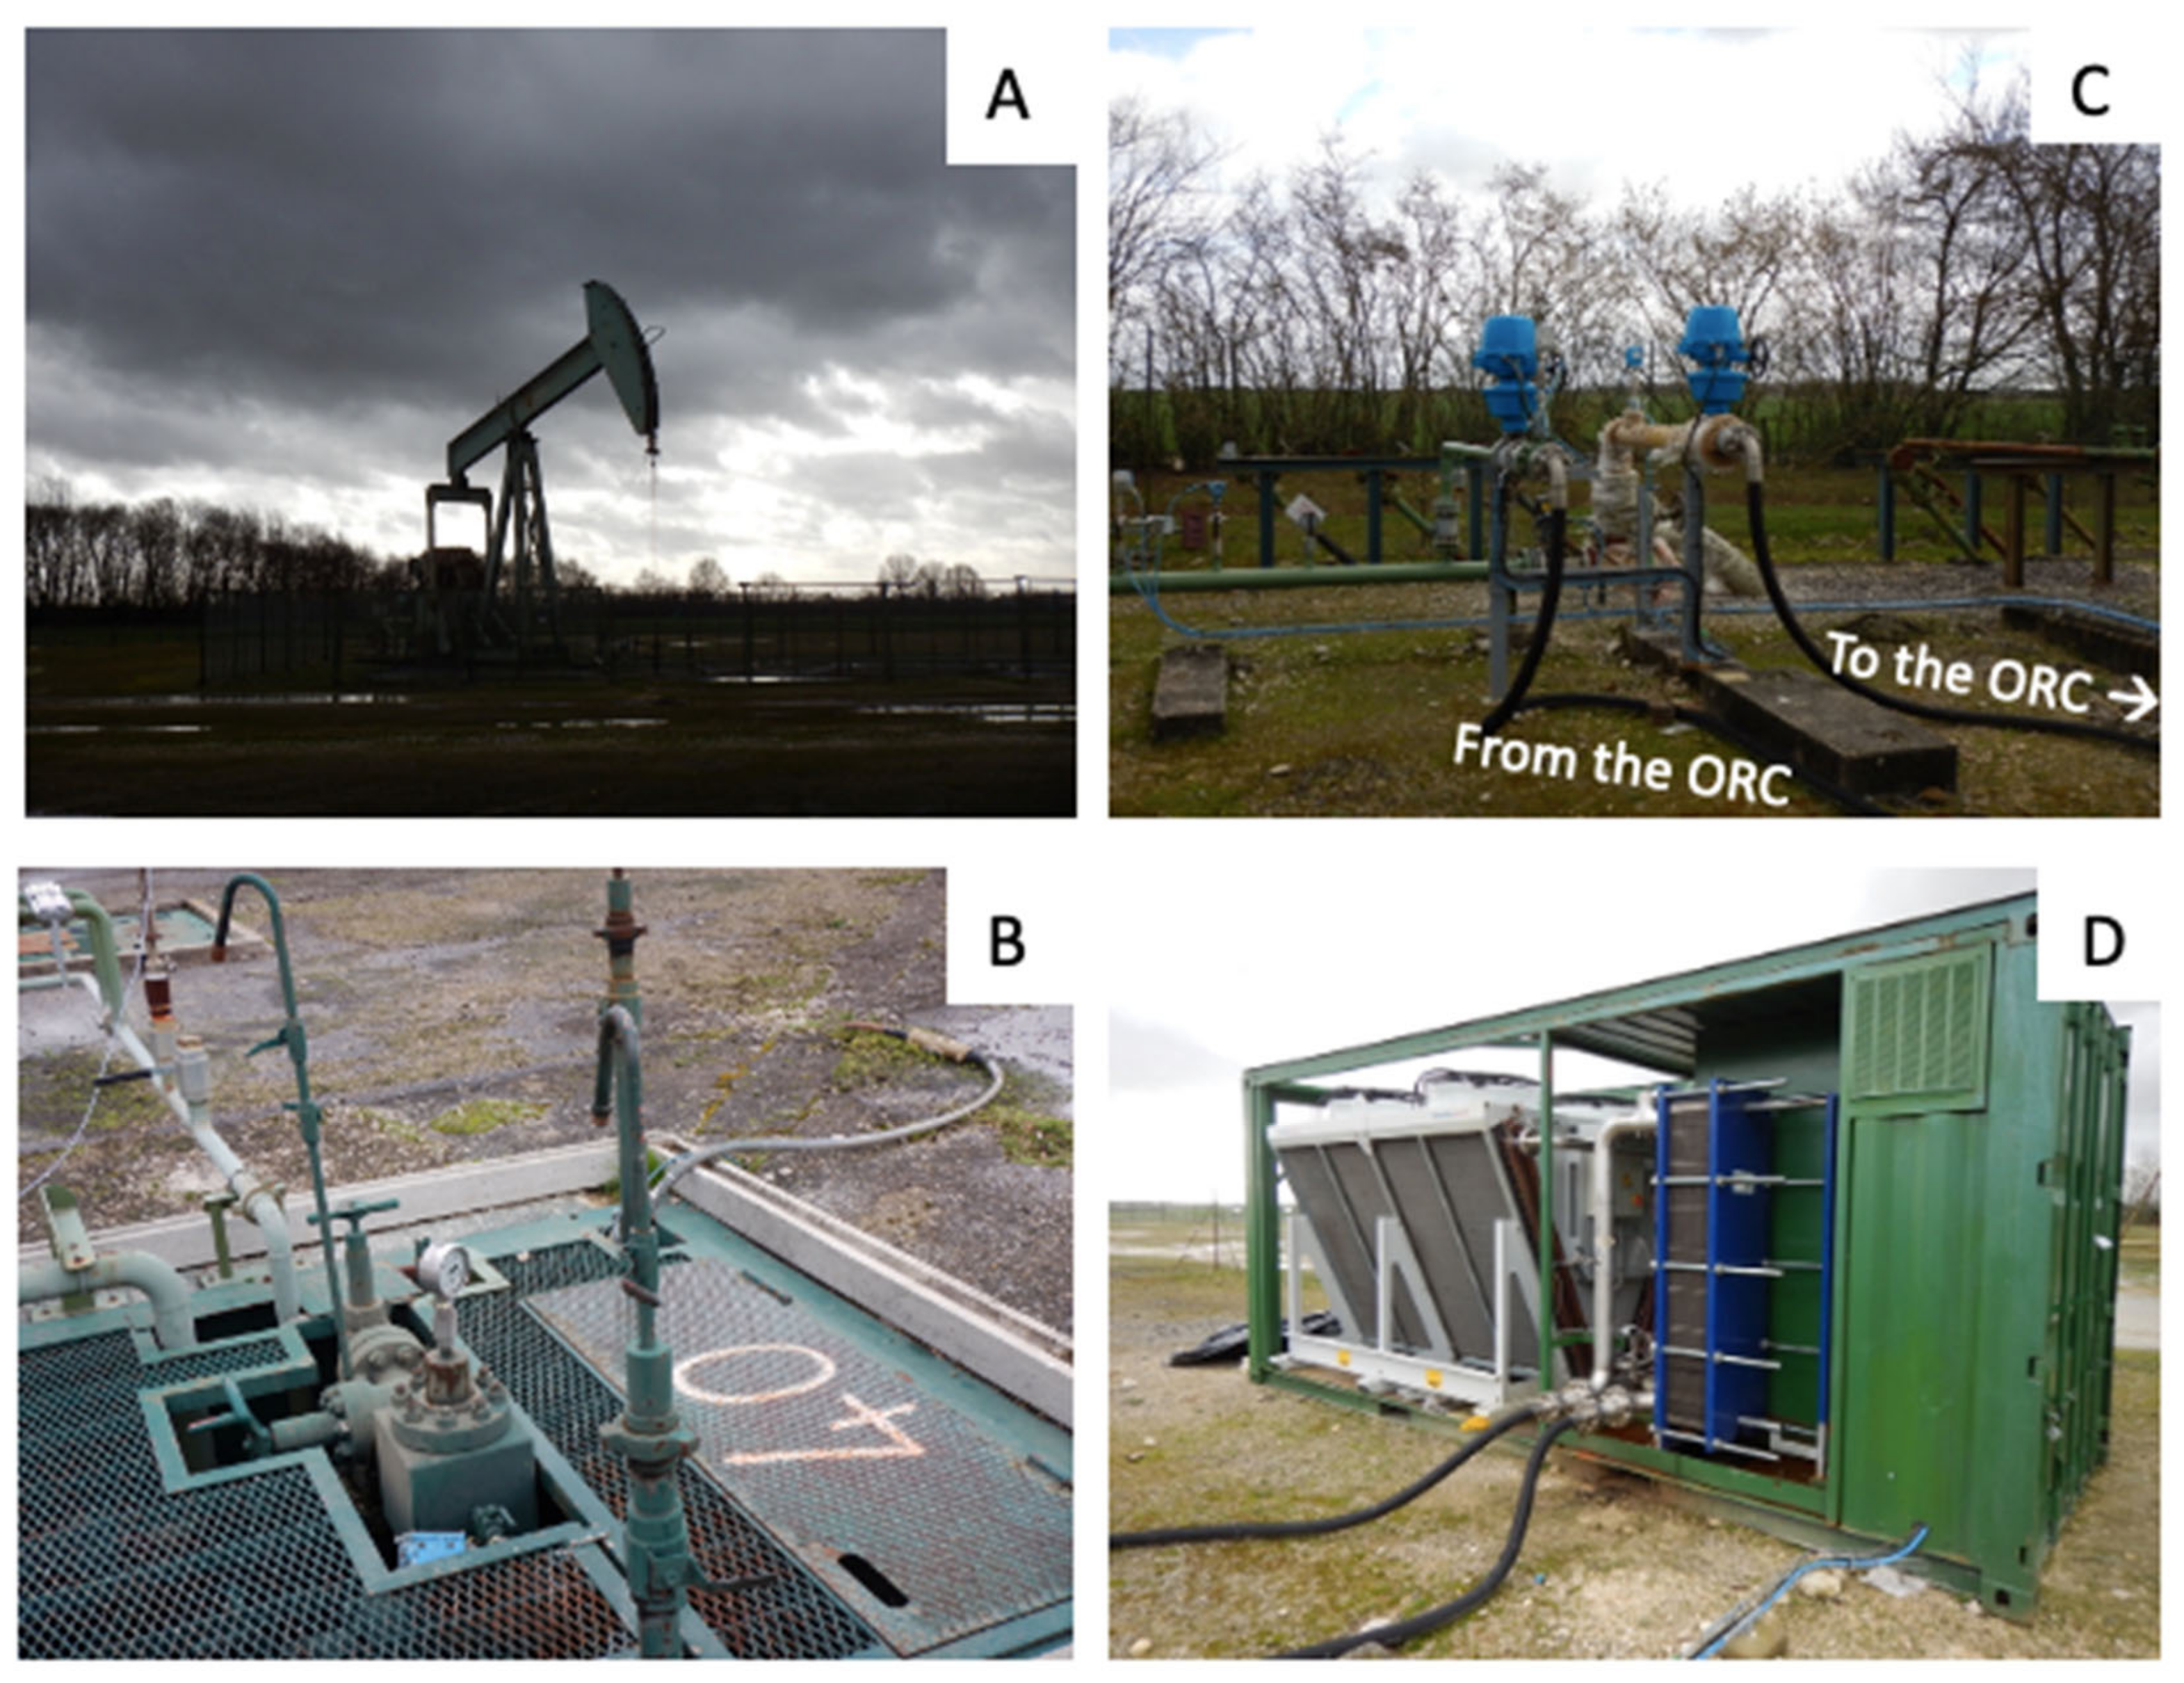
The timing of the in-situ material exposure performed at Chaunoy oil field coincided with an ORC powerplant demonstration performed within the framework of the MEET project. Exhaust water coming out of the CNY40 oil well (
Figure 2B) was connected to the inlet of an ORC powerplant. The samples tested in this work at Chaunoy were placed within the exhaust water flowline (
Figure 2C) connected to the inlet of the small-scale ORC unit (
Figure 2D). The cooled water coming out of the ORC was reinjected with the whole exhaust flow. The oil field showed a high water cut with approximately 96 L of water for every 1 L of oil produced (Vermilion, personal communication).
4. Conclusions
The most accurate method for evaluating the material performance for a geothermal application is with direct exposure of the material in the geothermal environment. Such experiments give an important indication of the viability of engineering materials in the particular geothermal setting in order to ensure the sustainability of geothermal projects. The material exposure is dependent on fluid parameters such as the ratio between steam and liquid form, corrosive ions and gases, temperature, and pressure. Furthermore, the abrasiveness of particles found within the fluid coming from the underground or high fluid velocity can also affect the material.
While the two geothermal locations differ widely in geological setting, they have some similarities when it comes to geochemistry. Both geothermal fluids, at the wellhead, have high salinity and calcium content. However, the fluid in Reykjanes is quite a bit more acidic when compared to the Chaunoy fluid, and while Reykjanes holds a high amount of SiO2, the fluid at Chaunoy is a mixture of geothermal brine and oil. The experiment at Reykjanes, a volcanic geothermal area, exposed the samples to a separated vapour state 200 °C and 18 bar geothermal fluid, resulting in a visually homogeneous appearance after exposure. The Chaunoy experiment, performed in a sedimentary basin, on the other hand, exposed the materials to a 94 °C and 9.5 bar liquid state geothermal fluid.
The duration of the exposure was 1 and 4 months for Reykjanes and Chaunoy, respectively. The Reykjanes geothermal exposure conditions are substantially more severe, resulting in similar or more affected samples compared to Chaunoy.
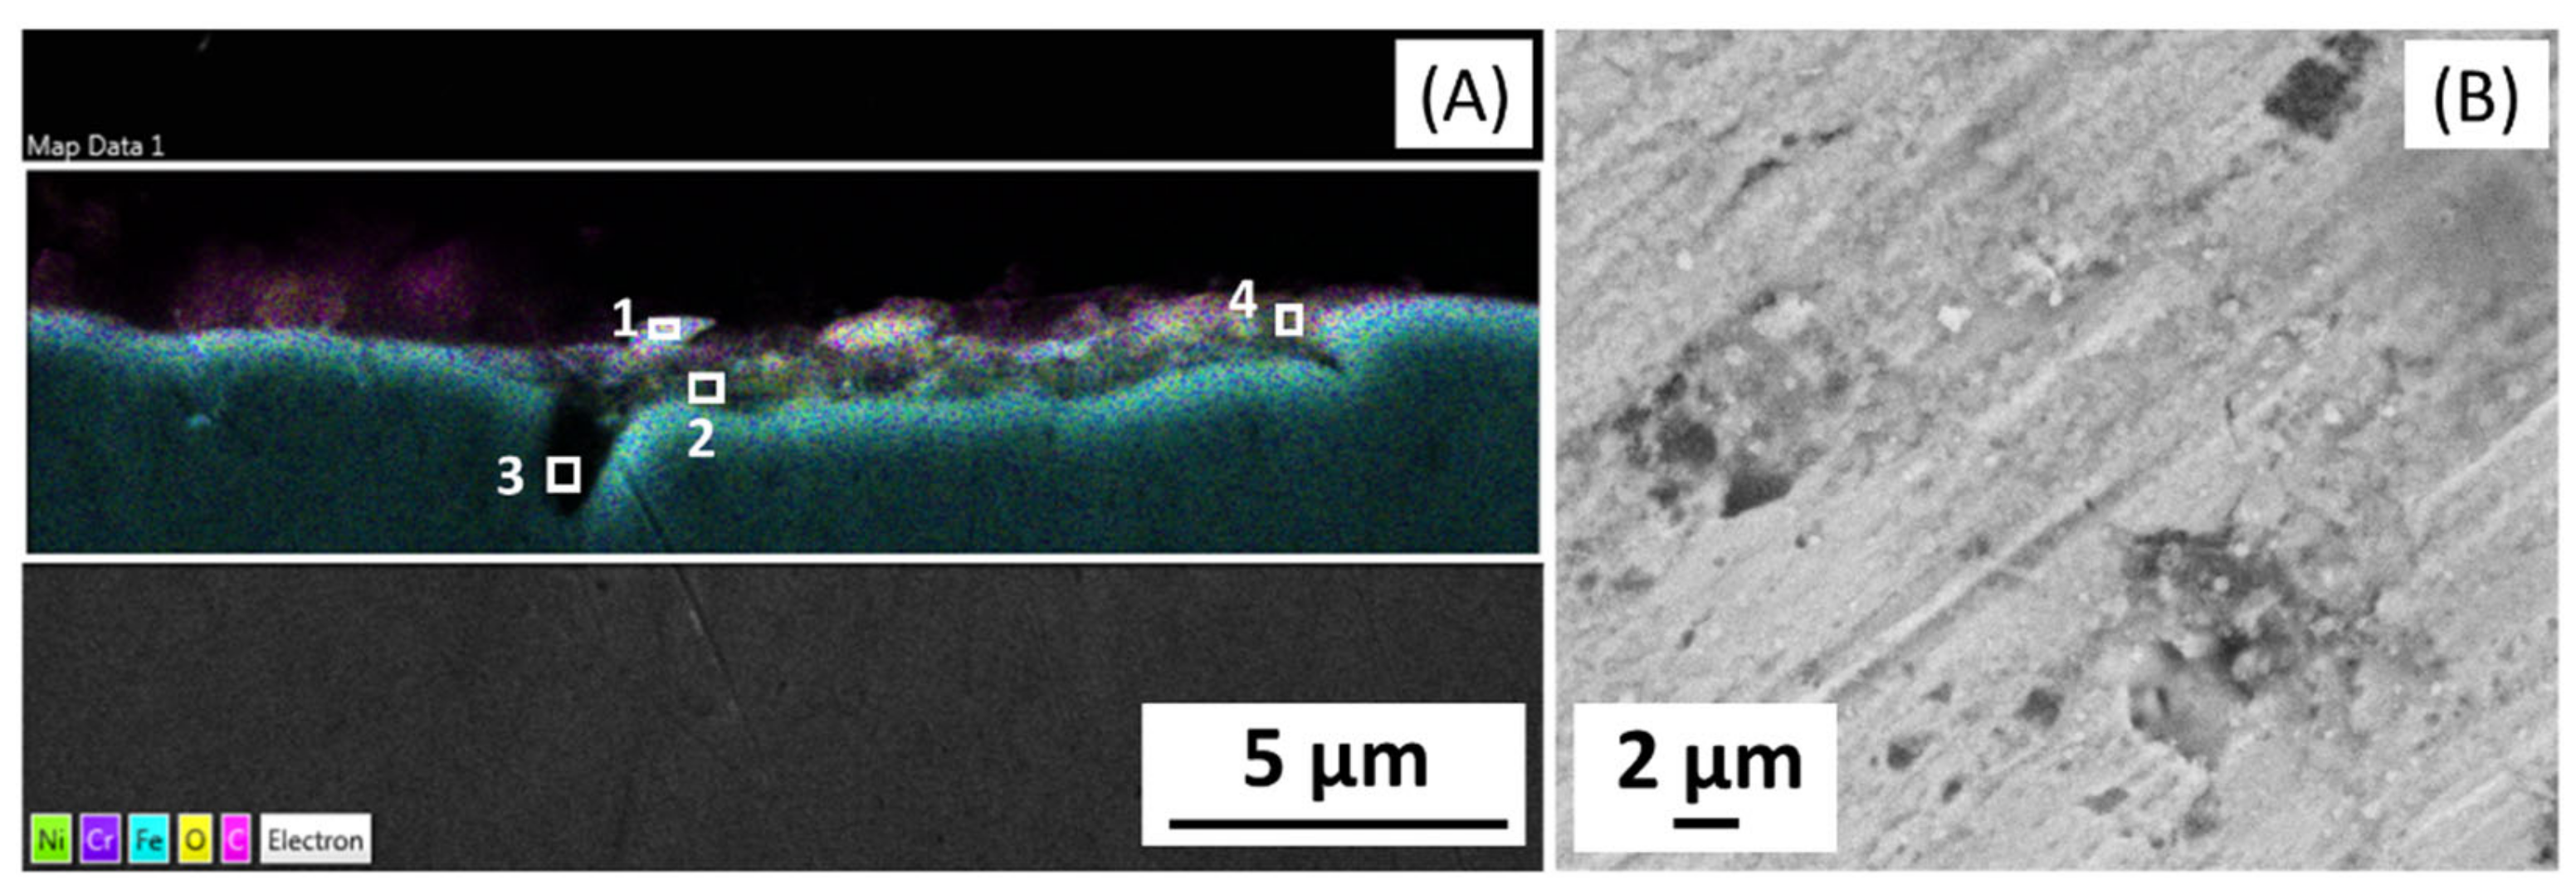
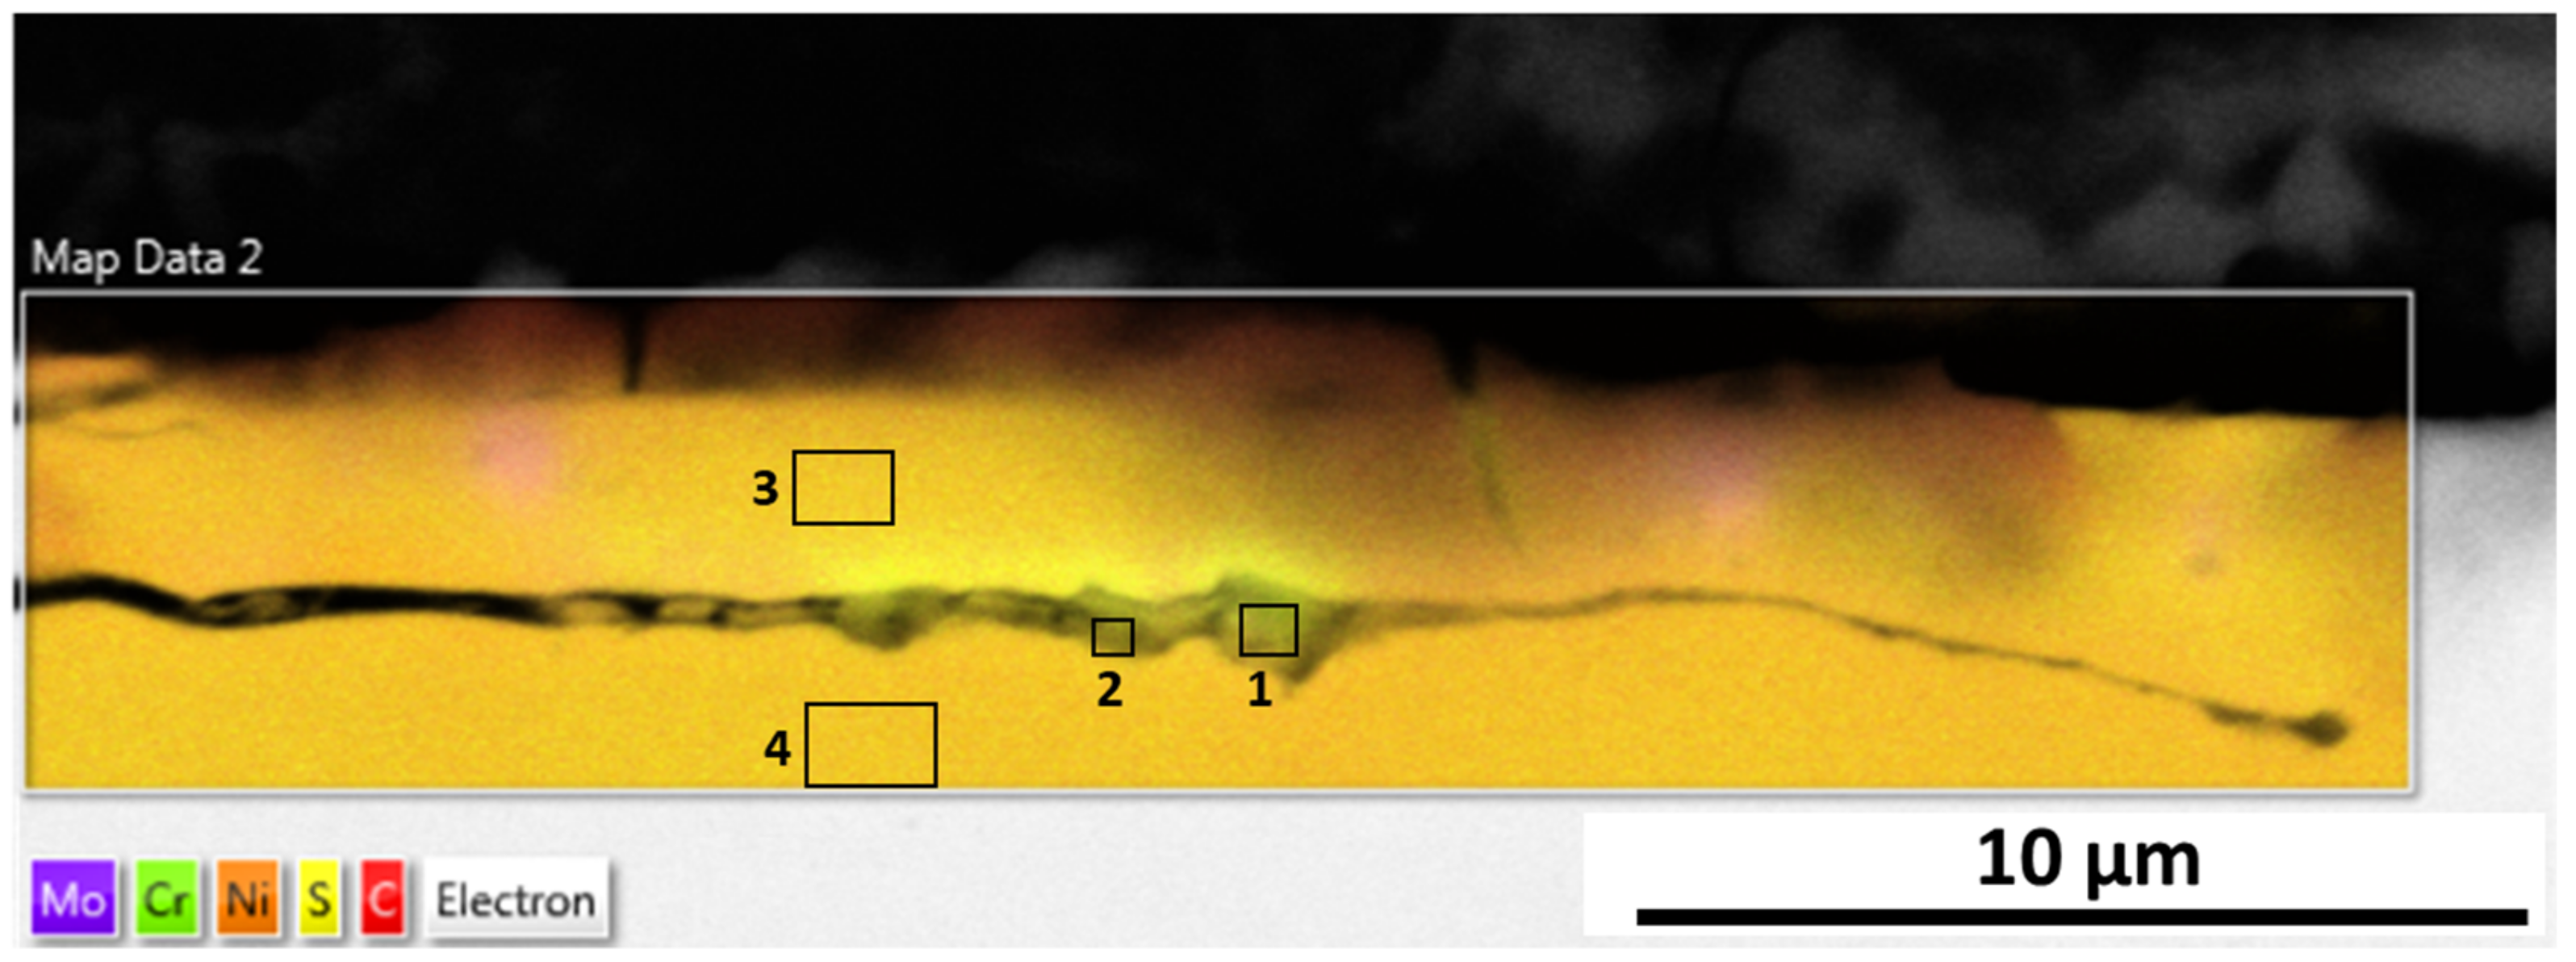
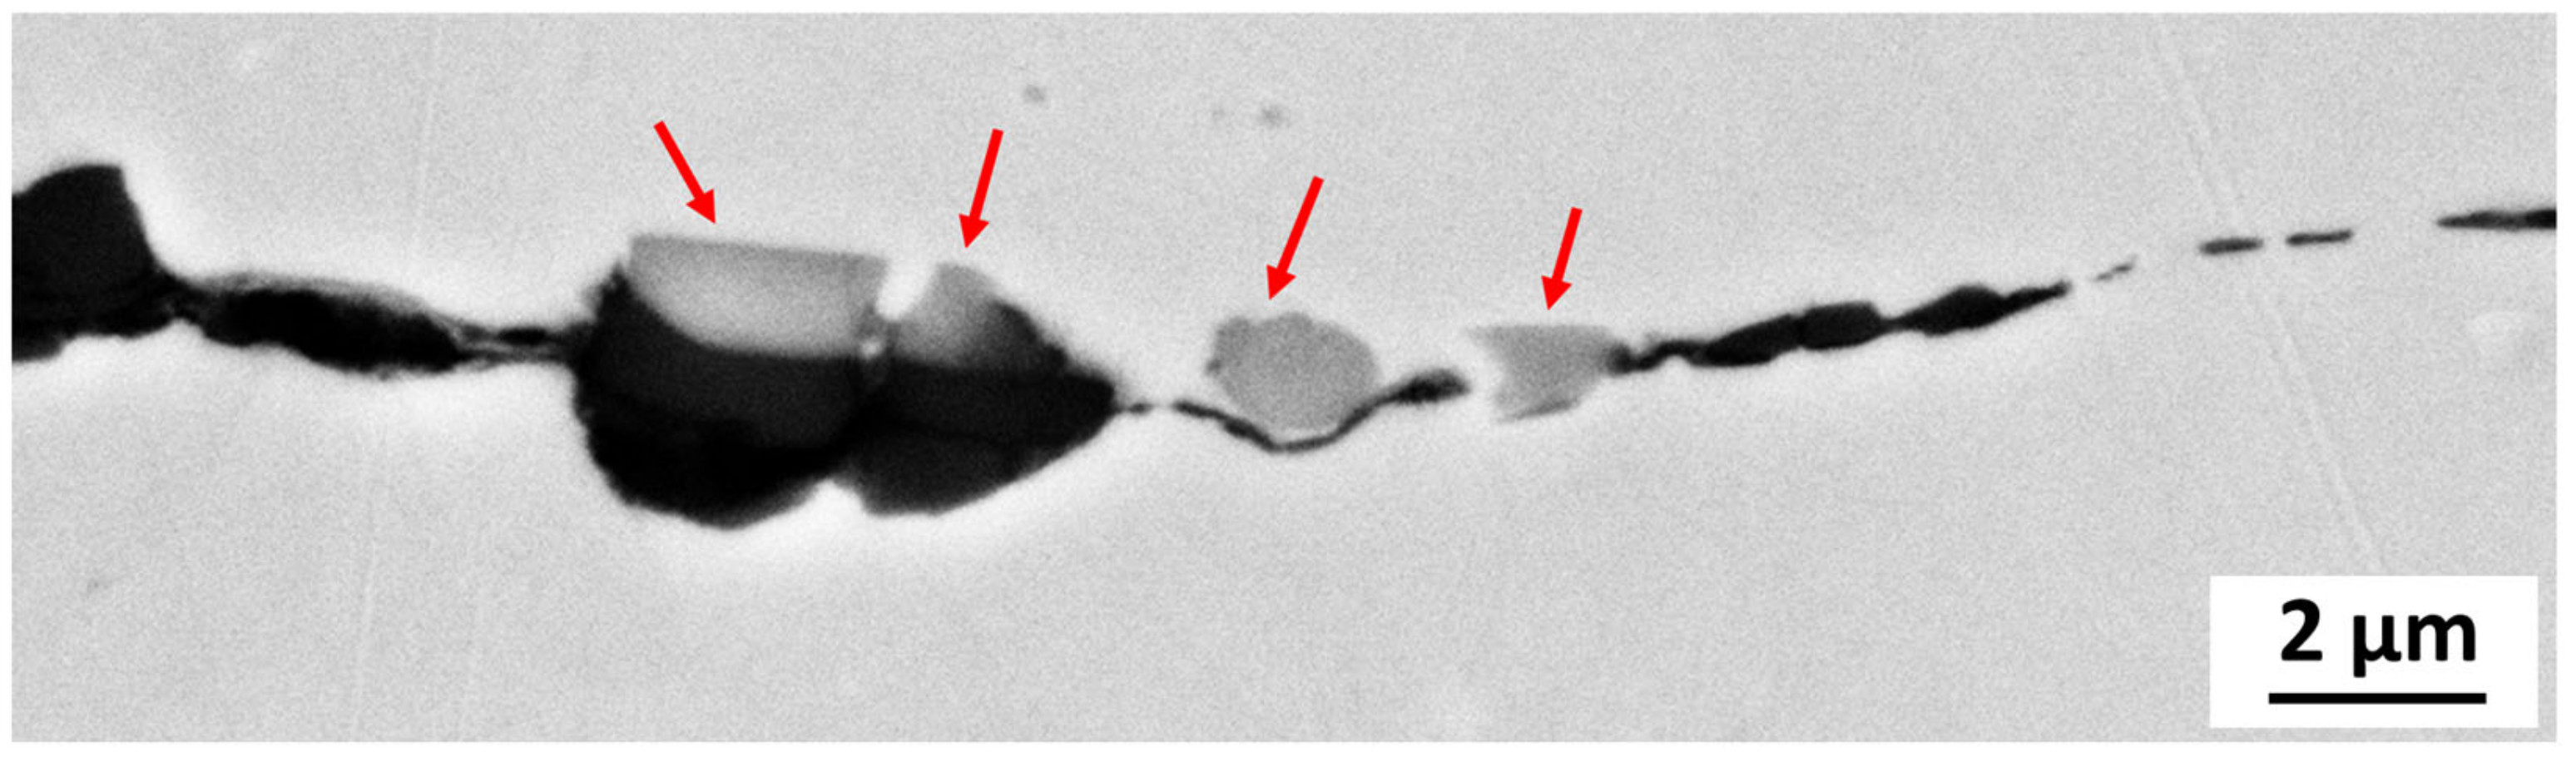
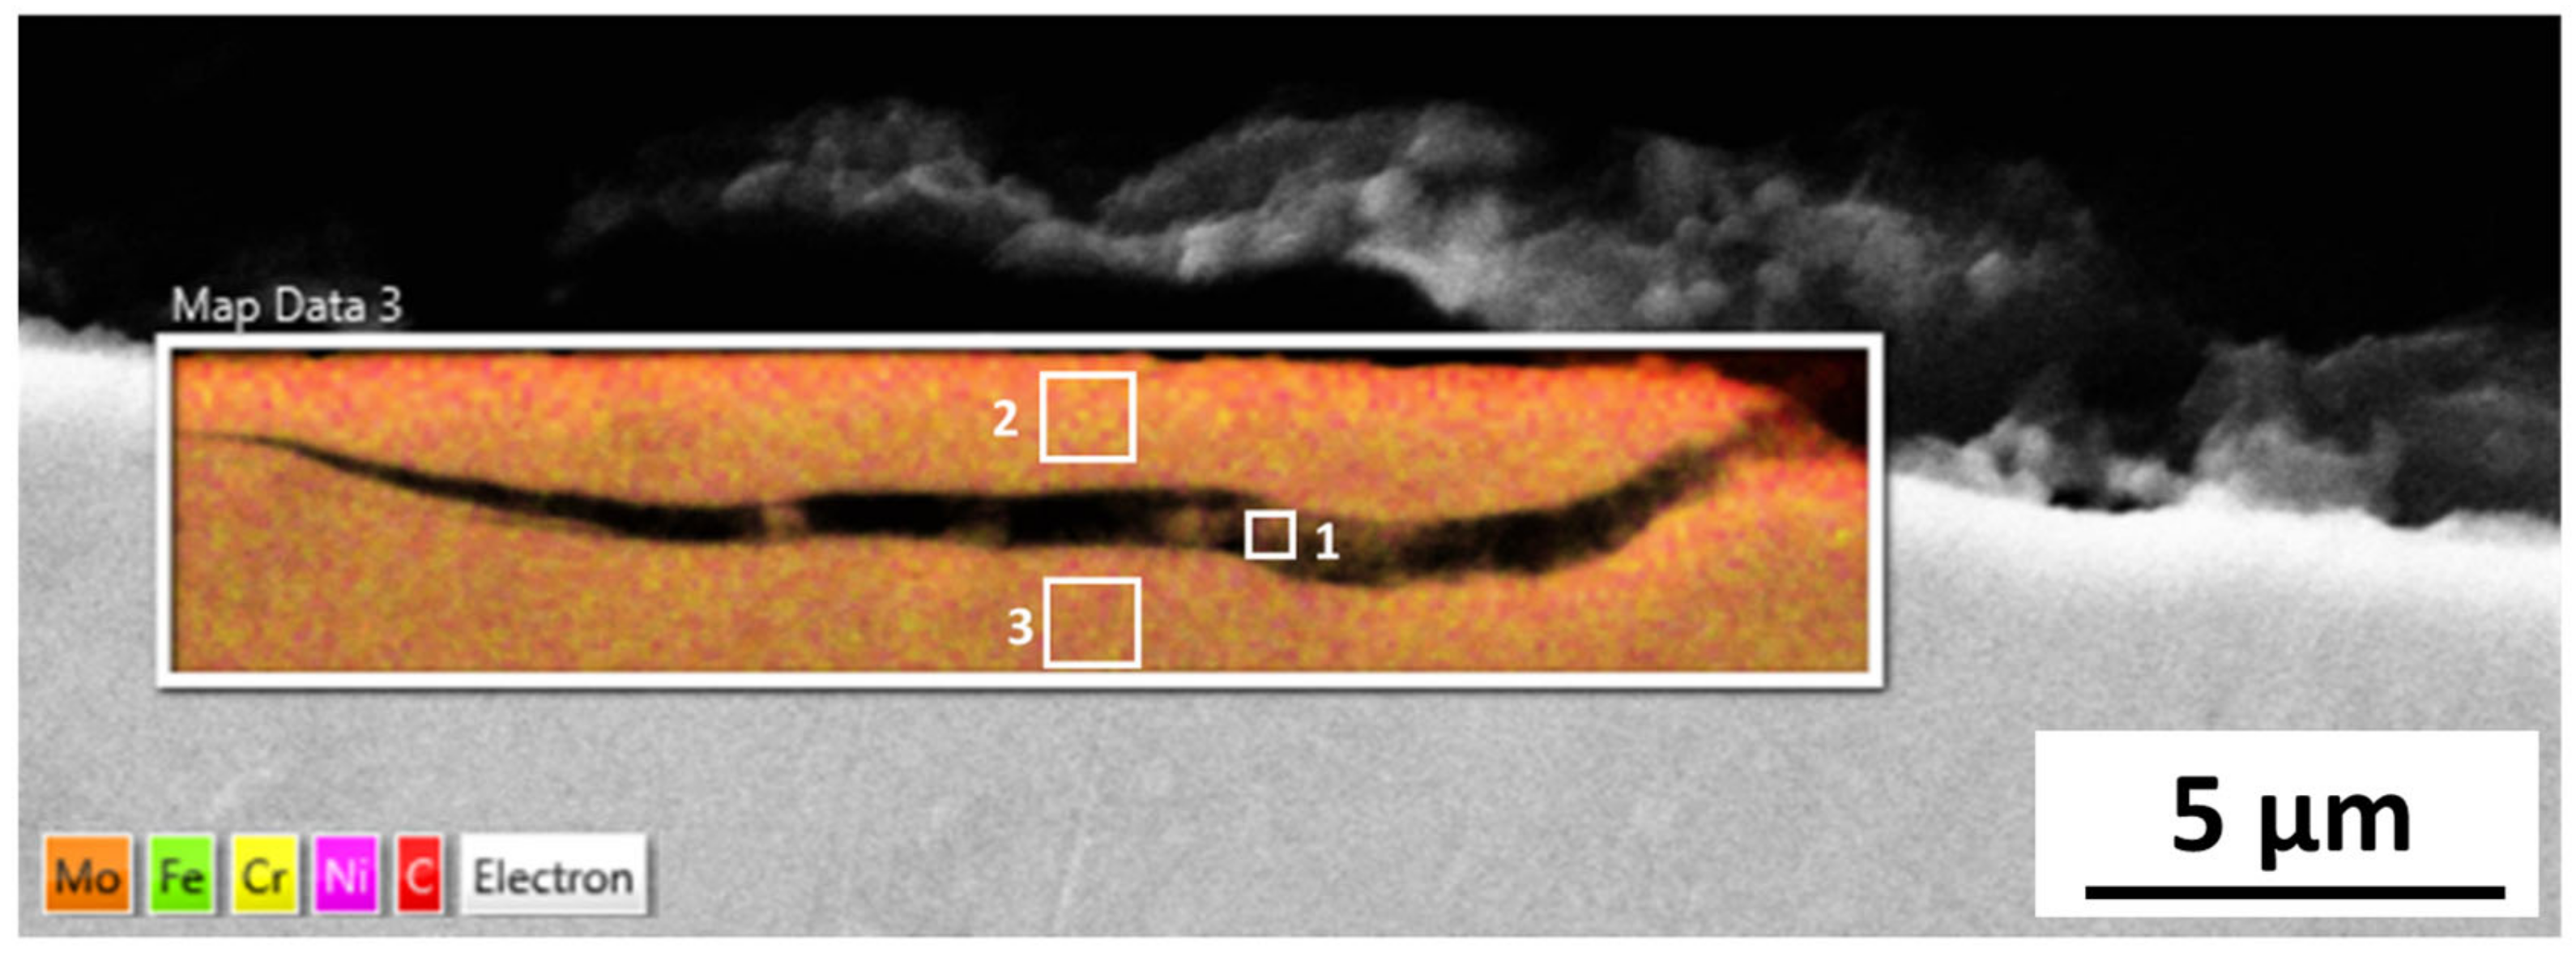
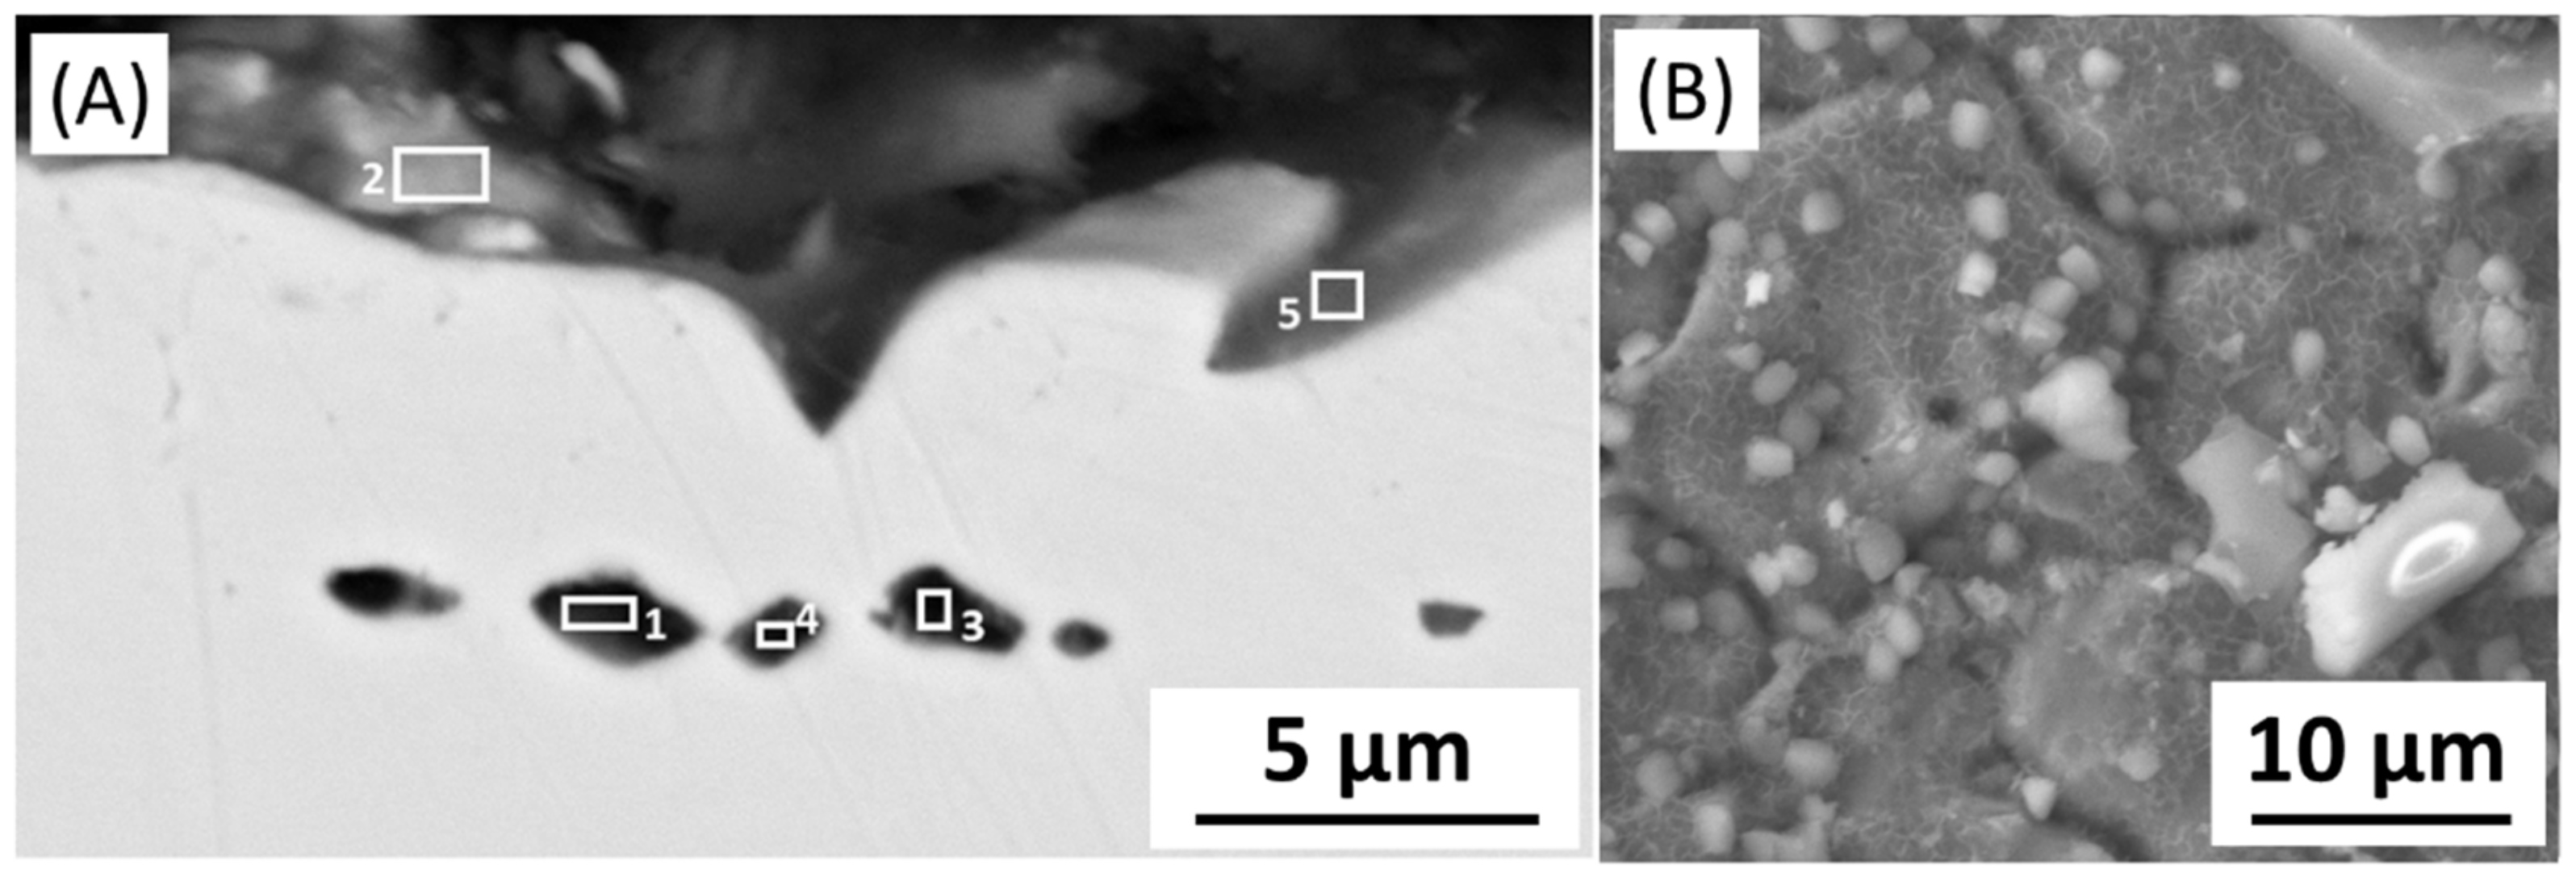
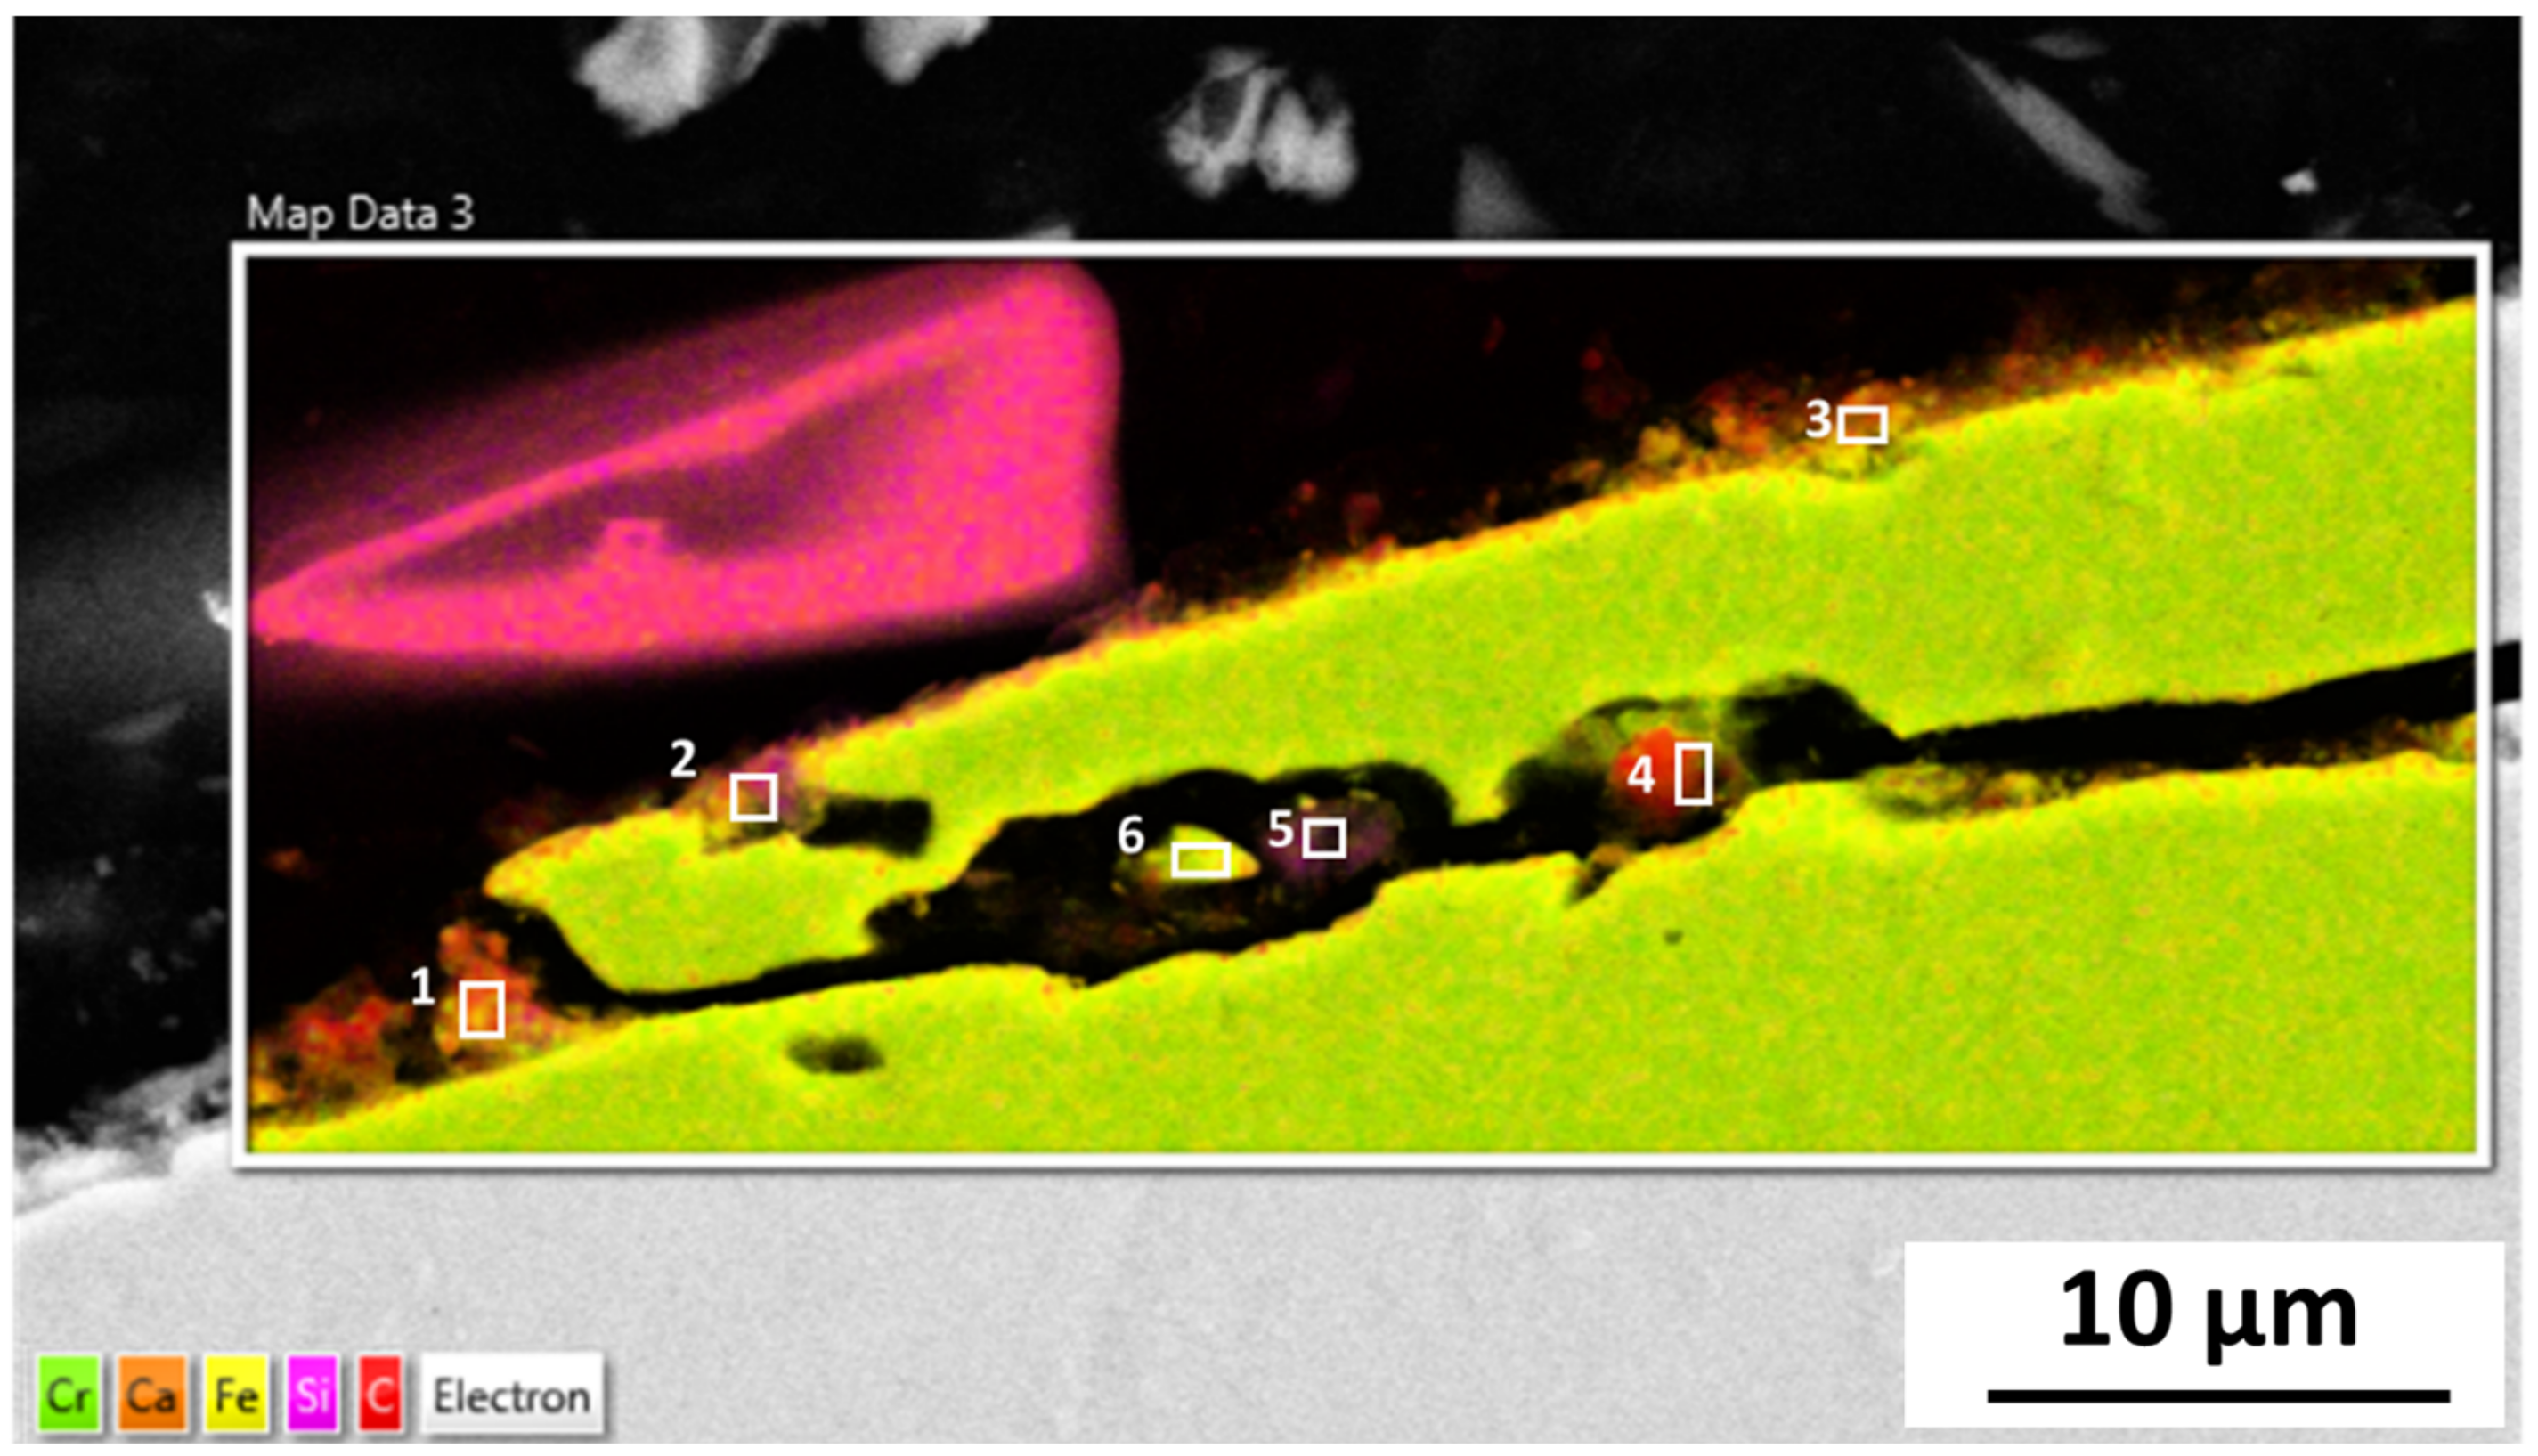
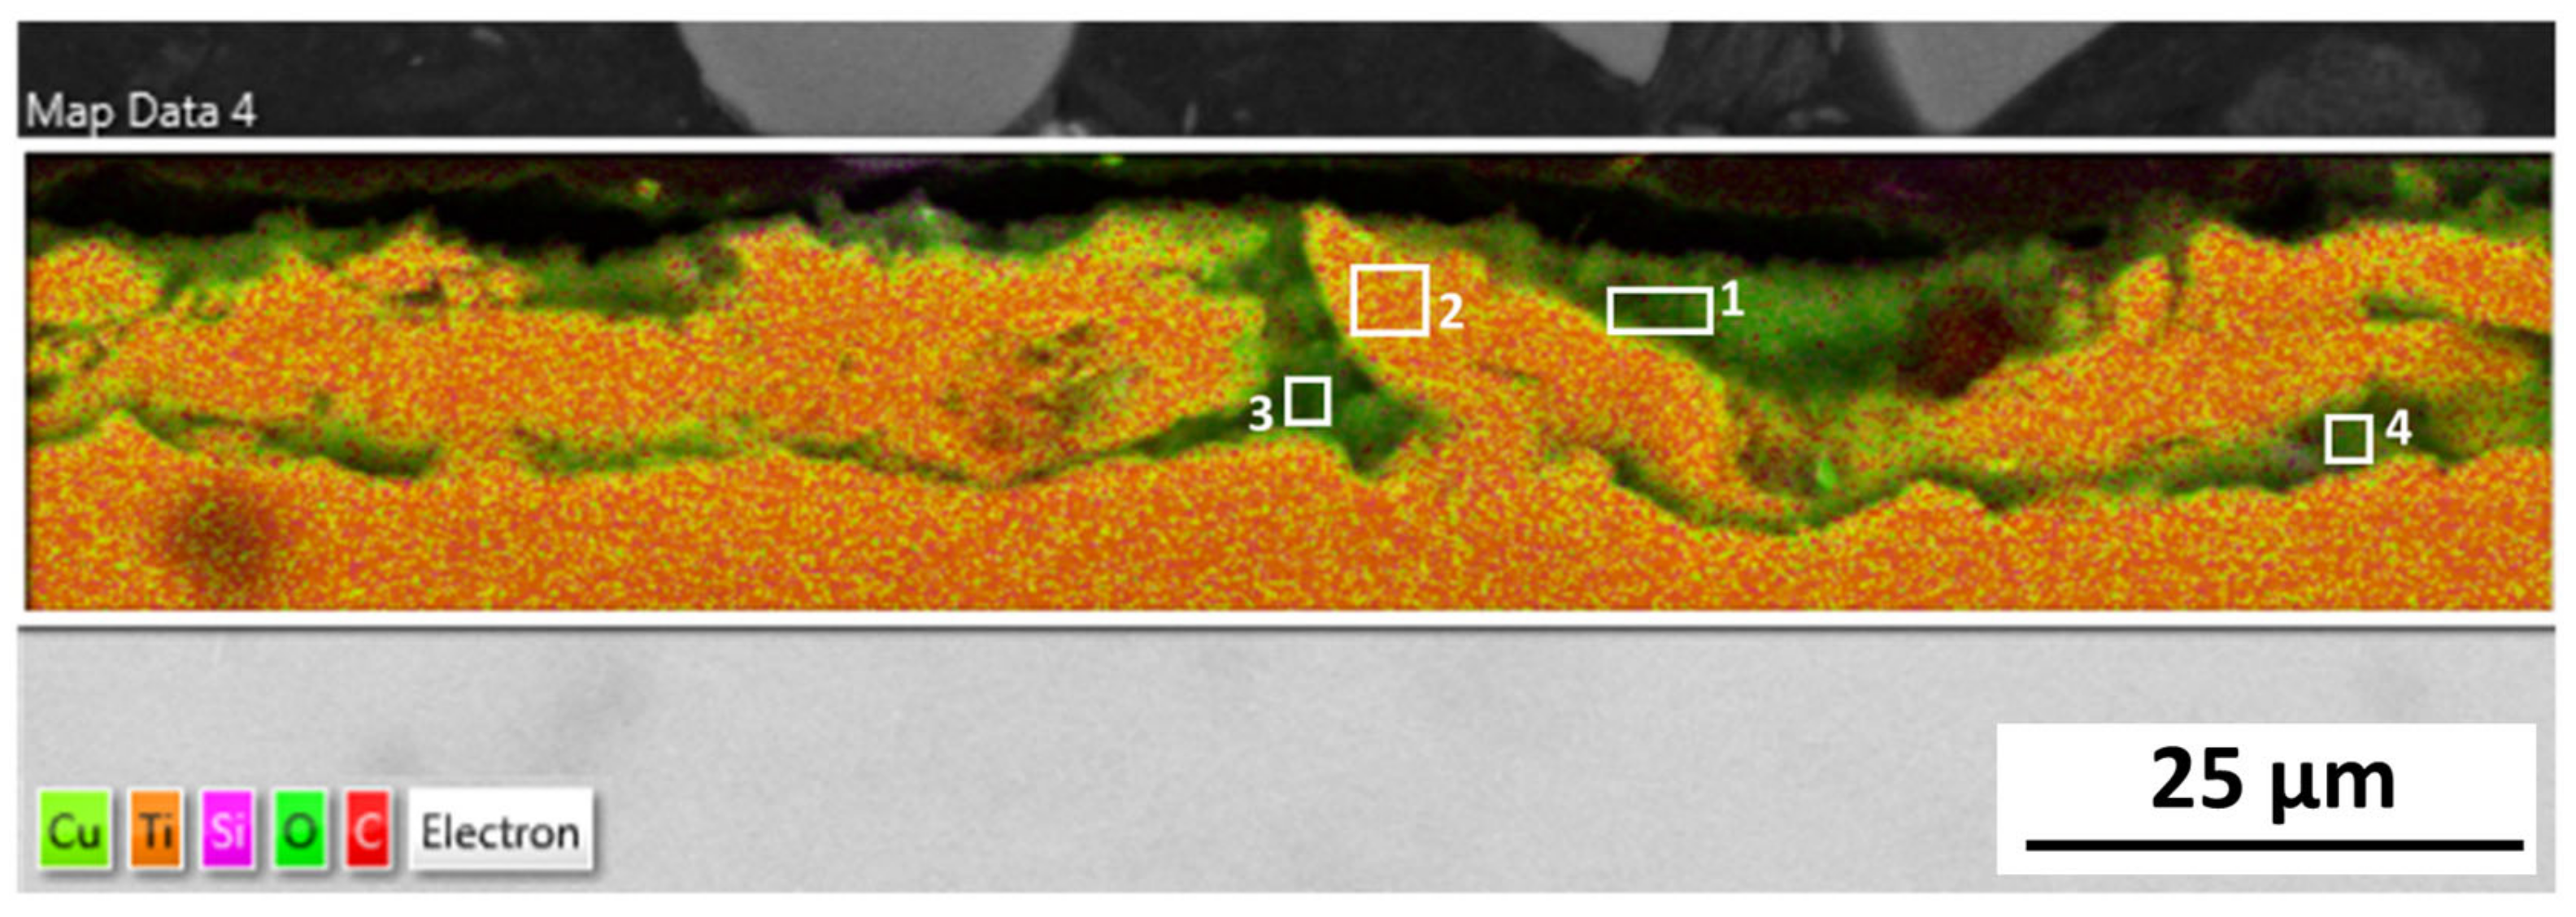
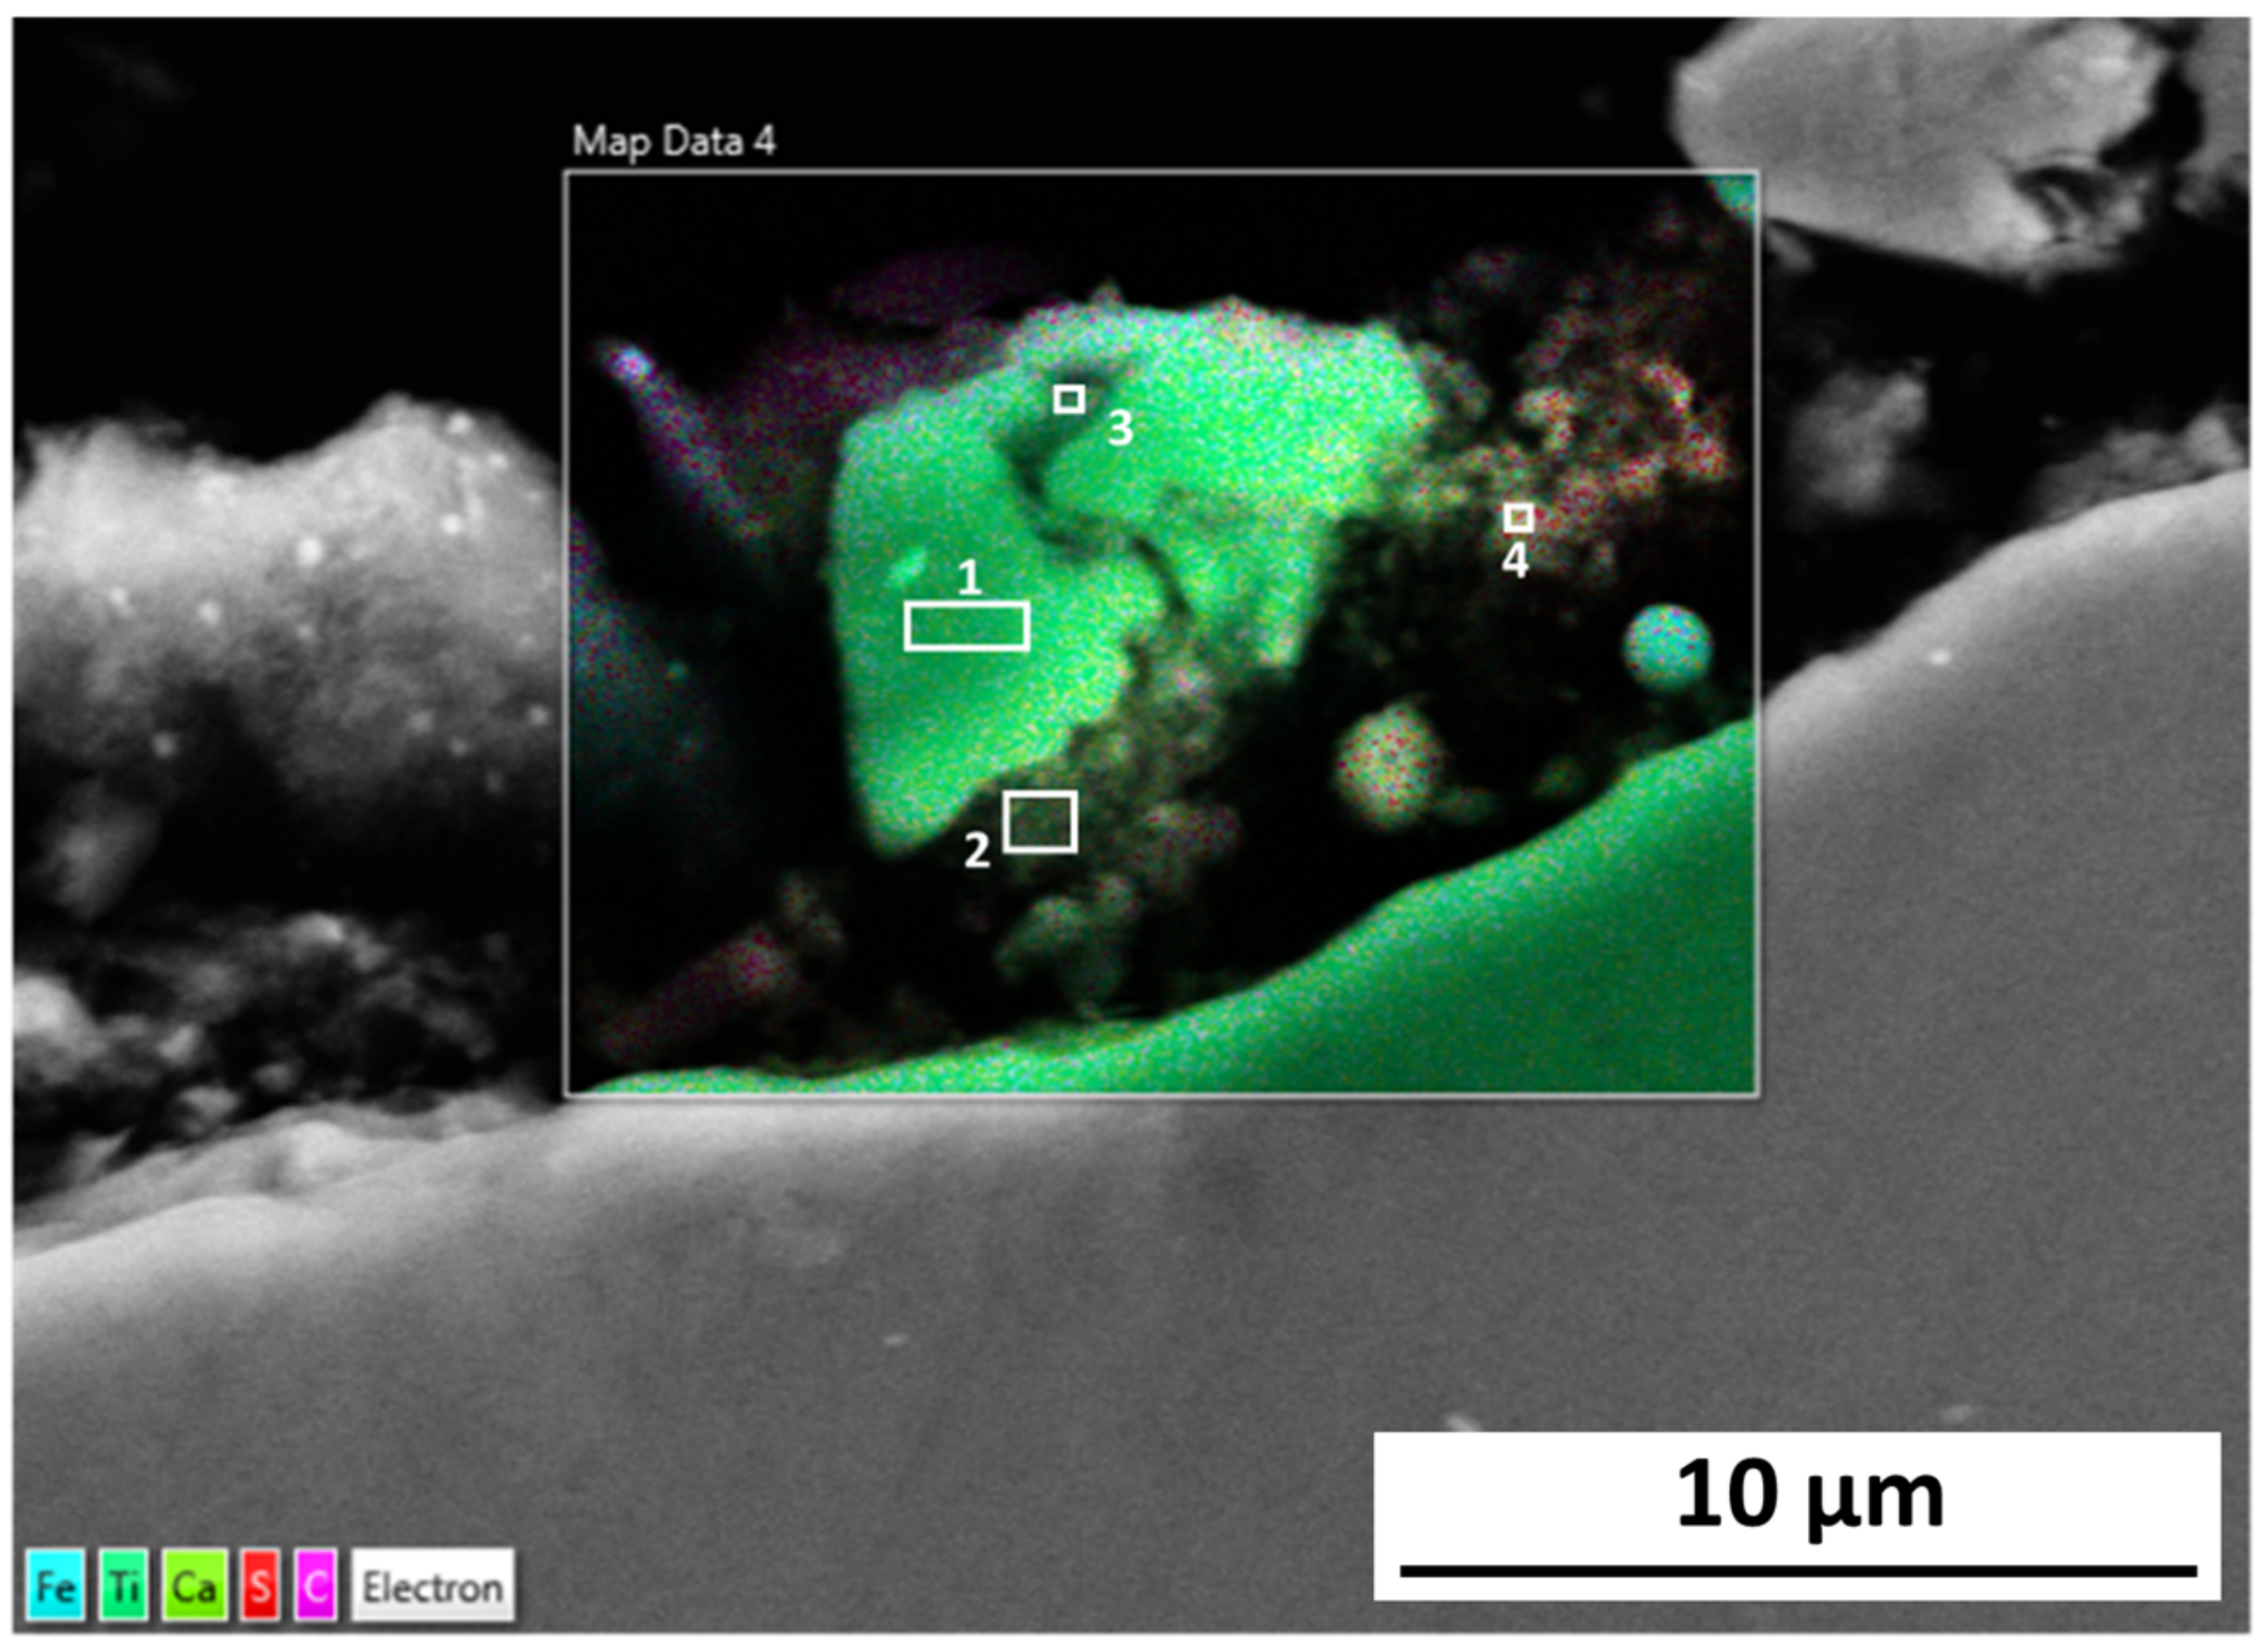
The microstructure analysis of 316L at Reykjanes showed the formation of two inhomogeneous layers where the inner layer is Cr and Mo rich, and the outer layer contains Fe segregation. The 316L tested in Chaunoy showed local corrosion of around 4 µm in diameter and 2.5 µm in depth. The 254SMO tested in both locations showed subsurface elongated cracks of approximately 100 µm and longer.
The cracks in the 254SMO tested at Reykjanes showed a Cr rich layer forming within them as well as areas where material is breaking off. Corrosion was not observed on the surface of the Inconel 625 after Reykjanes testing. After both exposures, the material showed subsurface cracking. The Ti gr. 2 samples tested both in Reykjanes and Chaunoy showed an indication of erosion. The results are both supported by topography and cross-section images.
Even though all tested materials showed defects after exposures at both locations, no defect was observed to reach deeper than 50 µm into the coupon samples. Further testing is required to accurately predict the long-term sustainability of the tested materials for usage in heat exchanger plates at the tested locations and to investigate how the different defects evolve over time.


 and
and 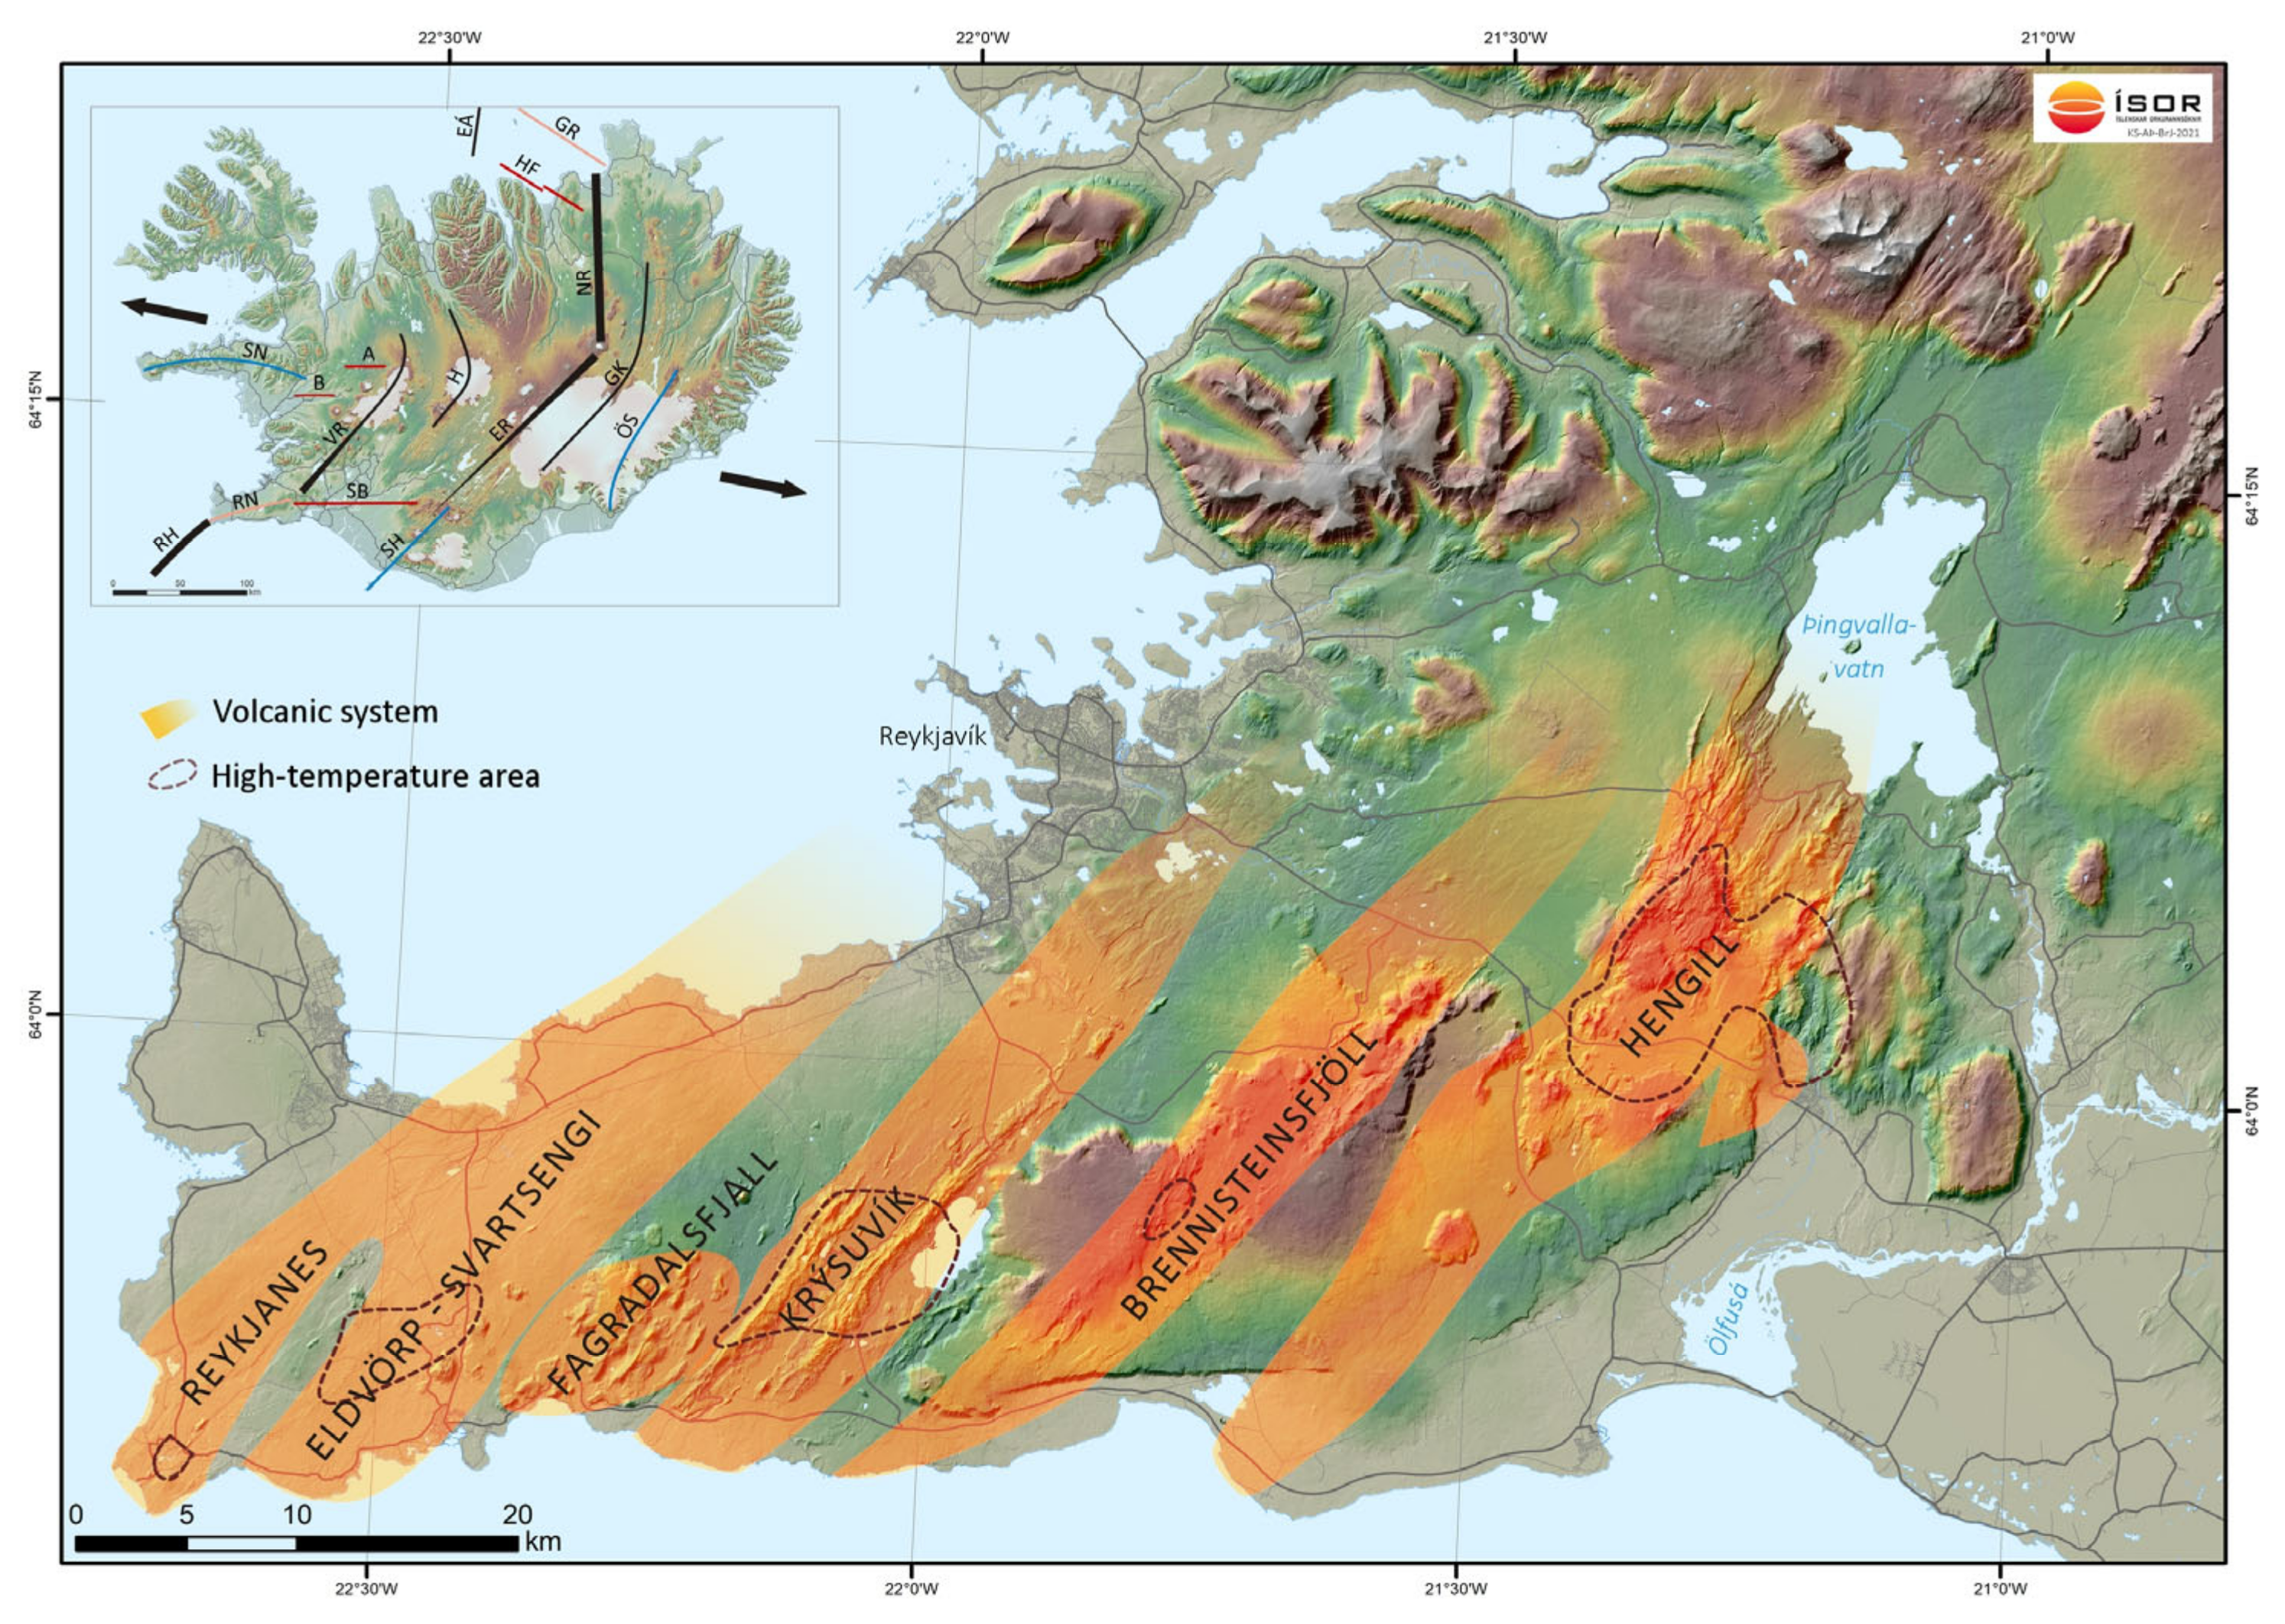


