Article

Twenty-Five Years of Geomorphological Evolution in the Gokurakudani Gully (Unzen Volcano): Topography, Subsurface Geophysics and Sediment Analysis

1
LofHazs Lab., Graduate School of Maritime Science, Kobe University, Kobe 657-8501, Japan
2
Department of Geography, Universitas Gadjah Mada, Sekip Utara, Yogyakarta 55281, Indonesia
3
Faculty of Agriculture, University of Miyazaki, Miyazaki 889-2155, Japan
4
Department of Disaster Prevention, Meteorology and Hydrology, Forestry and Forest Products Research Institute, Tsukuba 305-8687, Japan
5
Graduate School of Agricultural and Life Science, The University of Tokyo, Tokyo 113-8654, Japan
6
Division of Earth and Planetary Sciences, Graduate School of Science, Kyoto University, Kyoto 606-8501, Japan
*
Author to whom correspondence should be addressed.
Geosciences 2021, 11(11), 457; https://doi.org/10.3390/geosciences11110457
Submission received: 13 September 2021 / Revised: 29 October 2021 / Accepted: 3 November 2021 / Published: 6 November 2021
(This article belongs to the Special Issue Progress in Volcanic Geomorphology)

Abstract

:
In the aftermath of pyroclastic density current-dominated eruptions, lahars are the main geomorphic agent, but at the decadal scale, different sets of processes take place in the volcanic sediment cascade. At Unzen volcano, in the Gokurakudani gully, we investigated the geomorphologic evolution and how the topographic change and the sediment change over time is controlling this transition. For this purpose, a combination of LiDAR data, aerial photography and photogrammetry, ground penetrating radar and sediment grain size analysis was done. The results show choking zones and zones of enlargement of the gully, partly controlled by pre-eruption topography, but also by the overlapping patterns of the pyroclastic flow deposits of 1990–1995. The ground penetrating radar revealed that on top of the typical lahar structure at the bottom of the gully, side wall collapses were trapping finer sandy sediments formed in a relatively low-energy deposition environment. This shows that secondary processes are taking place in the sediment transport process, on top of lahar activity, but also that these temporary dams may be a source of sudden sediment and water release, leading to lahars. Finally, the sediments from the gully walls are being preferentially oozed out of the pyroclastic flow deposit, meaning that over longer period of time, there may be a lack of fines, increasing permeability and reducing internal pore pressure needed for lahar triggering. It also poses the important question of how much of a past event one can understand from outcrops in coarse heterometric material, as the deposit structure can remain, even after losing part of its fine material.

1. Introduction and State of the Art

Quantifying landforms by balancing erosion and uplift on mountain and volcanic slopes is a century-old quest: e.g., [1]. Although long-term evolution models have evolved to include the complexity of soil generation and slope angle-related transport [2], scientists have argued that the models would benefit from further direct measurements (e.g., at Merapi Volcano [3]), which unfortunately are often too scarce on volcanoes. Furthermore, these measurements also need to be extended over long periods of time to account for the variability in the sediment cascade at the decadal scale (e.g., at Unzen Volcano [4]) and at the Holocene- and Quaternary-scale period. Although there is a large body of research on syn- and post-eruptive research as well as long-term (Holocene, Quaternary and older period) research, work at the decadal scale is still in need of attention, including at Unzen Volcano, the location of the present research [4].
At Unzen Volcano (Japan), despite a large amount of unconsolidated material remaining on the apron of the volcano, the frequency of lahars and other forms of gully erosion has decreased dramatically in recent years [4], with a change in the relation between eroded material and rainfall intensity and duration, as well as a change in the watershed geometric configurations [4]. Tsunetaka et al. [4] investigated the role of the geomorphology and the rainfall on the erosion, and in the present contribution, the goal is to qualify and quantify the role of material composition change over time and the role of the sedimentary structure on the geomorphologic evolution of the Gokurakudani Gully, and so at the decadal scale after the eruption.

1.1. Syn-Eruptive to Decadal-Scale Erosion on Volcanoes

On stratovolcanoes, sediment fluxes increase sharply in the aftermath of eruptions. At Merapi Volcano (Indonesia), out of all the 851 lahars produced during the 44 years of existing records, 11.2%, 9.2% and 15.2% occurred immediately after respectively the eruptions of 1969, 1975 and 2011 [5]. For the millennial eruption of 2010, 0.03 to 0.06 km3 pyroclastic flow deposits were generated [6], resulting in more than 250 lahars in the Kali-Putih valley alone, in less than half a year [5]. In the month after the eruption stopped, more than 50 lahars were counted in the Kali-Putih valley, around 25 in the Kali Boyong valley and 25 in the Kali-Gendol valley [7]. At Mount Pinatubo, an approximated 6 km3 of loose volcanic sediments mantled the volcanic slopes due to the 1991 eruption [8], and 450 lahars were reported for the Pasig and Sacobia catchments—two of the eight catchments impacted by the eruption—between 1991 and 1997 [9]. At Mount St. Helens, an approximated 2.3 km3 of pyroclastic material was deposited in the upper Toutle River in 1980, feeding syn-eruptive lahars that transported about 140 × 106 Mg (megagrams) of sediment in 1980 alone [10].
The syn-eruptive and immediately post-eruptive sediment flux decreases over time. In the aftermath of the 1984 eruption at Merapi Volcano, the number of lahars per year reduced from 35 in 1985–1986, to 27 in 1986–1987, to 29 in 1987–1988 and to 0 in 1988–1990 in the Kali Putih [11]. At Mt. St. Helens, the recorded sediment fluxes in different valleys ranged from 1 to 100 Mg/km2/year (mass per catchment surface per unit time) in 1980, and they reduced to only 0.2 to 0.3 Mg/km2/year in 1994 [12].
In controlling the flux, both rainfall and the sediment availability play a crucial role. At Merapi Volcano, the largest number of monthly lahars was triggered just after the 2010 eruption, with 50 to 60 lahars for a month when the cumulated rainfall events were 1500 mm to 2000 mm, while the highest rainfall in the subsequent months (>3000 mm) triggered fewer lahars: 40–50 per month [7]. The timing of the rainfall and the availability of removable material is therefore crucial. This pattern could also be observed at Mt. Pinatubo, where broadband seismometers show an increase in high sediment concentration events between 1991 to 1994, corresponding to increased-intensity rainfalls over the years. However, from 1994 to the end of 1997 the number of debris flows and hyperconcentrated flows decrease every year, leaving space for lower-density flows, regardless of the rainfall intensity. At Mt. St. Helens, because the period 1980–1994 was relatively dry, the decreasing trend in sediment fluxes in the first 14 years after the volcanic collapse suddenly ramped up in 1995–1996, starting a new decreasing trend [11].
From these events, it appears that at the decade and multi-decade scale, the sediment fluxes mostly carried by lahars are first controlled by the amount of material available, before being then controlled more predominantly by rainfall trends. Despite a relatively rapid (considering the life of a volcanic structure) decrease in lahar frequency, their deposits dominate the material volcanic aprons are made of [8,13,14].

1.2. Quaternary-Scale Erosion Rates on Volcanoes

At the Quaternary scale it becomes more difficult to identify the influence of one process over another, but for stratovolcanoes, mechanical erosion is the main driver compared to shield and island volcanoes where chemical weathering dominates the erosion process—e.g., 49 to 306 t/km2/year from river transport and 113 to 1382 t/km2/year as dissolved material in groundwater, at Mayotte French Volcanic Island [15]. At the stratovolcanoes Cayambe, Cubilche, Cushnirumi, Cusin, FuyaFuya, Imbabura and Mojanda, on the Ecuadorian Arc, the estimated erosion rates from isotopic analysis are respectively 0.02, 0.02, 0.12, 0.02, 0.1 and 0.14 km3/1000 years, using calculations over the periods of 30,000 years to 1,050,000 years [16]. These rates are in line with erosion rates provided in other studies, such as 0.2 km3/year at the Tungurahua volcano and the Huisla volcano [16], and at the Cayambe volcano [17]. On top of the geochemical approach, scientists have used high-resolution topography to measure erosion, following the movement of knickpoints at waterfalls for instance. In this way, Hayakawa et al. [18] measured recession rates of 0.013 to 0.068 m/year at 11 waterfalls located in the Aso volcanic structure (Japan), and 0.08 to 0.15 m/year at Shomyo falls, cut into ignimbrites [19]. These calculations and measures are to be taken carefully, because they encompass climate and landcover change, etc. For instance, at Terceira Island in the Azores, the change from pasture to bare soil has shown a threefold increase of soils erosion based on measurements from 1996 to 1998 [20], showing that minute changes can have important impact on long-term erosion rates of volcanoes. Furthermore, the breath of processes occurring at different timescales after an eruption, makes the interpretation of these calculations even more arduous.
Between the first syn- and immediately post-eruptive scale and Quaternary scales, there is thus a relative knowledge gap at the tens to hundreds of years scale.

1.3. Lahar: The Major Observed—Agent of Change

From field surveys and event observations, lahars appear to be an important terragenic driver of stratovolcanoes. Since its first use in the scientific literature—almost 100 years ago for a mudflow in Alaska [21]—lahar research has flourished, especially due to its imperatives for associated hazards and disaster risk. In the scientific literature, a lahar has been defined as an Indonesian term most commonly defined as a rapidly flowing, gravity-driven mixture of rock, debris and water from a volcano [22,23,24].
Large events will typically have several flow peaks and phase changes [25], and the lahar will also vary with time and distance downstream (dilution, tributary intakes and material deposition). The lahar may comprise one or more flow types, which include debris flow, transitional or hyperconcentrated flow and muddy streamflow or flood flow [26], all differentiated based on the sediment concentration [27]. Typically, the debris flow phase has a sediment concentration (SC) of 60% of volume or 80% of mass [28], and the hyperconcentrated flow phase has a SC between 20 and 60% of volume or 40–80% of the mass [24,29]. As the lahar often dilutes in hyperconcentrated flow and eventually streamflow [30], the deposited material at a given site only represents a portion of the originally mobilized material, which makes it often haphazard to survey post event, notably using traditional outcrop analysis [31].
Because of the wide range of environments where lahar can occur [32], and because lahars can happen during the timespan of an eruption and up to several decades after it has stopped (e.g., hot and cold lahars [33]), the processes affecting lahar triggering are assumed to vary with the environment and with the local geological and geomorphologic setting. Notably, the proportion of fines delimitates cohesive and non-cohesive lahars. Non-cohesive lahars are most common when Dacitic (e.g., Unzen Volcano in Japan, with poor grain size distribution in clay size material [34]) and Andesitic material (e.g., Merapi and Semeru in Indonesia) are present. Such lahars usually originate from dome collapse pyroclastic flows and other forms of pyroclastic flow material, where the number of fines is relatively limited. On the contrary, the development of cohesive lahars requires a larger amount of clay, which can be produced via hydrothermal eruptions [35] or from flank-collapse debris avalanche deposits for instance [27]. Further variability in lahar and the related deposits appear over time, especially when the timespan from an eruption increases [36]. As the progressive sediment depletion after an eruption modifies the relation between rainfall and lahar triggering, and as the geometry of valleys changes [37], so are the erosion rates and processes (e.g., at Merapi and Semeru Volcano [14]). Long-term monitoring is therefore essential to grasp the variability in lahars over time and their interplay with the valley geomorphology [37].

1.4. From Pyroclastic Density Currents’ Deposits to Lahar Deposits

Consequently, sediment flux and lahar research are often the link between pyroclastic flow deposits and their transformation into lahar deposits, with the finer portion of the material being exported further downstream, generating other forms of deposits. Furthermore, the irregular nature of those events often requires scientists to work from the deposits, where pyroclastic flow deposits mingle with lahar and other deposits generated by the remobilization of the original material.
Pyroclastic density current deposits (PDCD) typically display tongue-shaped topography with a front lobe, and they are often trapped in the valleys, while surge deposits are a thinner deposit spreading around it. The internal structure of PDCDs is typically made of sets of bedded layers with or without grain-size gradients within the layers [38,39,40]. From their remobilization, lahar deposits are typically clasts rich and supported by a sandy to gravelly matrix with sets of crude horizontal layers [41], which alternate with foresets and backsets depending on the valley configuration [42]. Local variations exist along the valley gradient and at the sub-meter scale [31]. Those intricacies have been related to multiple peak flows and eventually complex deposition patterns during single events [25]. Over several years to decadal scales, the topography of lahar deposits and the gullies they shape experience a complex evolution with an alternation of erosion and deposition, notably under the influence of ravine wall collapses [37]. The work of Vasquez et al. [37] in the Montegrande ravine of Volcan de Colima shows that after a single event, erosion can occur in portions of the channel, while wall collapses and floor filling can temporarily raise the valley floor by more than 2 m in other portions of the channel. In detail, it is therefore not erosion or depositional processes, it is a mix of the two, with dominant trends at a broader scale. As the floor slope of the ravine tends toward a general equilibrium slope, upstream sections can still be dominated by erosion (8 to 10 degree slopes) while the lower slopes (2 to 4 degrees) are more prone to deposition. At Unzen Volcano, it is this type of PFD-dominated environment from which lahars are emerging.

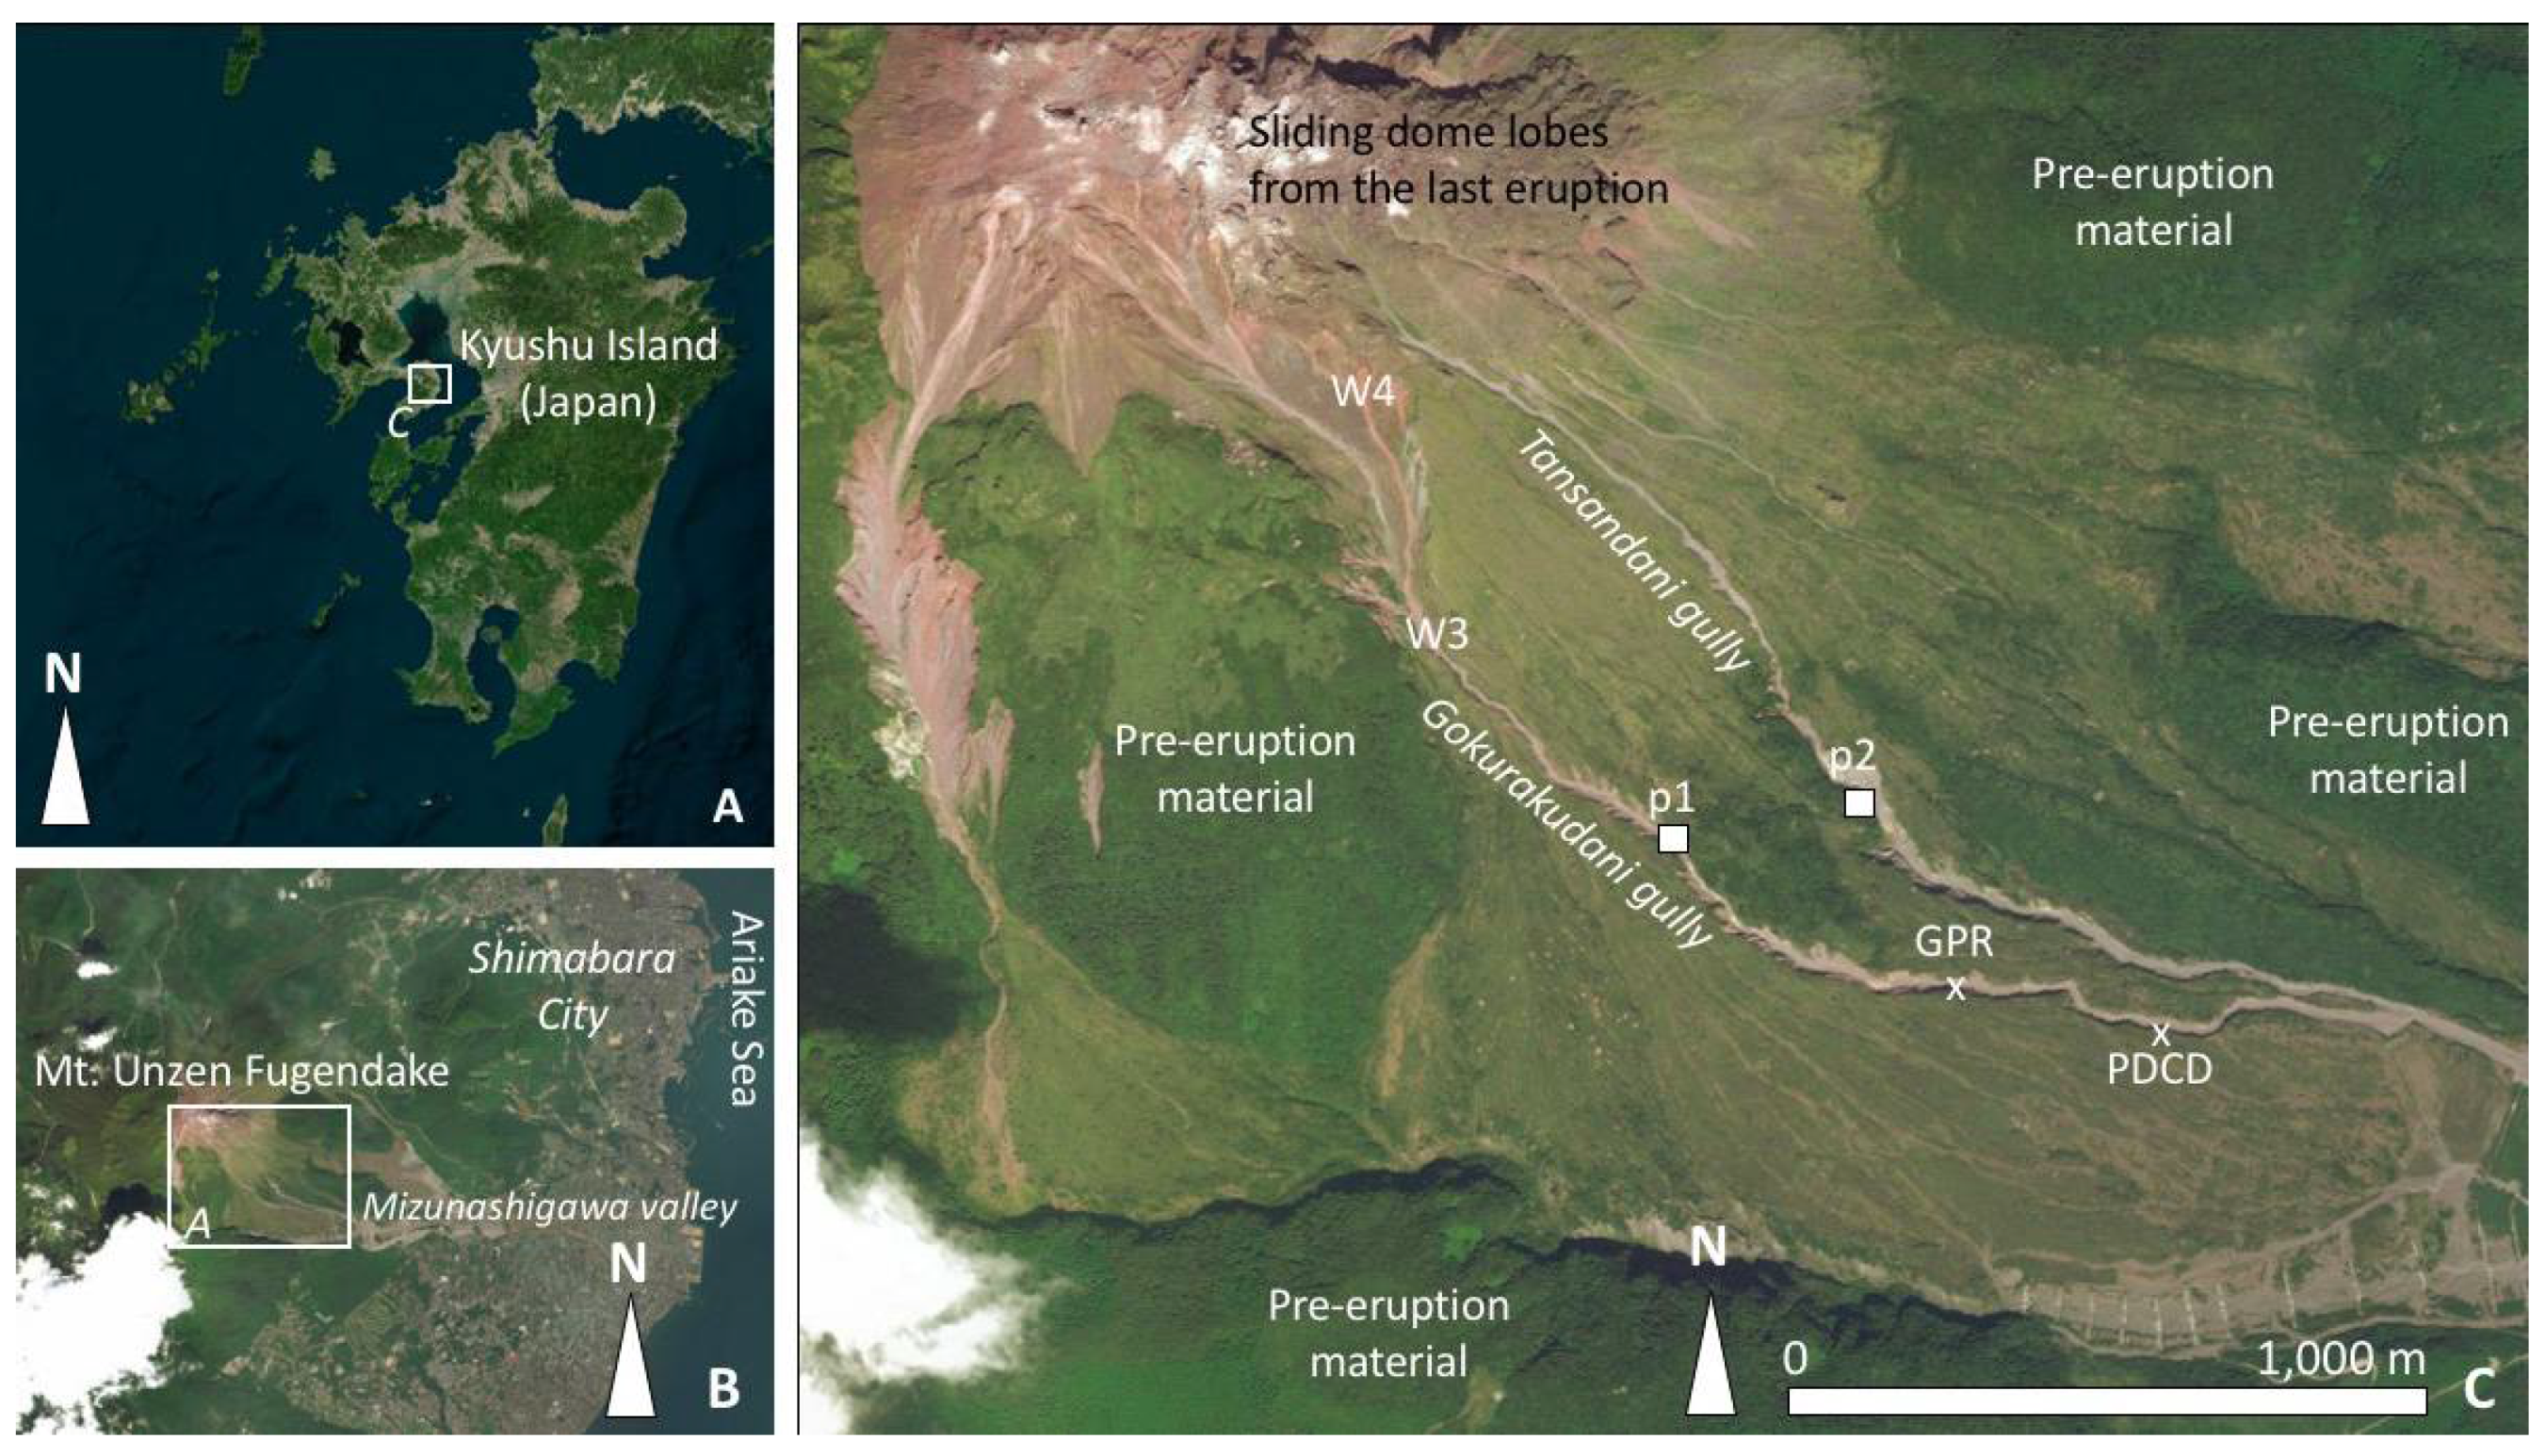
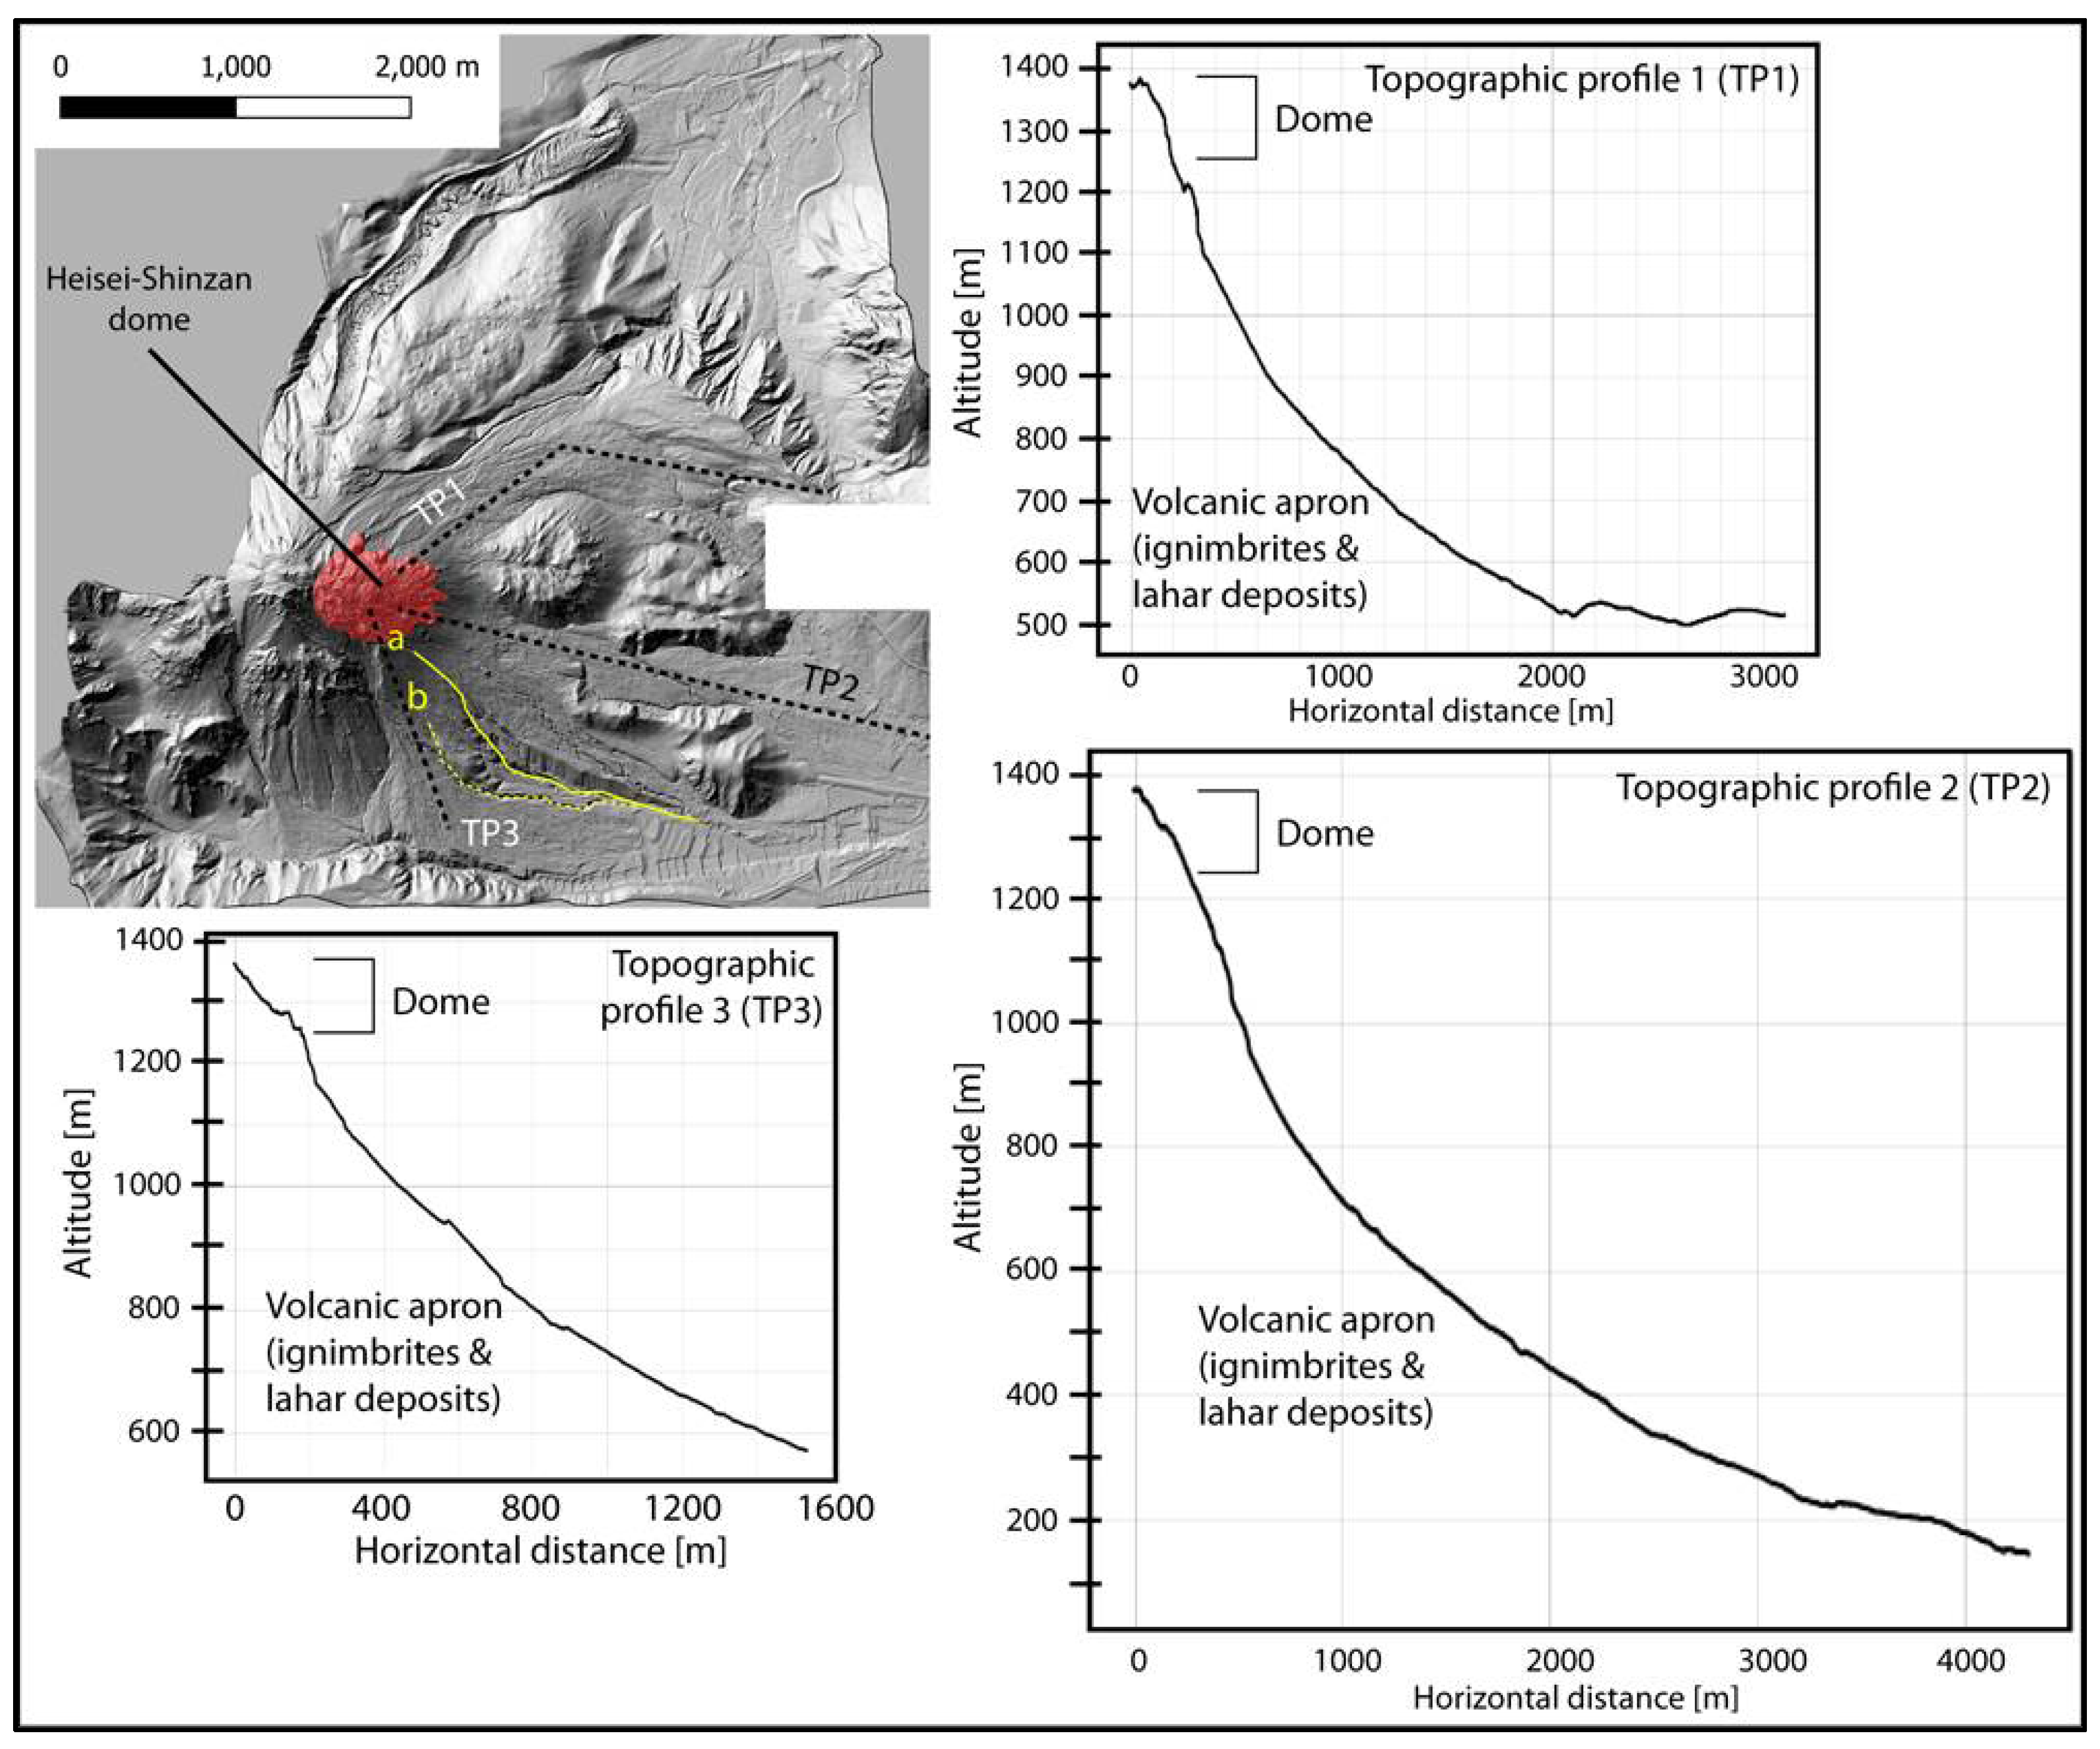
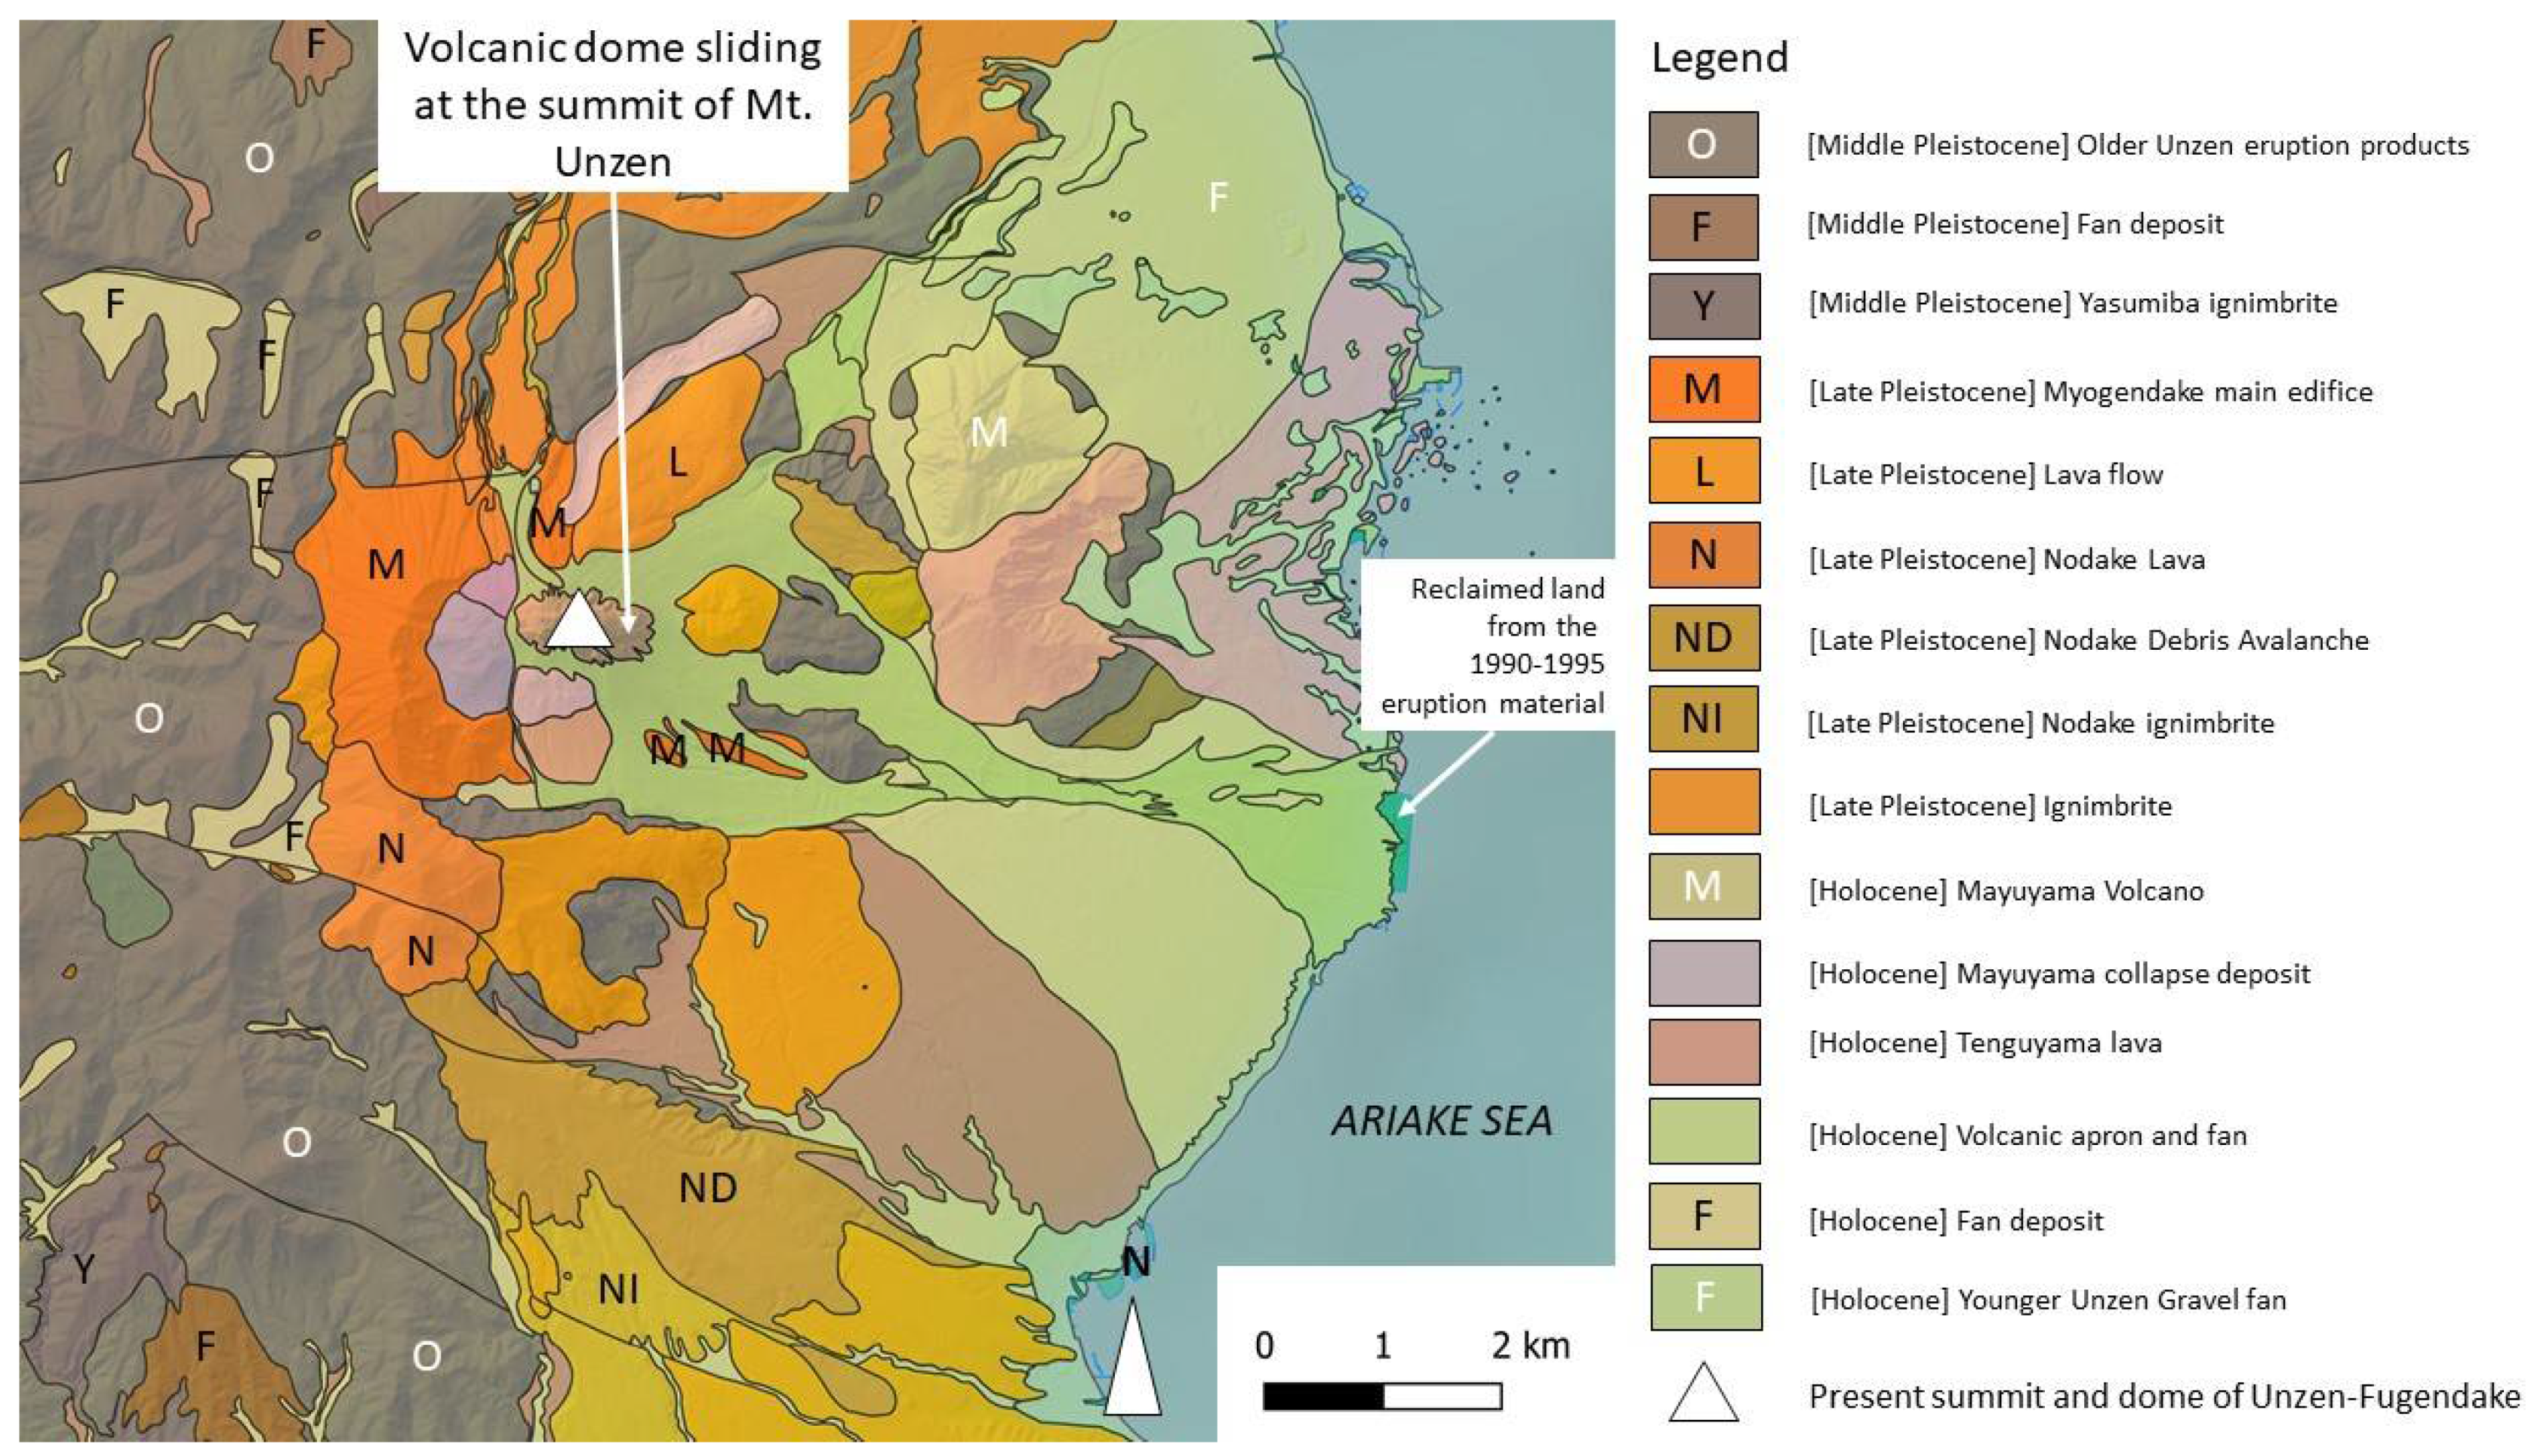
1.5. Topographic and Geological Setting

The Unzen volcano is located on the peninsula of Shimabara, on the Island of Kyushu (South Japan), and the actual summit is at 1486 m asl (Figure 1 and Figure 2). The basement rock of the volcano is Paleogene to middle Pleistocene sedimentary sequences. Japanese scientists have recognized two phases in the edifice construction: the Older Unzen volcano between 500 kBP and 100 kBP and, after 100 kBP, the Younger Unzen volcano. During the last period, four volcanic structures have topographically emerged: the Mayuyama volcano (Figure 3), the Nodake volcano (Figure 3), the Myokendake volcano and the Fugendake volcano (Figure 3).

1.6. The Unzen Volcano and the 1990–1995 Eruption

After a period of 198 years of dormancy, its eruption began in November 1990 and became infamous after taking the lives of 44 victims including French and American scientists and Japanese mass media professionals in June 1991. The eruption lasted until 1995. The eruptive sequence started with a swarm of earthquakes in November 1989. The first tremor underneath the summit was then recorded in July 1990. The eruption officially ended in February 1995 with the halt of the effusion and a slow caving of the dome [44]. The eruption resulted in a series of dome growth, fracturation and subsequent gravity collapse, sweeping mostly over the slopes located on the east side towards the Mizunashigawa valley basin. However, during the latest stage of the eruption, pyroclastic density currents also flowed northbound. On the southern flank, the pyroclastic flow deposits filled the valley with material >50 m thick [45], greatly modifying the pre-eruption topography and by then the subsurface hydrological mechanisms and processes. From the PDCDs (probably mixed with other secondary deposits), lahars have been generated, sweeping the flanks of the volcano, with the majority occurring in the the Mizunashigawa valley at first and in recent years in the smaller-scale gullies of the Gokurakudani and the Tansandani [4], where the lahars have been scouring the 1990–1995 eruption material down to the pre-eruption material [46,47,48].

2. Methodology

To reach the objective, the research combines
(1)
fieldwork,
(2)
laboratory analysis of the samples and collected empirical data and,
(3)
geophysical exploration based on ground penetrating radar (GPR).

2.1. Imagery and Topographic Data

2.1.1. Data Acquisition

The topographic data used in the present research are LiDAR (light detection and ranging) data for the years 2004 to 2016, completed with UAV-based data using a DJI Mavic Pro UAV (DJI, Shenzhen, China) for the years 2017 and 2018. The UAV-based DEM was only used to rectify aerial imagery in the present work. The LiDAR data was commissioned by the Unzen Restoration Work Office directed by the Ministry of Land, Infrastructure, Transport and Tourism, while the UAV data were collected by the authors. Details on the dataset for both the UAV and the LiDAR can be found in Tsunetaka et al. [4].

2.1.2. UAV Data Processing

Structure from motion (SfM) is the photogrammetric method used with the UAV and the implementation was performed using Agisoft PhotoscanPro® software, from which the sparse point cloud, dense point cloud, the meshed surface, the DEM and the orthophotographs were successively generated following methods described in the literature [49,50,51] and used previously in various volcanic and non-volcanic settings by the authors [45]. To calibrate and scale the DEMs, eight targets in the valleys were measured using GNSS PPK with a Trimble GeoExplorer (Geo-7X, Trimble, Sunnyvale, CA, USA) hooked to an external antenna. To ensure the best data generation, tie points were added through a trial-and-error approach. For further details on the data please see Tsunetaka et al. [4].

2.1.3. GIS Analysis

Planform analysis—From aerial orthophotographs of the years 2005, 2006, 2015 and 2016, a total of 50 gully sections of 30 m length were digitized and calculated in UTM 52, using the open-source GIS environment QGIS. Each section was digitized using polygon-shapefiles and the limits of each cross section were kept constant for the 4 different years, so that for a specific section, widening or size reduction could be retrieved. The planform analysis is thus providing a dataset of the planform stability/instability of the gully.
Topographic analysis—Imagery and topographic data was incorporated in the QGIS environment in UTM 52. The raster dataset was sampled using vector files (shapefiles). A set of 116 cross sections was acquired along the Gokurakudani gully with a sampling interval of 10 m.
On each cross section, 100 points were acquired from the LiDAR data of 2005, 2015 and 2016, creating a dataset of 348,000 points to compare at 116,000 locations along the gully (data available upon reasonable request). The data of each cross section was used to calculate the cross-sectional area, in order to detect vertical and horizontal adjustments in the geometry of the gully using the following formula for each cross section:
A = i = 1 n 1 ( Z m a x Z i )   d i d i + 1
where A is the cross section area, n is the number of sampling points along the cross section, i is the iterator over n, di is the distance from the first point of the cross section to the ith point, and the subscript i + 1 is the iteration to the next point; Zmax is the maximum altitude at one of the n points on a given transect, and Zi is the averaged altitude given by:
Z i = i n 1 Z i + Z i + 1 2
The calculation was made in the R language, using the shapefile id (each transect has a distinct id number) to run the above calculations on each transect separately.

2.2. Characterization of the Gully Floor and the Walls’ Material

After characterizing the change and rates of change in the gullies, it is then important to understand the role of the material and its structure (next section). In Tsunetaka et al. [4], the questions of rainfall and modifications of the geometry of the catchment have been examined, and to complement this research, the authors look at how the material change may also influence the evolution of the gullies. Indeed, as erosion occurs, the different size fractions travel at differential speed, creating a natural horizontal sieving between the walls (dominated by PFDs), the floor of the gully and its exit. A total of 18 samples were collected from the floor of the valley with a shovel or from the walls. For the walls, the outcrop was refreshed to remove potential contamination from falling material, except in the case of the acquisition of the wall drape (see the results for explanation), composed of the fine fraction that had oozed out of the wall. The sediments were sealed and double bagged in 800 mL plastic bags.

Dry Sieving and Grain Size Analysis

At the laboratory, each sample was weighed, and then the organic debris were floated out of the sediments using water washing and drying. The amount of organic debris found was close to none in most samples, if not for a few leaves and branch bark trapped in the gully floor samples. Their amount was judged negligible. After drying the remaining sediments in a dish on a hot plate at 60 degrees, the samples were dry-sieved, and the size distribution was measured per mass for a column of 8 mesh sizes (8 mm, 4 mm, 2 mm, 1 mm, 0.5 mm, 0.25 mm, 0.125 mm, 0.0625 mm, <0.0625 mm). The grain size distribution was calculated and so was the grain sorting using the grain size variation using [52] inclusive standard deviation:
σ 1 = ϕ 84 ϕ 16 4 + ϕ 95 ϕ 15 6.6   [ ϕ ]
Finally, the kurtosis, or measure of the strength of the peak was derived as:
k = ϕ 95 ϕ 5 2.44 ( ϕ 75 ϕ 25 )   [ ϕ ]

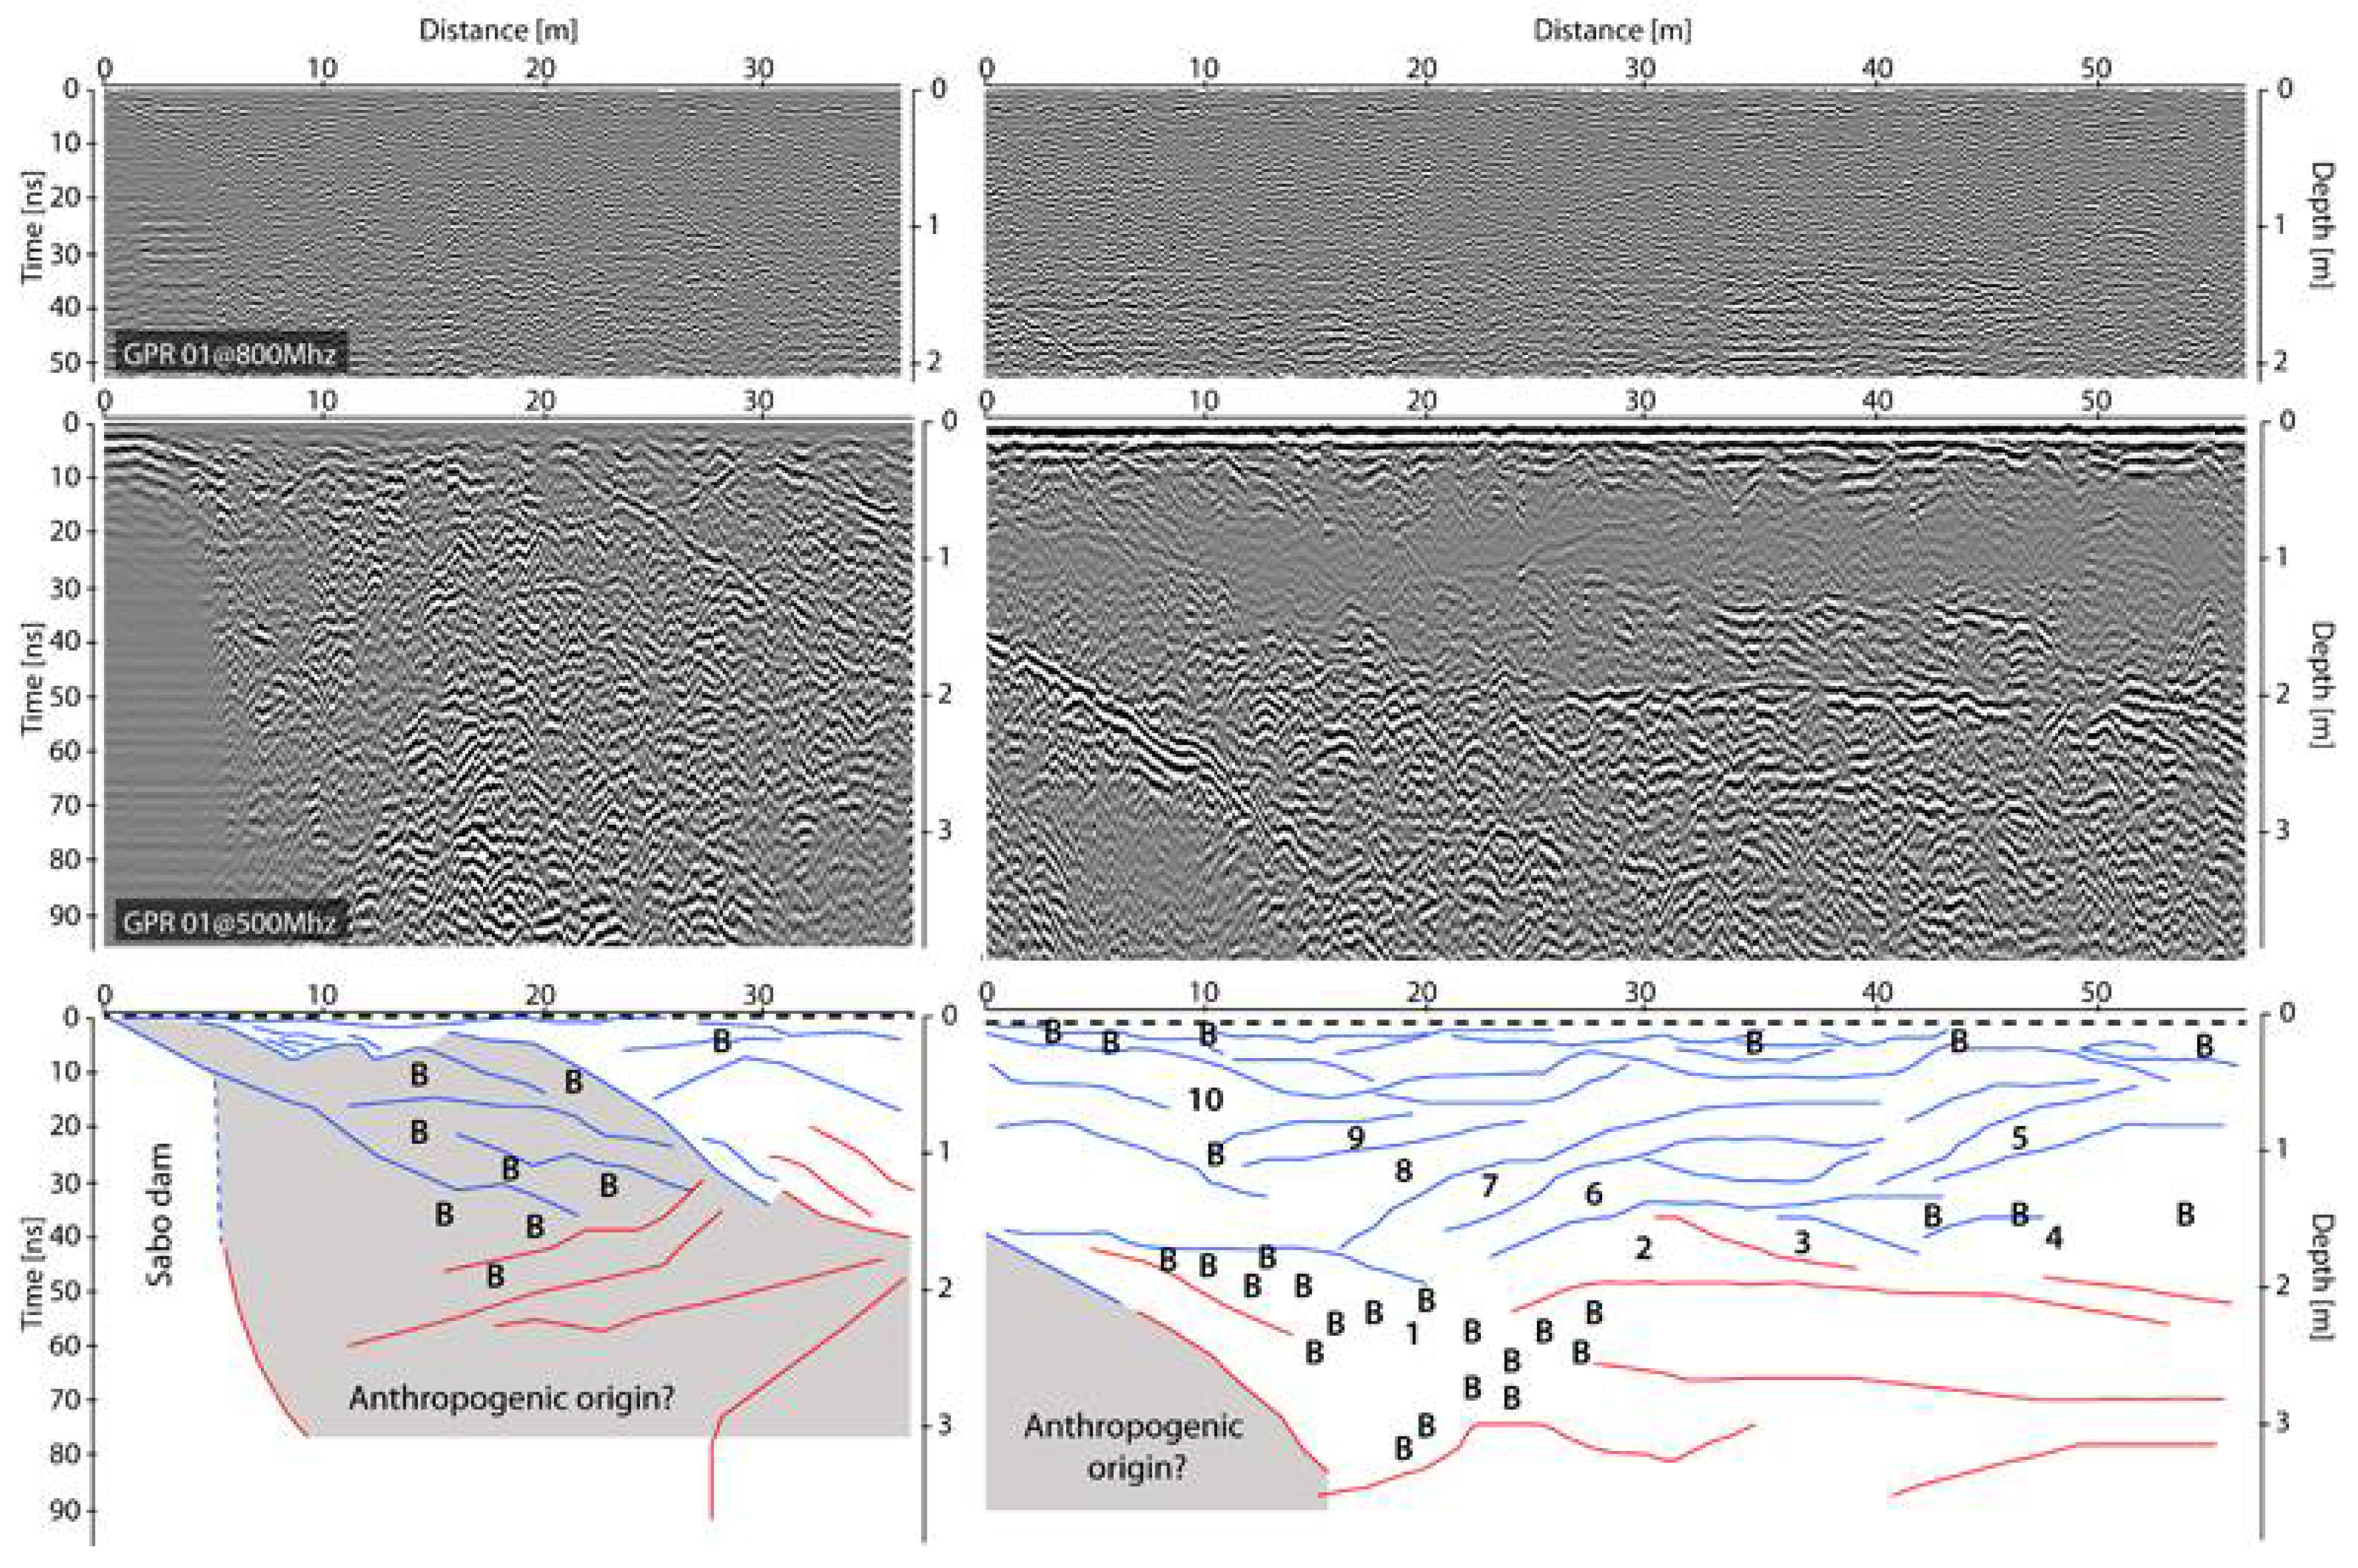
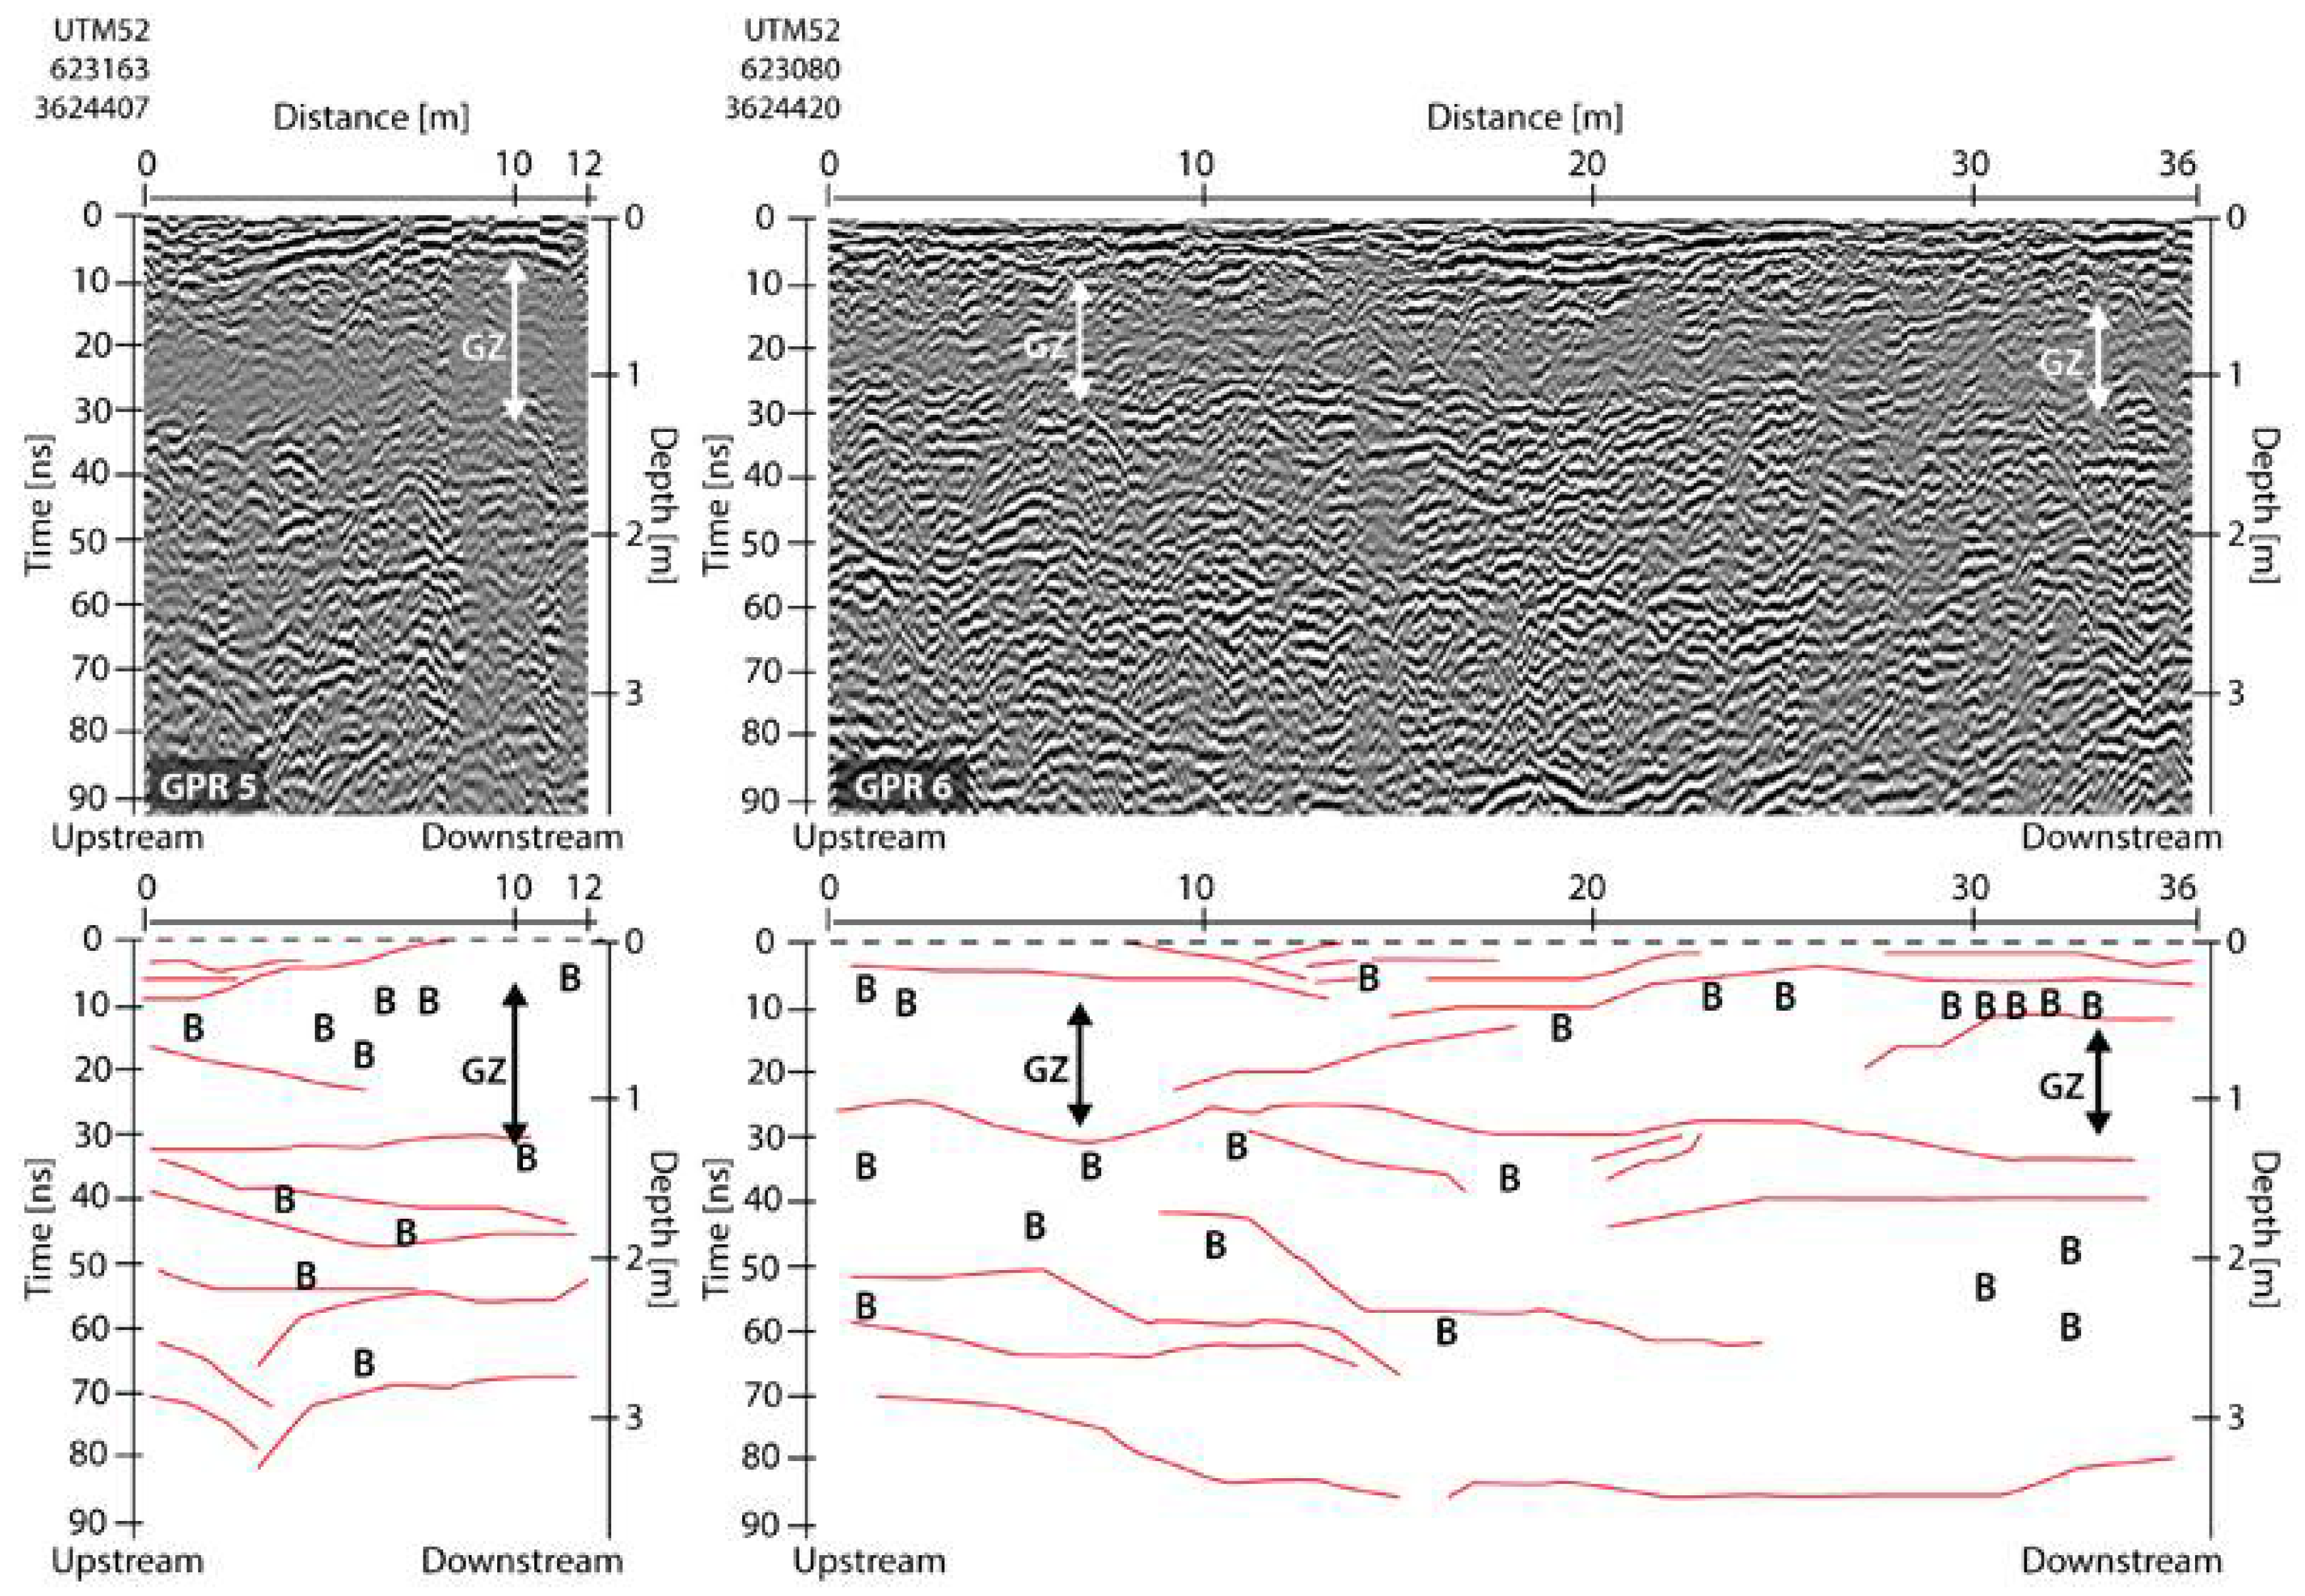
2.3. Subsurface Geophysical Data Using Ground Penetrating Radar (GPR)

To complete the material characterization, the gully floor subsurface was imaged with ground penetrating radar (GPR). GPR was used in order to investigate the internal structure and find the presence (or not) of bedrock that may not be visible from the surface following the methods used on PDCDs [39,40] and lahar deposits [31,42,44]. The method was also aimed at better understanding the evolution of the gullies: if the channel is going through a purely erosive phase, one is expected to find solely PDCDs or the pre-eruptive material; however, if a mix of lahar deposits, wall collapse material, etc. is present, it shows a non-linear evolution. This is essential, because even yearly topographic surveys are blind to topographic variations that occur at the minute to hour scale.

2.3.1. The GPR Method

Subsurface data was gathered using GPR from the floor of the gully. GPR is a geophysical technique based on the emission and reception of electromagnetic waves through the ground. As the wave travels in the substratum and encounters irregularities, part of the energy is refracted and recorded by the receiving antenna [53]. Electromagnetic waves travel at the speed of light in a vacuum and decrease in substratum, mostly as a function of the electricity resistivity (ξr) and the relative magnetic permeability (µr), so that for a wave travelling back and forth from the emitting antenna (Et) and a punctual object or a layer (O), the time (t) can be calculated using the slope of diffraction hyperbola as:
E t O = ( x 2 + h 2 ) 1 2
t = 2 ( x 2 + h 2 ) 1 2 V 1
where x is the horizontal distance and h is the vertical distance underneath the antenna, and V1 is the velocity until the object that creates the hyperbola; and because the velocity (V) can also be estimated to be:
V = c [ ( μ r ξ r ) 1 2 ]
where c is the speed of light (considered to be a constant in a vacuum), information on the material invisible at the surface can be inferred. This calculation is made using the relation of electric resistivity and velocity between layers using the reflection coefficient Rc:
R c = ( ξ 2 1 2 ξ 1 1 2 ) ( ξ 2 1 2 + ξ 1 1 2 ) = V 2 V 1 V 2 + V 1
where the indices ‘1’ and ‘2’ indicate two different layers of contrasting dielectric properties.

2.3.2. Field Data Acquisition with the Mala-ProEx GPR

The GPR data acquisition was performed at two locations, one along a set of transects of ~140 m at the downstream end of the Gokurakudani gully using a 500 MhZ and a 800 MhZ antenna (centered on UTM 52 623163/3624407) and upstream in a reach of the Gokurakudani gully, where material had accumulated UTM 52 623353/3624242, and from which 4 GPR transects were collected: one along the gully direction and three perpendicularly across (cf. Figure 1 with the locations).
For the present study, the GPR is a Ramac® Pro-Ex (Mala GeoScience, Mala, Sweden) mounted with shielded antennas 500 MhZ and 800 MhZ. The distance was measured using a calibrated coding wheel and a measuring tape to confirm the wheel’s data, as well as a hand-held GNSS to mark the track position in the Gokurakudani gully. The data used in the present research follows semi-horizontal topographies for which no complex topography inversion was necessary (cf. Figure 1 for location).

2.3.3. GPR Data Processing

The data produced by the Mala system are .RDS and .RD3 binary files that were converted into ascii data using ReflexW (Sandmeier Software, Karlsruhe, Germany). The processing steps used in the present contribution are standard for GPR [41]:
-
Static time correction to remove the signal time before entry into the ground;
-
DEWOW filtering (low-cut filter) to remove the air-ground reflection (this step was removed from one of the transects as it was erasing some of the data associated with the removed signal);
-
AGC gain amplification with a 40 ns window and a 1.12 multiplier;
-
Removal of the background noise with an average moving window every 100 traces;
-
Energy propagation loss compensation using an energy decay multiplier of 1.44;
-
Measure of the velocity through the ground. As the common mid-point method is not possible with the shielded antenna [42], the authors used the slopes of the hyperbola curves to calculate the velocity profiles;
-
Finally, the velocities are then converted into depths using the calculated velocities. Because the data were acquired on semi-horizontal surfaces, no topographic data migration was necessary.
The method therefore combines imagery with topographic analysis with sediment grain size characterization and GPR-based sediment architecture measurements.

3. Results and Interpretations

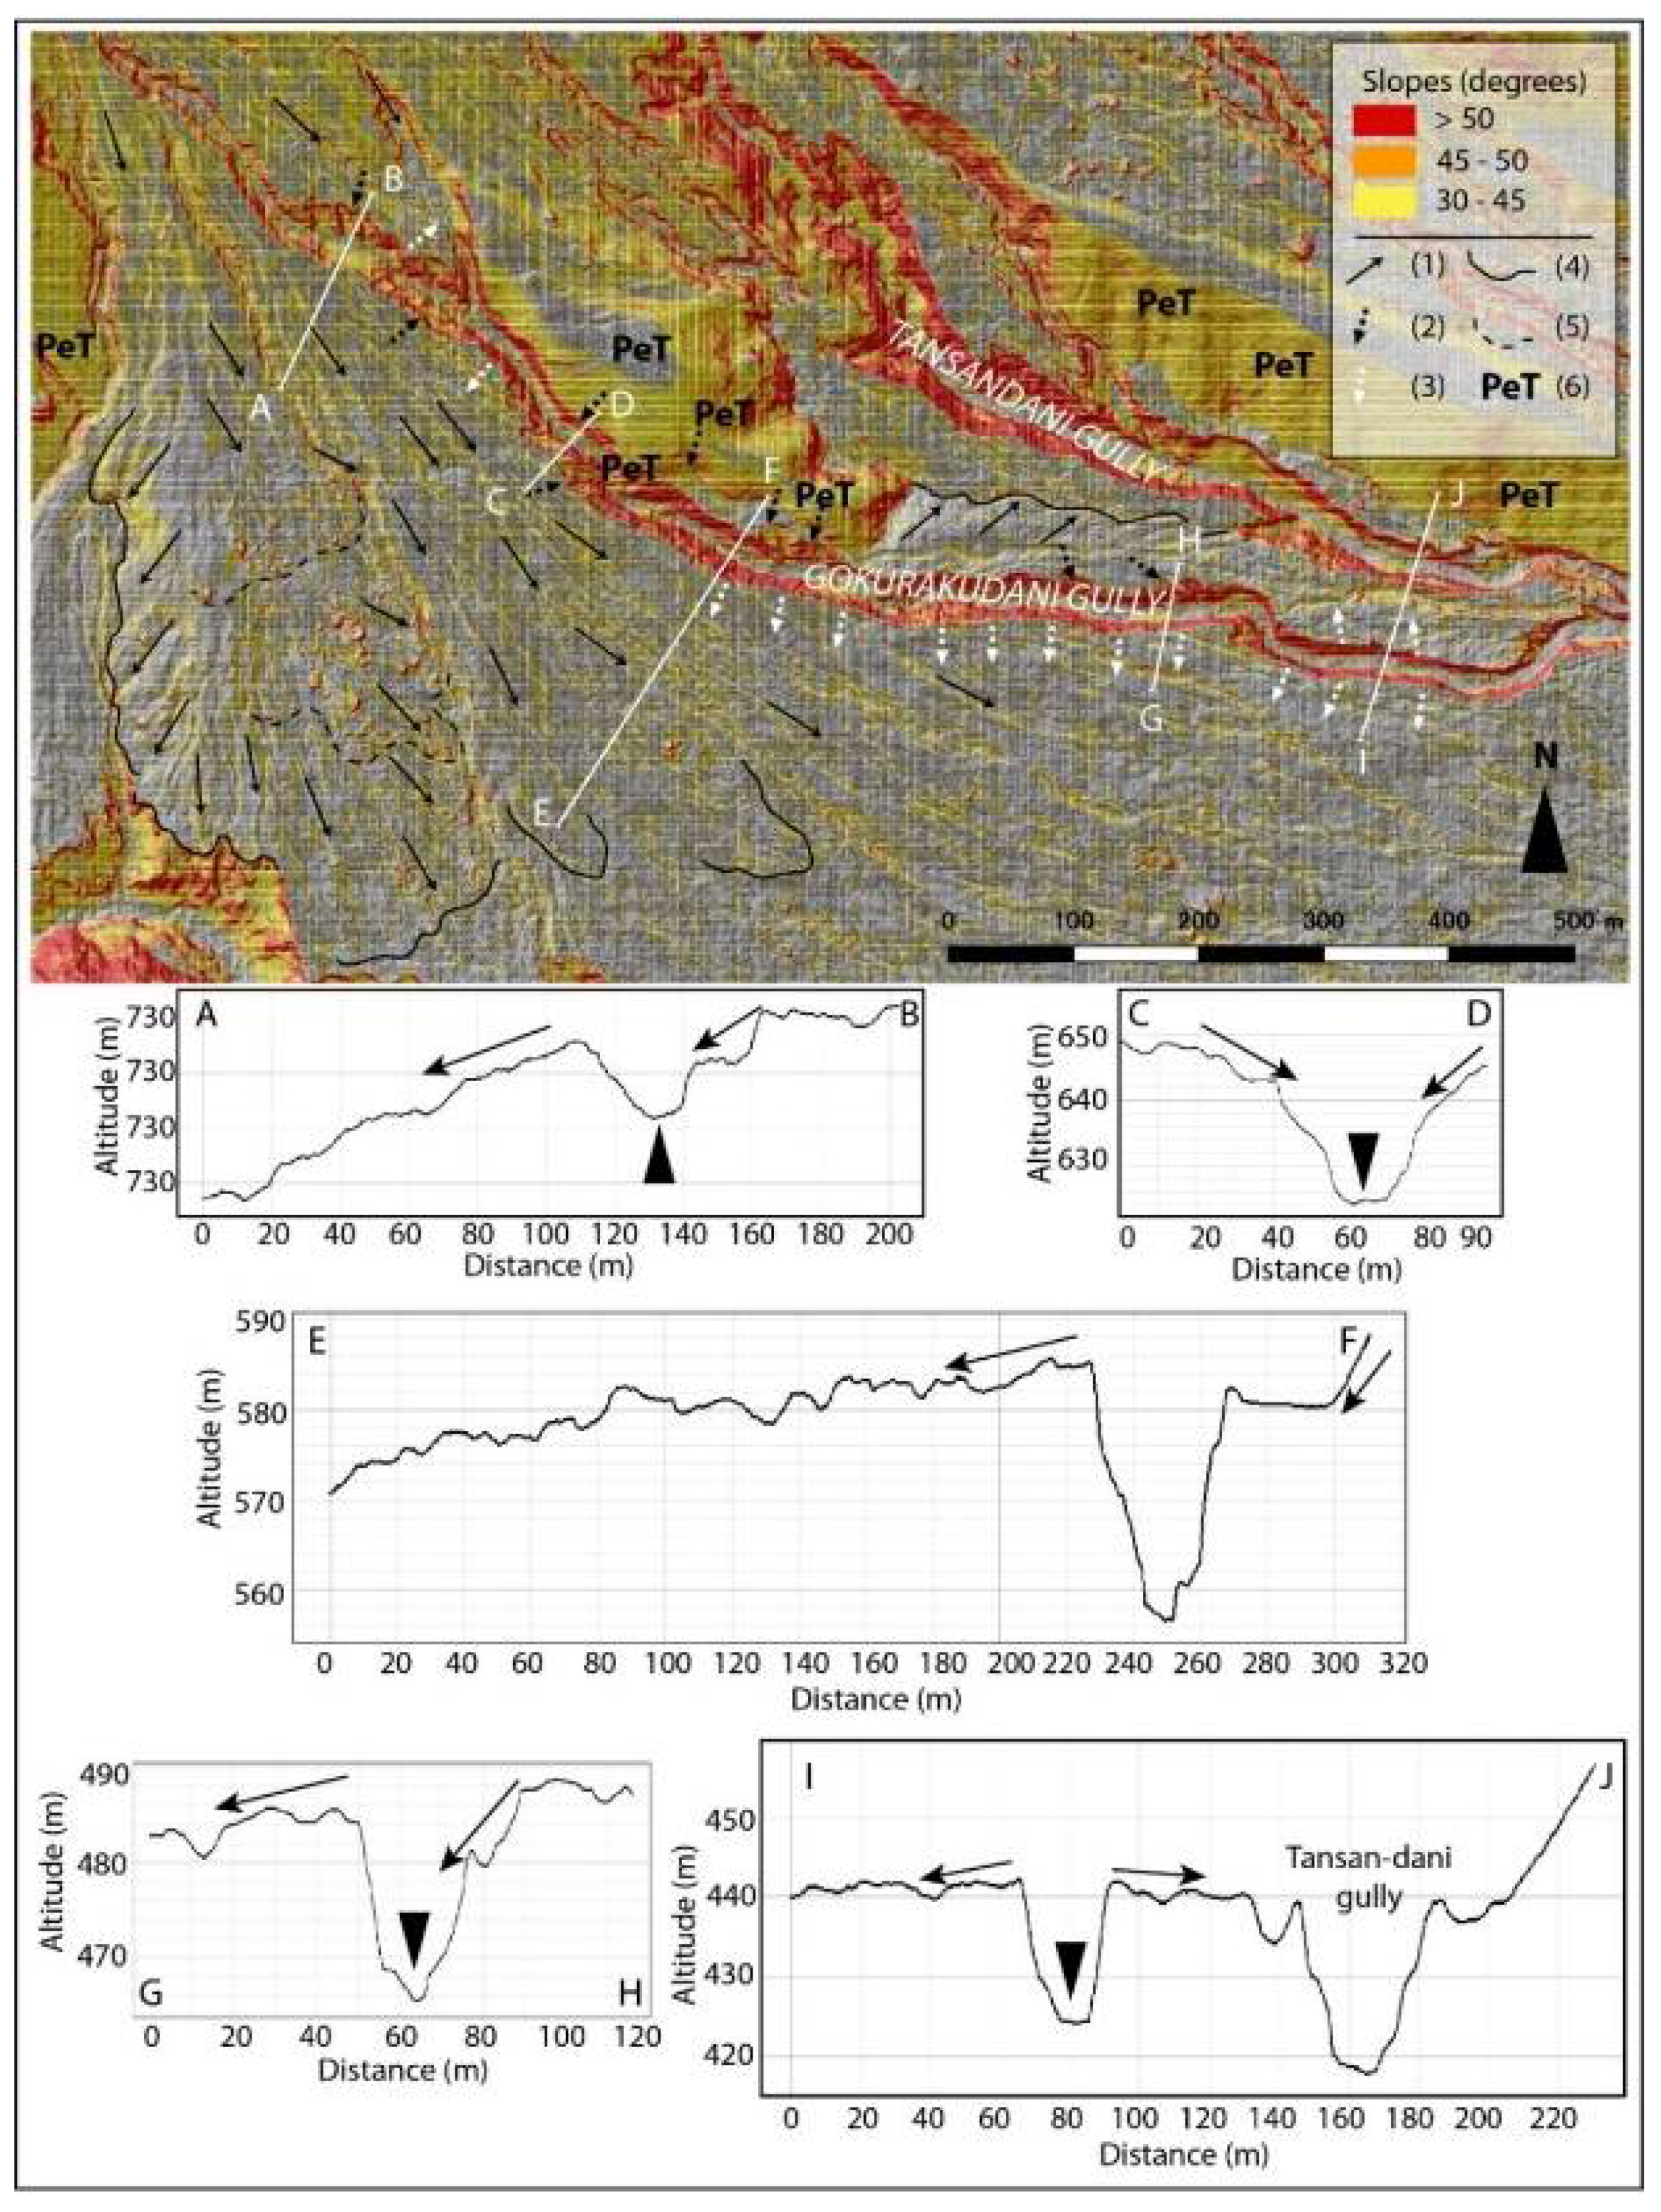
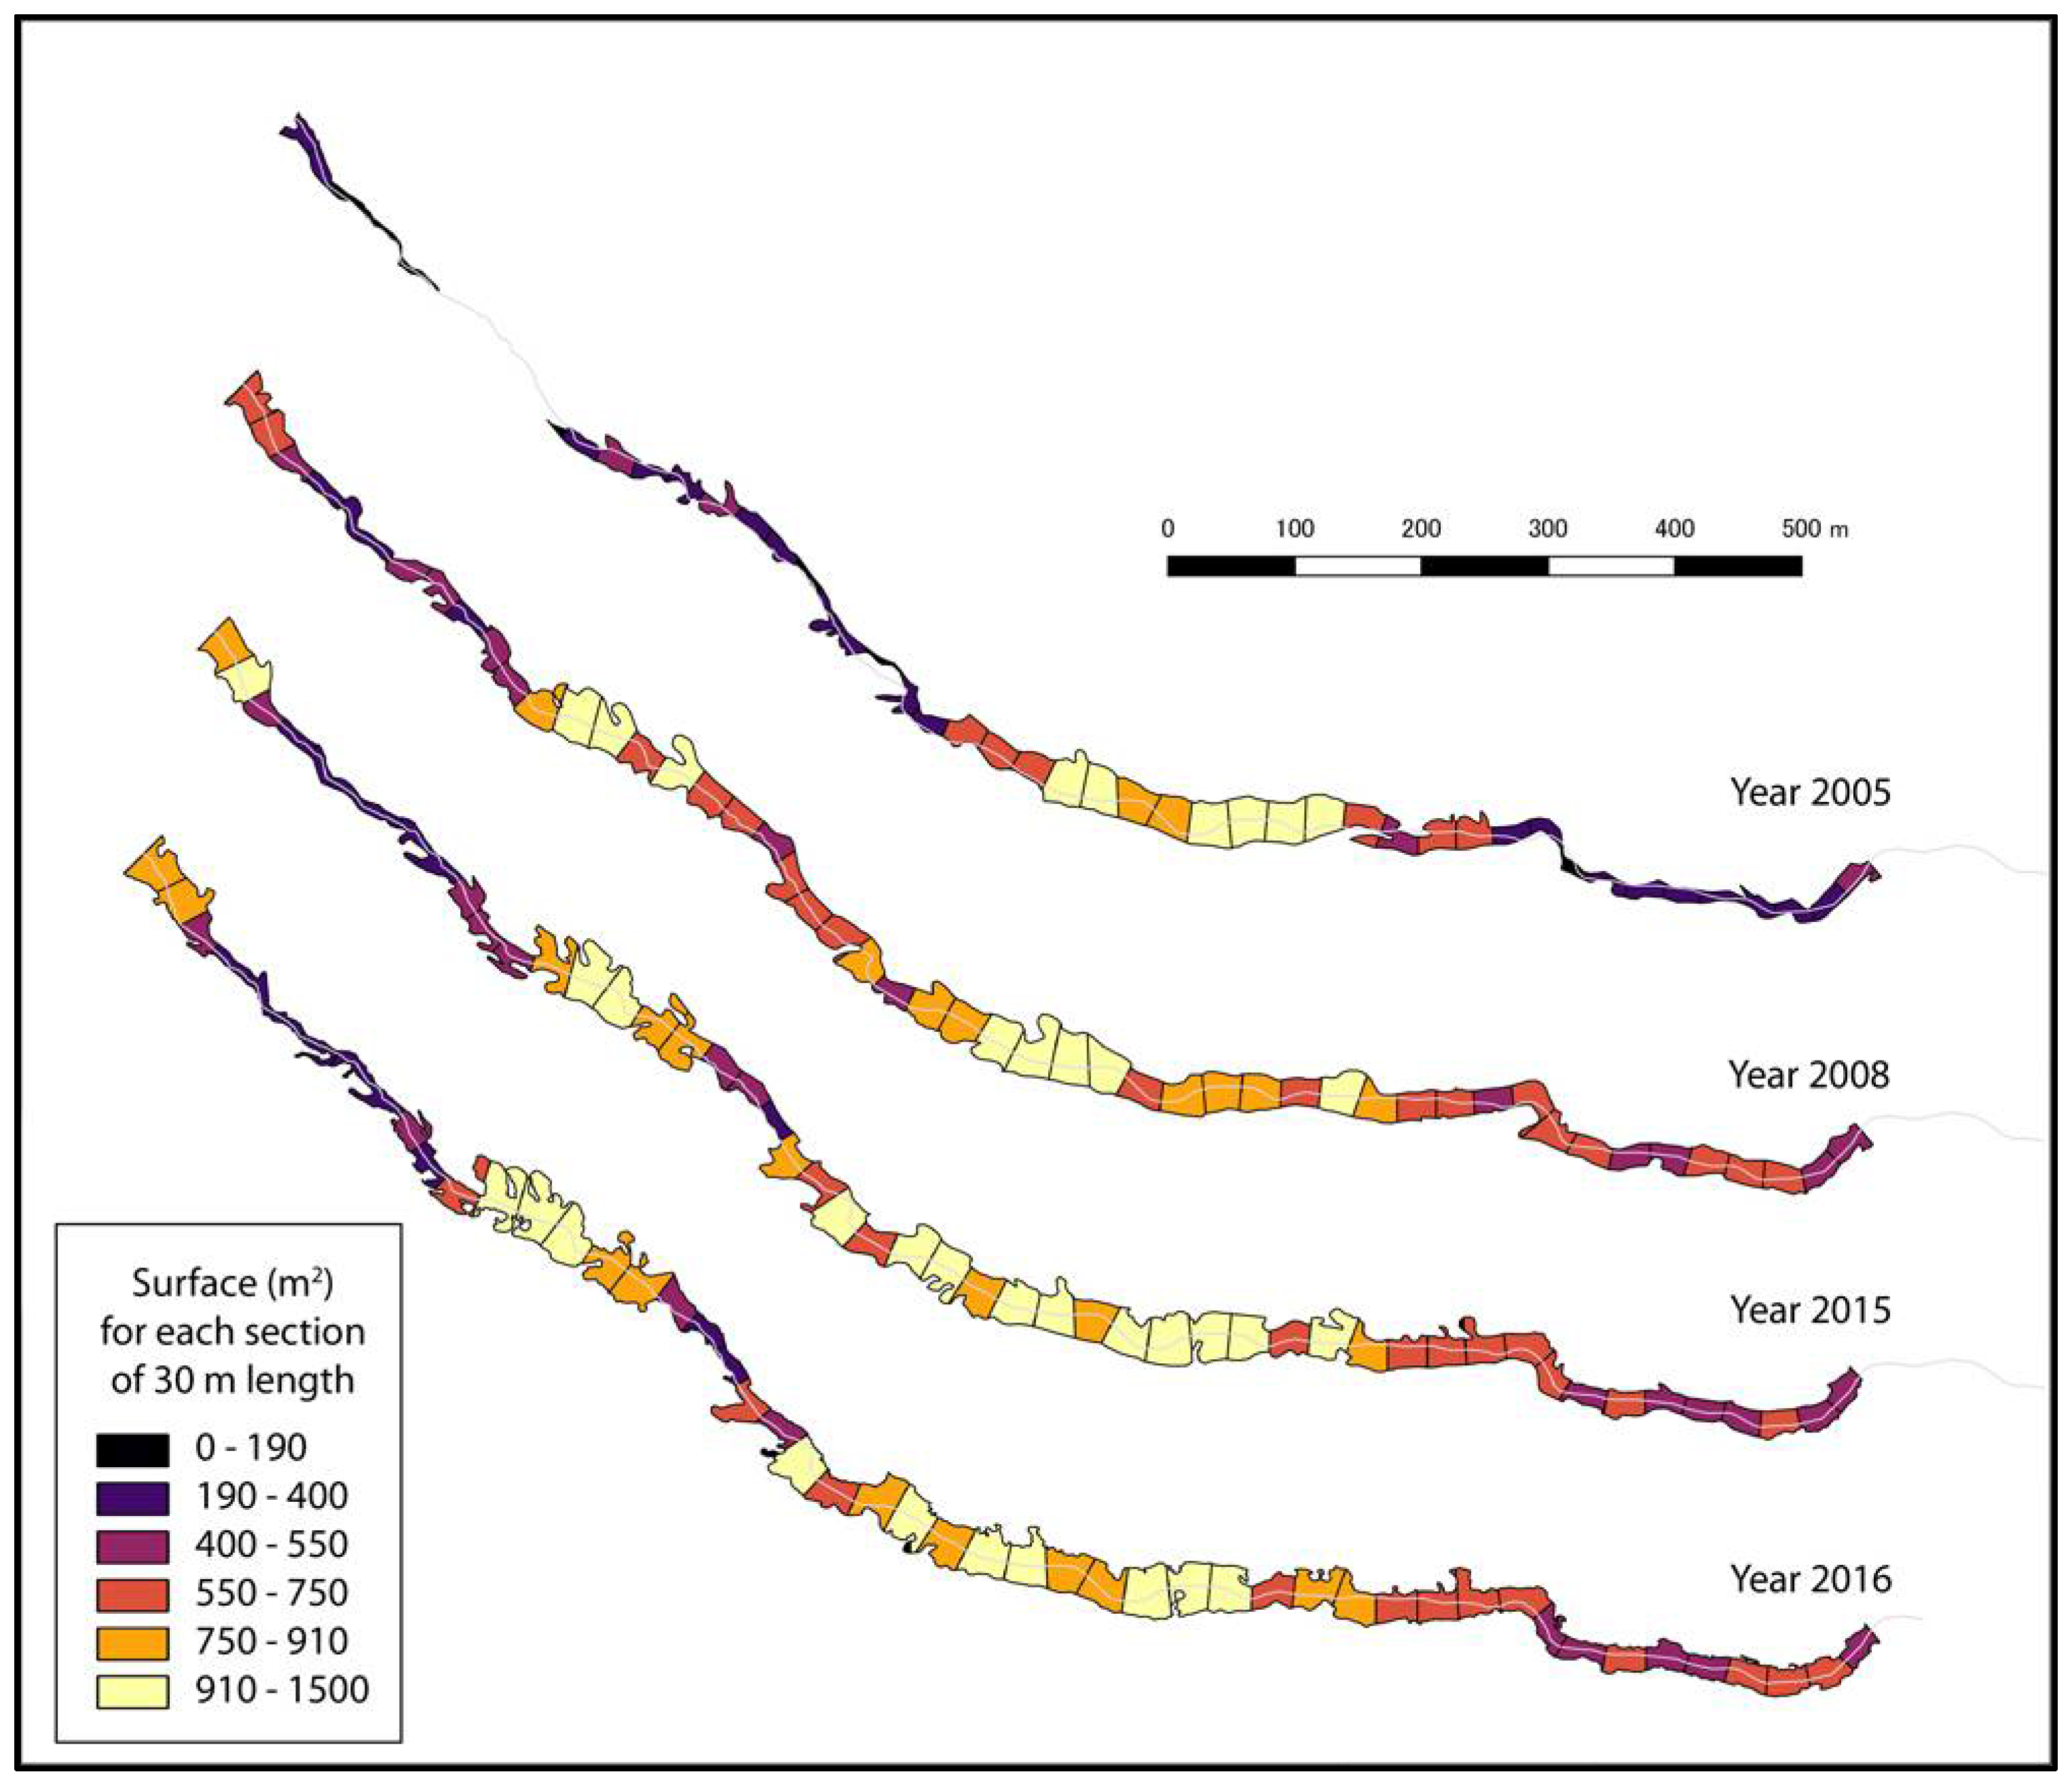
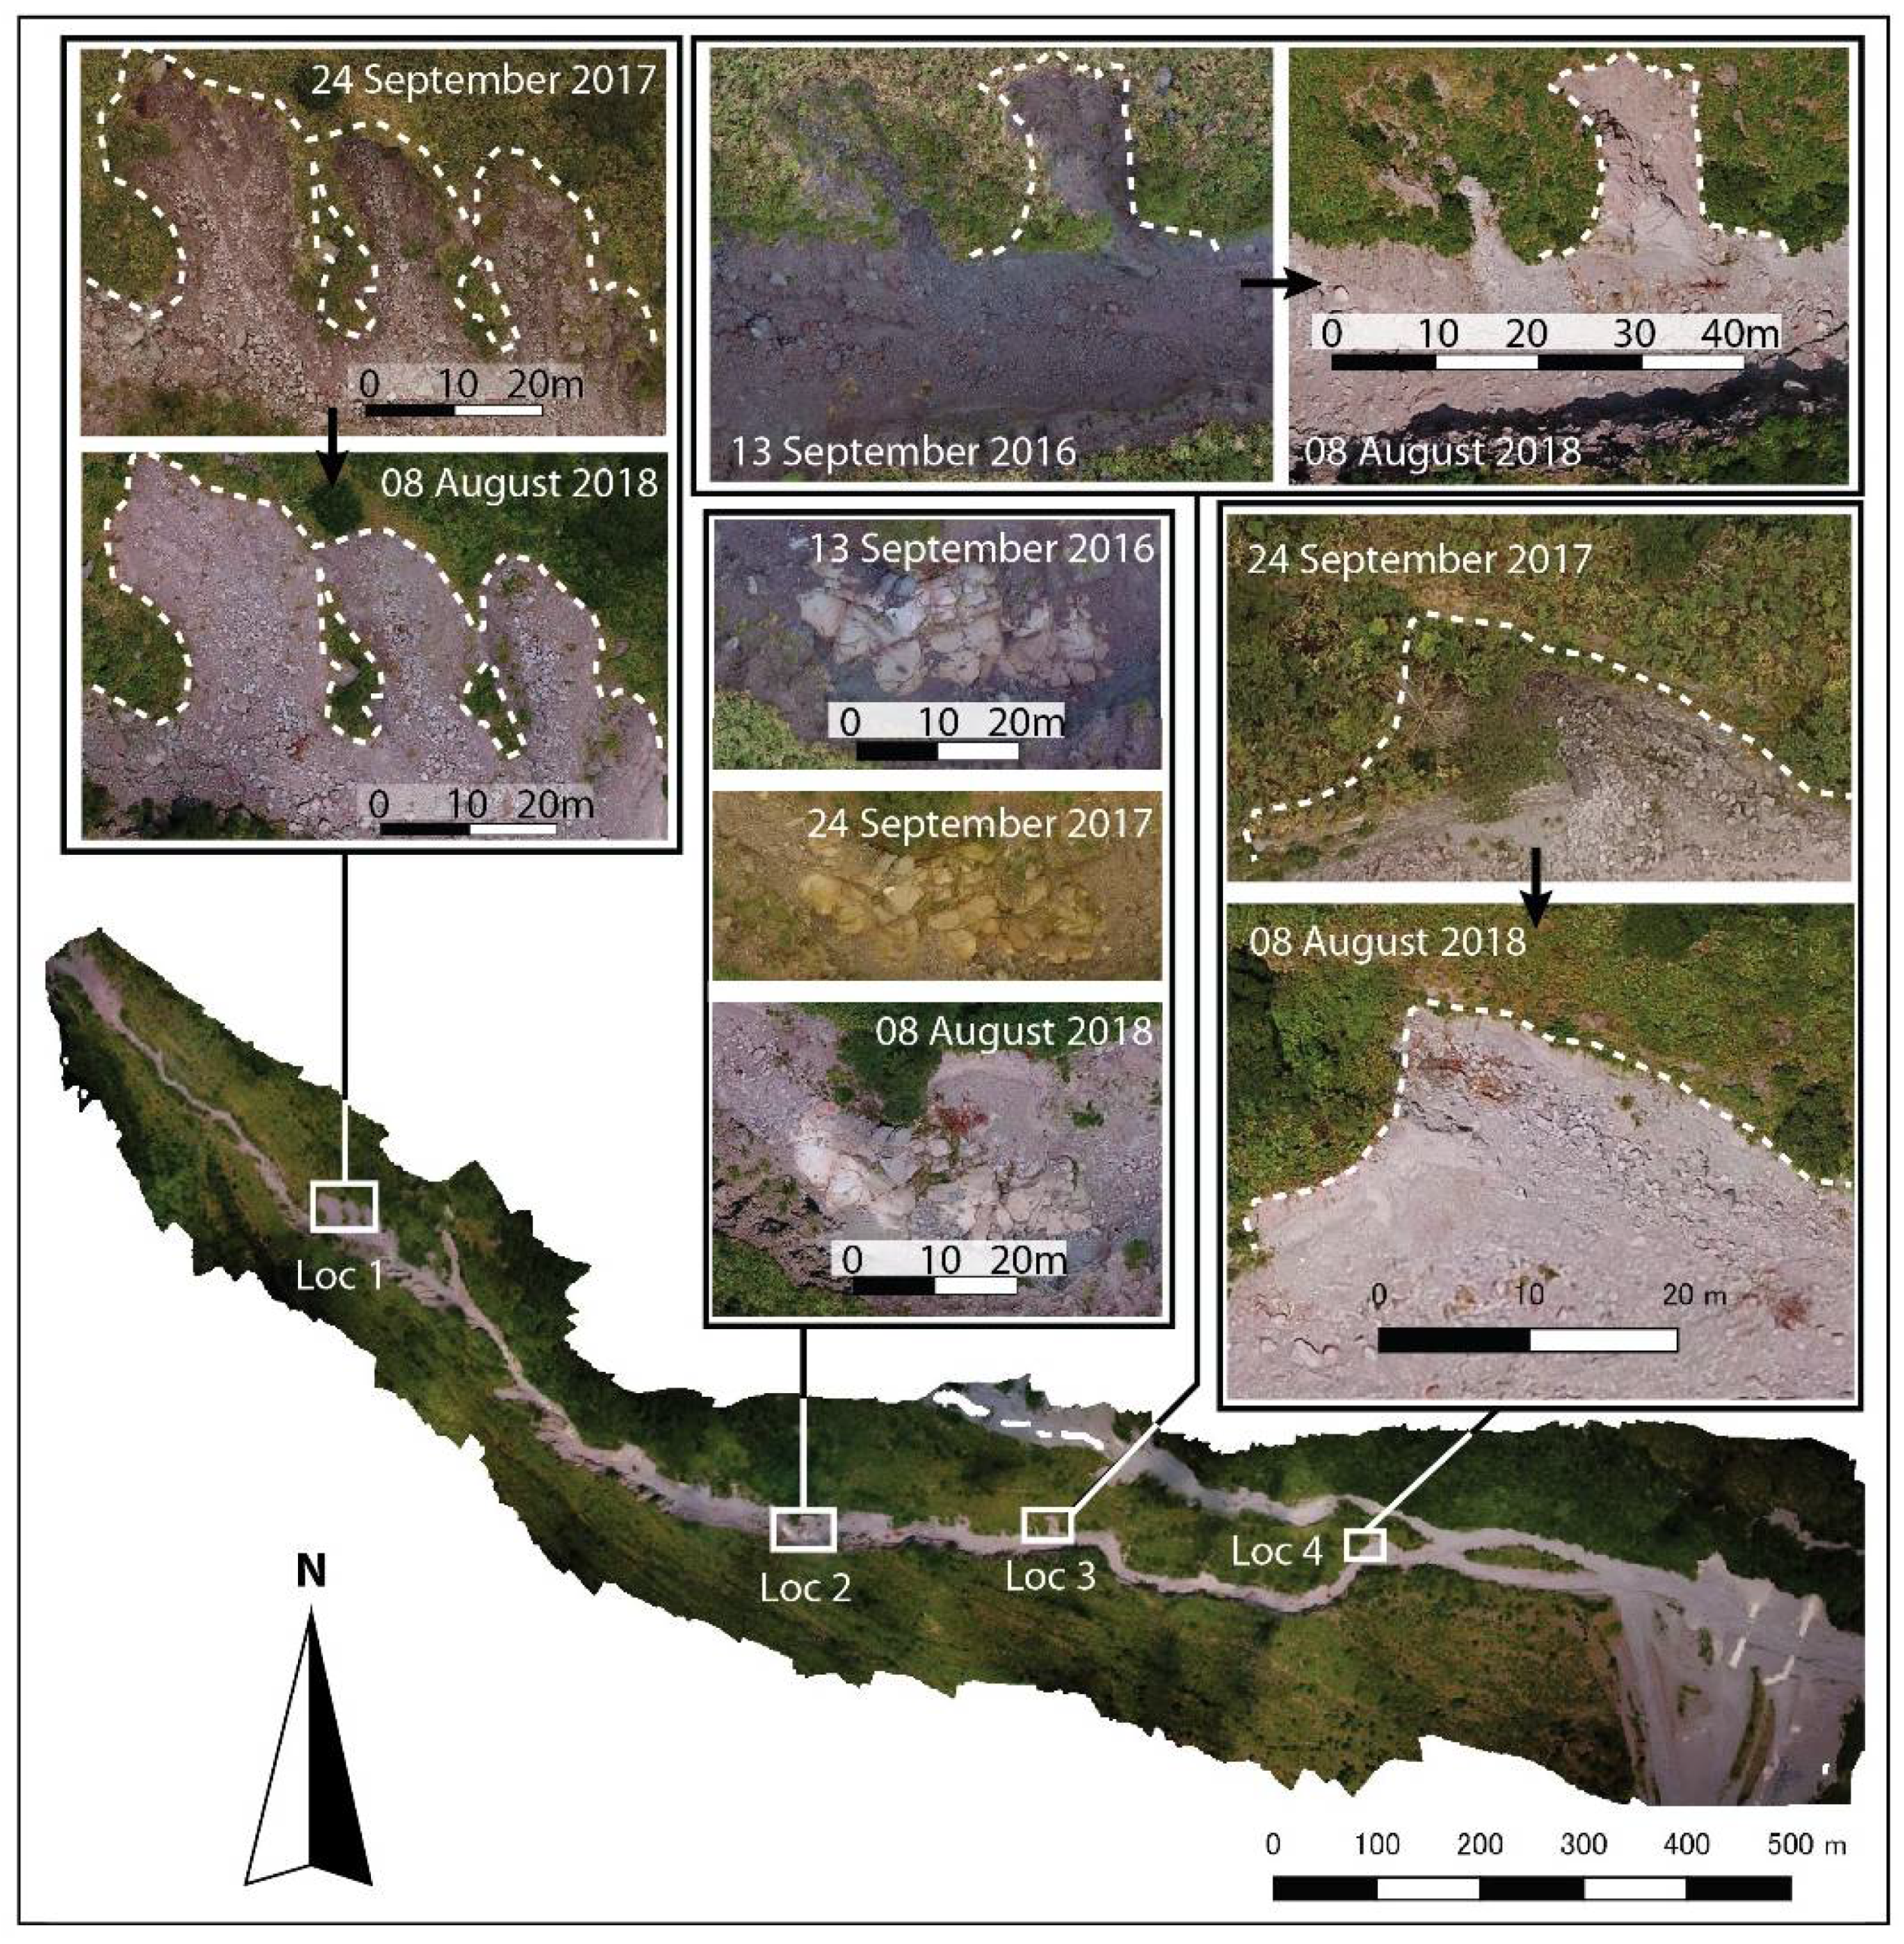
3.1. Planform Changes of the Gokurakudani Gully

Derived from aerial and UAV photographs for the period 2005–2016, the planform evolution of the Gokurakudani gully shows surfaces between 0 m2 to 1500 m2 for the surveyed series of 30 m length sections of the gully (Figure 4).
During the 11 years, the gully is irregular in its width with broad and narrow sections (Figure 5). Although one could expect a homogenization of the gully over time under the effect of lahars and other processes, the gully has however kept the same spatial distribution of wide sections and narrower sections. The distribution of the gully widths shows a narrow section in the first upstream 800 m, then an abrupt widening for almost 500 m, and then a narrowing again, with both the downstream and upstream narrow sections experiencing widening. The two upstream sections widen from a <190 m2/30 m (6.3 m width) to a 750–910 m2/30 m length (25 to 30 width), representing a rapid average lateral growth of 2.5 m/year for the section. The section between ~400 and ~700 m from the upstream ends also widens dramatically in the 11-year period, passing from <190 m2/30 m to 910–1500 m2/30 m, or an average growth of 3 m/year (Figure 5). By comparison, the central section remains mostly unchanged. The planform evolution of the gully is therefore irregular in space, and the gully is not homogenized nor does it become calibrated in its horizontal shapes. Temporally, the gullies have not evolved in a homogeneous manner either. The originally disconnected section upstream of the gully fails to grow after connecting, and between 2008 and 2016, there is a stabilization and a narrowing of the gully, with more vegetation encroachment.
In detail, the evolution of these sections is not a linear process and it is notably driven by the erosion of the side walls and the creation of erosion notches, corresponding to water preferential pathways that have eroded the sediments (Figure 4 and Figure 5). Comparing more recent data obtained from UAV imagery in 2017 and 2018, one can observe the erosion of side gullies connected to the main Gokurakudani gully (Figure 5).

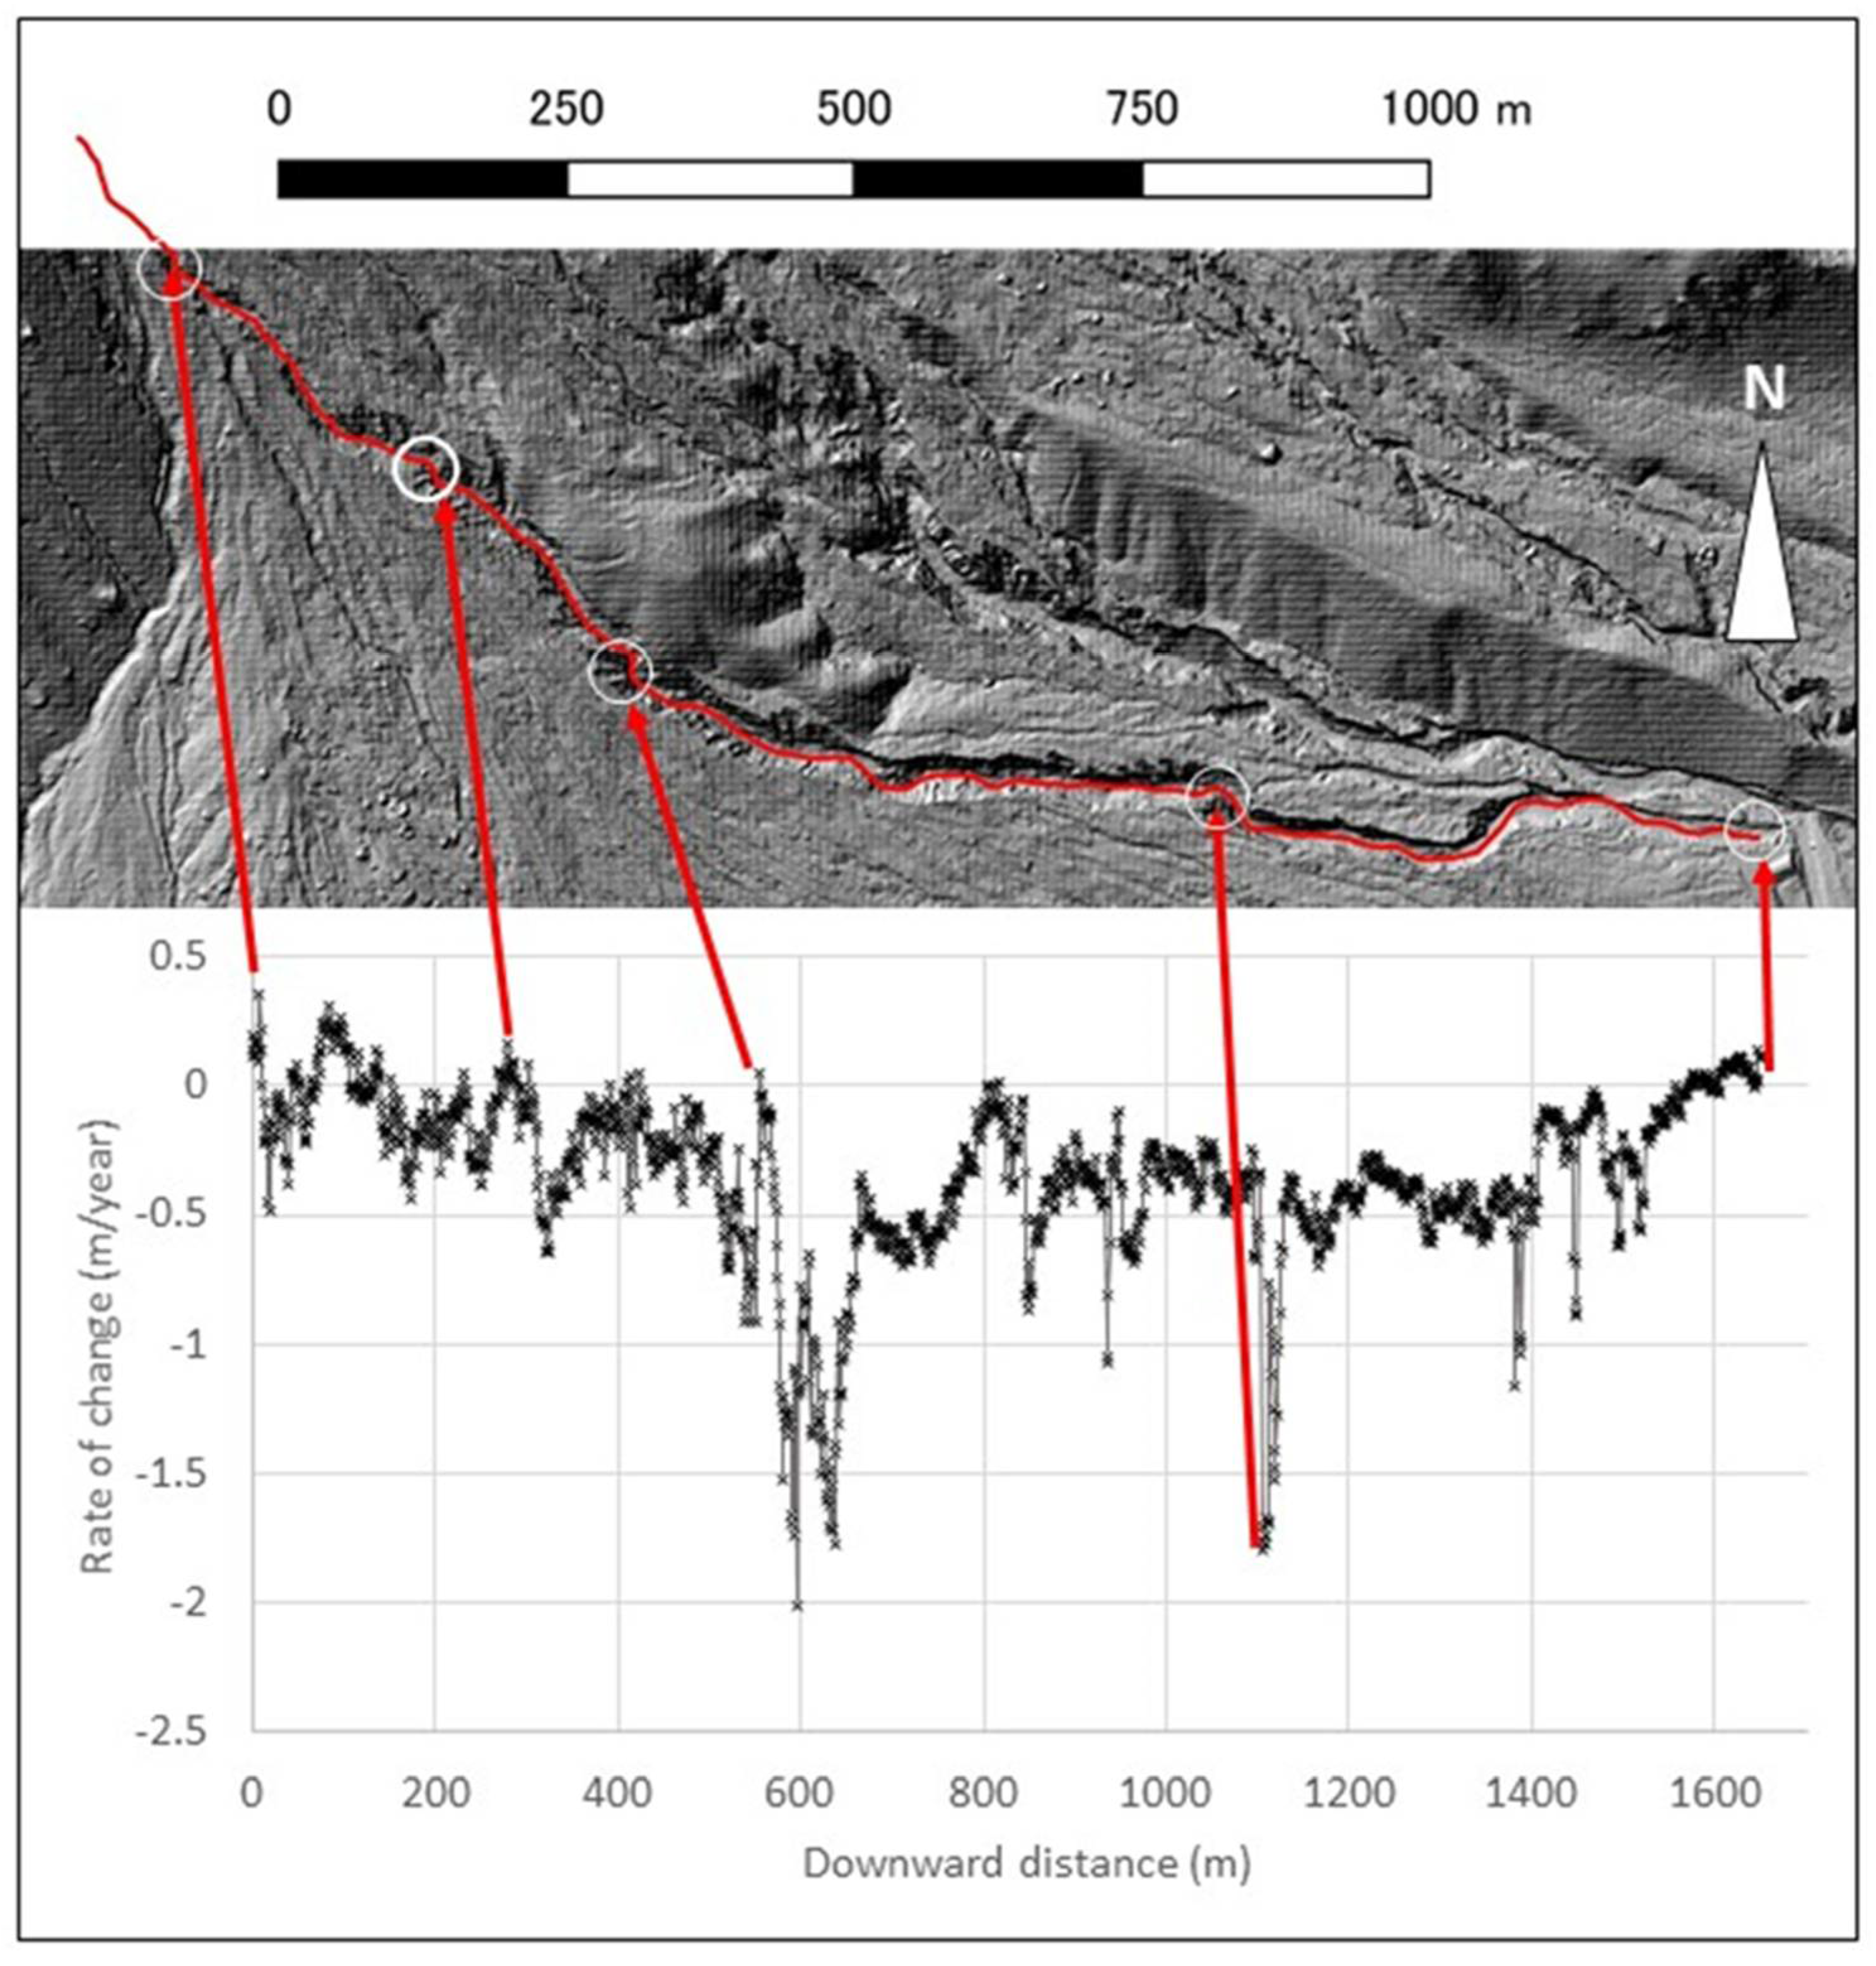
3.2. Vertical Changes of the Gokurakudani Gully

The comparison of topographic data between 2008 and 2016 shows that the gully is stable overall, and its floor has not been eroding nor accumulating deposits significantly, as the majority of the topographical change is within 50 cm (Figure 6). There are three unstable zones between 250 and 300 m and between 550 and 600 m and at 1100 m. These features appear as a topographical step, with the top of the step being stable, while the lower part erodes. The recorded change has been 1.5 m to 2 m per year. There are three zones of such erosion, creating drops of several meters in the gully floor (Figure 6) for the studied period. On top of the three steps with erosion >1.5 m, there are smaller secondary steps that also exist with erosion values between 0.5 m and 1 m.
The gully is therefore changing over time in an irregular manner, both horizontally and vertically, with the alternation of zones of relative stability against zones of increased erosion. Completing the longitudinal profile evolution, cross-profile analysis using the angles of the wall face as a measure of stability (Figure 7) show that the sub-vertical walls are all comprised between 26.7 and 71 degrees. They present a sloping angle comprised between values below 35.4 degrees (the angle of repose or friction angle) and up to subvertical angles (71 degrees). The distribution of these angles is controlled by the status of the wall: whether it has collapsed or not and also its position on the right or left side of the gully (Figure 7). Dividing the walls that have shown signs of collapse from those that have not, the data show that the true left walls can sustain an angle of 56.7 degrees, while the true right walls can withstand angles of up to 68 degrees. The collapsing mechanisms are arguably different on the true right and the true left of the gully. This is further evidenced by the distribution of collapsed or partially collapsed wall profiles that can be straight up to 71 degrees on the true right, while the value only reaches 45 degrees for the true left (Figure 7). The “not collapsed” walls show the same pattern with maxima at 68 and 56.7 degrees for the true left and the true right respectively.

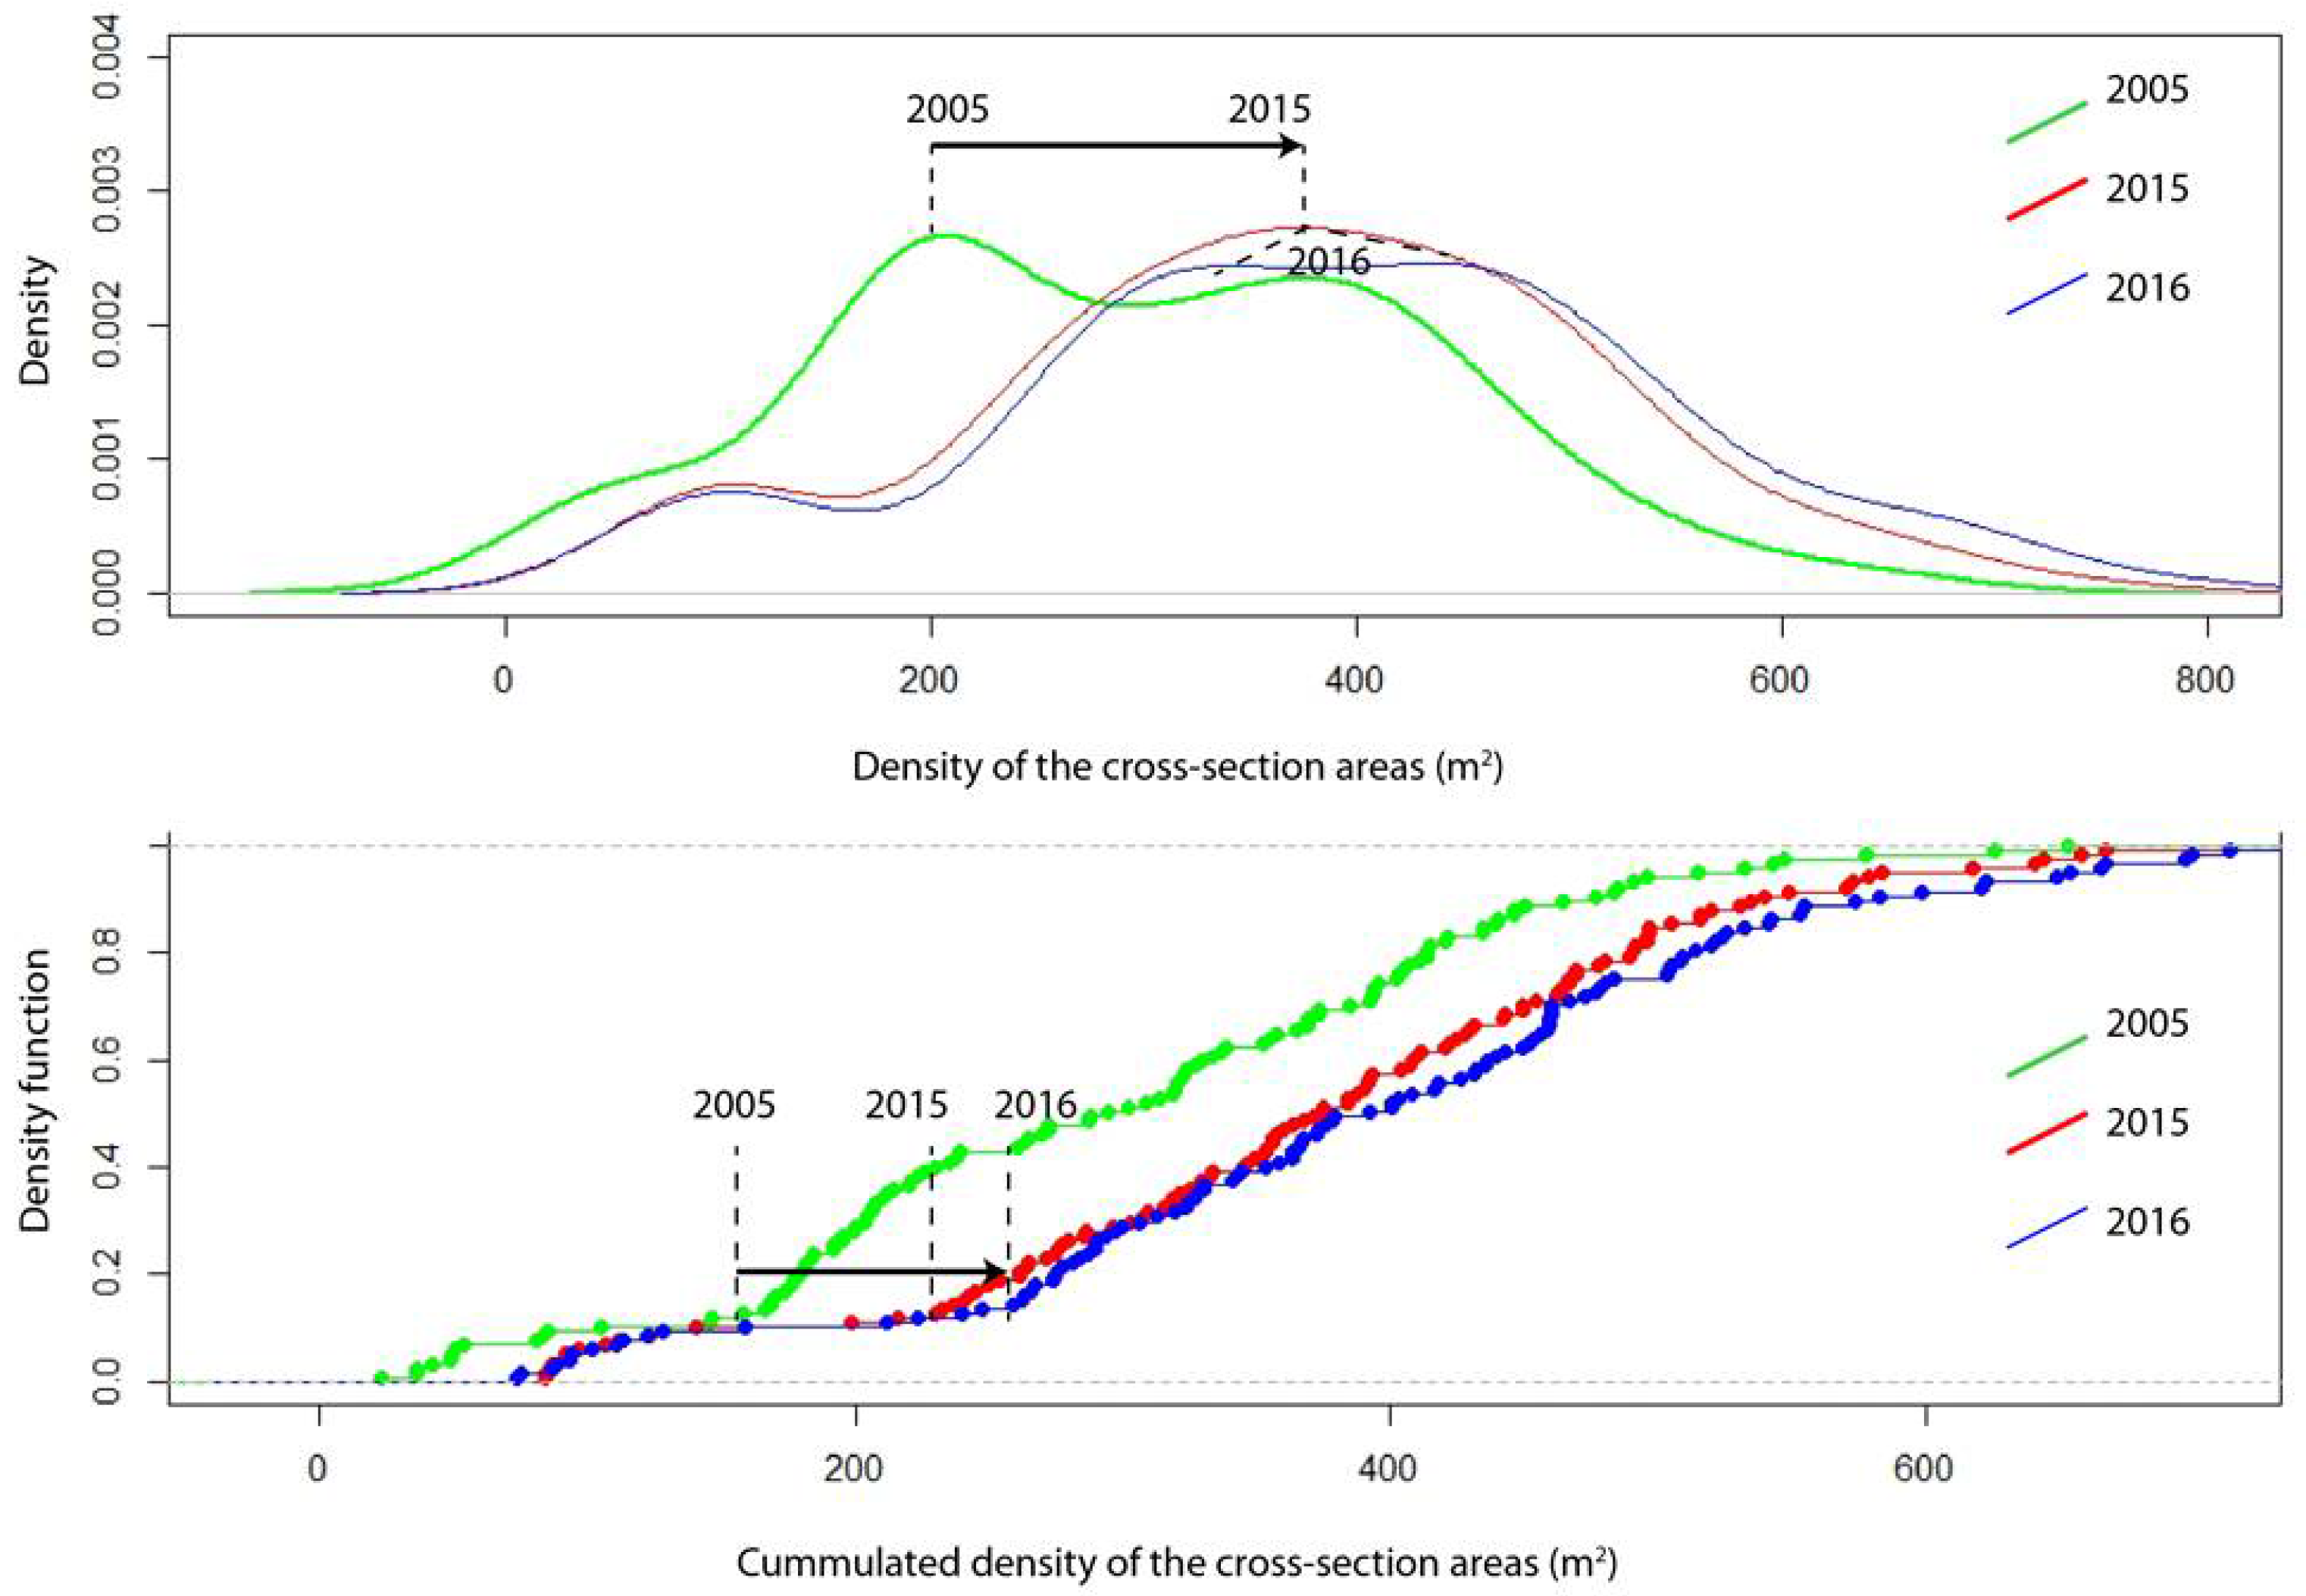
3.3. Cross Section Areas’ Evolution from 2005 to 2016

Using the sampled transects along the Gokurakudani gully (Figure 4), the statistical distribution of cross sectional areas of the gully was calculated. It shows that the distribution of the gully areas is bimodal in 2005, becoming increasingly unimodal in 2015 and 2016 (Figure 8).
In 2005, the two modes of the cross sections are ~200 m2 and ~400 m2 with respective density of 0.003 and 0.004. In 2015 and 2016, the series tends to converge with one single mode ~380 m2, but this mode is a plateau rather than a peak and the plateau ranges from ~300 m2 to 500 m2. There is thus an increase of the sizes of the cross section areas and a thickening of the positive tail, while the density of small cross sections <200 m2 reduces (Figure 8). Overall, one can observe a shift of all the series towards larger values. The cumulated density representation of this dataset shows this pattern with a shift to high values. In 2005, a cross section <200 m2 represents >20% of the cross sections, when in 2015 and 2016, it drops to ~10% (or 0.1 on Figure 8).

3.4. Topographic Results’ Interpretation

The geometry of the Gokurakudani gully displays stretches where the width alternates between narrow and wide reaches. It also shows a relative stability of the bed, with localized points of erosion, and the lateral erosion and stability of the walls of the gully show a dissymmetry between the left and the right wall. To attempt to understand those differences, the interpretation of these results will rely on the hypothesis that antecedent conditions must have a control on the geometry and geomorphological evolution of the gully. The upper section of the Gokurakudani gully cuts into the 1990–1995 PDCDs before wrapping around the pre-eruptive topography (PeT on Figure 9), so that the left is against it, while the right is limited by the PDCD. For the lower half of the gully, it cuts through the 1990–1995 PDC, which is present on both sides of the gully. Cross sections show that the PDC topography is slanting away from the gully right wall, while at transect C-D (Figure 9) the transversal slopes converge towards the gully. At transects E-F and G-H, the transversal slope diverges from the gully right wall, and converges towards the left wall. Finally, at transect I–J, the transverse slope tends towards 0 (flat topography). The Tansandani gully is also much lower than the Gokurakudani gully. For most of the gully, the direction of the transverse topography is opposite for the left and right walls of the gully. From the topographic surface of the PDCDs (Figure 9), this characteristic is related to the location of the gully compared to the PDCD and the pre-eruptive topography. This dissymmetry between the left and the right side of the gully can be related to the difference between the stability of the left and the right wall, as precipitated water tends to either diverge or converge towards the gully. From the aerial imagery (Figure 5), the direction of the topography and the location of the side gullies are related. In places where the transversal slope converges towards the gully, side gullies are present, otherwise not. Most side gullies are therefore located on the left side of the Gokurakudani, except in the mid-upper section, where both transversal slopes converge towards the Gokurakudani, and then side gullies are denser on the right side. One will also note the lack of gullies in the PeT material, as it is not loose material generated by the latest eruption.

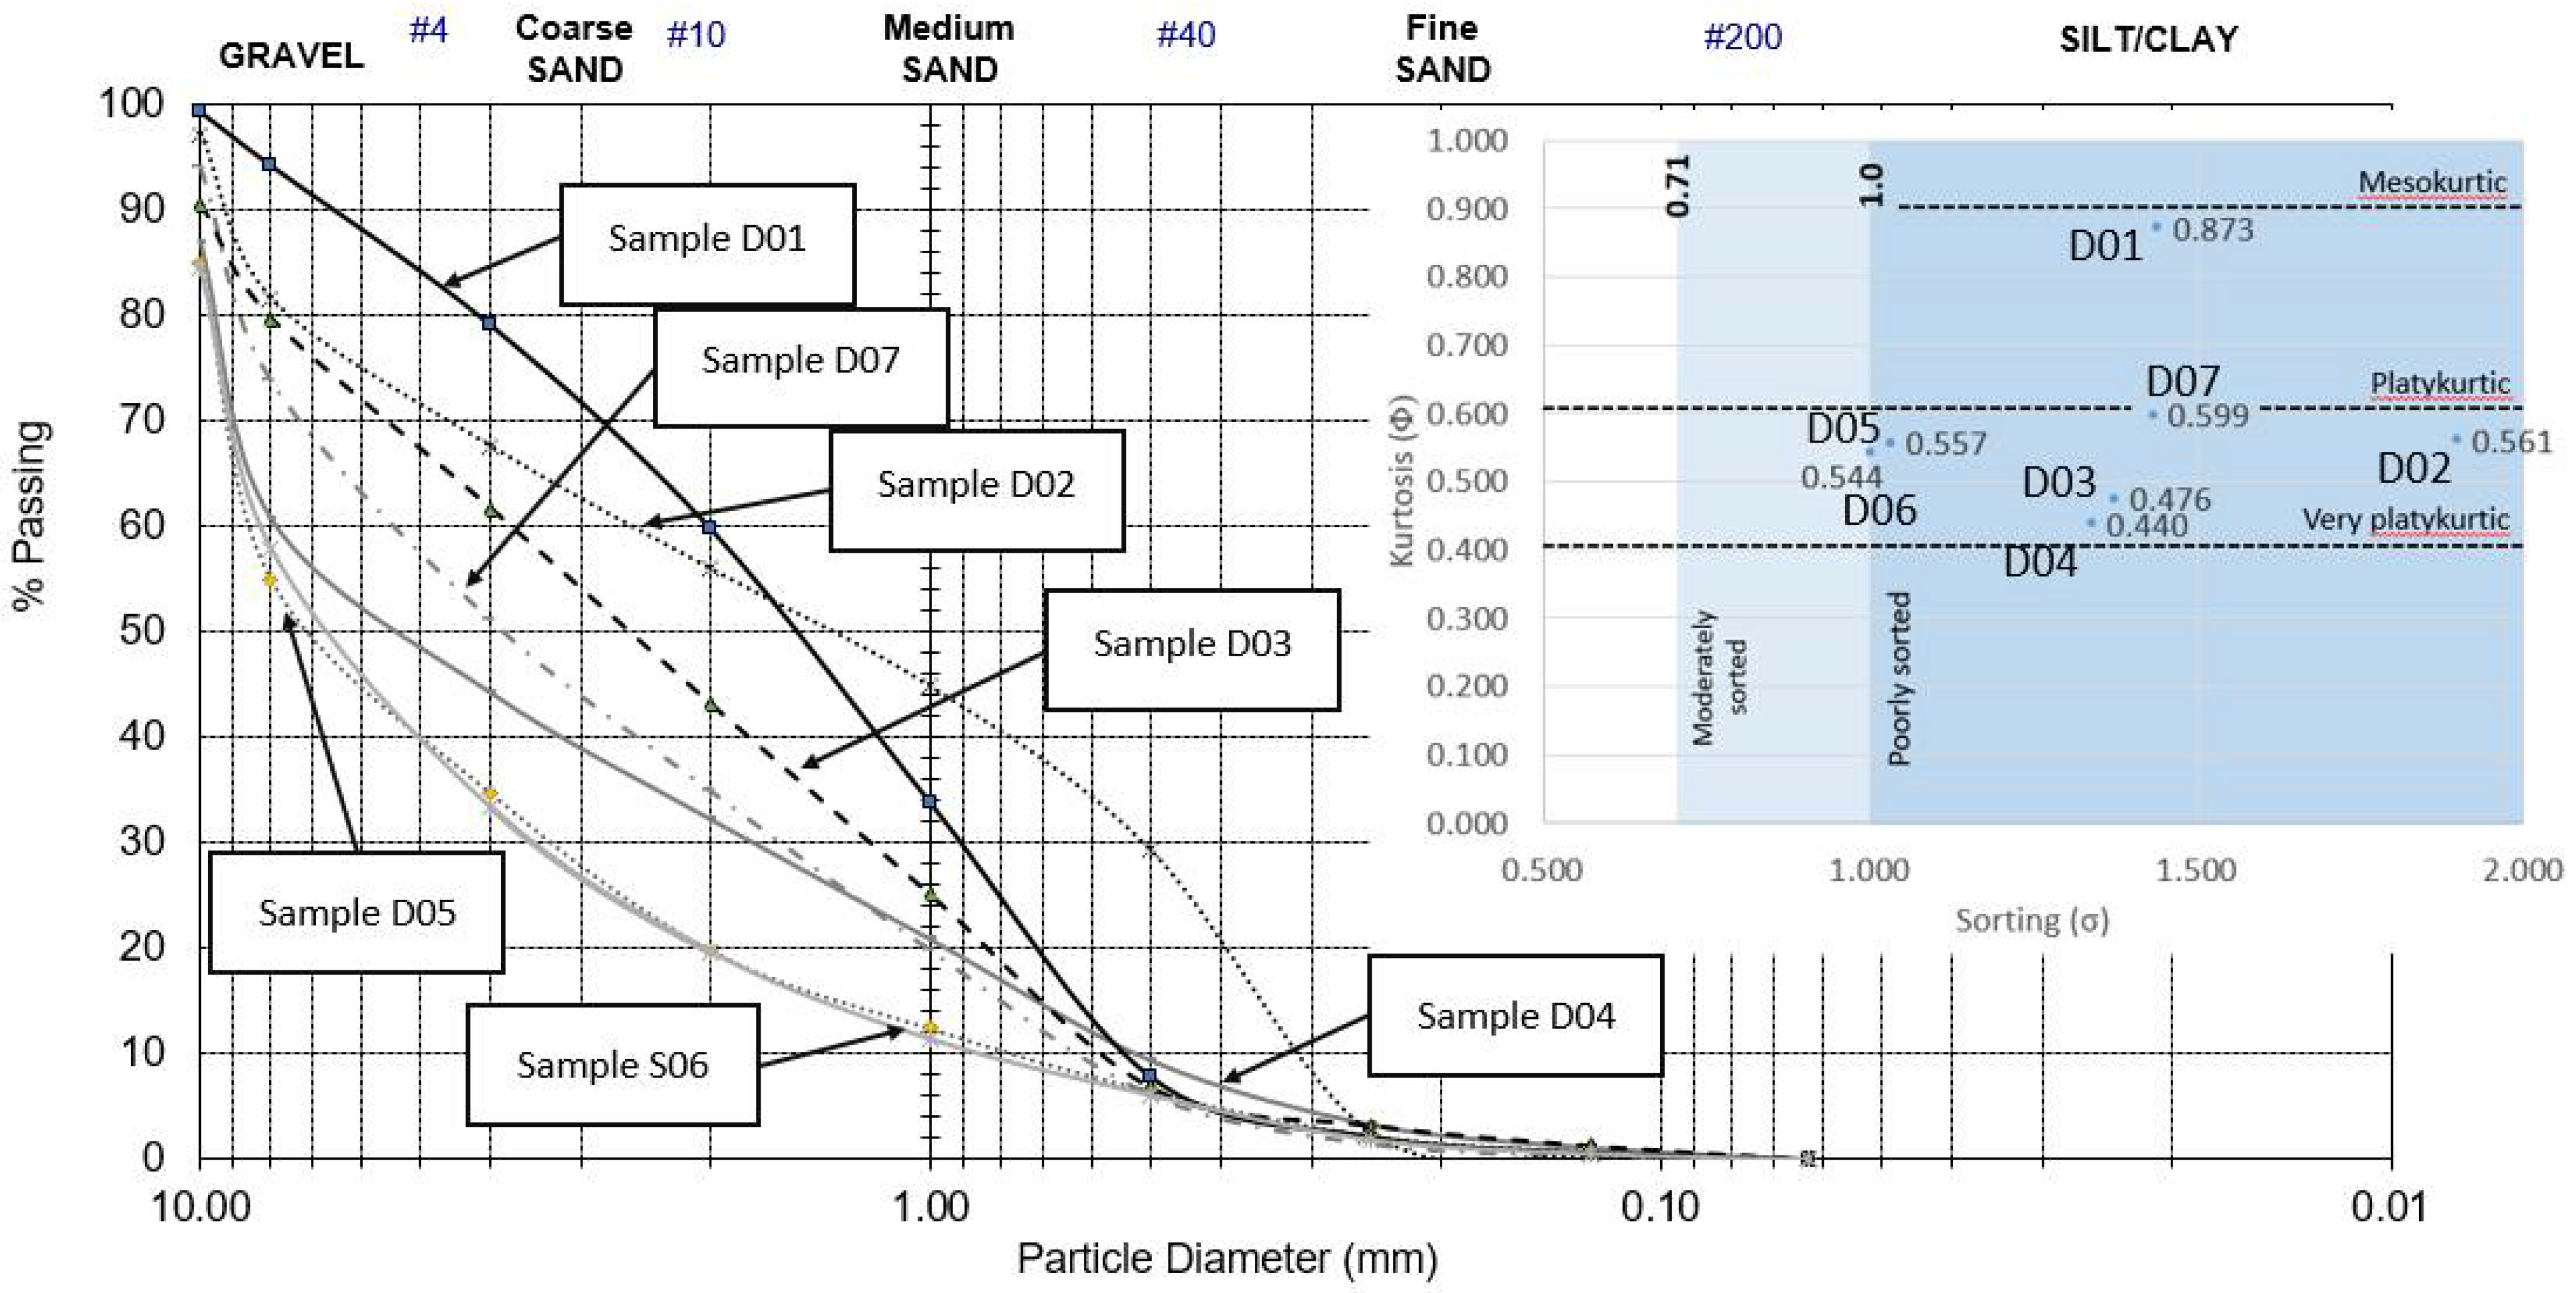
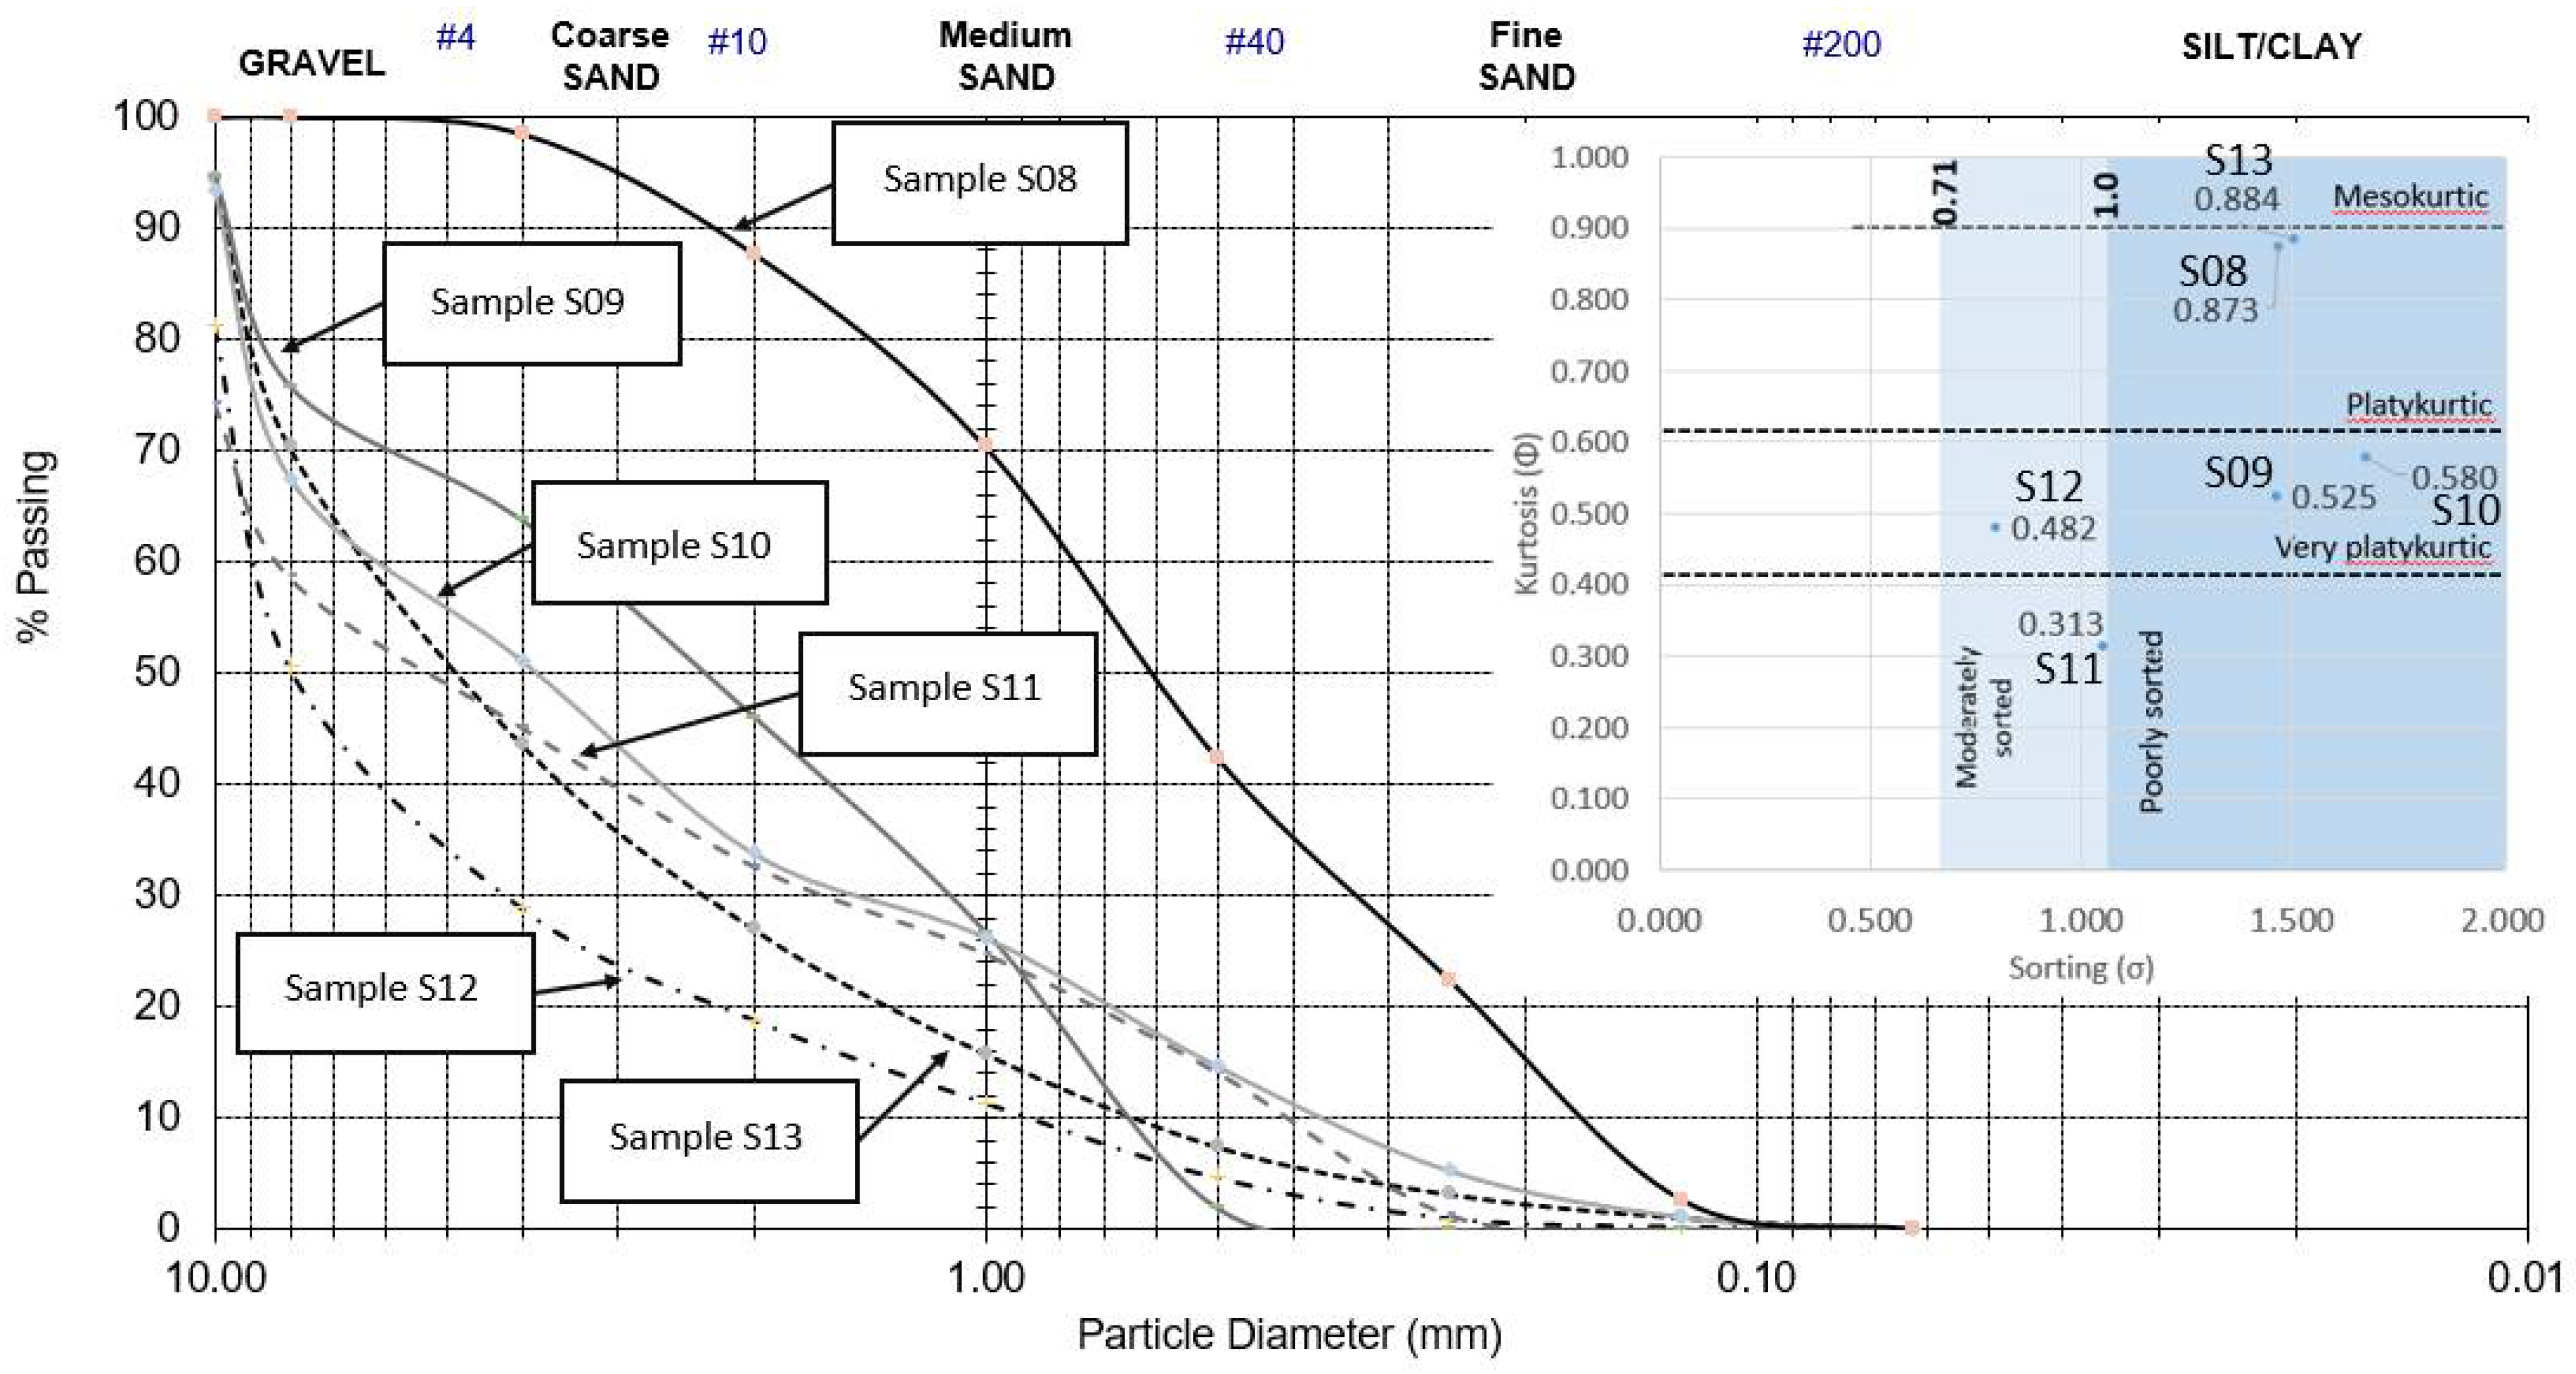
3.5. The Material: Grain Size Analysis and Material Differentiation

Although the geomorphology of the gully and its evolution over time and space show variations that can be interpreted as topography-related, the constituents of the gully must have changed from the original PDCDs and the secondary processes (such as lahars and waterflows as evidenced by [4]. The grain size distribution of the collected samples from the valley floor (Figure 10) shows a material dominated by poorly sorted material (>1 on the sorting scale) with a platykurtic distribution (i.e., the tails at both ends of the distribution are not important). For instance, there is no material of fine sand size and smaller in sample D02 taken at the center of the gully floor, and the gravel fraction is also limited. Sample D01, (interpreted as a lahar debris flow phase facies, based on the material and the rest of the lahar deposit in the Gokurakudani gully) has even less fine material but a larger fraction of coarse material and gravel. The other samples from the gully floor, D03 to D06, were deposited by Newtonian flows and trapped behind a side gully debris cone.
In the lower section of the gully, lahar deposits S09 to S12 are poorly to moderately sorted, and the distributions are very platykurtic (Figure 11). This material contrasts with the wall PDCDs that are at the limit between platykurtic and mesokurtic. If the sampled PDCD material did not display a distinctive difference with the lahar deposits, a drape of fine and wet material was oozing out of the outcrop and its sample showed a significantly finer distribution of material (S08 on Figure 11). This shows that although the wall is stable and not changing from a topographic perspective, its constituents are being selectively washed away. The diminution of fine material from this process may explain why the PDCD material in sample S13 does not present a higher proportion of fine material and is very close to the material found in the lahar deposits.

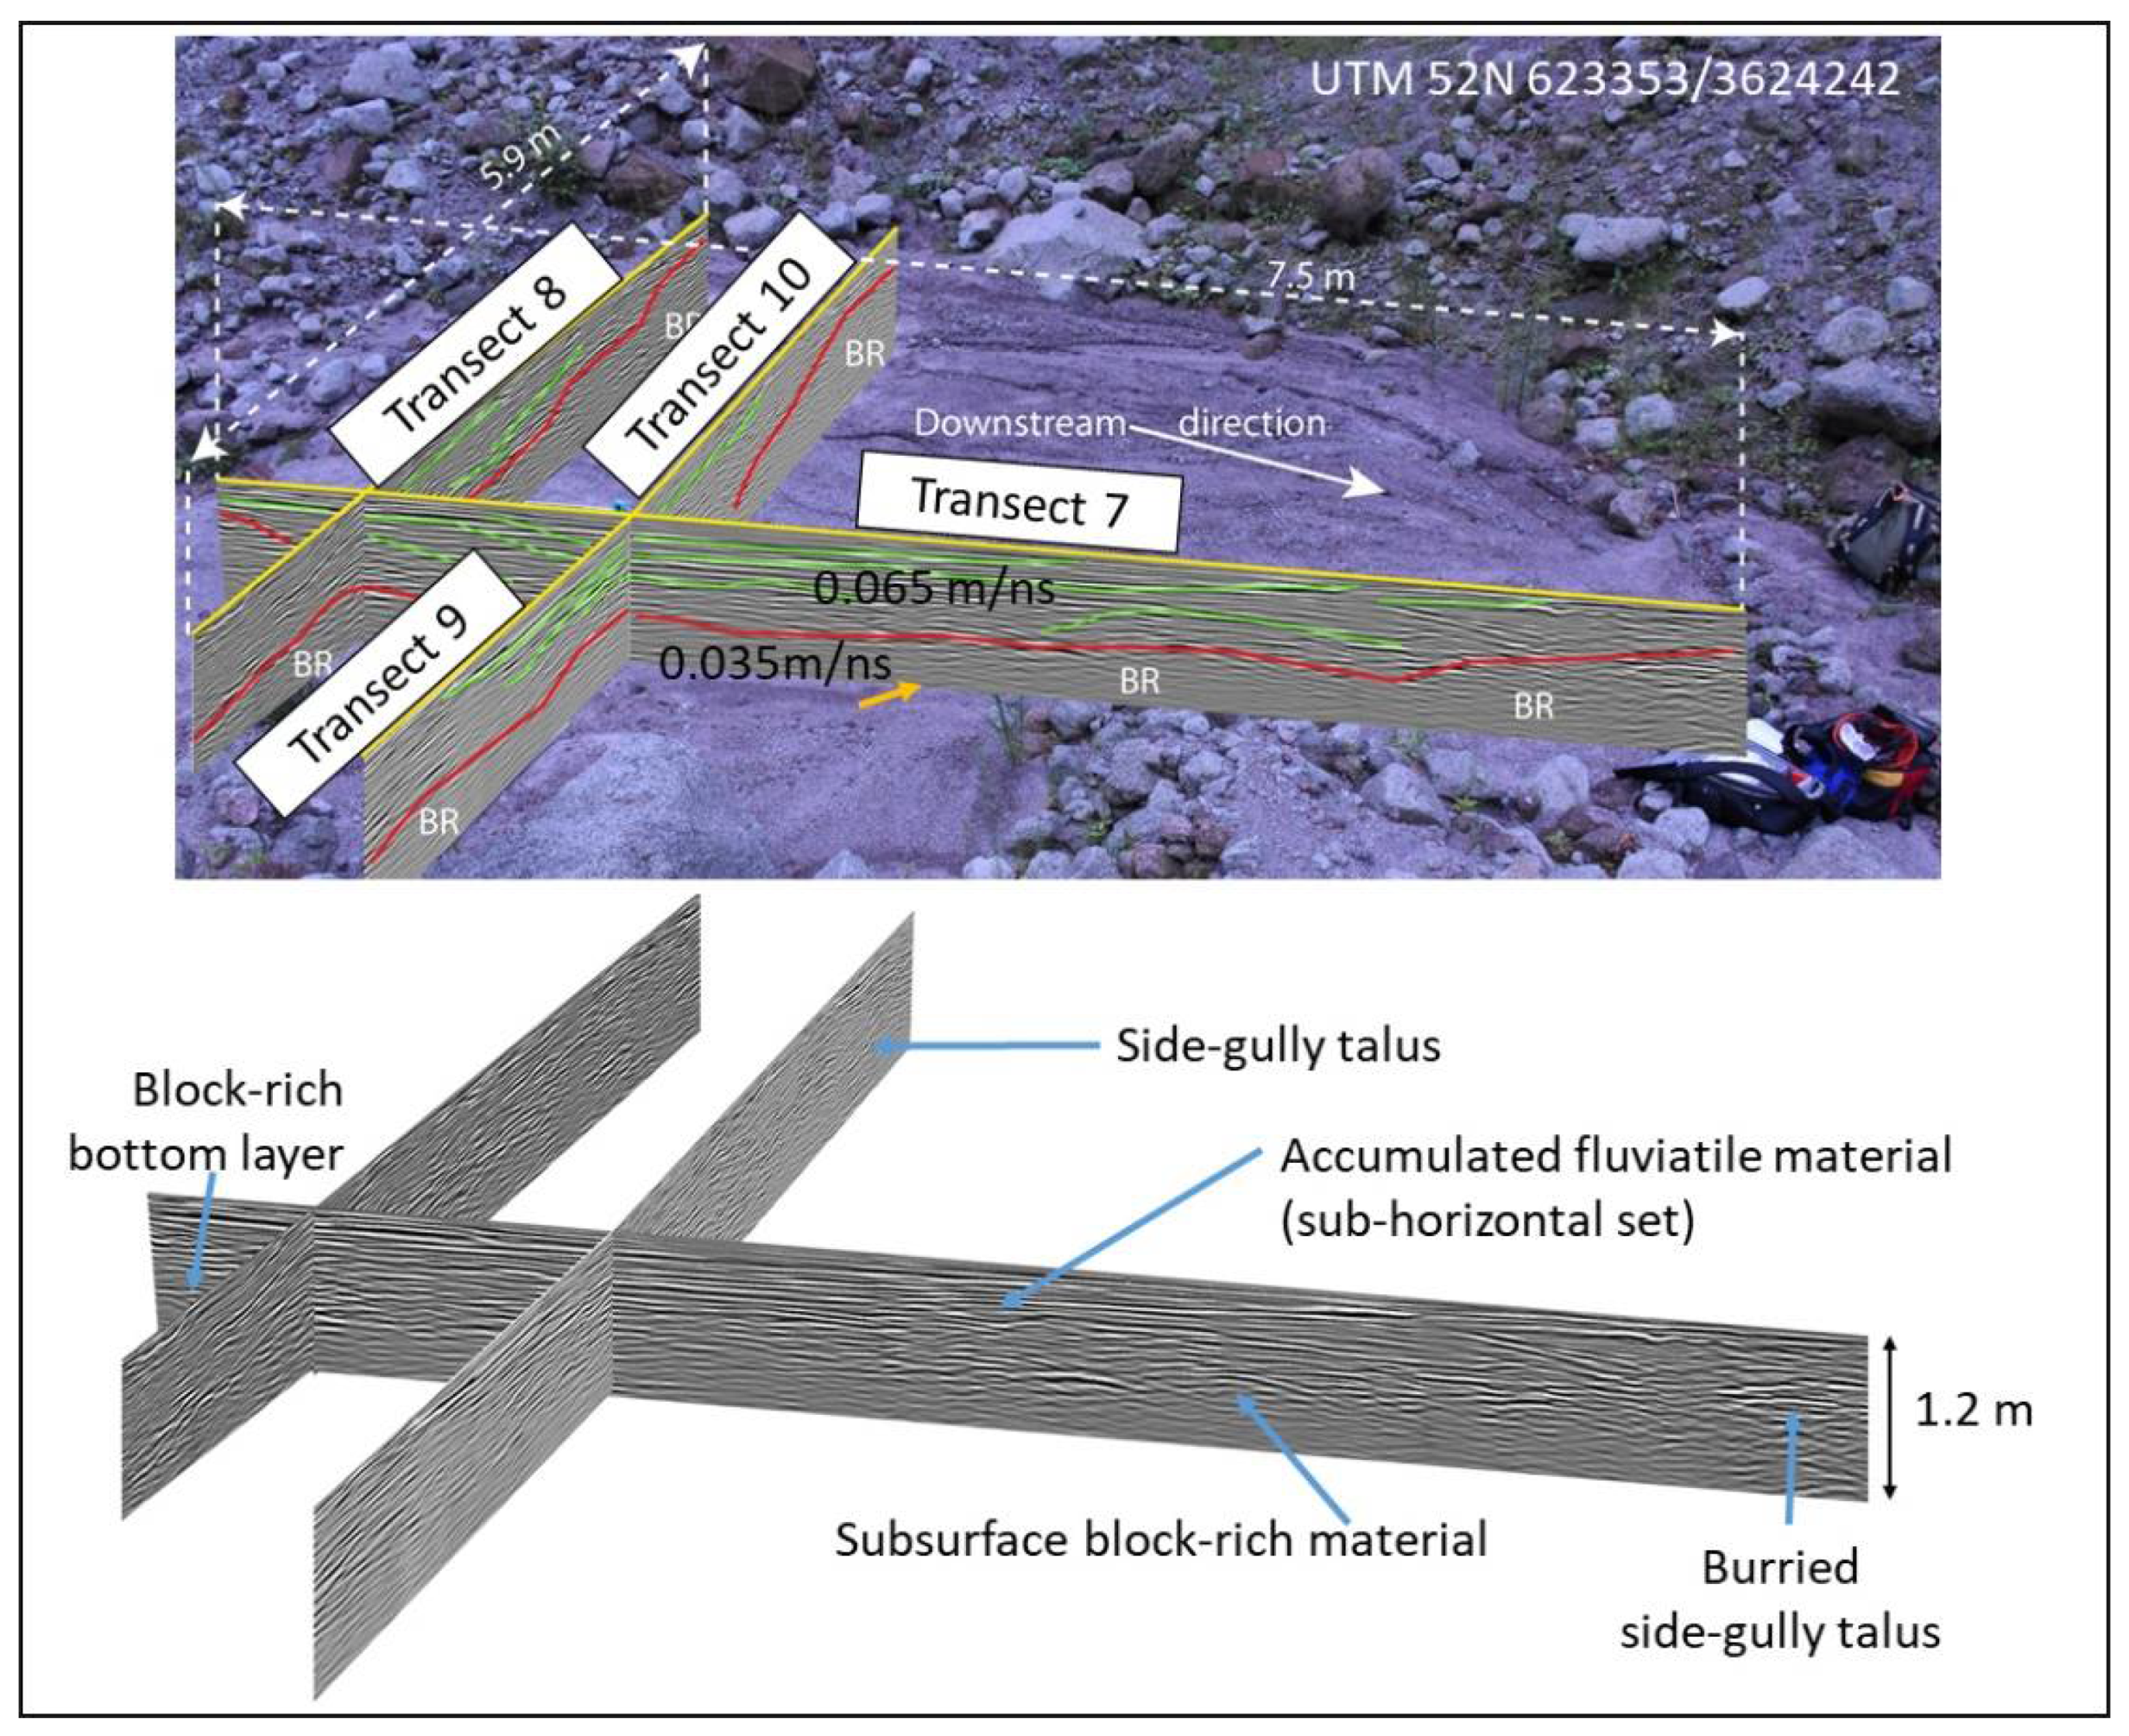
3.6. The Subsurface Structure of the Gully Floor from GPR

The geometry of the gully is changing and so is the material that makes it. The topographical analysis showed areas of erosion, but an overall stability of the gully. We thus investigated with GPR three different locations, two where the topography was stable during the 2004–2018 period and one where a temporary dam created by a wall collapse has raised the gully floor level locally, creating a topographic “step”, where finer sediments have accumulated.
The first “stable” location is located at the lower end of the studied gully. The deposit structure (Figure 12) near the check dam shows a set of units with a weak structure and delineated by a strong reflectivity layer, signaling a difference between the material on the left side of the wedge (from 0 to 20 m on the first radargram of Figure 12) and the rest of the deposited material. Underneath 2 m depth, sub-horizontal layers rich in blocks dominate the lower part, while a set of layers with a series of overlapping layers is located between 0 and 2 m depth. The layers have been numbered based on the deposition sequence (1 to 10 on Figure 12). Layer 1 is a bulk of blocks without structure that lies against the wedge with what was interpreted to be of anthropogenic origin. Upstream, layers 2, 3 and 4 are the connection with the lower unit. Then, located on top of these units, layers 8 to 10 show a downstream prograding pattern, which has the typical morphology of a foreset. On top of this last set of units, a number of short sub-horizontal layers can be found.
At the second location, there has been no human influence in the gully and all the structures visible are the result of natural processes. The two transects collected at UTM52 623163/3624407 have a total length of 48 m along the central line of the Gokurakudani gully. In these two transects, the units are not showing the prograding layers found downstream (Figure 12), the layer structure is restricted and the density of blocks (B in Figure 12 and Figure 13) is preponderant. Large blocks have been marked on the interpretative side of Figure 13, but the vast majority can be seen from the radargrams themselves. These gully floor features are toped in the first few 10 s of centimeters by finer units with blocks less than >1 m depth. To these unstructured deposits, the local sandy material deposited upstream of temporary dams generated by the side gullies collapsing in the gully shows an important contrast. The internal structure shows a set of thin sub-horizontal layers made of sand and coarse sands (samples D04, D05 and D06 in Figure 11). The velocity in the upper part of the material is approximately 0.065 m/ns and 0.035 m/ns in the lower part of the material, richer in blocks.
At the third location, the authors collected a series of transects (transects 7 to 10 in Figure 14), from a “pool” of sandy sediments, which were trapped upstream of a temporary dam created by a small wall collapse, which barred the gully. The radargram shows two sets of layers, one with velocities of 0.065 m/ns and one at 0.035 m/ns (Figure 14). The unit near the surface is deeper in the center of the gully and it thins outwards towards the gully wall. The limit between the two layers connects to the topography of the side wall collapses, showing that the side wall collapse surface continues underneath the horizontal layer deposited over it. Although the top layer is characterized by a set of horizontal layers, with little hyperbolae, showing only a few blocks, the layer underneath is more chaotic, with numerous hyperbolae showing blocks and sets of less elongated units.

4. Discussion

4.1. Topographic Change over Time

In the aftermath of the 1990–1995 eruption of Unzen volcano, material accumulated several tens of meters thick [45], and in this material, the Gokurakudani gully has been eroding vertically, developing an incision mostly 10–20 m deep with steep side walls (in the upper part of the gully, the wall was measured to be 40 m high locally in 2021). During the period 2005–2008, the connection between the upper part of the proto-gully (linked to the dome) and the main gully occurred via regressive erosion. While increasing its length and by then the surface of its watershed, the gully has also been carving its bed vertically and the gully is at present meeting with the pre-eruptive topography at a few locations along the gully [4,46]. It has also been shown in [4] that the tributary gullies were capturing varying portions of the watershed over time, further modifying the amount of water being transferred to the gully and also the location where the water is being conveyed to the main gully. As the gully is becoming deeper, reaching pre-1990–1995 eruption material, the pre-eruptive material located underneath the gully floor has emerged at a few locations, and they provide some general stability, although immediately downstream of the erosion-resistant pre-1990–1995 eruption material, an erosion step can often be found.
In comparison with other volcanoes, however, it is difficult to determine whether this evolution will be representative or marginal. Indeed, compared with lahars reaching more than 10 km at Casita volcano [54] or 20 to 30 km at Merapi Volcano [55], the lahars and the place where they are supposed to occur is more modest (Tsunetaka et al., 2021), and the observed processes and the role of the secondary processes may only be typical of “end of life” lahar gullies.

4.2. Grain Size of Different Features in the Gully

The grain size analysis has shown that the gully is not only changing in shape, but also in composition. As the walls are oozing fine material due to slow differentiation of the material, the longer the timespans, the coarser the material becomes. This means that the same deposit, which may seem homogeneous, may actually evolve very differently depending on the topography it is associated with.
Similar lahar deposit variability within one single lahar unit has also been shown by Vazquez et al. [56] (cf. Figure 12). The authors have demonstrated that sediment statistical parameters can vary within one single deposit, and the representativity of sediment grain-size analysis is essential to ponder. Grain size provides an appraisal of a deposit, but not a “full picture”, and this spatial variability may further evolve over time, with a change in the composition, which must be typical of coarse unconsolidated deposits. Indeed, as the skeleton of the sediment structure is holding the general shape of the deposit, fine fractions in between may not—for a given concentration—play any role in this skeleton. They can then leave the deposit, without any change in the topography. It is just changing the density of the deposit.

4.3. Subsurface Structure: Multiple Processes

The ground penetrating radar data show, at the two lower locations, typical sub-horizontal units with terminal overlapping units. A set of units below 100–120 cm deep shows higher relative dielectric permittivity data and reflectors, suggesting that finer material or material with higher moisture contents (and thus with finer grain size) must be present, as has been demonstrated from GPR at other similar volcanoes, in lahar deposits of Semeru volcano [31] and at Merapi volcano in pyroclastic flow deposits [39,40]. At the upstream location, however, a set of horizontal fine-bedded units with fewer blocks, trapped upstream of a local natural dam generated by a wall collapse, show that the general pattern can be broken. More importantly, the finer material thin units, which are semi-horizontal, cannot be directly related to the wall collapse nor to lahars, and this confirms the fact that water is transporting sediments in between lahars, being, with wall collapses and side gully connections, another set of processes occurring in the gully.
Put in perspective, due to the oozing of drapes from the pyroclastic walls, the fine material is thus being exported from the gully, and only coarser material remains, and this secondary process is in turn making the triggering of the lahar more difficult (it is difficult to raise the pore pressure leading to material liquefaction if the pores are very coarse). This oozing process is also a reason for the low popularity of this theory among traditional geologists and sedimentologists. Indeed, as those processes occur, one can start to wonder what is being measured and calculated from outcrops several thousands of years later. Unless the material is welded or fully consolidated during the deposition process, it is most likely that any interpretation (as I have done myself) is biased.

5. Conclusions

The present volcanic geomorphology study at Unzen volcano has demonstrated that:
(1)
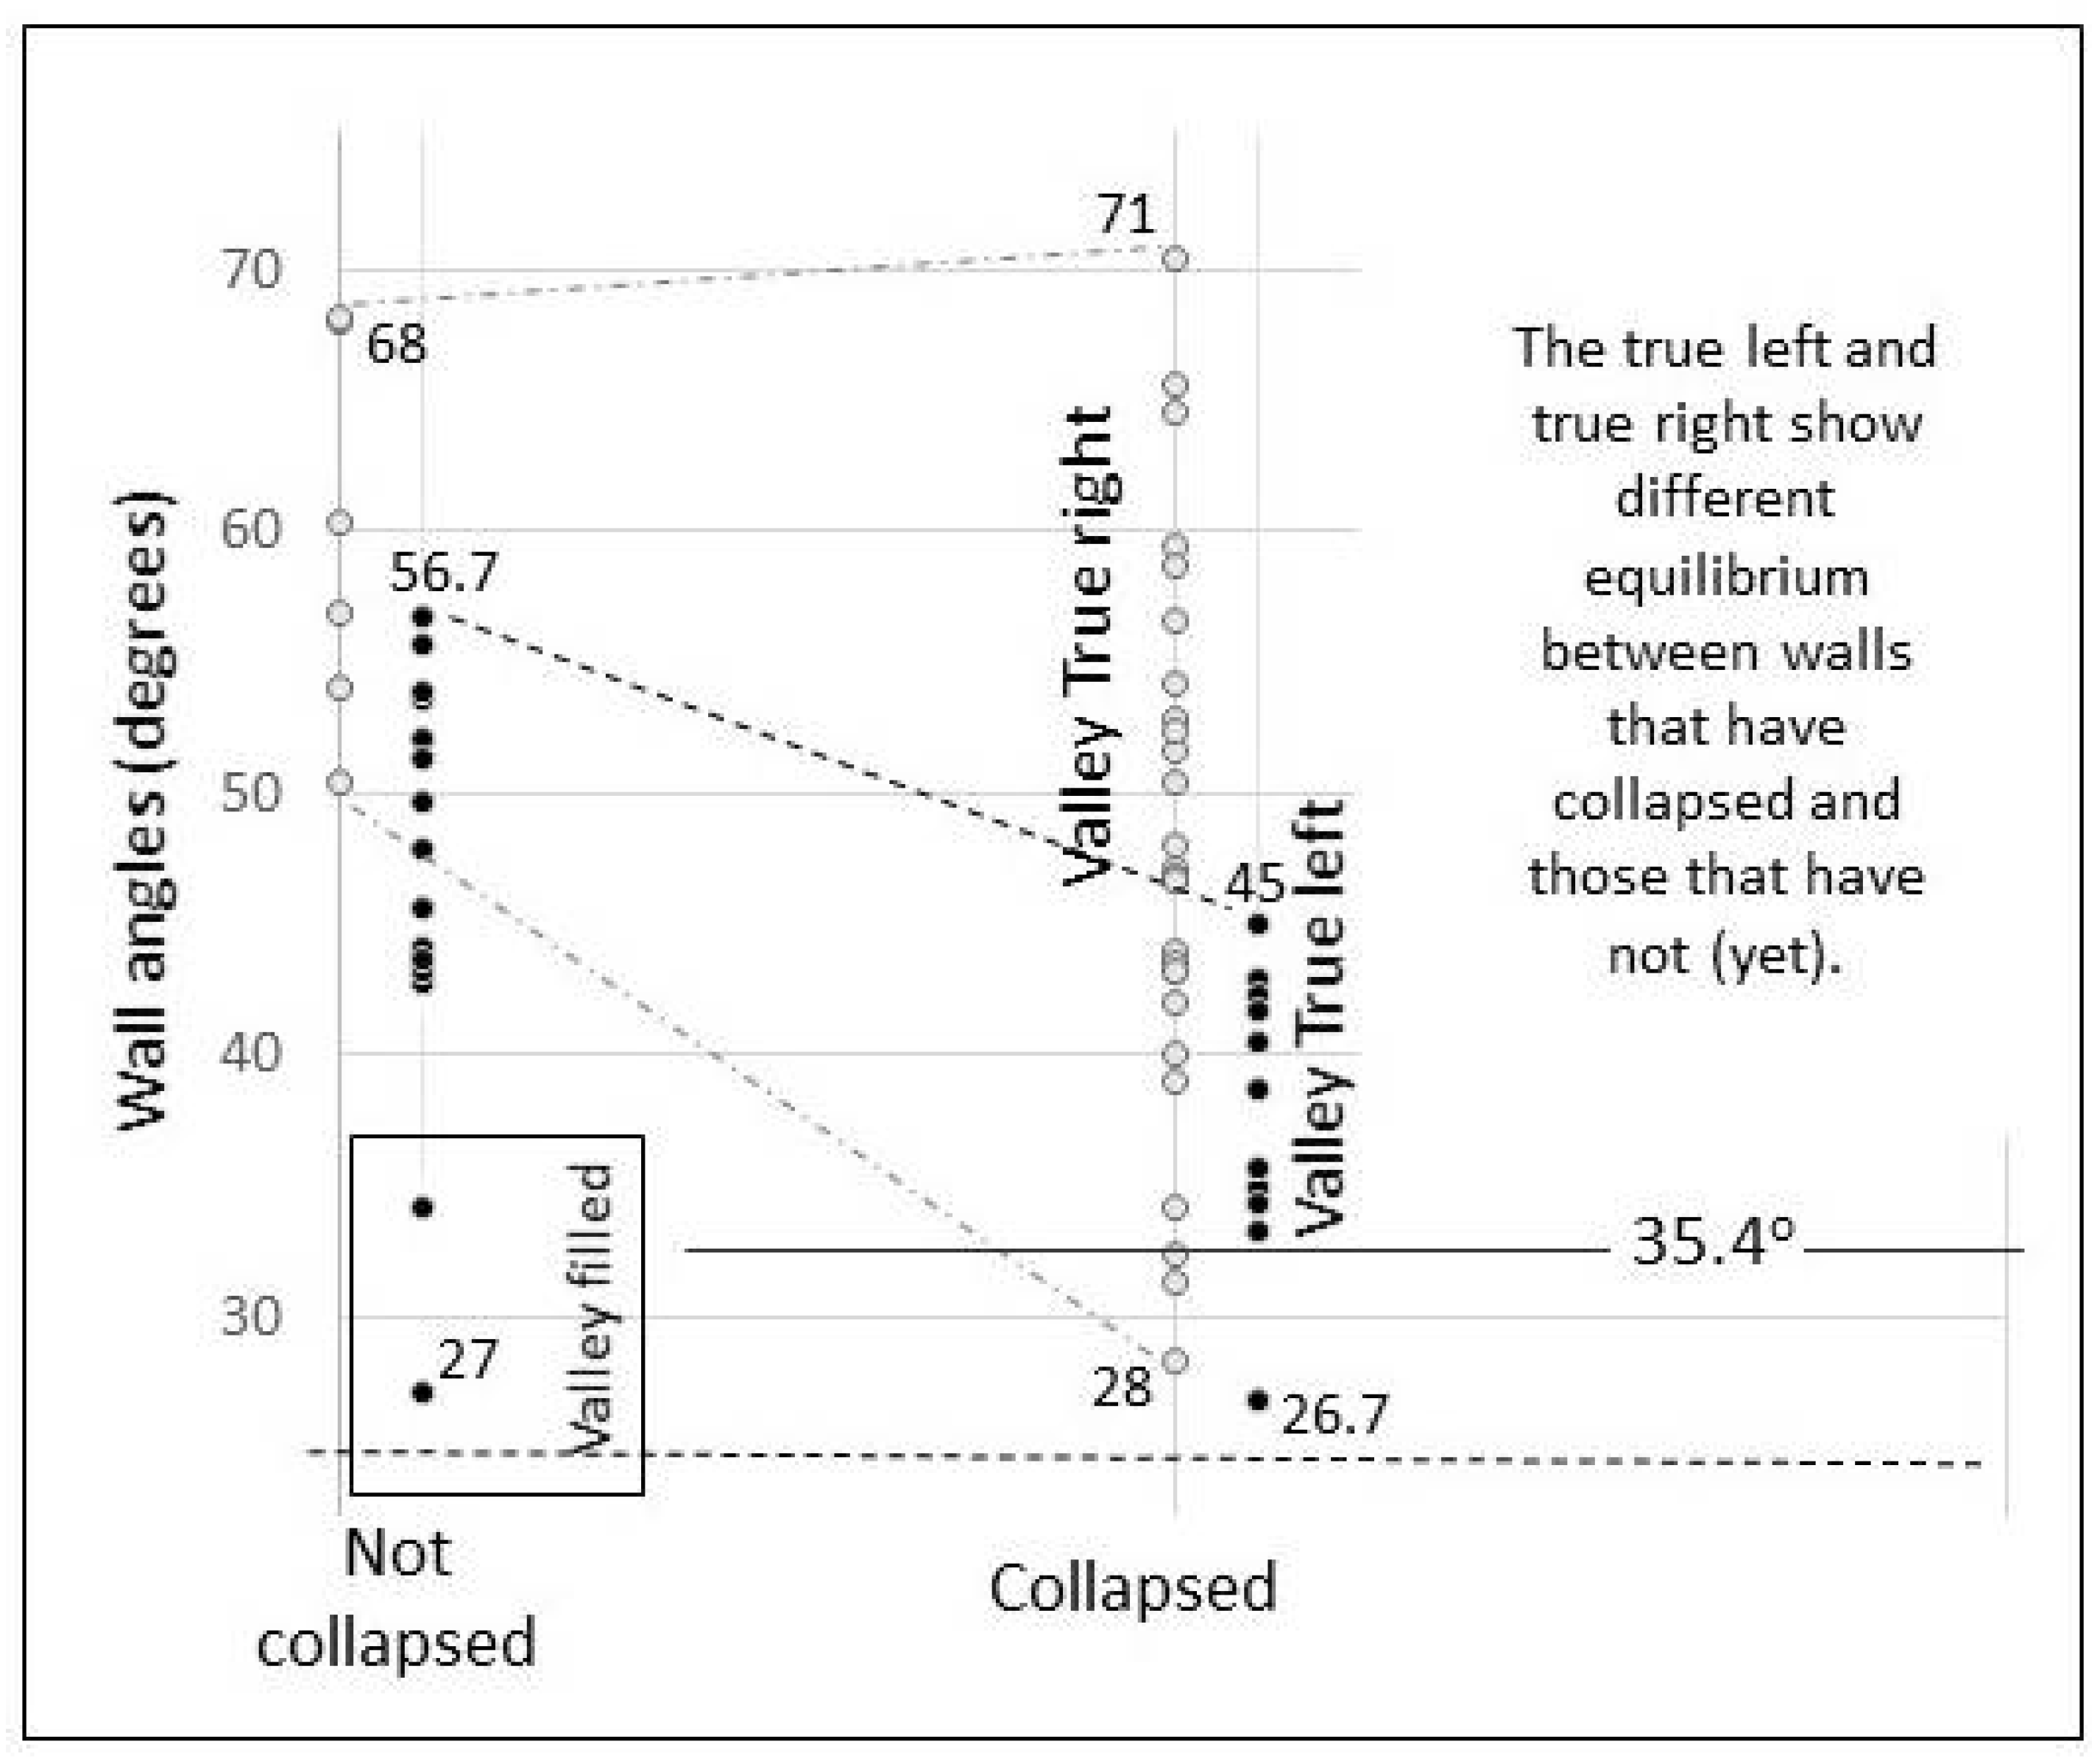
The left and right walls of the Gokurakudani gully evolve at different rates and that the collapsed profiles and maximum sustained slope angles vary by more than 20 degrees. This difference corresponds to layers in the pyroclastic density current deposits either tilting towards the gully or away from it.
(2)
The longitudinal profile is overall close to an equilibrium profile, but there is an alternation of stable and of erosive and deposit-dominated zones. These patterns have appeared over time, when the erosion of the material from the last eruption let pre-eruptive rocks emerge.
(3)
Underneath the surface, the ground penetrating radar confirmed the fact that the gully is undergoing periods of erosion and eventually deposition in the same location. Underneath the present valley floor, there is evidence of gully wall collapses in the valley, which were then filled up. Even if the gully has been eroded during the last 20 years following the eruption, it however does not mean that it is a purely erosive process. Episodes of deposition also occurred. Methodologically, this has implications on the representativity of two sets of LiDAR data taken over time and compared against one another. Any erosion rate calculated from such datasets would not represent the full extent of erosion, and it might be necessary to complete the topographic data with subsurface geophysical investigation.
(4)
On top of the spatial variability (vertical and horizontal), there is a temporal variability in the material as well. Indeed, as the pyroclastic density current deposits are oozing the fine fraction out, and so without changing the surface topography, it means that (1) over time, there is less fine material available in the gully (notably to trigger lahars) and (2) “precise” grain-size analysis, which is often a pillar in geomorphology or sedimentology, is not a reliable parameter. In other words, the same pyroclastic density current may have a very different grain size distribution at an outcrop, depending on the time at which scientists go and sample it. Even if the deposit does not show any sign of erosion, in the case of unconsolidated coarse and mixed grain deposits, outcrop analysis cannot be performed as scientists would do for fluviatile or estuary data for instance.
Overall, volcanic eruption simplifies the processes occurring on volcanic structures for a period of a decade or so, eventually starting from pyroclastic density currents and then turning towards lahar processes, before the rhythm (frequency + amplitude + coupling with other processes + “non-frequenciable” processes) progressively changes, leaving some space for secondary sedimentary processes to come and play a role in shaping volcanic morphology (Newtonian flows, wall erosion and grain size distribution transformation). Those processes, in turn, are not linear either, and accounting for their complexity is essential to provide an exact picture of the geomorphologic processes occurring on volcanoes. This issue is particularly true because scientists have developed increasingly precise instruments to measure topography notably, but the paradigms that drive them are still the same as the previous generation of researchers, and the assumptions made at a broad scale do not actually stand anymore at a finer scale.

Author Contributions

Conceptualization: all authors (H.T., N.H., B.B.) contributed through various discussions in the lab and in the field, as well as field data acquisition; methodology, C.G.; investigation, all participated.; original draft preparation and writing C.G.; project administration, Y.S. (Yuichi Sakai); funding acquisition, Y.S. (Yoshinori Shinohara) All authors have read and agreed to the published version of the manuscript.

Funding

The research was supported by a grant from the Ministry of Land, Infrastructure, Transport and Tourism, Japan. The Unzen Restoration Work Office kindly provided topographic data prior to the field period of 2016 onwards.

Institutional Review Board Statement

Not Applicable.

Informed Consent Statement

Not Applicable.

Data Availability Statement

Data can be provided upon reasonable request.

Conflicts of Interest

The authors declare no conflict of interest.

References

  1. Gilbert, G.K. The convexity of hilltops. J. Geol. 1909, 17, 344–350. [Google Scholar] [CrossRef] [Green Version]
  2. Roering, J.J. How well can hillslope evolution models “explain topography? Simulating soil transport and production with high-resolution topographic data. GSA Bull. 2008, 120, 1248–1262. [Google Scholar] [CrossRef]
  3. Lavigne, F.; Thouret, J.-C. Lahars at Merapi Volcano, Central Java: An Overview. J. Volcanol. Geotherm. Res. 2000, 100, 423–456. [Google Scholar] [CrossRef]
  4. Tsunetaka, H.; Shinohara, H.; Hotta, N.; Gomez, C.; Sakai, Y. Multi-decadal changes in the relationships between rainfall characteristics and debris-flow occurrences in response to gully evolution after the 1990–1995 Mount Unzen eruptions. Earth Surf. Process. 2021, 46, 2141–2162. [Google Scholar] [CrossRef]
  5. Hadmoko, D.S.; de Belizal, E.; Mutaqin, B.W.; Dipayana, G.A.; MArfai, M.A.; Lavigne, F.; Sartohadi, J.; Worosuprojo, S.; Starheim, C.A.; Gomez, C. Post-eruptive lahars at Kali Putih following the 2010 eruption of Merapi volcano, Indoensia: Occurrences and impacts. Nat. Hazards 2018, 94, 419–444. [Google Scholar] [CrossRef]
  6. Thierry, P.; Jousset, P.; Boichu, M.; Surono, B.F.; Bignami, C.; Lavigne, F.; Picquout, A.; Le Cozanet, G.; Jenkins, S.; Berger, J.; et al. Merapi Volcano 2010 Crisis: A Case Study for Implementing the FP7 MIAVITA European Project; Geoscience Union General Assembly: Vienna, Austria, 2011. [Google Scholar]
  7. De Belizal, E.; Lavigne, F.; Hadmoko, D.S.; Degeai, J.-P.; Dipayana, G.A.; Mutaqin, B.W.; Marfai, M.A.; Coquet, M.; Le Mauff, B.; Robin, A.-K.; et al. Rain-triggered lahars following the 2010 eruption of Merapi volcano, Indonesia: A major risk. J. Volcanol. Geotherm. Res. 2013, 261, 330–347. [Google Scholar] [CrossRef]
  8. Scott, W.E.; Hoblitt, R.P.; Torres, R.C.; Slef, S.; Martinez, M.M.L.; Nillos, T. Pyroclastic Flows of the 15 June 1991 Claimactic Eruption of Mt. Pinatubo. In Fire and Mud, Eruptions and Lahars of Mt. Pinatubo, Phillipines; Newhall, C.G., Punongbayan, R.S., Eds.; University of Washington Press: Washington, DC, USA, 1996; pp. 545–570. [Google Scholar]
  9. Van Westen, C.J.; Daag, A.S. Analysing the relation between rainfall characteristics and lahar activity at Mount Pinatubo, Philippines. Earth Surf. Process. 2005, 30, 1663–1674. [Google Scholar] [CrossRef]
  10. Dinehart, R.L. Sediment Transport at Gaging Stations near Mt. St Helens, Washington, 1980–1990, Data Collection and Analysis; US Geological Survey: Denver, CO, USA, 1998; Volume 1573, 111p.
  11. Gonda, Y.; Miyata, S.; Fujita, M.; Legono, D.; Tsutsumi, D. Temporal Changes in Runoff Characteristics of Lahars After the 1984 Eruption of Mt. Merapi, Indonesia. J. Disaster Res. 2019, 14, 61–68. [Google Scholar] [CrossRef]
  12. Major, J.J.; Pierson, T.C.; Dinehart, R.L.; Costa, J.E. Sediment yield following severe volcanic disturbance—A two-decade perspective from Mount St Helens. Geology 2000, 28, 819–822. [Google Scholar] [CrossRef]
  13. Suwa, H.; Okuda, S. Deposition of debris flows on a fan surface, Mt. Yakedake, Japan. Z Geomorphol. Sup. 1983, 46, 79–101. [Google Scholar]
  14. Lavigne, F.; Suwa, H. Contrasts between debris-flows, hyperconcentrated flows and stream flows at a channel of Mount Semeru, East Java, Indonesia. Geomorphology 2004, 61, 41–58. [Google Scholar] [CrossRef]
  15. Puyraveau, R.-A.; Rad, S.; Basile-Doelsch, I.; Deparis, J.; Jaouen, T.; Nehlig, P. Mayotte Critical Zone Observatory: Preliminary Results on Chemical Weathering and Erosion Rates on Volcanic Edifices. Procedia Earth Planet. Sci. 2014, 10, 73–76. [Google Scholar] [CrossRef]
  16. Bablon, M.; Quidelleur, X.; Samaniego, P.; Le Pennec, J.-L.; Lahitte, P.; Liorzou, C.; Bustillos, J.E.; Hidalgo, S. Eruptive chronology of Tungurahua volcano (Ecuador) revisited based on new K/Ar ages and geomorphological reconstructions. J. Volcanol. Geotherm. Res. 2018, 357, 378–398. [Google Scholar] [CrossRef]
  17. Samaniego, P.; Martin, H.; Monzier, M.; Robin, C.; Fornari, M.; Eissen, J.-P.; Cotton, J. Temporal evolution of magmatism in the Northern Volcanic Zone of the Andes: The geology and petrology of Cayambe Volcanic Complex (Ecuador). J. Petrol. 2005, 46, 2225–2252. [Google Scholar] [CrossRef] [Green Version]
  18. Hayakawa, Y.S.; Yokoyama, S.; Matsukura, Y. Erosion rates of waterfalls in post-volcanic fluvial systems around Aso volcano, southwestern Japan. Earth Surf. Process. 2008, 33, 801–812. [Google Scholar] [CrossRef]
  19. Hayakawa, Y.S.; Obanawa, H.; Matsukura, Y. Post-volcanic erosion rates of Shomyo falls in Tateyama, Central Japan. Geogr. Ann. A 2007, 90, 65–74. [Google Scholar] [CrossRef]
  20. Fontes, J.C.; Pereira, L.S.; Smith, R.E. Runoff and erosion in volcanic soils of Azores: Simulation with OPUS. Catena 2004, 56, 199–212. [Google Scholar] [CrossRef]
  21. Escher, B.G. On the Hot ‘Lahar’ (Mud Flow) of the Valley of the Ten Thousand Smokes (Alaska); van Wetenschappen, K.A., Ed.; Koninklijke Akademie van Wetenschappen: Amsterdam, The Netherlands, 1922; Volume 24, pp. 282–293. [Google Scholar]
  22. Pierson, T.C. Flow characteristics of large eruption-triggered debris flows at snow-clad volcanoes: Constraints for debris-flow models. J. Volcanol. Geotherm. Res. 1995, 66, 283–294. [Google Scholar] [CrossRef]
  23. Smith, G.A.; Fritz, W.J. Volcanic influences on terrestrial sedimentation. Geology 1989, 17, 375–376. [Google Scholar] [CrossRef]
  24. Vallance, J.W. Lahars. In Encyclopedia of Volcanoes; Sigurdsson, H., Houghton, B., McNutt, S.R., Rymer, H., Stix, J., Eds.; San Diego Academic Press: San Diego, CA, USA, 2000; pp. 601–616. [Google Scholar]
  25. Starheim, C.; Gomez, C.; Davies, T.; Lavigne, F.; Wassmer, P. In-flow evolution of lahar deposits from video-imagery with implications for post-event deposit interpretation, Mount Semeru, Indonesia. J. Volcanol. Geotherm. Res. 2013, 256, 96–104. [Google Scholar] [CrossRef]
  26. Scott, K.M. Origins, Behavior, and Sedimentology of Lahars and Lahar-Runout Flows in the Toutle Cowlitz River System; US Geological Survey: Reston, VA, USA, 1988; Volume 1447-A, 83p.
  27. Vallance, J.W.; Iverson, R.M. Chapter 37—Lahars and Their Deposits. In Encyclopedia of Volcanoes, 2nd ed.; Sigurdsson, H., Ed.; Academic Press: Cambridge, MA, USA, 2015; Volume 649, p. 664. [Google Scholar]
  28. Smith, G.A.; Lowe, D.R. Lahars: Volcano-hydrologic events and deposition in the debris flow-hyperconcentrated flow continuum. In Sedimentation in Volcanic Setting; Fisher, R.V., Smiths, G.A., Eds.; SEPM Special Publication: Tulsa, OK, USA, 1991; Volume 45, pp. 59–70. [Google Scholar]
  29. Pierson, T.C.; Costa, J.E. A rheologic classification of subaerial sediment-water flow. Geol. Soc. Am. Rev. Eng. Geol. 1987, 7, 1–12. [Google Scholar]
  30. Pierson, T.C.; Scott, K.M. Downstream dilution of a lahar, transition from debris flow to hyperconcentrated streamflow. Water Resour. Res. 1985, 21, 1511–1524. [Google Scholar] [CrossRef]
  31. Gomez, C.; Lavigne, F. Transverse architecture of lahar terraces, inferred from radargrams: Preliminary results from Semeru Volcano, Indonesia. Earth Surf. Process. 2010, 35, 1116–1121. [Google Scholar] [CrossRef]
  32. Lavigne, F.; Thouret, J.-C. Les lahars, depots, occurrence et dynamique: Une revue des ecoulements volcano-hydrologiques. BSGF-EARTH SCI B 2000, 171, 545–558. (In French) [Google Scholar] [CrossRef]
  33. Arguden, A.T.; Rodolfo, K.S. Sedimentologic and dynamic differences between hot and cold laharic debris flows of Mayon Volcano, Philippines. GSA Bull. 1990, 102, 865–876. [Google Scholar] [CrossRef]
  34. Miyabuchi, Y. Deposits associated with the 1990–1995 eruption of Unzen volcano, Japan. J. Volcanol. Geotherm. Res. 1999, 89, 139–158. [Google Scholar] [CrossRef]
  35. Procter, J.N.; Cronin, S.J.; Zernack, A.V.; Lube, G.; Stewart, R.B.; Nemeth, K.; Keys, H. Debris flow evolution and the activation of an explosive hydrothermal system. J. Volcanol. Geotherm. Res. 2014, 286, 303–316. [Google Scholar] [CrossRef]
  36. Capra, L.; Borselli, L.; Varley, N.; Gavilanes-Ruiz, J.C.; Norini, G.; Sarocchi, D.; Caballero, L.; Cortes, A. Rainfall-triggered lahars at Volcan de Colima, Mexico: Surface hydro-repellency as initiation process. J. Volcanol. Geotherm. Res. 2010, 189, 105–117. [Google Scholar] [CrossRef]
  37. Vazquez, R.; Capra, L.; Coviello, V. Factors controlling erosion/deposition phenomena related to lahars at Volcan de Colima, Mexico. Nat. Hazards Earth Syst. Sci. 2016, 16, 1881–1895. [Google Scholar] [CrossRef] [Green Version]
  38. Gertisser, R.; Cassidy, N.J.; Charbonnier, S.J.; Nuzzo, L.; Preece, K. Overbank block-and-ash flow deposits and the impact of valley-derived, unconfined flows on populated areas at Merapi volcano, Java, Indonesia. Nat. Hazards 2012, 60, 623–648. [Google Scholar] [CrossRef]
  39. Gomez, C.; Lavigne, F.; Lespinasse, N.; Hadmoko, D.S.; Wassmer, P. Longitudinal structure of pyroclastic-flow deposits, revealed by GPR survey, at Merapi Volcano, Java, Indonesia. J. Volcanol. Geotherm. Res. 2008, 176, 439–447. [Google Scholar] [CrossRef]
  40. Gomez, C.; Lavigne, F.; Hadmoko, D.S.; Lespinasse, N.; Wassmer, P. Block-and-ash flow deposition: A conceptual model from a GPR survey on pyroclastic-flow deposits at Merapi Volcano, Indonesia. Geomorphology 2009, 110, 118–127. [Google Scholar] [CrossRef]
  41. Gomez, C.; Lavigne, F.; Hadmoko, S.D.; Wassmer, P. Insights into lahar deposition processes in the Curah Lengkong (Semeru Volcano, Indonesia) using photogrammetry-based geospatial analysis, near-surface geophysics and CFD modelling. J. Volcanol. Geotherm. Res. 2018, 353, 102–113. [Google Scholar] [CrossRef]
  42. Ettinger, S.; Manville, V.; Kruse, S.; Paris, R. GPR-derived architecture of a lahar-generated fan at Cotopaxi, Ecuador. Geomorphology 2014, 213, 225–239. [Google Scholar] [CrossRef]
  43. Watanabe, K.; Hoshizumi, H. Geological Map of Unzen Volcano. 1/25,000 Map; Geological Survey of Japan: Tsukuba, Japan, 1995.
  44. Nakada, S.; Shimizu, H.; Ohta, K. Overview of the 1990–1995 eruption at Unzen Volcano. J. Volcanol. Geotherm. Res. 1999, 89, 1–22. [Google Scholar] [CrossRef]
  45. Gomez, C.; Wassmer, P. Evolution of the Unzen Volcano and the Shimabara Peninsula (Japan) during the last 60 years: The role of the 1990–1995 eruption in modifying the landscape. Geomorphol. Relief Process. Environ. 2015, 21, 205–216. [Google Scholar] [CrossRef]
  46. Hirakawa, H.; Okano, K.; Ueno, T.; Tsutsumi, D.; Miyata, S.; Satofuka, Y. Topographical and geological characteristics of source areas of debris flows on hillslope coered with pyroclastic-flow deposits for 20 years after the eruption of Mt. Unzen. J. Jpn. Soc. Erosion. Control. Eng. 2018, 71, 12–20, (In Japanese with English Abstract). [Google Scholar]
  47. Gomez, C.; Hotta, N.; Shinohara, Y.; Sakai, Y.; Tsunetaka, H.; Yano, A.; Kitamoto, G.; Sakamoto, M. Understanding the Variations of Internal Sedimentary Structures and Material Characteristics using Ground Penetrating Radar. Jpn. Soc. Erosion. Control Eng. Annu. Meet. Proc. 2018, V-079, 209–210. [Google Scholar]
  48. Gomez, C.; Hotta, N.; Shinohara, Y.; Tsunetaka, H. Grain-size distribution change at Unzen volcano and impact on lahar triggering and flowage. Jpn. Soc. Eros. Control. Eng. Annu. Meet. Proc. 2019, TI-004, 17–18. [Google Scholar]
  49. Gomez, C. Digital photogrammetry and GIS-based analysis of the bio-geomorphological evolution of Sakurajima Volcano, diachronic analysis from 1947 to 2006. J. Volcanol. Geotherm. Res. 2014, 280, 1–13. [Google Scholar] [CrossRef]
  50. Gomez, C.; Hayakawa, Y.; Obanawa, H. A study of Japanese landscapes using structure from motion derived DSMs and DEMs based on historical aerial photographs: New opportunities for vegetation monitoring and diachronic geomorphology. Geomorphology 2015, 242, 11–20. [Google Scholar] [CrossRef] [Green Version]
  51. Westoby, M.J.; Brasington, J.; Glasser, N.F.; Hambrey, M.J.; Reynolds, J.M. ‘Structure-from-Motion’ photogrammetry: A low-cost, effective tool for geoscience application. Geomorphology 2012, 179, 300–314. [Google Scholar] [CrossRef] [Green Version]
  52. Folk, R.L. Petrology of Sedimentary Rocks; Hemphill’s Book Store: Austin, TX, USA, 1968; 170p. [Google Scholar]
  53. Jol, H.M. Ground Penetrating Radar: Theory and Applications; Elsevier Science Publishing: Amsterdam, The Netherlands, 2009; 508p. [Google Scholar]
  54. Scott, K.M.; Vallance, J.W.; Kerle, N.; Macias, J.-L.; Strauch, W.; Devoli, G. Catastrophic precipitation-triggered lahar at Casita volcano, Nicaragua: Occurrence, bulking and transformation. Earth Surf. Process. 2005, 30, 59–79. [Google Scholar] [CrossRef]
  55. Furuya, T. Geomorphology of Merapi volcano; Volcanic Sabo Technical Centre & Japan International Cooperation Agency, Sabo Tech. Centre Report: Yogyakarta, Indian, 1989; 24p.
  56. Vazquez, R.; Capra, L.; Caballero, L.; Arambula-Mendoza, R.; Reyes-Davila, G. The anatomy of a lahar: Deciphering the 15th September 2012 lahar at Volcan de Colima, Mexico. J. Volcanol. Geotherm. Res. 2014, 272, 126–136. [Google Scholar] [CrossRef]
Figure 1. Location map of Unzen volcano (Kyushu, South Japan). (A) Zoom on the location, (B) zoom on the east coast of the Shimabara Peninsula where Unzen Fugendake is located, and (C) position of Gokurakudani where this research was conducted, next to the Tansandani gully. The vegetation density separates the surfaces that existed before the eruption (densely vegetated) from the new surfaces, with either no vegetation or sparse vegetation. To the south of the orthophotographs, a portion of the check dams system (SabSabo dam types) can also be observed.
Geosciences 11 00457 g001
Figure 2. The topography of Mount Unzen Fugendake from LiDAR data of 2016, with three topographic profiles starting from the last eruption dome (in red on the map). The topographic profile shows the steepness of the slopes and the hazard of a dome being partly supported by the loose material of the apron. On the map, (a) is the Tansandani gully, and (b) is the Gokurakudani gully.
Geosciences 11 00457 g002
Figure 3. Geological map of Mount Unzen after data from Watanabe and Hoshizumi [43]. The Volcanic apron and fan that starts at the present summit of Mt. Unzen and extends towards the east is trapped in the volcanic graben, in which the newest structure is sinking.
Geosciences 11 00457 g003
Figure 4. Surface evolution of the Gokurakudani gully between 2005 and 2016 measured from the orthophotographs generated from the DEMs. Please note that in 2005, parts of the gully are not fully connected as yet, so that their surfaces are virtually 0 m2.
Geosciences 11 00457 g004
Figure 5. Using the chronological aerial photographs from 2016 to 2018 to visually confirm the GIS numerical data, one can see that the increase in the surface areas of the active channel is largely controlled by the increase in size of the side gullies and valley collapses. The heads of the gullies progress outwards through regressive erosion during the investigated period (loc. 1, 3 and 4). Contrasting with those evolving areas, there are locations of stability, both on the planform and vertically.
Geosciences 11 00457 g005
Figure 6. Vertical rate of change of the valley floor of the Gokurakudani gully calculated between 2005 and 2016 (one will note the horizontal scale contraction between the map and the graphic).
Geosciences 11 00457 g006
Figure 7. Maximum slope for 60 transects across the left and right walls of the Gokurakudani, divided between collapsed walls and not collapsed walls from the DEM of year 2016.
Geosciences 11 00457 g007
Figure 8. Density and cumulated density distribution of the cross section areas. The mode distribution and the flattening of the mode show an increasingly homogeneous set of cross sections between 300 m2 and 500 m2. The cumulated density function also shows a diminution of the small cross section, with the lower inflection point moving from ~170 m2 to >250 m2. There is a progressive broadening of the gully’s cross sections.
Geosciences 11 00457 g008
Figure 9. Slopes of the pyroclastic surfaces and convergence and divergence to the Gokurakudani gully. The transects show the slopes outside the cross sections of the Gokurakudani gully, with either topography sloping away from or towards the valley, making any surface rainwater flow towards or away from the valley. (1) Pyroclastic flow directions as determined from visual striations of the surface; (2) locations where the topography converges towards the Gokurakudani gully; (3) locations where the topography diverges from the Gokurakudani gully; (4) limits of pyroclastic deposit lobes; (5) topographic flexure line on the pyroclastic flow deposit; (6) PeT as in pre-eruption topography. Underneath the map, the letters A to J refer to the starting points and end-points of each transect on the map.
Geosciences 11 00457 g009
Figure 10. Gokurakudani gully floor samples (UTM 52S 623353/3624242). Sample D01 was retrieved from a pseudo-terrace on the true right, made of a mixture of material without fabric, which can be attributed to a debris flow deposit. Sample D02 was retrieved from the valley floor, near the gully wall. Samples D03 and D07 were retrieved from small side gully debris cones with a gentle slope of 7.02 degrees. Samples D04 to D06 were all retrieved in the central part of the gully where the GPR transects 7, 8 and 9 were taken. Erosion features and the GPR transects show that the material has been deposited by Newtonian flow with a sub-horizontal layering.
Geosciences 11 00457 g010
Figure 11. Sample S08: drape over the ignimbrite deposit wall; sample S09 to S11: debris flow deposits near the first confluence with the Tansandani gully; sample S12: potential tail of the debris flow deposits sampled with S09 to S11; sample; S13: ignimbrites from the wall. This set of samples was collected in the vicinity of UTM52 623163/3624407 in the downstream area of the gully.
Geosciences 11 00457 g011
Figure 12. GPR data with the 800 Mhz and the 500 Mhz, retrieved at the downstream end of the gully, where the first check dam or Sabo dam bars the gully or valley (the upstream gully widens and becomes a valley near this location). The velocity of the signal ranges between 0.035 and 0.04 m/ns.
Geosciences 11 00457 g012
Figure 13. GPR transects 7, 8, 9 and 10 of the finer sediments trapped behind a side gully talus, creating a local zone of accumulation and a topographical step. On the two 3D diagrams, one can identify the top layers made of sands and coarse sands with subhorizontal internal structures, covering the talus slope and buried talus slope, in such a way that we know that the valley floor was at a lower level before being raised again. This is further evidence that the erosion of the gully is not a linear process.
Geosciences 11 00457 g013
Figure 14. Transects in the lower section of the Gokurakudani gully, just upstream of the confluence with the Tansandani.
Geosciences 11 00457 g014
Publisher’s Note: MDPI stays neutral with regard to jurisdictional claims in published maps and institutional affiliations.

