Article

Ultrasonic Shaking of Glauconite Pellets with Diverse Reagents for a Comparison of Their K–Ar with Already Published Rb–Sr Results

1
Institut des Sciences de la Terre et de l’Environnement, Université de Strasbourg (UdS/CNRS), 67084 Strasbourg, France
2
Department of Chemistry, Vrije Universiteit Brussel, BE-1050 Brussels, Belgium
3
Department of Geology, Faculty of Engineering, University of Istanbul-Cerrahpasa, Istanbul 34500, Turkey
*
Author to whom correspondence should be addressed.
Geosciences 2021, 11(11), 439; https://doi.org/10.3390/geosciences11110439
Submission received: 28 August 2021 / Revised: 13 October 2021 / Accepted: 18 October 2021 / Published: 25 October 2021
(This article belongs to the Section Geochemistry)

Abstract

:
A combined ultrasonic treatment, with de-ionized H2O, dilute HAc or dilute HCl, of three Mid-Miocene glauconite samples was applied to K–Ar date the different separates in order to compare the results with those obtained by the Rb–Sr method using the same three samples and that were analyzed strictly in the same way. Two aliquots yield opposite elemental and K–Ar trends, which suggests different initial mineral compositions for the various pellets. The K–Ar data of two untreated and leached L7 and L8 aliquots are almost within analytical uncertainty from 17.3 ± 0.6 Ma to 19.6 ± 0.7 Ma (2σ), while those of the third L10 sample are slightly higher at 22.1 ± 1.2 Ma (2σ). Comparatively, the earlier published Rb–Sr ages of the three untreated samples and of the leached aliquots gave similar data for the L7 aliquots by an isochron at 18.1 ± 3.1 (2σ) Ma and for the sample L8 by an isochron with an age of 19.6 ± 1.8 (2σ) Ma, while the untreated L10 aliquot yields a very high Rb–Sr date of 42.1 ± 1.6 (2σ) Ma. This untreated L10 glauconite fraction contains blödite, a Sr-rich carbonate that impacted the two isotopic systems differently. Generally, dilute HCl or HAc acids dissolve carbonates, sulfates, sulfites and oxides, while they do not affect the clay-type crystals such as glauconites. These soluble minerals can be identified indirectly, as here, by X-ray diffraction and the amounts of leached Na2O, CaO and Fe2O3 contents. Together with the leaching of some metallic trace elements, those of NaO confirm the leaching of metals and of blödite that are both hosted by the glauconite pellets. The occurrence of this Sr-enriched mineral explains the age differences of the non-treated aliquots and suggests a systematic leaching of any glauconite separate before isotope determination and, possibly, a comparison of the Rb–Sr and K–Ar results. Ultrasonic shaking appears appropriate for physical disaggregation of any contaminating grains that may remain hosted within the pellets, even after a preliminary H2O wash, which may dissolve and remove the soluble minerals but not the H2O-insoluble silicates. The K–Ar study completed here as a complement to a previous Rb–Sr study highlights, again, the importance of the preparation step in isotopic studies of glauconite-type and, by extension, of any clay material, as all occurring minerals can interfere in the final age determinations and, therefore, differently in the mineral assemblages. All those not in isotopic equilibrium need to be removed before analysis, including the soluble Sr or alkali-enriched ones.

1. Introduction

Because of their wide geographic and stratigraphic occurrence, authigenic glauconite minerals of various types of sediments have long been considered as reference materials for the calibration of time scale and were, therefore, studied in detail in many basic mineralogical and chemical studies and reviews e.g., [1,2,3]. In addition, since Cormier’s [4] pioneer Rb–Sr age dating of glauconites, many Rb–Sr and K–Ar dating studies were based on this mineral e.g., [5,6,7,8,9]. The 40Ar/39Ar method was also applied [10], even being considered as successful [11]. Expectedly, some of the published isotopic ages of glauconite separates were also questioned [12], especially because of the preparation methods due to the specific “granular” aspect of the target mineral. The systematic occurrence of agglomerated pellets often raised a concern about cleaning the intergrowths with the removal of potentially trapped detrital grains, which may explain why various preparation techniques were attempted. For instance, Odin and Hunziker [13] presented a preparation sequence of green aggregates based on leaching with dilute acetic acid combined with an ultrasonic treatment to remove any foreign particle, authigenic or detrital, from glauconite grains. Earlier, Pasteels et al. [6] and Keppens [14] chose dilute hydrochloric acid as the reagent, also with an ultrasonic shaking, whereas other authors preferred ammonium-acetate leaching without shaking e.g., [7,15]. In this context, Clauer et al. [16] examined isotopic data based on various preparation methods used by different investigators to focus on the most appropriate preparation. This survey demonstrated that the main reasons for analytical discrepancies were due to various separation and purification procedures of the clay types. Analytical aspects are precisely addressed here again by focusing more specifically on the ultrasonic shaking of glauconite separates strictly using the same procedure as Pasteels et al. [6] with the same reagents during the same shaking durations, and by comparing the K–Ar data obtained here with their Rb–Sr data published long ago.
While different types of reagents were extensively tested on illite particles, physical ultrasonic treatments combined with either dilute HCl or HAc were not used as often to clean glauconite pellets. In fact, detrital particles may adhere to or may even be included into growing glauconite pellets, which can bias the stratigraphic message that these green grains are expected to convey. In the present analytical context, the aim was also to complement a pioneering study on the topic by Pasteels et al. [6], by analyzing the chemical composition of strictly the same glauconite separates than these authors, and by applying K–Ar analyses on them before and after the same ultrasonic treatments.

2. Description of the Selected Samples and of the Analytical Procedure

Three samples located next to each other in a lenticular glauconite-rich horizon of Antwerp sands were collected from an access favored by a local road work along highway E3 near the city of Antwerp in Belgium [6]. The glauconite aggregates of these coarse sands were so enriched that pure separates were obtained by dry sieving followed by a magnetic separation. Independently to their stratigraphic dating by isotopic methods, the host Antwerp sands were considered to be Middle Miocene, based on descriptions of their calcareous nanoplancton (about 18 Ma referring to Berggren’s scale, [17]. The three untreated glauconite fractions were analyzed hereunder for their contents of major and trace elements, as well as for their K–Ar isotopic ages. Each sample was then split into several aliquots that were leached with different reagents and subjected to various ’ultrasonic treatments, as were those analyzed by Pasteels et al. [6]. De-ionized water, as well as ultra-pure 1.7N acetic acid and 1N hydrochloric acid, were used for the pre-analytical procedure (Table 1).
The major elements were analyzed on an inductively coupled plasma atomic emission spectrometer (ICP-AES) and the trace elements on an inductively coupled plasma mass spectrometer (ICP-MS), by following the procedure of Samuel et al. [18]. The analytical accuracy of the analyses was monitored by measuring known standard materials in between successive samples, which resulted in an internal reproducibility of ±2.5% for the major elements and of ±5% for the trace elements. The Ar extractions were made in a glass extraction line directly connected to a static gas mass spectrometer after preheating the samples under vacuum at 80 °C for at least 12 h. The use of this step was to reduce the amount of atmospheric Ar that could have adhered to the glauconite grains during preparation, handling and analysis. The accuracy of the K–Ar method was checked weekly by measuring the international glauconite standard GL-O that averaged 24.59 ± 0.17 (2σ) × 10−6 cm3/g (STP) radiogenic 40Ar for five independent measurements at the time of the study, to be compared to the recommended standard value of 24.85 ± 0.48 (2σ) × 10−6 cm3/g [19]. The procedure also included periodic determinations of atmospheric loads, which 40Ar/36Ar ratio averaged 298.7 ± 1.2 (2σ), to be compared to the recommended value of 298.6 ± 0.4 (2σ) [20]. The blanks of the coupled extraction line and mass spectrometer were also verified once a week for their content of radiogenic 40Ar that never exceeded 1 × 10⁻⁸, more often being below 1 × 10⁻⁹, which means that the equipment did not add measurable amounts of residual 40Ar to that of the samples. The K–Ar ages were calculated using the decay constants recommended by Steiger and Jäger [21] with their individual analytical uncertainties. Further details of the analytical procedure are available in Bonhomme et al. [22].

3. Results

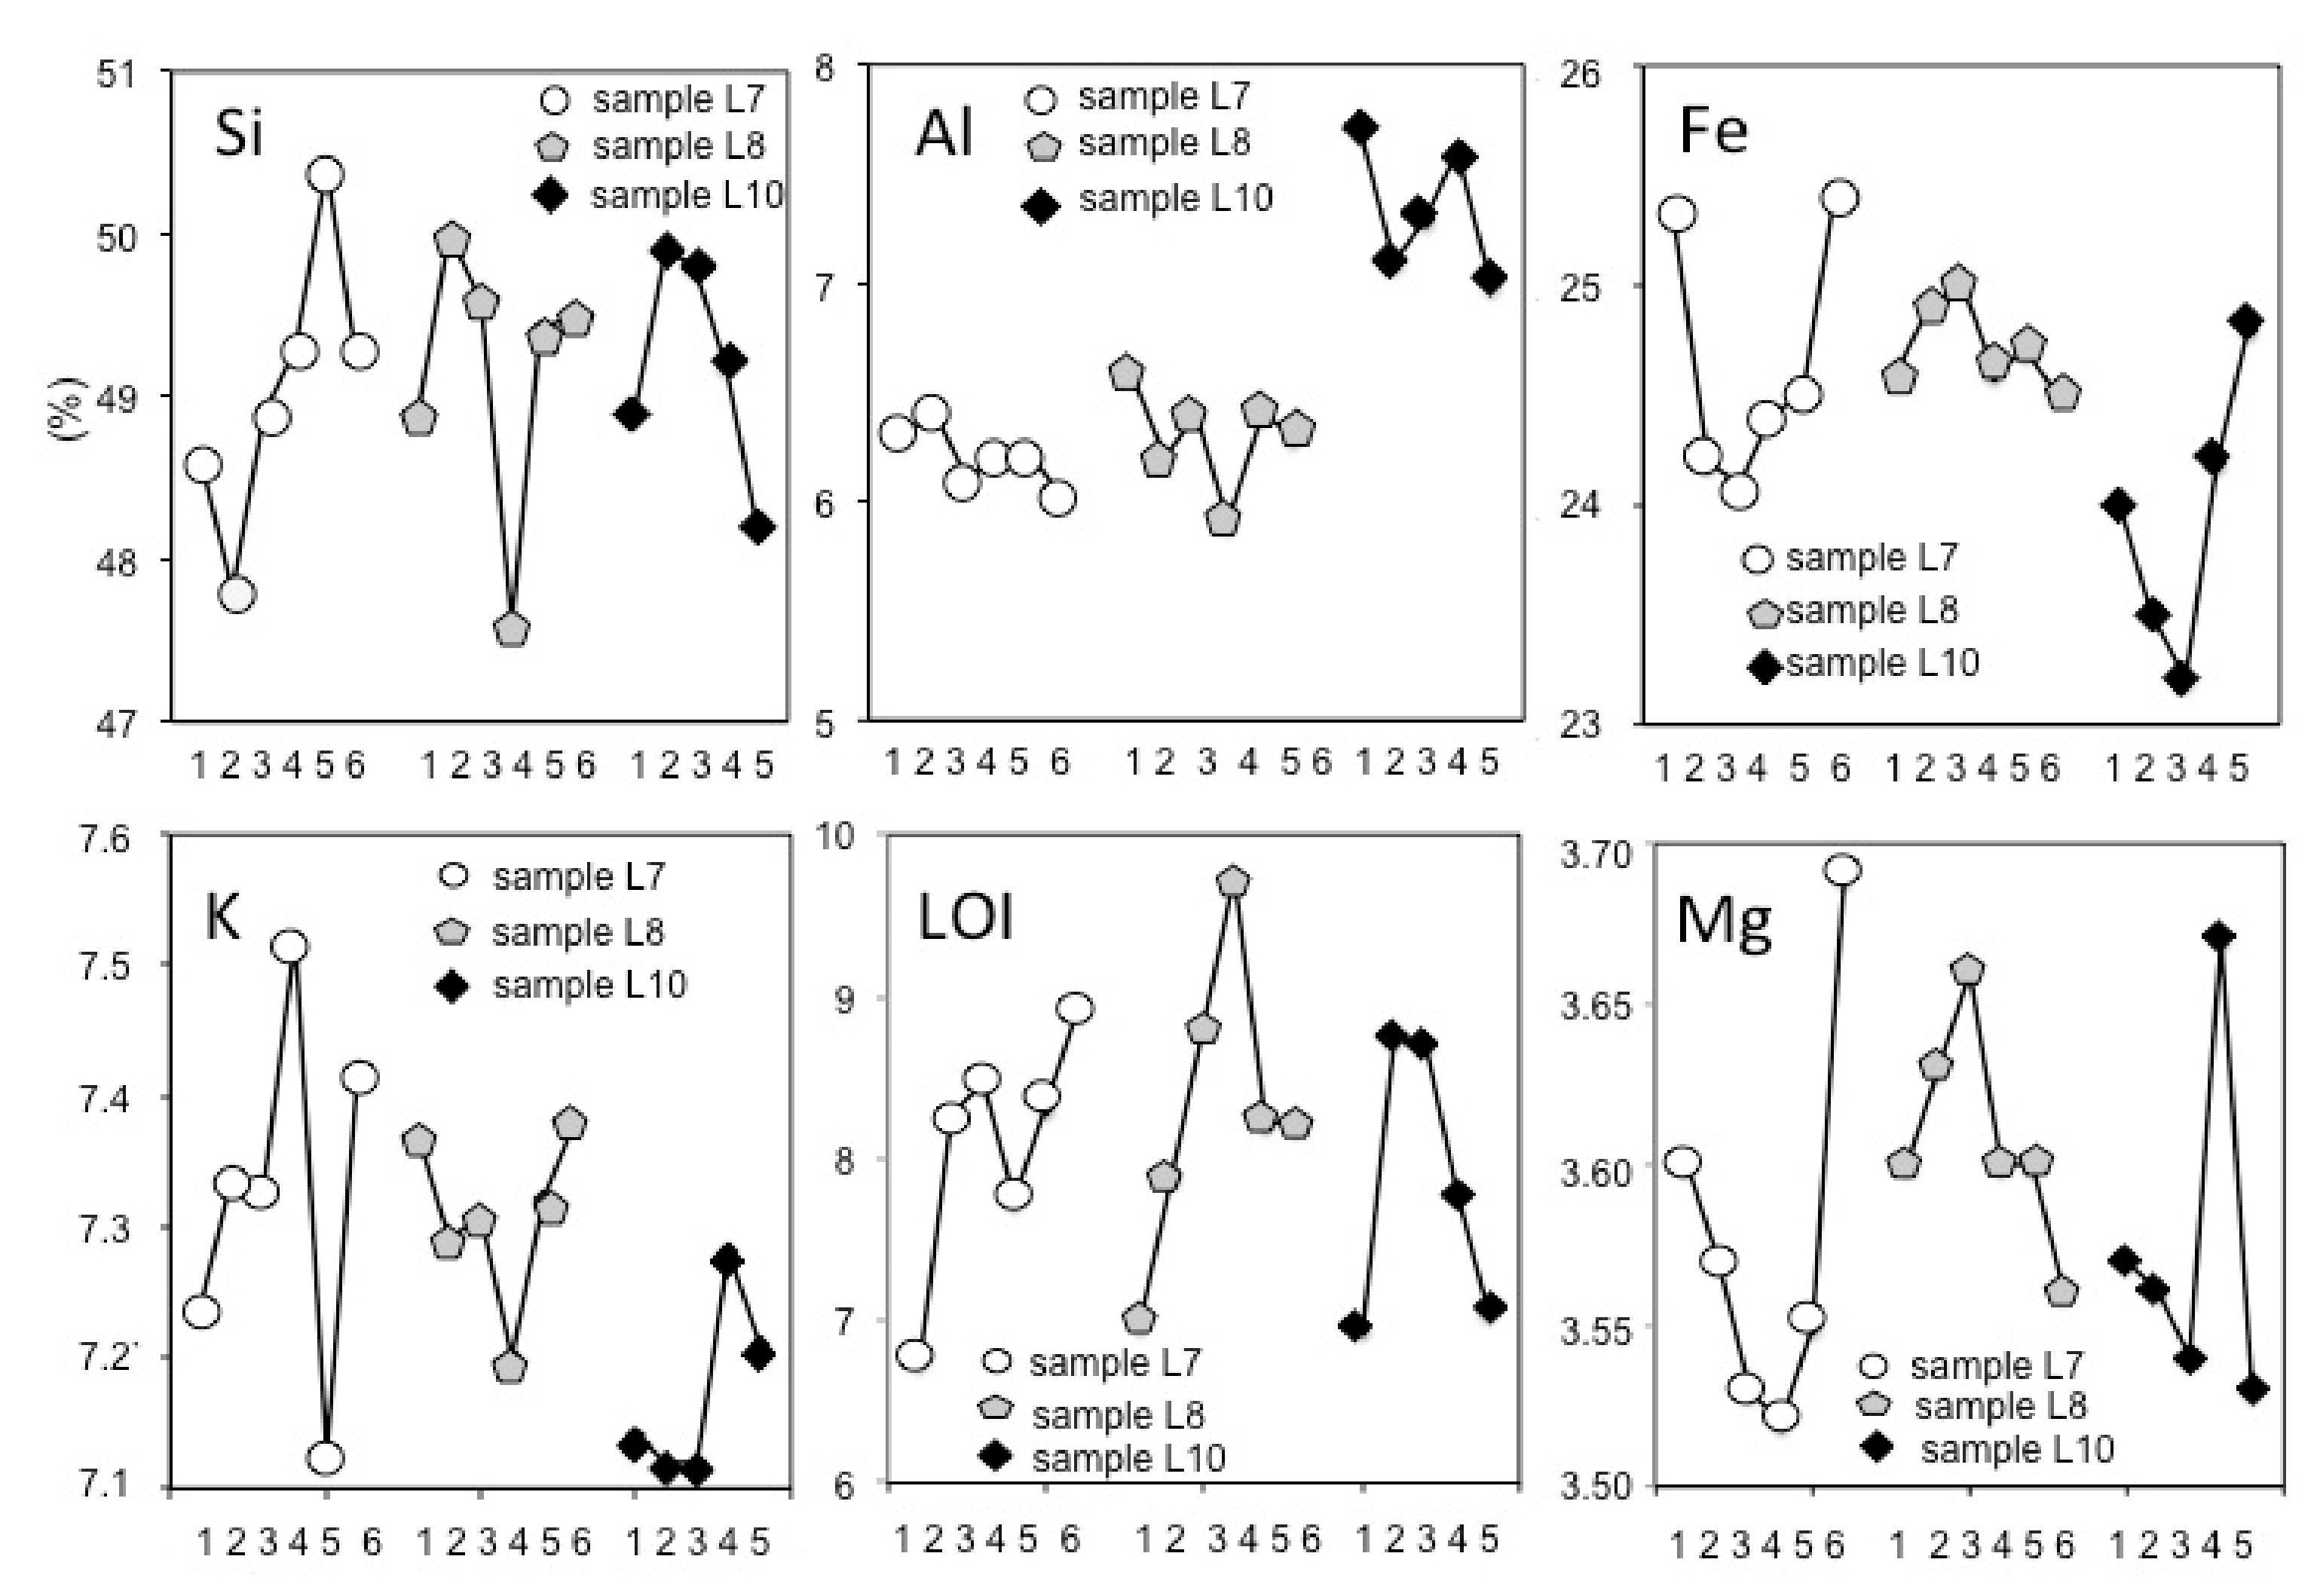
3.1. The Variations of the Major Elements

The contents of the major elements of the three untreated glauconite samples were compared to the aliquots submitted to ultrasonic shaking in different reagents (Figure 1; Table 1A). The variations in the SiO2 content scattered slightly below the analytical uncertainty of ±2.5%, except for the HCl-leached aliquots of the samples L7 and L8 (Table 1B). The Al2O3 content varied more, especially in the samples L8 and L10 with variations beyond analytical uncertainty. The variations in the MgO content were smaller, with only one decrease beyond the uncertainty limit. By contrast, the content of CaO decreased significantly in the acid-treated aliquots, suggesting an efficient dissolution of a soluble Ca-rich mineral. The Fe2O3 content also decreased significantly in most acid-treated separates of the samples L7 and L10, while it scattered within uncertainty in sample L8. The Mn3O4 content increased in the leachates, while those of TiO2 and Na2O decreased, those of K2O remaining within uncertainty. The loss on ignition systematically increased, while the total contents of the major elements increased, again slightly, for all aliquots of the three samples.
The previously released XRD diagrams of the untreated aliquots show the presence of two XRD peaks for the untreated L10 sample relative to the equivalent diagrams of the other samples (Figure 2). These two peaks are located at 19.2° and 36.6° (2θ) on a fuzzy diagram that was copied from Keppens [14]. Occurring only in the diagram of the untreated L10 sample, their absence in the other diagrams suggests the presence of a mineral that was dissolved by the dilute-acid leaching. The two theoretical mineral compositions that correspond to the location of these peaks, and to their relative intensities, are the Na–Mg sulfate blödite (Na2Mg(SO4)2, 4H2O) and the Fe sulfate rozenite (Fe(SO4), 4H2O). Combining this identification with the above chemical analyses of the untreated and HAc leached L10 sample, the Na content decreased dramatically due to leaching, while that of Mg remained in its analytical uncertainty and that of Fe increased. Therefore, blödite seems to be the additional mineral of marine origin [23] that apparently crystallized within the glauconite pellets.
In summary, the total contents of most major elements from differently treated separates relative to the untreated counterparts remained fairly stable, while the loss on ignition increased significantly from about 12% to 39%. In fact, the increasing loss on ignition supports the fact that soluble mineral phases were quite systematically dissolved. In addition, the overall chemical compositions of the samples do not appear to have been uniform, as would be expected, with various elements removed to variable extents by the combined treatments. For instance, the K2O content of sample L7 decreased significantly, i.e., by 3.9% upon the HCl ultrasonic treatment, while the two other samples yield increasing K2O content by 2.2 to 2.3%. The elements present in small amounts, such as CaO, Mn3O4, TiO2 and Na2O, all yield large variations due to the treatments, but these variations correspond to small amounts and did, therefore, probably not imply important mineral changes except, obviously, for the L10 sample. The almost constant variations of SiO2 and MgO were most often within analytical uncertainty, while this is not the case for Al2O3, for instance, that decreased more in the samples L8 and L10 than in sample L7. The value of Fe2O3 increased in sample L7 from untreated material to strongest shaking counterpart, but were very constant in those of the L8 and L10 samples

3.2. The Variations of the Trace Elements
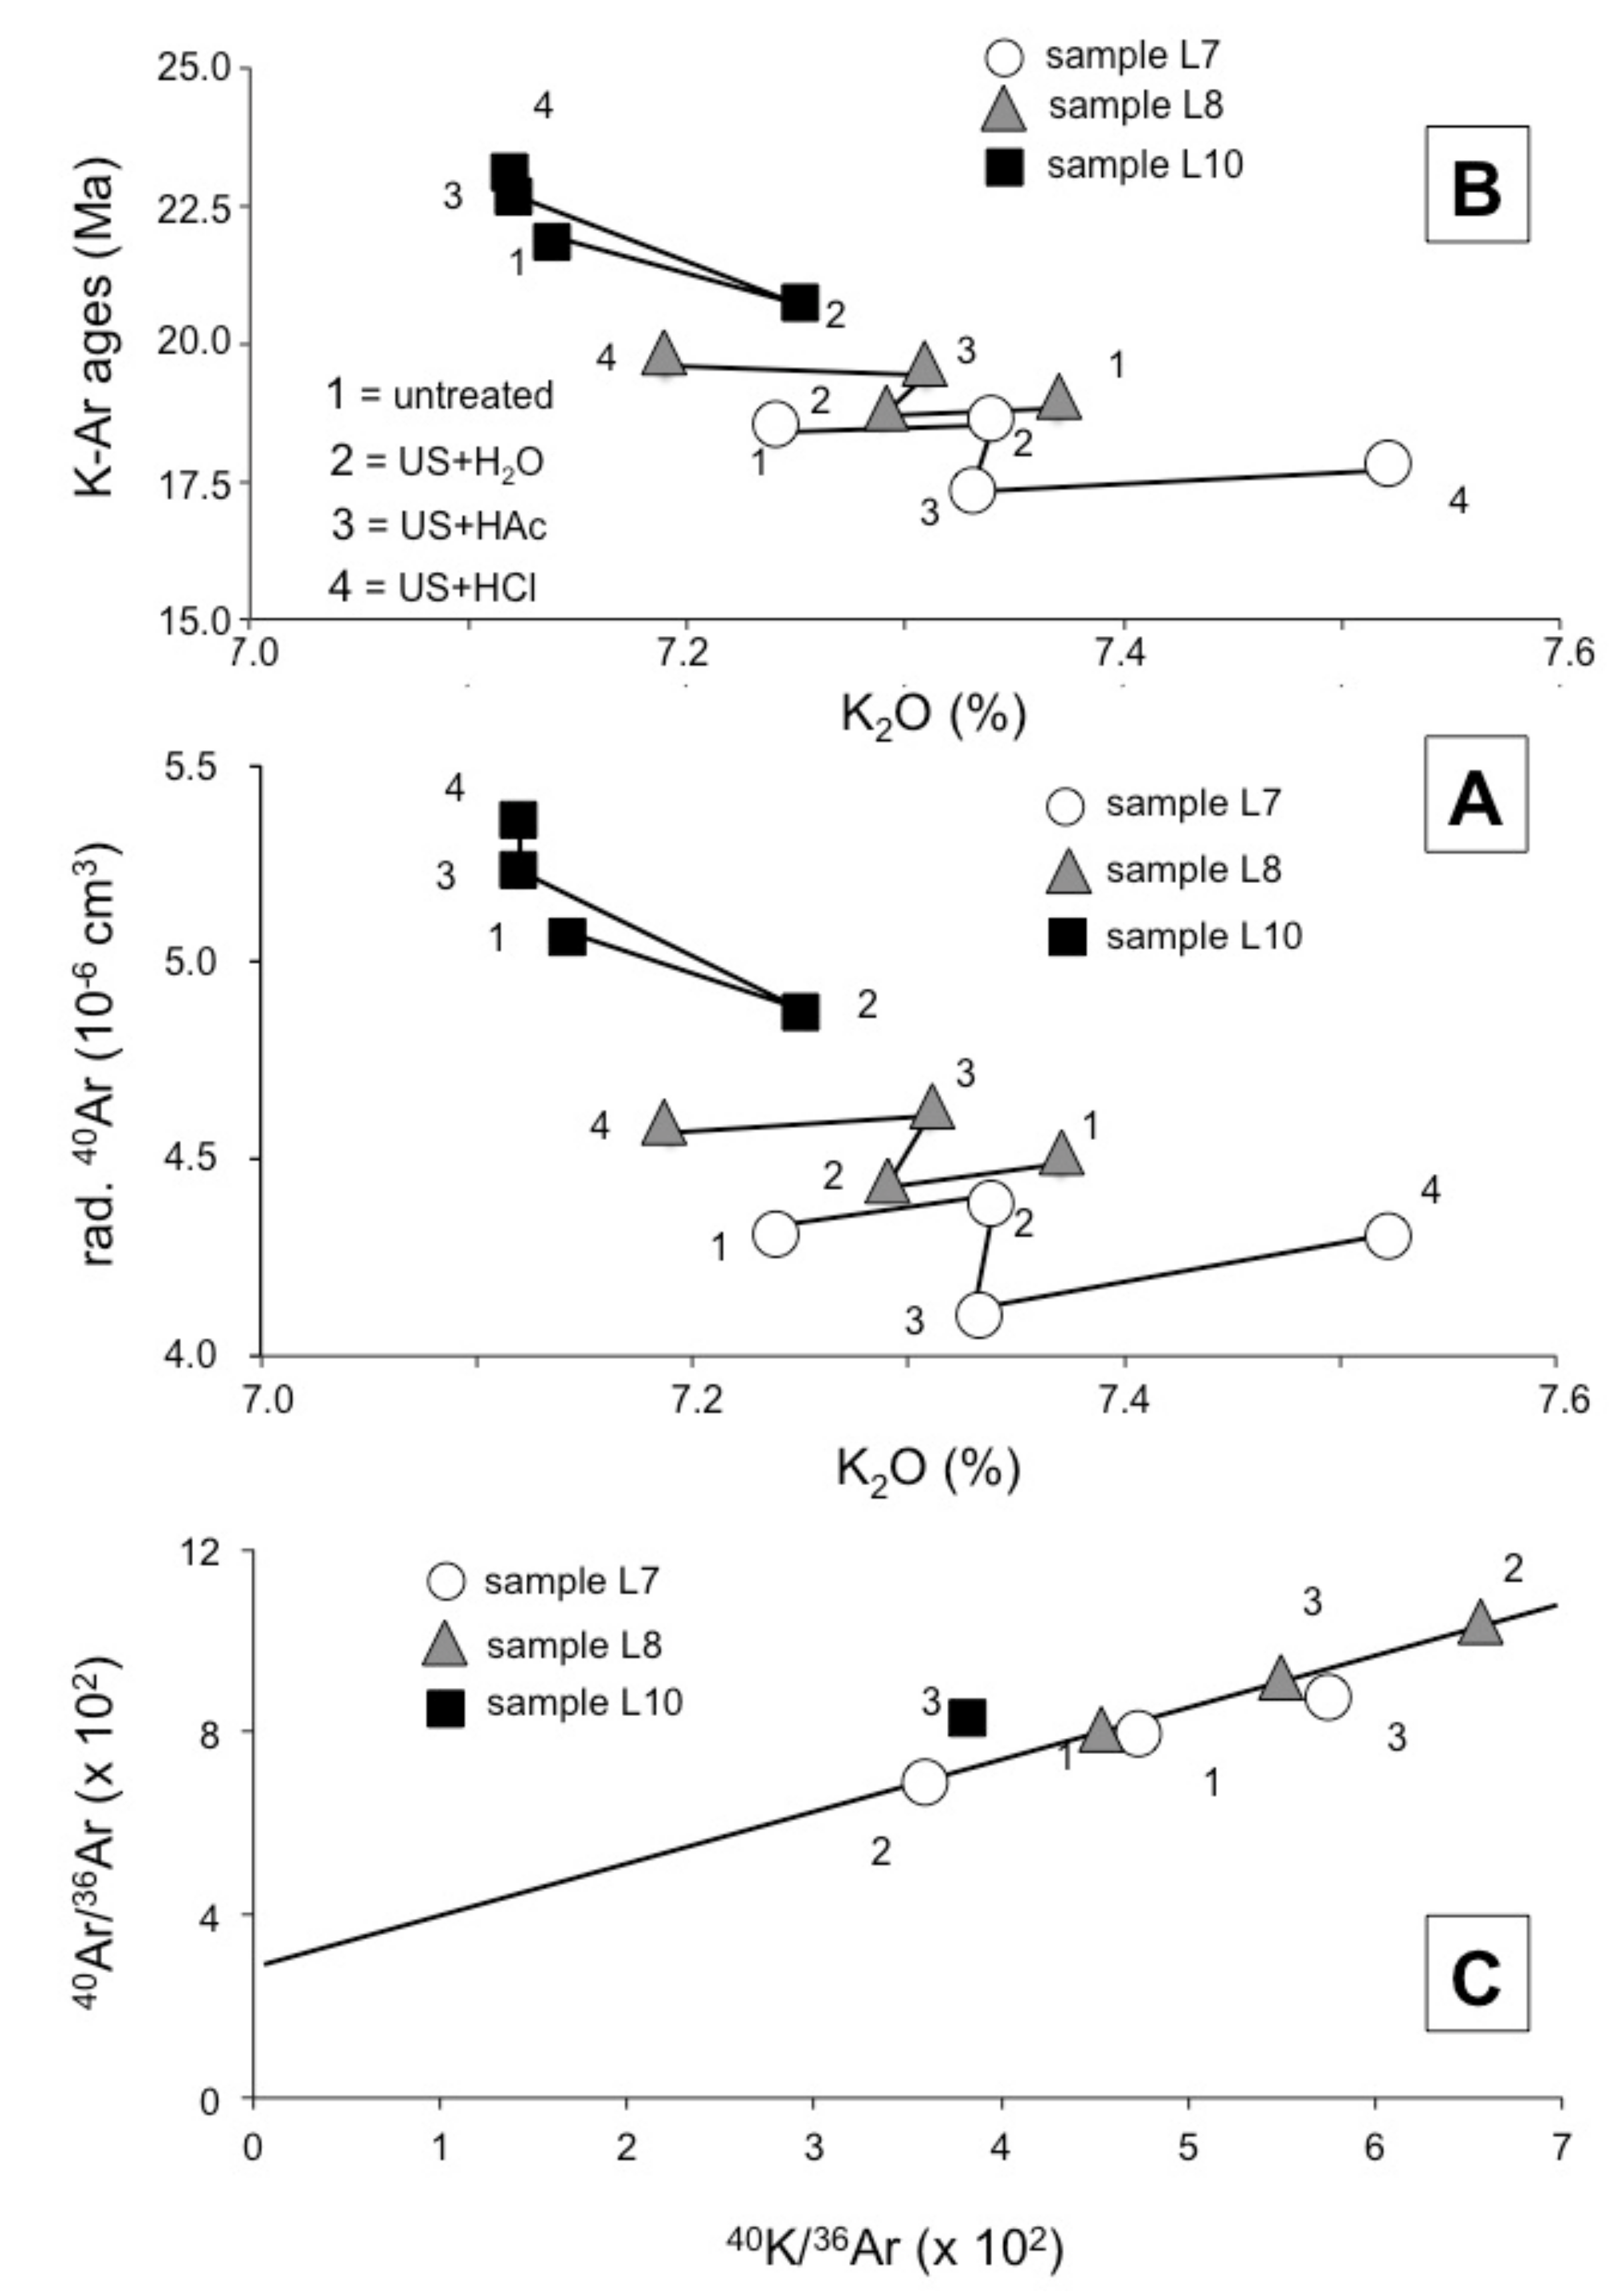
The Rb content varied in the treated separates within the admitted ±5% analytical uncertainty (Table 2A,B). In contrast, 96.1% of the Sr content were removed after the HCl treatment in sample L7, 91.5% in sample L8 and 56.4% in sample L10: Sr is clearly carried mostly by soluble minerals. Not analyzed for the untreated L7 sample, the content of the other trace elements were only discussed further for the aliquots after the HAc ultrasonic treatment.
For the L8 and L10 samples that yield a complete spectrum of trace elements, the V content increased in sample L8, while it decreased in L10. The Ni content either remained within the analytical uncertainty such as in sample L7 or decreased significantly to about 70% in the two other untreated L7 and L8 references. Most Co, Sc and Y contents remained also within uncertainty with, however, significant Y decreases in the L7 and L8 samples and a slight decrease for the Cr content after leaching. Decreases in Cu after acidic ultrasonic treatment are often significant, while Zn had a variable behavior: decreasing in sample L8 and increasing in sample L10 after treatment, probably due to the type(s) of dissolved minerals. In sample L7, the contents of Co, Zn, Cu and Y decreased significantly, while only that of Cr increased and that of V remained within analytical uncertainty. Furthermore, Cu decreased after leaching with dilute HCl (−60%), as well as Sr (−30%), Ni (−68.5%) and Cr (−34.5%) in the untreated sample L10 hosting blödite.
In summary, amongst the analyzed trace elements, Rb, V, Zn and Sc seem not to have been affected by the combined ultrasonic and dilute acid leaching. Others, such as Sr, Ba, Ni, Co, Cr and Cu were systematically removed, while Zr behaved differently in the L8 relative to the L10 sample: it leached out from the former, while remaining in the latter.

3.3. The K–Ar Data

The K–Ar data obtained before and after the treatments were analytically equivalent for the L7 and L8 samples (Table 3). The average age values for both, at 18.0 ± 0.4 Ma and 19.1 ± 0.4 Ma, are almost within uncertainty, while that of sample L10 is significantly higher at 22.1 ± 1.2 Ma. More precisely, the K–Ar results display differently in a Harper [24] diagram for the radiogenic 40Ar content relative to the corresponding K2O content (Figure 3A,B). The data points of the samples L7 and L8 move in opposite directions: those of the L7 aliquots yield increasing K2O content for a decreasing radiogenic 40Ar content, while those of sample L8 move into the opposite direction. In the case of sample L10, the H2O treatment decreases the contents of both K2O and radiogenic 40Ar, whereas the HAc and HCl treatments increase the radiogenic 40Ar content for similar K2O content.
The obtained data points of the different aliquots display the same changes in a K–Ar isochron diagram (Figure 1): those of samples L7 and L8 move in opposite directions, whereas the H2O leachate of the L10 aliquot yields a significant decrease in the age value due to an increase in the K2O content. In turn, the K–Ar data reflect the various contents of the major elements, namely the three glauconite samples are not identical in their chemical composition and, therefore, not in their mineralogical composition, due to the presence of contaminant minerals. In the case of sample L10, the dissolution of a soluble mineral from untreated aliquot, even after a preliminary routine H2O treatment, modified the Rb–Sr data, which is unusual e.g., [25]. Such behavior is most probably due to the dissolution of a mineral rich in Sr and depleted in Rb and K.

3.4. The Impact of the Duration of the Ultrasonic Shaking

Variations in the Rb–Sr isotopic ages of the glauconite pellets studied here by the K–Ar method were addressed before by Pasteels et al. [6] by varying the duration of the ultrasonic shaking on three more samples not studied here (L1, L2 and L3 on Table 4 of Pasteels et al. [6]) from 20 to 60 min, and even up to 24 h in the case of sample L8, all with the same reagent. In the case of the Rb–Sr ages, longer ultrasonic treatments induced older ages for the L7 and L8 samples (Table 4). Related to these age increases are a slight increase in the Rb content in sample L7 and a slight decrease in L8, as well as a large increase in Sr in both samples. Furthermore, the systematic increase in radiogenic 87Sr should be mentioned. These changes explain the variations in the ages, while the limited variations in the Rb content exclude any impact on the alkali-carrier minerals.
Increasing the shaking from 20 to 60 min in HCl only significantly reduced the contents in TiO2 and K2O, while shaking sample L8 in H2O for 20 min and 60 min, or for 24 h did not affect the contents of any of the main major elements. Only those of Mn3O4, TiO2 and Na2O decreased and increased again. Subjected to a duplicate treatment consisting first of a regular 20 min long shaking in H2O and then in HAc, followed by a second treatment in H2O, the Al2O3, Mg2O3, CaO and TiO2 contents of sample L10 decreased beyond analytical uncertainty, while those of Mn3O4 and Na2O increased, also beyond the analytical uncertainty. In the case of the trace elements, most variations in their contents induced by increased shaking time were limited within analytical uncertainties. Only the Sr and Zn contents visibly increased in sample L7 when the duration of the shaking in HCl increased from 20 to 60 min. When the shaking time increased from 20 min to 24 h in H2O, the Ni content decreased and that of Co increased in sample L8. When 20 min shaking in H2O was followed by another 20 min shaking in HAc, the contents of Sr, Ba, Zn, Cu and Zr decreased beyond analytical uncertainty. In summary, only shaking in H2O followed by an identical shaking duration in HAc had some leaching impact on the trace elements, obviously on a mineral carrier of the trace metals.
The K–Ar method was not applied to variably shaken aliquots but only during 20 min with H2O, HAc and HCl. The age increased the most in the case of the HCl interaction for the L8 and L10 samples, while it decreased about the same for sample L7.

4. Discussion

The elemental and K–Ar isotopic data obtained here raise a concern about the mineralogical homogeneity of glauconite samples collected within a narrow neighborhood, as the pellets apparently also carried accessory mineral phases. The treated aliquots of the L8 and L10 samples yield opposite K–Ar and elemental trends, suggesting at least different impacts by the leaching/shaking tests. For instance, the systematical leaching of Na by all treatments points to the occurrence of a constitutive soluble phase easily removed by whichever treatment and identified to be blödite detected in sample L10 by XRD. Some Na content could also or additionally have resulted as part of halite NaCl crystallized from the evaporation of seawater that could have diffused into the growing authigenic glauconite pellets during crystallization, while blödite is a reasonable alternative, contemporaneously or after the crystallization of the glauconite pellets. In contrast, Fe2O3 does not appear to have contributed significantly as its content only decreased significantly in the aliquots of sample L7, whereas it appeared quite uniform in most of those from the L8 and L10 samples. The systematic increases of the loss on ignition also alerts for discrete changes in the mineral compositions of the three samples. The high initial K–Ar age value of sample L10 and its slight increase after interaction with dilute acids also suggest the occurrence of various minerals dispersed in the pellets together with glauconite.

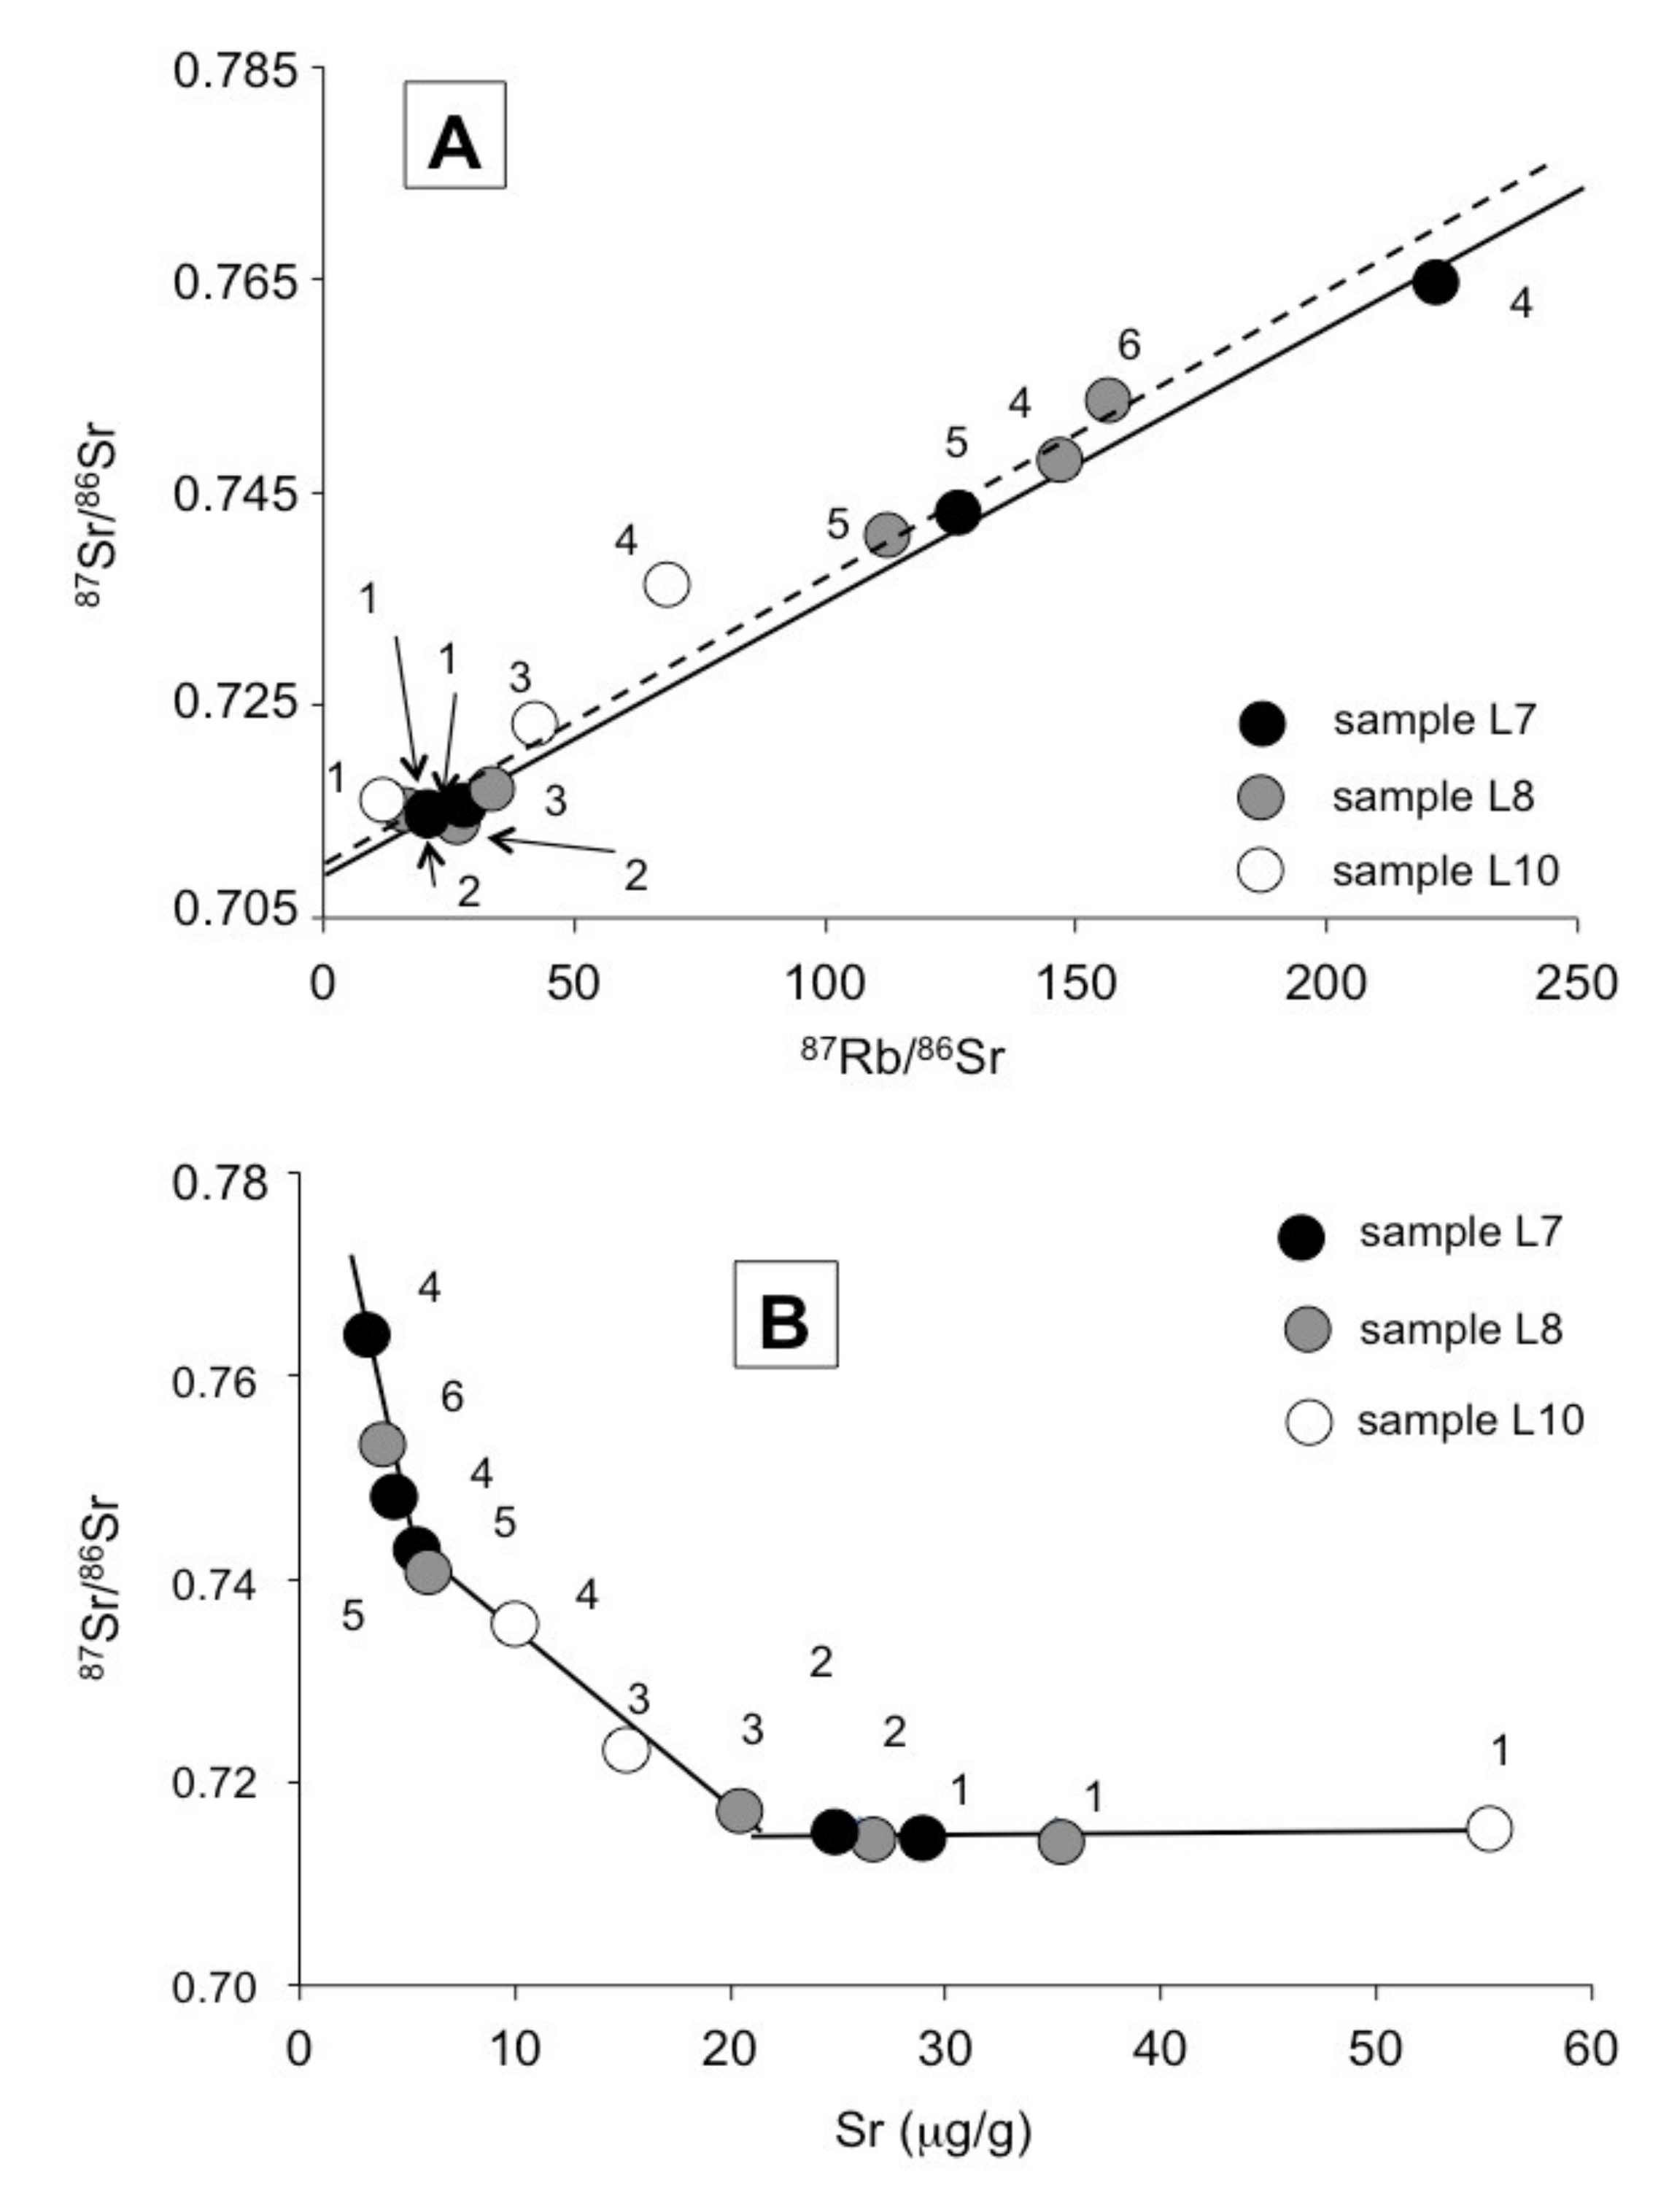
4.1. About the Earlier Published Rb–Sr Data

The Rb–Sr results published by Pasteels et al. [6] were plotted again here into an isochron diagram (Figure 4A) where the data points fit roughly with a straight array except that of the untreated L10 aliquot that plots above the line. A closer look at the Rb and Sr contents shows that Rb is hardly affected by the different treatments since its contents range narrowly from 222 μg/g for the untreated A1 aliquot of sample L7 to 231 μg/g for the two aliquots of the L7 sample leached by H2O and HCl. The difference of +4.1% is clearly within the analytical uncertainty. The Sr content varies much more, i.e., from 3.0 to 54.9 μg/g, suggesting that the applied experiments affected mostly, if not only, Sr carrying minerals. A further interesting relationship concerns the Sr contents and the 87Sr/86Sr ratios from leached residues (Figure 4B). The H2O leaching with an ultrasonic shaking only slightly reduces the Sr content and does not affect the 87Sr/86Sr ratio. This suggests that the H2O treatment released only Sr from water-soluble minerals, such as the suspected salts with an 87Sr/86Sr ratio of about 0.7154 ± 0.0004 (2σ). Obviously the ultrasonic shaking did not add much, except probably that it enabled de-ionized H2O to reach mineral particles that were physically protected within the pellets. It is also plausible that the obtained 87Sr/86Sr ratio of about 0.7154 is not representative of the depositional environment of the glauconite pellets, but rather indicative of a post-depositional diagenetic impact that probably favored the crystallization and/or the protection of these suspected minerals with abnormally high Sr content and unexpected 87Sr/86Sr ratios. The additional HAc treatment leached about 40 to 70% of the Sr from the two aliquots of the L8 and L10 samples. It yielded an 87Sr/86Sr ratio from 0.7174 to 0.7232, which is even above the ratio of 0.7154 for the previous H2O treatment. The removed Sr with a slightly higher 87Sr/86Sr ratio seems to have been carried mostly by minerals sensitive to the acidic leaching, but not to the ultrasonic shaking in H2O. The HCl treatment removed more than 80% of the originally trapped Sr in the pellets, which resulted in an expectedly significant increase in the trapped 87Sr/86Sr ratio of the residues from 0.7363 to 0.7534. In turn, the ultrasonic shaking did visibly not increase the amount of removed Sr, while an increase in the reagent’s acidity appeared to be more efficient in this respect. Another fact to be noticed is about the correlation between Sr contents and 87Sr/86Sr ratios in the residues: as long as the Sr content is higher than 25 μg/g, the 87Sr/86Sr ratios remain almost identical at 0.7154 ± 0.0004 (Figure 4B). When the Sr content ranges from about 25 to 6 μg/g, the 87Sr/86Sr ratio increases progressively to about 0.7400, and when its content drops below 6 μg/g, the increase in the 87Sr/86Sr is even stronger. Notable is the fact that when the Sr content is high in the pellets, i.e., above 25 μg/g, the contents of the additional carriers overwhelm those of the glauconite pellets. The Sr of the latter becoming dominant only when the content in the pellets is below 6 μg/g. It can then not be excluded that the isochron of the sole glauconite pellets only includes the data points that fit the dashed line of the diagram with an initial 87Sr/86Sr ratio of about 0.715 (Figure 4B). This change would slightly lower the “stratigraphic” age, which may then no longer relate to the stratigraphic scale but result from the above-mentioned delayed diagenetic episode. In this case, the blödite-type and the other soluble minerals would have crystallized at the same time as the insoluble glauconite, with an identical initial 87Sr/86Sr ratio and an overwhelming Sr content.
The Rb–Sr diagram plot somehow confirms this concept: with the exception of the data point of the L10 residue after HCl leaching/shaking, all others plot along an array that may also be considered to be an isochron (full line in Figure 4A). The four L7 data points fit a first plausible isochron (full line in Figure 4A) with an age of 18.1 ± 3.1 (2σ) Ma, an initial 87Sr/86Sr ratio of 0.7095 ± 0.0052 (2σ) and a MSWD of 13. The data points of the L8 untreated and residues plot along a sub-parallel isochron with an age of 19.6 ± 1.8 (2σ) Ma, an initial 87Sr/86Sr ratio of 0.7089 ± 0.0024 (2σ) and a higher MSWD of 63. The obtained ages and initial 87Sr/86Sr ratios of these two isochrons overlap, while the data points of the third L10 sample are clearly above the two arrays. Beyond these differences, it appears that minerals that were solubilized by the weak acids, such as the blödite in sample L10 for instance, as well as other soluble minerals characteristic of reduced environments such as glauconite pellets, could have crystallized within the volume and the ambiance of the pellets.
It is, then interesting to compare these results with the contents of the major and trace elements depending on the used reagents to identify which kind of soluble minerals characterize either oxidizing or reducing environments in the pellets. Leaching sample L7 with H2O removed large amounts of CaO. In the case of sample L8, the same H2O leaching removed mostly Mn3O4, while HAc leaching produced the highest removals of Mn3O4 and CaO. In turn, high decreases were observed for Na2O, Mn3O4 and CaO in the samples L7 and L8, whereas the highest losses in sample L10 were also in Na2O, Mn3O4 and CaO, suggesting the same dissolutions in the three samples at various amounts.
In summary, the glauconite pellets contained high amounts of foreign elements that were released by H2O and dilute acids, improved by ultrasonic shaking. The first conclusion is that the preparation used by Pasteels et al. [6], based on a magnetic enrichment and a H2O rinsing, appears to have not been sufficient to remove the accessory mineral phases characterized especially by metal-rich components that have crystallized within the pellets, either at the same time as the glauconite crystals in the reduced microenvironment of the pellets, or afterwards during a further diagenesis and with a different 87Sr/86Sr ratio. The systematic leaching of high amounts of Mn3O4, of TiO2 and of less Fe2O3 in the leachates testifies for the occurrence of such metal-rich soluble components. Whereas CaO was leached quite systematically, it appears that here the soluble mineral(s) probably did not precipitate at the time the pellets crystallized, as its (their) 87Sr/86Sr ratio(s) is (are) different from that of the Middle Miocene (18 Ma) seawater, that was of 0.7087–0.7088 [26]. This value is close to the value of 0.7086 used by Pasteels et al. [6] in Table 4. The occurrence of Na2O in the leachates relates reasonably to the identified blödite that could have crystallized when the seawater dried out within the pellets. Blödite, known to carry high Sr contents, as determined here, could have been trapped within the pellets, which hid it during the initial contact with H2O during sample preparation. In turn, this specific mineral composition of the glauconite pellets affected only the Rb–Sr and not the K–Ar system, because they carry mostly Sr and Na, but not K and Rb. The bias in the Rb–Sr age is then the consequence of the addition of Sr with an 87Sr/86Sr ratio different from that of the glauconite mineral that removed the data point away from initial isochron.

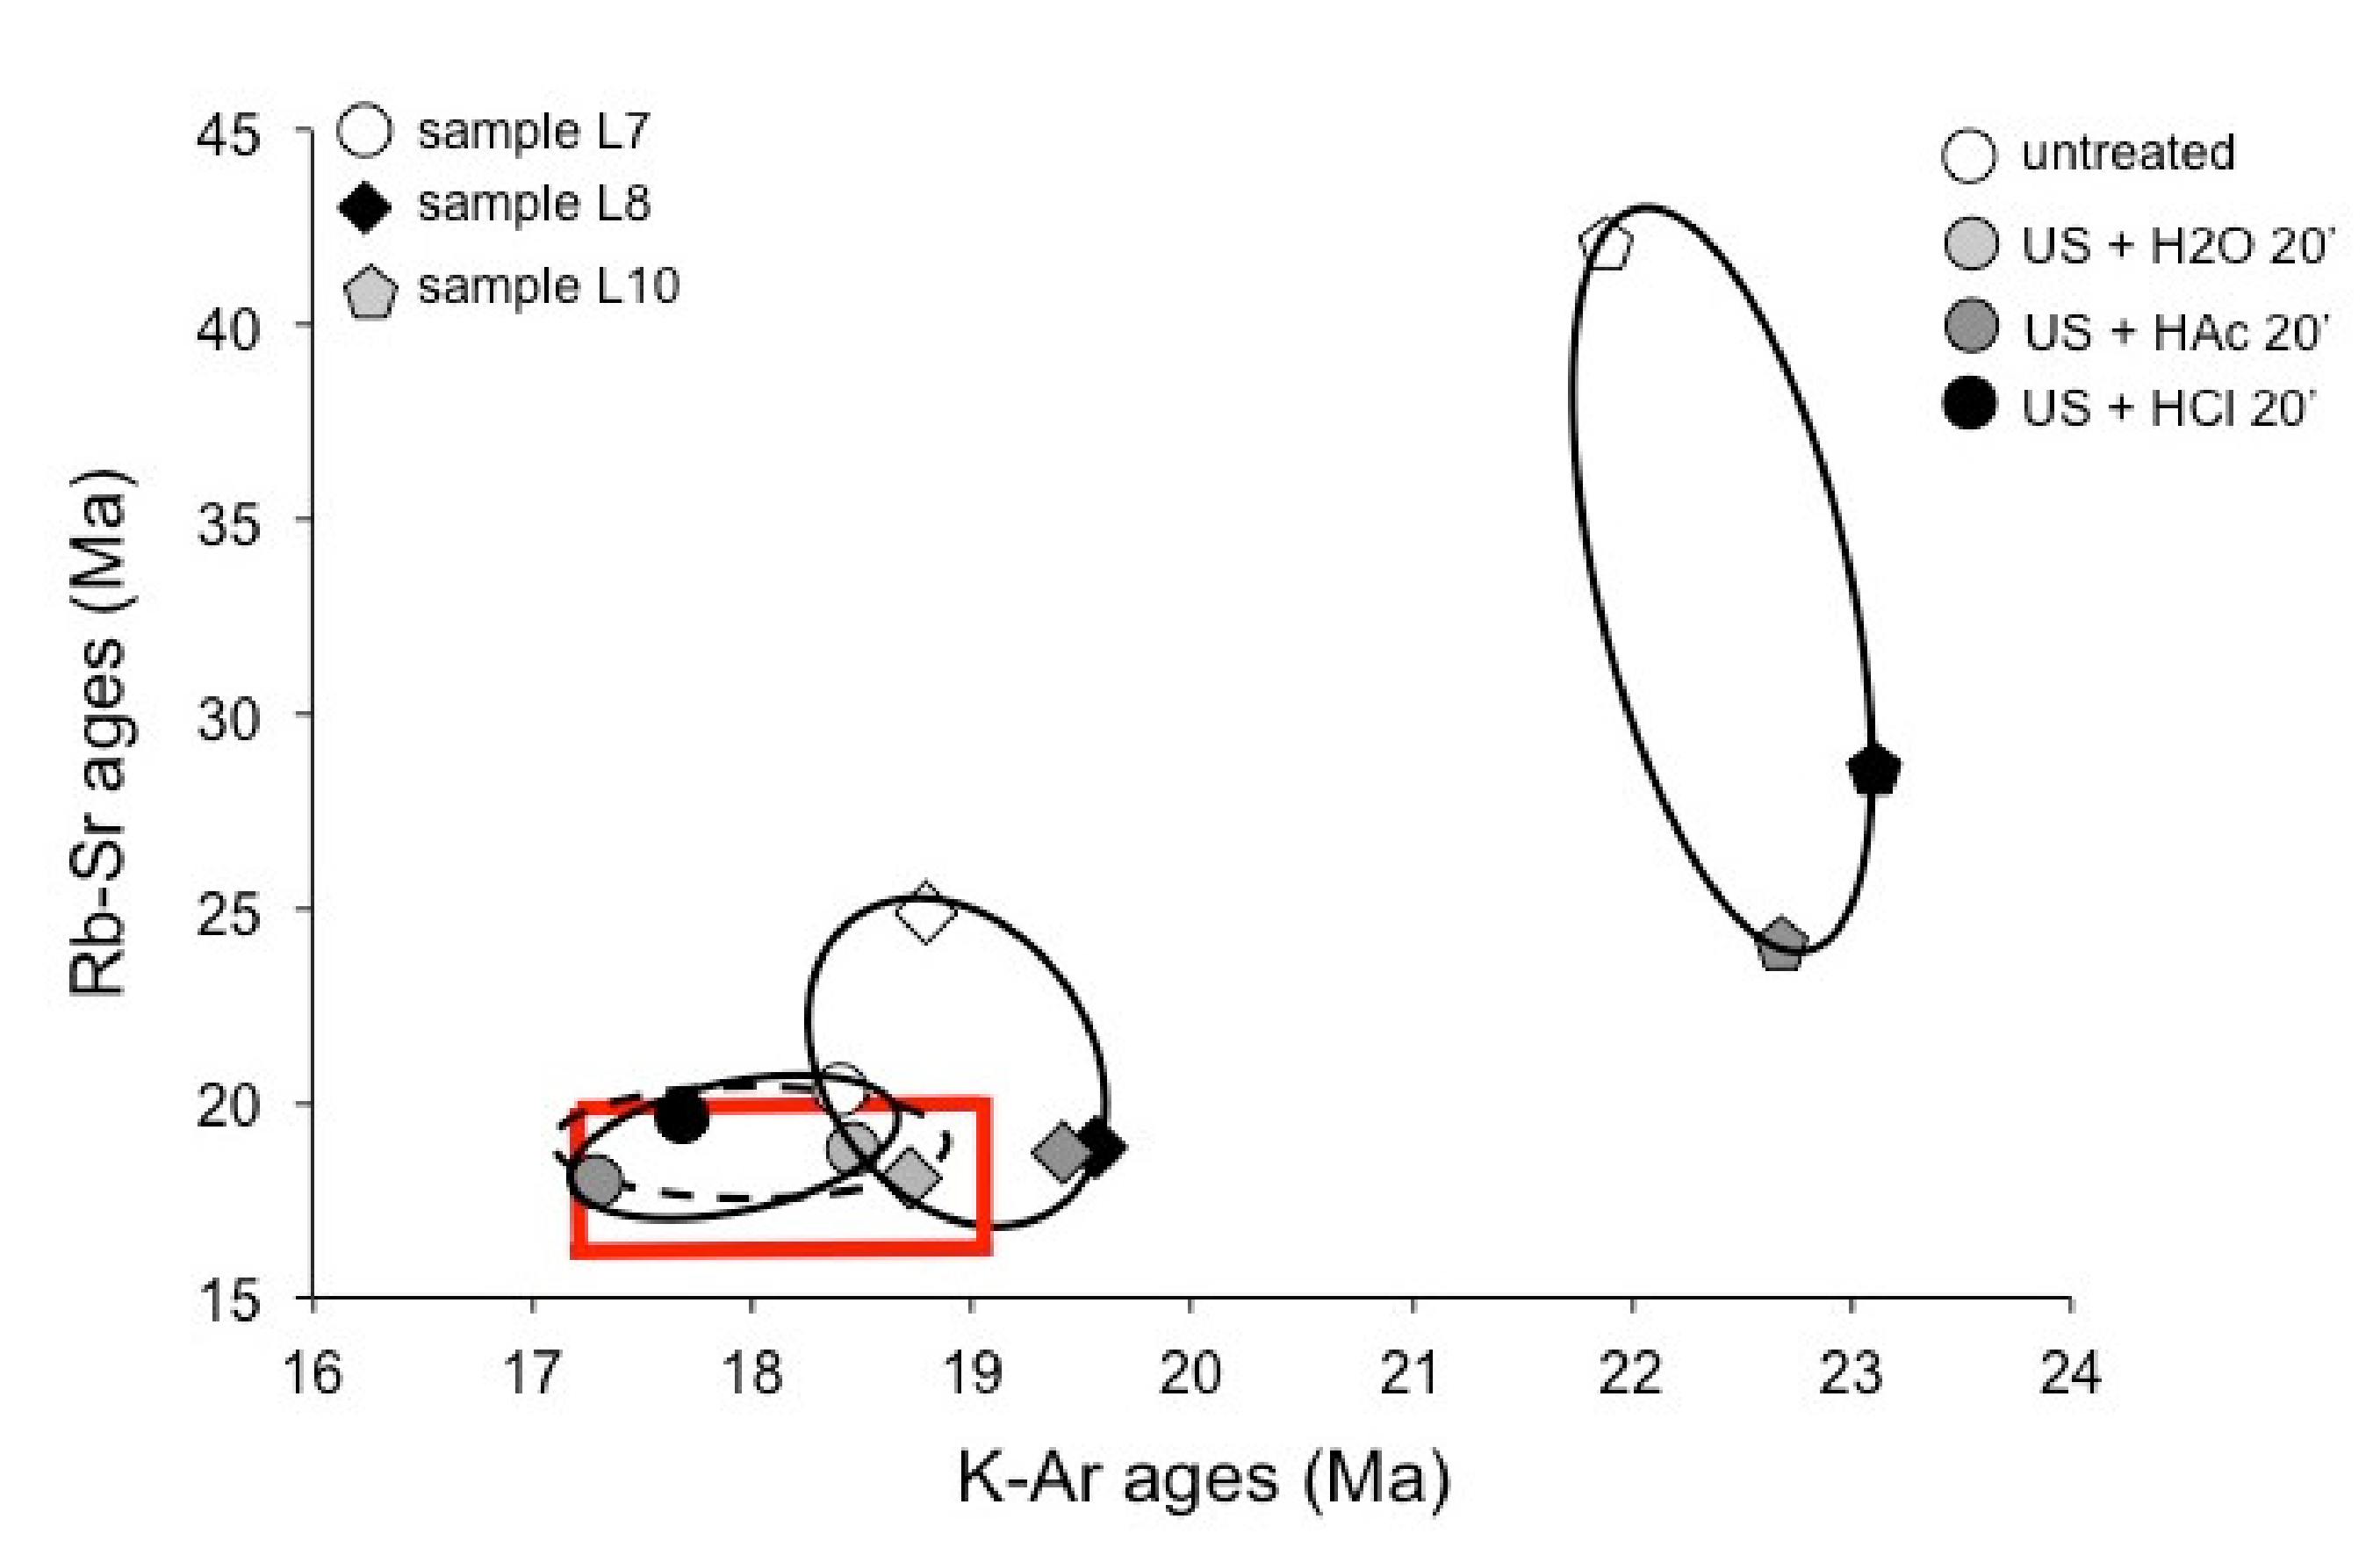
4.2. Comparison of the K–Ar and the Previously Published Rb–Sr Data

The Rb–Sr data of Pasteels et al. [6] that were obtained on the same samples as the K–Ar and geochemical data generated here (Table 4), outline a high Rb–Sr age for the sole untreated L10 sample with a very high Sr content. It is clear that the difference is not due to an analytic aspect as the two other samples yield identical Rb–Sr and K–Ar ages. Clearly abnormal, the Rb–Sr age spectra at 42.1 ± 1.6, 24.2 ± 1.3 and 28.7 ± 1.1 Ma for the three analyzed L10 aliquots with an initial 87Sr/86Sr ratio set conventionally at 0.7086, are clearly above the corresponding K–Ar values. These high values are also visible in the isochron diagram (Figure 4A), where the untreated aliquot has the lowest 87Rb/86Sr ratio of all analyzed aliquots, while plotting above the drafted isochron. In summary, the database points towards a specific mineral composition that clearly affects the Rb–Sr system and not its K–Ar equivalent.
The Rb contents remain quite constant for the untreated and leached aliquots of sample L10, the difference needs to relate to the higher Sr content of the untreated sample, which reduces its Rb/Sr ratio to a significant lower value than those of the other aliquots. This is also visible in the diagram that compares the 87Sr/86Sr ratios with the corresponding Sr content (Figure 4B). Interestingly, when ultrasonically leached, the L10 aliquots yield Rb–Sr age data that are much younger, even within analytical uncertainty, than those of the K–Ar data. In turn, as the differences between the Rb–Sr and K–Ar data of sample L10 obviously relate to the occurrence of blödite, a mineral enriched in Sr and lacking K and Rb, in the untreated L10 aliquot. It can also be stated that the Rb–Sr data were not biased by the preparation or by any analytical aspect, but correspond to a mineral phase that was not removed during the sample preparation.
All obtained Rb–Sr and K–Ar data were combined into a chart that allows a straight comparison of the results (Figure 5). Relative to the stratigraphic reference, most age data are on the higher side by both the Rb–Sr and K–Ar methods. In detail, the untreated aliquot of sample L8 and all those of sample L10 yield higher age values than the stratigraphic reference. It is confirmed that the high age value of the untreated L10 aliquot is mostly due to the identified blödite with an impact on only the Rb–Sr system. However, for that L10 sample, the data plots of the leached/shaken aliquots remain unevenly above the stratigraphic reference, which suggests that they also probably contain insoluble detrital components such as illite-type clay crystals that are clearly of detrital origin. The overall proposal for sample L10 is then that it was apparently deposited in a marine environment that was slightly different from that of the two other L7 and L8 samples in both its sedimentological and mineralogical context: more exposed to detrital supplies identified by further clay material and it also hosted a Na–Mg sulfate.

4.3. Evaluation of the Sample Preparation Techniques

It is difficult to evaluate precisely the impact of the preparation on a limited number of results. Here, the age difference of the untreated aliquot of the L10 sample relative to those of its treated aliquots is due to the occurrence of blödite overwhelmingly loaded in Sr that did not affect the K–Ar data because it lacks alkali elements. This interpretation is supported by the homogeneous K–Ar results of the four aliquots of this L10 sample that were subjected exactly to the same preparation steps as the equivalent aliquots of the two other samples. In the case of the two other L7 and L8 samples, the K–Ar ages also decreased after HCl reaction, which could be due to the dissolution, not of blödite but of another acid-sensitive soluble mineral and/or to the removal, by shaking the pellets in dilute acid, of detrital particles that were sticking to the glauconite crystals in the pellets.
Leaching experiments with dilute HCl or HAc acids have been extensively used in isotopic dating of clay-type minerals as they dissolve carbonates, sulfates and oxides, while leaving the clay crystals unaffected e.g., [15]. Such dissolutions are visible here on the basis of the changing CaO and Fe2O3 contents, while additional ultrasonic shaking seems not to have modified the impact of the chemical interaction. Leaching of Fe2O3 indicates, together with that of the metallic trace elements, that metal-rich crystals were dissolved by the applied treatments, especially for sample L10 that also contained soluble Na- and Ca-rich crystals that crystallized in the reduced environment of the glauconite pellets. Ultrasonic shaking seems justified for disaggregating mineral agglomerates, which facilitates the removal of detrital grains or particles that are potentially trapped within glauconite pellets and might be difficult to reach with acidic solutions.
In summary, the above multi-method isotopic dating of glauconite pellets focuses on an aspect in their preparation that needs to be highlighted again: a leaching/cleaning of the pellets appears to be very necessary with dilute reagents such as HAc and/or HCl. In addition, in the case of pelleted crystals such as glauconite grains, the addition of ultrasonic shaking seems also justified to somehow disaggregate the pellets in order to facilitate the access of the aggregated pellets to the used reagents. Of course, this procedure is only a suggestion based on experimental data with open choices in the types of reagents and/or the duration of the interactions that can obviously be adjusted.

5. Conclusions

Authigenic glauconite pellets represent important historic references for the calibration of the time scale by K–Ar and/or Rb–Sr isotopic dating. As illite separates, they were often treated with different reagents such as dilute HCl and/or HAc, but seldom together with ultrasonic shaking. The same procedure has been strictly applied again here for a comparison of K–Ar dating of three samples previously dated by Rb–Sr in order to precisely compare the two sets of data. Two opposite K–Ar data trends for the elemental contents suggest various mineral compositions in the untreated pellets. The K–Ar data obtained before and after the treatments are analytically similar for all aliquots of two of the analyzed samples, while those of the third one yield a slightly higher age difference. In fact, this sample also contains blödite identified by XRD, known as Sr enriched and for its marine origin, that affected the Rb–Sr data and not the equivalent K–Ar data. Based on its 87Sr/86Sr ratio above that of the depositional marine environment, this mineral appears to have crystallized during a late diagenetic episode relative to the glauconite precipitation. The chemical analyses show that the sample preparation has a determining impact on the isotopic dating of clay-type minerals. This technical aspect becomes especially important when glauconite isotopic dating is of stratigraphic application, by removing, or not, accessory minerals trapped in the pellets during initial crystallization or delayed diagenesis. It is essential to systematically leach the selected aliquots with dilute acid, run and, preferentially, compare the Rb–Sr and K–Ar data for a consolidated evaluation of the obtained ages. The combination of these two isotopic methods strengthen not only the isotopic and mineralogical results, but provides also information about the sedimentary context of the selected material.

Author Contributions

Conceptualization, N.C. and E.K.; formal analysis, E.K., I.T.U. and A.A.; methodology, N.C. All authors have read and agreed to the published version of the manuscript.

Funding

This research received no external funding.

Data Availability Statement

Data are available on request to the authors.

Acknowledgments

We would like to dedicate cordial thanks to the late Emeritus Professor Dr. Paul Pasteels for having allowed us to complete the Rb–Sr study of three glauconite separates by chemical and K–Ar analyses that became the basis of the present study. Two of us, who knew him for years, would also like to dedicate this, as a token of appreciation, to a very gentle colleague and a highly-respected scientist. Two anonymous reviewers are also sincerely thanked for their remarks, corrections and suggestions that were very useful to improve this presentation. The editorial team is also thanked for efficiency and constant availability during the final proofing round.

Conflicts of Interest

The authors declare no conflict of interest.

References

  1. Ehlmann, A.J.; Hulings, N.C.; Glover, E.D. Stages of glauconite formation in modern foraminiferal sediments. Sedim. Petrol. 1963, 33, 87–96. [Google Scholar]
  2. Odin, G.S.; Matter, A. De glauconarium origine. Sedimentology 1981, 28, 611–641. [Google Scholar] [CrossRef]
  3. Velde, B. Green clay minerals. In Treatise on Geochemistry 7. Sediments, Diagnosis and Sedimentary Rocks; Holland, H.D., Turekian, K.K., Eds.; Elsevier: Amsterdam, The Netherlands, 2004; Volume 7, pp. 309–324. [Google Scholar]
  4. Cormier, R.F. Rubidium-Strontium ages of glauconite. Bull. Geol. Soc. Am. 1956, 67, 1812. [Google Scholar]
  5. Thompson, G.R.; Hower, J. An explanation for low radiometric ages from glauconite. Geochim. Cosmochim. Acta 1973, 37, 1473–1491. [Google Scholar] [CrossRef]
  6. Pasteels, P.; Laga, P.; Keppens, E. Essai d’application de la méthode radiométrique au strontium aux glauconies du Néogène: Le problème du traitement de l’échantillon avant analyse. Comptes Rendus Académie Des. Sci. 1976, 282, 2029–2032. [Google Scholar]
  7. Morton, J.P.; Long, L.E. Rb-Sr ages of glauconite recrystallization: Dating times of regional emergence above sea level. J. Sedim. Petrol. 1980, 54, 495–506. [Google Scholar]
  8. Keppens, E.; Pasteels, P. A comparison of rubidium-strontium and potassium-argon apparent ages on glauconies. In Numerical Dating in Stratigraphy; Odin, G.S., Ed.; Wiley: New York, NY, USA, 1982; pp. 225–239. [Google Scholar]
  9. Odin, G.S.; Dodson, M.H. Zero isotopic age of glauconies. In Numerical Dating in Stratigraphy; Odin, G.S., Ed.; Wiley: New York, NY, USA, 1982; pp. 277–306. [Google Scholar]
  10. Foland, K.A.; Hubacher, F.A.; Arehartet, G.B. 40Ar/39Ar dating of very fine-grained samples: An encapsulated-vial procedure to overcome the problem of 39Ar recoil loss. Chem. Geol. Isot. Geosc. Sect. 1992, 102, 269–276. [Google Scholar]
  11. Smith, P.E.; Evensen, N.M.; York, D. First successful 40Ar/39Ar dating of glauconites: Argon recoil in single grain cryptocrystalline material. Geology 1993, 21, 41–44. [Google Scholar] [CrossRef]
  12. Clauer, N.; Huggett, J.M.; Hillier, S. How reliable is the K-Ar glauconite chronometer? A case study of Eocene sediments from the Isle of Wight. Clay Min. 2005, 40, 167–176. [Google Scholar] [CrossRef]
  13. Odin, G.S.; Hunziker, J.C. Potassium-argon dating of washed, leached, weathered and reworked glauconies. In Numerical Dating in Stratigraphy; Odin, G.S., Ed.; J. Wiley: New York, NY, USA, 1982; pp. 363–385. [Google Scholar]
  14. Keppens, E. Onderzoek van Het Glauconiet als Geochronometer voor de Rb-Sr Dateringsmethode. Ph.D. Thesis, Vrije Universiteit Brussel, Brussel, Belgium, 1981. [Google Scholar]
  15. Clauer, N.; Chaudhuri, S.; Kralik, M.; Bonnot-Courtois, C. Effects of experimental leaching on Rb-Sr and K-Ar isotopic systems and REE contents of diagenetic illite. Chem. Geol. 1993, 103, 1–16. [Google Scholar] [CrossRef]
  16. Clauer, N.; Cocker, J.D.; Chaudhuri, S. Isotopic dating of diagenetic illites in reservoir sandstones: Influence of the investigator effect. In Origin, Diagenesis, and Petrophysics of Clay Minerals in Sandstones. Soc. Econ. Pal. Miner. Spec. Pub. 1992, 47, 5–12. [Google Scholar]
  17. Berggren, W.A. A Cenozoic time-scale—Some implications for regional geology and paleobiogeography. Lethaia 1972, 5, 195–215. [Google Scholar] [CrossRef]
  18. Samuel, J.; Rouault, R.; Besnus, Y. Analyse multi-élémentaire standardisée des matériaux géologiques en spectrométrie d’émission par plasma à couplage inductif. Analusis 1985, 13, 312–317. [Google Scholar]
  19. Odin, G.S. Interlaboratory standards for dating purposes. In Numerical Dating in Stratigraphy; Odin, G.S., Ed.; John Wiley & Sons: Chichester, UK, 1982; pp. 123–148. [Google Scholar]
  20. Lee, J.Y.; Marti, K.; Severinghaus, J.P.; Kawamura, K.; Yoo, H.S.; Lee, J.B.; Kim, J.S. A redetermination of the isotopic abundances of Atmospheric Ar. Geochim. Cosmochim. Acta 2006, 70, 4507–4512. [Google Scholar] [CrossRef]
  21. Steiger, R.; Jäger, E. Subcommission on Geochronology: Convention on the use of decay constants in geo- and cosmochronology. Earth Plan. Sci. Lett. 1977, 36, 359–362. [Google Scholar] [CrossRef]
  22. Bonhomme, M.; Thuizat, R.; Pinault, Y.; Clauer, N.; Wendling, R.; Winkler, R. Méthode de Datation Potassium-Argon. Appareillage et Technique; Rapport technique du Centre de Géochimie de la Surface; Univ. Louis Pasteur: Strasbourg, France, 1975; 53p. [Google Scholar]
  23. Li, M.; Fang, X.; Galy, A.; Wang, H.; Song, X.; Wang, X. Hydrated sulfate minerals (bloedite and polyhalite): Formation and paleoenvironmental implications. Carbonates Evaporites 2020, 35, 126. [Google Scholar] [CrossRef]
  24. Harper, C.T. Graphic solution to the problem of 40Ar loss from metamorphic minerals. Eclog. Geol. Helv. 1970, 63, 119–140. [Google Scholar]
  25. Clauer, N. The rubidium-strontium method applied to sediments: Certitudes and uncertainties. In Numerical Dating in Stratigraphy; Odin, G.S., Ed.; John Wiley and Sons, Ltd.: Hoboken, NJ, USA, 1982; pp. 245–276. [Google Scholar]
  26. McArthur, J.M.; Howarth, R.J.; Bailey, T.R. Strontium isotope stratigraphy: LOWESS Version 3: Best fit to the marine Sr-isotope curve 0–509 Ma and accompanying look-up table for deriving numerical age. J. Geol. 2001, 109, 155–170. [Google Scholar] [CrossRef] [Green Version]
Figure 1. The analytical variations of the major elements leached from the three L7, L8 and L10 glauconite separates by the different ultrasonic leaching experiments. The numbers at the bottom of each diagram refer to the different aliquots of each sample in Table 1. LOI stands for loss of ignition.
Geosciences 11 00439 g001
Figure 2. Copies of the original XRD diagrams of the three untreated glauconite fractions from Keppens [14]. The three diagrams A, B and C for the three samples L7, L8 and L10 are somehow fuzzy but show clearly the two peaks of the blödite mineral in the L10 sample located by the two red arrows.
Geosciences 11 00439 g002
Figure 3. (A) Diagram displaying the content of radiogenic 40Ar relative to K2O in the untreated and leached glauconite separates; (B) the same for the K–Ar age values (in Ma) relative to the K2O content; (C) 40Ar/36Ar vs. 40K/36Ar isochron diagram of the untreated and leached glauconite separates.
Geosciences 11 00439 g003
Figure 4. (A) Isochron diagram of the previously published Rb–Sr data, the full line mostly includes the data points of sample L7 and the dashed line are those of sample L8 and some of sample L10; (B) Diagram of the 87Sr/86Sr ratios of the analyzed residues with their Sr content. In both diagrams, the samples yield symbols colored differently with a numbering of the individual leaching.
Geosciences 11 00439 g004
Figure 5. Synoptic chart of the Rb–Sr and K–Ar isotopic results of all L7, L8 and L10 glauconite aliquots. The red rectangle locates the stratigraphic age of the samples, each branch giving the analytical uncertainty for each method. The three full-lined circles integrate the data points of each sample, while the dashed-line circles identify the five data points within the stratigraphic age. The colored symbols to the right stand for all samples.
Geosciences 11 00439 g005
Table 1. (A) Contents of major elements in the untreated and leached glauconite pellets; (B) Positive and negative variations in the content of major elements of the leached separates, relative to the untreated reference sample. The numbers in brackets identify the successive aliquots; bdl stands for below detection limit.
(A)
Sample IDsSiO2
(%)
Al2O3
(%)
MgO
(%)
CaO
(%)
Fe2O3
(%)
Mn3O4
(%)
TiO2
(%)
Na2O
(%)
K2O
(%)
LOI
(%)
Total
(%)
L7 untreated (=1)48.66.303.600.4025.30.0100.070.127.246.7698.40
US H2O 20′ (=2)47.86.403.570.5024.20.0100.060.127.348.2798.27
US HAc 20′ (=3)48.96.103.530.3024.10.0130.070.117.338.4798.92
US HCl 20′ (=4)49.36.203.52bdl24.40.0140.080.147.527.7598.92
US HCl 60′ (=5)50.46.203.55bdl24.50.010.060.137.138.33100.3
US H2O + US HAc (=6)49.36.003.690.3025.40.0150.060.107.428.92101.2
L8 untreated (=1)48.96.603.600.4024.60.0160.070.097.376.9998.64
US H2O 20′ (=2)50.06.203.630.4024.90.0120.070.097.297.89100.5
US HAc 20′ (=3)49.66.403.660.3025.00.0130.070.057.318.80101.2
US HCl 20′ (=4)47.65.903.60bdl24.60.0160.060.077.209.7398.78
US H2O 60′ (=5)49.46.403.60bdl24.70.0100.060.077.328.2399.79
US H2O 24h (=6)49.56.303.56bdl24.50.0100.070.097.388.2099.61
L10 untreated (=1)48.97.703.570.5024.00.0150.140.087.146.9699.01
US HAc 20′ (=3)49.97.103.560.3023.50.0110.080.307.128.74100.6
US HCl 20′ (=4)49.87.303.54bdl23.20.0140.120.167.128.7199.96
US H2O + US HAc (=5)49.27.603.670.3024.20.0120.100.077.287.78100.2
USH2O + USHAc (2×) (=6)48.27.003.530.2024.80.0160.090.117.217.0798.23
(B)
Sample IDsSiO2
(%)
Al2O3
(%)
MgO
(%)
CaO
(%)
Fe2O3
(%)
Mn3O4
(%)
TiO2
(%)
Na2O
(%)
K2O
(%)
LOI
(%)
Total
(%)
L7 untreated (=1)00000000000
US H2O 20′ (=2)−1.6+1.6+0.8−25−4.30−14.30+1.4−22.3+0.1
US HAc 20′ (=3)+0.6−3.2+1.9−25−4.7−30.00−8.3+1.2−25.3+0.1
US HCl 20′ (=4)+1.4+1.6+2.2 −3.6−40.0−14.3−16.7−3.9−11.6+0.5
US HCl 60′ (=5)+3.7+1.6+1.4 −3.2−90.0−14.3+8.3+1.5−23.2+1.9
US H2O + US HAc (=6)+1.4−4.8+2.5−25+0.4−50.0−14.3−16.7+2.5−32.8+2.8
L8 untreated (=1)00000000000
US H2O 20′ (=2)+2.2−6.1+0.80+1.2−25.000+1.1−12.9+2.0
US HAc 20′ (=3)+1.4−3.1+1.7−25+1.6−18.80−44.4+0.8−25.9−2.8
US HCl 20′ (=4)−2.7−10.60 00−14.3−22.2+2.3−39.2+0.1
US H2O 1h (=5)+1.0−3.10 +0.4−37.5−14.3−22.2+0.7−17.7+1.2
US H2O 24h (=6)>1.2−4.5+1.1 +0.4−37.500+0.1 +1.0
L10 untreated (=1)00000000000
US HAc 20′ (=3)+2.0−7.8+0.3−40+2.1−26.7−42.9−2750+0.3−25.6+1.6
US HCl 20′ (=4)+1.9−5.2+0.8 +3.3−6.7−14.3−2000+0.3−25.1+1.0
US H2O + US HAc (=5)+0.6+1.3−2.8−40+0.8−20.0−28.6−125+2.2−11.8+1.0
USH2O + USHAc (2×) (=6))−1.4−9.1+1.1−60−3.3−6.7−35.7−375+1.0+1.6+0.8
Table 2. (A) Contents in trace elements of the untreated and leached glauconite pellets; (B) Variations in the contents in trace elements of the leached separates relative to the untreated reference sample.
(A)
Sample IDsRb
(μg/g)
Sr
(μg/g)
Ba
(μg/g)
V
(μg/g)
Ni
(μg/)
Co
(μg/g)
Cr
(μg/)
Zn
(μg/g)
Cu
(μg/)
Sc
(μg/g)
Y
(μg/g)
Zr
(μg/g)
L7 untreated (=1)22228.7
US + H2O 20′ (=2)23124.611.012911315.01741087.0010.59.0022.0
US + HAc 20′ (=3) 14.08.0013110714.019086.04.0011.08.0026.0
US + HCl 20′ (=4)2303.038.0012911214.019980.05.009.502.0022.0
US + HCl 60′ (=5)2315.347.0012911113.019480.05.0010.52.0025.0
US+H2O + US+HAc (=6) 15.06.0012610915.017495.012.010.08.0020.0
L8 untreated (=1)22635.117.012811515.020893.05.0010.57.0033.0
US + H2O 20′ (=2)23026.0
US + HAc 20′ (=3)22720.25.0013011711.019784.04.0010.57.0028.0
US + HCl 20′ (=4)2254.437.0013511316.017579.03.009.502.0022.0
US + H2O 60′ (=5) 3.006.0013130.017.016974.0bdl10.5bdl24.0
US + H2O 24h (=6) 3.007.0013537.014.017374.0bdl10.0bdl24.0
L10 untreated (=1)22422.013.016012417.034884.025.013.511.043.0
US + HAc 20′ (=3)22515.4
US + HCl 20′ (=4)2249.6012.01523915.022884.010.011.59.0075.0
US+H2O + US+HAc (=5) 16.011.013911016.023591.015.011.59.0075.0
US+H2O + US+HAc (2×) (=6) 14.09.00134nd16.0nd67.013.012.010.035.0
(B)
Sample IDsRb
(%)
Sr
(%)
Ba
(%)
V
(%)
Ni
(%)
Co
(%)
Cr
(%)
Zn
(%)
Cu
(%)
Sc
(%)
Y
(%)
Zr
(%)
L7 untreated (=1)00
US + H2O 20′ (=2)+4.1−14.6 000000000
US + HAc 20′ (=3) −51.2 +1.6−5.3−6.7+9.2−20.4−42.9+4.8−11.1+18.2
US + HCl 20′ (=4)+3.6−96.1 0−0.9−6.7+14.4−25.9−28.6−9.5−77.80
US + HCl 60′ (=5)+4.1−81.4 0−1.8−13.3+11.5−25.9−28.60−77.8+13.6
US H2O + US HAc (=6) −47.7 −1.6−3.500−12.0+71.4−4.8−11.1−9.1
L8 untreated (=1)000000000000
US + H2O 20′ (=2)+1.8−25.9
US + HAc 20′ (=3)+0.4−42.5−70.6+1.6+1.7−26.7−5.3−9.7−20.000−15.2
US + HCl 20′ (=4)+0.1−87.4−58.8+5.5−1.7+6.6−15.9−15.1−40.09.5−71.4−33.3
US + H2O 60′ (=5) −91.5−64.7+2.3−73.9+13.3−18.8−20.4bdl0bdl−27.3
US + H2O 24h (=6) −91.5−58.8+5.5−67.8−6.7−16.8−20.4bdl−4.8bdl−27.3
L10 untreated (=1)000000000000
US + HAc 20′ (=3)+0.4−30.0
US + HCl 20′ (=4)0−56.4−7.7−5.0−68.5−11.8−34.50−60.0−17.4−18.2+74.4
US H2O + US HAc (=5) −27.3−15.4−13.1−11.3−5.9−32.5+8.3−40.0−14.8−18.2+74.4
US H2O + US HAc (2×) (=6) −36.4−30.8−16.3nd−5.9nd−20.2−48.0−8.9−9.1−18.6
Table 3. K–Ar data of the untreated and leached glauconite pellets.
Sample IDsK2O40Ar *rad 40Ar40Ar/36Ar40K/36ArAge
(%)(%)(10−6 cm3/g) (×10−6)(Ma +/−2σ)
L7 untreated (=1)7.2463.034.33799.3466.618.4 (0.6)
US + H2O 20′ (=2)7.3457.664.41696.4356.218.5 (0.7)
US + HAc 20′ (=3)7.3366.334.12877.6572.317.3 (0.6)
US + HCl 20′ (=4)7.5266.394.31 17.7 (0.6)
L8 untreated (=1)7.3762.774.49793.7453.718.8 (0.6)
US + H2O 20′ (=2)7.2970.994.431018.6660.018.7 (0.6)
US + HAc 20′ (=3)7.3167.944.61921.7549.619.4 (0.6)
US + HCl 20′ (=4)7.1957.744.57 19.6 (0.7)
L10 untreated (=1)7.1467.595.08 21.9 (0.7)
US + H2O 20′ (=2)7.2573.844.88 20.7 (0.7)
US + HAc 20′ (=3)7.1264.315.23828.0385.422.7 (0.8)
US + HCl 20′ (=4)7.1272.285.37 23.1 (0.7)
(* = radiogenic)
Table 4. Report of the Rb–Sr data of the untreated and leached glauconite pellets by Pasteels et al. [6]). The * stands for radiogenic and the i for initial ratio that corresponds to the seawater ratio at the syn-deposition time of glauconite crystallization.
Sample IDsRbSr87Sr *87Rb/86Sr87Sr/86SrAge (+/−2σ)
(μg/g)(μg/g)(+/−1%) (+/−10−5)(i = 0.7086)
L7 untreated (=1)22228.718.5 (1.0)22.420.7151 (4)20.3 (1.5)
US H2O 20′ (=2)23124.617.6 (1.5)27.220.7159 (7)18.8 (2.2)
US HCl 20′ (=4)2303.0316.7 (0.5)220.10.7649 (17)18.1 (0.6)
US HCl 60′ (=5)2315.3418.3 (0.3)125.40.7436 (5)19.7 (0.6)
L8 untreated (=1)22635.123.0 (1.2)18.670.7152 (3)25.0 (1.9)
US H2O 20′ (=2)23026.016.9 (0.6)25.640.7151 (2)18.3 (1.2)
duplicate 0.7151 (2)
US HAc 20′ (=3)22720.217.5 (0.4)32.530.7174 (2)18.8 (0.7)
US HCl 20′ (=4)2254.4317.4 (0.2)147.20.7482 (4)18.9 (0.5)
US HCl 60′ (=5)2285.8618.7 (1.0)112.80.7411 (14)20.7 (1.6)
US HCl 24h (=6)2274.2018.5 (0.3)156.70.7534 (6)20.1 (0.6)
L10 untreated (=1)22454.938.6 (0.4)11.830.7157 (8) 42.1 (1.6)
US HAc 20′ (=3)22515.422.3 (1.0)42.360.7232 (6)24.2 (1.3)
US HCl 20′ (=4)2249.6026.1 (0.6)67.640.7363 (3)28.7 (1.1)
Publisher’s Note: MDPI stays neutral with regard to jurisdictional claims in published maps and institutional affiliations.

