
Effect of Composition on Engineering Behavior of Clay Tills


Abstract
:1. Introduction
2. Geological Setting
3. Research Methodology
4. Results and Discussion
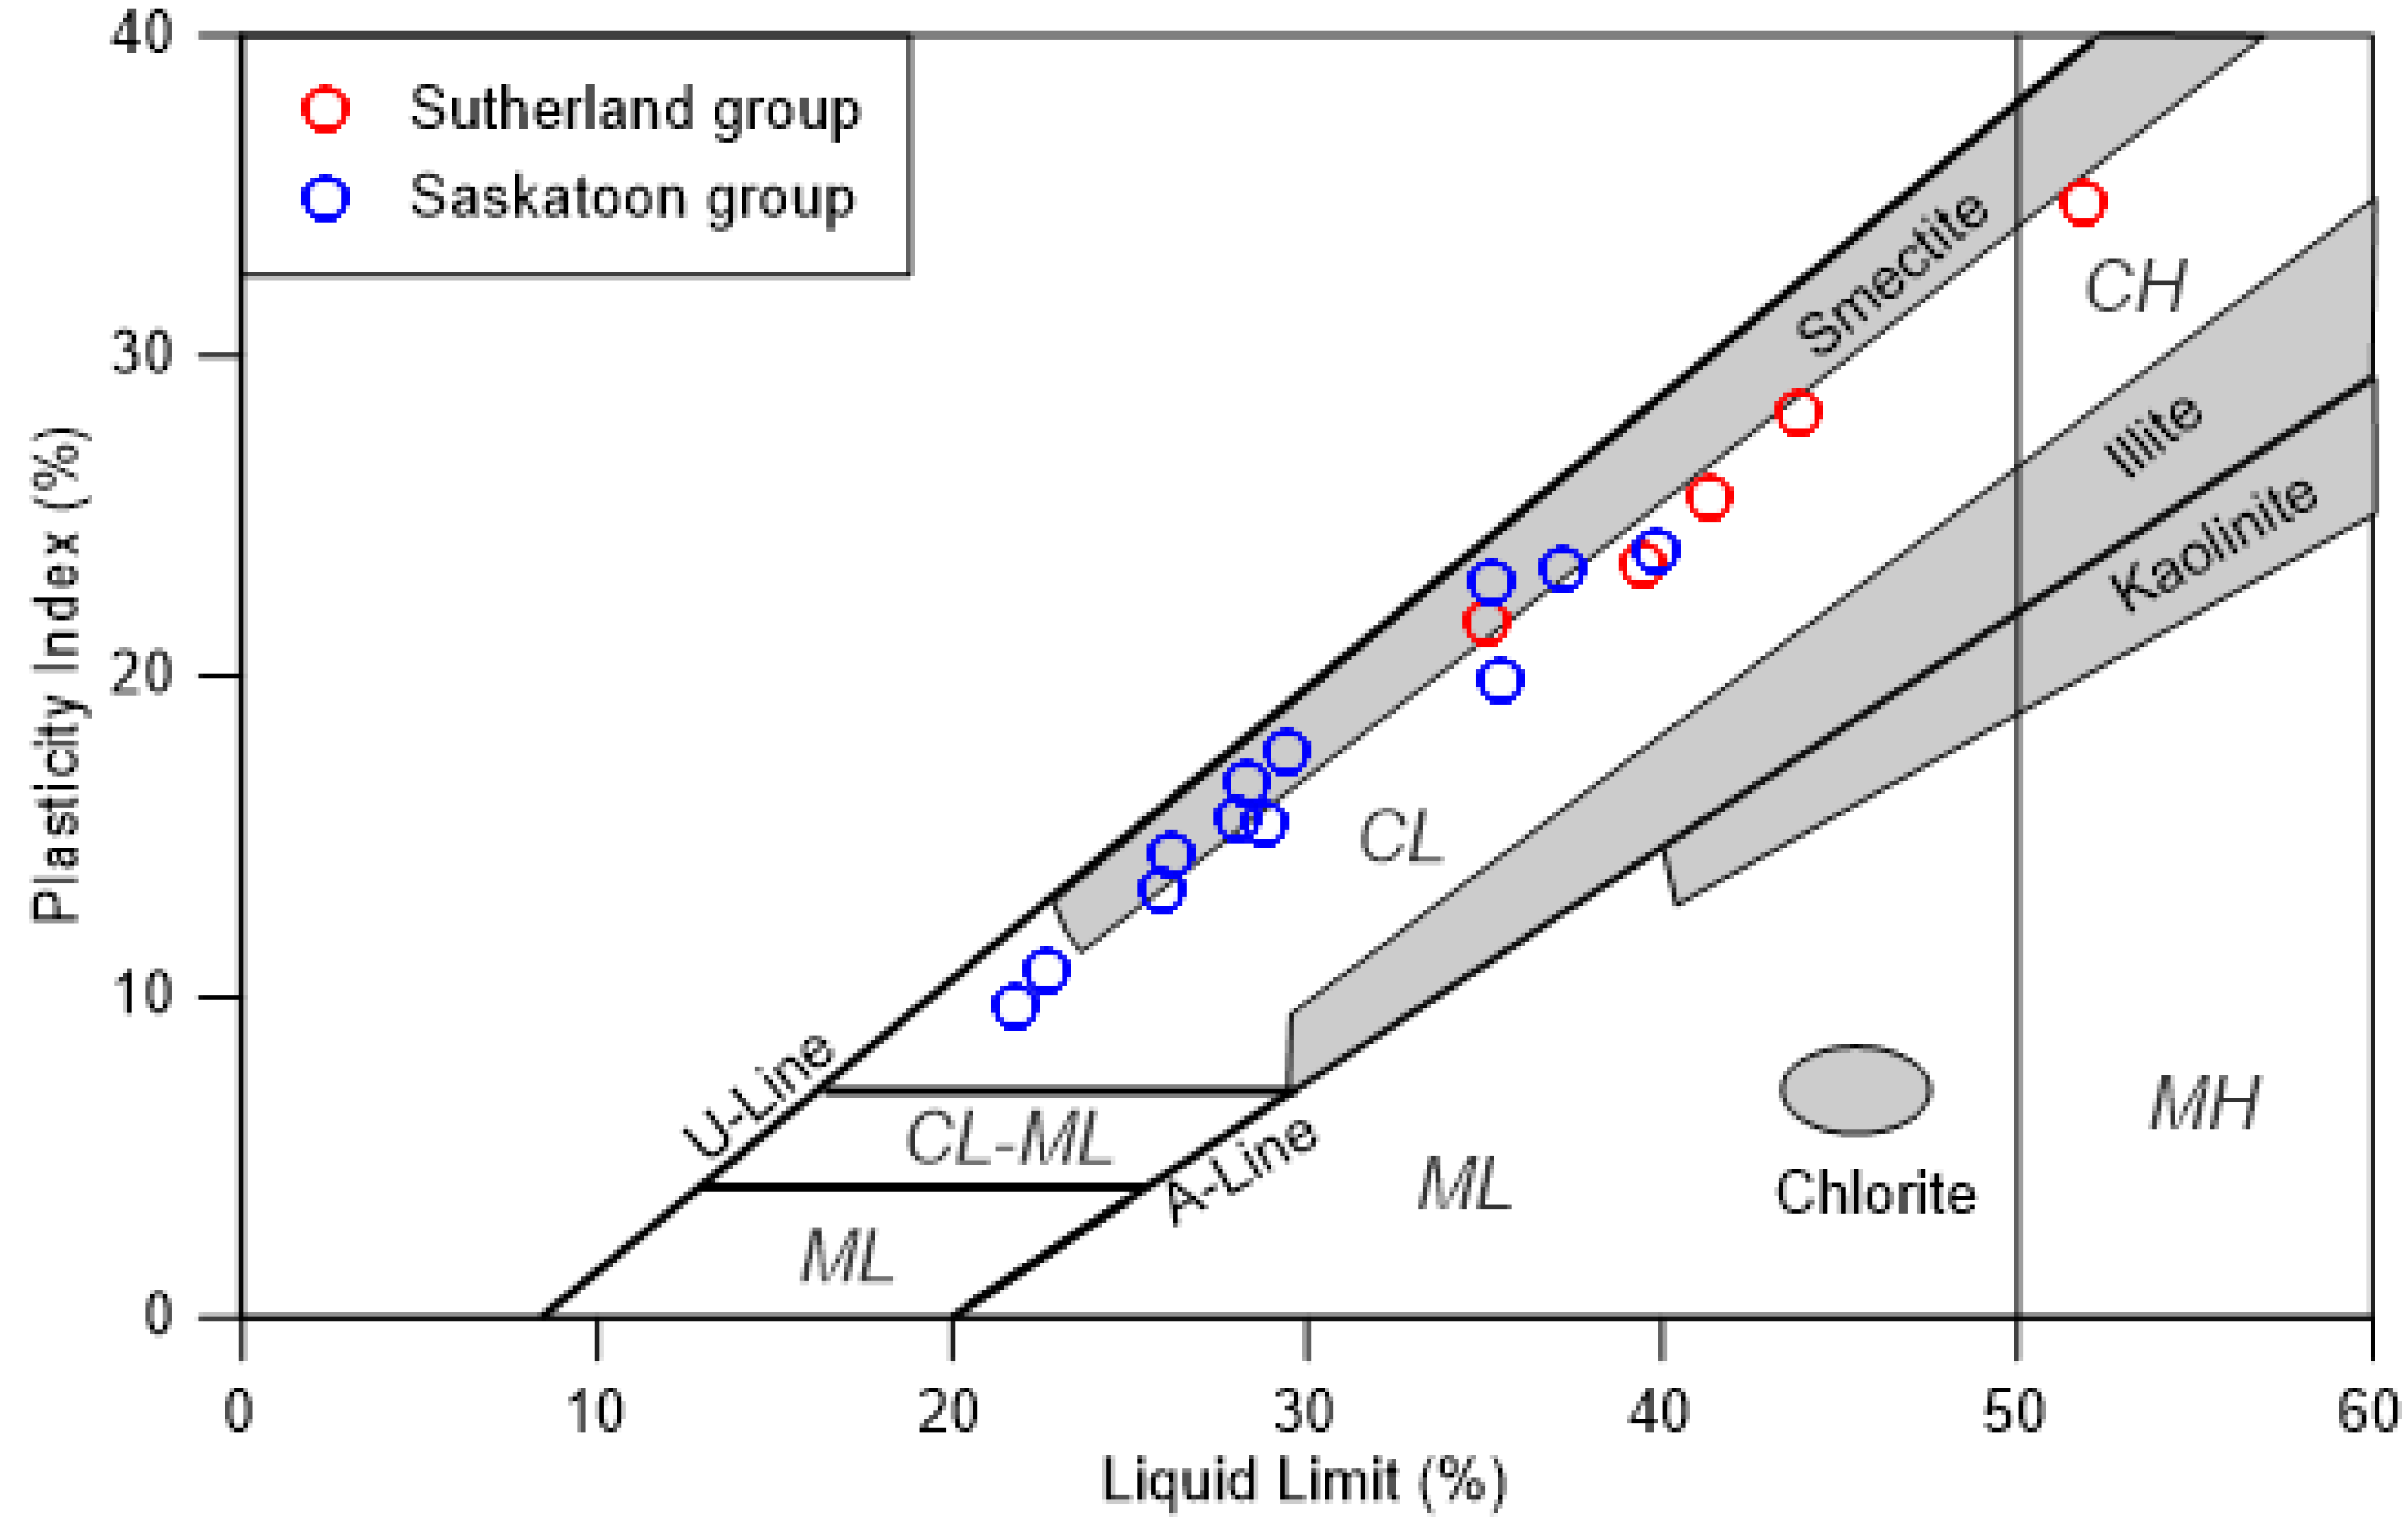
4.1. Index Properties
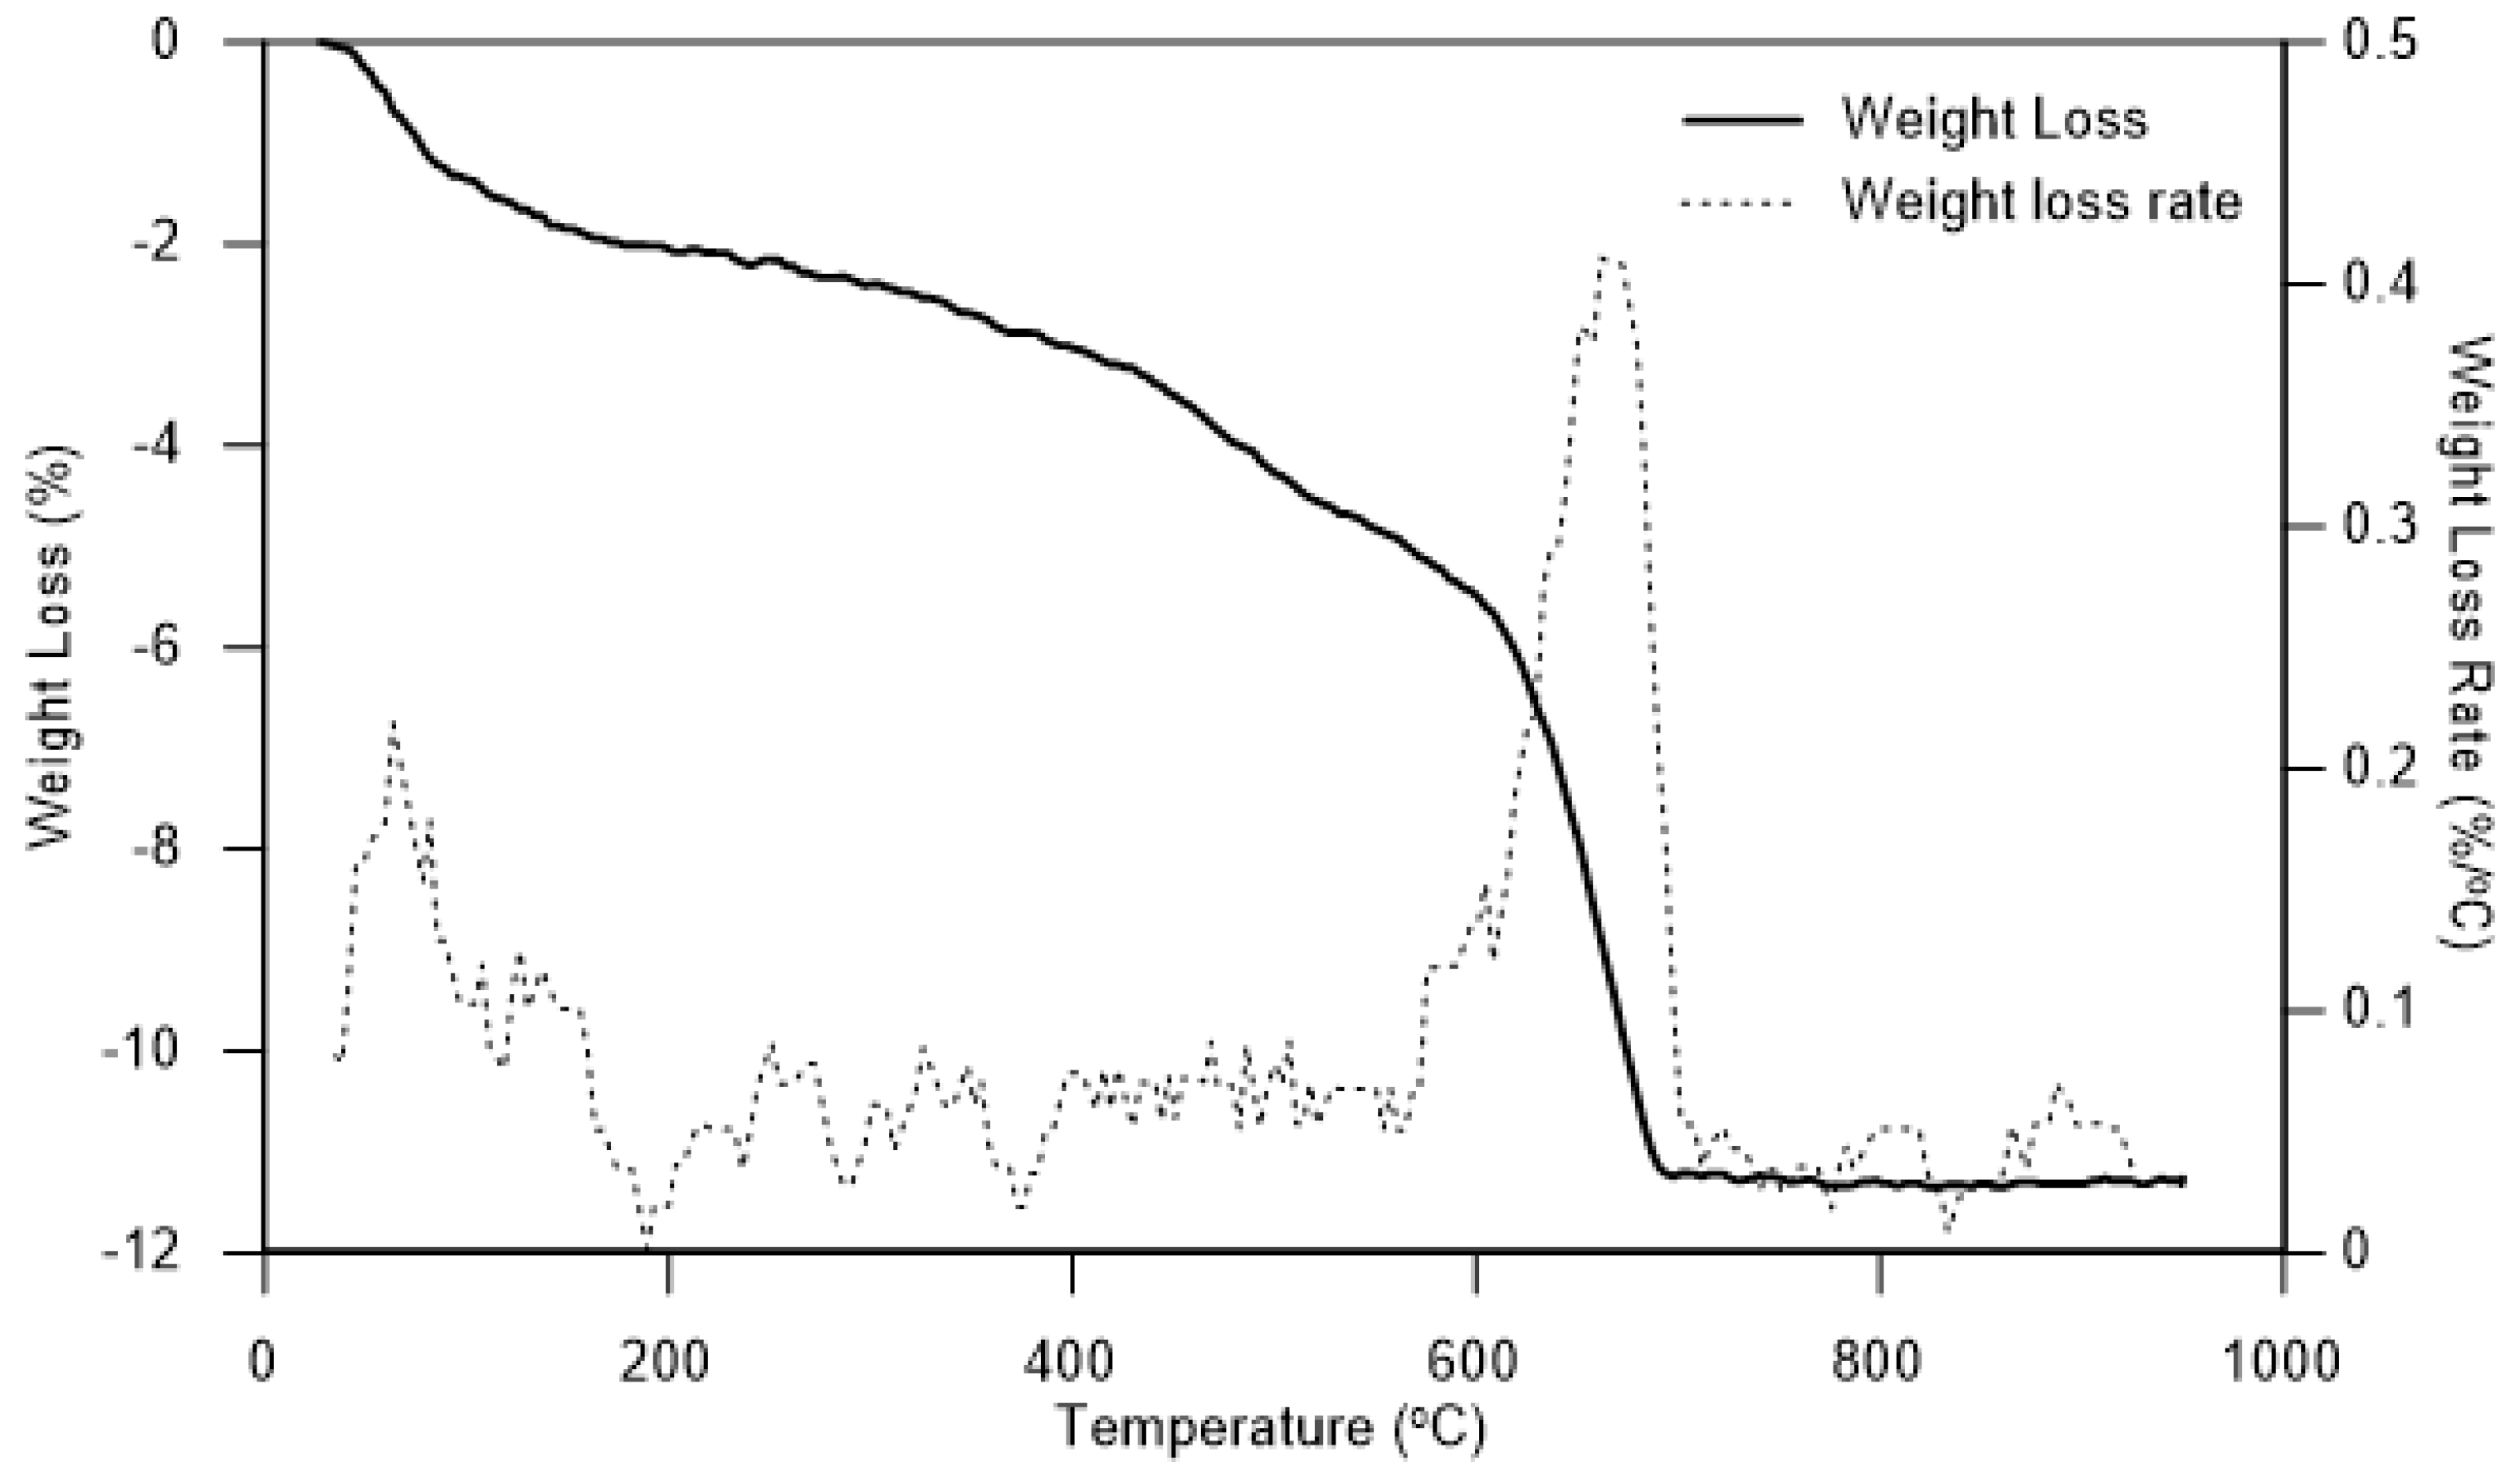
4.2. Soil and Pore Water Compositions
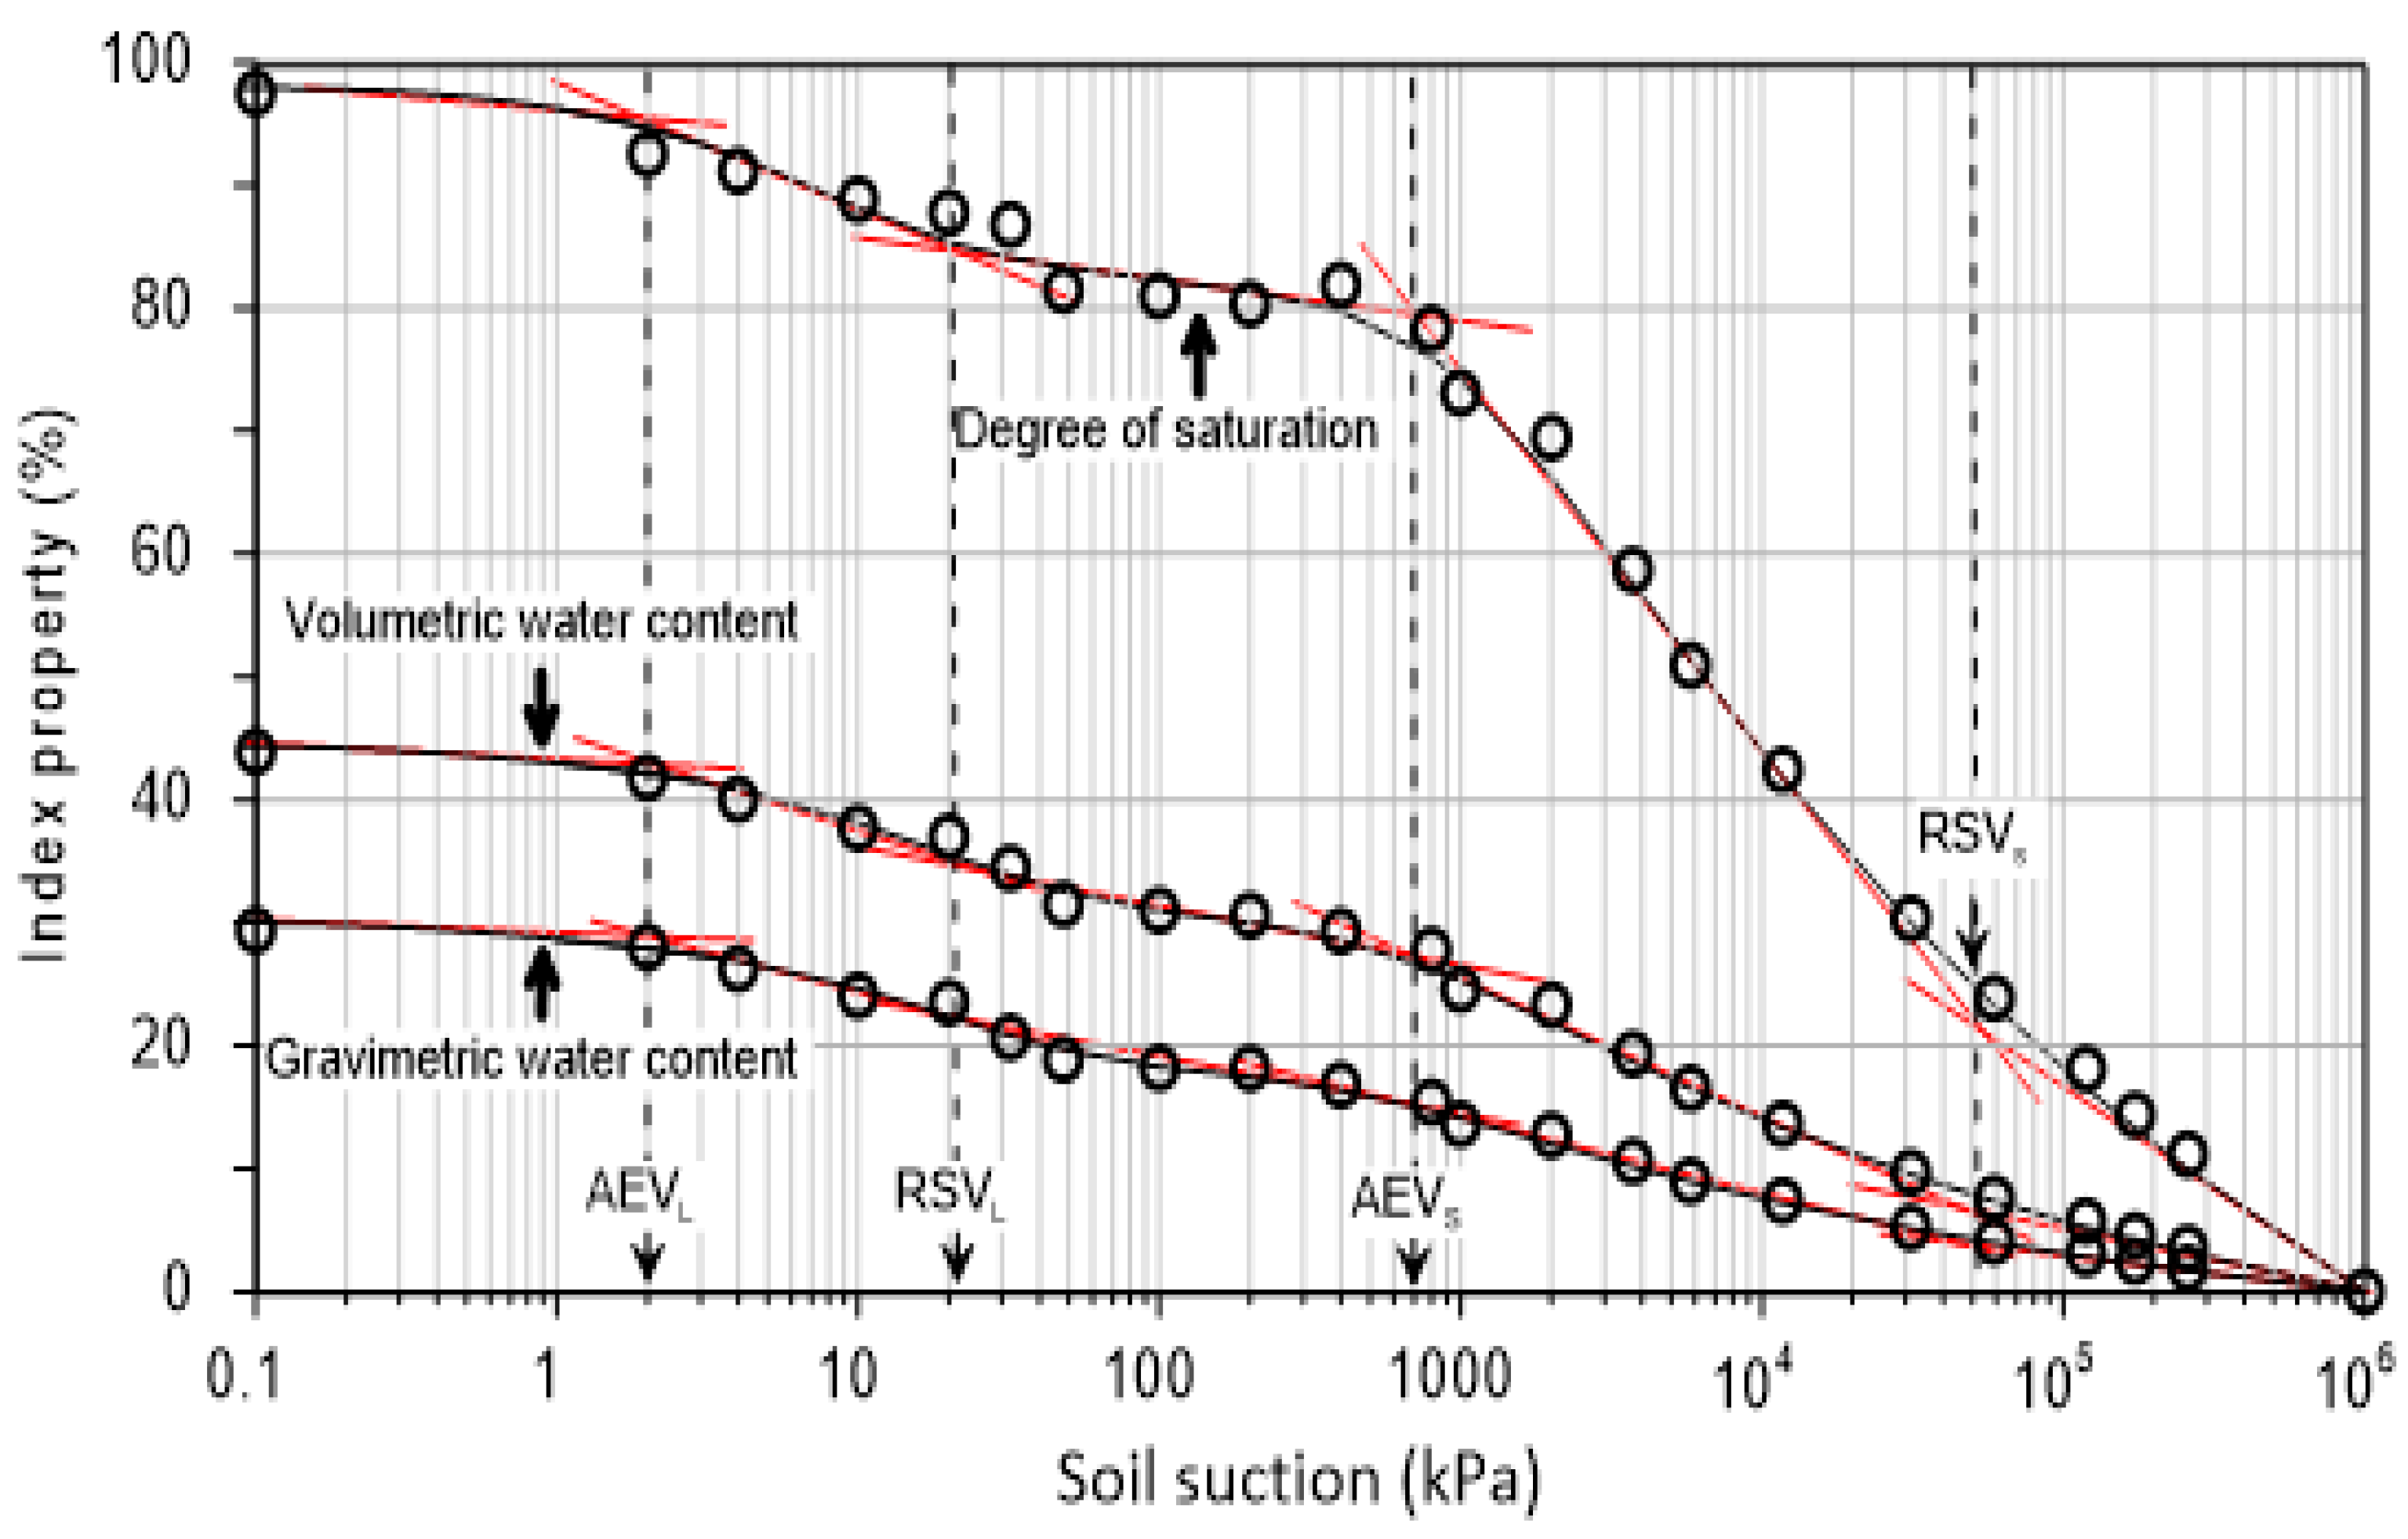
4.3. Water Retention
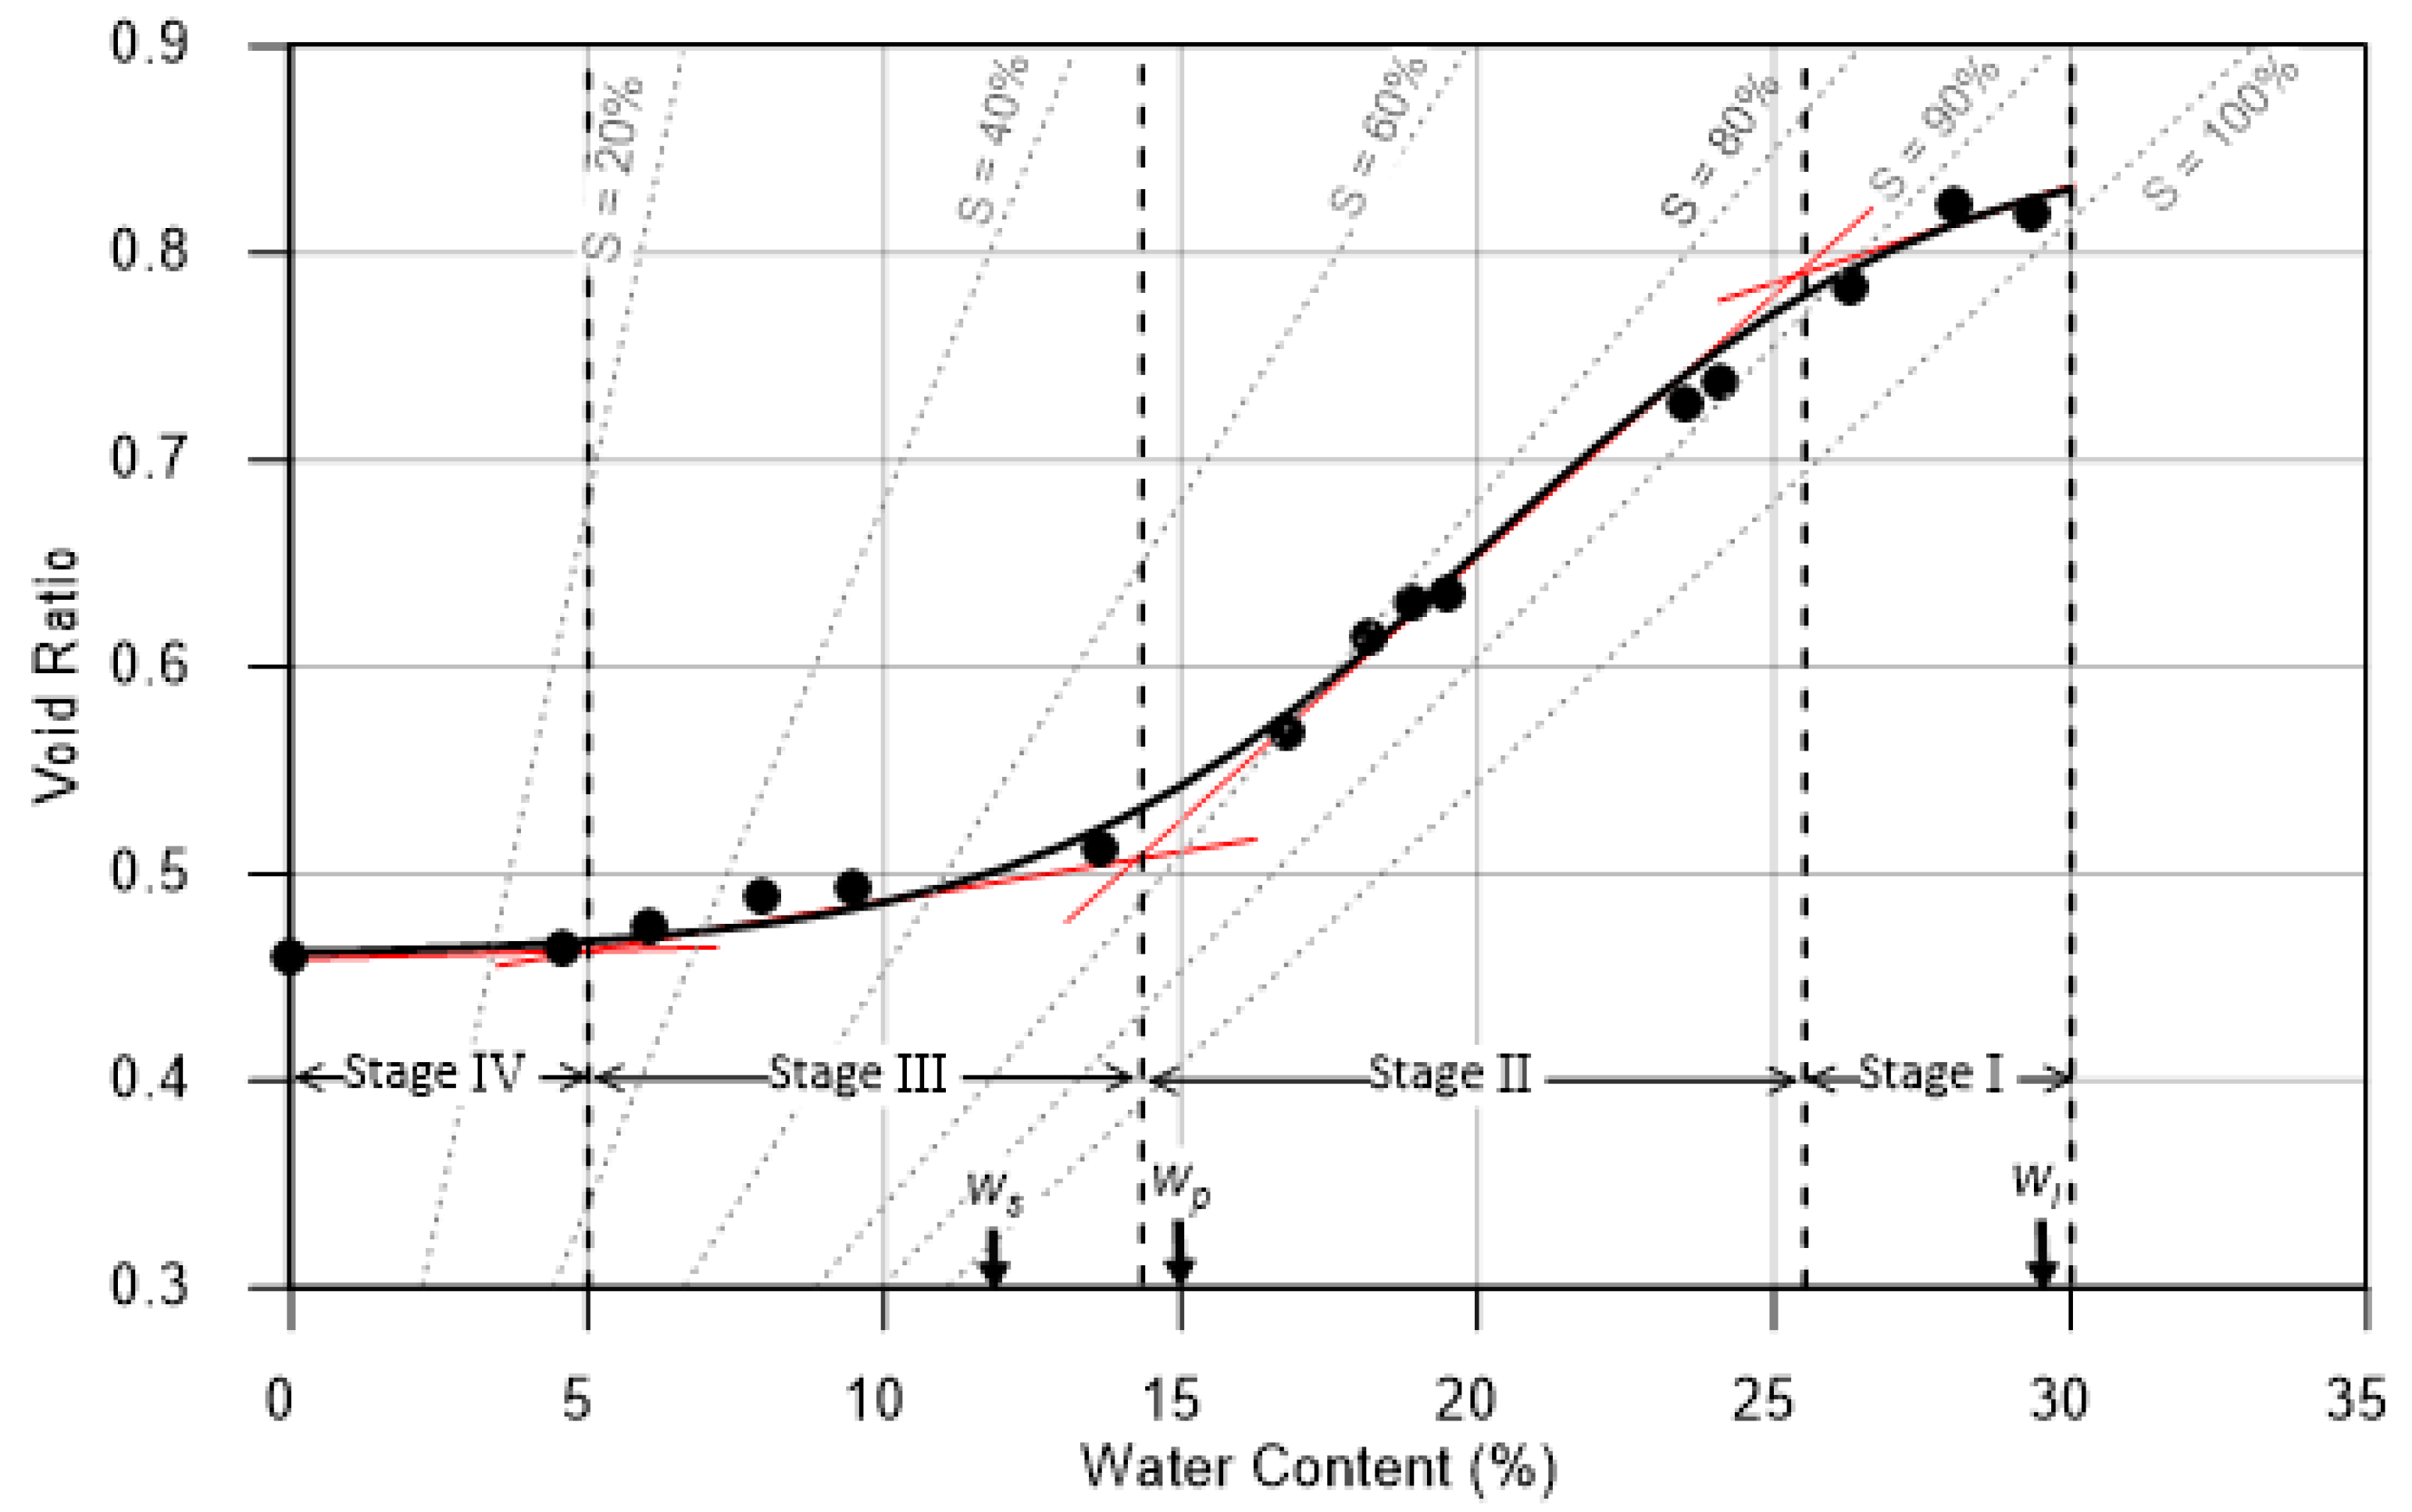
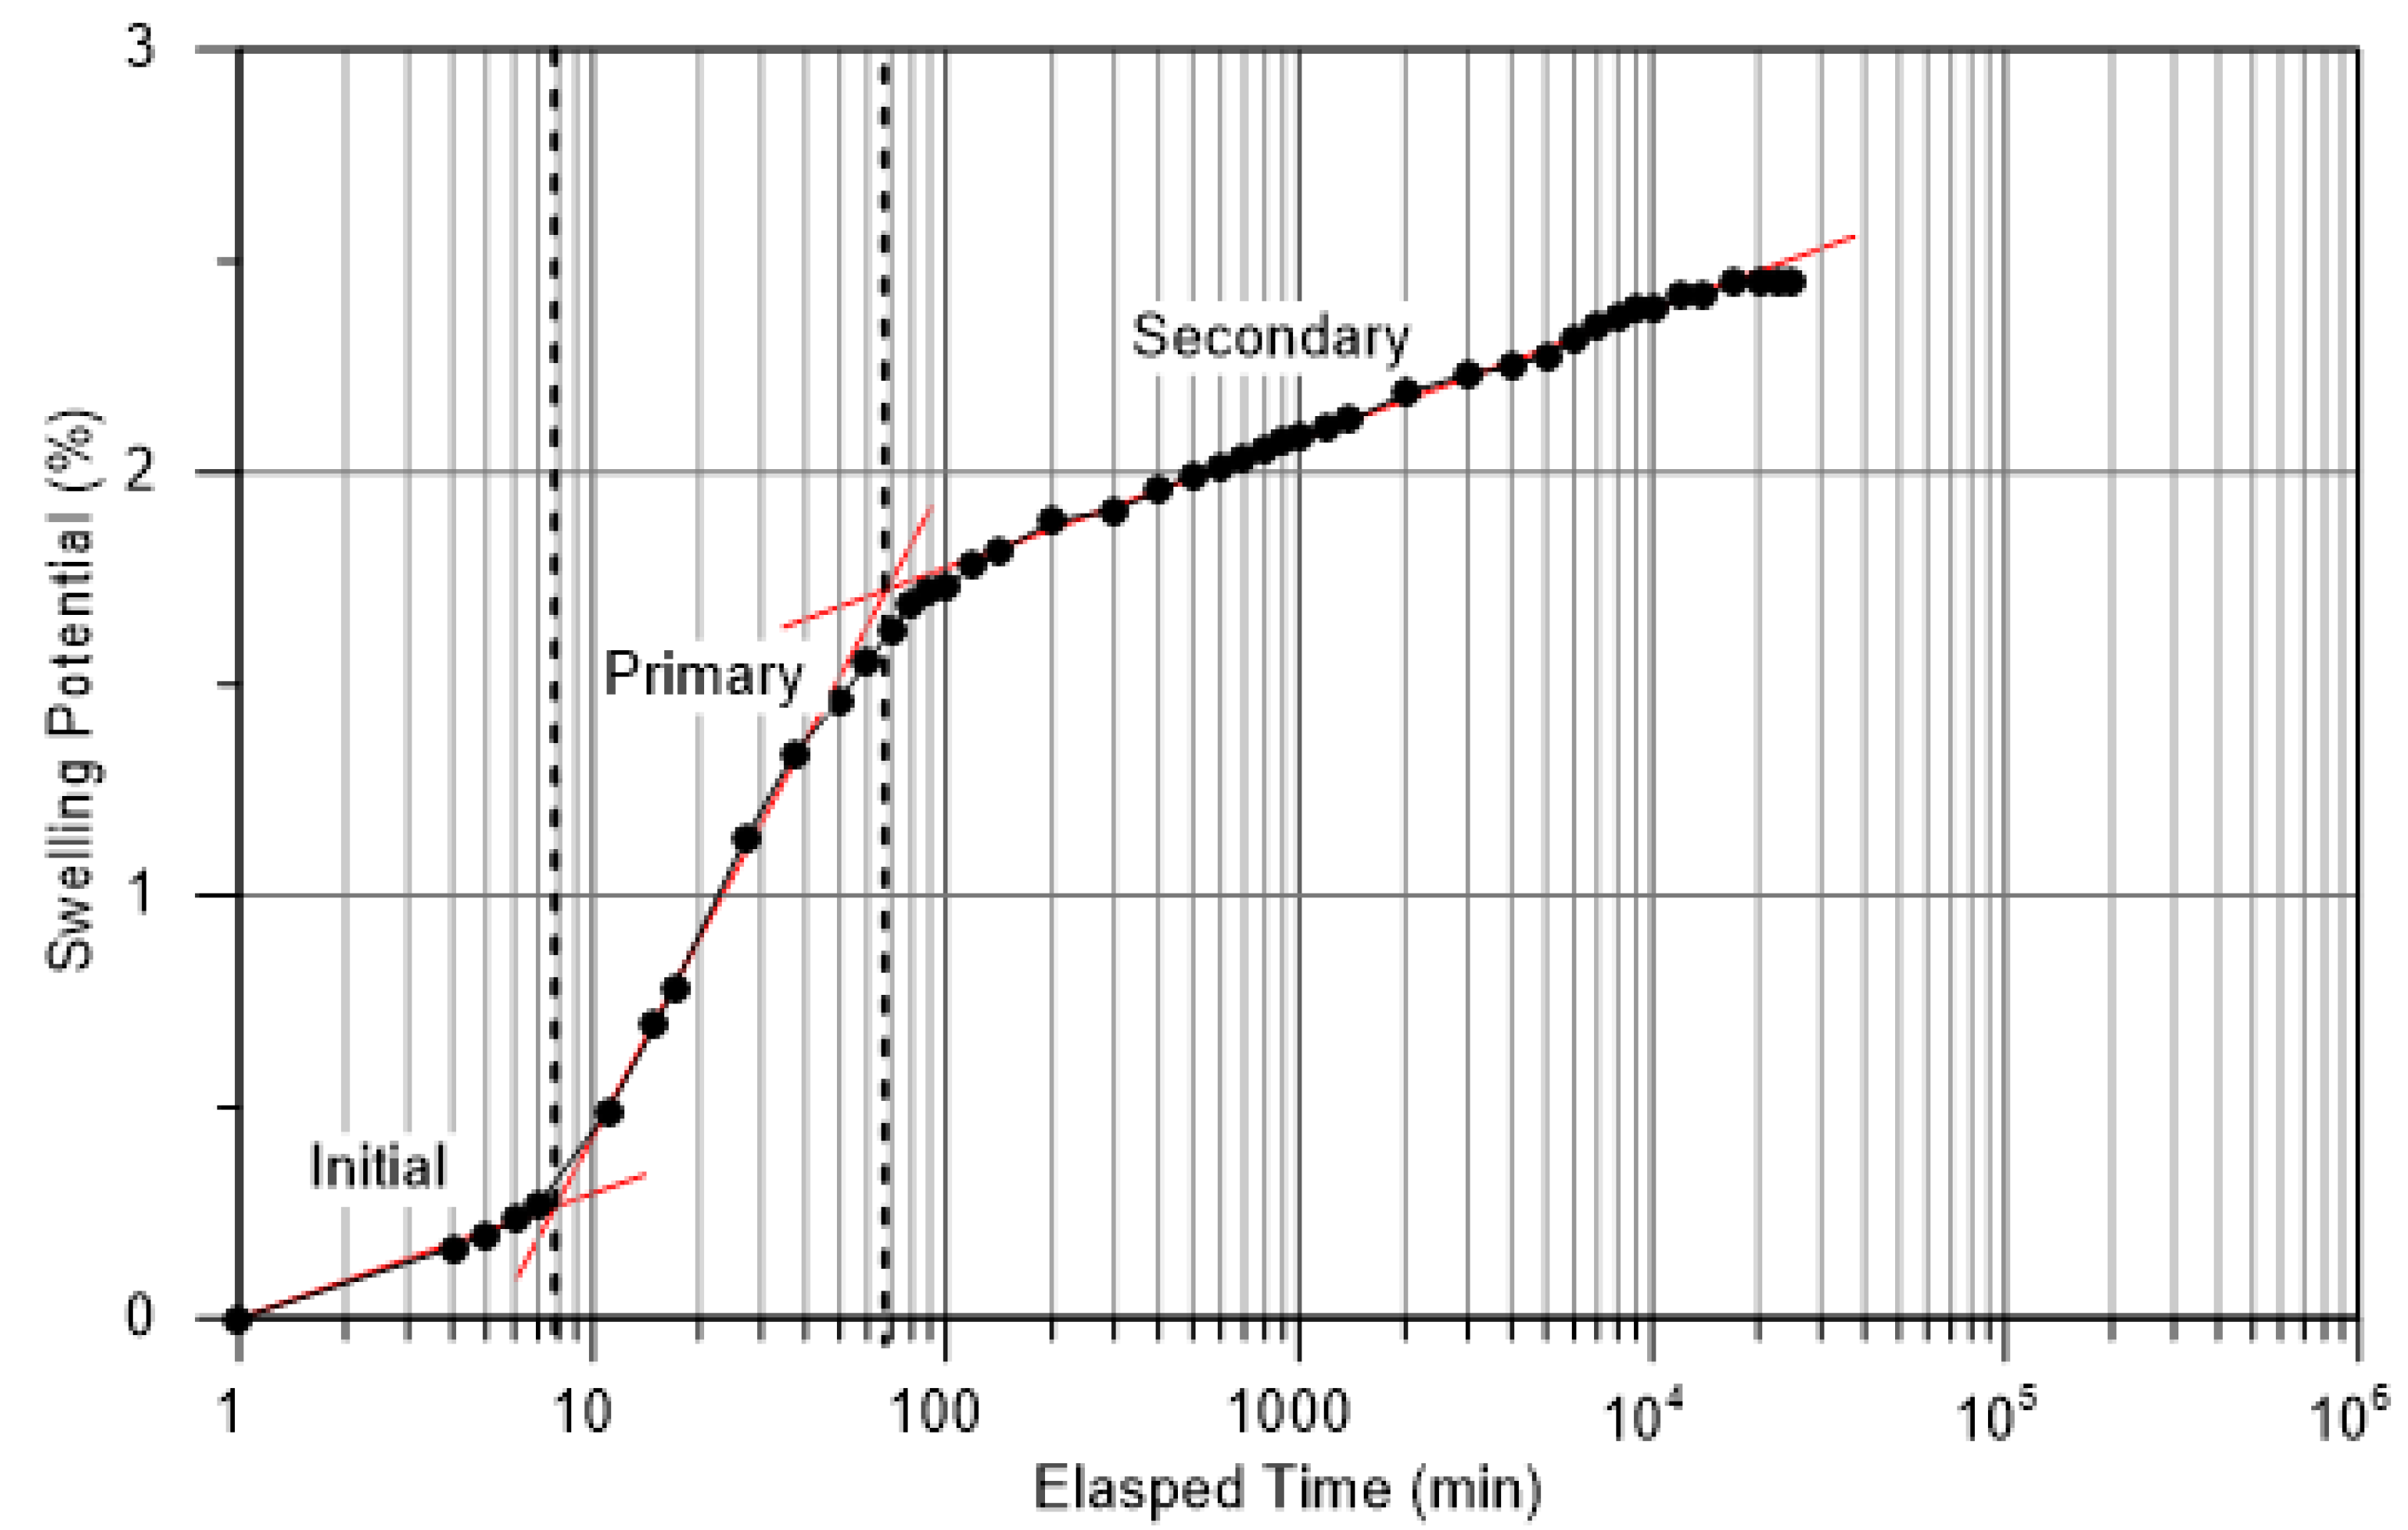
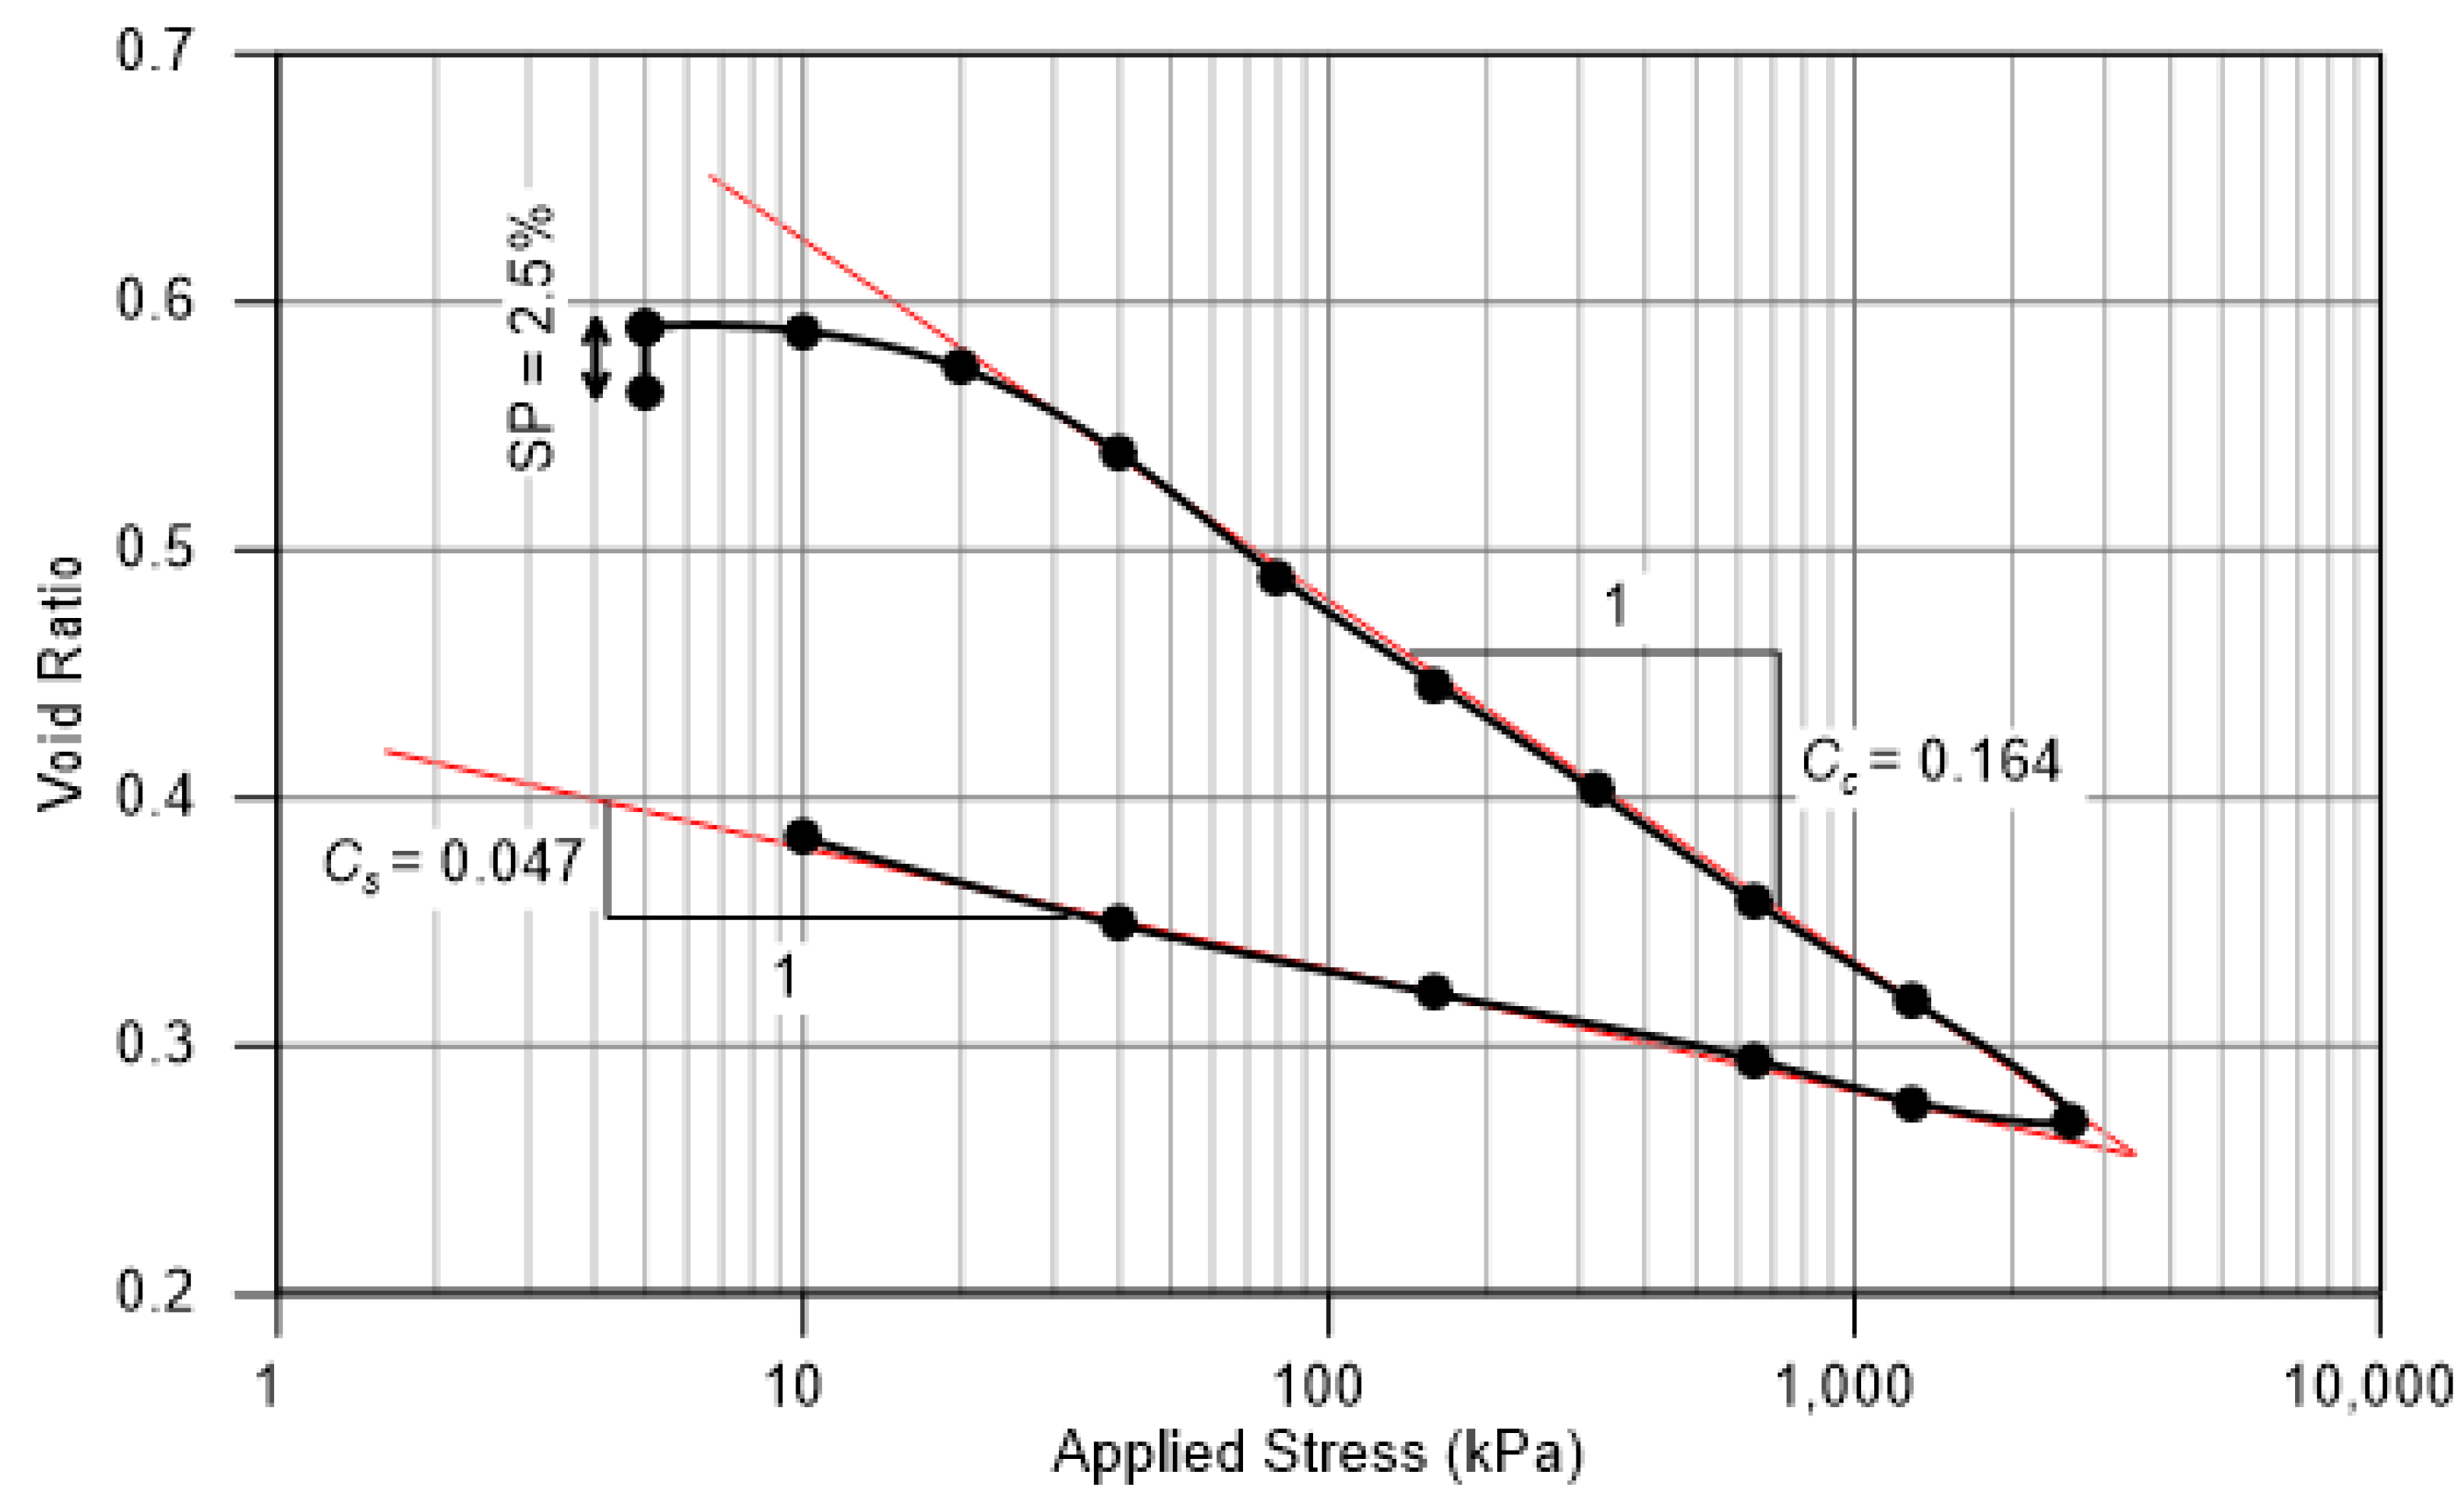
4.4. Volumetric Changes
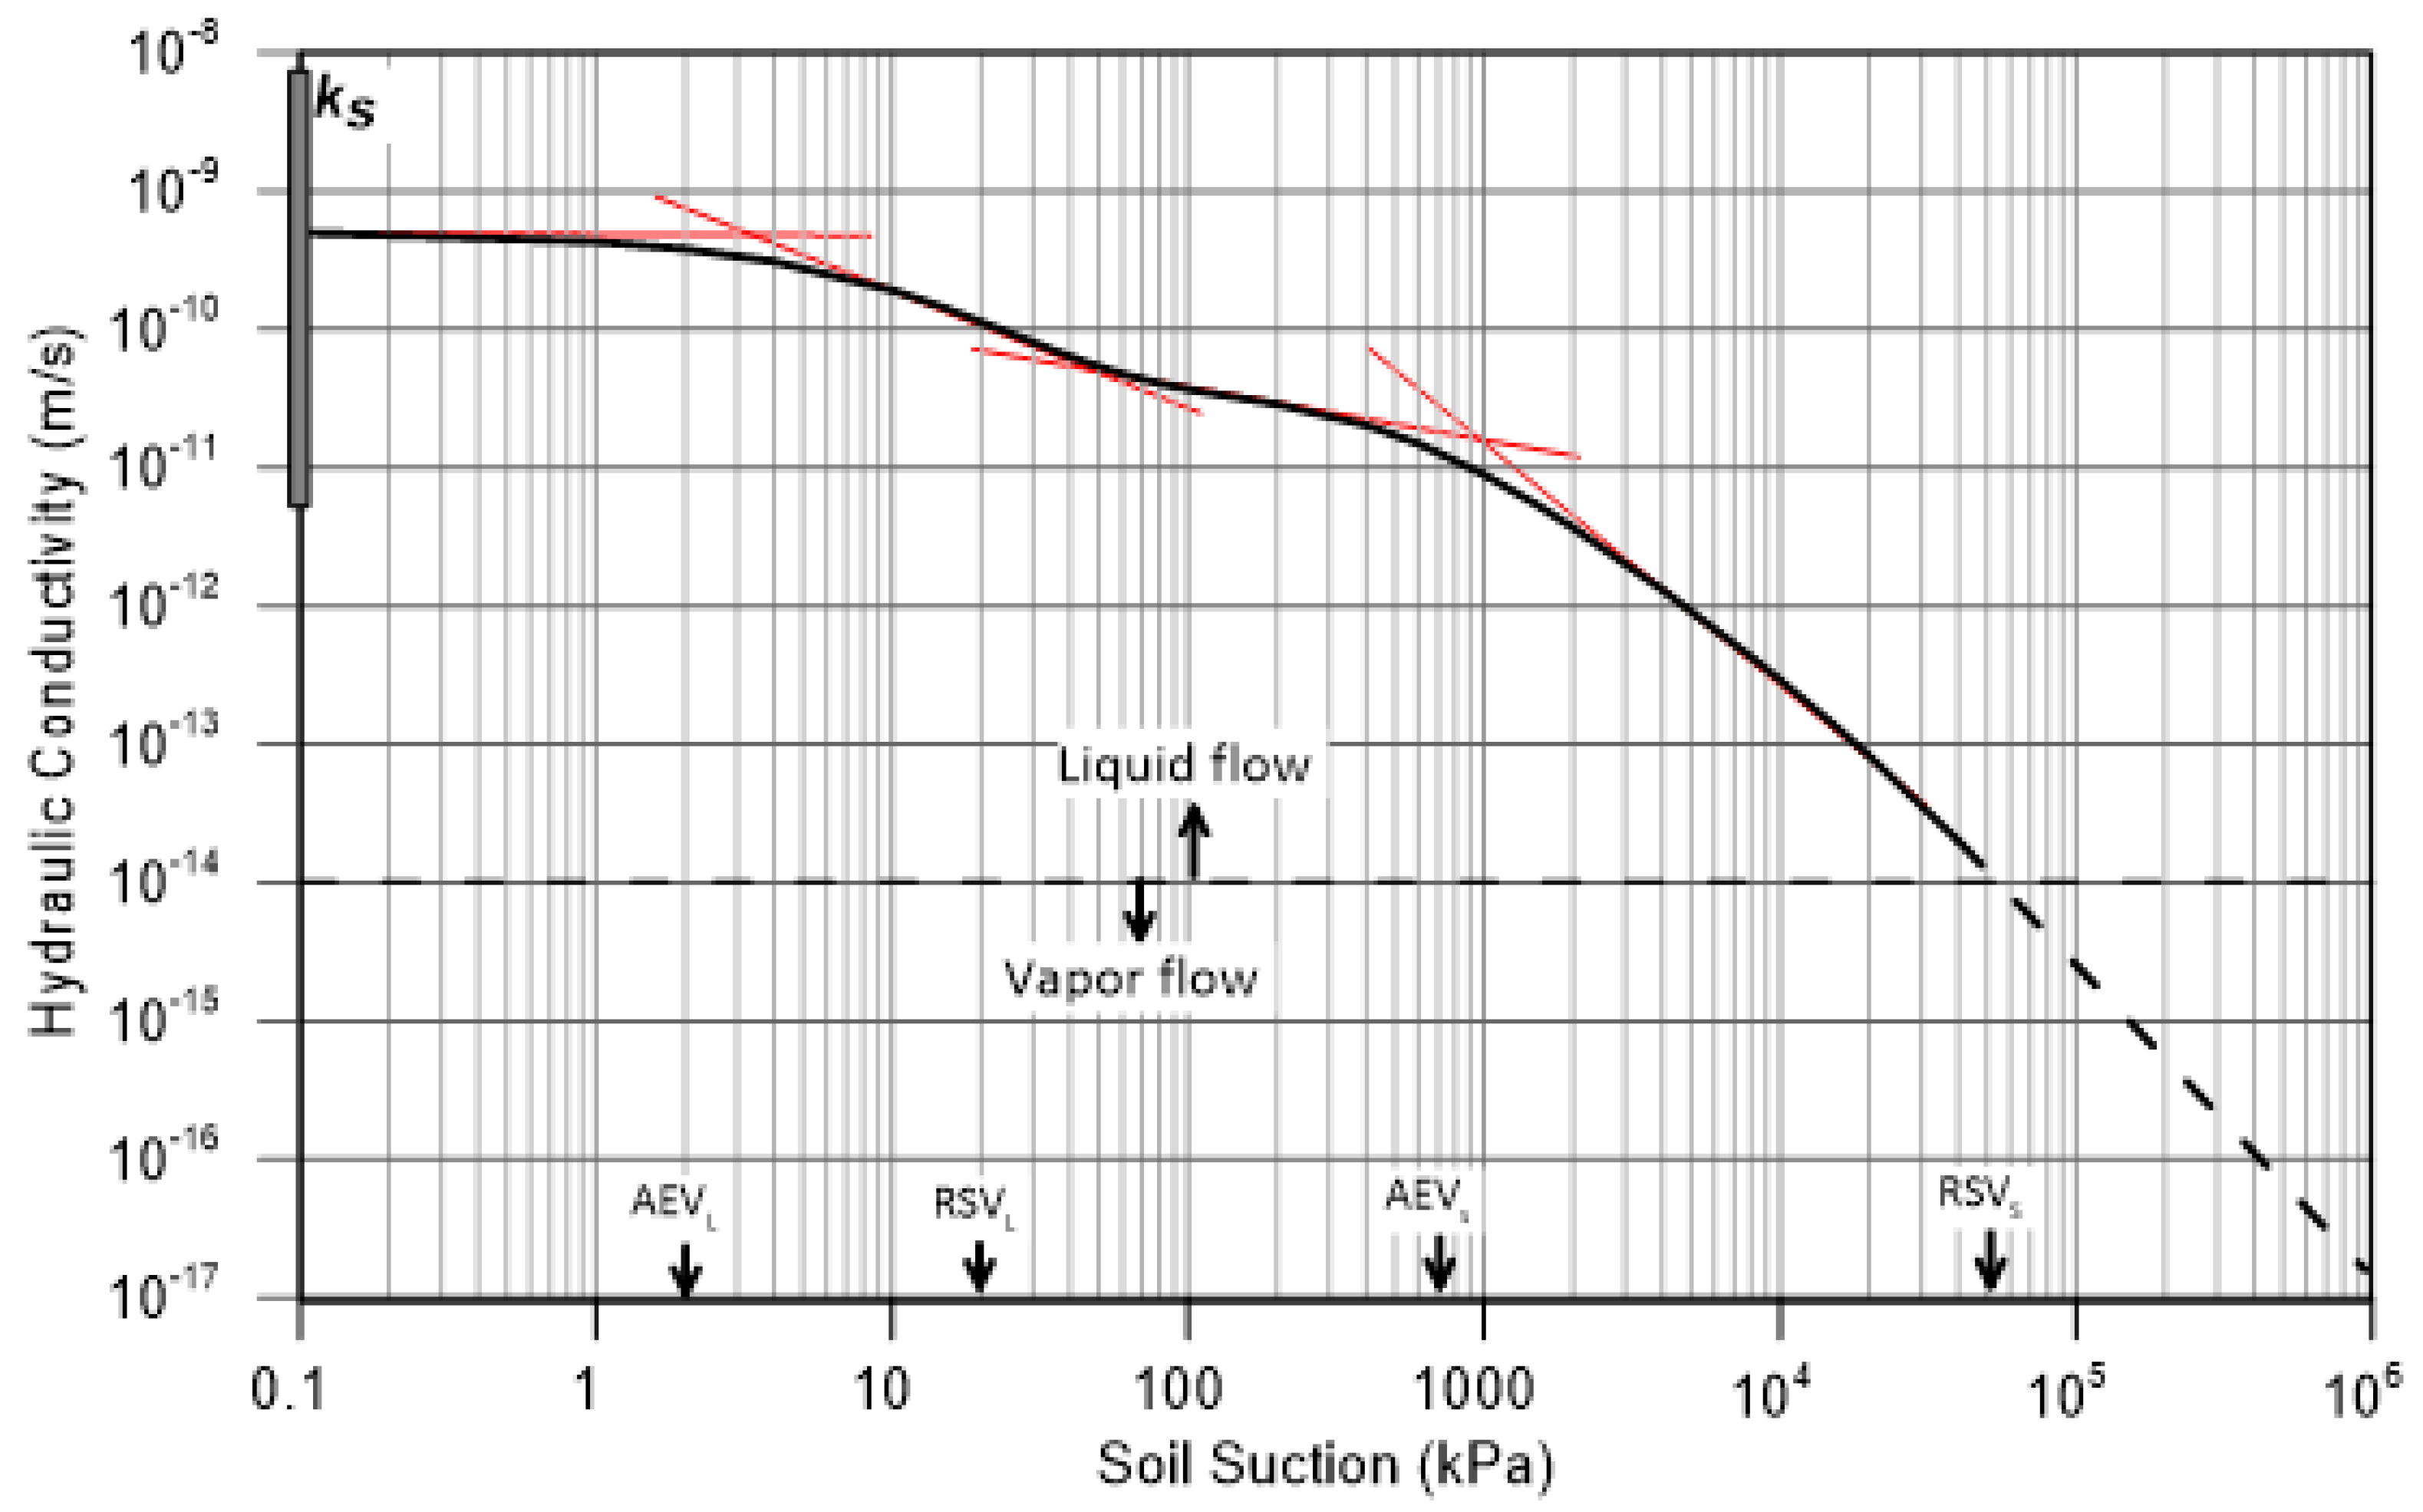
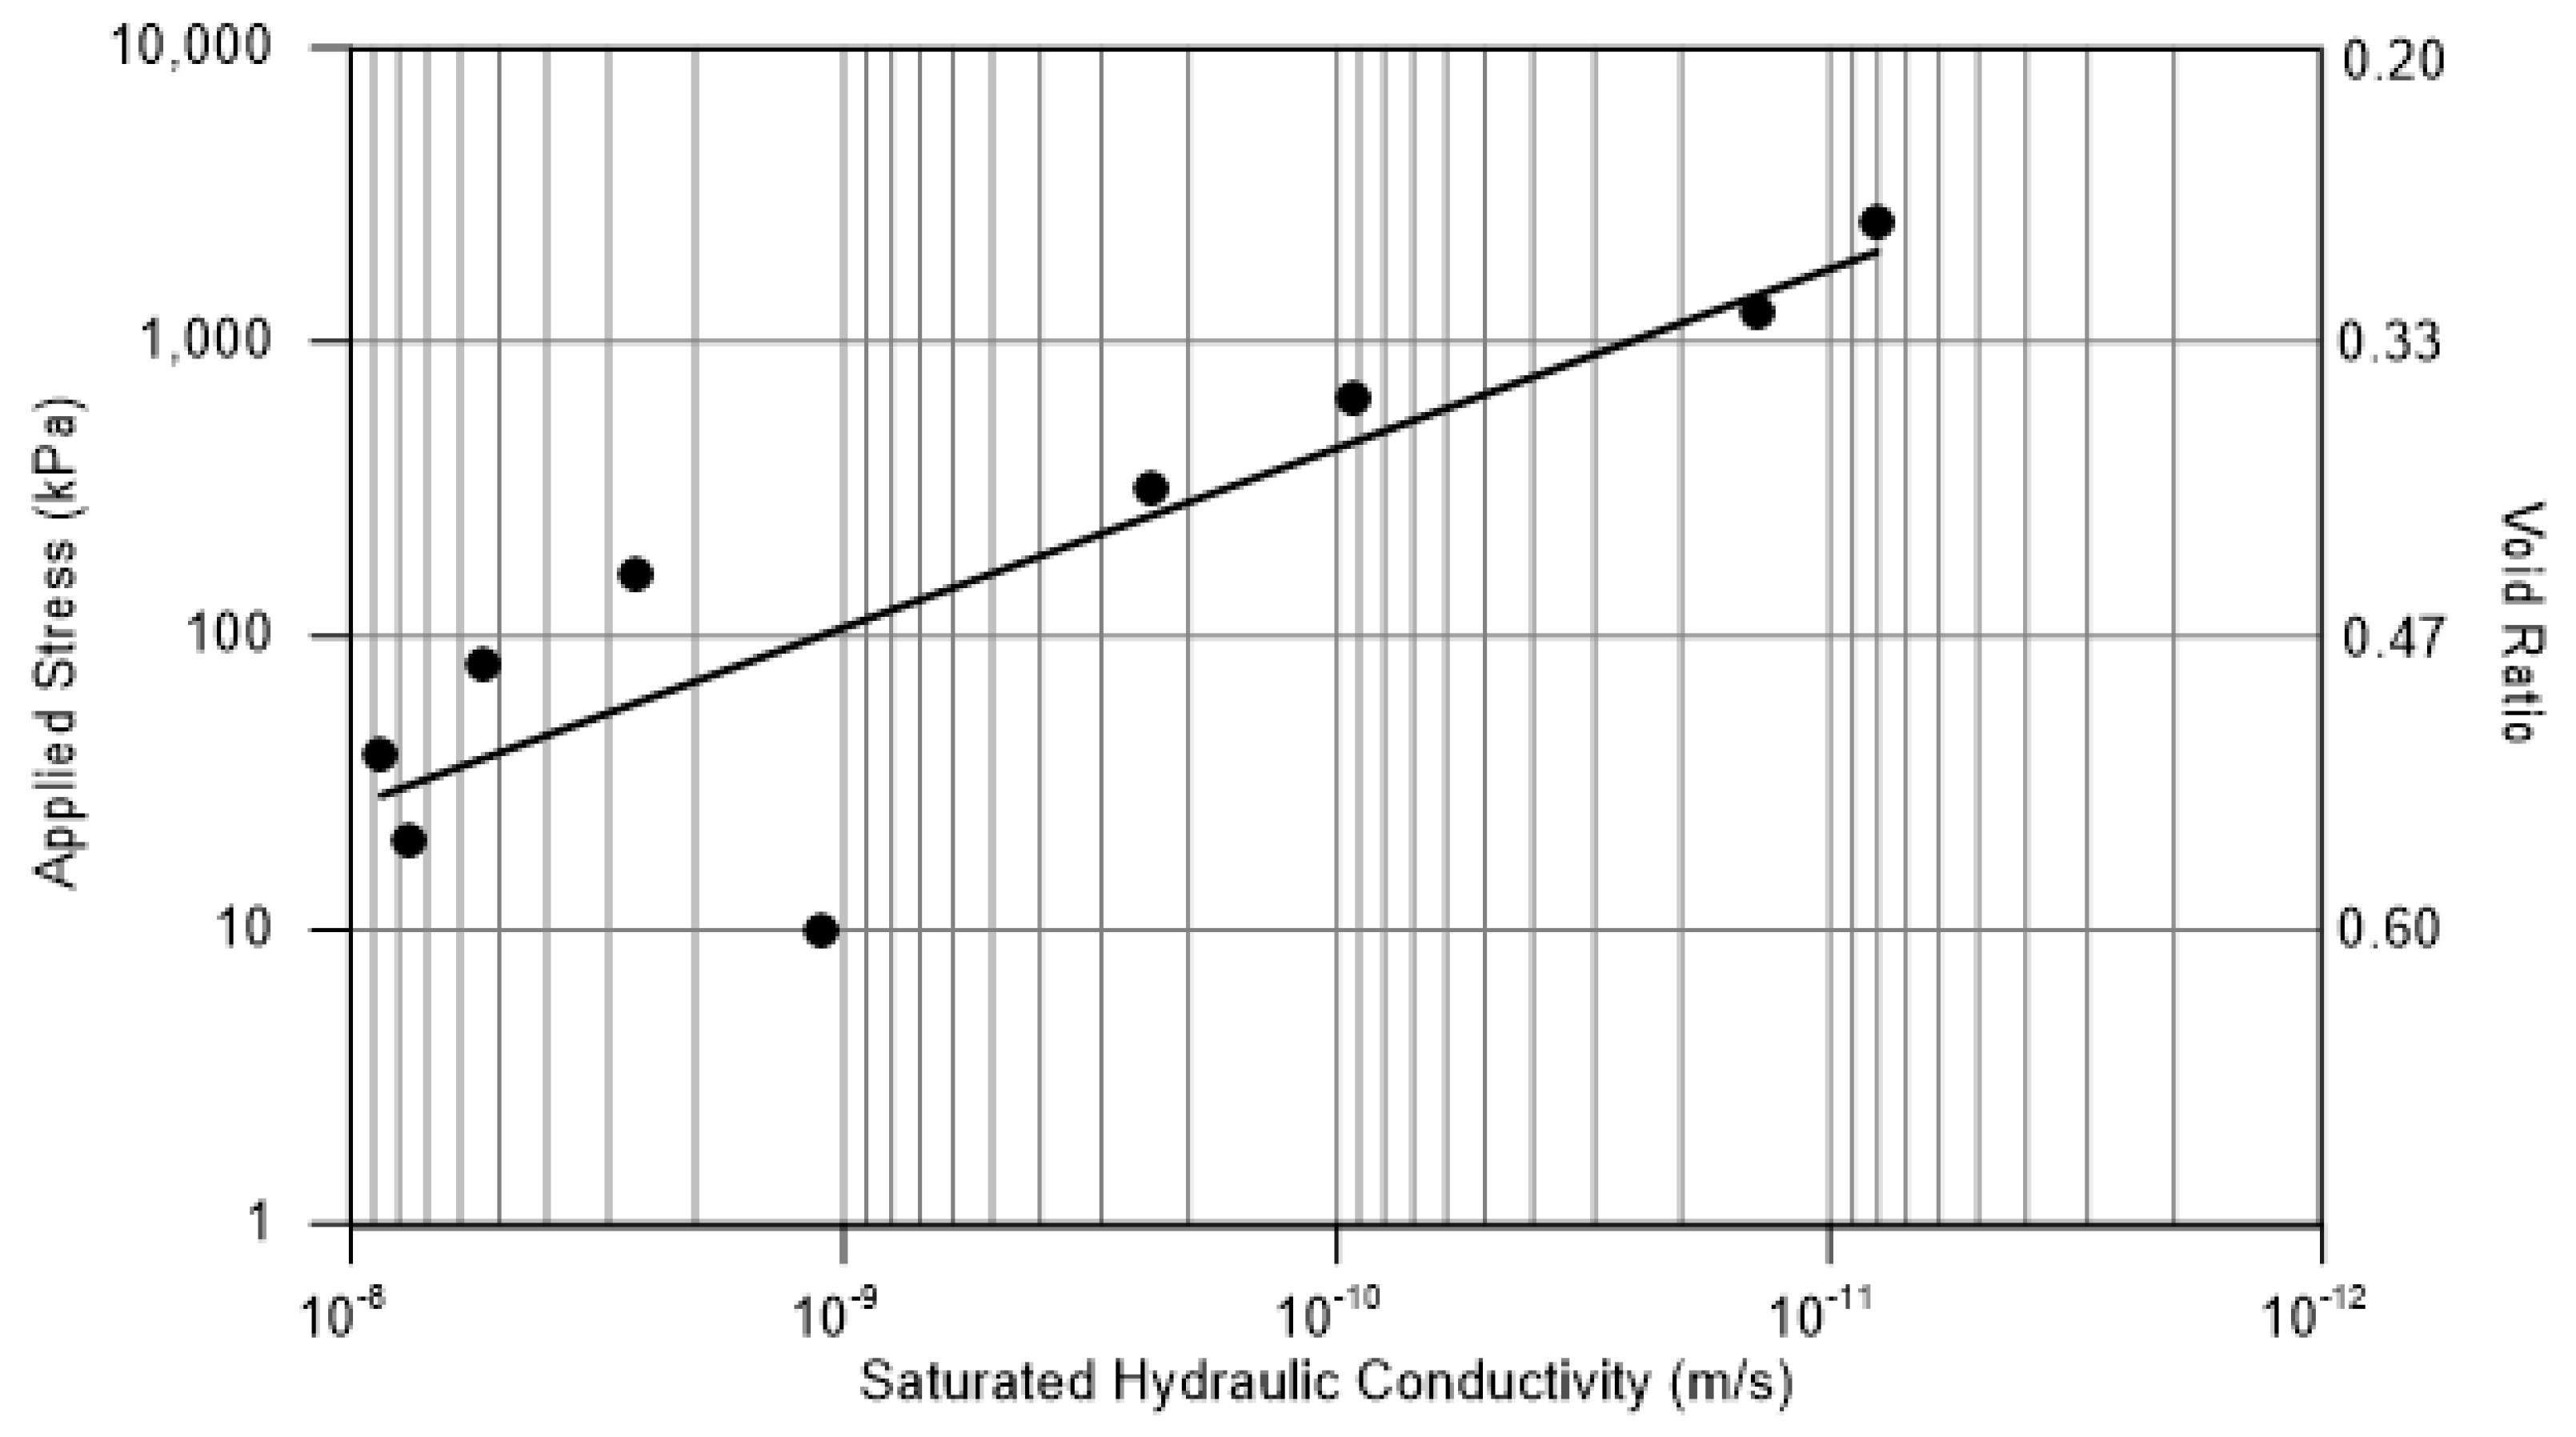
4.5. Hydraulic Conductivity
5. Summary and Conclusions
Author Contributions
Funding
Data Availability Statement
Acknowledgments
Conflicts of Interest
References
- Chen, L.L.; Zhou, G.G.; Mu, Q.Y.; Cui, K.F.E.; Song, D.R. Compression characteristics of saturated re-compacted glacial tills in Tianmo Gully of Tibet, China. J. Mt. Sci. 2019, 16, 1661–1674. [Google Scholar] [CrossRef]
- Ferris, D.M.; Potter, G.; Ferguson, G. Characterization of the hydraulic conductivity of glacial till aquitards. Hydrogeol. J. 2020, 28, 1827–1839. [Google Scholar] [CrossRef]
- Sauer, E.K.; Egeland, A.K.; Christiansen, E.A. Compression characteristics and index properties of tills and intertill clays in southern Saskatchewan, Canada. Can. Geotech. J. 1993, 30, 257–275. [Google Scholar] [CrossRef]
- Quinn, J.; Chin, B.; Pernito, M.; Scammell, J. Geotechnical assessment of the Alameda dam. Bull. Can. Dam Assoc. 2015, 26, 10–23. [Google Scholar]
- Errecalde, I.A. Modelling the SM-3 Dam, Quebec, Canada. Master’s Thesis, Polytechnic University of Catalonia, Barcelona, Spain, 2012. [Google Scholar]
- Clarke, D.; Smethurst, J.A. Effects of climate change on cycles of wetting and drying in engineered clay slopes in England. Q. J. Eng. Geol. Hydrogeol. 2010, 43, 473–486. [Google Scholar] [CrossRef]
- Hudacsek, P.; Leung, A. Physical and Numerical Modelling of Climate-Change Influenced, Poorly-Compacted Glacial Till Embankments. In Geotechnical Engineering for Infrastructure and Development; ICE Publishing: London, UK, 2015; pp. 3911–3916. [Google Scholar]
- Bell, F.G. The geotechnical properties of some till deposits occurring along the coastal areas of eastern England. Eng. Geol. 2002, 63, 49–68. [Google Scholar] [CrossRef]
- Cao, L.; Peaker, S.; Ahmad, S. A Case Study of Embankment Retaining Wall in Ontario. In Proceedings of the 69th Canadian Geotechnical Conference—GeoVancouver 2016, Vancouver, BC, Canada, 3–5 October 2016. [Google Scholar]
- Mitchell, J.K.; Soga, K. Fundamentals of Soil Behavior; John Wiley & Sons, Inc.: New York, NY, USA, 2005. [Google Scholar]
- Lu, N.; Khorshidi, M. Mechanisms for soil-water retention and hysteresis at high suction range. J. Geotech. Geoenviron. Eng. 2015, 141, 1–10. [Google Scholar] [CrossRef]
- Zhang, Z.F. Soil water retention and relative permeability for conditions from oven-dry to full saturation. Vadose Zone J. 2011, 10, 1299–1308. [Google Scholar] [CrossRef]
- Hillel, D. Environmental Soil Physics: Fundamentals, Applications, and Environmental Considerations; Academic Press: San Diego, CA, USA, 1998. [Google Scholar]
- Tokunaga, T.K. Hydraulic properties of adsorbed water films in unsaturated porous media. Water Resour. Res. 2009, 45. [Google Scholar] [CrossRef] [Green Version]
- Schanz, T.; Tripathy, S. Swelling pressure of a divalent-rich bentonite: Diffuse double-layer theory revisited. Water Resour. Res. 2009, 45. [Google Scholar] [CrossRef]
- Gao, C. Theory of menisci and its applications. Appl. Phys. Lett. 1997, 71, 1801–1803. [Google Scholar] [CrossRef]
- Lu, N. Generalized soil water retention equation for adsorption and capillarity. J. Geotech. Geoenviron. Eng. 2016, 142. [Google Scholar] [CrossRef] [Green Version]
- Or, D.; Tuller, M. Liquid retention and interfacial area in variably saturated porous media: Upscaling from single-pore to sample-scale model. Water Resour. Res. 1999, 35, 3591–3605. [Google Scholar] [CrossRef]
- Lu, N.; Dong, Y. Correlation between soil-shrinkage curve and water-retention characteristics. J. Geotech. Geoenviron. Eng. 2017, 143. [Google Scholar] [CrossRef] [Green Version]
- Zhou, A.; Wu, S.; Li, J.; Sheng, D. Including degree of capillary saturation into constitutive modelling of unsaturated soils. Comput. Geotech. 2018, 95, 82–98. [Google Scholar] [CrossRef]
- Acton, D.F.; Padbury, G.A.; Stushnoff, C.T. The Eco-Regions of Saskatchewan; Hignell: Winnipeg, MB, Canada, 1998. [Google Scholar]
- Ito, M.; Azam, S. Engineering characteristics of a glacio-lacustrine clay deposit in a semi-arid climate. Bull. Eng. Geol. Environ. 2009, 68, 551. [Google Scholar] [CrossRef]
- Vonhof, J.A. Tertiary Gravels and Sands in the Canadian Great Plains. Ph.D. Thesis, University of Saskatchewan, Saskatoon, SK, Canada, 1969. [Google Scholar]
- Scott, J.S.; Brooker, E.W. Geological and Engineering Aspects of Upper Cretaceous Shale in Western Canada; Geological Survey of Canada: Ottawa, ON, Canada, 1968. [Google Scholar]
- Dawson, F.M.; Evans, C.G.; Marsh, R.; Richardson, R. Uppermost Cretaceous and Tertiary Strata of the Western Canada Sedimentary Basin. In Geological Atlas of the Western Canada Sedimentary Basin; Alberta Research Council: Calgary, AB, Canada, 1994. [Google Scholar]
- Street, H.P.; Bamforth, E.L.; Gilbert, M.M. The formation of a Marine Bonebed at the Upper Cretaceous Dinosaur Park–Bearpaw transition of west-central Saskatchewan, Canada. Front. Earth Sci. 2019, 7, 209. [Google Scholar] [CrossRef] [Green Version]
- Stalker, A.M. Identification of Saskatchewan gravels and sands. Can. J. Earth Sci. 1968, 5, 155–163. [Google Scholar] [CrossRef]
- Holman, J.A. Climatic significance of giant tortoises from the Wood Mountain Formation (upper Miocene) of Saskatchewan. Can. J. Earth Sci. 1971, 8, 1148–1151. [Google Scholar] [CrossRef]
- Wolfe, J.A.; Upchurch, G.R., Jr. North American nonmarine climates and vegetation during the Late Cretaceous. Palaeogeogr. Palaeoclimatol. Palaeoecol. 1987, 61, 33–77. [Google Scholar] [CrossRef]
- Weaver, C.E. Clays, Muds, and Shales. In Developments in Sedimentology; Elsevier: New York, NY, USA, 1989; Volume 44. [Google Scholar]
- Christiansen, E.A. Tills in Southern Saskatchewan, Canada. In Till, a Symposium; Ohio State University Press: Columbus, OH, USA, 1971; pp. 167–183. [Google Scholar]
- Hanson, M.A. South Tantato Quaternary Project: Surficial Geology and Drift Prospecting Potential of the Southern Tantato Domain, Saskatchewan. In Summary of Investigations 2016, Saskatchewan Geological Survey; Miscellaneous Report 2016-4.2; Saskatchewan Ministry of the Economy: Regina, SK, Canada, 2016. [Google Scholar]
- Christiansen, E.A. The Wisconsinan deglaciation of southern Saskatchewan and adjacent areas. Can. J. Earth Sci. 1979, 16, 913–938. [Google Scholar] [CrossRef]
- Sauchyn, D.J. A reconstruction of Holocene geomorphology and climate, western Cypress Hills, Alberta and Saskatchewan. Can. J. Earth Sci. 1990, 27, 1504–1510. [Google Scholar] [CrossRef]
- Sauer, E.K.; Egeland, A.K.; Christiansen, E.A. Preconsolidation of tills and intertill clays by glacial loading in southern Saskatchewan, Canada. Can. J. Earth Sci. 1993, 30, 420–433. [Google Scholar] [CrossRef]
- Cassagrande, A. Classification and identification of soils. Trans. Am. Soc. Civ. Eng. 1948, 113, 901–930. [Google Scholar] [CrossRef]
- Holtz, R.D.; Kovacs, W.D. An Introduction to Geotechnical Engineering; Prentice-Hall, Inc.: Englewood Cliffs, NJ, USA, 1981. [Google Scholar]
- American Society for Testing and Materials. Standard Practices for Preserving and Transporting Soil Samples. In Annual Book of ASTM Standards; ASTM D4220/D4220M-14; American Society for Testing and Materials: West Conshohocken, PA, USA, 2014. [Google Scholar]
- American Society for Testing and Materials. Standard Test Methods for Specific Gravity of Soil Solids by Water Pycnometer. In Annual Book of ASTM Standards; ASTM D854-14; American Society for Testing and Materials: West Conshohocken, PA, USA, 2014. [Google Scholar]
- American Society for Testing and Materials. Standard Test Method for Particle-Size Analysis of Soils (Withdrawn 2016). In Annual Book of ASTM Standards; ASTM D422-63(2007)e2; American Society for Testing and Materials: West Conshohocken, PA, USA, 2007. [Google Scholar]
- American Society for Testing and Materials. Standard Test Methods for Liquid Limit, Plastic Limit, and Plasticity Index of Soils. In Annual Book of ASTM Standards; ASTM D4318-17e1; American Society for Testing and Materials: West Conshohocken, PA, USA, 2017. [Google Scholar]
- American Society for Testing and Materials. Standard Practice for Classification of Soils for Engineering Purposes (Unified Soil Classification System). In Annual Book of ASTM Standards; ASTM D2487-17e1; American Society for Testing and Materials: West Conshohocken, PA, USA, 2017. [Google Scholar]
- American Society for Testing and Materials. Standard Test Methods for Laboratory Determination of Water (Moisture) Content of Soil and Rock by Mass. In Annual Book of ASTM Standards; ASTM D2216-19; American Society for Testing and Materials: West Conshohocken, PA, USA, 2019. [Google Scholar]
- Hubbard, C.R.; Snyder, R.L. RIR-measurement and use in quantitative XRD. Powder Diffr. 1988, 3, 74–77. [Google Scholar] [CrossRef] [Green Version]
- Hendershot, W.H.; Lalande, H.; Duquette, M. Ion Exchange and Exchangeable Cations. In Soil Sampling and Methods of Analysis; Carter, M.R., Ed.; CRC Press: Boca Raton, FL, USA, 2008. [Google Scholar]
- American Society for Testing and Materials. Standard Test Methods for pH of Soils. In Annual Book of ASTM Standards; ASTM D4972-19; American Society for Testing and Materials: West Conshohocken, PA, USA, 2019. [Google Scholar]
- American Society for Testing and Materials. Standard Test Methods for Electrical Conductivity and Resistivity of Water. In Annual Book of ASTM Standards; ASTM D1125-14; American Society for Testing and Materials: West Conshohocken, PA, USA, 2014. [Google Scholar]
- Azam, S.; Rima, U.S. Oil sand tailings characterisation for centrifuge dewatering. Environ. Geotech. 2014, 1, 189–196. [Google Scholar] [CrossRef]
- American Society for Testing and Materials. Standard Test Methods for Laboratory Compaction Characteristics of Soil Using Standard Effort (12 400 ft-lbf/ft3 (600 kN-m/m3)). In Annual Book of ASTM Standards; ASTM D698-12e2; American Society for Testing and Materials: West Conshohocken, PA, USA, 2012. [Google Scholar]
- American Society for Testing and Materials. Standard Test Methods for Determination of the Soil Water Characteristic Curve for Desorption Using Hanging Column, Pressure Extractor, Chilled Mirror Hygrometer, or Centrifuge. In Annual Book of ASTM Standards; ASTM D6836-16; American Society for Testing and Materials: West Conshohocken, PA, USA, 2016. [Google Scholar]
- American Society for Testing and Materials. Standard Test Method for Shrinkage Factors of Cohesive Soils by the Water Submersion Method. In Annual Book of ASTM Standards; ASTM D4943-18; American Society for Testing and Materials: West Conshohocken, PA, USA, 2018. [Google Scholar]
- American Society for Testing and Materials. Standard Test Methods for One-Dimensional Swell or Collapse of Soils. In Annual Book of ASTM Standards; ASTM D4546-14e1; American Society for Testing and Materials: West Conshohocken, PA, USA, 2014. [Google Scholar]
- American Society for Testing and Materials. Standard Test Methods for One-Dimensional Consolidation Properties of Soils Using Incremental Loading. In Annual Book of ASTM Standards; ASTM D2435/D2435M-11(2020); American Society for Testing and Materials: West Conshohocken, PA, USA, 2020. [Google Scholar]
- Terzaghi, K.; Peck, R.B.; Mesri, G. Soil Mechanics in Engineering Practice; John Wiley & Sons Inc.: New York, NY, USA, 1996. [Google Scholar]
- Ellis, J.G.; Acton, D.F.; Moss, H.C. The Soils of the Willow Bunch Lake Map Area (72H) Saskatchewan; Saskatchewan Institute of Pedology: Saskatoon, SK, Canada, 1967. [Google Scholar]
- Braman, D.R.; Sweet, A.R.; Lerbekmo, J.F. Upper Cretaceous-lower Tertiary lithostratigraphic relationships of three cores from Alberta, Saskatchewan, and Manitoba, Canada. Can. J. Earth Sci. 1999, 36, 669–683. [Google Scholar] [CrossRef]
- Środoń, J. Nature of mixed-layer clays and mechanisms of their formation and alteration. Annu. Rev. Earth Planet. Sci. 1999, 27, 19–53. [Google Scholar] [CrossRef]
- Wilson, M.J.; Deer, W.A.; Howie, R.A.; Zussman, J. Rock-Forming Minerals, Sheet Silicates: Clay Minerals; Geological Society of London: London, UK, 2013; Volume 3C. [Google Scholar]
- Azam, S. Effect of composition and morphology on self-weight settling of laterite ore slurries. Geotech. Geol. Eng. 2012, 30, 107–118. [Google Scholar] [CrossRef]
- Chorom, M.; Rengasamy, P. Dispersion and zeta potential of pure clays as related to net particle charge under varying pH, electrolyte concentration and cation type. Eur. J. Soil Sci. 1995, 46, 657–665. [Google Scholar] [CrossRef]
- Fredlund, M.D. The Role of Unsaturated Soil Property Functions in the Practice of Unsaturated Soil Mechanics. Ph.D. Thesis, University of Saskatchewan, Saskatoon, SK, Canada, 2000. [Google Scholar]
- Vanapalli, S.K.; Fredlund, D.G.; Pufahl, D.E. Comparison of Saturated-Unsaturated Shear Strength and Hydraulic Conductivity Behavior of a Compacted Sandy-Clay Till. In Proceedings of the 50th Canadian Geotechnical Conference, Ottawa, ON, Canada, 20–22 October 1997; pp. 625–632. [Google Scholar]
- Menon, M.; Yuan, Q.; Jia, X.; Dougill, A.J.; Hoon, S.R.; Thomas, A.D.; Williams, R.A. Assessment of physical and hydrological properties of biological soil crusts using X-ray microtomography and modeling. J. Hydrol. 2011, 397, 47–54. [Google Scholar] [CrossRef] [Green Version]
- Collins, K.; McGown, A. The form and function of microfabric features in a variety of natural soils. Geotechnique 1974, 24, 233–254. [Google Scholar] [CrossRef]
- Simms, P.H.; Yanful, E.K. Measurement and estimation of pore shrinkage and pore distribution in a clayey till during soil-water characteristic curve tests. Can. Geotech. J. 2001, 38, 741–754. [Google Scholar] [CrossRef]
- Najser, J.; Pooley, E.; Springman, S.M.; Laue, J.; Boháč, J. Mechanisms controlling the behaviour of double-porosity clay fills in situ and centrifuge study. Q. J. Eng. Geol. Hydrogeol. 2010, 43, 207–220. [Google Scholar] [CrossRef]
- Leroueil, S.; Hight, D.W. Compacted Soils: From Physics to Hydraulic and Mechanical Behavior. In Proceedings of the 1st Pan-American Conference on Unsaturated Soils, Cartagena de Indias, Colombia, 19–22 February 2013; Taylor & Francis Group: Boca Raton, FL, USA, 2013; pp. 41–59. [Google Scholar]
- Maleksaeedi, E.; Nuth, M. Evaluation of capillary water retention effects on the development of the suction stress characteristic curve. Can. Geotech. J. 2019, 57, 1439–1452. [Google Scholar] [CrossRef]
- Chen, R.P.; Liu, P.; Liu, X.M.; Wang, P.F.; Kang, X. Pore-scale model for estimating the bimodal soil–water characteristic curve and hydraulic conductivity of compacted soils with different initial densities. Eng. Geol. 2019, 260, 105199. [Google Scholar] [CrossRef]
- Ito, M.; Azam, S. Relation between flow through and volumetric changes in natural expansive soils. Eng. Geol. 2020, 279, 105885. [Google Scholar] [CrossRef]
- Ebrahimi-Birang, N.; Gitirana Jr, G.F.N.; Fredlund, D.G.; Fredlund, M.D.; Samarasekera, L. A Lower Limit for the Water Permeability Coefficient. In Proceedings of the 57th Canadian Geotechnical Conference, Quebec City, QC, Canada, 24–26 October 2004; pp. 24–27. [Google Scholar]
- Li, X.; Zhang, L.M.; Wu, L.Z. A framework for unifying soil fabric, suction, void ratio, and water content during the dehydration process. Soil Sci. Soc. Am. J. 2014, 78, 387–399. [Google Scholar] [CrossRef]
- Azam, S.; Chowdhury, R.H. Swell–shrink–consolidation behavior of compacted expansive clays. Int. J. Geotech. Eng. 2013, 7, 424–430. [Google Scholar] [CrossRef]
- Haines, W.B. The volume changes associated with variations of water content in soil. J. Agric. Sci. 1923, 13, 296–310. [Google Scholar] [CrossRef]
- Hobbs, P.R.N.; Jones, L.D.; Kirkham, M.P.; Gunn, D.A.; Entwisle, D.C. Shrinkage limit test results and interpretation for clay soils. Q. J. Eng. Geol. Hydrogeol. 2019, 52, 220–229. [Google Scholar] [CrossRef]
- Stirk, G.B. Some aspects of soil shrinkage and the effect of cracking upon water entry into the soil. Aust. J. Agric. Res. 1954, 5, 279–291. [Google Scholar] [CrossRef]
- Low, P.F. Interparticle Forces in Clay Suspensions: Flocculation, Viscous Flow, and Swelling. In Clay-Water Interface and Its Rheological Implications; CMS Workshop Lectures, Guven, N., Pollastro, R.M., Eds.; The Clay Minerals Society: Boulder, CO, USA, 1992; Volume 4, pp. 158–190. [Google Scholar]
- Van Olphen, H. Compaction of clay sediments in the range of molecular particle distances. Clays Clay Miner. 1962, 11, 178–187. [Google Scholar] [CrossRef]
- Ito, M.; Azam, S. Determination of swelling and shrinkage properties of undisturbed expansive soils. Geotech. Geol. Eng. 2010, 28, 413–422. [Google Scholar] [CrossRef]
- MacDonald, A.B.; Sauer, E.K. The engineering significance of Pleistocene stratigraphy in the Saskatoon area, Saskatchewan, Canada. Can. Geotech. J. 1970, 7, 116–126. [Google Scholar] [CrossRef]
- Alonso, E.E.; Pinyol, N.M.; Gens, A. Compacted soil behavior: Initial state, structure, and constitutive modelling. Geotechnique 2013, 63, 463–478. [Google Scholar] [CrossRef] [Green Version]
- Rahardjo, H.; Fredlund, D.G. Experimental verification of the theory of consolidation for unsaturated soils. Can. Geotech. J. 1995, 32, 749–766. [Google Scholar] [CrossRef]
- Cui, Y.J.; Nguyen, X.P.; Tang, A.M.; Li, X.L. An insight into the unloading/reloading loops on the compression curve of natural stiff clays. Appl. Clay Sci. 2013, 83–84, 343–348. [Google Scholar] [CrossRef]
- Romero, E.; Della Vecchia, G.; Jommi, C. An insight into the water retention properties of compacted clayey soils. Geotechnique 2011, 61, 313–328. [Google Scholar] [CrossRef]
- Olsen, H.W.; Nichols, R.W.; Rice, T.L. Low gradient permeability measurements in triaxial system. Geotechnique 1985, 35, 145–157. [Google Scholar] [CrossRef]
- Leong, E.C.; Rahardjo, H. Permeability functions for unsaturated soils. J. Geotech. Geoenviron. Eng. 1997, 123, 1118–1126. [Google Scholar] [CrossRef] [Green Version]
- Fredlund, D.G.; Rahardjo, H.; Fredlund, M.D. Unsaturated Soil Mechanics in Engineering Practice; John Wiley & Sons, Inc.: Hoboken, NJ, USA, 2012. [Google Scholar]
- Zhai, Q.; Rahardjo, H. Estimation of permeability function from the soil–water characteristic curve. Eng. Geol. 2015, 199, 148–156. [Google Scholar] [CrossRef]


| Soil Property | Value |
|---|---|
| Specific gravity, Gs | 2.72 |
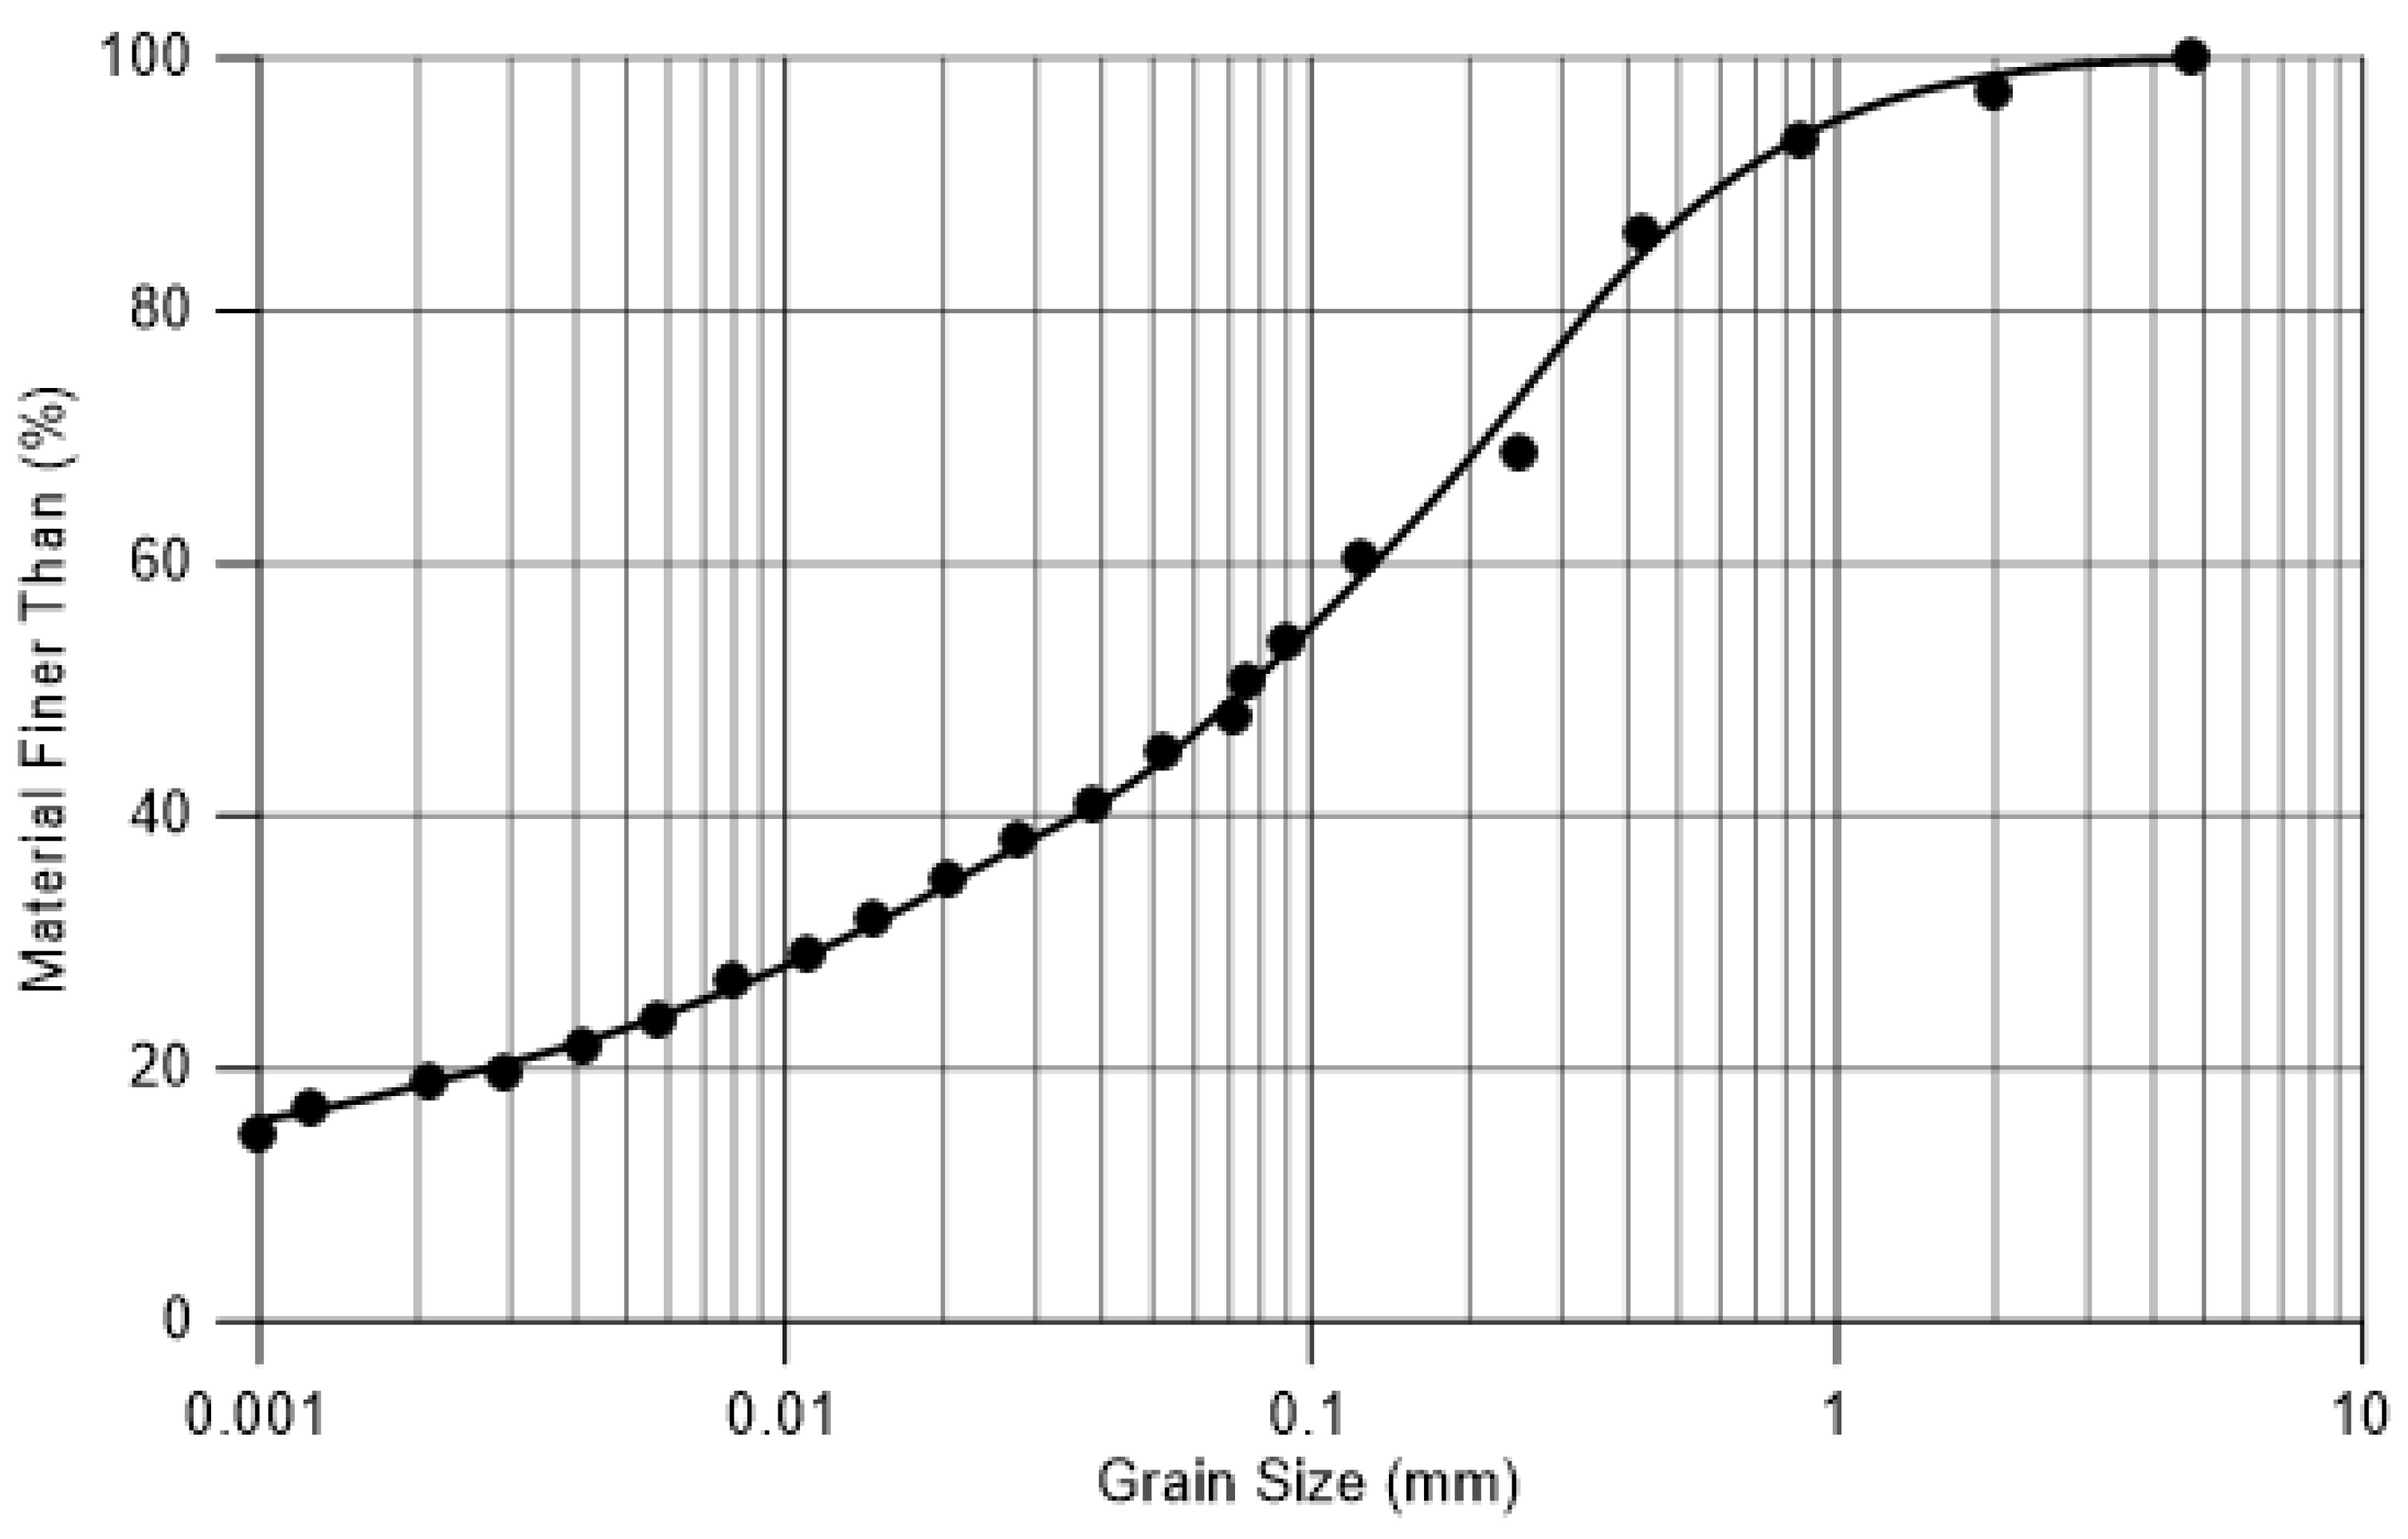
| Material finer than 4.75 mm (%) | 100 |
| Material finer than 0.075 mm (%) | 51 |
| Material finer than 0.002 mm (%) | 18 |
| Liquid limit, wl (%) | 29 |
| Plastic limit, wp (%) | 15 |
| Shrinkage limit, ws (%) | 12 |
| USCS symbol | CL |
| Property | Value |
|---|---|
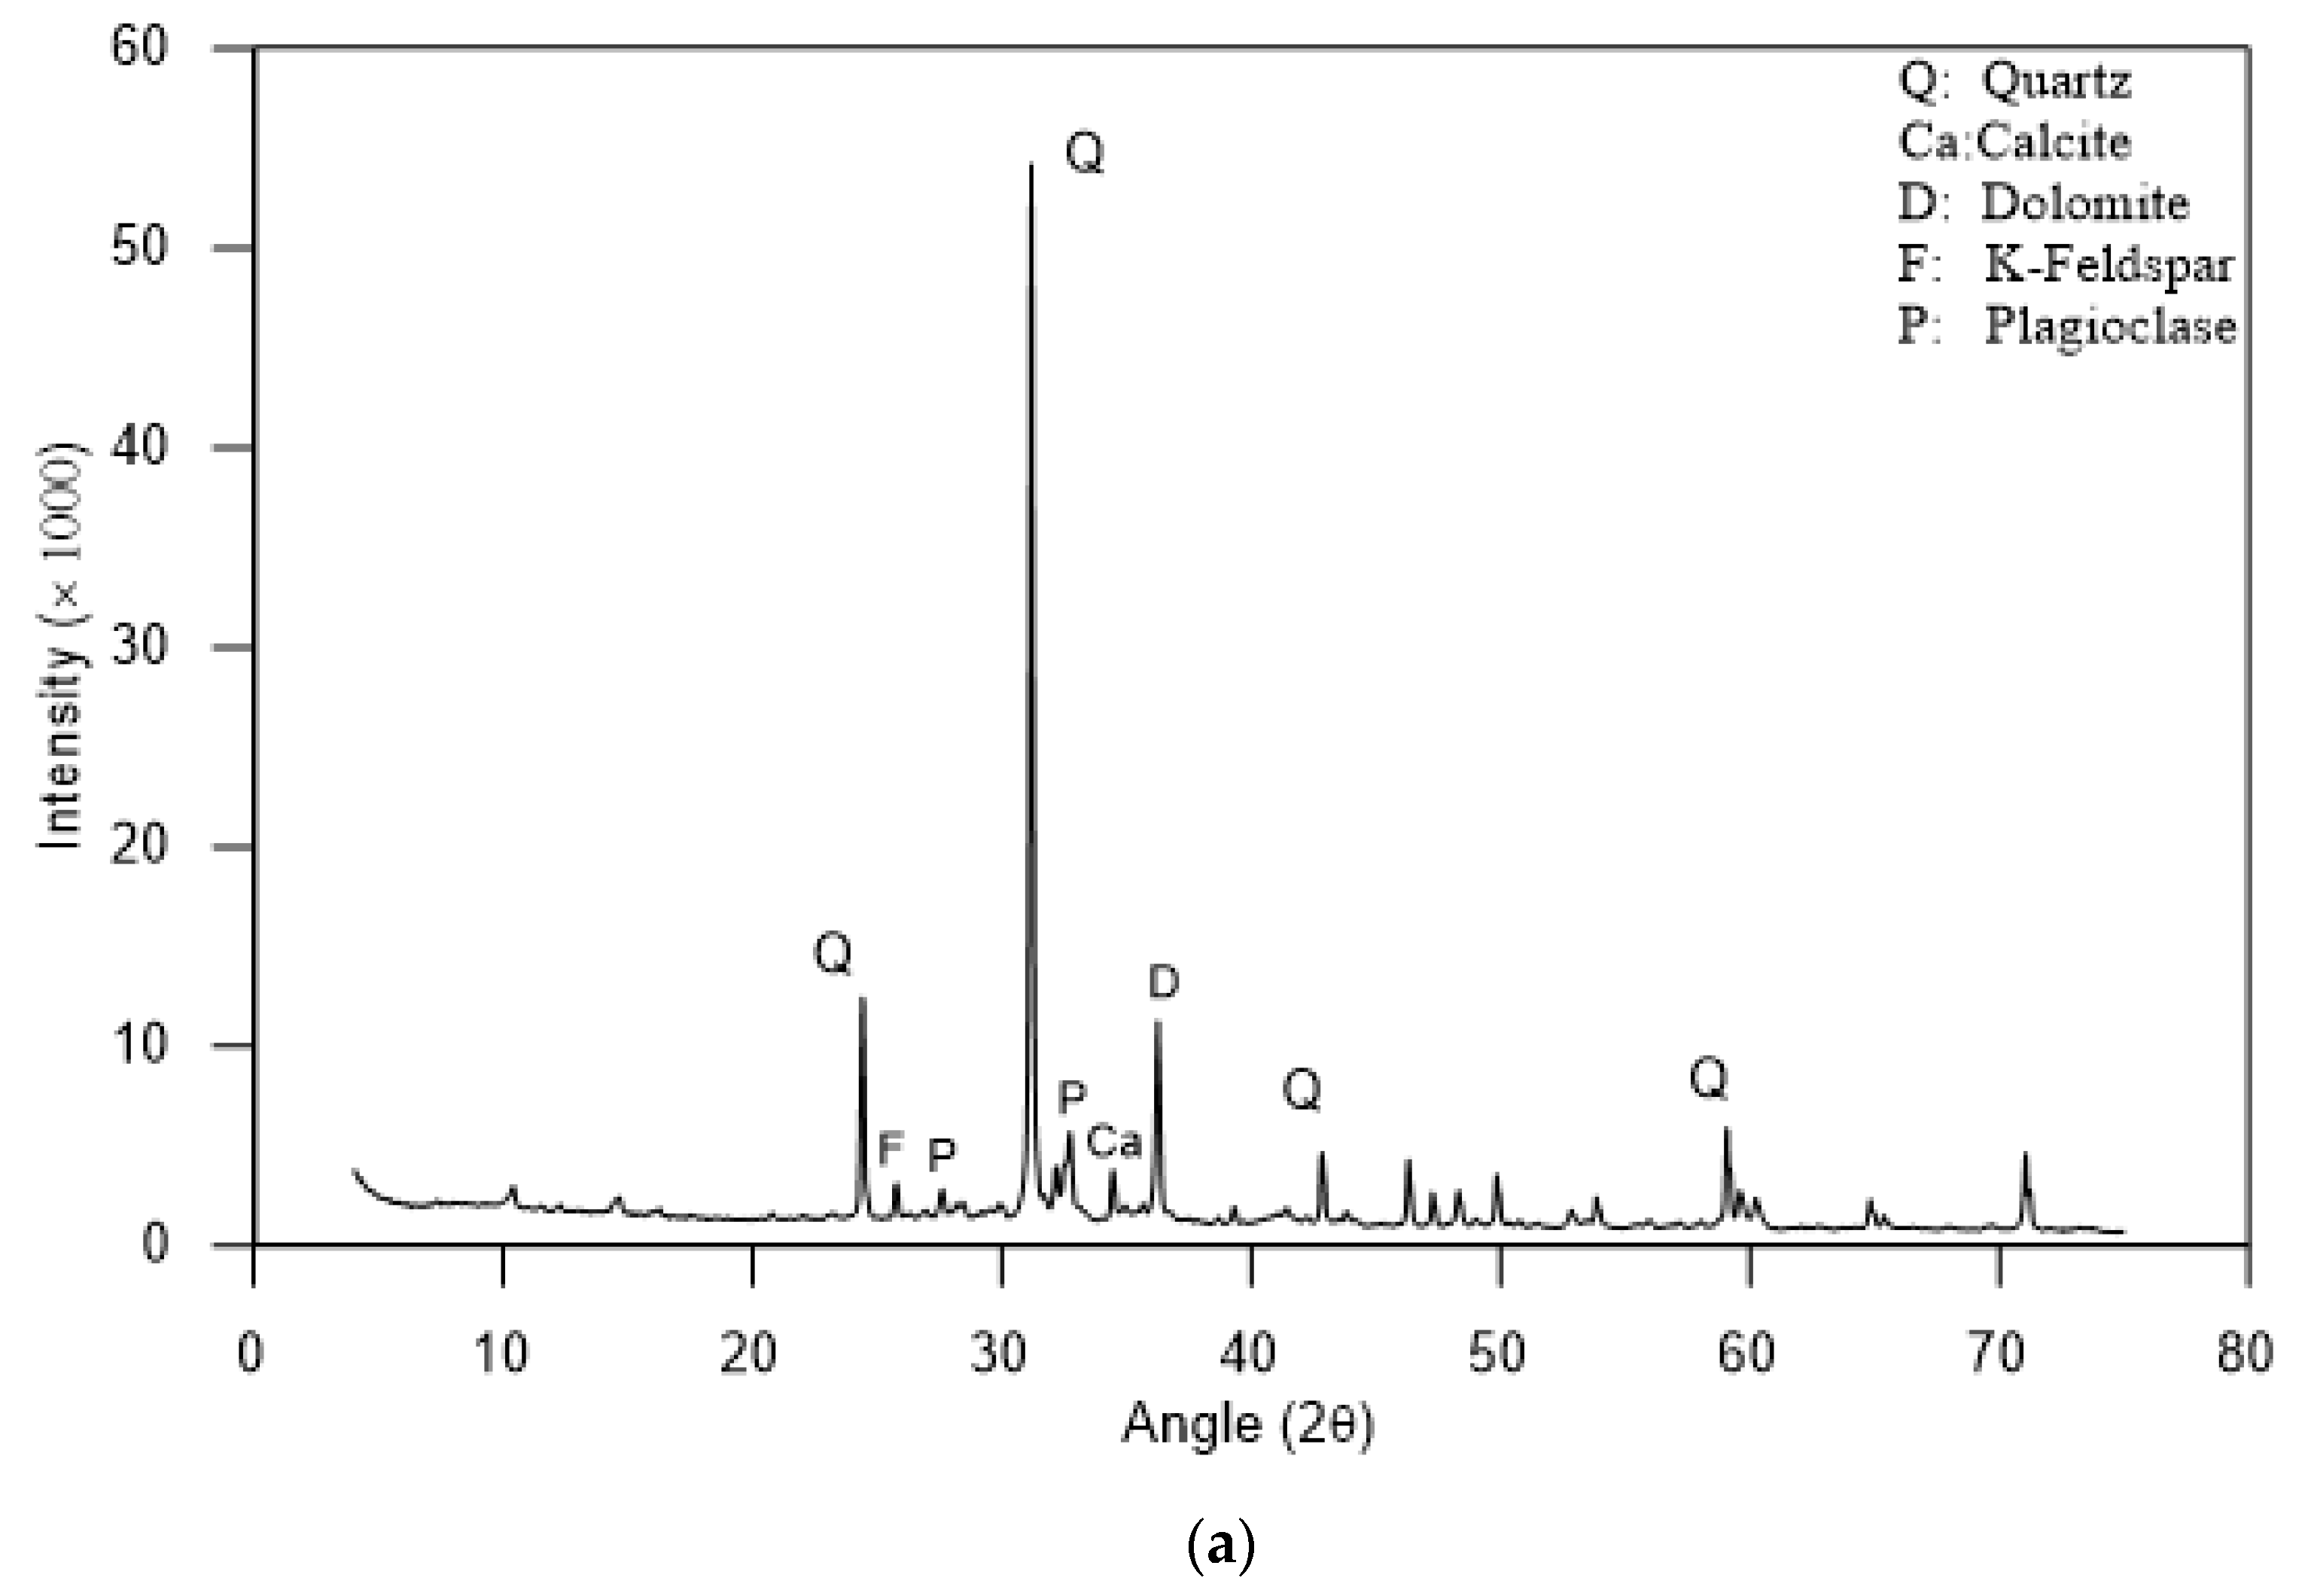
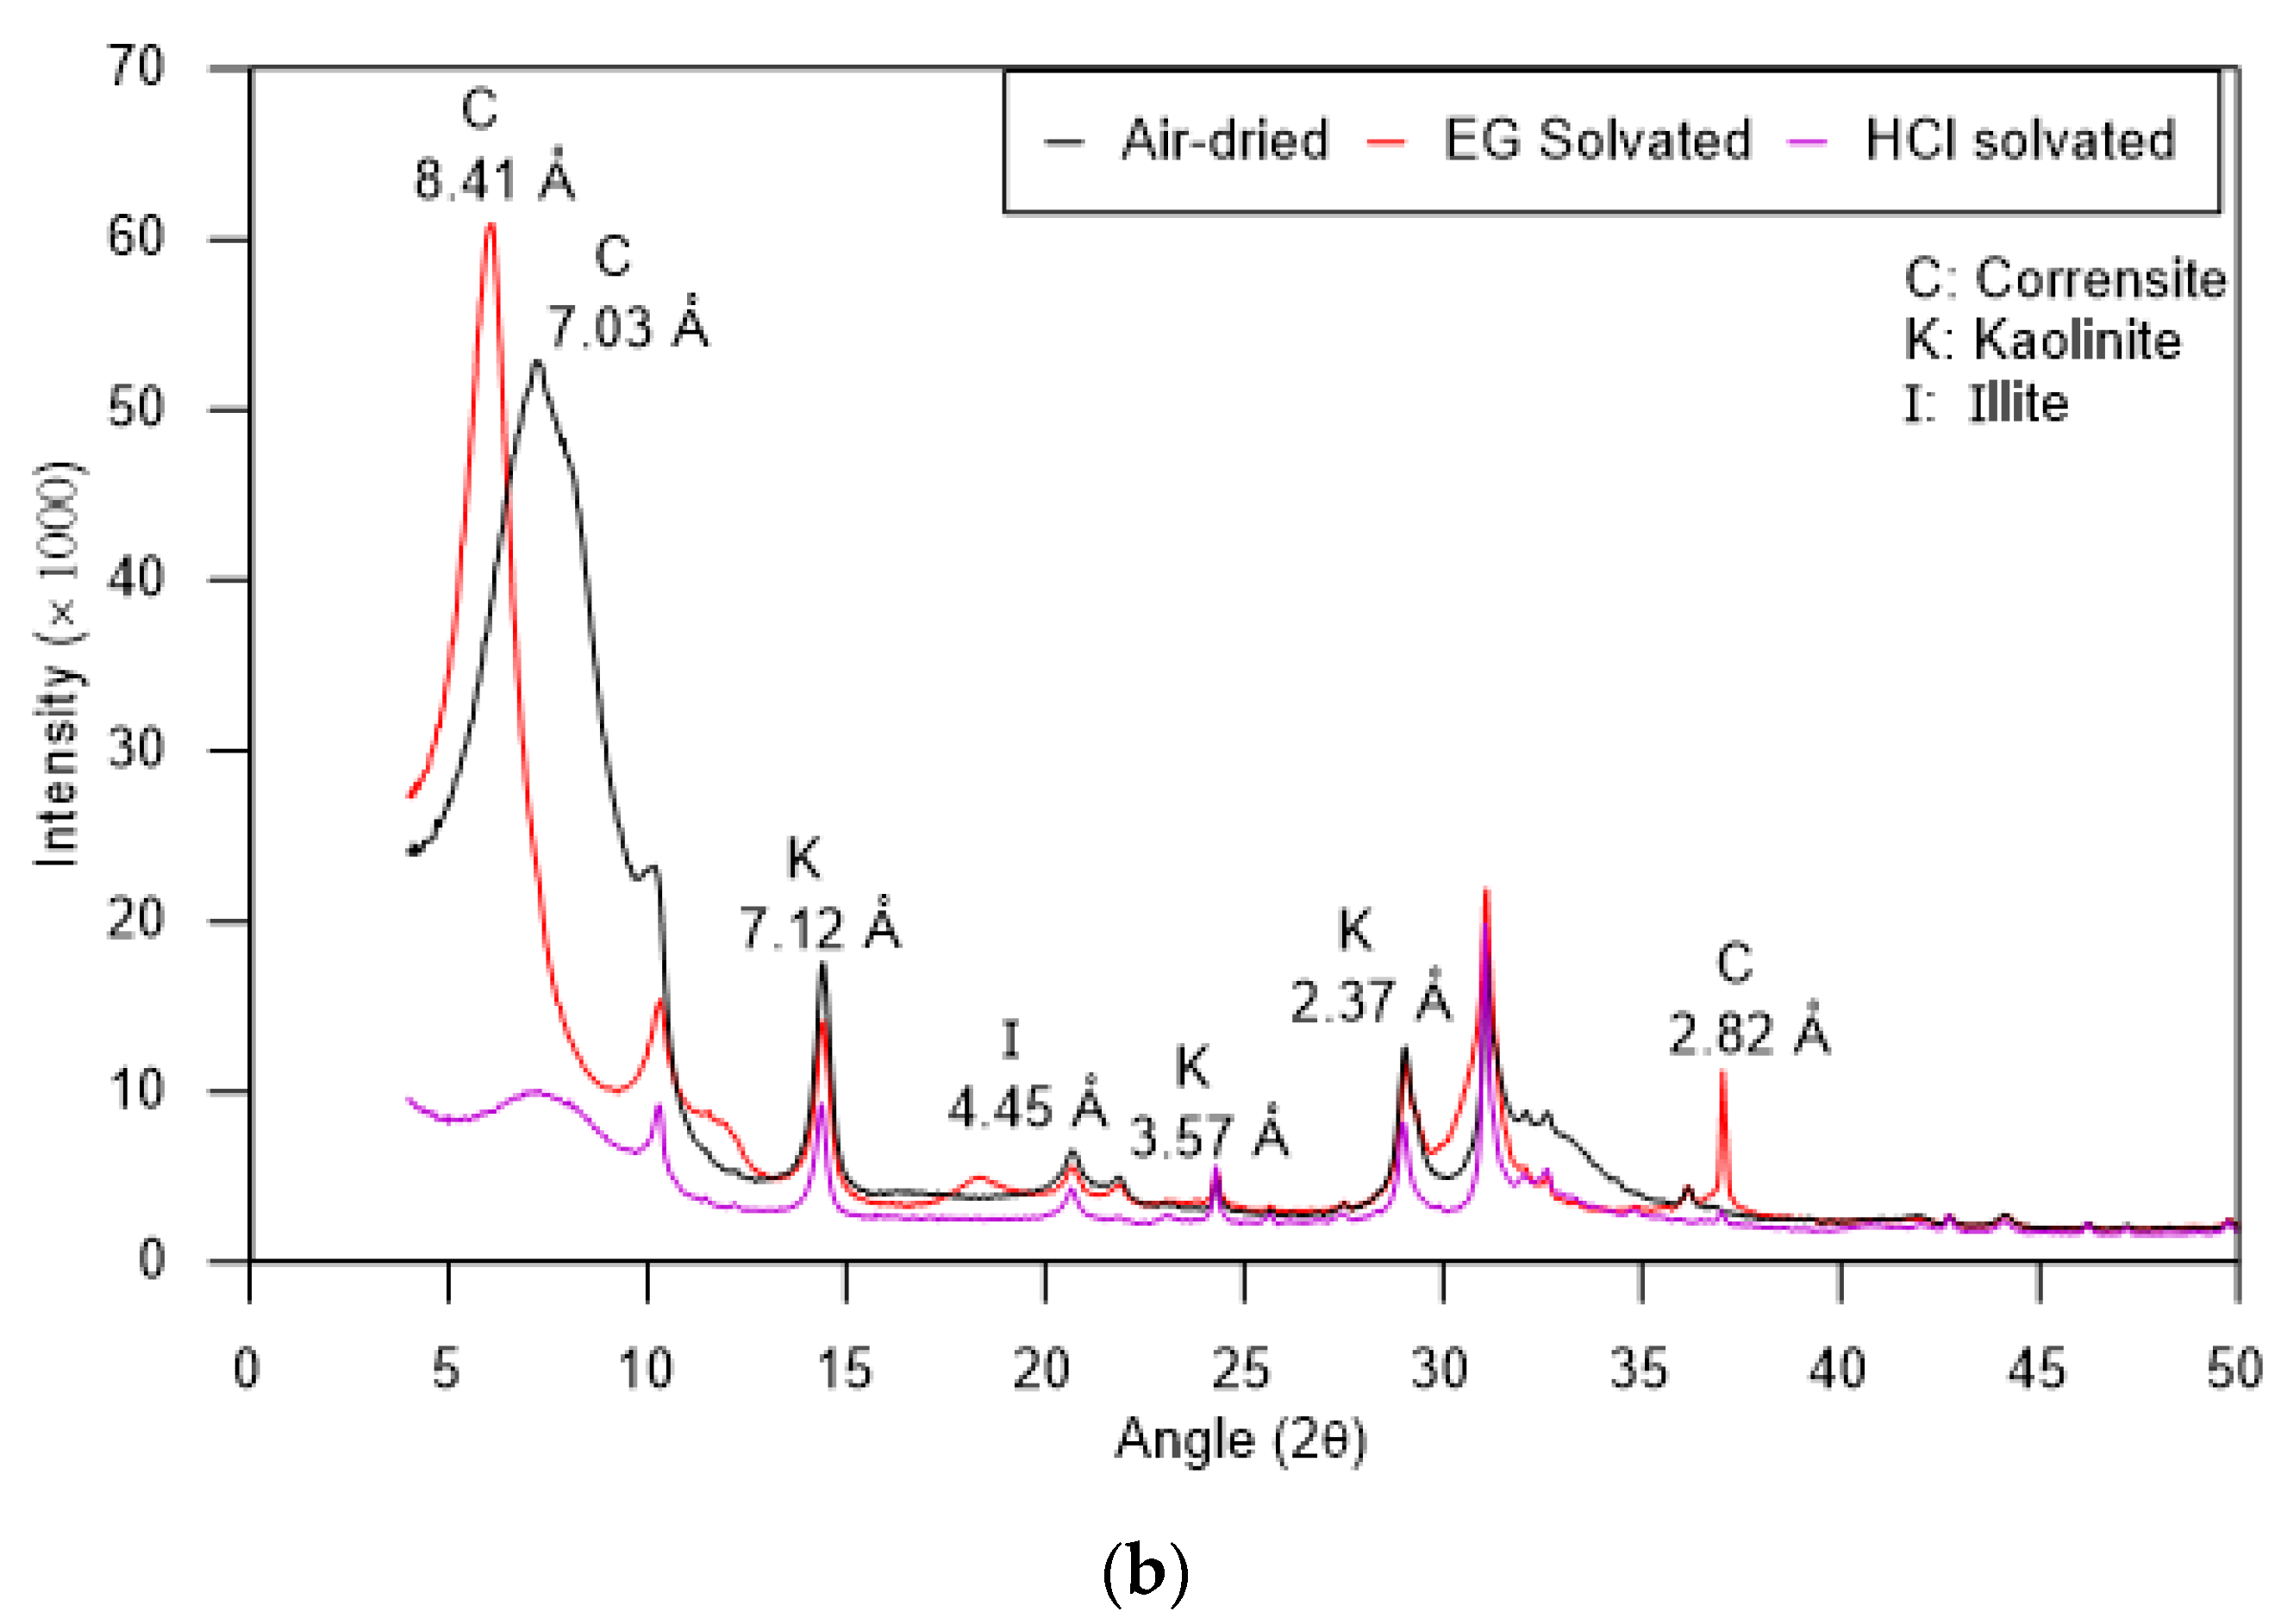
| Minerals (%) * | Coarse (55) Quartz (34), Dolomite (11), Plagioclase (4), K-Feldspar (2), Calcite (2), Others (2) Clay (44) Corrensite (26), Illite (10), Kaolinite (8) |
| Exchangeable cations (cmol(+)/kg) | Na+ (0.2), K+ (0.9), Ca2+ (19.1), Mg2+ (6.2) |
| Total CEC (cmol(+)/kg) | 26.5 |
| pH | 7.5 |
| Electrical conductivity (μS/cm) | 1725 |
| Exchangeable sodium percentage (%) a | 0.75 |
| Zeta potential (mV) | −20.4 |
| Stage | w Range (%) | e Range | θ Range (%) | R * | S Range (%) |
|---|---|---|---|---|---|
| I | 30–26 | 0.82–0.79 | 45–40 | 0.4 | 100–90 |
| II | 26–14 | 0.79–0.51 | 40–24 | 0.8 | 90–70 |
| III | 14–5 | 0.51–0.47 | 24–9 | 0.3 | 70–30 |
| IV | 5–0 | 0.47–0.47 | 9–0 | 0.0 | 30–0 |
Publisher’s Note: MDPI stays neutral with regard to jurisdictional claims in published maps and institutional affiliations. |
© 2021 by the authors. Licensee MDPI, Basel, Switzerland. This article is an open access article distributed under the terms and conditions of the Creative Commons Attribution (CC BY) license (https://creativecommons.org/licenses/by/4.0/).
Share and Cite
Paranthaman, R.; Azam, S. Effect of Composition on Engineering Behavior of Clay Tills. Geosciences 2021, 11, 427. https://doi.org/10.3390/geosciences11100427
Paranthaman R, Azam S. Effect of Composition on Engineering Behavior of Clay Tills. Geosciences. 2021; 11(10):427. https://doi.org/10.3390/geosciences11100427
Chicago/Turabian StyleParanthaman, Rajeevkaran, and Shahid Azam. 2021. "Effect of Composition on Engineering Behavior of Clay Tills" Geosciences 11, no. 10: 427. https://doi.org/10.3390/geosciences11100427
APA StyleParanthaman, R., & Azam, S. (2021). Effect of Composition on Engineering Behavior of Clay Tills. Geosciences, 11(10), 427. https://doi.org/10.3390/geosciences11100427