Abstract
The Serre Batholith in Central Calabria (southern Italy) represents the intermediate portion of a continuous cross-section of late Variscan continental crust. The various granitoid units of the batholith were emplaced at depths between 23 and 6 km through an overaccretion mechanism that, at its upper levels, was marked by the emplacement of two-mica granodiorites and granites (MBG) at c. 295 Ma, followed by weakly peraluminous granodiorites (BAG) at c. 292 Ma. These upper crustal granitoid rocks have recorded tectonic stresses, which affected the batholith during cooling of the magmatic bodies, exhibiting a range of deformation microstructures from submagmatic to low-temperature subsolidus conditions, but without developing an evident meso/micro-structural fabric. Anisotropy of magnetic susceptibility (AMS) was employed to identify a possible “internal” fabric of the Serre upper crustal granitoids, revealing a magnetic foliation represented by a mainly oblate AMS ellipsoid. Magnetic foliations and lineations are consistent with a stress field characterized by a shortening axis roughly oriented NW–SE. Further studies are in progress to investigate more in depth the relationships between regional tectonic structures and the emplacement of the late-Variscan Serre Batholith granitoids.
1. Introduction
Relationships between magma emplacement and deformation have been widely documented by different authors and in various contexts all over the world (e.g., [1,2,3,4,5,6,7,8,9,10,11]) and, in particular, a close connection between granitic intrusion and shear zone systems has been highlighted in many cases (e.g., [12,13,14,15,16,17,18,19,20]). This is because granitoid magmatism is often synchronous with regional tectonic events, such as those involved in the building or the exhumation of orogenic belts [10,11,17,19]. However, the establishment of a link between shear zone activity and granite emplacement must be carefully assessed, since different portions of a pluton may exhibit different fabrics or no fabric at all, therefore making structural interpretations quite challenging. Large volumes of granitoid magmas were produced during the latest stages of the Variscan Orogeny in southern Italy (c. 300 Ma; [21,22,23,24]). In central Calabria, these granitoids formed the Serre Batholith, where a tight relationship between magmatism and shear zone activity has long been proposed for the foliated quartz diorites and tonalites that make up the oldest and deepest magmatic unit of the batholith (e.g., [23,25,26,27,28,29,30]). Over the past thirty years, considerable progress has been made in understanding the microstructural evolution of crystallizing intrusive rocks, and several meso/microstructural criteria are hence available to distinguish between magmatic, submagmatic and solid-state deformation (e.g., [31,32,33,34,35]). However, even granites that have relationships with regional deformation often lack visible foliations. Indeed, although evidence of deformation can be documented through microstructural investigations, no clear shape or crystallographic preferred orientation is usually developed in these rocks. In these cases, fabric analysis cannot be carried out by using field-based or microstructural data only. To decipher the internal fabric in apparently undeformed rocks, anisotropy of magnetic susceptibility (AMS) is a very useful and well-established technique [18,36,37,38,39,40,41,42,43,44,45]. The reconstructed three-axis magnetic ellipsoid can be related to the strain ellipsoid and can therefore provide valuable information on the intensity and kinematics of the deformation that affected the rocks, in order to evaluate the relationships between regional tectonics, magma emplacement and fabric development (e.g., [42,44,46,47,48,49,50,51,52,53]). In this study, we shed light on the microstructural evolution from magmatic to low-temperature subsolidus conditions of the upper crustal granites and granodiorites from the Serre Batholith in central Calabria and integrate preliminary AMS data aiming to reveal hidden relationships between regional tectonics and emplacement of these late-Variscan granitoids. This study emphasizes the importance of AMS in obtaining constraints on these relationships from apparently isotropic rocks.
2. Geo-Petrological Background
2.1. Regional Outline
The Calabria–Peloritani Orogen (CPO; Figure 1) is a poly-orogenic basement complex made up of remnants of Variscan and Cadomian mountain chains (e.g., [54,55,56,57,58,59,60]) incorporated into the Alpine–Apennine orogenic system ([61,62,63,64,65,66,67,68,69]). In a more general framework, the whole CPO is considered one of the peri-Gondwanan crustal blocks of the former Galatian superterrane ([70]) that, with neighboring areas such as Sardinia, Corsica, West Carpathians and parts of the Alps, belonged to the future south Variscan terranes. These basement areas were located at the northern Palaeotethys margin, while terranes such as Saxothuringia, Bohemia and Armorica faced to the north the Rheic–Rhenohercynian Ocean ([71,72]). The sequential closure of the two oceans led to the final collision, resulting in the formation of Pangea at ca. 300 Ma. Extensive crustal anatexis and granitoid magmatism in the south Variscan terranes, at c. 320–280 Ma, are considered to have been triggered by a change from a compressional to a transtensional/transpressional regime, locally associated with significant crustal thinning and asthenosphere upwelling, producing a complex pattern of strike–slip shear zones, collectively known as the East Variscan Shear Zone (e.g., [71,73,74,75]). According to reconstructions by [75,76], the CPO was also possibly part of the East Variscan Shear Zone. The latest stages of the Variscan Orogeny were marked also in the CPO by widespread crustal melting and voluminous granitoid magmatism [23,24,25,28,77,78,79]. Such magmatism gave rise to the composite Serre and Sila batholiths in central and northern Calabria [21,23,28,77,78], as well as to isolated anatectic plutons of weakly to strongly peraluminous trondhjemites and strongly peraluminous leucogranodiorite-leucogranites in southern Calabria and north-eastern Sicily (Aspromonte Unit) [11,22,25,79,80]. Late Variscan magmatism in southern Italy ended with extensive dyke magmatism producing swarms of medium- to high-K calcalkaline felsic to intermediate dykes [81,82], which sharply intruded both the batholith and the upper crustal country rocks. These magmatic rocks represent the transition from a late-orogenic to a post-orogenic setting, associated with the early breakup of Pangea, which is documented by sodic-alkaline and tholeiitic Triassic basalts from northern Calabria [83] and central-western Sicily [84,85]. The pre-Alpine rocks from the CPO were then locally affected by Alpine metamorphism, which reworked pre-existing metamorphic rocks or produced monometamorphic Alpine rocks, the latter mostly exposed in the Catena Costiera and Aspromonte Massif. On the other hand, other CPO areas such as the Serre Massif in central Calabria, were largely unaffected by an Alpine metamorphic overprint ([62] and references therein).
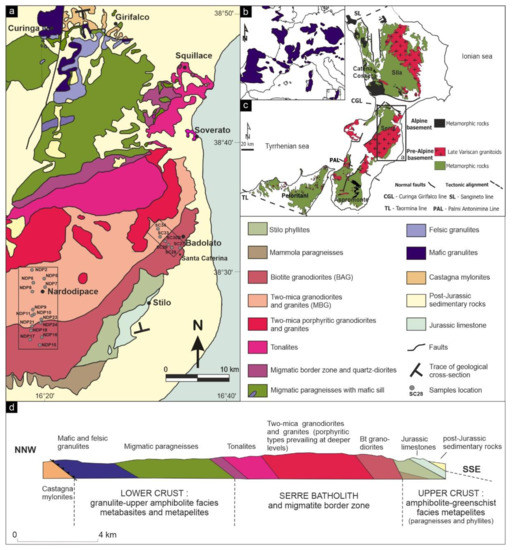
Figure 1.
Geological sketch map of the Serre Massif (modified from [78] and references therein, adapted with permission from Elsevier) with black boxes indicating study areas: (a). Insets show; (b) distribution of pre-Alpine basement in western Europe [29,30,58], adapted with permission from Elsevier; the square indicates the Calabria–Peloritani Orogen; (c) distribution of Alpine and pre-Alpine (Variscan and/or pre-Variscan) basement rocks in the Calabria–Peloritani Orogen and main tectonic alignments; (d) simplified lithological cross-section of the Serre Massif, whose orientation is marked in (a).
2.2. The Serre Massif
The Serre Massif (Figure 1), in the central portion of the CPO, represents an almost complete and continuous exposure of late Variscan continental crust (e.g., [29,30,58]) and consists of metamorphic and magmatic rocks linked to the Variscan orogenic cycle. In this crustal section, it is possible to distinguish three segments that crop out from the north-west to the south-east and are broadly representative of the lower, middle and upper crust, respectively.
The 7–8 km thick lower crustal portion, exposed in the northern part of the Serre Massif, is composed by 2–3 km thick mafic granulites, including basal layered metagabbros, intercalated by minor felsic granulites, fine-grained metapelites and metacarbonates. These are overlain by a metapelitic complex of 5–6 km overall thickness, comprising dominant migmatitic paragneisses and felsic granulites, with intercalated metabasites and rare marbles and augen gneisses. Tonalitic–trondhjemitic dykes of dm to m-size intrude the metabasic complex, while mafic dykes with thickness up to 300 m are present in the overlying metapelitic unit [21,58,86]. The mafic granulites experienced multi-stage dehydration–decompression, passing from peak values of at least 1.1 GPa at 900 °C to 0.7–0.8 GPa at 650–700 °C [87]. The metapelites have been subjected to amphibolite facies metamorphism (peak P–T 0.8 GPa at 700 °C; [88]) related to crustal thickening, followed by a multi-stage decompressional path with dehydration melting and finally near-isobaric cooling associated with the final stages of exhumation.
The intermediate portion of the crust is composed by the late Variscan intrusive rocks of the Serre Batholith [25,78,89,90], with an overall thickness of about 12–13 km, also including the granitoids from the Capo Vaticano Promontory and Palmi-Bagnara area. It mostly consists of tonalites to granites, with minor quartz diorites and quartz gabbros. Previous microstructural studies on the Serre granitoids [25,26,27,28,91] have widely documented that these rocks have experienced deformation during their cooling history. According to most authors, magma emplacement took place along ductile shear zones in an extensional regime [25,29,30], at depths ranging from ~23 to ~6 km [28]. In particular, Angì et al. [30] proposed that the upper crustal paragneisses from the Serre Massif, after achieving baric peak conditions of 0.9 GPa, were quickly exhumed by means of a shear zone operating in a mainly extensional regime. Furthermore, as suggested by [24,25] and confirmed by [23], the emplacement of the granitoids and, therefore, the construction of the batholith itself, occurred through a mechanism of overaccretion. Specifically, according to [23], partial melting conditions were reached, at different times, in specific lower crustal sources, which generated magmas whose emplacement depth was then strongly influenced by the presence of the previously intruded granitoid bodies. Although Serre plutonic rocks are collectively roughly referred to as mid-crustal granitoids, Caggianelli et al. [27,28] have identified the following: (1) lower crustal granitoids, emplaced at depths in the range of 23–20 km (P = 0.65–0.57 GPa); (2) intermediate level granitoids, emplaced at depths of ca. 20–17 km (P = 0.55–0.47 GPa); (3) upper crustal granitoids, emplaced at depths shallower than 12 km (P < 0.31 GPa). Specifically, strongly foliated quartz diorites and tonalites were intruded earlier at deep structural levels, producing a migmatitic border zone in the lower-crustal host rocks [25]. On the other hand, weakly foliated to unfoliated granodiorites and granites were emplaced later into shallower crustal domains, producing contact aureoles in the low to medium-grade host rocks of the upper crust [30,92]. The intermediate level granitoids in the central parts of the batholith are predominantly two-mica porphyritic granodiorites and monzogranites (MBPG) [78,93] characterized by K-feldspar megacrysts up to 10 cm long. The uppermost granitoids, representing the shallowest intrusions [28,90], are two-mica granodiorites and granites (MBG) passing upward to biotite ± amphibole weakly peraluminous granodiorites (BAG). Geochronological studies from [23] and references therein, which aimed to constrain the construction ages of the different levels of the batholith, indicate ca. 297 Ma for the lower crustal quartz diorites and tonalites, ca. 295 for the upper intermediate strongly peraluminous granodiorites and granites and, finally, ca. 292 Ma for the upper crustal granodiorites; their results suggest that the Serre Batholith may have developed over a relatively short time period of about 5 Ma.
The uppermost crustal portion, exposed in the southern part of the Serre Massif, is comprised of two different metamorphic complexes that were brought into tectonic contact along a low-angle surface before being intruded by the granitoids [30,92,94]: a lower-grade hanging wall complex and a higher-grade footwall complex (Stilo–Pazzano complex and Mammola complex, respectively). The Stilo–Pazzano complex consists of low greenschist-facies phyllites with minor marbles, quartzites and metavolcanic levels. The Mammola complex comprises dominant lower amphibolite-facies paragneisses and subordinate leucocratic gneisses and amphibolites. The upper crustal rocks are locally intruded by late- to post-Variscan felsic to mafic dykes [82]. According to Angì et al. [30], the Mammola paragneisses were affected by collision-related crustal thickening together with the lower crustal metapelitic migmatites reaching peak P–T conditions of 0.9 GPa at 530 °C, but they were then detached from the lower-crustal metapelites before achieving thermal equilibrium and rapidly uplifted to upper crustal levels (up to c. 0.3 GPa at 470 °C) along a major extensional shear zone that also assisted the emplacement of the granitoids. In this framework, Fiannacca et al. [23] suggested that the Mammola paragneisses acted as the continuously uplifted lid of the batholith, accommodating the emplacement of the newly arriving magmas for most or all of its accretion history. During the last stages of batholith construction and shear zone activity, the Mammola complex was underthrusted beneath the upper crustal Stilo–Pazzano complex [30]. According to [23], the upper crustal Serre granitoids were emplaced during these waning shearing stages, suturing the tectonic contact between the two metamorphic complexes at the batholith roof and producing late- to post-tectonic thermal metamorphism in the host rocks [92]. This also involved the annealing of the mylonitic foliation in the paragneisses closest to the contact with the magmatic rocks [30]. In Tursi et al. [94], a similar P–T path for the Mammola paragneisses was obtained, with cooling and exhumation from the metamorphic peak at ~0.9 GPa and 585°C to ~0.3 GPa and 440–470 °C; these authors propose that mylonitization occurred during prograde evolution to deep-crustal conditions as well as during subsequent exhumation and final juxtaposition to the upper crustal Stilo–Pazzano phyllites, though not discussing the possible relationships between shear zone activity and emplacement of the Serre granitoids. Furthermore, Tursi et al. [94] interpreted the obtained P-T path, including the difference in peak temperature between the Mammola paragneisses and the similarly deep-seated migmatitic metapelites, as due to location of the Mammola unit in a Palaeotethys–Gondwana subduction complex, while both migmatitic metapelites and Stilo phyllites would be part of the Laurussia upper plate.
2.3. Previous Studies on the Upper Crustal Serre Granitoids
BAG and MBG crop out in the central to southernmost sector of the Serre Batholith. According to [90], a gradual transition occurs in the central Serre, from border BAG, intruding the upper crustal basements rocks, to inner MBG. Both rock types show a slightly inequigranular structure due to coarser biotite crystals. BAG consist of zoned plagioclase crystals with An61–44 cores and An51–23 rims [90,95], orthoclase, biotite and rare amphibole (up to 3 vol.%), forming aggregates with biotite, apatite, allanite and zircon. In MBG, plagioclase is zoned from andesine to oligoclase; biotite is more enriched in Fe and Altot and more depleted in Mg than in BAG; muscovite appears either as crystallized together with quartz and K-feldspar or as a secondary product replacing plagioclase and biotite, while no amphibole or allanite occurs. Both BAG and MBG contain mafic microgranular enclaves up to more than 50 cm in size, but their abundance drastically decreases in the transition to the MBG. Centimeter-sized metabasic enclaves only occur in BAG, whereas similarly sized metapelitic enclaves, although more abundant in MBG, are present in both granitoid types. Finally, both rock types are locally intruded by late- to post-tectonic aplitic-pegmatitic dykes [30,82].
Previous studies on the fabric of the upper levels of the Serre Batholith have been carried out by [26,27,28], which specifically studied Santa Caterina granodiorites (BAG samples, ~6 km estimated depth of emplacement, Figure 1). Acquafredda et al. [26] highlights a chiefly isotropic fabric and a magmatic layering, even though they define these rocks as massive granitoids, in accordance with [90]. Accordingly, Caggianelli et al. [27], based on measurements of the fabric ellipticity in the Serre granitoids by using feldspar and quartz crystals as markers, quantified a significant increase in fabric anisotropy from the shallowest to the progressively deeper crustal levels, measuring in Santa Caterina granodiorites the lowest fabric anisotropy. Moreover, Rb–Sr biotite cooling ages from the same authors, together with Rb–Sr biotite and white mica ages and zircon and apatite fission track ages by [28,96], suggest that any fabric of these shallow-level granodiorites was mainly gained in the magmatic stage, since data indicate rapid cooling and crossing of the brittle–ductile transition. In addition, a magmatic foliation is locally defined by preferential mineral orientation, parallel arrangement of mafic enclaves or schlieren layering. Similarly, it is possible to detect the effect of a deformation that occurred in the solid state. In more detail, Caggianelli et al. [96] recognize in the Santa Caterina granodiorites a pre-full crystallization fabric [97] with variable degrees of anisotropy, given by the preferred orientation of plagioclase, biotite and amphibole; they underline that the deformation continued in the solid state, as indicated by the presence of quartz aggregates with lobate grain boundaries, chessboard patterns and rare dynamically recrystallized K-feldspar. Finally, in Festa et al. [98], mapping the contact between BAG and the metamorphic host rocks in the southern sector of the Serre Massif, recognized an isotropic magmatic structure for these shallowest granitoids.
3. Materials and Methods
Thin sections of 45 samples from the study area were studied with an (Axioscope 2 optical microscope (Zeiss, Germany). High resolution images of the entire thin sections were acquired by using a flatbed scanner (Epson Perfection 3490 Photo; Seiko, Japan) at a resolution of 4800 dpi (both at crossed and parallel polarizers), together with several photomicrographs of deformed domains taken by an Axios Camera (Zeiss, Germany) mounted on the Zeiss Axioscope 2 Microscope, both hosted at the Department of Biological, Geological and Environmental Sciences, University of Catania.
Anisotropy of magnetic susceptibility (AMS) was employed to decipher the magnetic fabric in the studied rocks, drilling multiple cores from each sample, oriented in the field by means of a geological compass. Several samples, especially less fresh samples from the north-eastern sector of the study area, broke down during core drilling. Therefore, AMS investigations were carried out on a selection of 24 oriented samples collected along two transects (Figure 1a, Table 1). AMS measurements were made using the KLY-4S Kappabridge (AGICO, Czech Republic) housed in the Department of Geology and Geophysics, Indian Institute of Technology (IIT), Kharagpur (India). This is a fully automatic inductivity bridge that has a sensitivity of 2 × 10⁻⁸ SI units. All the measurements were made in an external magnetic field of 300 A/m. Three to seven standard cores (each having 25.4 mm diameter and 22 mm height) were investigated from every oriented sample. The measurements were made in spinner mode using the program SUFAR 4.2 (AGICO, Czech Republic). AMS measurements yield magnitude and orientation of the three principal axes of the AMS ellipsoid, where K1 > K2 > K3 [37,38]. The magnetic lineation corresponds to the K1 axis, while the K3 axis represents the pole to the magnetic foliation (i.e., the plane containing both K1 and K2 axes). The magnitudes of K1, K2 and K3 are used to calculate the various parameters as follows: intensity of magnetic lineation (L) and foliation (F), corrected degree of magnetic anisotropy (Pj) and the shape parameter (T).
The formulae are as below (after [37,38]):
Km = (K1 + K2 + K3)/3
F = K2/K3L = K1/K2
Pj = exp √{2[(η1 − ηm)2+(η2 − ηm)2+(η3 − ηm)2]}
Tj = (2η2 − η 1− η3)/( η1 − η3)
Here, η1 = ln K1, η2 = ln K2, η3 = ln K3 and ηm = (η1.η2.η3)1/3. Pj (sometimes also denoted as P′) is a measure of the eccentricity of the AMS ellipsoid and Tj gives the shape of the ellipsoid. The value of Tj lies between −1 and +1. Positive and negative values indicate oblate and prolate shapes, respectively.

Table 1.
AMS data of the Serre Batholith rocks investigated in this study. Km, L, F, Pj and T are the average susceptibility, the magnetic lineation, the magnetic foliation, the magnetic anisotropy and the shape parameter, respectively. K1, K2 and K3 are the three main axes of the magnetic ellipsoid (K1 > K2 > K3), whose declination (azimuth) (D) and inclination (plunge) (I) of the Kmax and Kmin axes are reported.
| Sample | Lat Long | Cores per Sample | Unit | Km (10−6 SI) | Km St. Dev. | L | F | Pj | T | K1 D/I | K1 Mean Tensor | K1 95% Conf. Angle | K3 D/I | K3 Mean Tensor | K3 95% Conf. Angle | K2 D/I | K2 Mean Tensor | K2 95% Conf. Angle |
|---|---|---|---|---|---|---|---|---|---|---|---|---|---|---|---|---|---|---|
| NDP-12 | 16°20′50″ 38°26′58″ | 5 | BAG | 171 | 3.34 × 10⁻⁵ | 1.015 | 1.017 | 1.033 | 0.034 | 77/51 | 1.005 | 75/23 | 193/20 | 0.993 | 43/29 | 296/32 | 1.002 | 75/36 |
| NDP-16 | 16°20′45″ 38°25′56″ | 4 | BAG | 175 | 1.86 × 10⁻⁵ | 1.007 | 1.017 | 1.025 | 0.412 | 19/23 | N.A. | N.A. | 288/03 | N.A. | N.A. | 190/67 | N.A. | N.A. |
| NDP-17 | 16°20′20″ 38°26′03″ | 4 | BAG | 47 | 5.00 × 10⁻⁶ | 1.021 | 1.019 | 1.042 | −0.080 | 153/36 | N.A. | N.A. | 300/42 | N.A. | N.A. | 50/18 | N.A. | N.A. |
| NDP-18 | 16°20′28″ 38°26′42″ | 4 | BAG | 121 | 1.94 × 10⁻⁵ | 1.010 | 1.016 | 1.027 | 0.292 | 25/18 | N.A. | N.A. | 200/72 | N.A. | N.A. | 65/12 | N.A. | N.A. |
| SC-28 | 16°29′42″ 38°32′03″ | 6 | BAG | 163 | 3.19 × 10⁻⁵ | 1.005 | 1.010 | 1.016 | 0.279 | 188/58 | 1.004 | 34/18 | 286/05 | 0.995 | 33/19 | 19/32 | 1.001 | 39/23 |
| SC-29A | 16°29′22″ 38°32′14″ | 4 | BAG | 221 | 1.31 × 10⁻⁵ | 1.011 | 1.018 | 1.020 | −0.119 | 268/12 | N.A. | N.A. | 60/72 | N.A. | N.A. | 66/30 | N.A. | N.A. |
| SC-30B | 16°28′55″ 38°32′16″ | 5 | BAG | 164 | 1.62 × 10⁻⁵ | 1.017 | 1.020 | 1.037 | 0.073 | 194/16 | 1.014 | 35/8 | 104/01 | 0.983 | 13/08 | 12/74 | 1.003 | 36/05 |
| SC-40 | 16°28′29″ 38°33′30″ | 5 | BAG | 247 | 1.54 × 10⁻⁵ | 1.005 | 1.010 | 1.016 | 0.287 | 180/54 | N.A. | N.A. | 300/78 | N.A. | N.A. | 285/66 | N.A. | N.A. |
| NDP-2B | 16°19′55″ 38°31′41″ | 7 | MBG | 69.3 | 8.38 × 10⁻⁶ | 1.014 | 1.024 | 1.039 | 0.254 | 12/59 | 1.012 | 44/10 | 269/08 | 0.981 | 10/07 | 175/30 | 1.007 | 44/07 |
| NDP-2BIS | 16°19′55″ 38°31′41″ | 6 | MBG | 69.6 | 1.50 × 10⁻⁵ | 1.018 | 1.022 | 1.042 | 0.137 | 348/49 | 1.012 | 26/13 | 255/03 | 0.986 | 29/16 | 162/41 | 1.002 | 26/19 |
| NDP-6 | 16°21′10″ 38°30′18″ | 7 | MBG | 91 | 1.89 × 10⁻⁵ | 1.008 | 1.020 | 1.030 | 0.218 | 278/09 | 1.007 | 29/24 | 13/28 | 0.995 | 13/28 | 172/60 | 0.999 | 64/25 |
| NDP-7 | 16°21′06″ 38°30′06″ | 5 | MBG | 69.6 | 1.50 × 10⁻⁵ | 1.006 | 1.014 | 1.021 | 0.375 | 62.2/61.7 | 1.006 | 27/10 | 157.7/3.0 | 0.991 | 21/15 | 249/28 | 1.003 | 28/17 |
| NDP-8 | 16°20′38″ 38°29′39″ | 7 | MBG | 57.6 | 6.42 × 10⁻⁶ | 1.005 | 1.006 | 1.012 | 0.044 | 251.3/18.3 | 1.003 | 33/14 | 137.2/51.0 | 0.997 | 27/18 | 354/33 | 1.000 | 34/23 |
| NDP-9 | 16°20′53″ 38°27′59″ | 7 | MBG | 12.6 | 3.12 × 10⁻⁶ | 1.048 | 1.059 | 1.112 | 0.067 | 358.5/58.7 | 1.016 | 48/23 | 176.6/31.3 | 0.987 | 60/39 | 267/01 | 0.997 | 60/41 |
| NDP-10 | 16°21′02″ 38°27′43″ | 4 | MBG | 143 | 1.43 × 10⁻⁵ | 1.011 | 1.013 | 1.025 | 0.086 | 48.0/60.0 | N.A. | N.A. | 171.0/12.0 | N.A. | N.A. | 73/36 | N.A. | N.A. |
| NDP-11 | 16°20′56″ 38°27′34″ | 5 | MBG | 128 | 1.10 × 10⁻⁵ | 1.011 | 1.017 | 1.029 | 0.194 | 210.5/55.1 | 1.007 | 23/18 | 0.8/31.2 | 0.993 | 35/22 | 100/14 | 0.999 | 36/13 |
| NDP-21 | 16°21′11″ 38°27′48″ | 5 | MBG | 129 | 1.55 × 10⁻⁵ | 1.013 | 1.012 | 1.026 | −0.115 | 200.0/73.2 | 1.01 | 31/13 | 307.5/5.2 | 0.988 | 14/6 | 39/16 | 1.002 | 31/06 |
| NDP-23 | 16°21′41″ 38°27′17″ | 3 | MBG | 150 | N.A. | 1.011 | 1.015 | 1.027 | 0.063 | 195.2/39.1 | N.A. | N.A. | 293.2/9.8 | N.A. | N.A. | 35/49 | N.A. | N.A. |
| NDP-24 | 16°21′37″ 38°27′07″ | 7 | MBG | 162 | 7.24 × 10⁻⁶ | 1.005 | 1.018 | 1.024 | 0.559 | 81.7/11.7 | 1.004 | 29/16 | 175/15.2 | 0.995 | 48/17 | 316/71 | 1.001 | 48/29 |
| SC-33 | 16°28′25″ 38°32′37″ | 5 | MBG | 113 | 1.86 × 10⁻⁵ | 1.019 | 1.011 | 1.031 | −0.231 | 57.2/14.8 | 1.011 | 29/13 | 300.5/59.7 | 0.991 | 39/15 | 155/26 | 0.998 | 39/26 |
| SC-34 | 16°28′13″ 38°33′06″ | 6 | MBG | 65.3 | 5.73 × 10⁻⁶ | 1.012 | 1.008 | 1.020 | −0.158 | 144.1/20.1 | 1.004 | 42/32 | 246.3/30.0 | 0.995 | 48/33 | 26/53 | 1.000 | 49/38 |
| SC-38 | 16°28′56″ 38°33′33″ | 5 | MBG | 38.2 | 3.55 × 10⁻⁶ | 1.006 | 1.010 | 1.017 | 0.144 | 209.0/36.5 | 1.003 | 64/31 | 64.0/48.0 | 0.995 | 35/15 | 313/18 | 1.001 | 64/17 |
| SC-39A | 16°28′56″ 38°33′48″ | 5 | MBG | 128 | 1.28 × 10⁻⁵ | 1.007 | 1.013 | 1.021 | 0.285 | 89.2/27.7 | 1.006 | 29/14 | 262.0/62.0 | 0.995 | 48/16 | 358/03 | 0.999 | 48/27 |
| SC-39B | 16°28′57″ 38°33′49″ | 3 | MBG | 121 | 2.52 × 10⁻⁵ | 1.006 | 1.035 | 1.046 | 0.390 | 350.0/54.0 | N.A. | N.A. | 231.0/48.0 | N.A. | N.A. | 15/66 | N.A. | N.A. |
Lastly, the samples from the transects (Figure 1a) were used for a semi-quantitative study aimed at assessing any possible relationship between rock type/emplacement depth and type and relative incidence of microstructures recorded from magmatic to low-temperature subsolidus conditions. For each studied thin section, the frequencies of each microstructure exhibited by the different mineral phases were reported in a table sheet, grouped by related temperature conditions, and finally converted into pie charts.
4. Results
4.1. Upper Crustal Granitoid Rocks in the Study Area
This section is aimed to give the reader an exhaustive summary of the general field and petrographic features of the granitoid rocks making up the upper levels of the Serre Batholith, before presenting deformation microstructures and magnetic data, which are the main focus of this work.
The granitoid outcrops studied in this work are from two transects (Figure 1), each of them crossing the transition between MBG and BAG. At the outcrop scale, relationships between these rocks are not easy to define, since no intrusive contact has been observed in the studied area and an extreme alteration often prevents fruitful field observations. Both lithotypes are characterized by slightly heterogeneous grain size and are generally massive (Figure 2a,b); BAG are usually slightly coarser-grained than BMG, with the former typically showing coarser biotite prismatic grains, sometimes gathered into polycrystalline aggregates. A thick system of veins and aplitic-pegmatitic dykes, reaching locally a meter in thickness, mostly characterizes MBG (Figure 2c). Another key character is the occurrence of mafic enclaves, usually globular but locally evolving into more stretched shapes (Figure 2d), with their abundance much higher in the BAG. Rare occurrences of narrow shear zones have been observed within the BAG (Figure 2e–g), sometimes evolving into mylonitic bands up to 5 cm thick.
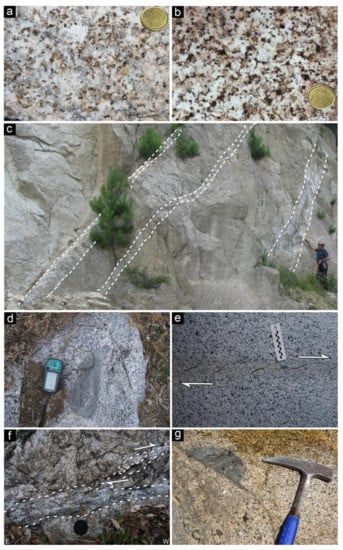
Figure 2.
Typical field appearance of (a) MBG and (b) BAG; (c) 10 cm to a meter thick steeply dipping felsic dykes showing sharp intrusive contacts with MBG host rocks; (d) stretched mafic microgranular enclave in BAG; (e) narrow shear zone showing a dextral sense of shear within an isotropic BAG; (f) anastomosed shear zone with a dextral sense of shear in BAG; (g) mafic enclave truncated by a narrow shear zone in BAG. A weak fabric can be detected in close proximity of the tectonic structure.
MBG crop out in the central sector of the Serre Batholith and are bounded by the intermediate-seated rocks of the batholith to the north and by the BAG to the south.
MBG are medium-fine grained slightly inequigranular and isotropic rocks (Figure 3a), with local occurrence of tectonic grain size reduction (Figure 3b). The microstructure is hypidiomorphic, with large quartz, plagioclase and biotite (Figure 3a,b). On average, the MBG are made up of plagioclase (c. 40%), quartz (c. 25%), K-feldspar (c. 20%), biotite (c. 10%) and muscovite (c. 5%). Plagioclase appears in euhedral-subhedral weakly zoned crystals, and in rare crystals with a well-developed oscillatory zoning (Figure 3c). K-feldspar is subhedral to euhedral, usually present as microcline and more rarely as orthoclase (Figure 3d); microperthites frequently occur. Biotite occurs as tabular crystals, sometimes altered (Figure 3a–d); alteration occurs as chloritization along rims, cleavage planes and transgranular fractures that cross the crystals, rarely affecting the whole individuals, as epidotization of the rims of the crystals and, more typically, as red staining. Muscovite occurs both as primary and secondary phase (Figure 3a–d). Among the accessory phases, zircon is closely associated with biotite. Apatite forms inclusions in biotite (Figure 3c) and more rarely in plagioclase. It is present more as prismatic rather than acicular crystals. Monazite occurs in rounded grains commonly along biotite rims. Titanite crystals are very scarce, always associated to biotite and exclusive of samples close to the BAG transition zone. Oxides, represented by ilmenite (Figure 3c) and very rare hematite, are found in low proportions (<1% vol.). Secondary phases include sericite and muscovite, as products of alteration of plagioclase, and chlorite partially replacing biotite. The overlying BAG crop out in the central-southern sector of the Serre Batholith. They are delimited to the north by MBG, to the east by Cenozoic covers and to the south-east by the Stilo–Pazzano and Mammola complexes.
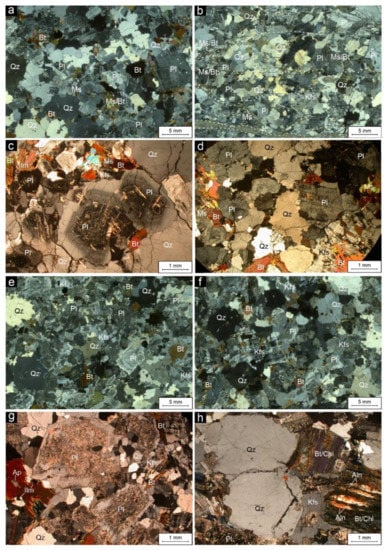
Figure 3.
General petrographic features of the studied granitoids (crossed polars). Two-mica granites (MBG, a–d): (a,b) thin-section scans showing subhypidiomorphic-autoallotriomorfic microstructures with pervasive fracturing in the sample on the right highlighted by dashed white lines (a: NDP10-N 38°27′43″, E 16°21′02″; b: NDP5–N 38°30′32″, E 16°21′19″); (c) zoned plagioclase crystals, subhedral quartz crystals and aggregates of biotite/muscovite exhibit an inequigranular microstructure (NDP10); (d) euhedral plagioclase together with rounded quartz grains with lobated boundaries, microcline and interstitial lamellae of biotite (SO12-N 38°28′02″, E 16°16′27″). Biotite ± amphibole granodiorites (BAG, e–h): (e,f) thin-section scans showing slightly inequigranular hypidiomorphic microstructures (e: SO8-N 38°26′18″, E 16°14′23″; f: NDP18-N 38°26′42″, E 16°20′28″); (g) typical subhedral plagioclase crystals with sericitic core and unaltered rims in contact with biotite and poikilitic microcline (NDP17-N 38°26′09″, E 16°20′20″); (h) subhedral fractured quartz crystals, altered plagioclase grains and partially chloritized biotite sheets with characteristic metamict allanite inclusions (NDP16-N 38°25’56′’, E 16°20′45″). Abbreviations are after Whitney and Evans (2010).
BAG are sub-hypidiomorphic medium to fine grained rocks, sometimes slightly porphyritic with larger plagioclase, quartz and biotite (Figure 3e,f). The microstructure is generally isotropic. The BAG studied in the present paper are made up of plagioclase (c. 40%), quartz (c. 25%), K-feldspar (c. 18%), biotite (c. 17%). Plagioclase occurs as euhedral to subhedral crystals, frequently with an altered core (Figure 3e–g). Some crystals preserve the original magmatic zoning, although less frequently compared to MBG. Quartz appears subhedral to anhedral (Figure 3e,f,h) and sometimes as interstitial crystals. K-feldspar mainly occurs as orthoclase, locally poikilitic with inclusions of quartz, biotite and plagioclase (Figure 3f,h). Locally, a weak microperthitic structure is visible. Biotite occurs as subhedral and anhedral crystals. Altered individuals occur more commonly than in MBG and include strongly chloritized crystals, preferentially along the rims but frequently affecting the entire crystals (Figure 3e,g). Secondary epidote habitually occurs at the crystal rims. Staining is also diffuse. Muscovite mostly appears as a secondary product replacing plagioclase and biotite, while it is rarely found as a primary phase together with quartz and K-feldspar. Zircon is closely associated with biotite. Apatite occurs both as roundish and acicular crystals, of smaller size than in MBG. Allanite is always associated to biotite, often occurring in a metamict state. Monazite, unlike in MBG samples, is lacking. Epidote is closely associated with biotite, frequently on the periphery of the crystals and along the cleavage planes. Titanite occurs as subhedral grains, commonly associated with biotite/chlorite but also with feldspar and quartz. Oxides are represented by ilmenite (Figure 3g) and hematite, where the latter usually accounts for a third of the total oxide modal proportion, which is always lower than 1%, but generally higher than MBG. Secondary phases include muscovite and sericite as a product of alteration of the plagioclase, chlorite and epidote associated with the alteration of biotite and finally clinozoisite associated mainly with plagioclase and more rarely with biotite.
4.2. Submagmatic to Subsolidus Deformation Microstructures
In the following two sub-sections, we will describe the microstructural evidence of deformation developed from submagmatic to, progressively, subsolidus lower temperature conditions in the studied late Variscan granitoids of the Serre Batholith emplaced at different depths and with different ages, mostly using the criteria of [31,32,33,34,35,99].
4.2.1. Two-Mica Granodiorites and Granites (MBG)
Magmatic microstructures in the MBG are represented by undeformed euhedral to subhedral plagioclase and K-feldspar crystals, subhedral to anhedral quartz grains and biotite and muscovite in plates with no evidence of kinking. No magmatic fabric or “pre-full crystallization fabric” [97] has been observed in the studied samples.
Submagmatic deformation microstructures (T > 650 °C) occur as a chessboard extinction pattern in quartz crystals (Figure 4a), resulting from combined activation of basal <a> and prism <c> slip systems, which is mostly referred to occur at T above 650 °C for pressure up to 1.0 GPa [33,100,101].
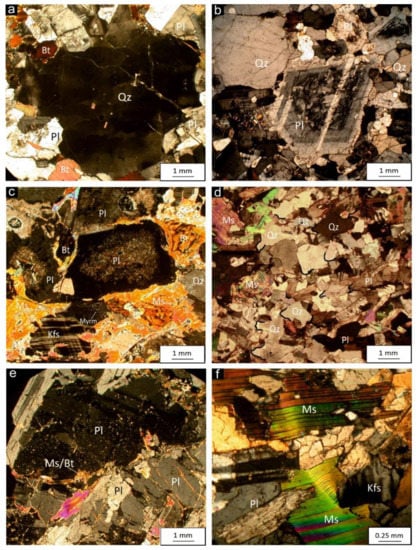
Figure 4.
Deformation microstructures from submagmatic to solid-state domain in two mica granodiorites (MBG). (a) Chessboard extinction in quartz due to deformation under submagmatic conditions (SC34-N 38°33′06″, E 16°28′13″); (b) strongly lobate boundaries indicative of GBM recrystallization in a zoned plagioclase crystal (NDP11-N 38°27′43″, E 16°20′56″); (c) slightly rounded feldspar crystals bounded by deformed Bt/Ms aggregates (NDP2-N 38°31′41″, E 16°19′55″); (d) grain boundaries orientation of quartz and plagioclase crystals as a result of SGR recrystallization mechanism (marked by black curved lines) (SO15-N 38°29′00″, E 16°17′03″); (e) deformation twins in a large plagioclase crystal together with a mica fish, indicating dextral sense of shearing (NDP8-N 38°2′39″, E 16°20′38″); (f) kink bands in submillimetric muscovite crystals (SO15).
Subsolidus high-temperature deformation microstructures (T about 550 °C) are provided by grain boundary migration (GBM) recrystallization in feldspars (Figure 4b; e.g., [102]). Examples of GBM recrystallization are found in quartz crystals as well, exhibiting extremely lobate boundaries with feldspar crystals. Ribbon-like quartz and, more in general, variably stretched grains with undulose extinction occur locally along millimeter to submillimetric cataclastic zones. Evidence of bulging (BLG) recrystallization of feldspar (Figure 4b), suggesting deformation at 450–600 °C [33], is found frequently in contacts with quartz grains. Asymmetrically anastomosing biotite/muscovite folia around large, sometimes fractured, feldspar crystals occur locally (Figure 4c). Few examples of sub-grain rotation (SGR) recrystallization of feldspar and quartz are also observed, especially in subtly oriented fine-grained domains (Figure 4d), indicating a temperature of deformation ranging between 400 and 500 °C [33,103]. Rare myrmekitic intergrowths and quartz forming core-and-mantle microstructure are also pertinent to this thermal domain.
Low-temperature deformation microstructures, produced at T ≤ 400 °C, are mainly represented by ubiquitous BLG recrystallization in quartz grains (Figure 4c). Plagioclase crystals often show deformed polysynthetic albite twins (Figure 4b), while some K-feldspar grains exhibit inhomogeneous albite–pericline twinning, localized only in some portions of the crystal (Figure 4e). In some cases, deformation localizes into a kink band affecting the whole plagioclase crystal. Flame perthites occur frequently in large K-feldspar crystals and less frequently in smaller ones; these microstructures have been related to deformation by [104]. Few examples of mica fish in muscovite (Figure 4e) and more frequent occurrences of kinked crystals, in both muscovite (Figure 4f) and biotite, indicate intracrystalline plastic deformation in the same temperature domain. Finally, undulose extinction, as well as deformation bands, occur very frequently in quartz.
4.2.2. Biotite ± Amphibole Granodiorites (BAG)
Magmatic microstructures in the BAG are characterized by undeformed euhedral to mostly subhedral grains of plagioclase with polysynthetic albite twins, subhedral to anhedral K-feldspar with regular cross-hatched twinning and biotite occurring as stout prismatic to tabular crystals. Pre-full crystallization fabric and/or magmatic fabric are not detected in the studied granitoids. Submagmatic deformation microstructures are represented by chessboard extinction in quartz crystals (Figure 5a). Submagmatic microfractures, providing direct evidence of deformation in the presence of melt, have been locally detected (Figure 5b).
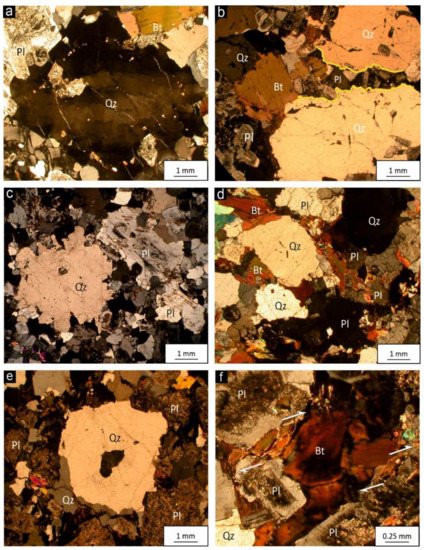
Figure 5.
Deformation microstructures from submagmatic to solid-state domain in biotite ± amphibole granodiorites (BAG). (a) Large anhedral quartz crystal characterized by chessboard extinction overprinted by a dominant undulose extinction (NDP24-N 38°27′07″, E 16°21′37″); (b) submagmatic microfracture (yellow lines) filled by subhedral plagioclase after breaking apart a large quartz crystal (SC28-N 38°32′03″, E 16°29′42″); (c) extremely lobed edges of both quartz and plagioclase crystals, representing examples of high-temperature recrystallization (NDP17-N 38°26′09″, E 16°20′20″); (d) quartz and plagioclase crystals with wavy boundaries wrapped by biotite grains (SO3-N 38°25′01″, E 16°10′42″); (e) core-and-mantle microstructure in a quartz crystal showing dynamic recrystallization at its edges (NDP15-N 38°25′45″, E 16°20′27″); (f) sub-millimetric biotite mica fish, indicating dextral sense of shearing (NDP18-N 38°26′42″, E 16°20′28″).
High-temperature subsolidus microstructures (T about 550 °C) are abundantly present in quartz crystals and less frequently in feldspars, especially K-feldspar. At temperatures greater than 550 °C [102], the grain boundary migration (GBM) recrystallization mechanism makes feldspar boundaries able to move freely (Figure 5c,d). Ribbon-like quartz with undulose extinction is locally present. Quartz also shows examples of GBM recrystallization with strongly lobate boundaries, indicating temperatures of deformation between 500 °C and 700 °C (Figure 5c). Deformation at temperatures between 450 °C and 600 °C is documented by BLG recrystallization in feldspars (Figure 5c). Myrmekitic intergrowths in plagioclase, in contact with K-feldspar crystals, are also pertinent to this thermal domain and indicate deformation temperatures of ~550°C or more [99,105,106] (Figure 5d). Feldspars and quartz sometimes occur as slightly rounded grains bounded by biotite layers (Figure 5d). Rare examples of lower temperature SGR recrystallization occur locally in quartz crystals, indicating deformation in the temperature range of ~400–500 °C [33]. Finally, remnants of older grains enveloped by newly recrystallized grains as core-and-mantle microstructures are found in both plagioclase and quartz (Figure 5e) crystals.
Low-temperature subsolidus microstructures (T < 450 °C) are widespread in these rocks and tend to obliterate the higher temperature microstructures. Both plagioclase and K-feldspar show deformation twins and kinked grains, which, according to [33], suggest deformation between 400 and 500 °C. Bulging recrystallization of quartz crystals [33,100] is widespread in all the studied samples, which indicates temperatures of deformation under 400 °C (Figure 5d,e). Furthermore, flame perthites are locally found in K-feldspar, as a result of K-feldspar replacement by albite in sites subjected to oriented pressure during deformation [35]. Evidence of deformation at the same thermal conditions is also provided by undulose extinction of quartz, mica kink bands and rare mica fish (Figure 5f).
4.3. Anisotropy of Magnetic Susceptibility (AMS)
As shown in the previous section, although the rocks have evidence of deformation and dynamic recrystallization at the microscopic scale, there is no well-developed visible (mesoscopic) planar and/or linear fabric. To identify the internal fabric in the rocks, anisotropy of magnetic susceptibility (AMS) was employed. Oriented blocks were sampled along two transects crossing the MBG–BAG transition in the proximities of Nardodipace and Badolato villages (Figure 1, Table 1). The values of magnetic anisotropy Pj (MBG, 1.012–1.046 with one value at 1.112; BAG, 1.016–1.042) highlight a quite narrow range of magnetic anisotropies developed within these rocks.
The Pj vs. T (Jelinek) plot (Figure 6a) shows that the shape of the AMS ellipsoids varies between oblate and prolate, although the oblate shape is more prominent for both BAG and MBG. In more detail, T value varies from 0.412 (sample_NDP16) to −0.119 (sample SC29A) in the BAG, and from 0.559 (sample_NDP24) to −0.231 (sample SC33) in the MBG. A mainly oblate AMS ellipsoid identifies a dominant flattened fabric in the studied granitoids, indicating that magnetic foliation is more developed than magnetic lineation. This is consistent with microstructural data by [27], indicating that fabric ellipsoids in the Serre granitoids mostly exhibit an oblate shape and therefore suggest a flattening deformation. However, it is to be noticed that magnetic axis values for the studied upper crustal granitoids are very close to each other and they actually result in a spheroidal shape, rather than ellipsoidal. On the other hand, the results from the above diagrams indicate that the granitoids hold a magnetic fabric, even though of a quite weak intensity. An exception is observed for a single sample (NPD−9; MBG) with an appreciable microstructural fabric represented by oriented mica flakes and dynamically recrystallized grains, which are characterized by much higher values of the plotted magnetic parameters (Table 1).
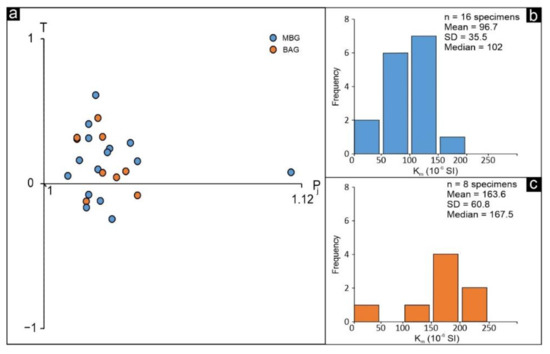
Figure 6.
Magnetic parameters for the investigated granitoids from the upper crustal levels of the Serre Batholith: (a) Degree of magnetic anisotropy (Pj) vs. shape parameter (T) plot (Jelínek plot); (b,c) histograms of Km reporting variation of magnetic susceptibility values within MBG (b) and BAG (c), the latter having higher mean magnetic susceptibility. Blue: MBG; orange: BAG. SD: standard deviation.
The mean magnetic susceptibility (Km) value calculated from the available data (Figure 6b,c), is of ca. 163.6 × 10⁻⁶ SI units for the BAG, with a maximum value of 247 × 10−6 and a minimum of 47 × 10−6; the mean magnetic susceptibility value for the MBG is 96.7 × 10⁻⁶ SI units, with a maximum of 162 × 10−6 and a minimum of 12.6 × 10⁻⁶.
Magnetic susceptibility has long been used to discern between different granitoid types. From a magnetic point of view, indeed, Ishihara et al. [107] distinguished granitoids belonging to a Magnetite Series characterized by the occurrence of magnetite and/or magnetite/ilmenite and granitoids of the Ilmenite Series characterized by the occurrence of ilmenite and/or hemo-ilmenite. Furthermore, the Magnetite Series granites would roughly coincide with I-type granites, while the Ilmenite Series granites have more affinity with S-type granites (e.g., [108,109]). From the petrographic features in the present study and from the petrological and geochemical features discussed by [78] and references therein, for the granitoid rocks of the Serre Batholith, the MBG would be associated with S-type granitoids. BAG, on the other hand, have more ambiguous features, in any case closer to those of I-type granites. However, magnetite is absent in BAG and therefore this possible correlation between magnetic and compositional properties is not observed in our studied granitoids. The mineralogical composition of the Serre Batholith rocks includes diamagnetic, paramagnetic and ferromagnetic phases, where feldspar and quartz, both diamagnetic minerals, represent more than 80% of the mineral assemblage. The most abundant paramagnetic minerals for these rocks, biotite and muscovite, have a positive magnetic susceptibility on the order of 10−5 to 10−4 [SI]. Among the accessory phases, epidote, titanite, allanite in BAG and monazite in MBG are also paramagnetic minerals, whereas apatite and zircon are classified as diamagnetic minerals. On the other hand, ilmenite and hematite have ferromagnetic properties and, although less than 1 vol.% in the studied granitoids, they contribute with a magnetic susceptibility on the order of 10−2–10−1 [SI] [38]. Major diamagnetic minerals, quartz and feldspars, have a small negative magnetic susceptibility, with average values equal to −12.5 × 10⁻⁶ [SI] [38,110] and −13.4 × 10⁻⁶ [SI] [38], respectively. However, as noted in the present study, all the samples have positive susceptibilities, with Km values in the typical magnetic susceptibility range for granitic rocks, i.e., 0–50,000 × 10−6 [SI] [111].
In light of this, it can be useful to understand how much the paramagnetic phases can contribute to the magnetic susceptibility. The contribution of paramagnetic minerals to the rock susceptibility can be estimated using the concept of the Maximum Theoretical Paramagnetic Susceptibility (MTPS) introduced by [112]. This approach considers all iron and manganese of the rocks to be contained in the paramagnetic minerals, since the paramagnetic contribution to the magnetic susceptibility originates mainly from Fe2+, Fe3+ and Mn2+ in mafic silicates, such as biotite, which is the only mafic mineral phase in the rocks under study. Therefore, once the iron and manganese content in the rocks have been determined, the MTPS can be calculated. Several similar formulae for calculating the MTPS were introduced in the past years (e.g., [112,113,114]). In the present paper, the formula from [112] is considered:
where d is the rock density (in kg m−3), assuming 2.67 as the mean density value for granitic rocks, and c(FeO), c(Fe2O3) and c(MnO) are oxide weight percent concentrations of bivalent iron, trivalent iron and manganese, respectively. In the following table, two values for each sample, as if all the iron was trivalent and bivalent, were calculated. The theoretical values obtained (Table 2) are almost two orders of magnitude smaller than measured magnetic susceptibilities and, in particular, the mean theoretical susceptibilities are on the same order of magnitude for both lithotypes and equal to 0.193 × 10⁻⁶ [SI] for BAG and 0.156 × 10⁻⁶ [SI] for MBG. This would emphasize the contribution given to magnetic susceptibility by ferromagnetic minerals, i.e., ilmenite and less abundant hematite, which play an important role, even if their modal proportions are overall less than 1%.
KMTPS = d [2.096c(FeO) + 2.258c(Fe2O3) + 2.542c(MnO)]10−8
Table 2.
Maximum theoretical paramagnetic susceptibilities calculated using formula (6) by [112] from chemical analyses of representative Serre granitoids compared with the AMS measured susceptibilities.
Figure 7 shows lower-hemisphere, equal-area projections of K1 (magnetic lineation) and K3 (poles to magnetic foliation) in the BAG and MBG, respectively. Poles of BAG magnetic lineation are plotted on stereoplots (mean value 189°/28° C in trend/plunge format, Figure 7a,b), where they appear dispersed along a best fit great circle roughly NNE–SSW oriented (117°/60° in dip direction/dip format). Poles of MBG magnetic lineation (mean value 51°/68° C in trend/plunge, Figure 7c,d) outline a weak preferential trend as well, as highlighted by contour lines in Figure 7d, with a best fit great circle mainly ENE–WSW oriented (337°/85° in trend/plunge). The mean magnetic foliation of BAG is dipping to the east (105°/51° C in dip direction/dip; Figure 7e,f), while magnetic foliations of MBG (Figure 7g,h) are highly dispersed along a NNW–SSE trend plane, as illustrated by contour lines (Figure 7h; main foliation plane is 148°/86° C in dip direction/dip).
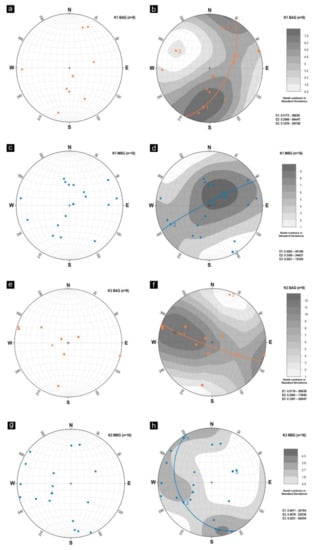
Figure 7.
Lower hemisphere, equal-area projections of the AMS orientations for studied samples. K1 (a–d) poles and contouring of magnetic lineation for BAG (a,b), MBG (c,d) and K3 (e–h) poles and contouring of magnetic foliation for BAG (e,f) and MBG (g,h). Eigenvectors of the Bingham analysis (E1, E2, E3) are also displayed for both modulus and orientation (trend/plunge); n is the number of considered AMS samples (each dot in the stereonet is the mean of 3–7 individual core measurements).
No clear correlations between magnetic lineations and foliations can be observed, as a result of a quite scattered distribution of the data with very few hints of preferential alignments. Stereoplots for magnetic lineation of BAG and magnetic foliation of MBG are sub-parallel to each other, which could imply possible analogous relationships of the two granitoid units with deformation and fabric development but, in the absence of well-defined trends, additional data would be needed to make more accurate evaluations.
AMS data of BAG and MBG have been also used to evaluate strain intensity variations along the upper levels of the Serre Batholith. In this context, despite the degree of magnetic anisotropy (Pj) not corresponding to an absolute value of strain, it has been demonstrated by several authors to increase with the increase in strain (e.g., [44,115,116,117]). MBG magnetic anisotropy reaches its highest values in the Nardodipace transect, where the sample NDP9 with a Pj of 1.112 is located, while in the Badolato transect the highest value was obtained for sample SC30B, with a magnetic anisotropy of 1.037 only. Therefore, while in the first transect an MBG sample holds the highest Pj, in the second transect it is a BAG sample. However, it is to be noticed that, except for the single value of 1.112 of the MBG sample NDP9, the highest values of the magnetic anisotropy for the BAG and MBG in the two transects are quite similar (i.e., 1.042-NDP17, 1.037-SC30B for BAG and 1.042-NDP2BIS, 1.046-SC39B for MBG). Finally, in the Nardodipace transect, the highest values of magnetic anisotropy appear concentrated in the MBG domain, close to the contact of the two granitoid units in study, as pointed out by contour lines mostly stretched towards the MBG–BAG boundary and, in general, a preferential N–S alignment stands out. In the Badolato transect, none of these relationships are apparent.
Two main geographical distributions of magnetic data have been obtained from the values of magnetic foliation and magnetic lineation in the study area (Figure 8). Magnetic foliations of the samples, expressed in dip direction/dip format, are plotted in Figure 8a, where the equal area lower hemisphere stereoplot for magnetic foliation of all the samples shows a rather scattered distribution of data.
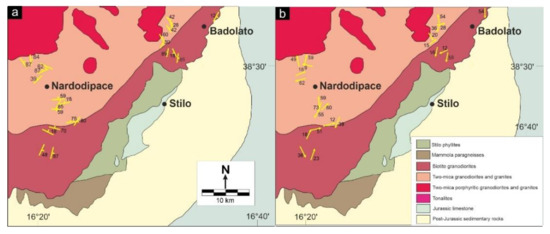
Figure 8.
Maps of the magnetic foliations (a) and lineations (b) in the upper crustal levels of the Serre Batholith.
In more detail, the Nardodipace transect consists of 15 magnetic data, 11 MBG and 4 BAG, with a mean magnetic foliation (dip direction/dip format) of about 335°/85° and 267°/42°, respectively. As shown in Figure 8a, foliations for these rocks are roughly sub-parallel to the E–W direction, with two BAG magnetic data approximately N–S that strongly influence the mean magnetic foliation of the Nardodipace BAG, which otherwise would have been very similar to the MBG mean in this area. Magnetic foliation nearby Badolato village shows quite different orientations compared to the Nardodipace sector. In this area, the magnetic database consists of nine samples, five MBG with a mean magnetic foliation of 257°/33°and four BAG with 286°/73°. Here, the magnetic foliations indicate orientations about NW–SE, with a NE–SW orientation only represented by a single sample on the north of Badolato village. Mean magnetic lineation values, using trend/plunge format for the granitoids of Nardodipace (Figure 8b), are 31°/30° for BAG and 13°/79° for MBG, while 199°/44° and 72°/28° in the area of Badolato, respectively.
5. Discussion
5.1. Insights from Microstructures
Unlike [26,28,96], who reported a magmatic fabric in BAG samples from the Santa Caterina area, our BAG and MBG rocks from the area of Nardodipace and Badolato, in agreement with analogous results from [90,92,98], lack clear meso/microscopic mineral preferred orientations. However, in accordance with the former group of authors, Serre upper crustal granitoids largely exhibit deformation microstructures. Late Variscan Serre granitoids, indeed, underwent deformation from the submagmatic domain, i.e., when the melt was still present but below the critical fraction for magmatic flow [32], down to the low-temperature subsolidus domain. The most representative features occur in the MBG granitoids, representing in this study the deepest emplaced magmatic rocks.
More specifically, deformation microstructures are present in all the samples, ranging from typical submagmatic conditions (>650 °C) to low-temperature subsolidus conditions (<450 °C), where the latter typically tend to obliterate the previous conditions. This implies that a tectonic stress was active during all the cooling phases of the plutons, starting when some melt was still present and lasting down to subsolidus low-temperature conditions. It is relevant to remember here that, based on barometric [28,96] and geochronological [23,24] investigations, the BAG represent the shallowest and youngest granitoids of the Serre Batholith. The MBG are considered to have been emplaced somewhat earlier [23] at a deeper structural level, even though no barometric data are specifically available for these rocks so far. From the data of this study, we can say that the MBG started to register a tectonic stress soon after their emplacement (c. 295 Ma; [23]), and the stress was still active after the emplacement of BAG magmas (c. 292 Ma; [23,24]), which also developed deformation microstructures until subsolidus low-temperature conditions were reached, i.e., in the final cooling stage of the pluton.
Figure 9, inspired by [118], provides a semi-quantitative summary of the different types of microstructures recorded in the studied samples along the Nardodipace and Badolato transects. In this figure, the colors of the sample spots relate to the dominant microstructure, while the associated pie charts indicate the relative abundance of the various types of microstructures found in the same sample. Our microstructural analysis shows that the original magmatic microstructure has always been preserved and, as earlier reported, no magmatic fabric is identified in the studied Serre upper crustal rocks; low-T subsolidus microstructures are the main deformation-related features in the highest levels of the Serre Batholith; deformation can vary strongly between samples of few kilometers apart, up to the case of adjacent samples showing deformation microstructures in different proportions.
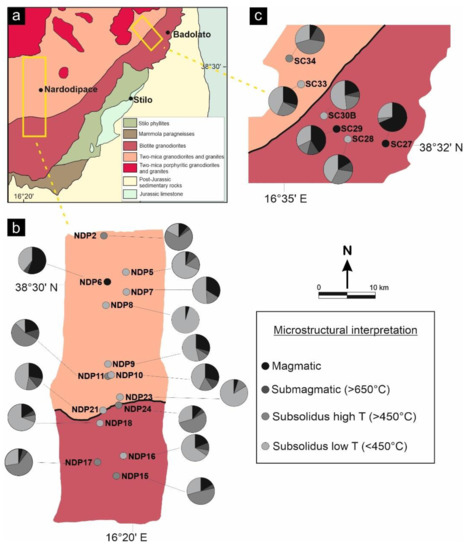
Figure 9.
Microstructural interpretation of the samples in the study area (a) along the geological transects belonging to the Nardodipace (b) and Badolato (c) transects. Relative proportions of the different types of microstructures estimated in each studied sample are illustrated through pie charts.
As pointed out by [26,27,28,96], fabric anisotropy in the Serre granitoids tends to increase as depth of emplacement increases. This is apparent by comparing the shallow granodiorites and granites with no or weak fabric with the deep-seated strongly foliated quartz diorites and tonalites. However, summing up our microstructural data, it is to be highlighted that there is a non-linear relationship between depth of emplacement and fabric developed in the studied granitoids from the upper levels of the batholith, since not only a massive microstructure is typically observed in all these rocks, but also no relevant microstructural differences emerge from the comparison between the shallowest BAG and the underlying MBG. At the same time, these results would imply no significant change in the relationships between tectonics and magma emplacement related to different composition and age of the granitoids, i.e., passing from the slightly older, strongly peraluminous MBG, of granodioritic to granitic composition, to the weakly peraluminous granodioritic BAG, representing the ending stage of batholith construction.
In particular, the deformation began to develop, at least, at submagmatic conditions in all the studied granitoids, as evidenced by the diffuse presence of chessboard patterns in the quartz crystals and rare submagmatic fractures in the BAG samples. High-temperature subsolidus microstructures then formed during initial cooling of the granitoids, with strong evidence of dynamic recrystallization in feldspars and GBM recrystallization in quartz. Finally, low-T subsolidus deformation largely obliterated both the submagmatic and high-T subsolidus deformation microstructures; an example is represented by the frequent quartz undulose extinction superimposing chessboard patterns, or by low-temperature dynamic recrystallization of quartz/feldspar edges on higher temperature recrystallized grains. Specifically, in a few samples of both MBG and BAG, deformation at low-T subsolidus conditions dominates the rock microstructure.
5.2. Integration with Magnetic Data
AMS investigations have highlighted mineral preferred orientations for both studied granitoids that were not revealed from field and thin-section analyses. A previous fabric analysis study on Serre granitoids emplaced at different depths, carried out by [27,96], highlighted the existence of a direct relationship between the X/Z ratio of the fabric ellipsoid and the depth of emplacement of the granitoids. In particular, the above authors estimated the lowest X/Z ratio of the fabric ellipsoid for the upper crustal Santa Caterina granodiorites (BAG, depth c. 6 km) to be equal to 1.31, much lower than the value of 2.13 obtained for the deepest granitoids (Squillace tonalites, depth c. 23 km). The degree of magnetic anisotropy (Pj) is a gauge of the eccentricity of the AMS ellipsoid, and in several previous studies this has been considered as a strain intensity gauge (although not a measure of absolute strain [119,120,121]). In the present investigation, it is noted that Pj for the two granitoid units (BAG and MBG) is low and varies between 1.016–1.042 in the BAG and 1.012–1.112 in the MBG (Table 1). Hence, no significant difference and relationship between emplacement depth and magnetic anisotropy of the upper crustal granitoids emerges from the obtained magnetic data, in accordance with the microstructural data (Figure 9). A possible explanation is that our studied rocks only include the shallowest granitoid units of the batholith, so that the relationships between depth and anisotropy would be less marked anyway. Furthermore, these results would reinforce the proposal that both MBG and BAG were emplaced under a low tectonic stress field, during the waning stages of the shear zone activity (e.g., [23]), in agreement with weakly developed deformation microstructures and field evidences. AMS data for both studied rock types define a mainly oblate ellipsoid on the Jelinek plot (T vs. Pj), suggesting dominant flattening deformation (Figure 6a). In addition, the average magnetic susceptibility Km values were calculated for both lithotypes, obtaining approximately 161 × 10−6 [SI] for BAG and 94 × 10−6 [SI] for MBG. In particular, Km is always less than 500 × 10−6 SI units (see Table 1 and Figure 6c), as typical for paramagnetic granitoids (e.g., [39,122]), thus implying that the rock susceptibility is mostly controlled by paramagnetic minerals, such as biotite. However, as highlighted by the MTPS evaluations for these rocks, bulk magnetic susceptibility measurements also include contributions from ilmenite and hematite, which although occurring in less than 1% vol, are expected to increase magnetic susceptibilities; this can explain the difference in magnetic susceptibility between the two lithotypes, since the iron oxides are slightly more abundant in BAG. In addition, the modal abundance of biotite is higher in BAG, where it reaches around 17%, and lower in MBG (ca. 10%). Being a paramagnetic mineral, with low yet positive magnetic susceptibility (1500–2900 × 10−6 [SI]; [123]), biotite occurrence influences the latter parameter in these rocks, raising its value proportionally to its modal abundance. Biotite, allanite and epidote, despite occurring as accessory phases, also contribute to the rock mean magnetic susceptibility. On the other hand, low biotite content, no allanite and local absence of ilmenite lower the mean magnetic susceptibility of the MBG.
AMS stereograms (Figure 7) bring out dissimilarities in magnetic lineation and foliation patterns obtained for the two investigated rock types. This would suggest that BAG and MBG have been possibly affected by one deformation event, which caused scattering of magnetic fabric orientation or, at least, two unrelated deformation events. A third, more likely, explanation would involve a change in orientation of the local stress field recorded by the youngest granitoids during the tectonic evolution of the batholith.
In this respect, K1 plots of both BAG and MBG (Figure 10a) suggest a dispersion of magnetic lineations along small circles around a rotation axis roughly dipping 25° to N-E. Such a result is also in quite good agreement with the data reported by [92,94,98] for the host rocks in neighboring areas, for which they inferred an NNE sub-horizontal axis for a recumbent, nearly isoclinal syncline fold developed during a Dn+1 event that occurred after the Dn shearing event linked to the tectonic juxtaposition of the Stilo–Pazzano and Mammola Paragneiss Units.
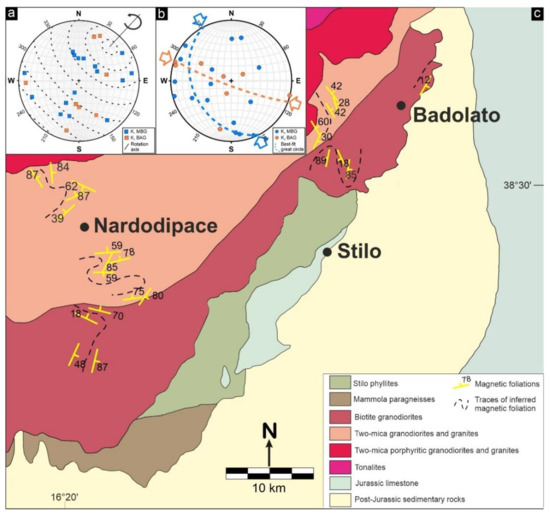
Figure 10.
(a) Lower hemisphere equal-area projection of magnetic lineations (K1), with interpreted dispersion of lineations along small circles (black dashed lines) around a gently N–E dipping rotation axis (42°/25° in trend/plunge format); (b) lower hemisphere equal-area projection of magnetic foliation (K3), with orientation of inferred shortening axes (orange and light blue arrows for BAG and MBG, respectively); (c) interpretative map of magnetic foliation trajectories.
The distribution of K3 poles is consistent with a possible shortening axis oriented roughly NW–SE (Figure 10b), inferred by the best fit circles in Figure 7f,h, assuming that magnetic foliations may have recorded a dispersion around a hypothetical folding axis [124]; this might suggest a main regional compressive tectonic phase, probably active from emplacement to cooling of the granitoid units. Such a stress field might have been associated with the activation of narrow shear zones, which have been locally recognized in the field (Figure 2e).
The distribution of the poles of magnetic foliations (K3) (Figure 10b) might suggest a slight counter-clockwise rotation of the above compressional axis within the time span of c. 3 Ma, from N155 inferred for the MBG to N110 obtained for the BAG, by following the model proposed by [124] for the possible trajectories of poles after a tectonic folding event.
Complementary considerations on these two granitoid units come from magnetic foliations and lineation maps (Figure 10c). Apparently, consistency in magnetic fabric of the granitoids straddling the MBG–BAG transition would suggest emplacement of both granitoids as a single magmatic body. However, this aspect is at odds with the different orientations recorded in both the deepest MBG samples and the shallowest BAG samples. In addition, an origin as different granitoid units is supported by previous geochemical and geochronological studies considering the Serre Batholith as formed by different magmatic units produced by the melting of diverse crustal sources and built by incremental multi-pulse overaccretion, assigning also to the MBG and BAG two different emplacement times [23,78].
Although AMS data are limited at the moment, there is enough initial evidence to construct foliation trajectories (Figure 10c). As shown in Figure 10c, the strike of magnetic foliation varies from E–W to N–S in the Nardodipace area; this might imply folding related to a regional NW–SE directed compression (shortening), consistent with results in Figure 7 and Figure 10a,b.
On the other hand, magnetic foliations in the Badolato transect show a roughly N–S trend. As a first possible interpretation, Badolato foliations may have been re-oriented by the activation of a post-emplacement tectonic structure, which might be responsible for the very pronounced indented contact of BAG with phyllites to the north of Stilo, as well as for exposing the intermediate-level porphyritic granitoids in the same outcropping domain of the upper crustal granitoids (Figure 8). A second possible interpretation is that N–S Badolato foliations may reflect stretching of the upper crustal granitoids along the lateral termination of the batholith roof, proposed to have been emplaced as a laccolith by [24]. Further research and data collection are in progress to work out details of the tectonics of the region.
Going back to previous consideration about emplacement–tectonics relationships, it should be reminded that the Serre Batholith represents a tilted sheeted intrusive complex built through a multistage overaccretion mechanism, from deep crustal quartz diorites and tonalites to intermediate MBPG and upper crustal MBG and BAG [23]. In addition, according to the latter authors, the shear zone responsible for detaching the Mammola paragneisses from the lower crustal magmatic metapelites and uplifting them up to the upper crust also played a significant role in assisting magma emplacement along the whole growth history of the Serre Batholith. In Langone et al. [24,92], a hybrid building mechanism was instead proposed for the batholith, where the lower crustal granitoids emplaced within a space created by extensional tectonics and downward flexure of the batholith floor, while upper crustal granodiorites formed a laccolith-like intrusion, by doming the batholith roof. The above model assumes that the emplacement of the batholith occurred in two main pulses separated by c. 10 Ma, deeper tonalites at c. 306 Ma and shallower granodiorites at c. 295 Ma. The study by [24] dated one sample of tonalite and one of BAG, while a subsequent study by [23] also investigated the emplacement relationships between the different types of granodiorites and granites, suggesting that the batholith was constructed by incremental multi-pulse overaccretion, with the two-mica granitoids forming a separate and earlier pulse than that producing the BAG. Our study focuses on the relationships at the contact between these two granitoid units. In this respect, magnetic foliations and lineations define alignments roughly parallel to the BAG–MBG contact. This is well displayed in the Nardodipace area, where magnetic foliations are steeply dipping and lineations agree with the direction of foliations, which might suggest a dominant strike–slip movement, while along the Badolato transect this relationship is not observed.
All the studied samples exhibit widespread submagmatic to low-T subsolidus deformation microstructures that, in a few samples, also include some evidence for shearing (e.g., poorly developed mica fish and feldspar porphyroclasts; Figure 4c,e and Figure 5d,f). Finally, field evidence for shear-related deformation affecting the granitoids close to the contact between the two units has been found in some BAG outcrops in the Nardodipace transect (e.g., Figure 2e), while in the Badolato area no clear related features have been observed, with a tectonic fabric sporadically recognized in the field.
Summing up, our field, microstructural and magnetic data would support an emplacement of the upper crustal granitoids controlled by shear zone dynamics involving the emplacement of the BAG magmas between the metamorphic host rocks and the underlying MBG, as proposed by [23]. In particular, in our tentative model, after the MBG had already acquired a dominant rigid state and developed a weak submagmatic to subsolidus fabric, the same shear zone influenced the emplacement of the BAG magmas, which were then weakly deformed in turn. Our multi-technique study, despite being based on preliminary data at the present stage, has produced very promising results, prompting us to start a new campaign of survey and sampling aimed at obtaining an amount of meso/microstructural and AMS data able to provide sounder and more straightforward constrains. On the other hand, we would like to remark that the present manuscript illustrates: (a) the supra- to low-T subsolidus deformation microstructures developed in the Serre upper crustal granitoids, including the MBG, which have never been studied in this respect, and (b) the first AMS data for the Serre upper crustal granitoids aimed to reveal an internal fabric for apparently undeformed rocks, highlighting the potential of the AMS technique of revealing “hidden” relationships between tectonics and magma emplacement.
6. Conclusions
The present study provides information on the relationships between tectonics and post-collisional granitoid magmatism through field, microstructural and AMS investigations on granodiorites and granites from the upper levels of the Serre Batholith, namely two-mica granodiorites and granites (MBG; c. 295 Ma) and overlying Bt ± Amp granodiorites (BAG; c. 292 Ma). Microstructural investigations highlighted a wide range of deformation microstructures, indicating tectonic stresses operating, at decreasing temperatures, during the cooling of the magmatic bodies from submagmatic conditions, at T > 650 °C (quartz chessboard extinction, rare submagmatic fractures) to T ≈ 550 °C (GBM in quartz and feldspar) to T ≈ 450 °C (mica kink or deformation twins). No specific relationships between type or intensity of recorded deformation and emplacement depth, age or composition have been found. It is worth remarking that the deformation experienced by the studied rocks resulted only locally in the development of an oriented fabric at the micro/mesoscale.
On the other hand, AMS studies have highlighted how these apparently isotropic granitoids actually have an internal magnetic fabric. Indeed, anisotropy of the Serre upper crustal granitoids is testified by the resulting magnetic ellipsoids, which are slightly oblate or, in a few cases, prolate for both rock types. Comparison between the stereograms of BAG and MBG may reflect a possible change in the orientation of the local stress field during the emplacement of the youngest granitoid units. Magnetic foliation and lineation maps reveal preferential alignments roughly E–W and N–S along the Nardodipace and Badolato transects, respectively, for both BAG and MBG, highlighting common tectonic relationships. In particular, local occurrence of field and microstructural evidence for shear-related deformation would suggest that the emplacement of Serre Batholith upper crustal granitoids was influenced by a shear zone, whose geometry and tectonic regime are still to be constrained in detail. The results of this study shed new light on the upper levels of the Serre Batholith, but it is important to proceed with further sampling and investigations in order to increase the meso/microstructural and magnetic database for these rocks and thus allow a better understanding of the relationships between the emplacement of granitoid bodies and the activity of tectonic structures on a regional scale.
Author Contributions
Conceptualization, P.F., D.R., E.F., R.C. and M.A.M.; investigation, P.F., D.R., E.F., R.C. and M.A.M.; writing—original draft preparation, D.R. and P.F.; writing—review and editing, P.F., D.R., E.F., R.C. and M.A.M. All authors have read and agreed to the published version of the manuscript.
Funding
This research was partly funded by the University of Catania (PIAno di inCEntivi per la RIcerca di Ateneo 2020/2022—Pia.Ce.Ri), Grant Number: 22722132153, within the project “GeoPetroMat”.
Acknowledgments
AMS analyses were performed at the IIT (Indian Institute of Technology) of Kharagpur (India). Thin sections were prepared at the Laboratory ‘Sezioni sottili’ at the Department of Biological, Geological and Environmental Sciences of Catania University (Italy). We thank three anonymous reviewers for their in-depth reviews and valuable comments and suggestions that helped us significantly improve the manuscript.
Conflicts of Interest
The authors declare no conflict of interest.
References
- Paterson, S.R.; Miller, R.B. Magma Emplacement during arc-perpendicular shortening: An Example from the Cascades Crystalline Core, Washington. Tectonics 1998, 17, 571–586. [Google Scholar] [CrossRef]
- Snoke, A.W.; Kalakay, T.J.; Quick, J.E.; Sinigoi, S. Development of a deep-crustal shear zone in response to syntectonic intrusion of mafic magma into the lower crust, Ivrea–Verbano Zone, Italy. Earth Planet. Sci. Lett. 1999, 166, 31–45. [Google Scholar] [CrossRef]
- Neves, S.P.; Vauchez, A.; Feraud, G. Tectono-thermal evolution, magma emplacement, and shear zone development in the Caruaru area (Borborema Province, NE Brazil). Precambrian Res. 2000, 99, 1–32. [Google Scholar] [CrossRef]
- Rosenberg, C.L. Shear zones and magma ascent: A model based on a review of the tertiary magmatism in the Alps. Tectonics 2004, 23, 1–21. [Google Scholar] [CrossRef]
- Weinberg, R.F.; Mark, G. Magma migration, folding, and disaggregation of migmatites in the Karakoram shear zone, Ladakh, NW India. Geol. Soc. Am. Bull. 2008, 120, 994–1009. [Google Scholar] [CrossRef] [Green Version]
- Demartis, M.; Pinotti, L.P.; Coniglio, J.E.; D’Eramo, F.J.; Tubía, J.M.; Aragón, E.; Insúa, L.A.A. Ascent and emplacement of pegmatitic melts in a major reverse shear zone (Sierras de Córdoba, Argentina). J. Struct. Geol. 2011, 33, 1334–1346. [Google Scholar] [CrossRef]
- Trubač, J.; Žák, J.; Chlupáčová, M.; Janoušek, V. Magnetic fabric and modeled strain distribution in the head of a nested granite diapir, the Melechov Pluton, Bohemian Massif. J. Struct. Geol. 2014, 66, 271–283. [Google Scholar] [CrossRef]
- Casini, L.; Cuccuru, S.; Puccini, A.; Oggiano, G.; Rossi, P. Evolution of the Corsica–Sardinia Batholith and late-orogenic shearing of the Variscides. Tectonophysics 2015, 646, 65–78. [Google Scholar] [CrossRef]
- Tomek, F.; Žák, J.; Verner, K.; Holub, F.V.; Sláma, J.; Paterson, S.R.; Memeti, V. Mineral fabrics in high-level intrusions recording crustal strain and volcano–tectonic interactions: The Shellenbarger Pluton, Sierra Nevada, California. J. Geol. Soc. 2017, 174, 193–208. [Google Scholar] [CrossRef]
- Avila, C.F.; Archanjo, C.J.; Hollanda, M.H.B.; de Macedo Filho, A.A.; Lemos-Santos, D.d.V. Shear zone cooling and fabrics of synkinematic plutons evidence timing and rates of orogenic exhumation in the Northwest Borborema Province (NE Brazil). Precambrian Res. 2020, 350, 105940. [Google Scholar] [CrossRef]
- Fazio, E.; Fiannacca, P.; Russo, D.; Cirrincione, R. Submagmatic to solid-state deformation microstructures recorded in cooling granitoids during exhumation of late-variscan crust in North-Eastern Sicily. Geosciences 2020, 10, 311. [Google Scholar] [CrossRef]
- Vigneresse, J.-L. Control of granite emplacement by regional deformation. Tectonophysics 1995, 249, 173–186. [Google Scholar] [CrossRef]
- Weinberg, R.F.; Sial, A.N.; Mariano, G. Close spatial relationship between plutons and shear zones. Geology 2004, 32, 377–380. [Google Scholar] [CrossRef]
- Zibra, I.; Kruhl, J.H.; Montanini, A.; Tribuzio, R. Shearing of magma along a high-grade shear zone: Evolution of microstructures during the transition from magmatic to solid-state flow. J. Struct. Geol. 2012, 37, 150–160. [Google Scholar] [CrossRef]
- Punturo, R.; Cirrincione, R.; Fazio, E.; Fiannacca, P.; Kern, H.; Mengel, K.; Ortolano, G.; Pezzino, A. Microstructural, compositional and petrophysical properties of mylonitic granodiorites from an extensional shear zone (Rhodope Core Complex, Greece). Geol. Mag. 2014, 151, 1051–1071. [Google Scholar] [CrossRef]
- Oberc-Dziedzic, T.; Kryza, R.; Pin, C. Variscan granitoids related to shear zones and faults: Examples from the Central Sudetes (Bohemian Massif) and the Middle Odra Fault Zone. Int. J. Earth Sci. 2015, 104, 1139–1166. [Google Scholar] [CrossRef] [Green Version]
- Olivier, P.; Druguet, E.; Castaño, L.M.; Gleizes, G. Granitoid emplacement by multiple sheeting during variscan dextral transpression: The Saint-Laurent—La Jonquera pluton (Eastern Pyrenees). J. Struct. Geol. 2016, 82, 80–92. [Google Scholar] [CrossRef]
- Lyra, D.S.; Savian, J.F.; de Fátima Bitencourt, M.; Trindade, R.I.; Tomé, C.R. AMS fabrics and emplacement model of Butiá Granite, an Ediacaran syntectonic peraluminous granite from Southernmost Brazil. J. S. Am. Earth Sci. 2018, 87, 25–41. [Google Scholar] [CrossRef]
- Lehmann, J.; Bybee, G.M.; Hayes, B.; Owen-Smith, T.M.; Belyanin, G. Emplacement of the Giant Kunene AMCG complex into a contractional ductile shear zone and implications for the mesoproterozoic tectonic evolution of SW Angola. Int. J. Earth Sci. 2020, 109, 1463–1485. [Google Scholar] [CrossRef]
- De Toni, G.B.; de Bitencourt, M.F.; Konopásek, J.; Martini, A.; Andrade, P.H.S.; Florisbal, L.M.; Campos, R.S.D. Transpressive strain partitioning between the Major Gercino shear zone and the Tijucas Fold Belt, Dom Feliciano Belt, Santa Catarina, Southern Brazil. J. Struct. Geol. 2020, 136, 104058. [Google Scholar] [CrossRef]
- Graessner, T.; Schenk, V.; Bröcker, M.; Mezger, K. Geochronological constraints on the timing of granitoid magmatism, metamorphism and post-metamorphic cooling in the hercynian crustal cross-Section of Calabria. J. Metamorph. Geol. 2000, 18, 409–421. [Google Scholar] [CrossRef] [Green Version]
- Fiannacca, P.; Williams, I.S.; Cirrincione, R.; Pezzino, A. Crustal contributions to late hercynian peraluminous magmatism in the Southern Calabria-Peloritani Orogen, Southern Italy: Petrogenetic inferences and the Gondwana connection. J. Petrol. 2008, 49, 1497–1514. [Google Scholar] [CrossRef] [Green Version]
- Fiannacca, P.; Williams, I.S.; Cirrincione, R. Timescales and mechanisms of batholith construction: Constraints from zircon oxygen isotopes and geochronology of the late Variscan Serre Batholith (Calabria, Southern Italy). Lithos 2017, 277, 302–314. [Google Scholar] [CrossRef]
- Langone, A.; Caggianelli, A.; Festa, V.; Prosser, G. Time constraints on the building of the Serre Batholith: Consequences for the thermal evolution of the hercynian continental crust exposed in Calabria (Southern Italy). J. Geol. 2014, 122, 183–199. [Google Scholar] [CrossRef]
- Rottura, A.; Bargossi, G.M.; Caironi, V.; Del Moro, A.; Maccarrone, E.; Macera, P.; Paglionico, A.; Petrini, R.; Piccarreta, G.; Poli, G. Petrogenesis of contrasting hercynian granitoids from the Calabrian Arc, Southern Italy. Lithos 1990, 24, 97–119. [Google Scholar] [CrossRef]
- Acquafredda, P.; Caggianelli, A.; Di Battista, P. Contrasting features of foliated and massive hercynian granitoids from Calabria (Italy). Mineral. Petrogr. Acta 1995, 38, 9–24. [Google Scholar]
- Caggianelli, A.; Prosser, G.; Di Battista, P. Textural features and fabric analysis of granitoids emplaced at different depths: The example of the Hercynian Tonalites and Granodiorites from Calabria. Mineral. Petrogr. Acta 1997, 40, 11–26. [Google Scholar]
- Caggianelli, A.; Prosser, G.; Rottura, A. Thermal history vs. fabric anisotropy in granitoids emplaced at different crustal levels: An example from Calabria, Southern Italy. Terra Nova 2000, 12, 109–116. [Google Scholar] [CrossRef]
- Caggianelli, A.; Liotta, D.; Prosser, G.; Ranalli, G. Pressure–temperature evolution of the late Hercynian Calabria continental crust: Compatibility with post-collisional extensional tectonics. Terra Nova 2007, 19, 502–514. [Google Scholar] [CrossRef]
- Angì, G.; Cirrincione, R.; Fazio, E.; Fiannacca, P.; Ortolano, G.; Pezzino, A. Metamorphic evolution of preserved Hercynian crustal section in the Serre Massif (Calabria-Peloritani Orogen, Southern Italy). Lithos 2010, 115, 237–262. [Google Scholar] [CrossRef]
- Paterson, S.R.; Vernon, R.H.; Tobisch, O.T. A review of criteria for the identification of magmatic and tectonic foliations in granitoids. J. Struct. Geol. 1989, 11, 349–363. [Google Scholar] [CrossRef]
- Bouchez, J.L.; Delas, C.; Gleizes, G.; Nedelec, A.; Cuney, M. Submagmatic microfractures in granites. Geology 1992, 20, 35–38. [Google Scholar] [CrossRef]
- Passchier, C.W.; Trouw, R.A.J. Microtectonics; Springer: Berlin/Heidelberg, Germany, 2005; ISBN 3540640037. [Google Scholar]
- Vernon, R.H. Review of microstructural evidence of magmatic and solid-state flow. Electron. Geosci. 2000, 5, 1–23. [Google Scholar] [CrossRef]
- Vernon, R.H. A Practical Guide to Rock Microstructure, 2nd ed.; Cambridge University Press: Cambridge, UK, 2018; ISBN 9781108427241. [Google Scholar]
- Birch, F.S. Magnetic fabric of the Exeter pluton, New Hampshire. J. Geophys. Res. Solid Earth 1979, 84, 1129–1137. [Google Scholar] [CrossRef]
- Jelinek, V. Characterization of the magnetic fabric of rocks. Tectonophysics 1981, 79, T63–T67. [Google Scholar] [CrossRef]
- Tarling, D.H.; Hrouda, F. The Magnetic Anisotropy of Rocks; Chapman & Hall: London, UK, 1993; p. 217. [Google Scholar]
- Bouchez, J.L. Granite is never isotropic: An introduction to AMS studies of granitic rocks. In Granite: From Segregation of Melt to Emplacement Fabrics; Springer: Dodrecht, The Netherlands, 1997; pp. 95–112. [Google Scholar]
- Borradaile, G.J. Magnetic fabrics and petrofabrics: Their orientation distributions and anisotropies. J. Struct. Geol. 2001, 23, 1581–1596. [Google Scholar] [CrossRef]
- Faccenna, C.; Speranza, F.; Caracciolo, F.D.; Mattei, M.; Oggiano, G. Extensional tectonics on Sardinia (Italy): Insights into thearc-back-arc transitional regime. Tectonophysics 2002, 356, 213–232. [Google Scholar] [CrossRef]
- Mamtani, M.A.; Greiling, R.O. Granite emplacement and its relation with regional deformation in the Aravalli Mountain Belt (India)—Inferences from magnetic fabric. J. Struct. Geol. 2005, 27, 2008–2029. [Google Scholar] [CrossRef]
- Nké, B.B.; Njanko, T.; Mamtani, M.A.; Njonfang, E.; Rochette, P. Kinematic evolution of the Mbakop Pan–African granitoids (Western Cameroon Domain): An integrated AMS and EBSD approach. J. Struct. Geol. 2018, 111, 42–63. [Google Scholar]
- Mamtani, M.A.; Bhatt, S.; Rana, V.; Sen, K.; Mondal, T.K. Application of anisotropy of magnetic susceptibility (AMS) in understanding regional deformation, fabric development and granite emplacement: Examples from Indian Cratons. Geol. Soc. Lond. Spec. Publ. 2020, 489, 275–292. [Google Scholar] [CrossRef]
- Tomé, C.R.; Bitencourt, M.d.F.; Raposo, M.I.B.; Savian, J.F. Magnetic fabric data on interactive syntectonic magmas of contrasting composition in composite dikes from South Brazil. J. Geodyn. 2020, 138, 101754. [Google Scholar] [CrossRef]
- Rochette, P.; Scaillet, B.; Guillot, S.; Le Fort, P.; Pêcher, A. Magnetic properties of the High Himalayan leucogranites: Structural implications. Earth Planet. Sci. Lett. 1994, 126, 217–234. [Google Scholar] [CrossRef]
- Greiling, R.O.; Verma, P.K. Strike-slip tectonics and granitoid emplacement: An AMS fabric study from the Odenwald Crystalline Complex, SW Germany. Mineral. Petrol. 2001, 72, 165–184. [Google Scholar] [CrossRef]
- Stevenson, C.T.E.; Owens, W.H.; Hutton, D.H.W.; Hood, D.N.; Meighan, I.G. Laccolithic, as opposed to cauldron subsidence, emplacement of the Eastern Mourne pluton, N. Ireland: Evidence from anisotropy of magnetic susceptibility. J. Geol. Soc. 2007, 164, 99–110. [Google Scholar] [CrossRef]
- Raposo, M.I.B.; Gastal, M.C.P. Emplacement mechanism of the main granite pluton of the Lavras Do Sul intrusive complex, South Brazil, determined by magnetic anisotropies. Tectonophysics 2009, 466, 18–31. [Google Scholar] [CrossRef]
- Stevenson, C.T.E.; Bennett, N. The emplacement of the Palaeogene Mourne Granite Centres, Northern Ireland: New results from the Western Mourne Centre. J. Geol. Soc. 2011, 168, 831–836. [Google Scholar] [CrossRef]
- McCarthy, W.; Petronis, M.S.; Reavy, R.J.; Stevenson, C.T. Distinguishing diapirs from inflated plutons: An integrated rock magnetic fabric and structural study on the Roundstone pluton, Western Ireland. J. Geol. Soc. 2015, 172, 550–565. [Google Scholar] [CrossRef]
- Mamtani, M.A. Magnetic fabric as a vorticity gauge in syntectonically deformed granitic rocks. Tectonophysics 2014, 629, 189–196. [Google Scholar] [CrossRef]
- Chatué, C.N.; Njanko, T.; Fozing, E.M.; Nké, B.B.; Séta, N.; Njonfang, E. Field observations, magnetic fabrics and microstructures evidences of Syn-Kinematic emplacement of the Numba Granitic pluton (Western Cameroon Domain). J. Afr. Earth Sci. 2020, 172, 104009. [Google Scholar] [CrossRef]
- Appel, P.; Cirrincione, R.; Fiannacca, P.; Pezzino, A. Age constraints on Late Paleozoic evolution of continental crust from electron microprobe dating of monazite in the Peloritani Mountains (Southern Italy): Another example of resetting of monazite ages in high-grade rocks. Int. J. Earth Sci. 2010, 100, 107–123. [Google Scholar] [CrossRef]
- Cirrincione, R.; Fiannacca, P.; Giudice, A.L.; Pezzino, A. Evidence of early palaeozoic continental rifting from Mafic Metavolcanics of Southern Peloritani Mountains (North-Eastern Sicily, Italy). Ofioliti 2005, 30, 15–25. [Google Scholar]
- Fiannacca, P.; Williams, I.S.; Cirrincione, R.; Pezzino, A. The augen gneisses of the Peloritani Mountains (NE Sicily): Granitoid magma production during rapid evolution of the Northern Gondwana margin at the end of the Precambrian. Gondwana Res. 2013, 23, 782–796. [Google Scholar] [CrossRef]
- Micheletti, F.; Fornelli, A.; Piccarreta, G.; Barbey, P.; Tiepolo, M. The basement of Calabria (Southern Italy) within the context of the Southern European Variscides: LA-ICPMS and SIMS U–Pb zircon study. Lithos 2008, 104, 1–11. [Google Scholar] [CrossRef]
- Schenk, V. U-Pb and Rb-Sr radiometric dates and their correlation with metamorphic events in the granulite-facies basement of the Serre, Southern Calabria (Italy). Contrib. Mineral. Petrol. 1980, 73, 23–38. [Google Scholar] [CrossRef]
- Schenk, V. The exposed crustal cross section of southern Calabria, Italy: Structure and evolution of a segment of Hercynian crust. In Exposed Cross-Sections of the Continental Crust; Springer: Berlin/Heidelberg, Germany, 1990; pp. 21–42. [Google Scholar]
- Williams, I.S.; Fiannacca, P.; Cirrincione, R.; Pezzino, A. Peri-Gondwanan origin and early geodynamic history of NE Sicily: A zircon tale from the basement of the Peloritani Mountains. Gondwana Res. 2012, 22, 855–865. [Google Scholar] [CrossRef]
- Cirrincione, R.; Fazio, E.; Ortolano, G.; Pezzino, A.; Punturo, R. Fault-related rocks: Deciphering the structural-metamorphic evolution of an accretionary wedge in a collisional belt, NE Sicily. Int. Geol. Rev. 2012, 54, 940–956. [Google Scholar] [CrossRef]
- Cirrincione, R.; Fazio, E.; Fiannacca, P.; Ortolano, G.; Pezzino, A.; Punturo, R. The Calabria-Peloritani Orogen, a composite terrane in Central Mediterranean; its overall architecture and geodynamic significance for a pre-Alpine scenario around the Tethyan Basin. Period. Mineral. 2015, 84, 701–749. [Google Scholar] [CrossRef]
- Fazio, E.; Cirrincione, R.; Pezzino, A. Estimating P-T conditions of Alpine-type metamorphism using multistage garnet in the tectonic windows of the Cardeto Area (Southern Aspromonte Massif, Calabria). Mineral. Petrol. 2008, 93, 111–142. [Google Scholar] [CrossRef]
- Fazio, E.; Punturo, R.; Cirrincione, R. Quartz c-axis texture mapping of mylonitic metapelite with rod structures (Calabria, Southern Italy): Clues for hidden shear flow direction. J. Geol. Soc. India 2010, 75, 171–182. [Google Scholar] [CrossRef]
- Fazio, E.; Cirrincione, R.; Pezzino, A. Tectono-metamorphic map of the South-Western Flank of the Aspromonte Massif (Southern Calabria -Italy). J. Maps 2015, 11, 85–100. [Google Scholar] [CrossRef]
- Fazio, E.; Punturo, R.; Cirrincione, R.; Kern, H.; Pezzino, A.; Wenk, H.-R.; Goswami, S.; Mamtani, M.A. Quartz preferred orientation in naturally deformed mylonitic rocks (Montalto Shear Zone–Italy): A comparison of results by different techniques, their advantages and limitations. Int. J. Earth Sci. 2017, 106, 2259–2278. [Google Scholar] [CrossRef]
- Fazio, E.; Ortolano, G.; Visalli, R.; Alsop, I.; Cirrincione, R.; Pezzino, A. Strain localization and sheath fold development during progressive deformation in a ductile shear zone: A case study of macro-to micro-scale structures from the Aspromonte Massif, Calabria. Ital. J. Geosci. 2018, 137, 208–218. [Google Scholar] [CrossRef]
- Ortolano, G.; Visalli, R.; Fazio, E.; Fiannacca, P.; Godard, G.; Pezzino, A.; Punturo, R.; Sacco, V.; Cirrincione, R. Tectono-metamorphic evolution of the Calabria continental lower crust: The case of the Sila Piccola Massif. Int. J. Earth Sci. 2020, 109, 1295–1319. [Google Scholar] [CrossRef]
- Ortolano, G.; Fazio, E.; Visalli, R.; Alsop, G.I.; Pagano, M.; Cirrincione, R. Quantitative microstructural analysis of mylonites formed during Alpine tectonics in the Western Mediterranean realm. J. Struct. Geol. 2020, 131, 103956. [Google Scholar] [CrossRef]
- Von Raumer, J.F.; Stampfli, G.M. The birth of the Rheic Ocean—Early Palaeozoic subsidence patterns and subsequent tectonic plate scenarios. Tectonophysics 2008, 461, 9–20. [Google Scholar] [CrossRef] [Green Version]
- Von Raumer, J.F.; Bussy, F.; Schaltegger, U.; Schulz, B.; Stampfli, G.M. Pre-mesozoic Alpine basements—Their place in the European Paleozoic framework. GSA Bull. 2013, 125, 89–108. [Google Scholar] [CrossRef]
- Domeier, M.; Torsvik, T.H. Plate tectonics in the Late Paleozoic. Geosci. Front. 2014, 5, 303–350. [Google Scholar] [CrossRef] [Green Version]
- Carosi, R.; Montomoli, C.; Tiepolo, M.; Frassi, C. Geochronological constraints on post-collisional shear zones in the Variscides of Sardinia (Italy). Terra Nova 2012, 24, 42–51. [Google Scholar] [CrossRef]
- Corsini, M.; Rolland, Y. Late evolution of the Southern European Variscan belt: Exhumation of the lower crust in a context of oblique convergence. Comptes Rendus Geosci. 2009, 341, 214–223. [Google Scholar] [CrossRef]
- Padovano, M.; Dörr, W.; Elter, F.M.; Gerdes, A. The East Variscan shear zone: Geochronological constraints from the Capo Ferro area (NE Sardinia, Italy). Lithos 2014, 196–197, 27–41. [Google Scholar] [CrossRef]
- Padovano, M.; Elter, F.M.; Pandeli, E.; Franceschelli, M. The East Variscan shear zone: New insights into its role in the Late Carboniferous Collision in Southern Europe. Int. Geol. Rev. 2012, 54, 957–970. [Google Scholar] [CrossRef]
- Ayuso, R.A.; Messina, A.; De Vivo, B.; Russo, S.; Woodruff, L.G.; Sutter, J.F.; Belkin, H.E. Geochemistry and argon thermochronology of the Variscan Sila Batholith, Southern Italy: Source rocks and magma evolution. Contrib. Mineral. Petrol. 1994, 117, 87–109. [Google Scholar] [CrossRef]
- Fiannacca, P.; Cirrincione, R.; Bonanno, F.; Carciotto, M.M. Source-inherited compositional diversity in granite batholiths: The geochemical message of Late Paleozoic intrusive magmatism in Central Calabria (Southern Italy). Lithos 2015, 236–237, 123–140. [Google Scholar] [CrossRef]
- Fiannacca, P.; Basei, M.A.S.; Cirrincione, R.; Pezzino, A.; Russo, D. Water-assisted production of late-orogenic trondhjemites at magmatic and subsolidus conditions. Geol. Soc. Lond. Spec. Publ. 2020, 491, 147–178. [Google Scholar] [CrossRef]
- Fiannacca, P.; Williams, I.S.; Cirrincione, R.; Pezzino, A. Poly-orogenic melting of metasedimentary crust from a granite geochemistry and inherited zircon perspective (Southern Calabria-Peloritani Orogen, Italy). Front. Earth Sci. 2019, 7, 119. [Google Scholar] [CrossRef]
- Festa, V.; Langone, A.; Caggianelli, A.; Rottura, A. Dike magmatism in the Sila Grande (Calabria, Southern Italy): Evidence of Pennsylvanian-Early Permian exhumation. Geosphere 2010, 6, 549–566. [Google Scholar] [CrossRef] [Green Version]
- Romano, V.; Cirrincione, R.; Fiannacca, P.; Lustrino, M.; Tranchina, A. Late-hercynian post-collisional dyke magmatism in Central Calabria (Serre Massif, Southern Italy). Period. di Mineral. 2011, 80, 489–515. [Google Scholar] [CrossRef]
- Barca, D.; Cirrincione, R.; De Vuono, E.; Fiannacca, P.; Ietto, F.; Lo Guidice, A. The Triassic rift system in the Northern Calabrian-Peloritani Orogen: Evidence from basaltic dyke magmatism in the San Donato Unit. Period. Mineral. 2010, 79, 61–72. [Google Scholar] [CrossRef]
- Cirrincione, R.; Fiannacca, P.; Lustrino, M.; Romano, V.; Tranchina, A. Late triassic tholeiitic magmatism in Western Sicily: A possible extension of the Central Atlantic Magmatic Province (CAMP) in the Central Mediterranean area? Lithos 2014, 188, 60–71. [Google Scholar] [CrossRef]
- Cirrincione, R.; Fiannacca, P.; Lustrino, M.; Romano, V.; Tranchina, A.; Villa, I.M. Enriched asthenosphere melting beneath the nascent North African margin: Trace element and Nd isotope evidence in middle–late Triassic alkali basalts from Central Sicily (Italy). Int. J. Earth Sci. 2016, 105, 595–609. [Google Scholar] [CrossRef] [Green Version]
- Fornelli, A.; Langone, A.; Micheletti, F.; Piccarreta, G. Time and duration of Variscan high-temperature metamorphic processes in the South European Variscides: Constraints from U-Pb chronology and trace element chemistry of zircon. Mineral. Petrol. 2011, 103, 101–122. [Google Scholar] [CrossRef]
- Acquafredda, P.; Fornelli, A.; Piccarreta, G.; Pascazio, A. Multi-stage dehydration–decompression in the metagabbros from the lower crustal rocks of the Serre (Southern Calabria, Italy). Geol. Mag. 2008, 145, 397–411. [Google Scholar] [CrossRef]
- Acquafredda, P.; Fornelli, A.; Paglionico, A.; Piccarreta, G. Petrological evidence for crustal thickening and extension in the Serre Granulite Terrane (Calabria, Southern Italy). Geol. Mag. 2006, 143, 145–163. [Google Scholar] [CrossRef]
- Rottura, A.; Del Moro, A.; Pinarelli, L.; Petrini, R.; Peccerillo, A.; Caggianelli, A.; Bargossi, G.M.; Piccarreta, G. Relationships between intermediate and acidic rocks in orogenic granitoid suites: Petrological, geochemical and isotopic (Sr, Nd, Pb) data from Capo Vaticano (Southern Calabria, Italy). Chem. Geol. 1991, 92, 153–176. [Google Scholar] [CrossRef]
- Fornelli, A.; Caggianelli, A.; Del Moro, A.; Bargossi, G.M.; Paglionico, A.; Piccarreta, G.; Rottura, A. Petrology and evolution of the Central Serre Granitoids (Southern Calabria–Italy). Period. Mineral. 1994, 63, 53–70. [Google Scholar]
- Punturo, R.; Mamtani, M.A.; Fazio, E.; Occhipinti, R.; Renjith, A.R.; Cirrincione, R. Seismic and magnetic susceptibility anisotropy of middle-lower continental crust: Insights for their potential relationship from a study of intrusive rocks from the Serre Massif (Calabria, Southern Italy). Tectonophysics 2017, 712–713, 542–556. [Google Scholar] [CrossRef]
- Festa, V.; Caggianelli, A.; Langone, A.; Prosser, G. Time-space relationships among structural and metamorphic aureoles related to granite emplacement: A case study from the Serre Massif (Southern Italy). Geol. Mag. 2013, 150, 441–454. [Google Scholar] [CrossRef]
- Del Moro, A.; Fornelli, A.; Paglionico, A. K-Feldspar Megacrystic Suite in the Serre (Southern Calabria–Italy). Period. Mineral. 1994, 63, 19–33. [Google Scholar]
- Tursi, F.; Spiess, R.; Festa, V.; Fregola, R.A. Hercynian subduction-related processes within the metamorphic continental crust in Calabria (Southern Italy). J. Metamorph. Geol. 2020, 38, 771–793. [Google Scholar] [CrossRef]
- Fiannacca, P.; Lombardo, R.; Militello, G.M.; Cirrincione, R. Plagioclase microstructures and compositions as tracers of mixing processes in weakly to strongly peraluminous granodiorites and granites from the Serre Batholith (Southern Italy). Rend. Online Soc. Geol. Ital. 2016, 38, 43–46. [Google Scholar] [CrossRef]
- Caggianelli, A.; Prosser, G.; Del Moro, A. Cooling and exhumation history of deep-seated and shallow level, late Hercynian granitoids from Calabria. Geol. J. 2000, 35, 33–42. [Google Scholar] [CrossRef]
- Hutton, D.H.W. Granite emplacement mechanisms and tectonic controls: Inferences from deformation studies. Trans. R. Soc. Edinb. Earth Sci. 1988, 79, 245–255. [Google Scholar] [CrossRef]
- Festa, V.; Tursi, F.; Caggianelli, A.; Spiess, R. The tectono-magmatic setting of the Hercynian upper continental crust exposed in Calabria (Italy) as revealed by the 1:10,000 structural-geological map of the Levadio stream area. Ital. J. Geosci. 2018, 137, 165–174. [Google Scholar] [CrossRef]
- Mamtani, M.A.; Greiling, R.O. Serrated quartz grain boundaries, temperature and strain rate: Testing fractal techniques in a syntectonic granite. Geol. Soc. Lond. Spec. Publ. 2010, 332, 35. [Google Scholar] [CrossRef]
- Guillope, M.; Poirier, J.P. Dynamic recrystallization during creep of single-crystalline halite: An experimental study. J. Geophys. Res. 1979, 84, 5557–5567. [Google Scholar] [CrossRef]
- Kruhl, J.H. Prism- and basal-plane parallel subgrain boundaries in quartz: A microstructural geothermobarometer. J. Metamorph. Geol. 1996, 14, 581–589. [Google Scholar] [CrossRef]
- Rosenberg, C.L.; Stünitz, H. Deformation and recrystallization of plagioclase along a temperature gradient: An example from the Bergell Tonalite. J. Struct. Geol. 2003, 25, 389–408. [Google Scholar] [CrossRef]
- Stipp, M.; Stünitz, H.; Heilbronner, R.; Schmid, S.M. The Eastern Tonale fault zone: A “natural Laboratory” for crystal plastic deformation of quartz over a temperature range from 250 to 700 °C. J. Struct. Geol. 2002, 24, 1861–1884. [Google Scholar] [CrossRef]
- Pryer, L.; Robin, P.-Y. Differential stress control on the growth and orientation of flame perthite: A palaeostress-direction indicator. J. Struct. Geol. 1996, 18, 1151–1166. [Google Scholar] [CrossRef]
- Simpson, C. Deformation of granitic rocks across the brittle-ductile transition. J. Struct. Geol. 1985, 7, 503–511. [Google Scholar] [CrossRef]
- Simpson, C.; Wintsch, R.P. Evidence for deformation-induced K-feldspar replacement by myrmekite. J. Metamorph. Geol. 1989, 7, 261–275. [Google Scholar] [CrossRef]
- Ishihara, S. The Magnetite-series and ilmenite-series granitic rocks. Min. Geol. 1977, 27, 293–305. [Google Scholar]
- Takahashi, M.; Aramaki, S.; Ishihara, S. Magnetite-series/ilmenite-series vs. I-type/S-typeg; Les series magnetite/ilmenite comparees aux granitoides de type I. Min. Geol. Spec. Issue 1980, 8, 13–28. [Google Scholar]
- Chappell, B.W.; White, A.J. Two contrasting granite types: 25 years later. Aust. J. Earth Sci. 2001, 48, 489–499. [Google Scholar] [CrossRef]
- Bleil, U.; Petersen, N. Variations in magnetization intensity and low-temperature titanomagnetite oxidation of ocean floor basalts. Nature 1983, 301, 384–388. [Google Scholar] [CrossRef]
- Schön, J. Physical Properties of Rocks: A Workbook; Elsevier: Amsterdam, The Netherlands, 2011; Volume 8, ISBN 0444537961. [Google Scholar]
- Zapletal, K.; Kropáček, V. Magnetic anisotropy of polycrystalline haematite induced by A D. C. magnetic field. Studia Geophys. Geod. 1985, 29, 351–361. [Google Scholar] [CrossRef]
- Rochette, P.; Jackson, M.; Aubourg, C. Rock magnetism and the interpretation of anisotropy of magnetic susceptibility. Rev. Geophys. 1992, 30, 209–226. [Google Scholar] [CrossRef]
- Aydin, A.; Ferré, E.C.; Aslan, Z. The magnetic susceptibility of granitic rocks as a proxy for geochemical composition: Example from the Saruhan Granitoids, NE Turkey. Tectonophysics 2007, 441, 85–95. [Google Scholar] [CrossRef]
- Borradaile, G.J. Magnetic susceptibility, petrofabrics and strain. Tectonophysics 1988, 156, 1–20. [Google Scholar] [CrossRef]
- Hrouda, F. Theoretical models of magnetic anisotropy to strain relationship revisited. Phys. Earth Planet. Inter. 1993, 77, 237–249. [Google Scholar] [CrossRef]
- Borradaile, G.J.; Jackson, M. Anisotropy of magnetic susceptibility (AMS): Magnetic petrofabrics of deformed rocks. Geol. Soc. Lond. Spec. Publ. 2004, 238, 299–360. [Google Scholar] [CrossRef]
- Žák, J.; Verner, K.; Holub, F.V.; Kabele, P.; Chlupáčová, M.; Halodová, P. Magmatic to solid state fabrics in syntectonic granitoids recording early carboniferous orogenic collapse in the Bohemian Massif. J. Struct. Geol. 2012, 36, 27–42. [Google Scholar] [CrossRef]
- Sen, K.; Majumder, S.; Mamtani, M.A. Degree of magnetic anisotropy as a strain intensity gauge in ferromagnetic granites. J. Geol. Soc. 2005, 162, 583–586. [Google Scholar] [CrossRef]
- Sen, K.; Mamtani, M.A. Magnetic fabric, shape preferred orientation and regional strain in granitic rocks. J. Struct. Geol. 2006, 28, 1870–1882. [Google Scholar] [CrossRef]
- Mamtani, M.A.; Sengupta, A. Anisotropy of magnetic susceptibility analysis of deformed kaolinite: Implications for evaluating landslides. Int. J. Earth Sci. 2009, 98, 1721–1725. [Google Scholar] [CrossRef]
- Mamtani, M.A.; Pal, T.; Greiling, R.O. Kinematic analysis using AMS data from a deformed granitoid. J. Struct. 2013, 50, 119–132. [Google Scholar] [CrossRef]
- Hunt, C.P.; Moskowitz, B.M.; Banerjee, S.K. Magnetic Properties of Rocks and Minerals. Rock Phys. Phase Relat. A Handb. Phys. Constants 1995, 3, 189–204. [Google Scholar]
- Waldhör, M.; Appel, E. Layer parallelisation: An unrecognised mechanism for palaeomagnetic rotations in fold belts. Tectonophysics 2009, 474, 516–525. [Google Scholar] [CrossRef]
Publisher’s Note: MDPI stays neutral with regard to jurisdictional claims in published maps and institutional affiliations. |
© 2021 by the authors. Licensee MDPI, Basel, Switzerland. This article is an open access article distributed under the terms and conditions of the Creative Commons Attribution (CC BY) license (https://creativecommons.org/licenses/by/4.0/).