1. Introduction
Mineral grain shape lineations in metamorphosed and plastically deformed rocks have been used for over a hundred years to infer tectonic transport directions (e.g., Geikie [
1]; Peach et al., [
2], p. 599; see reviews by Cloos [
3]; Anderson [
4]; Kvale [
5]; Law and Johnson [
6]). Although such linear grain shape fabrics may develop by many different structural processes, where it can be demonstrated that they have developed parallel to the maximum principal stretch direction, their trend is commonly used as an indicator of local tectonic transport direction (the geographic direction in which rocks are transported by tectonic processes such as movement on underlying faults and pervasive shearing). Transport directions can, of course, change both spatially and temporally, and may reflect complex flow patterns (particularly under ductile conditions in the mid-lower crust) and strain path partitioning at a wide range of scales [
7,
8,
9,
10,
11,
12,
13]. Additionally, orogen-scale arcuate lineation patterns are commonly interpreted as indicating transpressional deformation associated with variable components of orogen-perpendicular shortening and orogen parallel shearing (e.g., Burg et al., [
14]; Xypolias et al., [
15]).
The Caledonian orogen of northern Scotland has historically played a pivotal role in development of our understanding of potential relationships between lineation development/orientation and tectonic transport direction (see historical review by Law and Johnson [
6]). In this paper we investigate the transition from W-E, through NW-SE, to N-S trending lineations in an orogen-perpendicular ~45 km-long transect across the Caledonian orogenic wedge in the Northern Highlands of Scotland. This transect extends from the Moine thrust exposed at the foreland edge on the west coast near Ullapool, eastwards across the metasedimentary rocks of the overlying Moine and Sgurr Beag thrust sheets into the high-grade interior of the orogenic wedge exposed in the Ben Wyvis/Rogie Falls area (
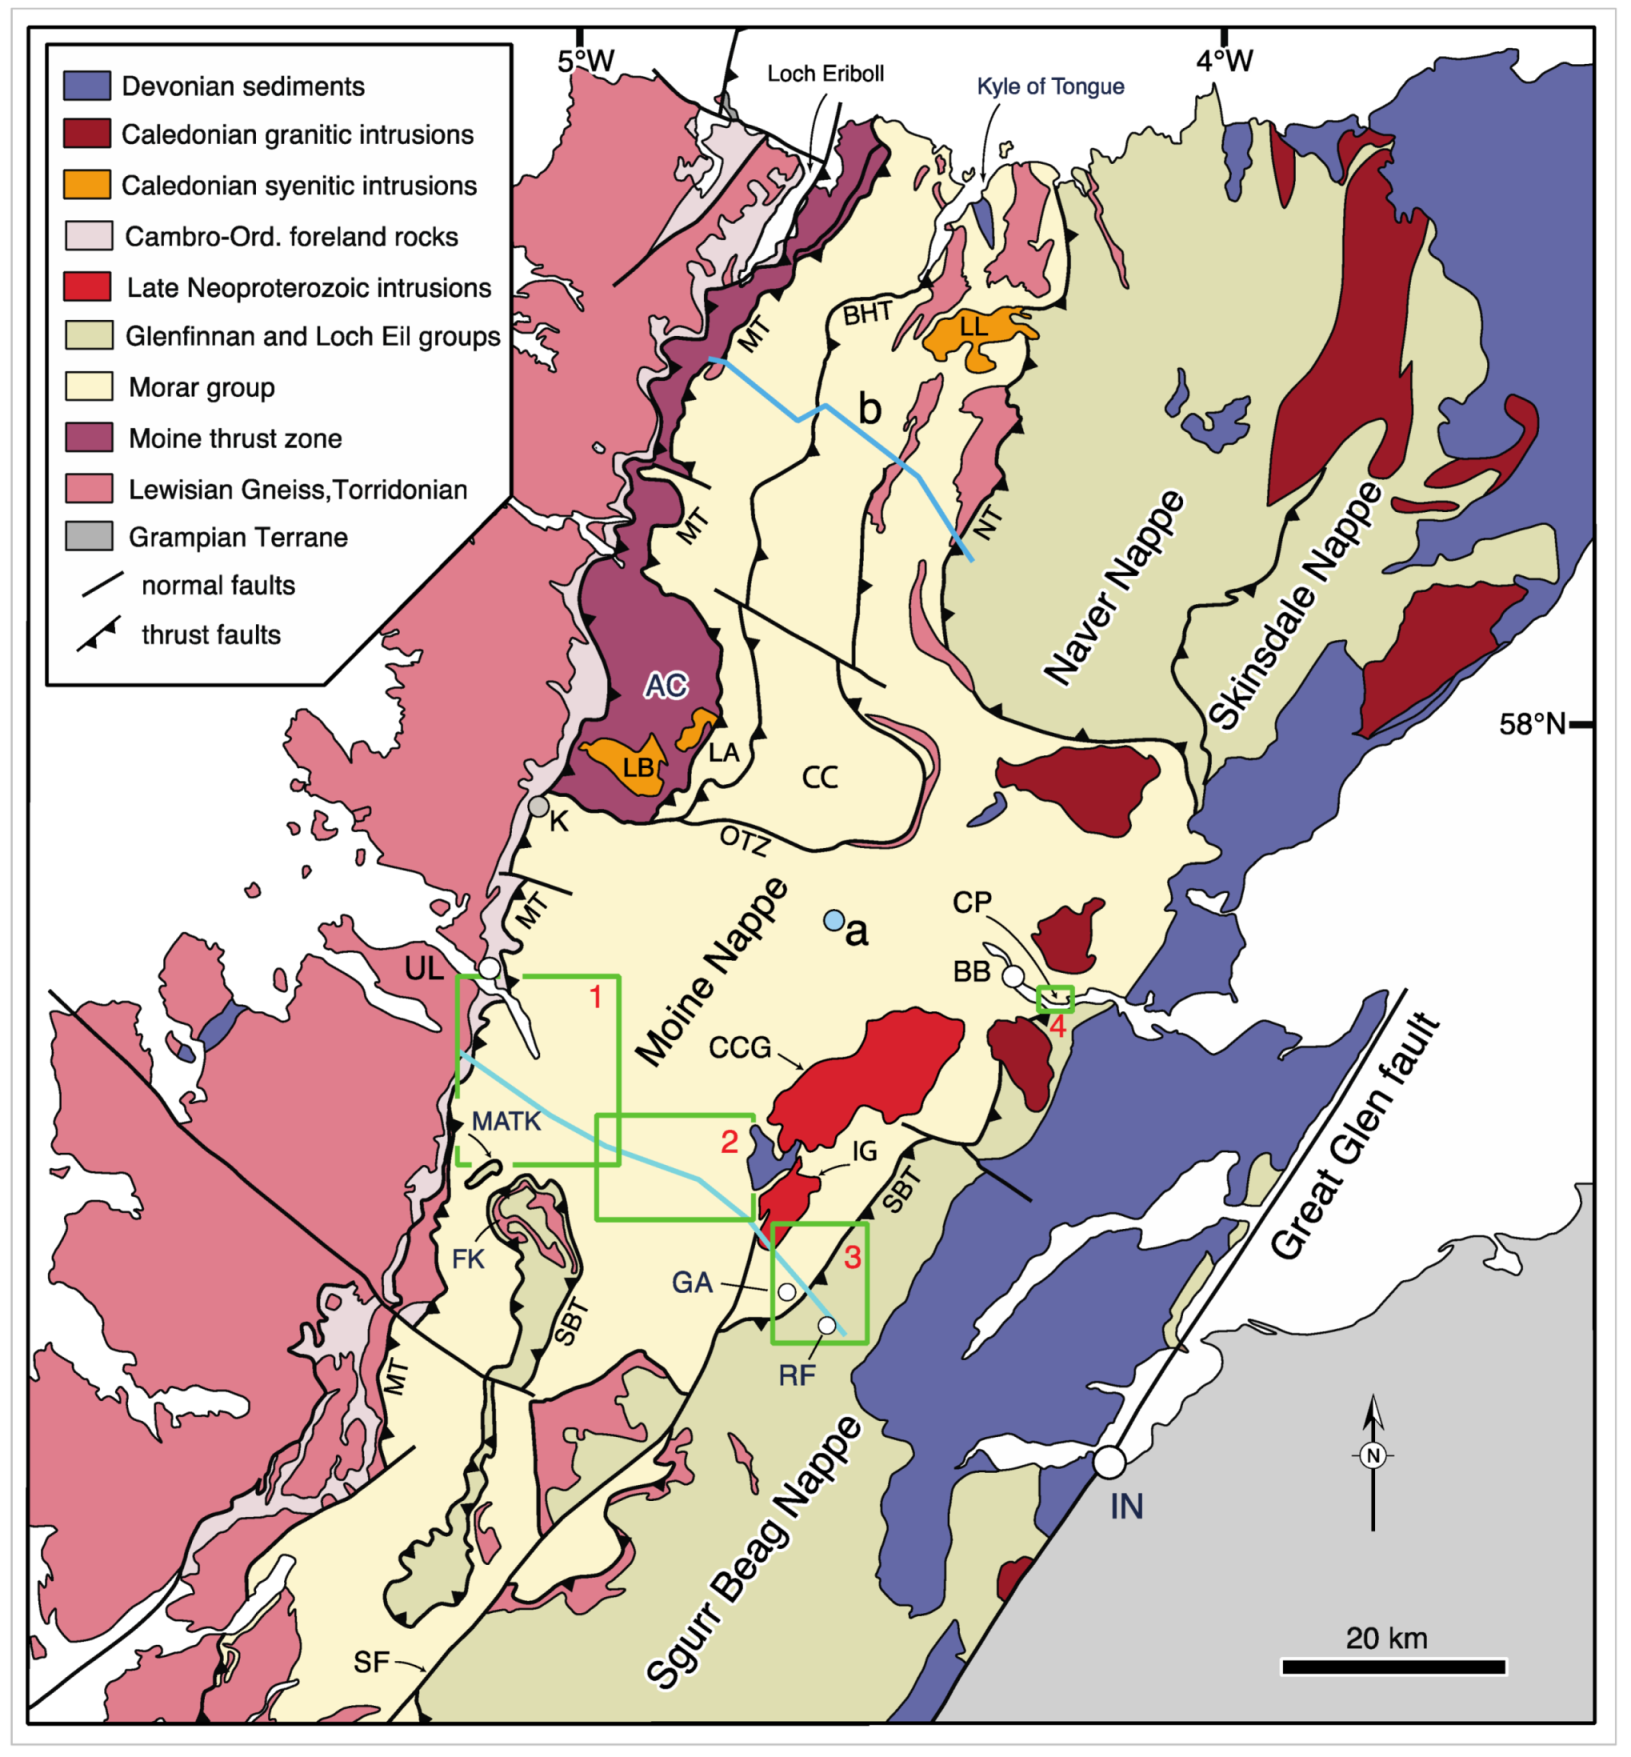
Figure 1 and
Figure 2, boxes 1–3). Quartz c-axis fabrics in these plastically deformed and dynamically recrystallized Moine metasedimentary rocks unequivocally demonstrate that macroscopic mineral lineations have developed parallel to the maximum principal stretch direction in all 52 oriented samples analyzed. Microstructures and c-axis fabrics also unequivocally demonstrate a progressive change from top to the W, through top to the NW, to top to the N shear sense traced from foreland to hinterland across the western part of the Moine thrust sheet. In contrast, microstructures and crystal fabrics in our 10 oriented samples from the uppermost part of the Moine thrust sheet and lowermost part of the overlying Sgurr Beag thrust sheets exposed on the east coast in the Creich Peninsula (
Figure 1 and
Figure 2, box 4) indicate a top down to the ESE to SSE shear sense.
With the exception of top to the W shearing on the Moine thrust itself, precise dating of the age (or ages) of this shearing remains to be resolved. Here, we summarize and discuss what geological and isotopic age constraints are available, and also consider the potential applicability of tectonic models proposed for the development of arcuate patterns of stretching lineations and transport directions in other orogens.
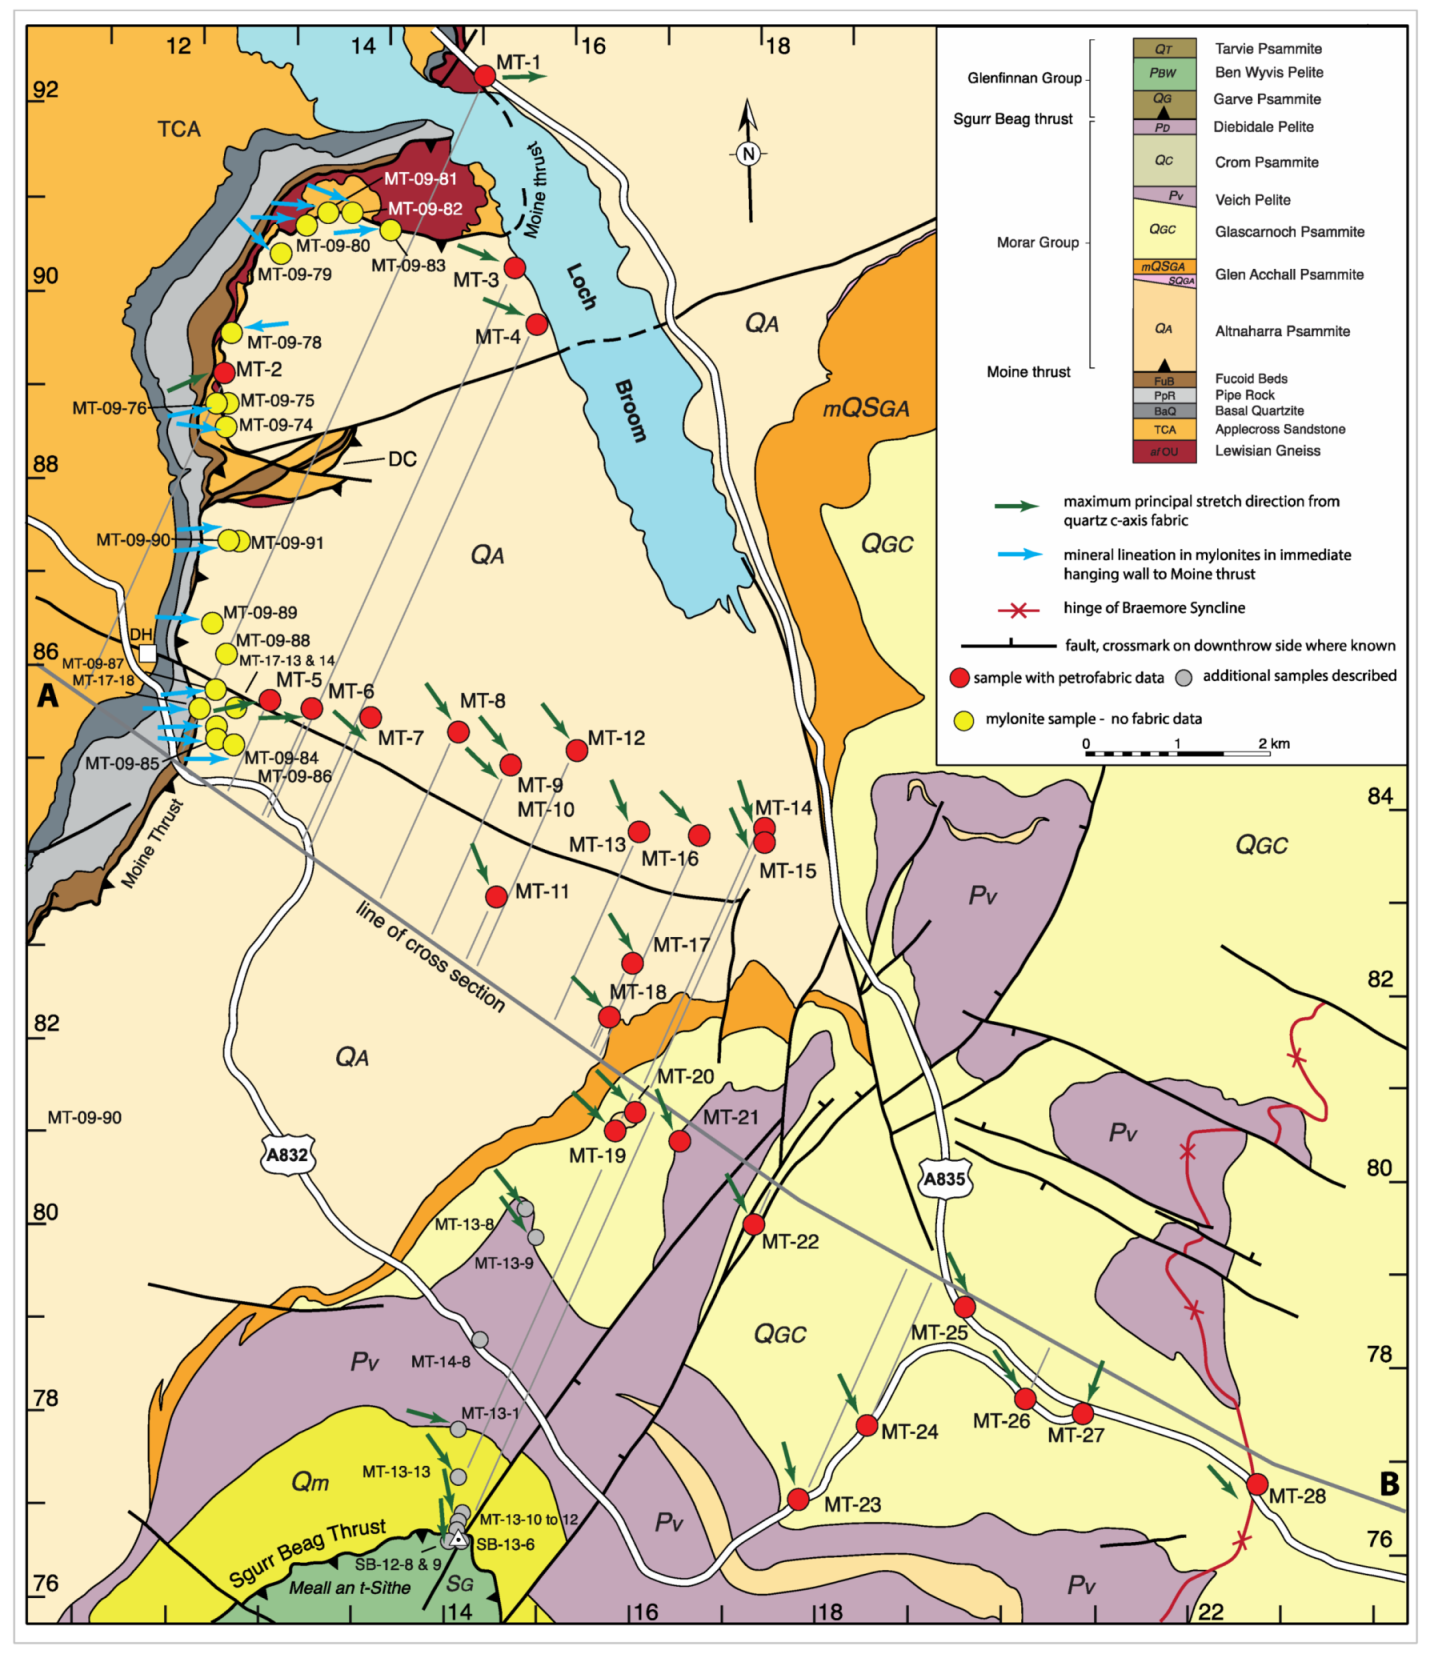
Figure 1.
Geological map of northern Scotland showing lithotectonic units and thrust sheets within the Moine Supergroup (Morar, Glenfinnan and Loch Eil Groups) of metasedimentary rocks. Location of sampling transect between Ullapool (UL), Garve (GA) and Rogie Falls (RF) indicated by blue line and positions of detailed geological maps along sampling transect indicated by green boxes 1–3. Position of Creich Peninsula (CP) coastal section indicated by small green box 4. AC, Assynt Culmination; BB, Bonar Bridge; BHT, Ben Hope thrust; CC, Cassley Culmination; CCG, Carn Chuinneag Granite; FK and MATK, Fannich Mountains and Meall an t-Sithe klippen of the Sgurr Beag thrust sheet; IG, Inchbae Granite; K, Knockan Crag; LA, LB and LL, Loch Ailsh, Loch Borralan and Loch Loyal alkaline intrusions; MT, Moine thrust; NT, Naver thrust; OTZ, Oykel Transverse Zone; SBT, Sgurr Beag thrust; SF, Strathconnon fault; (a) location of thermobarometry and isotopic dating sample MT-16-03 described by Mako [
16]; (b) location of grain size, quartz petrofabric/garnet-biotite thermometry profile (blue line) described by Francsis [
17], Thigpen et al., [
18] and Law [
19] between the Moine thrust and base of the Naver thrust sheet. Modified from Krabbendam et al., [
20], Leslie et al., [
21]; Thigpen et al., [
22] and Mako et al. [
23].
![Geosciences 11 00411 g001]()
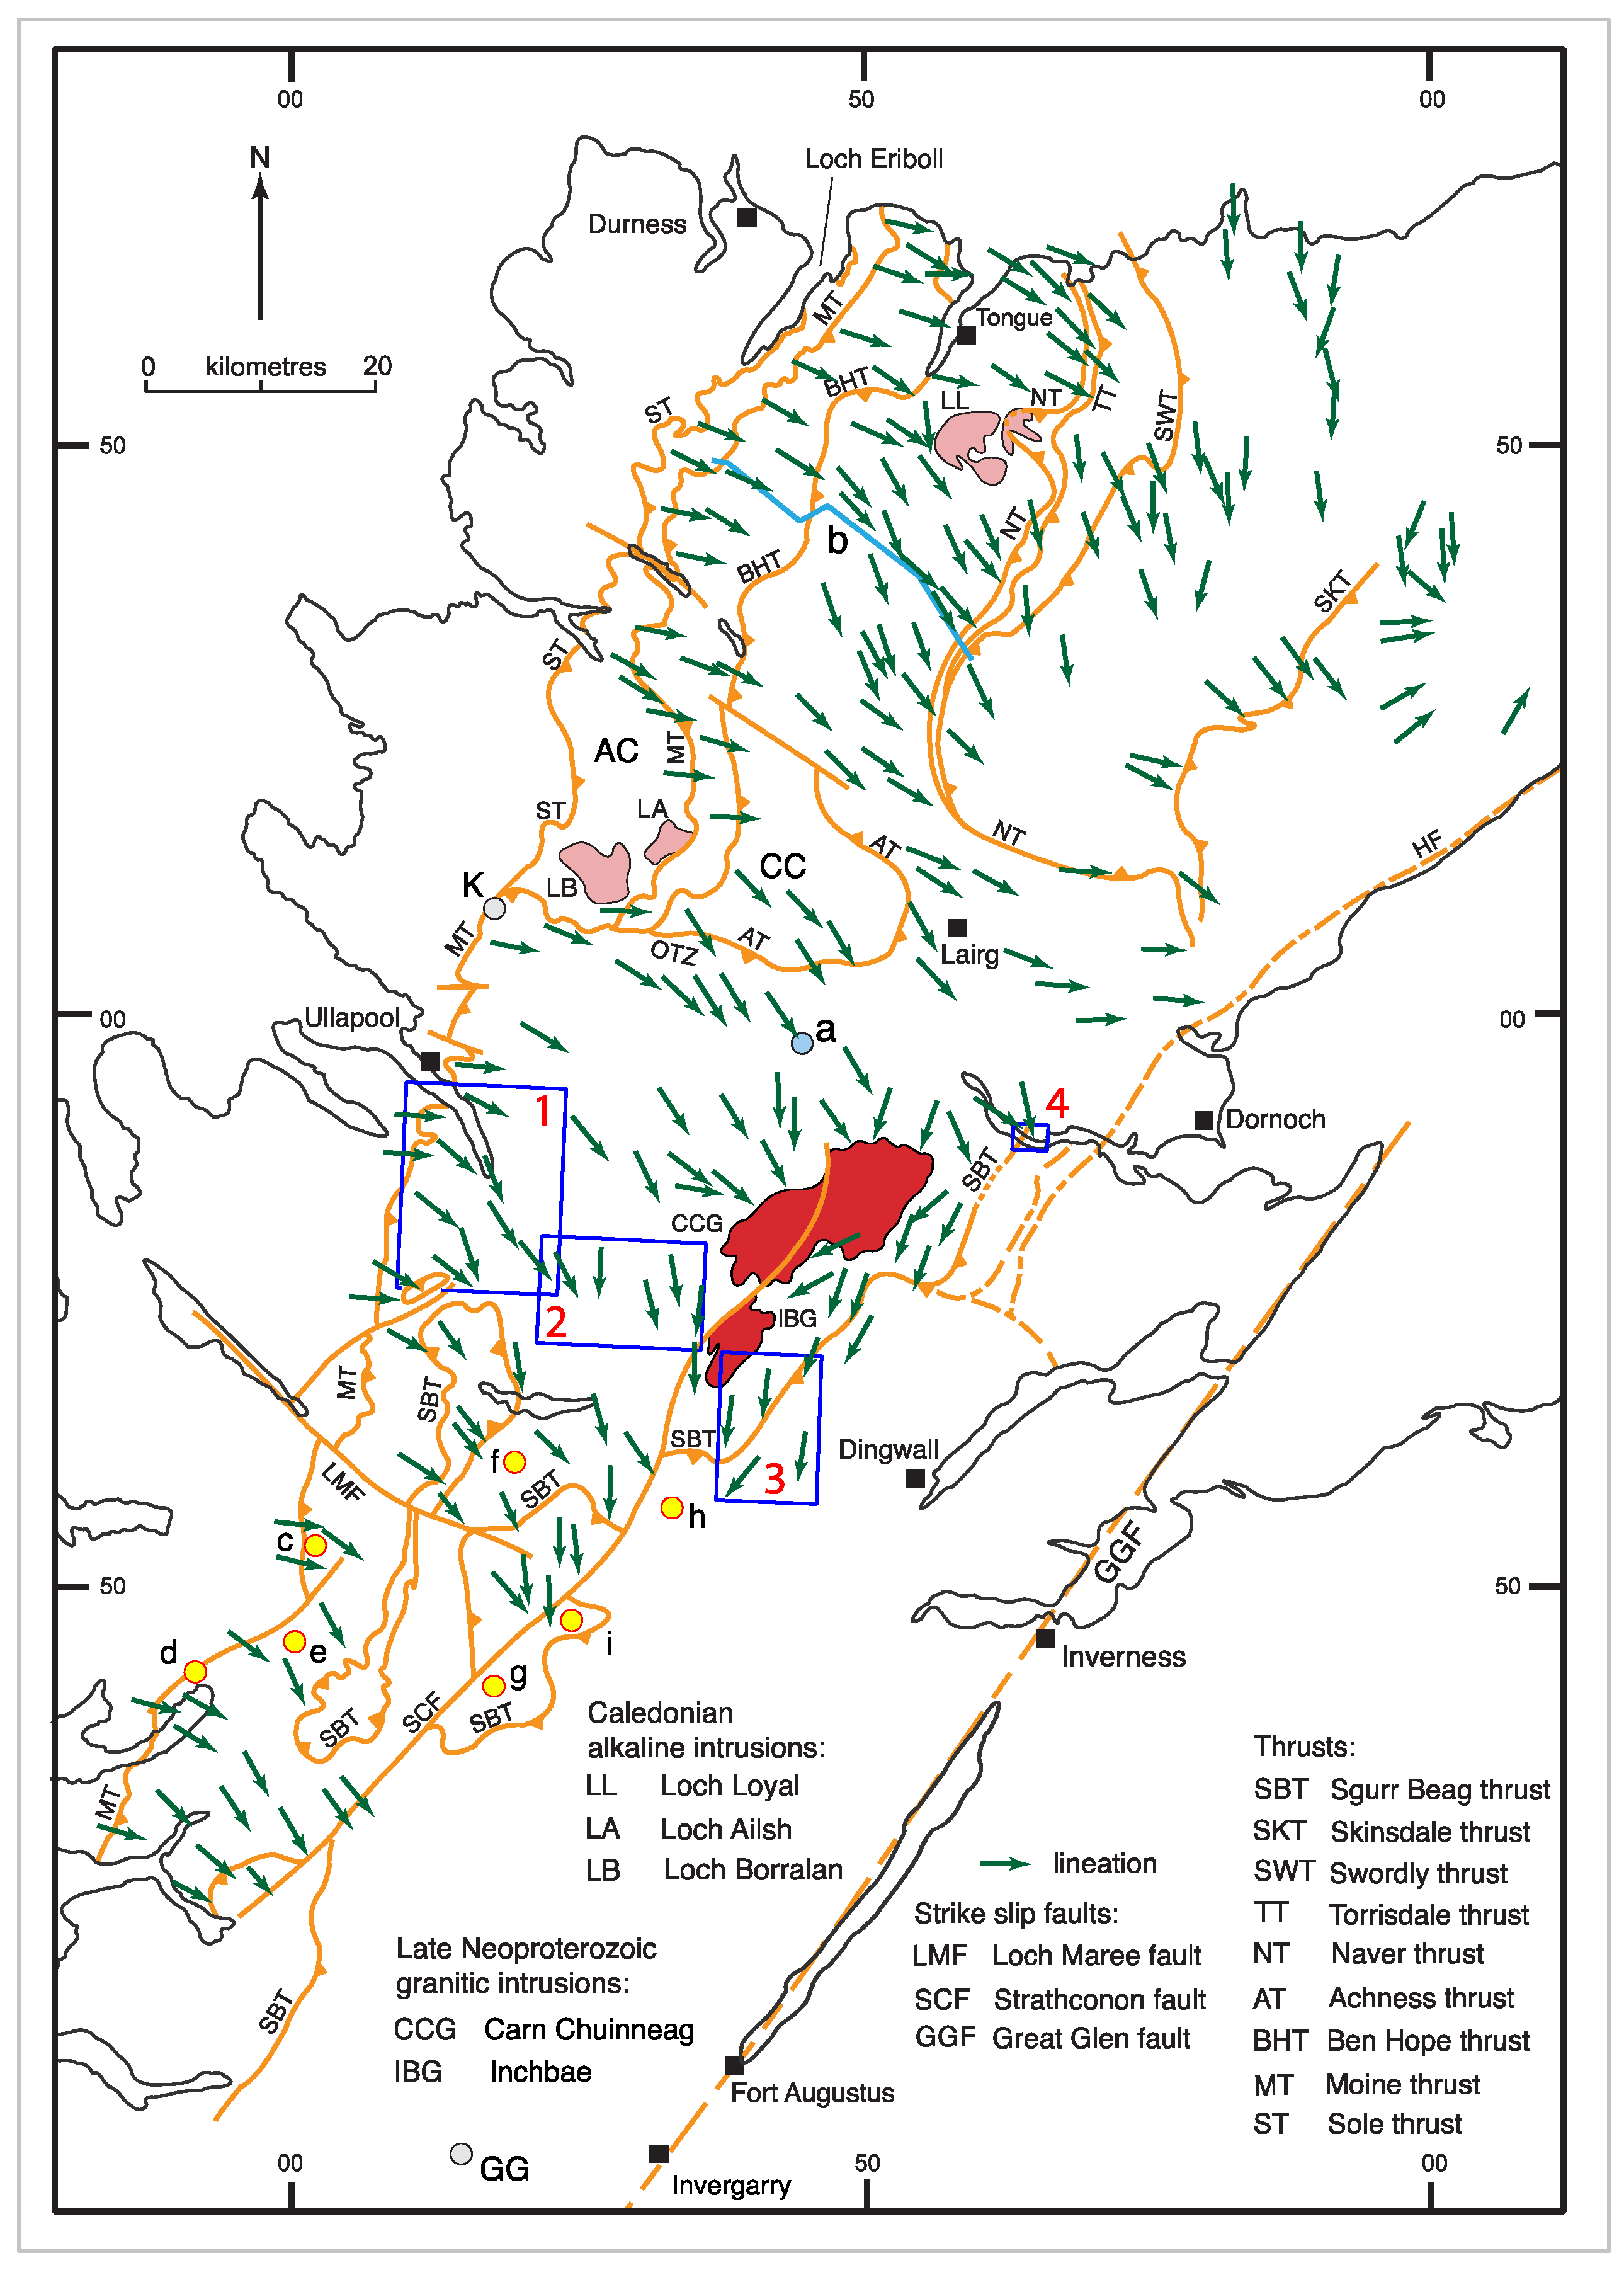
Figure 2.
Caledonian thrusts and L2 mineral lineations within the Moine rocks of Ross-shire and Sutherland. Modified from data compilation reviewed by Law and Johnson [
6] with additional data from Strachan et al. [
24] and this study. Location of sampling transect between Ullapool and Rogie Falls and detailed geological maps along sampling transect indicated by blue boxes 1–3. Position of Creich Peninsula coastal section indicated by small blue box 4. AC, Assynt Culmination; CC, Cassley Culmination; GG, Glen Garry; HF, Helmsdale Fault; K, Knockan Crag; OTZ, Oykel Transverse Zone. (a) location of thermobarometry and isotopic dating sample MT-16-03 described by Mako [
16]; (b) location of quartz petrofabric/garnet-biotite thermometry profile (blue line) described by Thigpen et al., [
18] and Law [
19] between the Moine thrust and base of the Naver thrust sheet. Yellow circles, labelled c–i, indicate locations of other petrofabric studies referred to in text: (c) Johnson [
25]; (d) Johnson [
26]; (e) Langford [
27]; (f) Sutton and Watson [
28]; (g) Ramsay [
29]; (h) Clifford [
30]; (i) Fleuty [
31].
![Geosciences 11 00411 g002]()
2. Geological Background
The Caledonian Orogen in the Northern Highlands of Scotland is primarily composed of Neoproterozoic Moine metasedimentary rocks, deposited at 980–870 Ma (Cawood et al., [
32]; Krabbendam et al., [
33] and references therein) and located between the Moine thrust zone to the NW and the Great Glen Fault to the SE (
Figure 1). These early Neoproterozoic metasedimentary rocks are cut by variably deformed and metamorphosed igneous intrusions and have been subjected to multiple phases of regional metamorphism and deformation. From oldest to youngest (and structurally from NW-SE) three major stratigraphic divisions are recognized (
Figure 1): the Morar Group composed of psammites and subordinate pelites, and the Glenfinnan and Loch Eil groups composed of psammites, pelites and quartzites (see review by Strachan et al., [
34]). The total cumulative thickness is c. 10–15 km. The Moine rocks have long been thought to represent an essentially continuous, although tectonically disrupted, succession and were assigned to a single Moine Supergroup [
35,
36]. However, rocks assigned to the Morar Group in Sutherland were metamorphosed at c. 950–940 Ma [
37], whereas the Glenfinnan and Loch Eil groups were deposited after c. 910 Ma [
38]. Recently, it has been proposed that the Morar Group, together with the Torridon and Sleat groups below the Moine thrust, belongs to an older Wester Ross Supergroup, and that the Glenfinnan and Loch Eil groups belong to a younger Loch Ness Supergroup [
39].
The Moine rocks are cut by a series of originally gently ESE-dipping ductile thrusts, with each thrust sheet having its own distinctive stratigraphic, structural and metamorphic characteristics [
40,
41]. The Moine thrust separates Morar Group rocks from underlying anchizonal and un-metamorphosed Cambro-Ordovician and older rocks of the Moine thrust zone (
Figure 1), while the Sgurr Beag thrust separates the Morar Group from the overlying Glenfinnan Group [
42,
43]. In the Loch Fannich area the Sgurr Beag thrust sheet is preserved as klippen of down-folded Glenfinnan Group rocks (
Figure 1, FK and MATK) now separated by erosion from their main outcrop east of the Strathconnon Fault. In the northern Moine rocks of Sutherland the Naver thrust separates Morar Group rocks from overlying possible Glenfinnan Group rocks referred to as the East Sutherland Moine; however, correlation between the Sgurr Beag and either the Naver or Skinsdale thrusts remains debated [
44,
45,
46]. Numerous smaller scale thrusts are recognized within the major thrust sheets.
Traced eastwards from the Moine thrust zone, metamorphic grade in the Moine rocks increases from greenschist facies in the immediate hanging wall to the Moine thrust, through epidote-amphibolite facies to lower and middle amphibolite facies, with upper amphibolite facies rocks recorded both in the far SW and NE [
47]. However, as pointed out by Strachan et al., [
41], p. 88, the apparent simplicity of this regional metamorphic zonation is illusory, as isotopic age-dating studies indicate that it is the composite result of multiple episodes of middle Neoproterozoic and Lower Paleozoic metamorphism and deformation. Three main groups of ages (and associated metamorphism and deformation) are traditionally recognized: (1) Knoydartian (~870–720 Ma) recognized primarily in the southern and central Moine on the SE side of the Strathconnon Fault; (2) Grampian (~480–460 Ma, early middle Ordovician) recognized in scattered locations throughout the southern Moine and in higher grade rocks located above and to the east of the Naver and Sgurr Beag thrusts in the northern Moine; (3) Scandian (~445–415 Ma, Silurian) recognized primarily in the Moine thrust Zone and the Moine/Ben Hope and Naver thrust sheets of the northern Moine, plus scattered locations in the southern Moine. The Grampian and Scandian are commonly viewed as separate phases of Caledonian orogenesis, the former resulting from the accretion of a magmatic arc to the Scottish margin of Laurentia, and the later the collision of Baltica and Laurentia and closure of the Iapetus Ocean [
48]. However, isotopic ages of 460–445 Ma falling between the traditional Grampian and Scandian groups have recently been documented from scattered locations in both the southern Moine and Moine rocks exposed on the north coast [
48,
49] indicating a more complex history than previously appreciated.
Fault geometries and microstructural/petrofabric kinematic indicators unequivocally demonstrate that the Moine thrust zone and overlying Moine thrust mylonites are associated with top to the WNW shearing (see historical review by Law and Johnson [
6]). In the Assynt region timing of motion on the Moine thrust is partially bracketed by the alkaline Loch Ailsh and Loch Borralan intrusive complexes (
Figure 1, locations LA and LB). The Loch Ailsh intrusion is locally mylonitized adjacent to the Moine thrust and has yielded a U-Pb zircon age of 430.6 ± 0.4 Ma, while the later parts of the Loch Borralan complex postdate penetrative shearing and have been dated at 429.2 ± 0.5 Ma [
48]. This is consistent with K-Ar and Rb-Sr mica ages from the Loch Broom–Fannich Forest area to the south which indicate that movement on the Moine thrust mylonites commenced at around 440–435 Ma with a cessation of ductile movement at ~430 Ma, although movement may have continued in a less pervasive manner until at least 408 Ma [
50,
51].
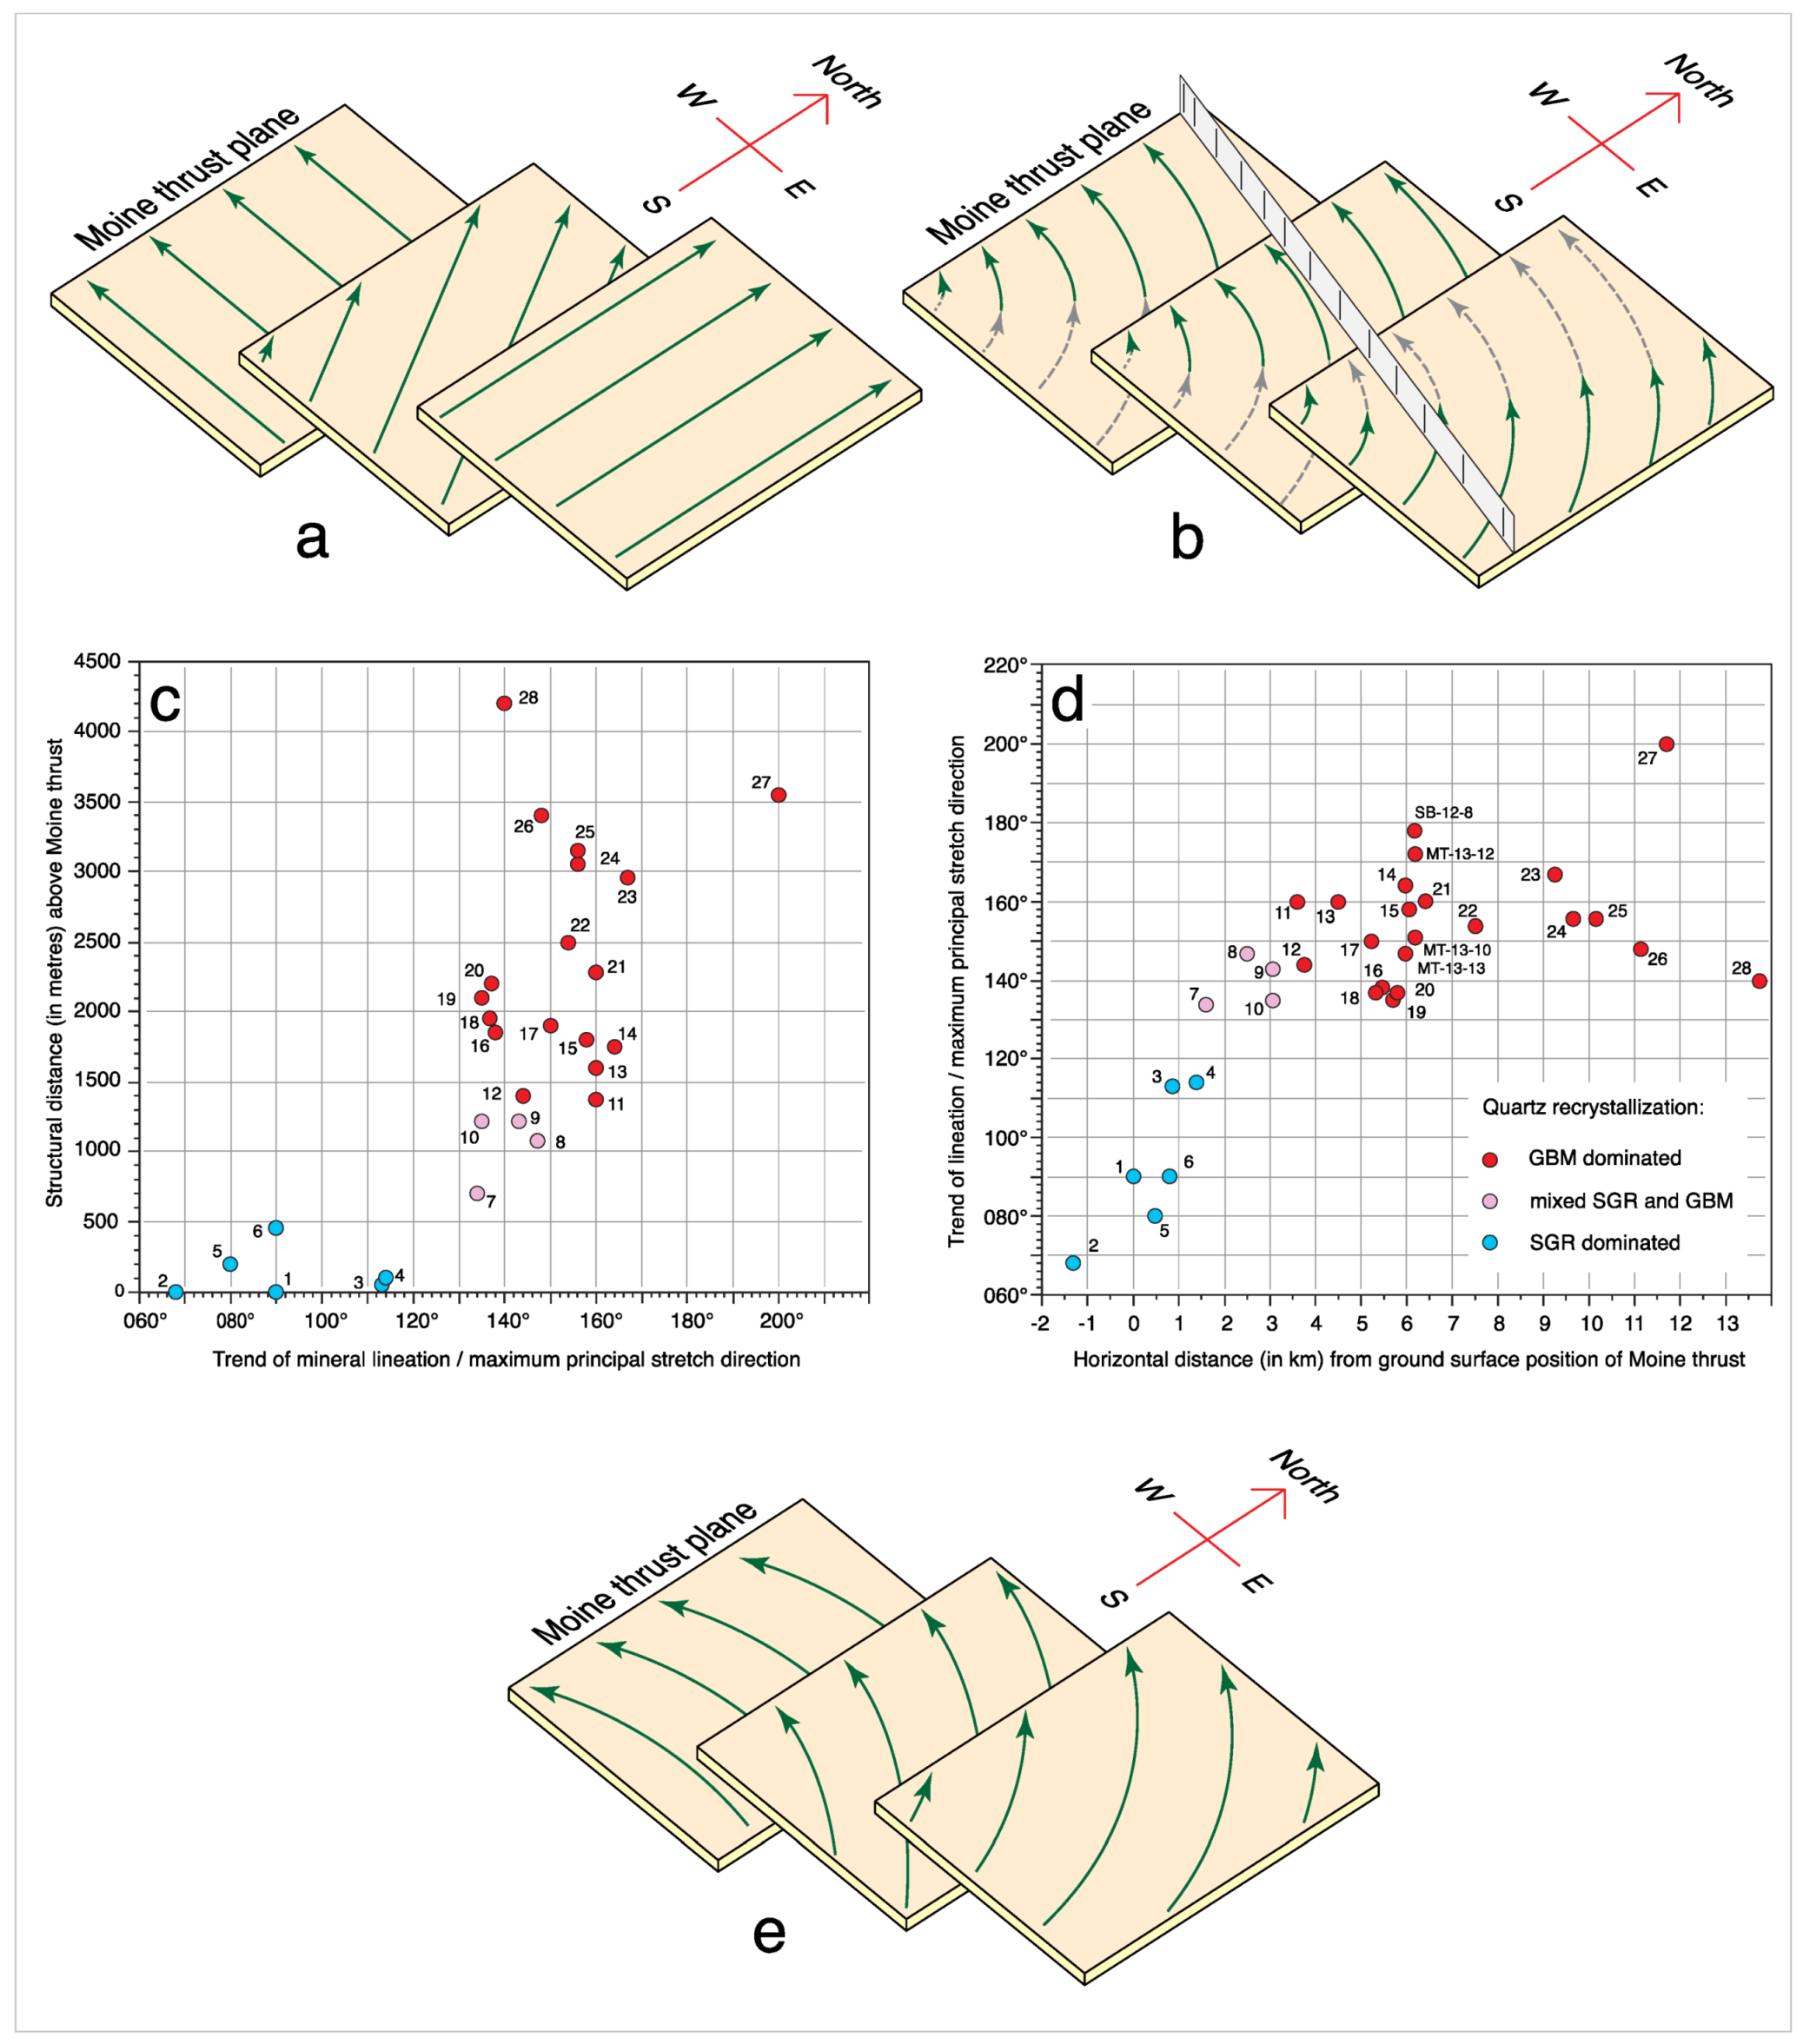
Despite the overwhelming evidence for multiple phases of deformation (thrusting, penetrative shearing and folding and metamorphism) the dominant mineral stretching lineation in the northern Moine metasedimentary rocks displays a remarkably simple map pattern (
Figure 2). Adjacent to the Moine thrust the lineation plunges gently to the ESE. Traced eastwards to the higher metamorphic grade rocks of the structurally overlying thrust sheets the lineation trend progressively turns in a clockwise fashion with lineations plunging to the S or SSW in the highest-grade rocks. This lineation is usually referred to as an ‘L2’ structure (e.g., Holdsworth et al., [
52,
53]; Strachan et al., [
41]; Mendum [
46]) as, where overprinting relationships are preserved, it is associated with an S2 foliation that postdates early cm-scale isoclinal F1 folds.
In the Kyle of Tongue area on the north coast (
Figure 1), Holdsworth [
54] and Holdsworth et al., ([
52], p. 20–21) have described N-trending mineral lineations in the Ben Hope thrust sheet which are deformed around F2 minor fold hinges and appear to represent a rarely preserved L1 fabric which was tentatively suggested to be of Precambrian age, and possibly formed during the Knoydartian orogenic event (Alsop et al., [
55] p. 257), although a Caledonian age is also possible. Holdsworth [
54] also noted that these N-trending L1 lineations are coincident with the majority of Caledonian age F2 fold hinges associated with W-vergent folding and thrusting prior to D2 sheath fold-formation and suggested that the later F2 folds initially formed parallel to an older regionally widespread L1 fabric.
Krabbendam et al., [
56] have noted that ‘L2’ and ‘S2’ fabrics cannot be correlated across different thrust sheets. Instead, individual thrust sheets such as the Moine, Ben Hope and Achness thrust sheets (
Figure 2) have their ‘own’ L2 or S2 fabrics, which are structurally younger than those developed in higher thrust sheets, which is consistent with an overall foreland-propagating thrust sequence.
Adjacent to the Moine thrust, the ESE trending L2 mineral lineation is parallel to the well-documented Scandian age transport direction in the underlying Moine thrust zone. Deformation microstructures and quartz c-axis fabrics in these dynamically recrystallized rocks unequivocally demonstrate that this lineation has developed parallel to the local maximum principal stretching direction during top to the W shearing (see historical review by Law and Johnson, [
6]). However, traced eastward into the overlying higher grade metasedimentary rocks only very limited data are currently available on: (a) the kinematic significance of these lineations (e.g., relationship to finite principal strain directions and associated shear sense); (b) how the microstructures and crystal fabrics that developed with these grain shape lineations (and their associated foliations) change with increasing deformation temperature/metamorphic grade; and (c) whether these lineations/foliations are everywhere of essentially the same (Scandian) age or if they becomes progressively older (intermediate Scandian-Grampian or Grampian ages) traced eastwards into the overlying higher metamorphic grade thrust sheets, as suggested, for example, by Kelley and Powell [
57] in the Fannich Forest area for the adjacent Moine and Sgurr Beag thrust sheets containing E and SE to S plunging lineations, respectively (
Figure 1, locations MATK and FK).
5. Area 2—Hinge of Braemore Syncline—East of Loch Glascarnoch
In Area 2 both the Morar Group stratigraphic units of the Moine thrust sheet and the projected positions of the overlying Sgurr Beag thrust sheet are folded about km-scale west-vergent folds [
70,
105] that are interpreted to detach onto the underlying Moine thrust surface [
56]. The Sgurr Beag thrust sheet is also folded about these km-scale folds with the Meall an t-Sithe and Fannich Forest klippen (MATK and FK in
Figure 1) being downfolded outliers of the main part of the Sgurr Beag thrust sheet [
56,
70] preserved further to the southeast in Area 3. These folds are shown on the cross section in
Figure 14a that extends from the Moine thrust in the western part of Area 1, through Area 2 to the Sgurr Beag thrust sheet exposed in the eastern part of Area 3. The hinges of these km-scale folds plunge gently to the N or S and axial surfaces increase in dip from ~35° to 60° E traced from west to east [
56]. Penetrative strain magnitudes are probably lower than in the same stratigraphic units in Area 1, with sedimentary way-up structures locally preserved [
56] and indicating a broadly right way-up sequence of stratigraphic units that are locally overturned on the steeply dipping limbs of the km-scale folds (
Figure 14a).
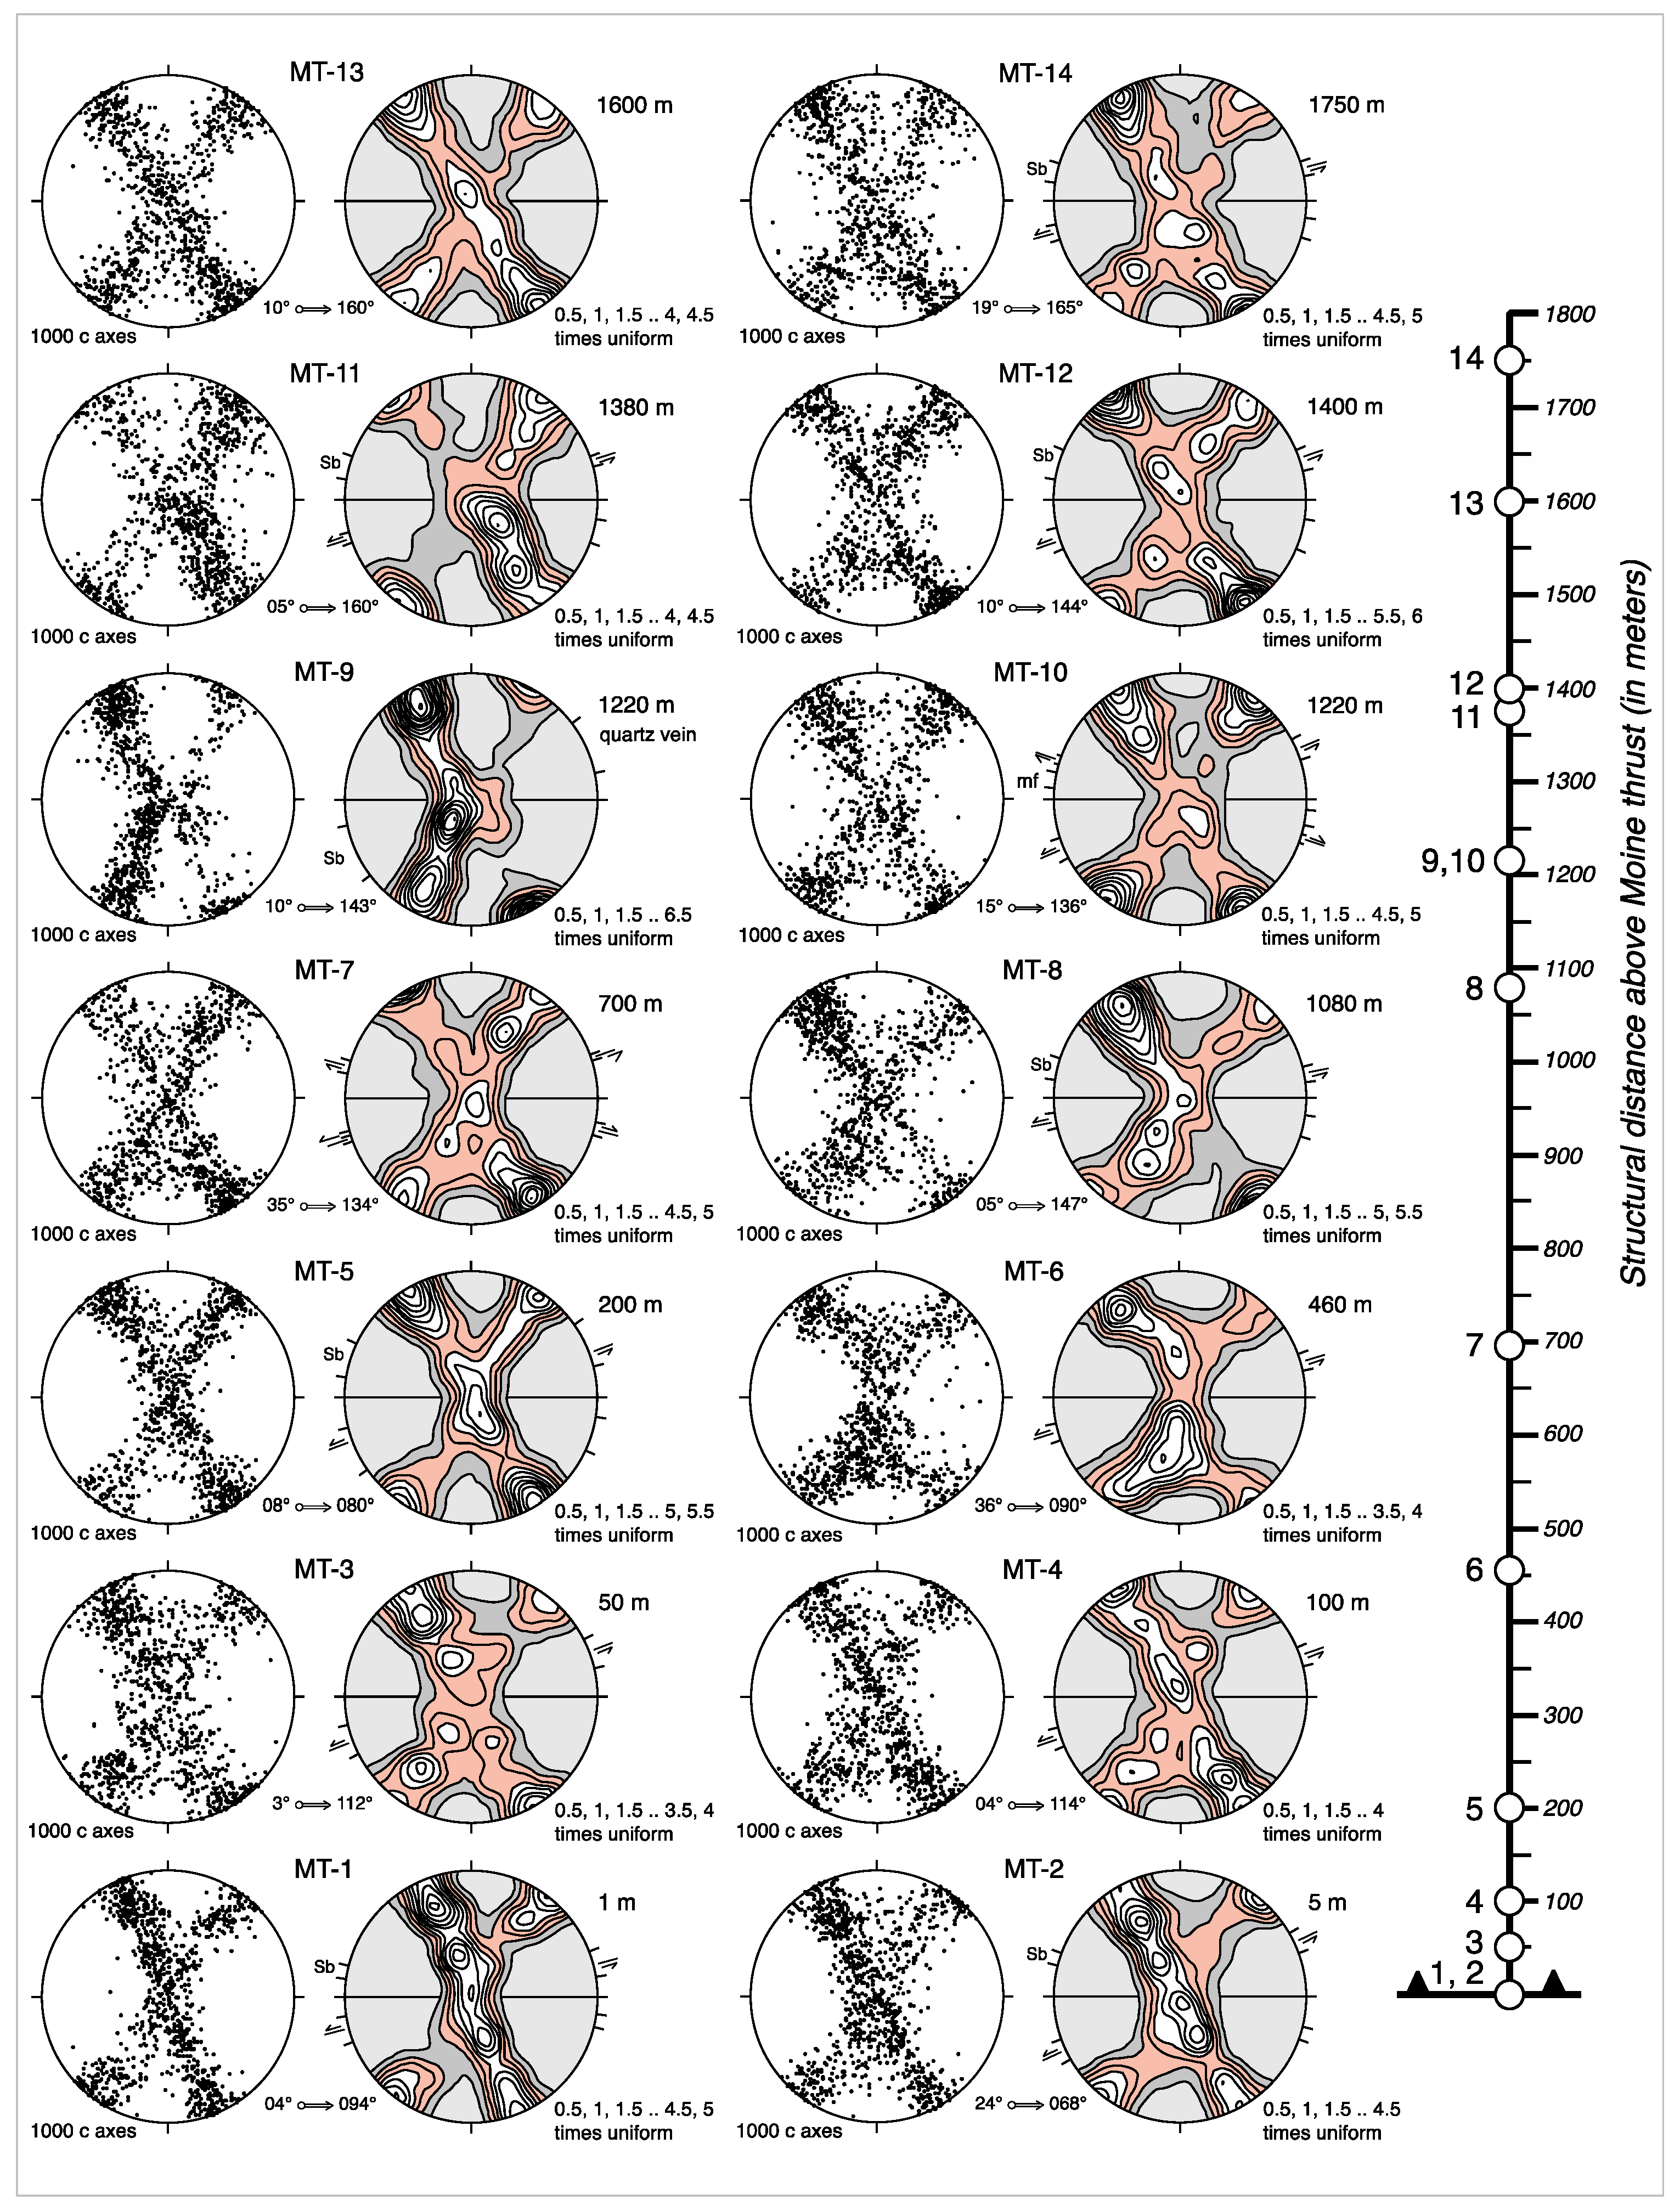
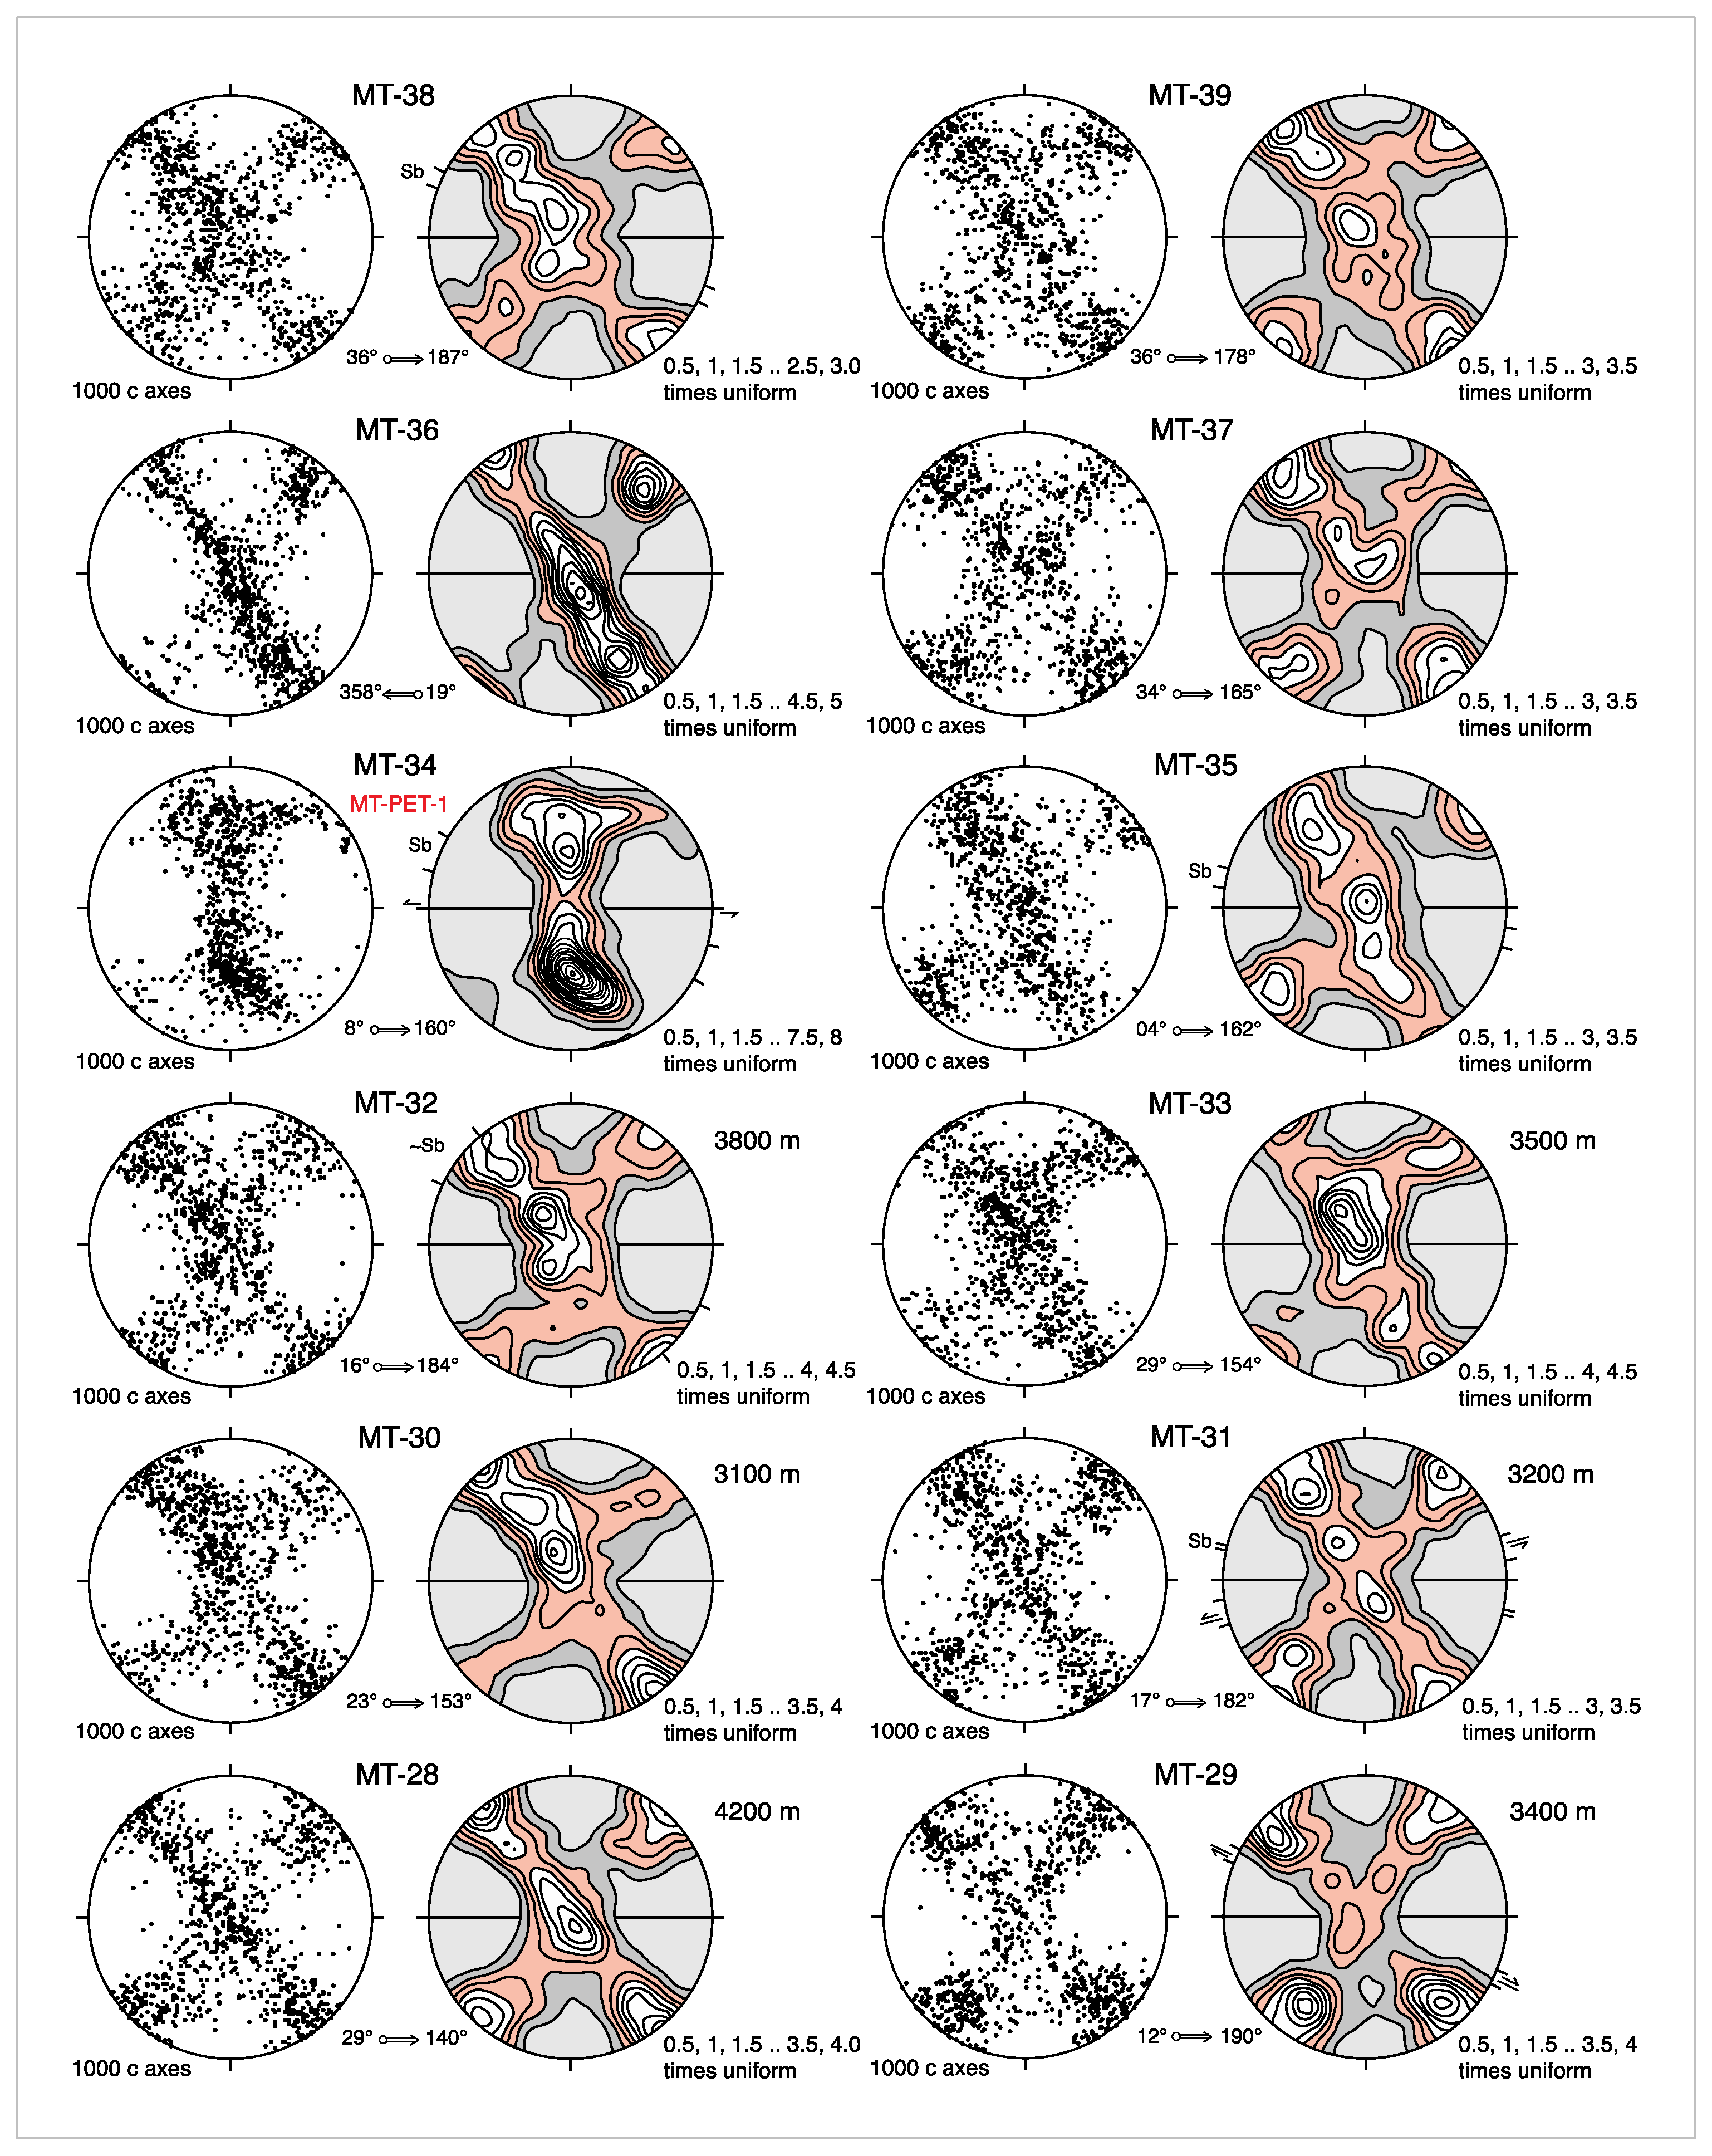
Thirteen oriented samples (MT-28 to 39 plus MT-PET-1) were collected in Area 2 (
Figure 14 and
Figure 16). Quartz c-axis fabrics from three of these samples (here relabeled as MT-33, 34 and 35) have previously been reported by Mazza et al., [
95]. Only the more pelitic samples contain a platy foliation, while grain shape fabrics are dominantly granular in the psammites due to grain boundary migration recrystallization microstructures developing in both quartz and feldspar. Nonetheless, a macroscopic grain shape foliation oriented parallel to color banding can be recognized in all samples, and all samples contain a N-S trending grain shape lineation of variable intensity on the foliation planes. Poles to foliation in the oriented samples define a partial great circle distribution suggesting that foliation has been folded about a fold hinge plunging gently to the S (12° towards 178°;
Figure 5c; cf. complete pole to foliation data sets from Areas 1–3 in
Figure 5e). Grain shape lineations on the oriented samples plunge gently to the S, sub-parallel to the km-scale fold hinges, and range in trend from 155° to 184° (
Figure 14b) with a vector average trend of 19° towards 170° (
Figure 5c). Quartz c-axis fabric analyses indicate that all grain shape lineations in the samples analyzed have developed parallel to the maximum principal stretch direction (X) and that the macroscopic foliation is parallel to the XY plane of the finite strain ellipsoid (
Figure 9; see below).
Krabbendam et al., [
56], p. 12, regarded the grain shape foliation (which they referred to as S2
Ac) in Area 2 as being axial planar to the km-scale folds and hence synchronous with formation of the folds and indicating that the folds developed during peak metamorphic conditions. In contrast we argue here that the foliation (and lineation/maximum principal stretch directions) predate formation of these folds. There are four main lines of evidence for this reinterpretation.
- (1)
Grain shape foliation is parallel to mapped gently eastward dipping stratigraphic units throughout the >4 km thick structural section in Area 1, and these units are themselves folded about the km scale folds in Area 2 (
Figure 4 and
Figure 14). Grain shape foliations are, however, oblique to lithological banding in other structural locations such as on the overturned limb of the Bean Dearg Anticline.
- (2)
In the hinge zone of the Beinn Dearg Anticline grain shape foliation/lithologic banding is locally folded by tight 10–20 cm scale minor folds with sub-horizontal hinges trending N-S and hinge planes dipping steeply E (e.g., Krabbendam et al., [
56], their
Figure 6e). Quartz c-axis fabric analysis of sample MT-30 taken from the limb of one of these folds (grid reference NH 25456 74828) demonstrates that the folded foliation is parallel to the local XY plane of the finite strain ellipsoid and that the fold-hinge parallel mineral lineation is itself parallel to the maximum finite stretch direction (X).
- (3)
Quartz c-axis fabrics and microstructures in samples taken from the right way-up limbs of the km-scale folds unequivocally indicate a top to the N shear sense, while samples from the overturned limbs (e.g., MT-29 from the locally overturned and steeply dipping limb of the Braemore Syncline–Beinn Dearg Anticline fold pair) indicate a top to the S shear sense. However, unfolding of the km-scale folds results in a common top to the N shear sense for all samples (see
Section 5.2 below).
- (4)
Throughout Area 2 lineations/maximum principal stretch directions trend N-S sub-parallel to the km-scale fold hinges and are associated with top to the north shear sense indicators. Although examples of fold hinges nucleating in the X direction have been documented both in nature and experimentally [
106,
107,
108,
109,
110,
111], here it seems more reasonable to interpret the folds in terms of deforming an earlier LS fabric in which the linear fabric element was oriented at a high angle to the WNW-directed transport direction on the underlying Moine thrust, and fold hinges developed sub-parallel to this earlier N-S trending lineation. As outlined in
Section 2, Holdsworth [
54] has previously made a similar interpretation for outcrop scale N-S trending W-verging folds nucleating on older, rarely preserved, N-S trending mineral lineations in the Ben Hope thrust sheet exposed on the north coast in the Kyle of Tongue area (
Figure 1).
5.1. Microstructures and Petrography
Microstructures in all samples from Area 2 indicate that both quartz and feldspar have deformed plastically, forming an interlocking mosaic of grains with grain scale sinuous/lobate grain boundaries (spectacularly developed between quartz and plagioclase grains in samples MT-34 and 36) (
Figure 7i,j) indicating high mobility of feldspar and quartz grain boundaries. Quartz grain interiors are usually strain free while orthoclase, and, to a lesser-extent plagioclase grains, locally exhibit patchy extinction and subgrain development, suggesting minimum temperatures of ~550–600 °C (Passchier and Trouw [
72], p. 260). Orthoclase grains are frequently sericitized, particularly in samples (e.g., MT-29 and 30) located on the vertical fold limbs, while plagioclase grains remain unaltered. Widely varying amounts of white mica and biotite are recorded in the different samples. Biotite remains fresh and highly pleochroic with fox-red colour in some samples but is chloritized in other samples and particularly on the vertical fold limbs. Garnet is present in the more pelitic samples from the western part of Area 2 (MT-29 to MT-34, M-PET-1) and individual grains are euhedral in all samples (Ashley et al., [
75], their
Figure 3 and
Figure 4).
Most samples from Area 2 lack the necessary metamorphic indicator minerals for quantitative PT analyses. However, sample MT-PET-1 from the central part of the area on the north side of Loch Glascarnoch (
Figure 16) contains the assemblage muscovite + quartz + plagioclase + biotite + garnet allowing Mazza et al., [
92] to estimate a broad range of temperature and pressure values of 550–680 °C and 2.8–7.2 kbar for this sample (referred to as MT-12-10 by Mazza et al., [
92]), based on pseudosection modeling. Mazza et al., [
95] suggested that more meaningful pressure constraints for this sample may come from the presence of kyanite overprinting andalusite in the aureole of the Carn Chuinneag granite, located approximately 15 km to the NE of Loch Glascarnoch in the upper part of the Moine thrust sheet [
112,
113,
114,
115,
116,
117]. Growth of kyanite is interpreted to be associated with regional metamorphism and fabric development that post-dates intrusion of the granite at c. 594 Ma (Oliver et al., [
118], their
Figure 2) and may structurally and temporally correlate with the deformation fabrics in our samples from Loch Glascarnoch in Area 2 [
56]. Given these observations, the pressure range of MT-PET-1 is further restricted to 4.8–7.2 kbar [
95].
To the north of the Carn Chuinneag granite and its contact aureole, kyanite has also been recorded by Mako [
16], his sample MT-16-03, in the upper part of the Moine thrust sheet at approximately 25 km to the NE of Loch Glascarnoch (
Figure 1 and
Figure 2, location a). Lineation in this sample plunges at 47° towards 149°. Detailed petrologic and geochronological analyses (monazite/xenotime) and thermodynamic modeling by Mako [
16], p. 85–93, on this sample (composed of quartz, garnet, staurolite, muscovite, biotite, ilmenite, rutile, kyanite, chlorite) suggested it reached peak temperatures and pressures of 670 °C and at least 8 kbar almost simultaneously, and on the retrograde path passed through 620 ± 25 °C at ~416 Ma ± 5 Ma and then 550–600 °C at 5–6 kbar.
5.2. Quartz c-Axis Fabrics and Microstructural Shear Sense Indicators
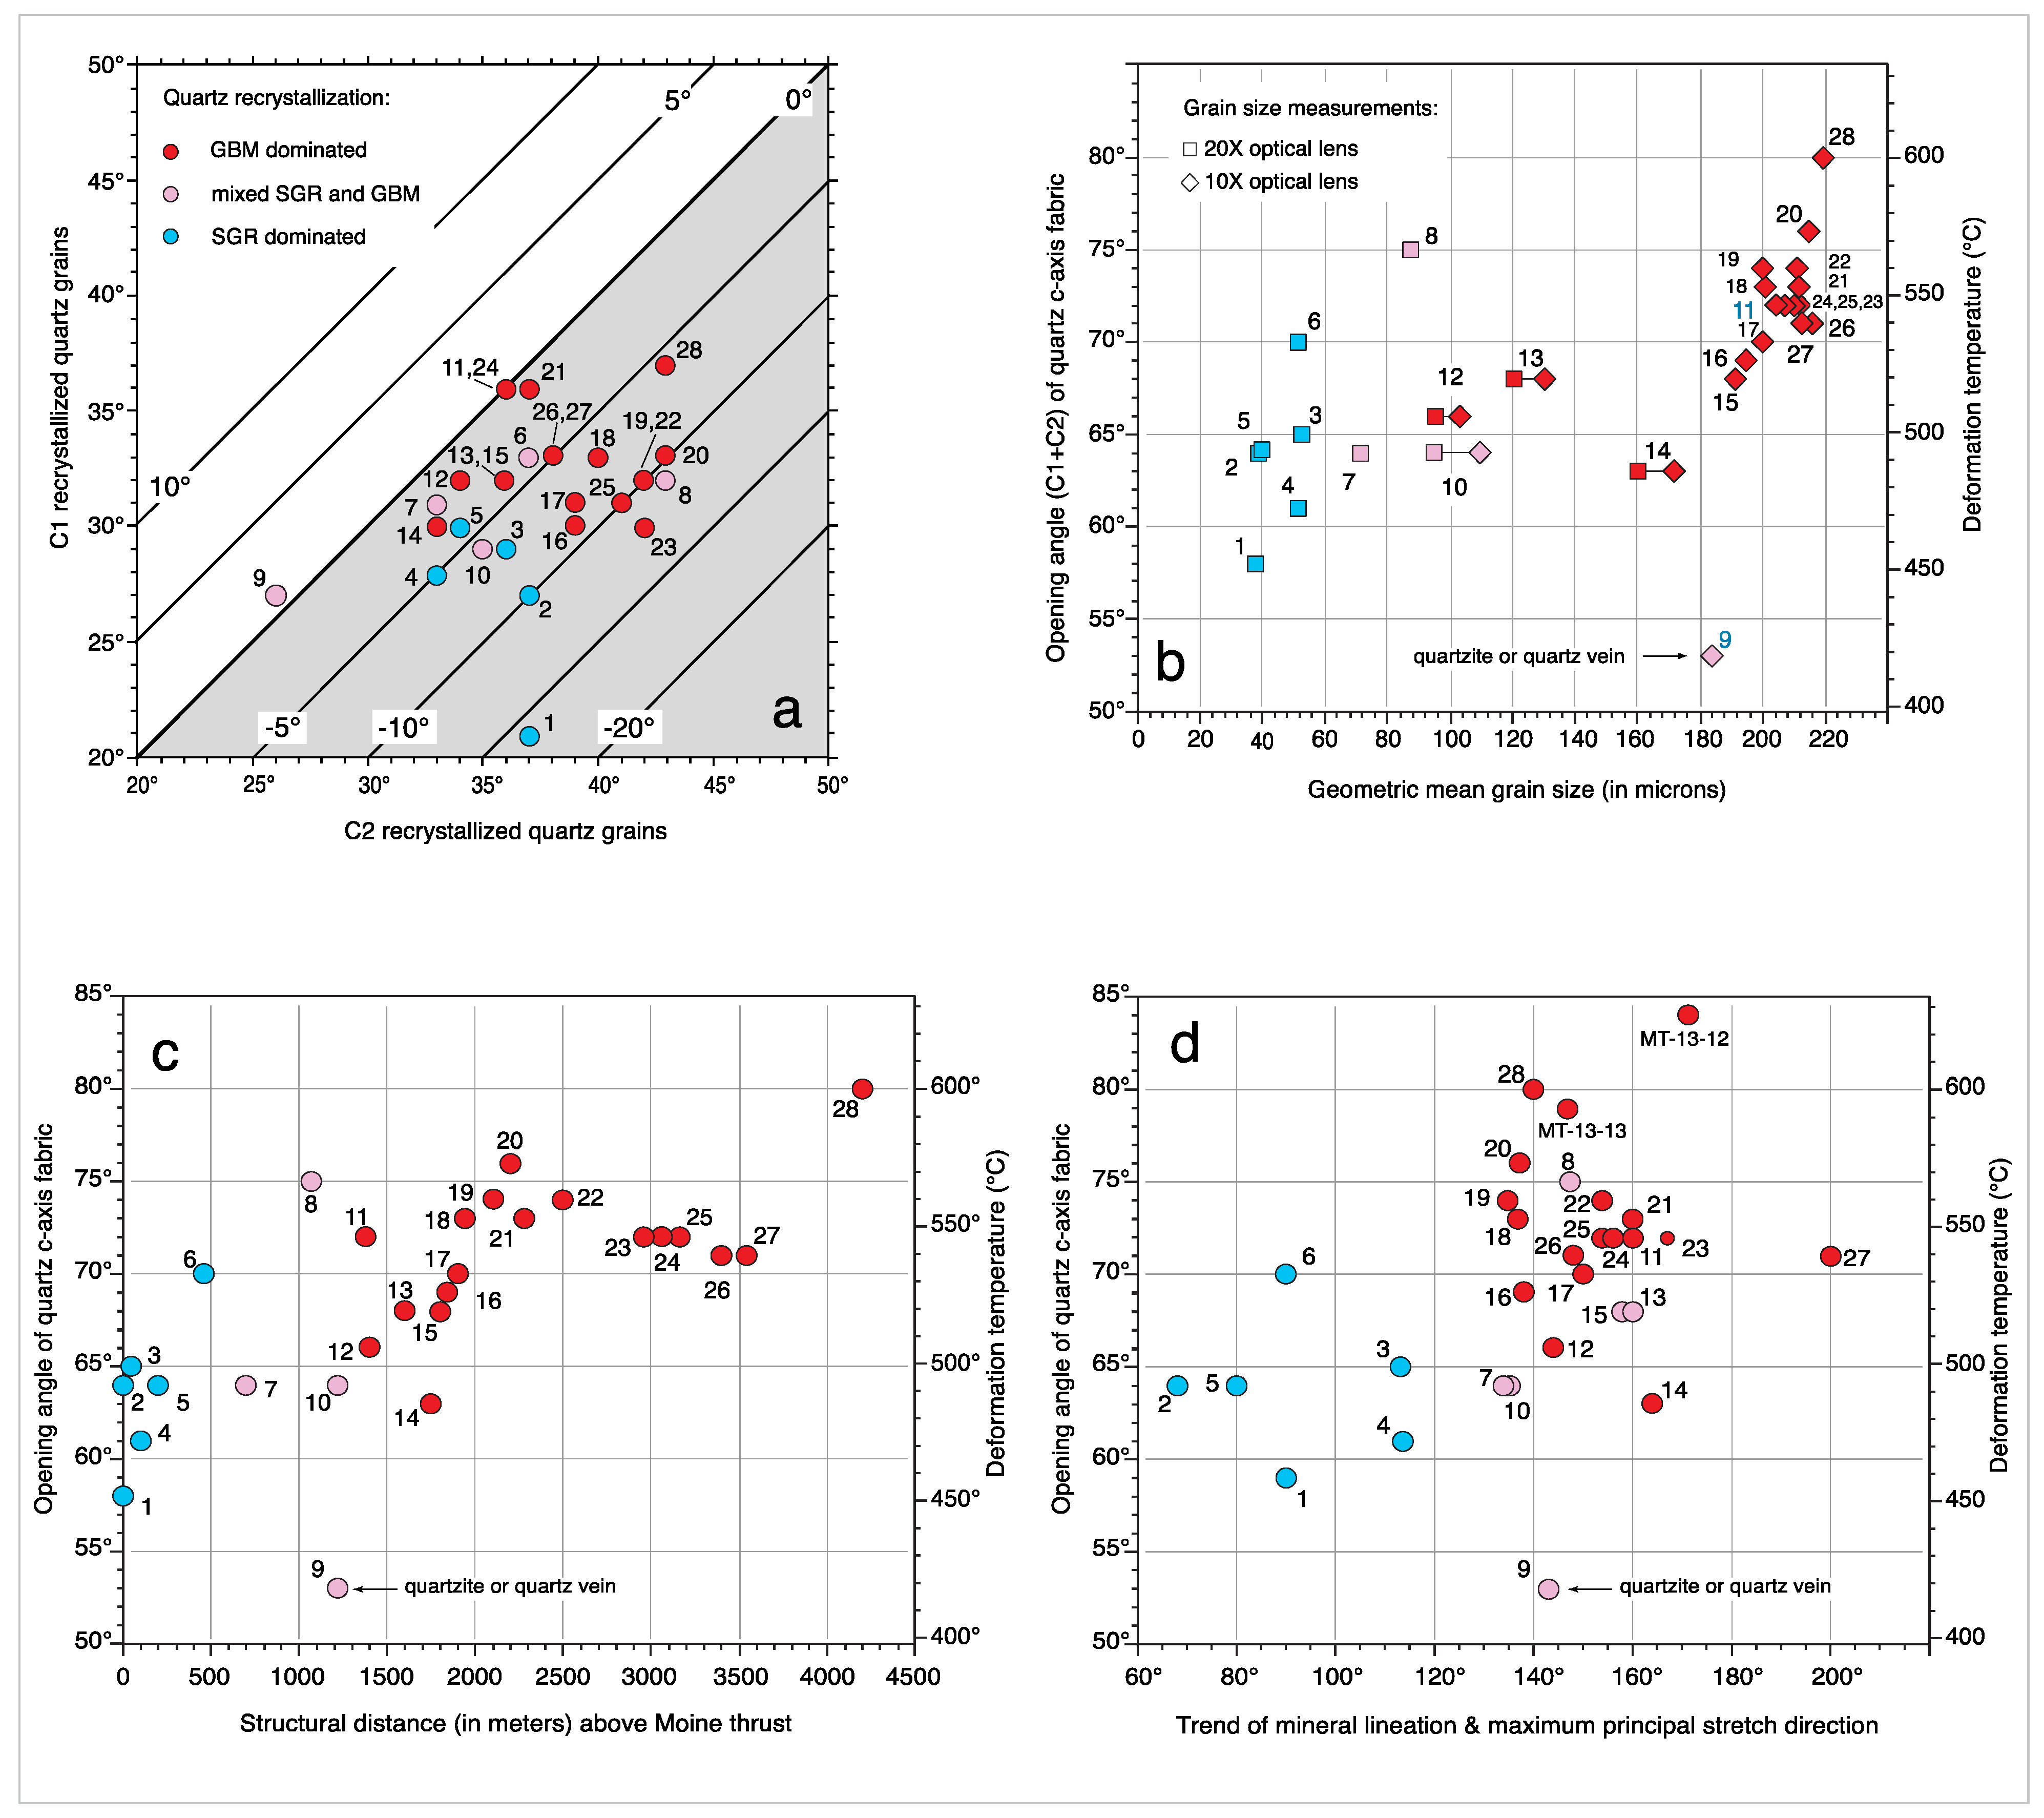
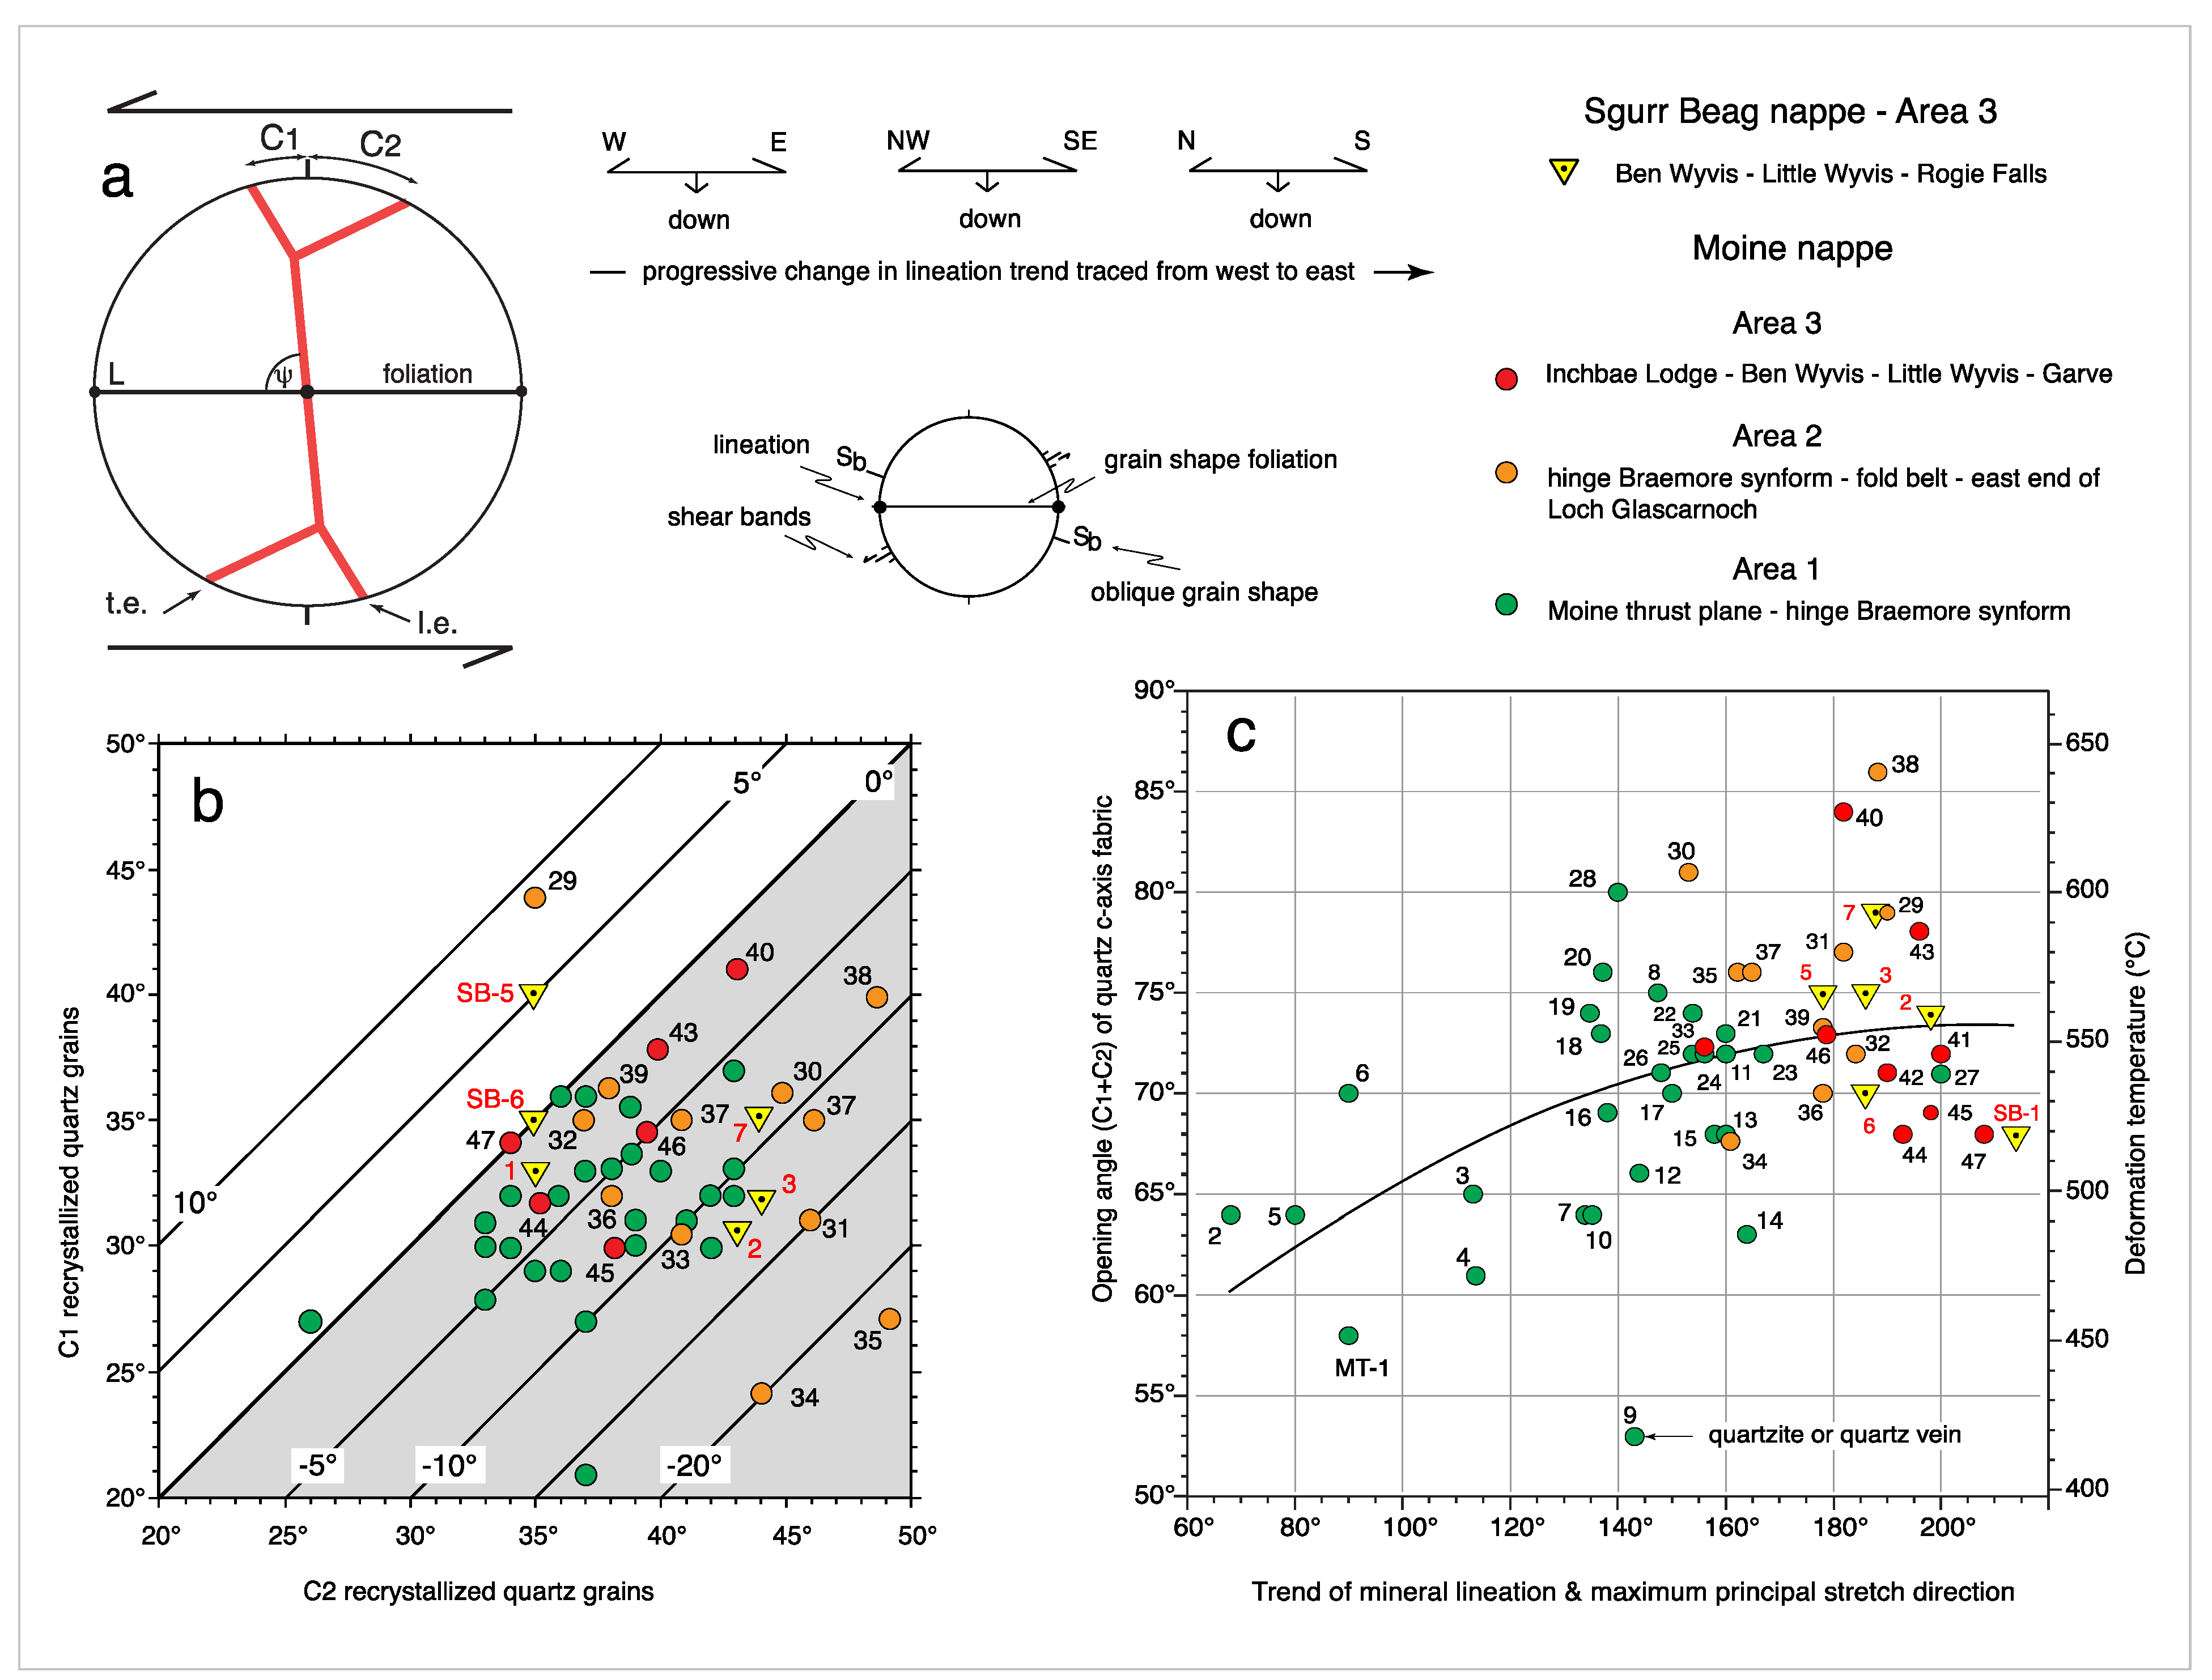
All c-axis fabrics in samples from Area 2 (
Figure 17) are cross girdle fabrics indicating approximately plane strain (k = 1) deformation conditions [
84], although the fabric from MT-34 is transitional between a cross-girdle and a single-girdle fabric. All measured fabrics demonstrate that the N-S trending mineral lineation is parallel to the maximum principal stretch direction (X). Topologically, the fabrics are dominantly Type II [
90] cross-girdle fabrics with the two girdles intersecting in the sample Y direction and creating a Y-axis point maxima of c-axes. Samples MT-32, 33, 35 and 39 have fabrics that are transitional between Type I and II cross-girdles. Fabric opening angles (C1 + C2,
Figure 18a) range between 70° and 86°, suggesting deformation temperatures of ~530–640 °C (
Figure 14c and
Figure 18c) using the linear opening angle thermometer of Faleiros et al., [
82]. This inferred range of deformation temperatures is similar to the broad range of likely temperatures (550–680 °C) indicated by quantitative thermobarometry of metamorphic mineral assemblages in sample MT-PET-1 [
95].
All quartz c-axis fabrics from samples in Area 2 are asymmetric in terms of the differences in angles C1 and C2 make between the foliation pole (Z) and the leading and trailing edges, respectively of the cross-girdle fabrics (
Figure 18a,b). Shear sense interpretation of the C1 versus C2 angles with respect to present day geographic coordinates is complicated by the folding and reorientation of the foliation (but not N-S trending lineation) around the km-scale folds (
Figure 14a and
Figure 19a). However, on restoration of the folded foliation to an assumed originally flat-lying planar configuration the differences between C1 and C2 angles in all samples are consistent with a top to the north shear sense (
Figure 19b). This shear sense interpretation is unequivocally supported by the presence of shear bands/extensional crenulations and oblique alignment (Sb) of elongate dynamically recrystallized quartz grains, including sample MT-29 from the locally overturned and steeply dipping limb of the Braemore Syncline–Beinn Dearg Anticline (
Figure 14a), in which the c-axis fabric and microstructures before unfolding appears to indicate a top to the south shear sense (
Figure 17).
6. Area 3: Inchbae Lodge—Rogie Falls
In Area 3 both the structurally upper part of the Moine thrust sheet and lower part of the overlying Sgurr Beag thrust sheet are exposed and are defined by stratigraphic units belonging to the upper part of the Morar Group and the lower part of the Glenfinnan Group, respectively (
Figure 20). A thin (80–100 m) 1 km long sliver of highly sheared Lewisian (Archaean) orthogneiss (too small to be shown on
Figure 20) is present at the base of the Glenfinnan Group rocks defining the local position of the underlying Sgurr Beag thrust [
105,
119,
120,
121,
122]. The Sgurr Beag thrust and foliations in the area have a general sheet dip of ~30–35° to the SE (
Figure 14a). Area 3 extends from the Inchbae Granite (an extension of the Carn Chuinneag Granite;
Figure 1) in the NW, through the village of Garve and the mountains of Little Wyvis and Ben Wyvis, to Rogie Falls in the SE. A few kilometres further to the SE the high-grade metasedimentary rocks of the Sgurr Beag thrust sheet are unconformably overlain by Devonian sedimentary rocks (
Figure 1).
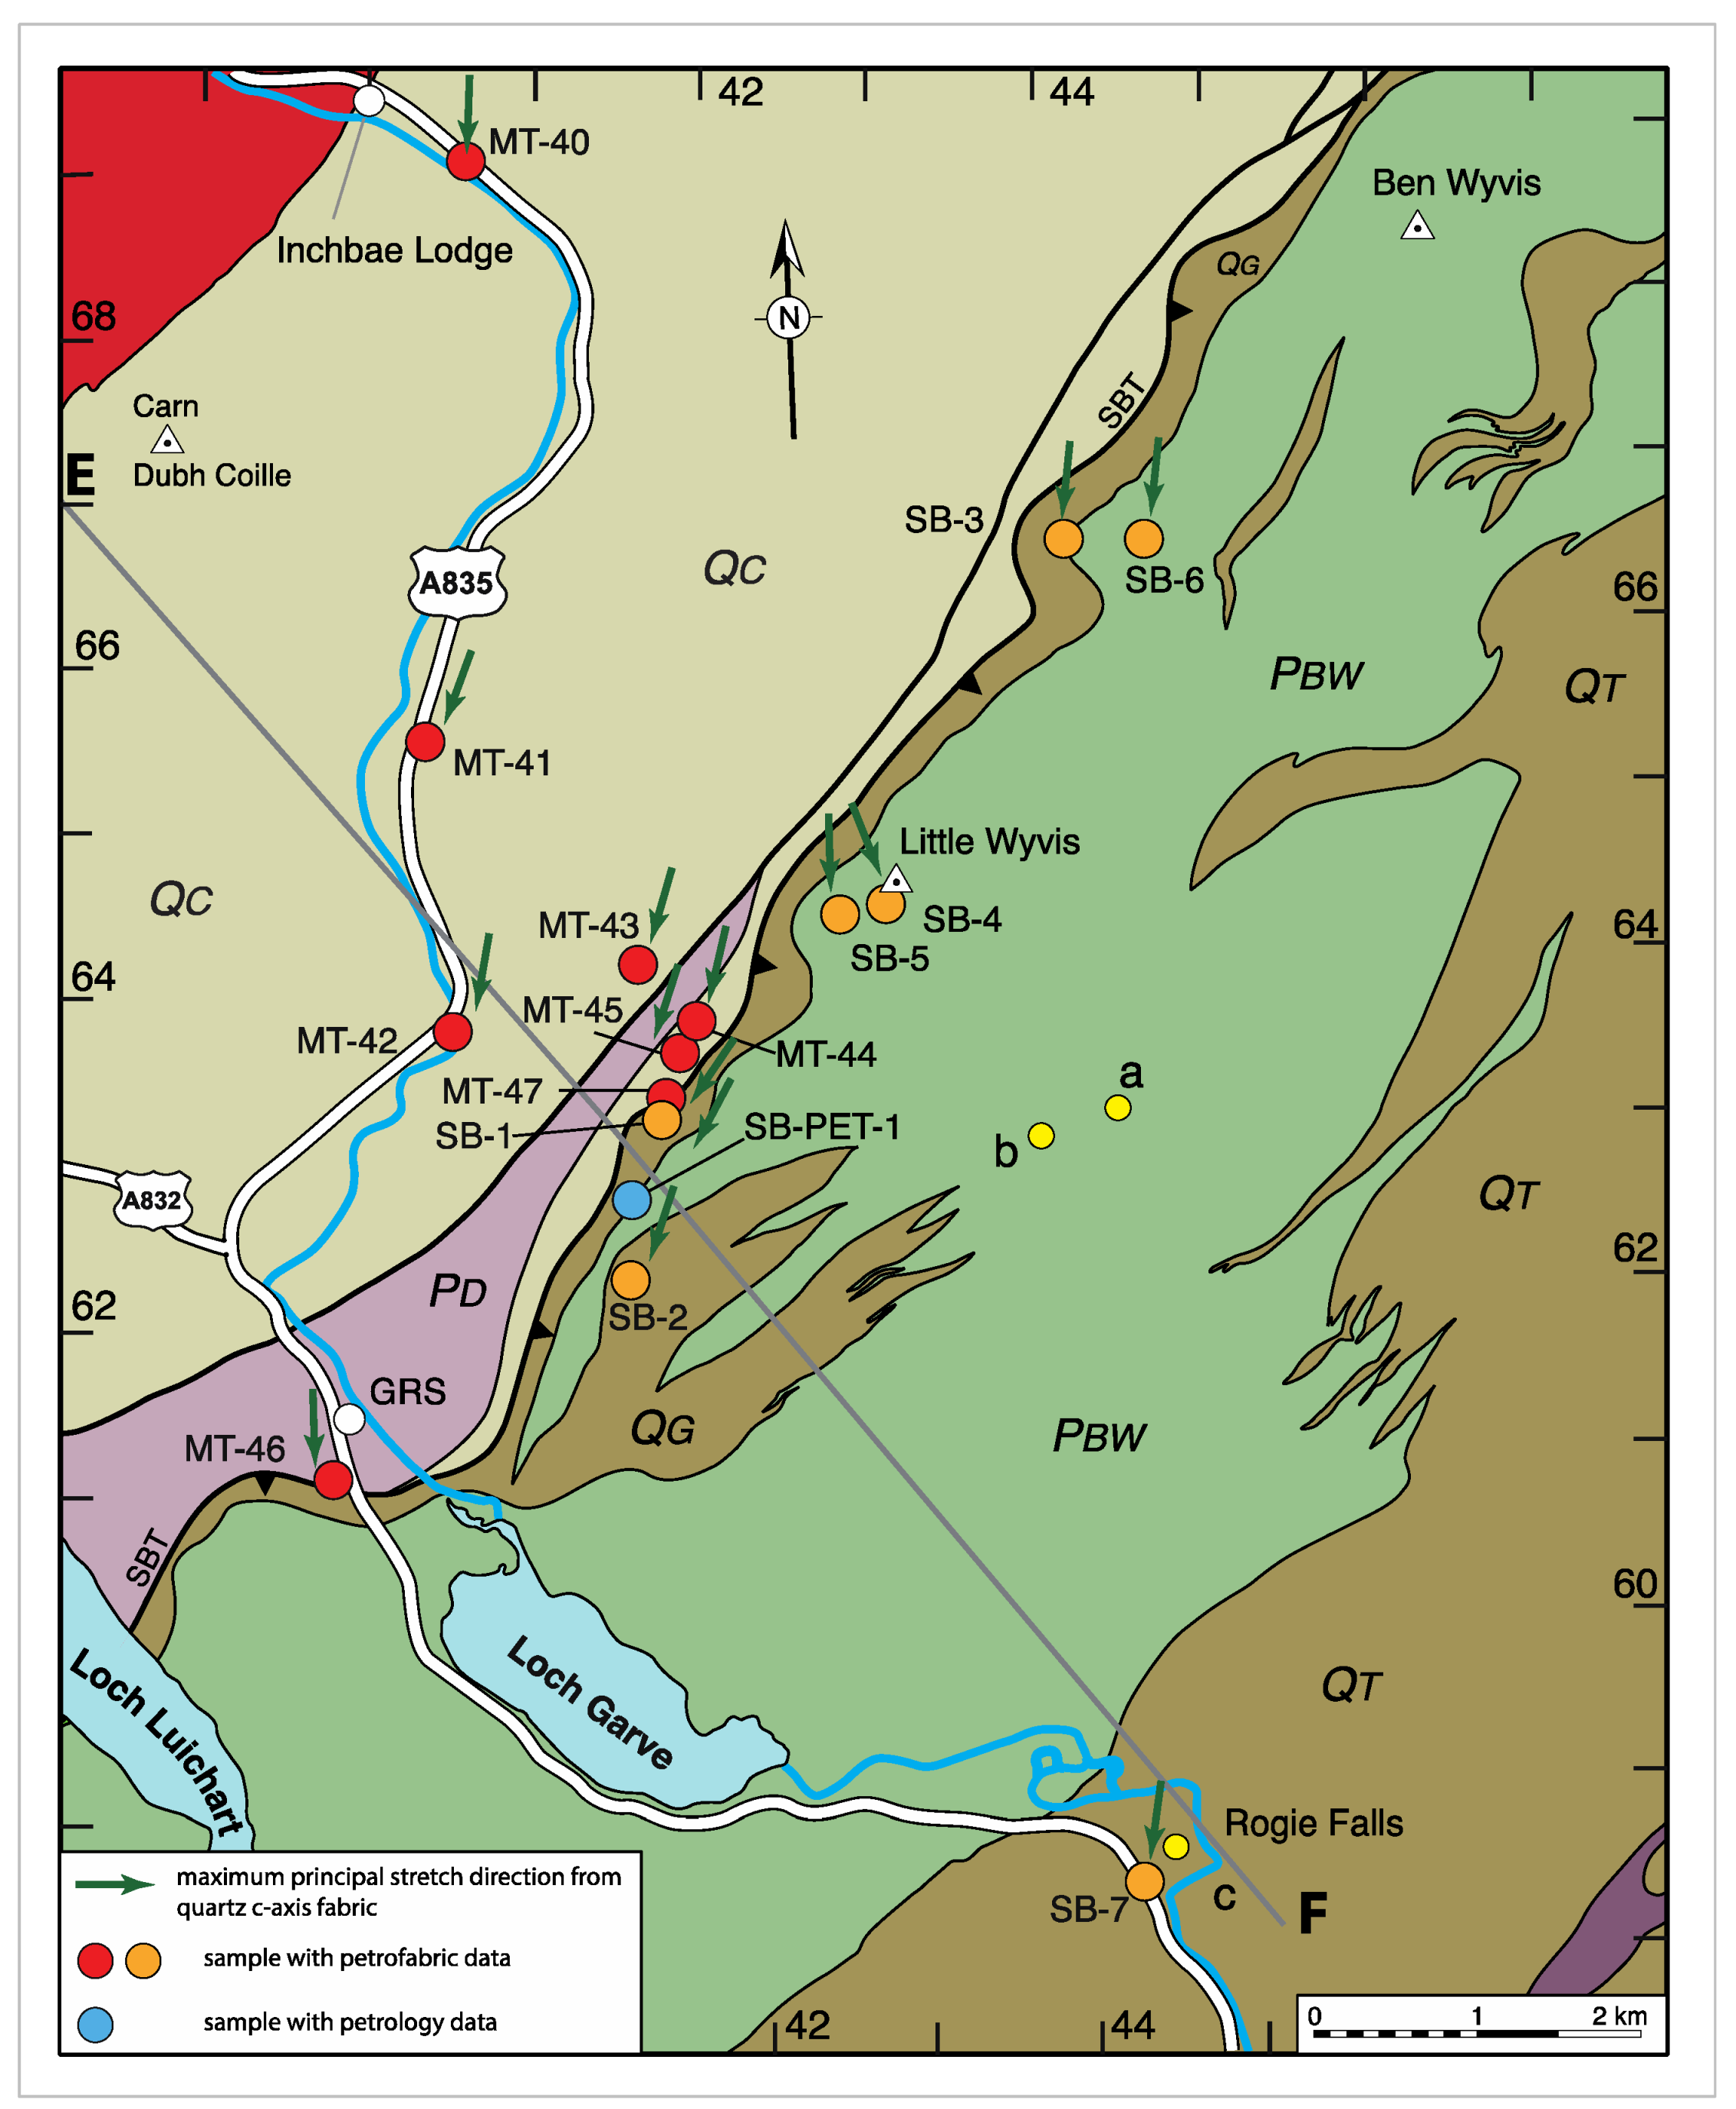
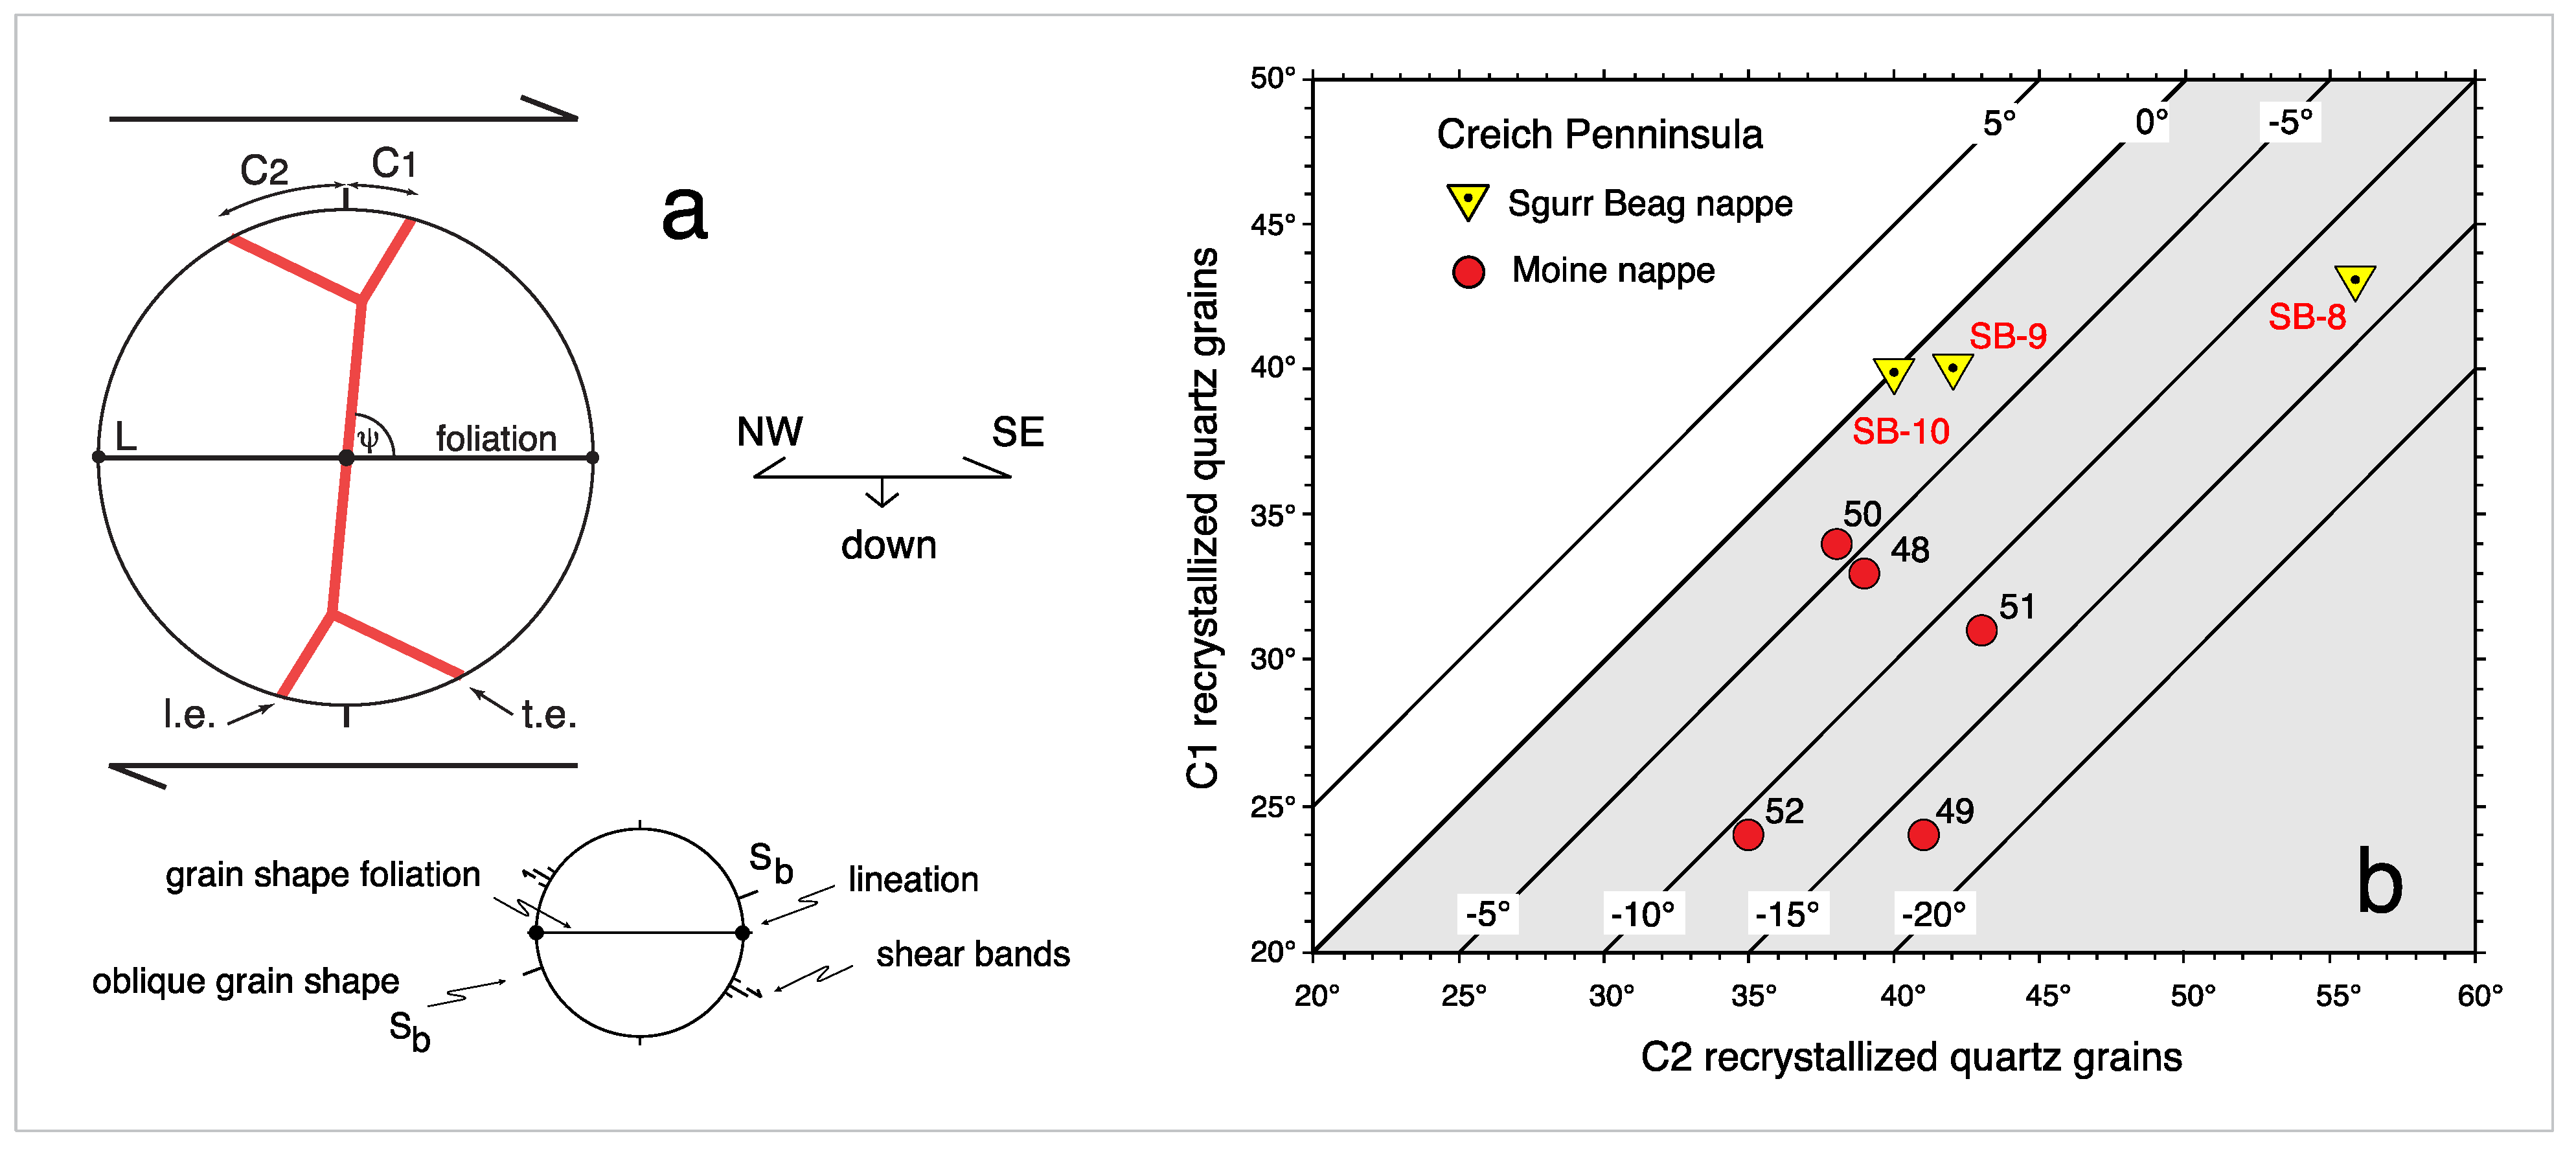
In Area 3, eight oriented samples (MT40 to MT-47) were collected from the Moine thrust sheet, and a further eight samples (SB-1 to SB-7, plus SB-PET-1) were collected in the overlying Sgurr Beag thrust sheet (
Figure 20). Samples are numbered with respect to estimated structural distance below or above the Sgurr Beag thrust, with MT numbers increasing towards the overlying thrust and SB numbers increasing with increasing structural distance above the thrust (
Figure 21). Grain shape foliations in both sets of samples dip gently to moderately towards the SE, while grain shape lineations on foliation (demonstrated by quartz c-axis fabrics to also be maximum principal stretch directions; see below) plunge gently to moderately to the SSW, with a vector average plunge and trend of 23° towards 190° (
Figure 5d). No significant differences in orientation of either foliation or lineation between samples from the two thrust sheets were found (
Figure 5d and
Figure 21a).
Microstructures from the footwall and hanging wall of the Sgurr Beag thrust located to the SW of Little Wyvis in our Area 3 have previously been described by Rathbone and Harris [
120], Grant and Harris [
121] and Mazza et al., [
95]. Quartz c-axis fabrics have also been described from these locations by Grant and Harris [
121] and Mazza et al., [
95]. In our current study we have incorporated the samples described by Mazza et al., [
95] adjacent to the Sgurr Beag thrust (relabeled as MT-44, 45, 47, SB-1, 2 and SB-PET-1) into our larger scale study of the Moine and Sgurr Beag thrust sheets in Area 3. To ensure continuity with petrofabric analyses reported in our current study, quartz c-axis fabrics were remeasured in the five samples originally described by Mazza et al., [
95] and structural distances below/above the Sgurr Beag thrust were recalculated. The precise locations of the three samples described by Rathbone and Harris [
120] at 450, 170 and 5 m below the inferred position of the Sgurr Beag thrust were not given. Samples described by Grant and Harris [
121] at 200 m below the thrust to a few metres above the thrust are from a linear transect coinciding with our samples MT-44 to SB-1 (
Figure 20). In general, our current study confirms and expands upon these earlier studies.
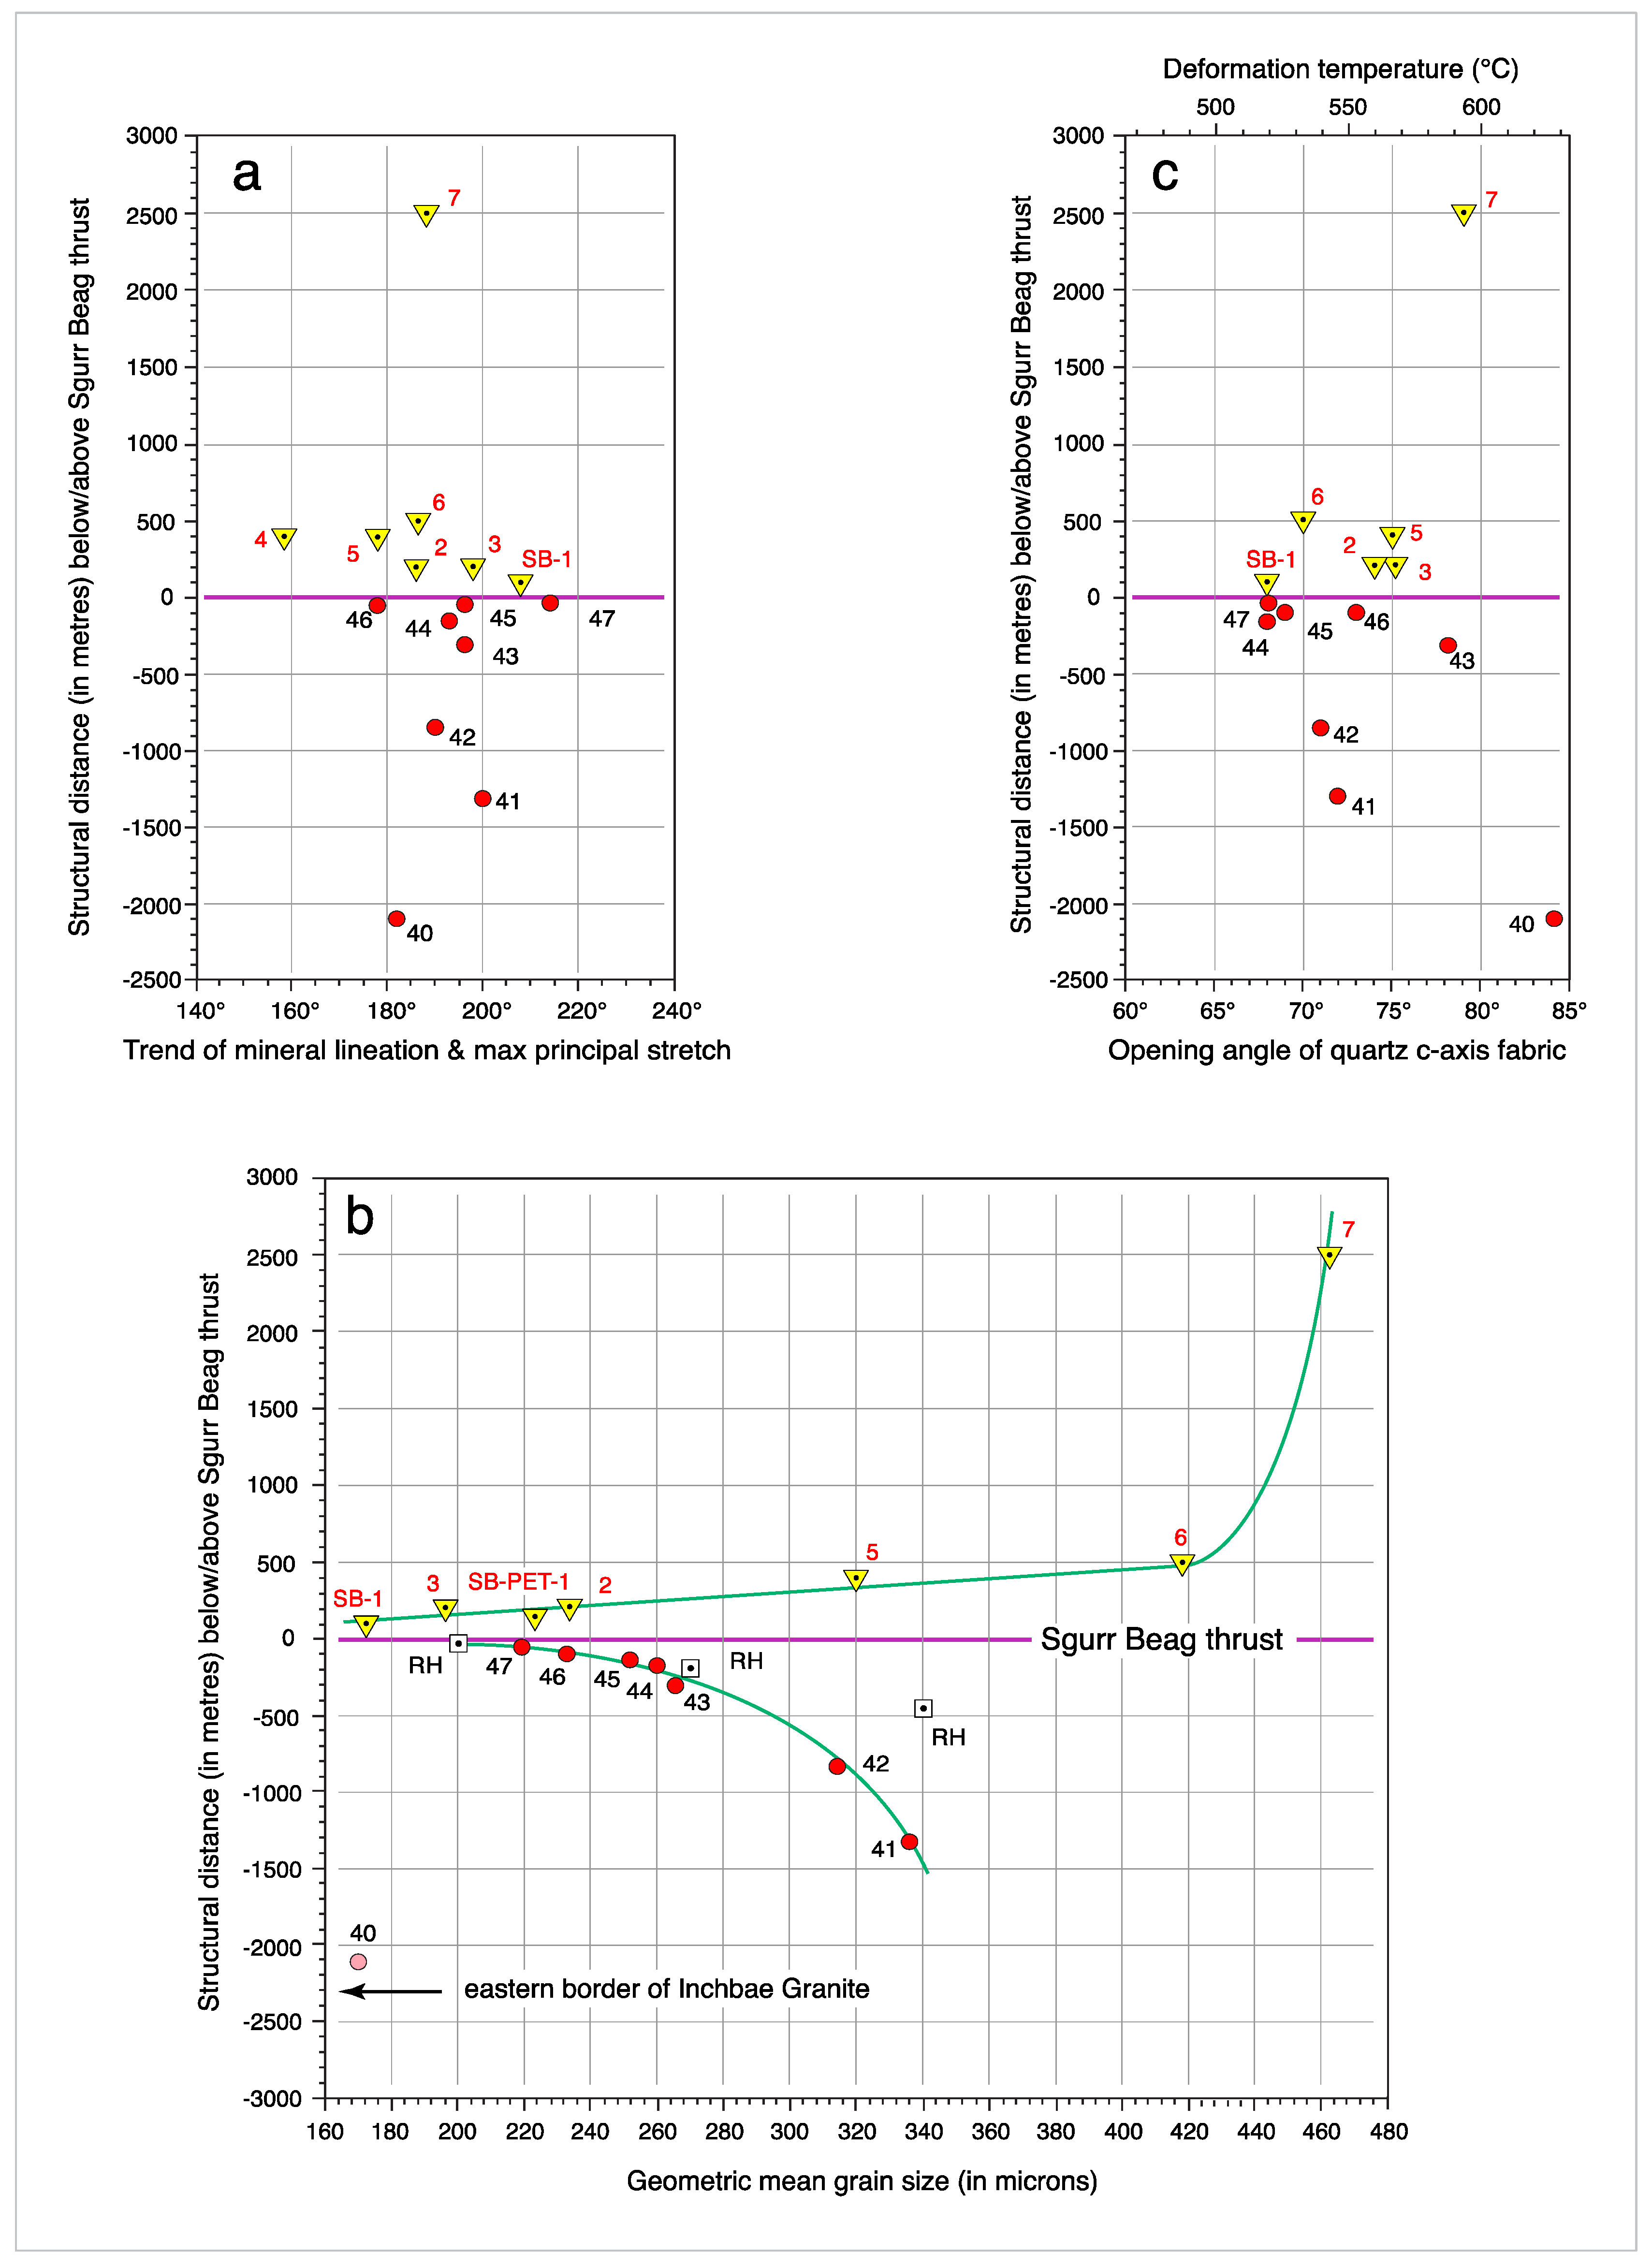
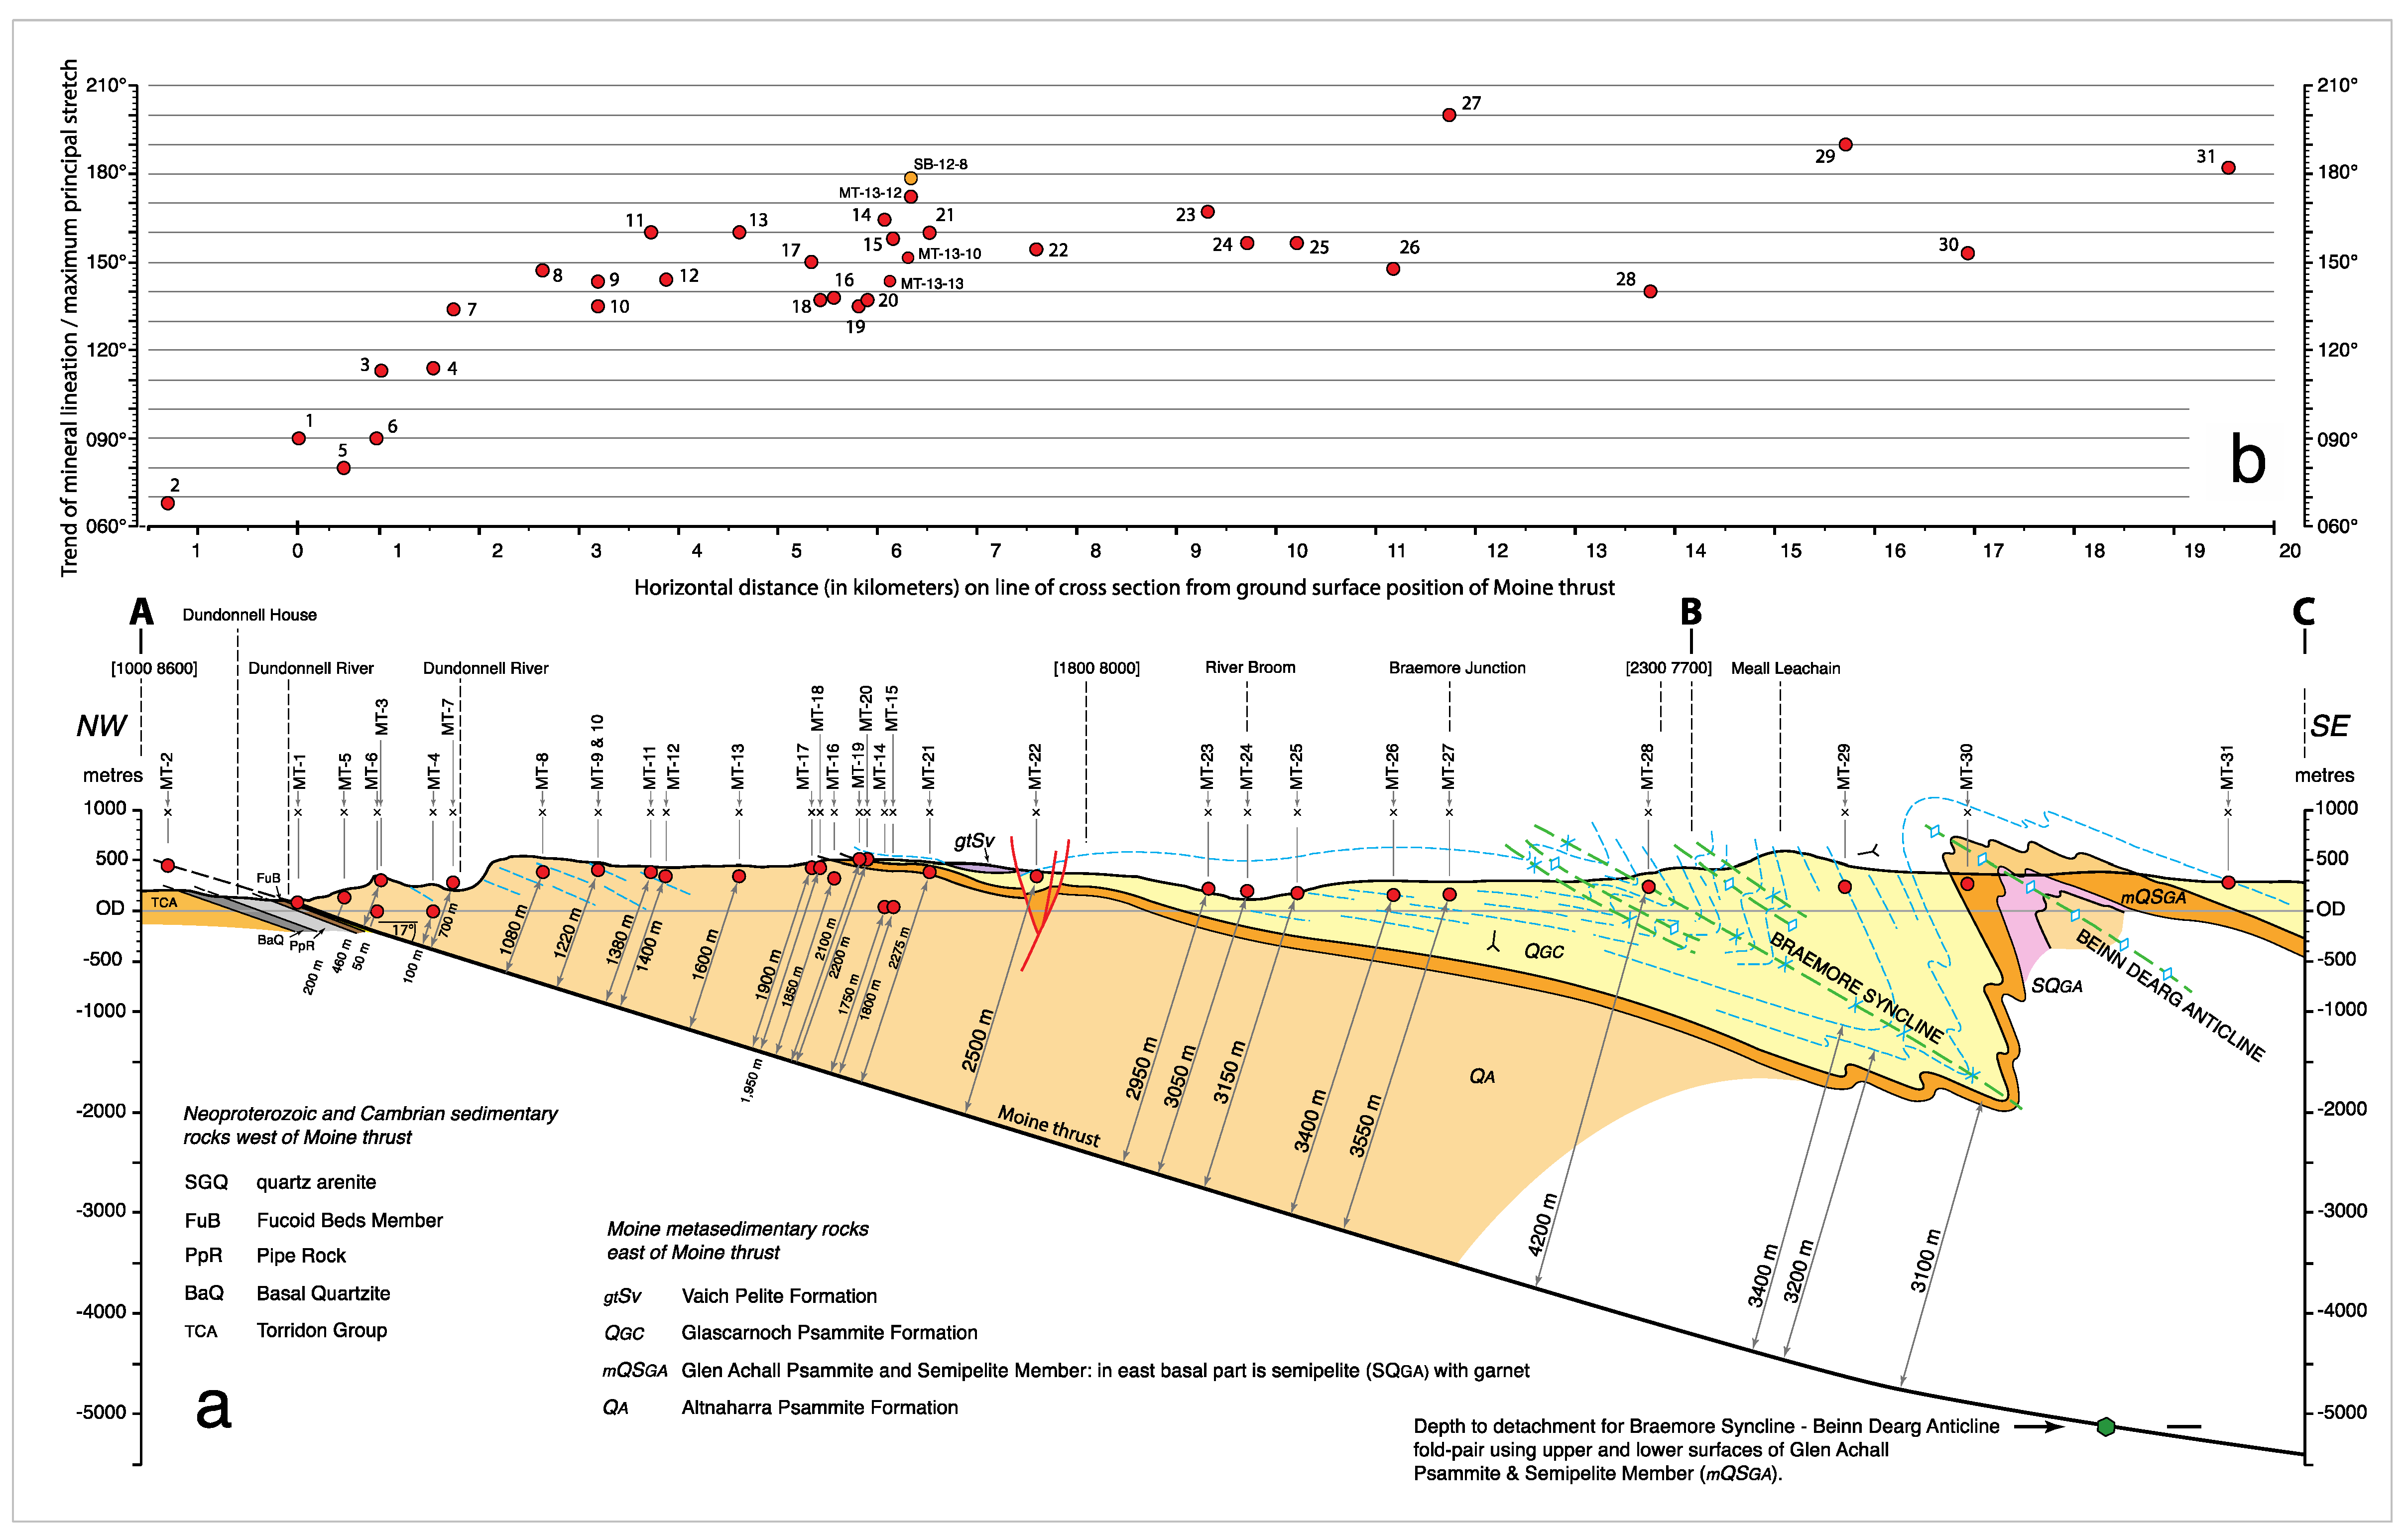
Figure 21.
Relationships in Area 3 samples between structural distance below/above the Sgurr Beag thrust and: (
a) Trend of mineral lineation/maximum principal stretch direction indicated by quartz c-axis fabrics; (
b) Geometric mean recrystallized quartz grain size; (
c) Quartz c-axis fabric opening angles (C1 + C2) and deformation temperatures inferred from opening angle (using linear calibration of Faleiros et al., [
82]). In (
b) note decrease in recrystallized grain size approaching mapped position of Sgurr Beag thrust in both footwall and hanging wall; trends of changing grain size in footwall and hanging wall shown schematically by green curves; RH—arithmetic recrystallized quartz grain sizes estimated by Rathbone and Harris [
120] at 450, 170 and 5 m beneath base of sheared Lewisian gneiss and taken to mark position of Sgurr Beag thrust in area to SW of Little Wyvis; corresponding geometric mean grain sizes are probably approximately 10 microns less than arithmetic mean grain sizes. Note also the anomalously small recrystallized quartz grain size in biotite-rich sample MT-40 adjacent to eastern boundary of Inchbae granite (cf.
Figure 14 and
Figure 19). 10X objective lens used in all grain measurements. Grain size data are summarized in
Supplementary File S2.
![Geosciences 11 00411 g021]()
6.1. Microstructures, Petrography and Geochronology
With one exception (MT-40, see next section) microstructures in all samples from the Moine and Sgurr Beag thrust sheets in Area 3 indicate that both quartz and feldspar have deformed plastically, forming an interlocking mosaic of grains with grain-scale sinuous/lobate grain boundaries that indicate high mobility of feldspar and quartz grain boundaries. Island grains [
73] are observed in some of the particularly quartz-rich samples (e.g., MT-46 and sheared quartz vein SB-4), indicating extreme mobility of quartz grain boundaries.
Quartz grains are usually strain free, but locally exhibit undulose extinction and incipient deformation bands. Both chessboard extinction and highly sinuous grain boundary bulges are also well developed in some, but not all, quartz grains in SB-4. This is presumably related to early high temperature and later much lower temperature deformation, respectively. Orthoclase grains are frequently weathered while adjacent microcline and plagioclase grains remain unaltered. Thin lenticular/tapering deformation twins are frequently present in microcline and plagioclase grains (e.g., MT-47, SB-1, SB-PET-1, SB-3, 6). Ribbon-like feldspar grains and elongate garnet grains sandwiched between foliation-parallel white mica and biotite laths in samples MT-43 and 46 likely indicate that high temperature dissolution processes may be locally important in forming grain shape fabrics. Widely varying amounts of white mica and biotite are recorded in the different samples. In some samples two generations of white mica are present (e.g., MT-46 and SB-7) with smaller lath-like grains defining the grain shape foliation, while larger more equant grains apparently overprint the grain shape foliation. Biotite remains fresh and highly pleochroic with fox-red colour in most samples but is chloritized in SB-1 located immediately above the Sgurr Beag thrust in a lens-shaped unit of sheared Lewisian gneiss [
120,
121]. Anhedral garnet is present in more pelitic samples from the uppermost part of the Moine thrust sheet (MT-42, MT-43), while euhedral garnet is present in the Sgurr Beag thrust sheet (SB-PET-1, SB-2 to SB-6); see Ashley et al., [
75], their
Figure 4.
Recrystallized quartz grain size decreases towards the Sgurr Beag thrust in both the footwall and hanging wall (
Figure 21b). Similar trends in recrystallized feldspar grain sizes were also observed but have not been quantified. In the hanging wall, the geometric mean grain size of recrystallized quartz decreases from 460 microns at 2500 m above the thrust (SB-7) to 170 microns at ~100 m above the thrust (SB-1, sheared Lewisian gneiss), with most of the grain size reduction occurring at <500 m above the thrust. In the footwall psammites, recrystallized quartz grain size decreases from 420 microns at 1300 m beneath the thrust (MT-41) to 220 microns at 25 m beneath the thrust (MT-47). It should be emphasized that in both the hanging wall and footwall this reduction in grain size of quartz (and feldspar) occurs entirely within the regime of grain boundary migration (GBM) recrystallization, although subgrain development is also locally observed in both minerals.
In the Moine thrust sheet to the SW of Little Wyvis (
Figure 20), Rathbone and Harris [
120] reported average recrystallized quartz grain sizes of 340, 270 and 200 microns at 450, 170 and 5 m, respectively, below the base of the sliver of sheared Lewisian taken to mark the position of the Sgurr Beag thrust (
Figure 20. This reduction in grain size was interpreted as indicating an increase in strain approaching the overlying thrust, with deformation microstructures associated with thrusting being preserved due to the absence of high-grade metamorphism after motion on the Sgurr Beag thrust ceased [
119,
120,
126].
Most samples from Area 3 lack the necessary metamorphic indicator minerals for quantitative PT analyses. However, sample SB-PET-1 from the Sgurr Beag thrust sheet at ~150 m above the thrust (
Figure 20) contains the assemblage (muscovite + quartz + plagioclase + biotite + garnet + monazite + xenotime) allowing Mazza et al., [
95] to calculate temperature and minimum pressure values of 595–625 °C and 5.6–7.7 kbar, respectively, for this sample (referred to as SB-12-03A by Mazza et al., [
95]), based on pseudosection modeling, and 590 ± 50 °C based on garnet-biotite thermometry.
LA ICPMS geochronology of monazite consistently found in garnet rims, and xenotime consistently found in garnet cores, in this sample both yield exclusively Precambrian (~800–550 Ma) ages, implying significant garnet growth and metamorphism during Knoydartian events; precise timing constraints remain elusive due to Pb-loss or recrystallization [
16,
95,
127]. The Precambrian ages from monazite and xenotime included within garnet, which would also indicate a Precambrian age for garnet core/rim growth based on microstructural relationships, do not provide any direct information on formation of the penetrative grain shape fabric that anastomoses around these garnet grains. PT conditions estimated by Mazza et al., [
95] for SB-PET-1 would of course only relate to formation of the grain shape fabric if chemical re-equilibration of the indicator minerals used had occurred during foliation formation.
Long and Lambert [
123] carried out pioneering Rb-Sr isotopic analyses of large muscovite books in the Carn Gorm pegmatite located 3 km to the east of SB-PET-1 in the Sgurr Beag thrust sheet (
Figure 20, location a), obtaining Precambrian (~750–660 Ma) ages upon which the concept of the Knoydartian orogenic event was, at least in part, originally proposed. Van Breeman et al., [
124] carried out more detailed Rb-Sr analyses on muscovites in the pegmatite, obtaining ages of ~700–800 Ma and showing that the oldest ages were obtained from the centers of the muscovite books with younger ages towards the margins of the books. Mineral layering in the Carn Gorm pegmatite trends parallel to foliation in the surrounding country rocks and deformation and recrystallization become stronger towards the pegmatite margins [
122] suggesting that shearing and foliation in the surrounding metasedimentary rocks post-dates formation of the pegmatite [
128]. U-Pb isotopic studies on zircon and monazite by Cawood et al., [
32] in the Carn Gorm pegmatite and adjacent country rocks (
Figure 20, location b) have yielded upper and lower intercept ages of 740 ± 8 Ma and 456 ± 4 Ma, indicating Neoproterozoic (Knoydartian) crystallization of the pegmatite followed by late Ordovician reworking. Two monazite fractions in the surrounding metasedimentary country rock yielded a 454 ± 1 Ma age, potentially indicating the timing of foliation development.
A U-Pb age of 468 ± 7 Ma obtained from euhedral titanite grains in a foliated amphibolite with a S-trending mineral lineation (Mako [
16], p. 119, Mako et al., [
127] their sample SB-G) from Rogie Falls (
Figure 20, location c) may help to bracket the timing of foliation development in the Sgurr Beag thrust sheet in Area 3. This age was interpreted as the crystallization age of the protolith mafic intrusion, so foliation development is younger than ~470 Ma, although it is difficult to unequivocally link this age to fabrics in other samples. Nonetheless, as with the other ages mentioned above, it seems likely that the dominant fabrics in this part of the Sgurr Beag thrust sheet are Grampian or younger.
6.2. Quartz c-Axis Fabrics and Microstructural Shear Sense Indicators
Samples from the Moine and Sgurr Beag thrust sheets in Area 3 are characterized by Type II [
90] cross-girdle quartz c-axis fabrics, with the only exception being sample SB-4, a sheared quartz vein which has a single girdle fabric (
Figure 22). All fabrics are indicative of close to plane strain deformation conditions, and also confirm that the observed S to SSW plunging grain shape lineation in these samples is parallel to the maximum principal finite stretch direction (cf.
Figure 9).
Fabric opening angles (C1 + C2,
Figure 18a) in both the Moine and Sgurr Beag thrust sheets range between 68° and 84°, suggesting deformation temperatures of ~515–645 °C (
Figure 14c and
Figure 21c) using the linear opening angle thermometer of Faleiros et al., [
82]. This inferred range of deformation temperatures is very similar to the range of likely temperatures indicated by quantitative thermobarometry of metamorphic mineral assemblages in sample SB-PET-1 at 150 m above the Sgurr Beag thrust [
95]. Some of the samples with the smallest recrystallized grain sizes close to the thrust (MT-44, 45, 47, SB-1) also have the smallest recorded opening angles (
Figure 21c), but no straight-forward correlation has been established between recrystallized grain size and fabric opening angle.
Sample MT-40, a highly foliated pelite with plastically deformed quartz and felspar grains located at ~2100 m beneath the thrust adjacent to the eastern margin of the Inchbae Granite, is a particular anomaly exhibiting the highest observed fabric opening angle (and hence inferred deformation temperature) but also the smallest recrystallized grain size (geometric mean grain size of 173 microns and ranging between 140 and 200 microns at the 1 standard deviation level). In this intensely foliated and lineated sample quartz and feldspar grains are pinned between biotite and white mica laths.
Of the fifteen fabrics obtained in samples from the Moine and Sgurr Beag thrust sheets in Area 3, thirteen indicate a top to the N shear sense in terms of differences in their C1 and C2 angles (
Figure 18a,b). This shear sense interpretation is strongly supported by the leading edge of the cross-girdle fabrics (and the single girdle fabric in SG-4) being straighter and more clearly defined than the trailing edge in these samples (
Figure 22). A top to the S shear sense is only indicated in SB-5, while the equal C1 and C2 angles in SB-6 would indicate a coaxial pure shear. Microstructural shear sense indicators are rare in these samples. Incipient, poorly defined alignment (Sb) of elongate recrystallized quartz grains in samples MT-42 and SB-6, together with shear bands in MT-43 would indicate a top to the N shear sense, while conjugate shear bands in SB-1 suggest at least a component of bulk pure shear deformation (
Figure 22). Quartz c-axis fabrics measured by Grant and Harris [
121] at 200 m below the Sgurr Beag thrust to a few meters above the thrust on a linear transect coinciding with our samples MT-44 to SB-1 dominantly indicated a top to the N shear sense. Top to the S or pure shear deformation was indicated by several of their fabrics which they interpreted in terms of likely contemporaneous but more complex flow surrounding a ramp on the thrust surface.
6.3. Tectonic Interpretation of Microstructures and Quartz c-Axis Fabrics in Area 3
Integration of our grain size and fabric data measured on the same samples in Area 3 (
Figure 20 and
Figure 22) strongly indicates that top to the N motion on at least this segment of the Sgurr Beag thrust must be contemporaneous with the pervasive regional scale top to the N shearing that we have documented in both the central-upper part of the Moine thrust sheet and the overlying Sgurr Beag thrust sheet in Areas 1–3 along a 55 km (restored length) NW-SE oriented sampling transect between Braemore Junction and Rogie Falls (
Figure 19b). This shearing is likely to have occurred at temperatures of 530–630 °C (
Figure 12b,
Figure 14c and
Figure 21c), with reduction in recrystallized grain size of quartz (and feldspar) presumably reflecting higher stress levels in the immediate hanging wall and footwall of the active Sgurr Beag thrust. Under experimental conditions recrystallized grain size is inversely proportional to stress magnitude, but independent of other variables such as strain magnitude and strain rate [
129,
130]. Nonetheless, numerous inter-related feedback loops probably operate during thrusting at elevated temperatures in the ductile middle crust (approximately middle amphibolite facies conditions) with localized higher stress levels leading to faster strain rates and accumulation of higher strains, as originally proposed for the Sgurr Beag thrust in Area 3 by Rathbone and Harris [
120] and Rathbone et al., [
126].
The age (or likely age range) of this regional top to the N shearing remains to be determined, although numerous previous studies [
113,
114,
115,
116,
117] have demonstrated that foliation/lineation development in the upper part of the Moine thrust sheet must postdate emplacement of the Carn Chuinneag Granite at 594 ± 11 Ma [
118]. In our sample SB-PET-1 from Area 3, ages obtained from monazite and xenotime included within garnet indicate a Precambrian age for garnet core/rim growth based on microstructural relationships [
16,
95], but do not provide any direct information on the age of the younger penetrative grain shape fabric that anastomose around these garnet grains. However, as noted above, U-Pb analysis by Cawood et al., [
32] of two fractions of monazite in the Glenfinnan metasedimentary rocks flanking the Carn Gorm pegmatite 3 km to the east of SB-PET-1 (
Figure 20, location b) yielded a 454 ± 1 Ma age. Similarly, a titanite crystallization age of 468 ± 7 Ma was obtained by Mako [
16] and Mako et al., [
127], their sample SB-G, from a deformed mafic intrusive with a S-trending mineral lineation at Rogie Falls (
Figure 20, location c). These data potentially indicate the at least local timing of foliation/lineation development at higher structural levels in the Sgurr Beag thrust sheet. Thus, at least in Area 3 the Sgurr Beag thrust is likely a Grampian or post-Grampian structure with a northward transport direction.
7. Area 4: Creich Peninsula
Area 4 is located ~30 km along strike to the NE of Area 3 (
Figure 1 and
Figure 2) and contains the most northerly known exposure of the Sgurr Beag thrust separating Morar Group psammites from strongly foliated pelitic schists and gneissose psammites of the Glenfinnan Group [
44,
131]. This small coastal exposure provides a transect across the uppermost 500 m of the Moine thrust sheet and lowermost 270 m of the overlying Sgurr Beag thrust sheet, with lineation plunging to the ESE and SSE, respectively in the two thrust sheets (
Figure 23). An inlier of Lewisianoid gneisses in the Morar psammites in the footwall to the Sgurr Beag thrust may represent either an isoclinal fold core or a sheet of basement rocks that have been interleaved with the Moine cover rocks along a ductile thrust at its base which is referred to by Grant and Harris [
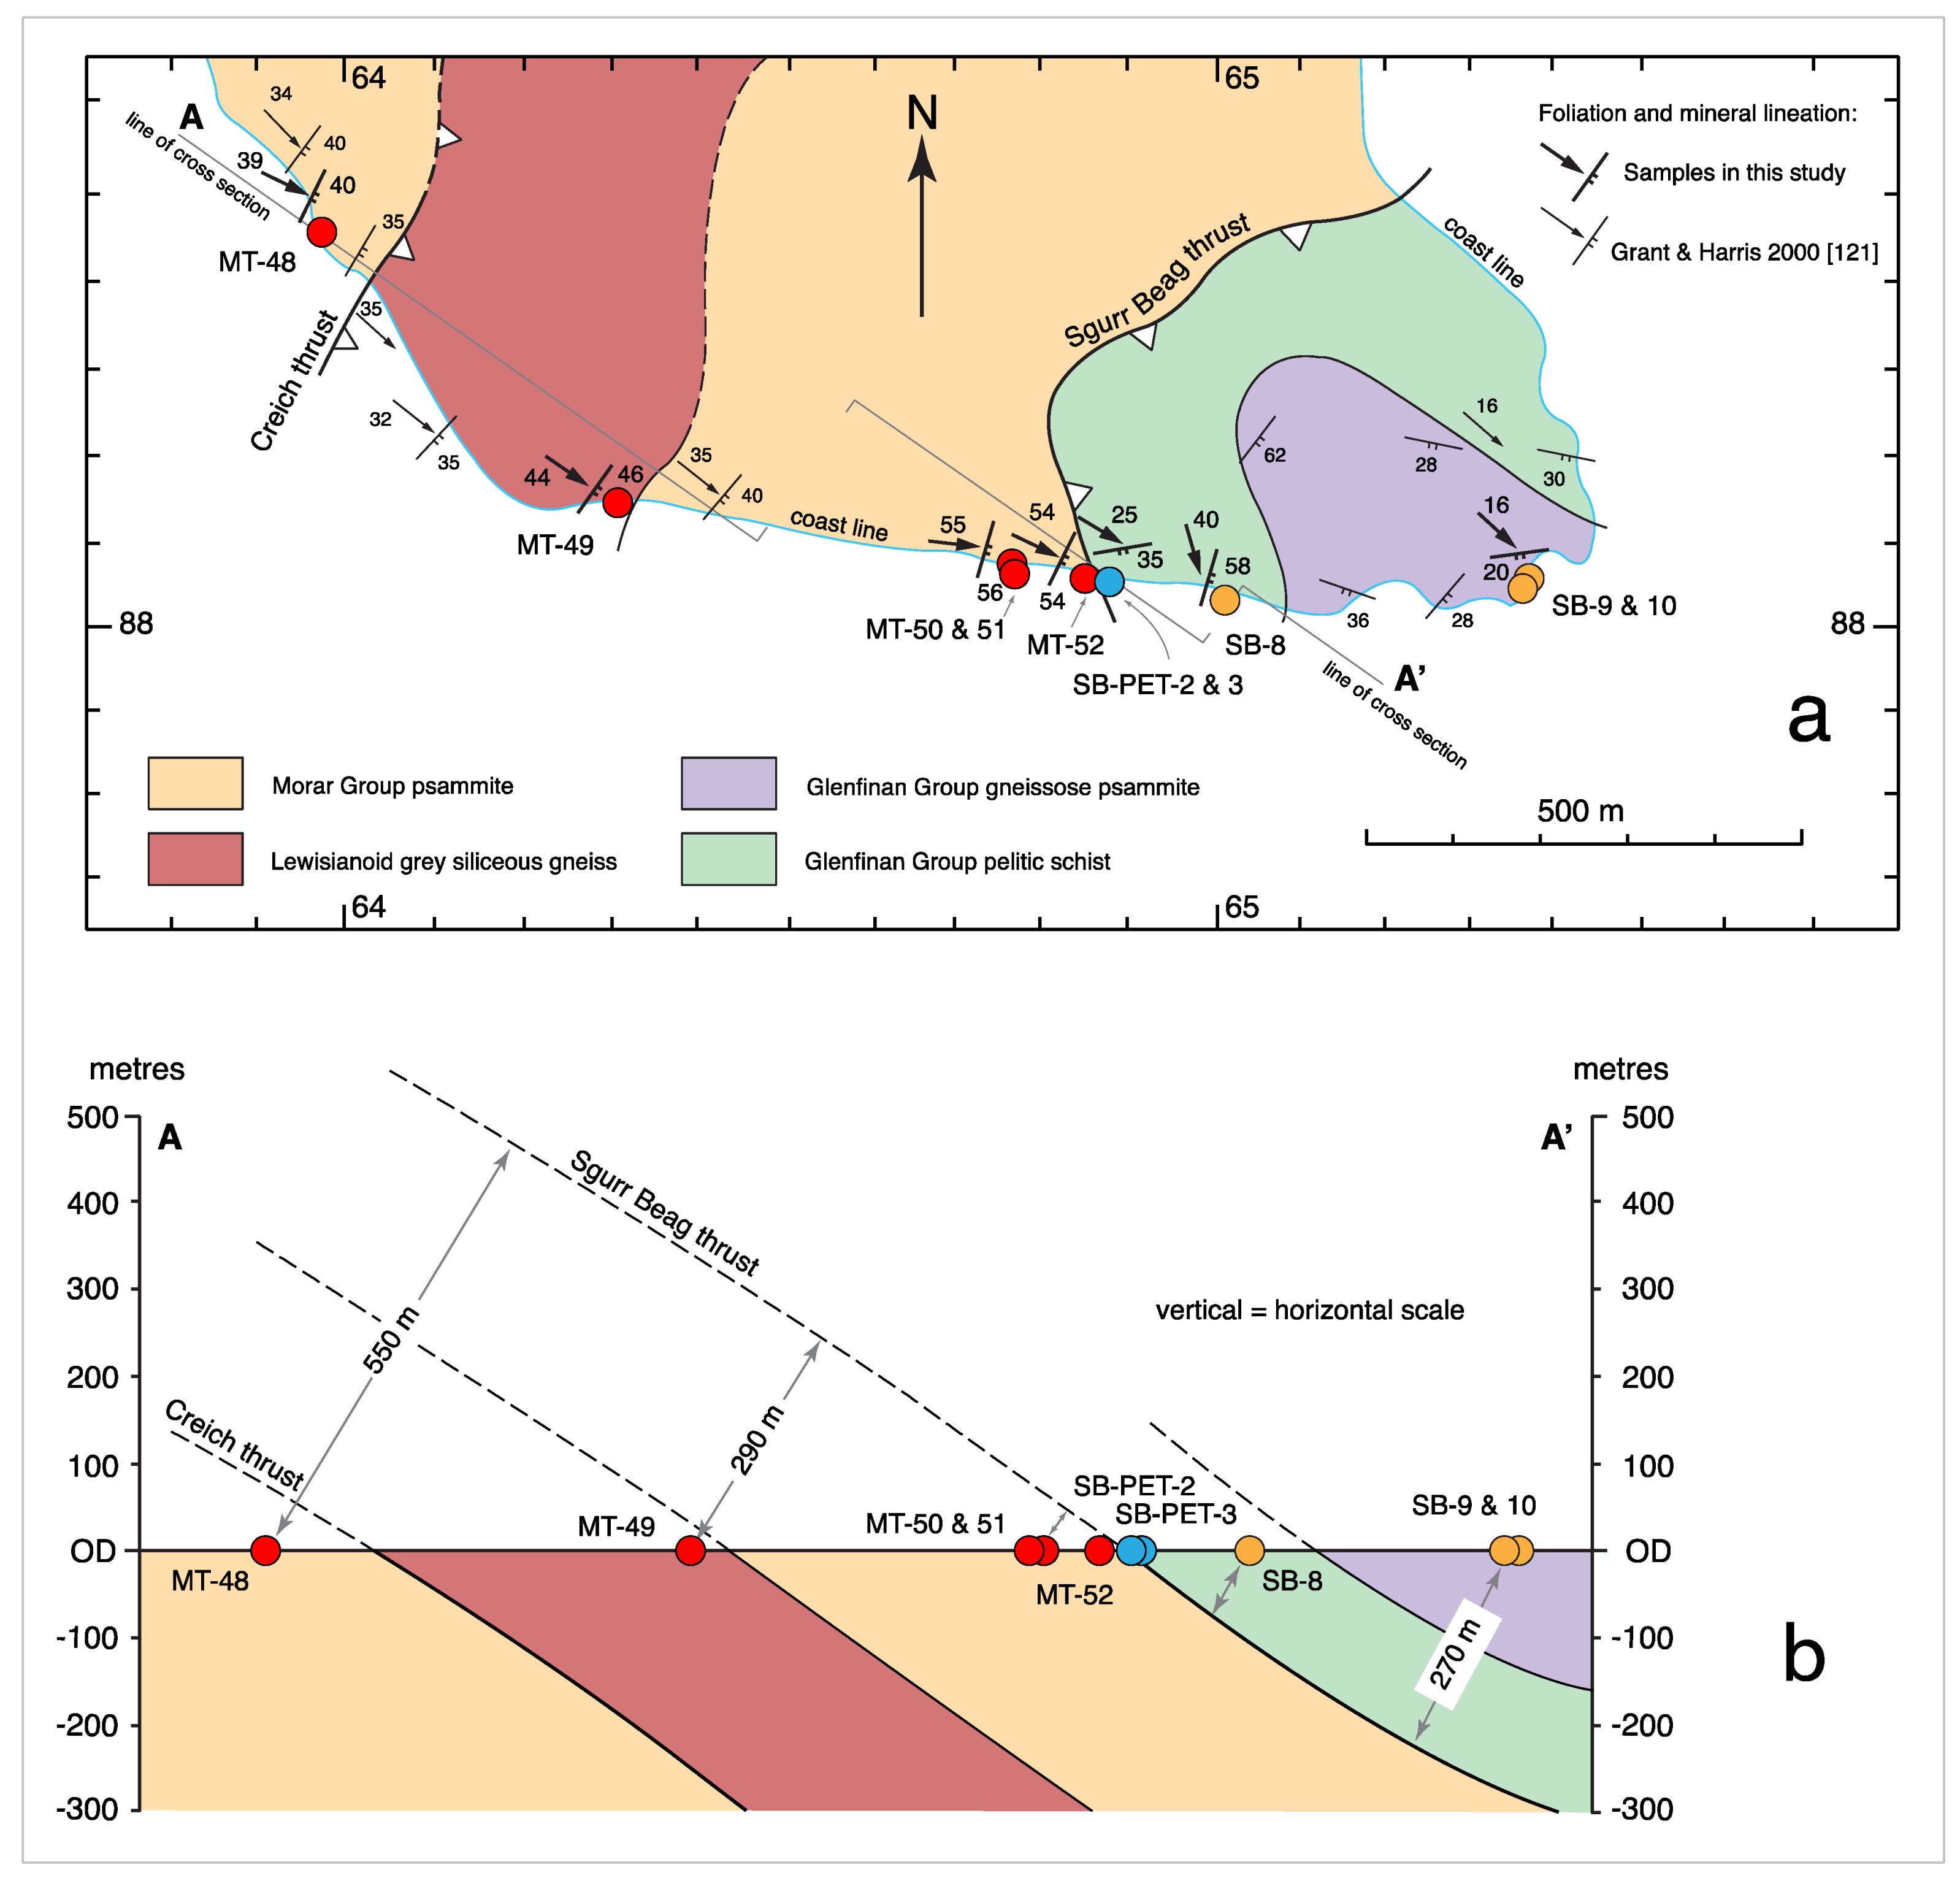
121] as the Creich thrust.
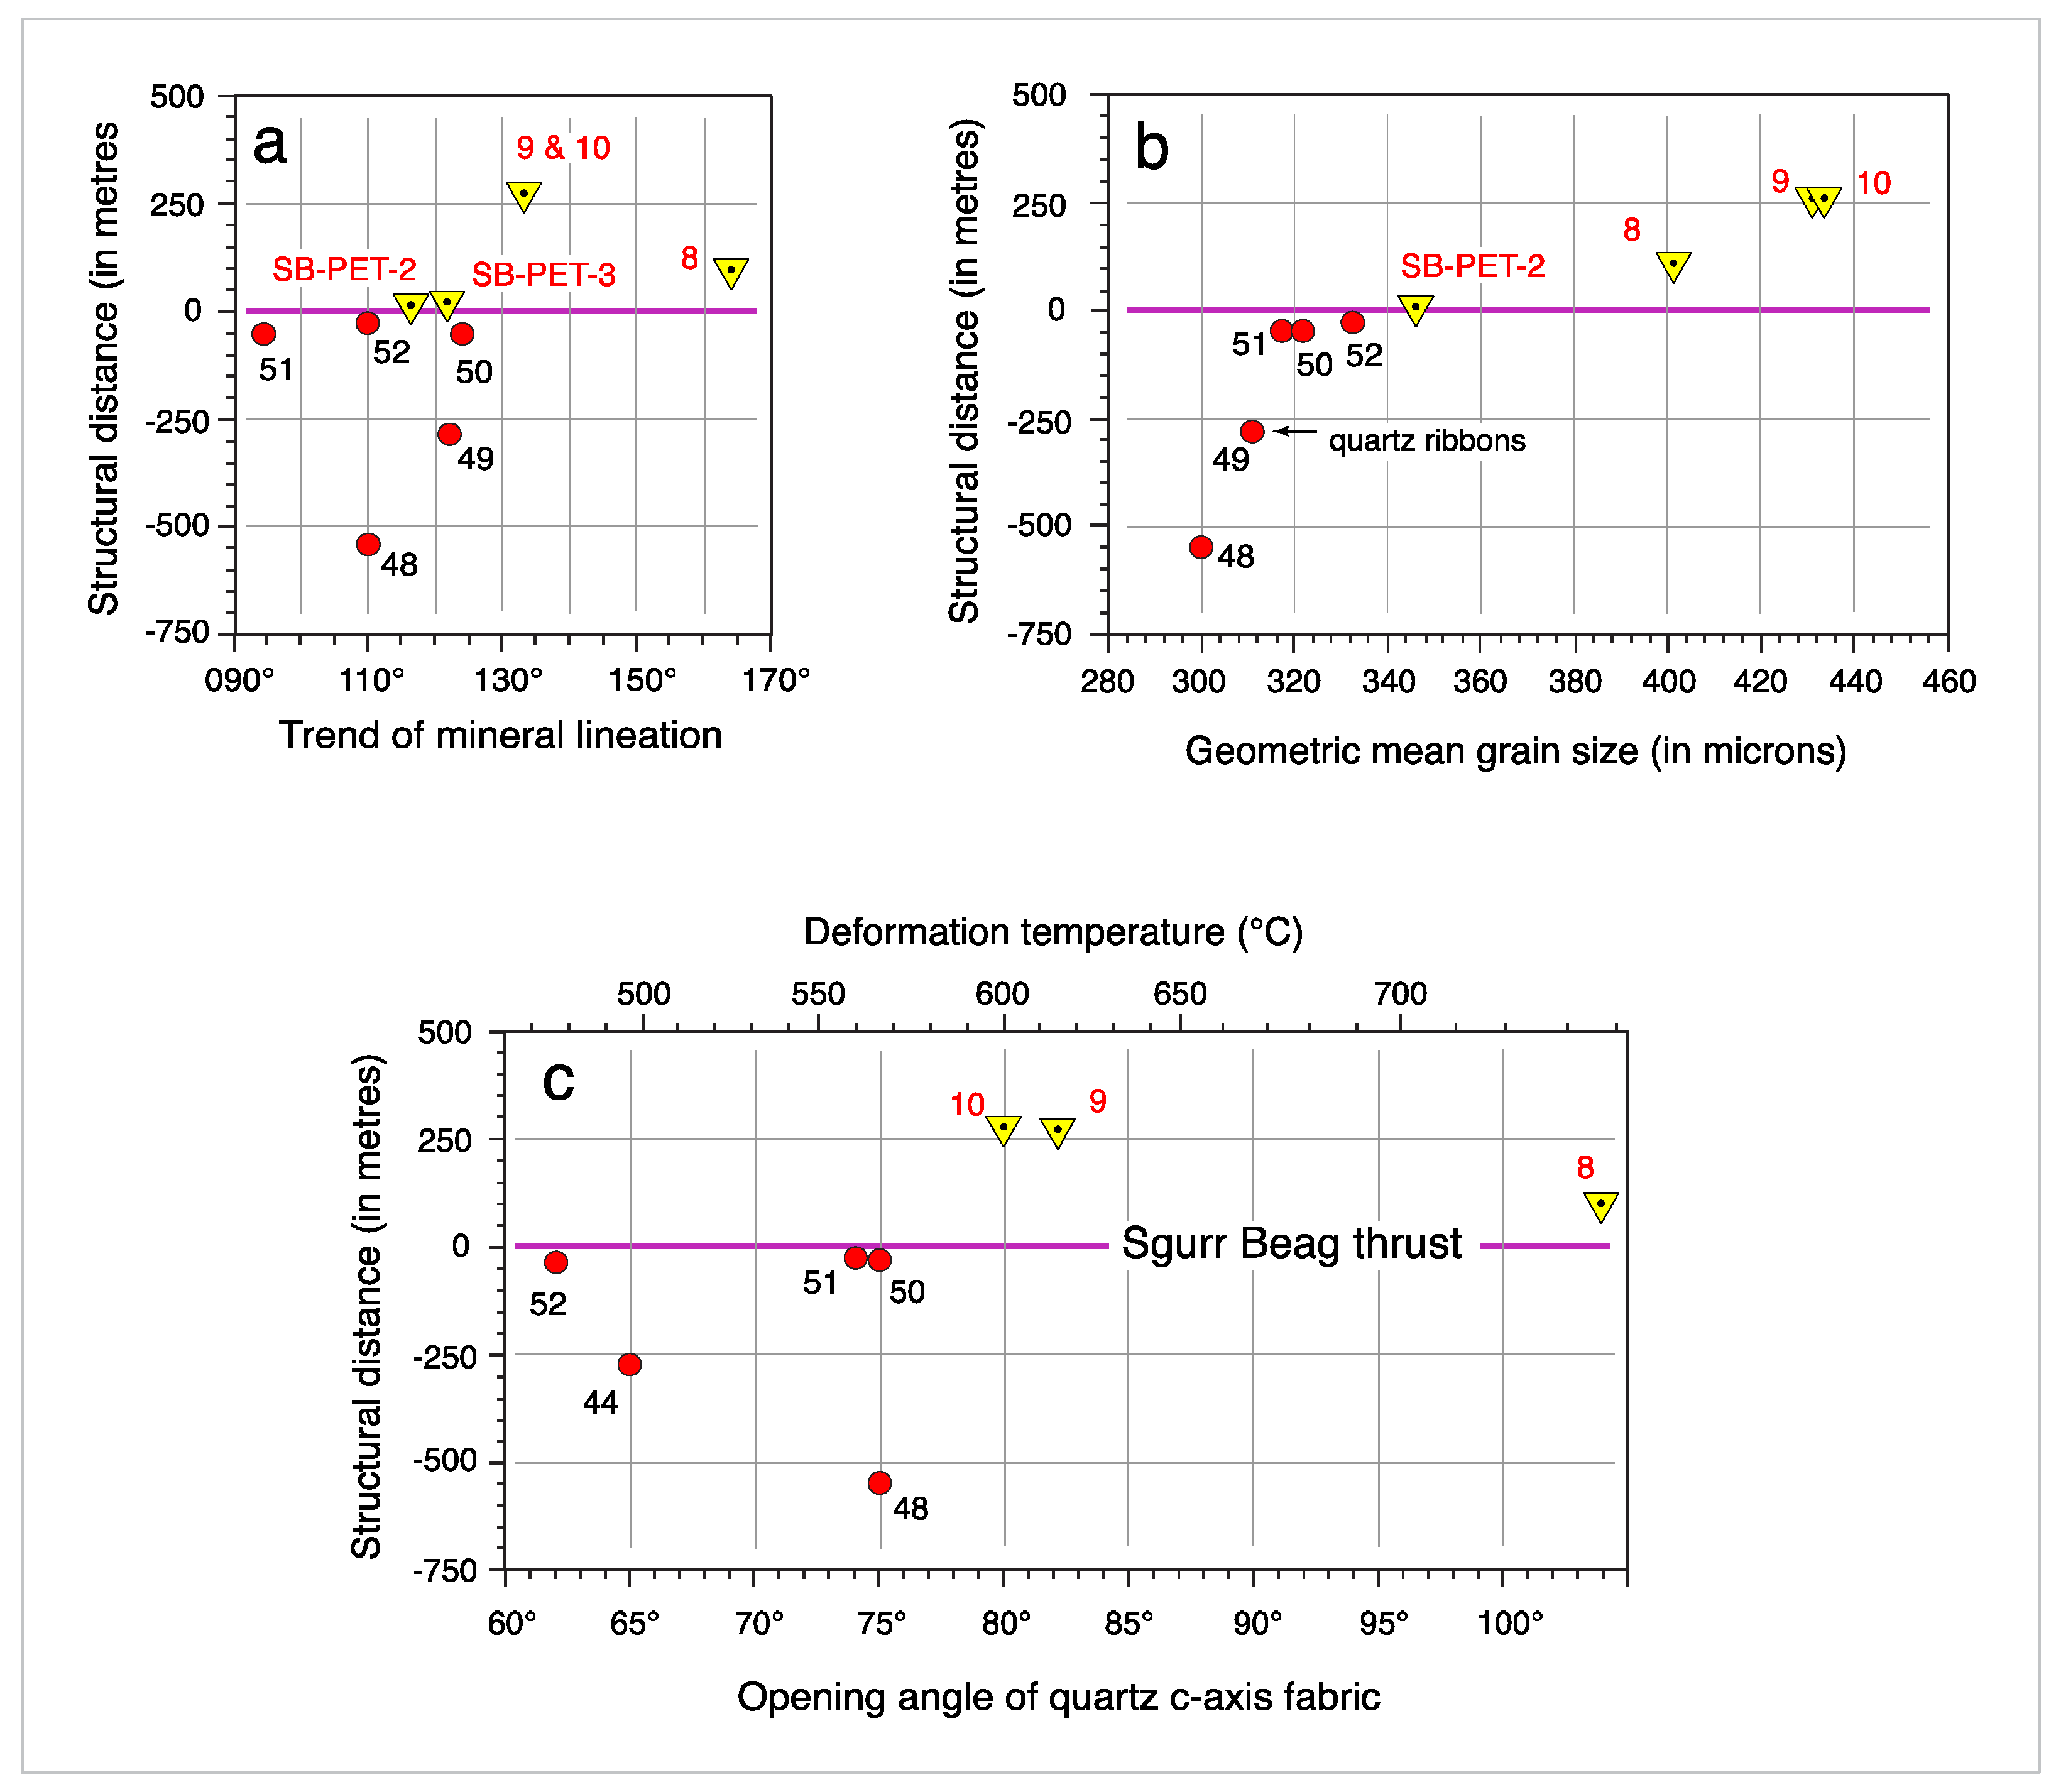
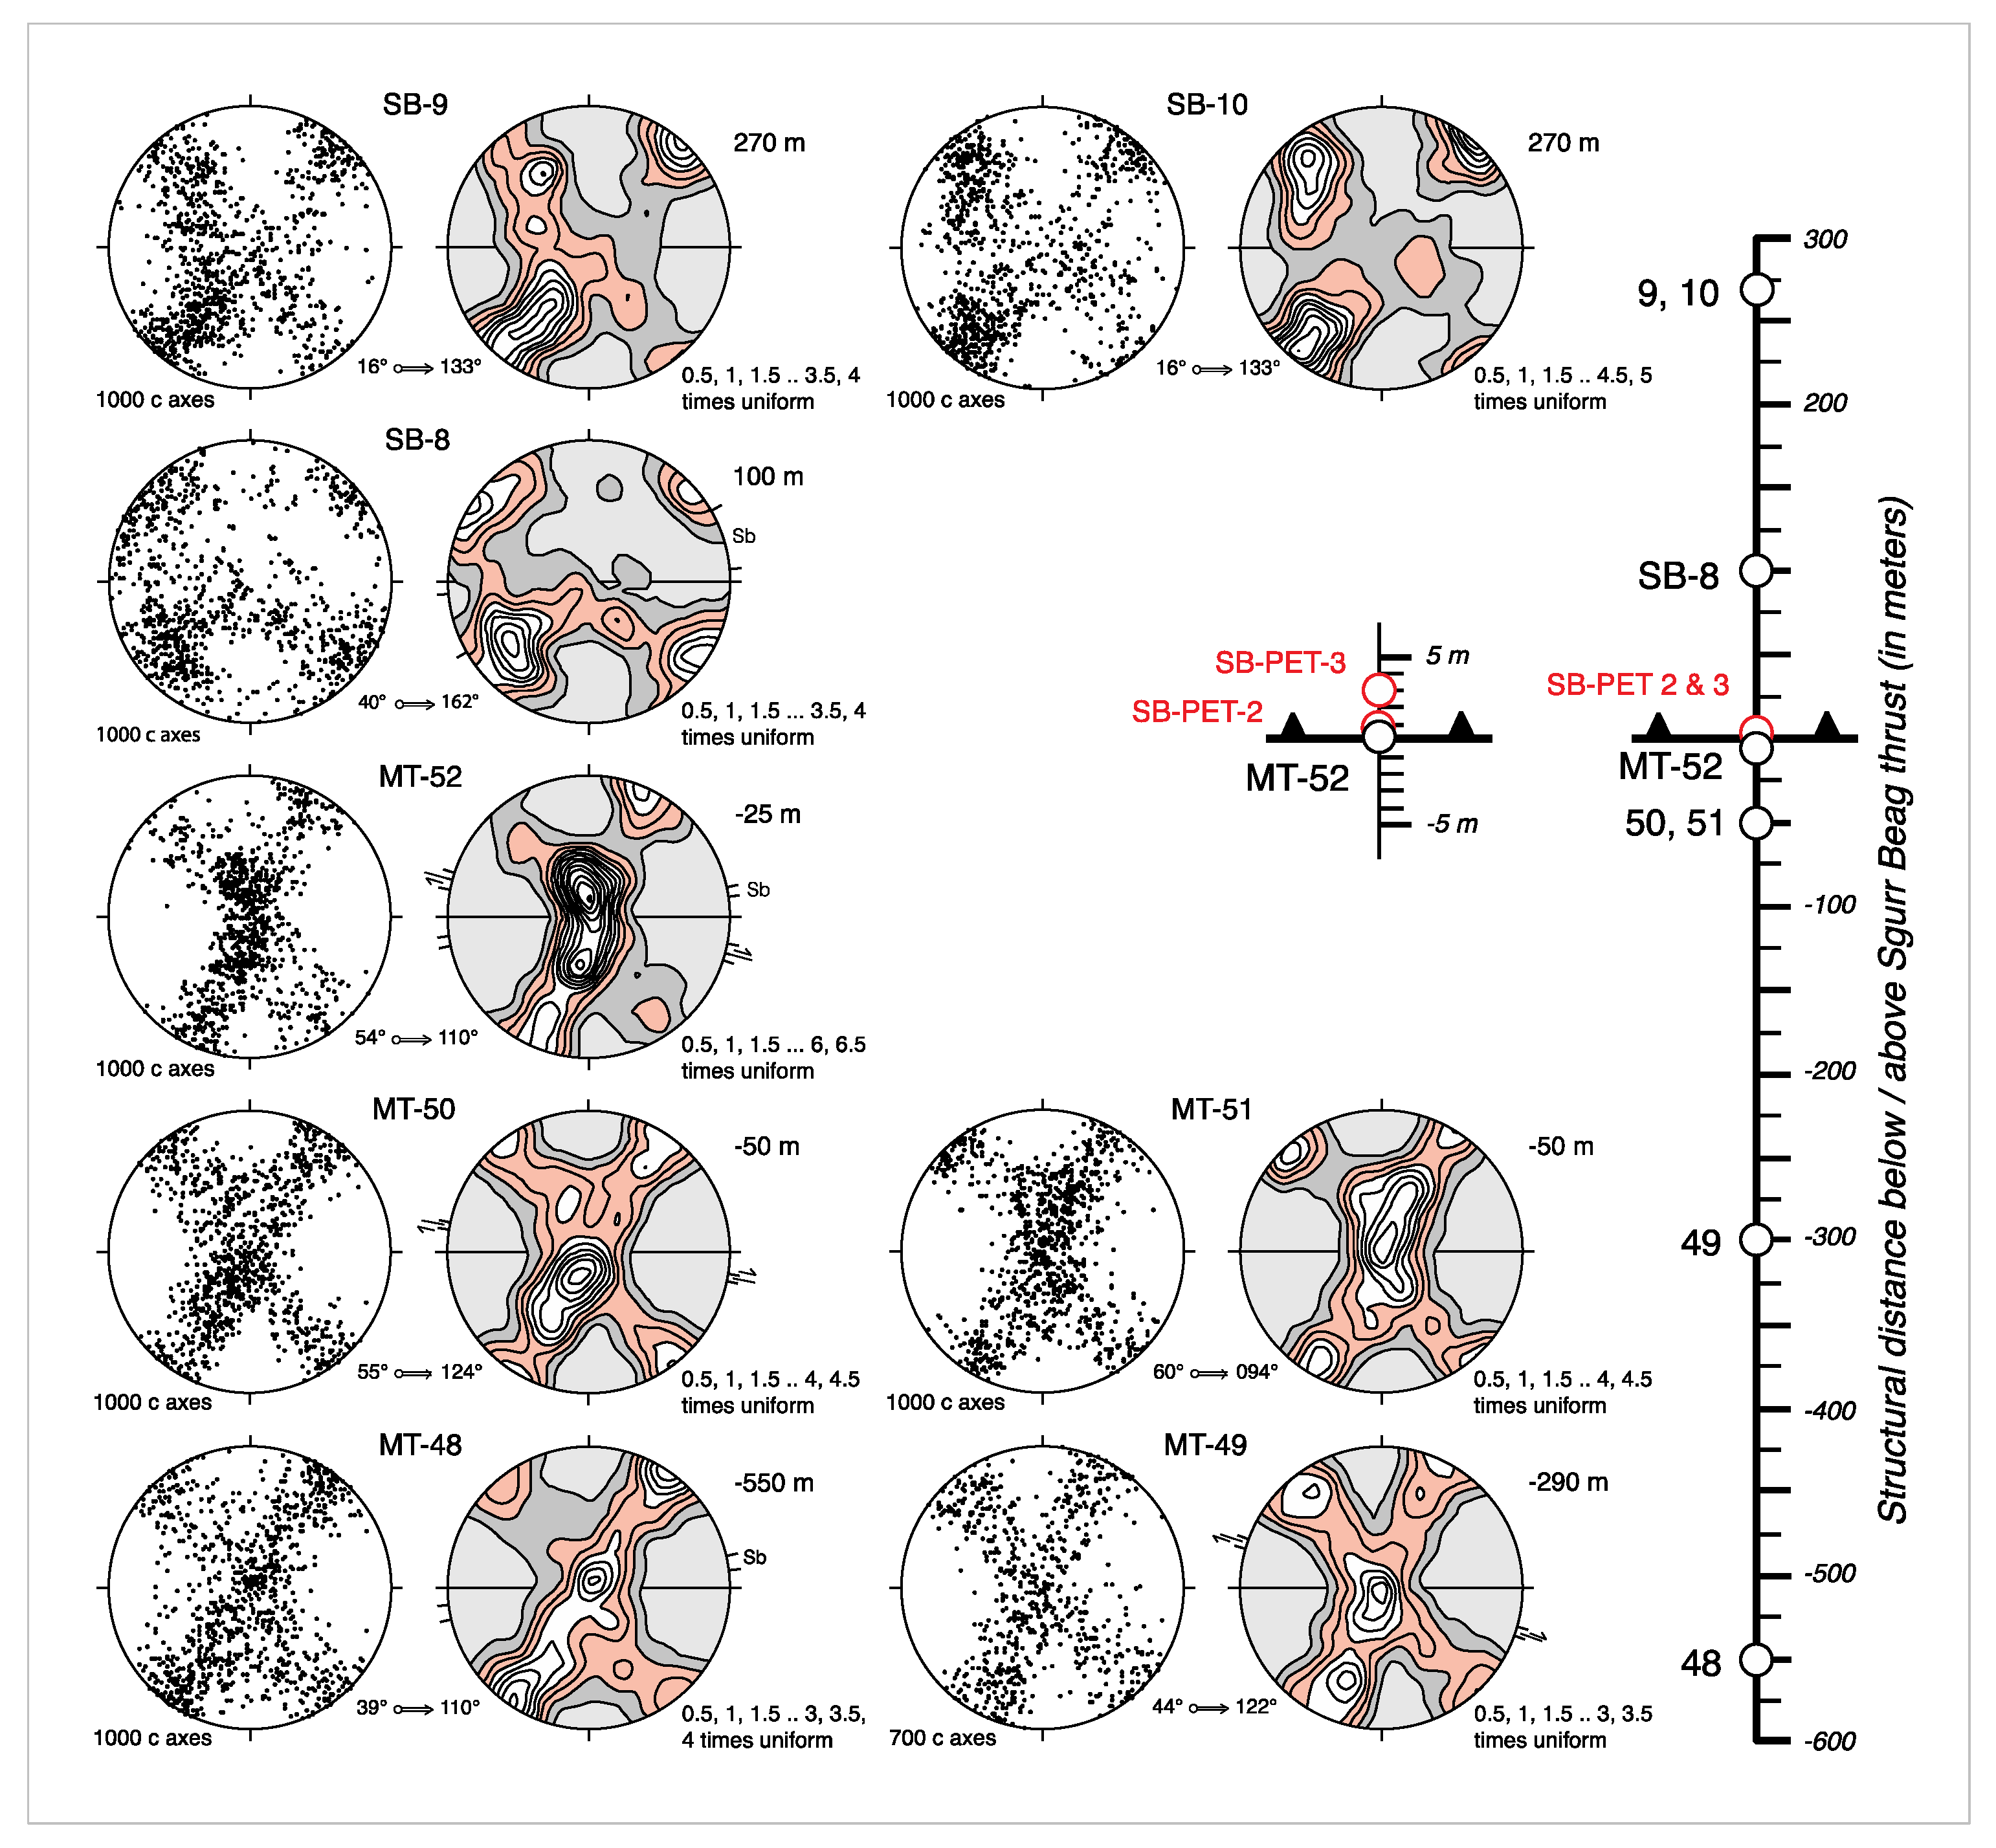
Five oriented samples (MT-48 to 52) were collected at 550 to 0.2 m beneath the Sgurr Beag thrust and five samples (SB-PET-2 to 3 and SB-8 to 10) were collected at 0.5 to 270 m above the thrust (
Figure 23 and
Figure 24). Grain shape foliation in our footwall samples dips at 40–60° towards the ESE, while grain shape lineations on foliation (demonstrated by quartz c-axis fabrics to also be maximum principal stretch directions; see below) plunge down dip to the ESE (
Figure 5f and
Figure 24a). Grain shape foliation in our hanging wall samples dips at 20–58° towards the ESE–SSE, while grain shape lineations on foliation plunge at 16–25° towards the ESE, and locally at 40° to the SSE.
Quartz c-axis fabrics from samples MT-52 and SB-8 at 0.2 and 100 m below and above the thrust, respectively, have previously been reported by Mazza et al., [
95]. PT estimates based on metamorphic mineral assemblages and monazite and xenotime geochronology from sample SB-PET-3 have previously been reported by Mako [
16] and Mazza et al., [
95]. Here, however, these samples have been relabeled to conform with our system of sample numbering adopted for Areas 1–4. Microstructures from both the footwall and hanging wall of the Sgurr Beag thrust located in our Area 4, together with quartz c-axis fabrics from the footwall (locations close to our samples MT-48 and 52), have also previously been described by Grant and Harris [
121]. In general, our current study confirms and expands upon these earlier studies.
Figure 23.
Area 4 coastal exposure on the Creich Peninsula of the uppermost part of the Moine thrust sheet and base of the overlying Sgurr Beag thrust sheet. Position of coastal exposure indicated in
Figure 1 and
Figure 2. (
a) Geological map with sample locations; adapted from Strachan and Holdsworth [
44], Grant and Harris [
121], Strachan et al., [
131] and Mazza et al., [
95]. (
b) Cross section along line A–A’ shown in (
a), indicating estimated structural distances of samples below (MT series) and above (SB series) the Sgurr Beag thrust.
Figure 24.
Relationships in Area 4 samples between structural distance below/above the Sgurr Beag thrust and: (
a) Trend of mineral lineation/maximum principal stretch direction indicated by quartz c-axis fabrics; (
b) Geometric mean recrystallized quartz grain size; (
c) Quartz c-axis fabric opening angles (C1 + C2) and deformation temperatures inferred from opening angle (using linear calibration of Faleiros et al., [
82]). Note in (
b) that grain size in recrystallized quartz ribbons is given for sheared Lewisianoid sample MT-49; recrystallized quartz grains in matrix are significantly smaller (geometric mean grain size of 180 microns) due to grain boundary pinning by amphibole and mica grains. Additionally, in sample SB-PET-2 only grains in quartz-rich layers were measured; quartz grains in matrix are pinned by micas and smaller. Grain size data are summarized in
Supplementary File S2.
7.1. Microstructures and Petrography
Microstructures in all samples from the Moine and Sgurr Beag thrust sheets in Area 4 indicate that both quartz and feldspar have deformed plastically, forming an interlocking mosaic of grains with grain scale sinuous/lobate grain boundaries, and indicating high mobility of feldspar and quartz grain boundaries. However, in some samples (e.g., SB-9), exceptionally large (2–4 mm) rounded to elliptical clasts of orthoclase feldspar appear to have behaved rigidly, with the grain shape fabric defined by micas and much smaller (300–500 micron) quartz and feldspar grains anastomosing around the clasts.
Quartz grains are usually strain free, but locally exhibit undulose extinction and tilt walls/subgrain boundaries. Unlike in Area 3, more pronounced internal strain features such as deformation bands are rarely observed in quartz grains from the Moine thrust sheet in Area 4, suggesting the more efficient operation of recovery mechanisms [
121]. Ribbon-like domains of recrystallized quartz measuring 500–600 microns in width and locally extending the length of an individual thin section are present in samples MT-49 (sheared Lewisianoid gneiss) and MT-52 (Morar psammite). In Glenfinnan psammite sample SB-10 quartz-rich domains are characterized by foliation-parallel plate-like quartz grains measuring up to 1000 microns in length which have recrystallized internally to form smaller more equant grains with tilt walls oriented parallel to prism and (less commonly) basal planes. Where both sets of tilt walls are present in the same grain, they form incipient chessboard extinction microstructures. Foliation-parallel mica laths within these grains indicate that quartz grain boundaries were highly mobile (GBM 2 regime of Stipp et al., [
73,
74]). Ribbon-like orthoclase feldspar grains sandwiched between foliation-parallel quartz and white mica and biotite laths in samples MT-48 and MT-51 probably indicate the local importance of high temperature dissolution processes in forming grain shape fabrics. Biotite remains fresh and highly pleochroic with fox-red color in all samples.
Measured in relatively quartz-rich domains where grain boundary pinning should be minimal, recrystallized grain size increases traced structurally upwards from the Moine thrust sheet into the Sgurr Beag thrust sheet (
Figure 24b). Similar trends in recrystallized feldspar grain sizes were also observed but have not been quantified. In the footwall geometric mean grain size increases from 300 microns (MT-48) at 550 m beneath the thrust to 332 microns (MT-52) at 0.2 m beneath the thrust. In the hanging wall geometric mean grain size increases more rapidly from 345 microns at 0.5 m above the thrust to 434 microns at 270 m above the thrust. In both the footwall and hanging wall this transition in quartz (and feldspar) grain size occurs entirely within the regime of grain boundary migration (GBM) recrystallization. This grain size transition in Area 4 is in direct contrast with our traverse across the Sgurr Beag thrust in Area 3, where recrystallized grain size decreases towards the thrust in both the footwall and the hanging wall (cf.
Figure 21b and
Figure 24b).
Pelite samples SB-PET-2 and 3 located at distances of ~0.5 and 3.0 m above the Sgurr Beag thrust, respectively, contain the assemblage quartz + orthoclase + plagioclase + muscovite + biotite + garnet + staurolite + ilmenite + apatite. In SB-PET-3 garnet is commonly retrogressed and replaced by quartz + plagioclase + biotite. Muscovite and biotite define the foliation and predominantly pin quartz grain boundaries. Foliation wraps around larger garnet and feldspar grains, and some of the feldspar augen display undulose extinction, subgrains and lobate grain boundaries. Pseudosection modeling and observed mineral abundances in SB-PET-3 indicates a PT range of 600–615 °C and 5.6–6.1 kbar, while PT conditions indicate by THERMOCALC are 610 ± 50 °C and 5.1 ± 1.4 kbar, and garnet-biotite thermometry indicate temperatures of 660 ± 50 °C [
95].
Unlike sample SB-PET-1 from Area 3, SB-PET-3 from Area 4 is extremely monazite-rich with 100+ grains in the matrix of a single thin section and only 3 grains included in garnet [
16,
95]. Ten xenotime grains (including two included in garnet) were identified in SB-PET-2 and isotope data yielded exclusively Precambrian ages from monazite and xenotime inclusions in garnet. Distinct populations of Knoydartian and Caledonian matrix monazite were identified in SB-PET-2. Scandian monazites gave an intercept age of 420 ± 3 Ma, while a regression of exclusively Precambrian analyses yielded intercept ages of 541 ± 27 Ma and 909 ± 65 Ma [
16,
95,
127]. Monazite-xenotime thermometry using the Scandian matrix monazites yielded temperatures of 610 ± 20 °C using the calibration of Heinrich et al., [
132]. Monazite ages were interpreted as being associated with peak or post-peak Scandian temperatures, but Mako [
16] and Mazza et al., [
95] cautioned that metamorphic conditions, constrained by thermometry and pseudosection analyses, for the Sgurr Beag thrust sheet in Area 4 could be associated with Scandian, Grampian or Knoydartian tectonism.
7.2. Quartz c-Axis Fabrics and Microstructural Shear Sense Indicators
Samples from the Moine thrust sheet in Area 4 are characterized by Type II [
90] cross-girdle quartz c-axis fabrics (
Figure 25). All fabrics are indicative of close to plane strain deformation conditions, and also confirm that the observed ESE plunging grain shape lineation in these samples is parallel to the maximum principal finite stretch direction (cf.
Figure 9). Fabric opening angles (C1 + C2) range between 62° and 75°, suggesting deformation temperatures of ~476–576 °C (
Figure 24c) using the linear opening angle thermometer of Faleiros et al., [
82]. In sample MT-52 many of the recrystallized grains in the quartz ribbons have their c-axes oriented at a low angle to the sample Y direction, producing an intense Y-axis maxima in the c-axis fabric and indicating at least the local dominance of prism <a> slip.
All samples from the Moine thrust sheet in Area 4 indicate a top down to the ESE shear sense in terms of differences in their C1 and C2 angles (
Figure 26). This shear sense interpretation is strongly supported by the leading edge of the cross-girdle fabrics being straighter and more clearly defined than the trailing edge in these samples (
Figure 25). This shear sense is also strongly supported by shear bands and extensional crenulations which deflect the main foliation (samples MT-49, 50 and 52) and by the incipient alignment (Sb) of elongate recrystallized quartz grains in samples MT-48 and 52 m (
Figure 25).
Unequivocal shear senses are difficult to determine in garnet-rich Glenfinnan pelite samples SB-PET-2 and SB-PET-3 at 0.5 and 3.0 m above the Sgurr Beag thrust. Foliation anastomoses around the large garnet grains in these samples and opposite shear senses are locally produced on opposing sides of the garnet grains. In SB-PET-2 wings of recrystallized quartz and feldspar on the garnets are locally either symmetric or sigma-shaped and indicate top up to the WNW or down to the ESE shear senses in individual cases. In SB-PET-2 shear bands containing white mica and fresh fox-red biotite laths and large (3–10 mm long) white mica ‘fish’ with tails that curve into adjacent shear bands also locally indicate either top up to the WNW or top down to the ESE shear senses, potentially forming conjugate sets, although the top down to the ESE sets are perhaps more widely developed. SB-PET-3 contains significantly higher amounts of feldspar (orthoclase and plagioclase with deformation twins) and lower amounts of quartz than SB-PET-2; top to the WNW shear bands are dominant in this sample.
Quartz c-axis fabrics from the Sgurr Beag thrust sheet in Area 4 are radically different from fabrics in the underlying Moine thrust sheet. In the three samples analyzed the fabrics consist of two dominant point maxima oriented at a high angle to the foliation pole and at up to ~30° to the XZ plane which are connected by small circle distributions of c-axes centered about the lineation (
Figure 25; samples SB-8, 9 and 10). Small circle c-axis fabrics centered about the maximum principal stretch direction (colloquially referred to as cleft girdle fabrics) are often regarded as being diagnostic of constrictional strains [
84]. However, in these samples both grain shape foliation and lineation are well-developed suggesting approximate plane strain conditions. These double point maxima fabrics are similar to fabrics described by Kruhl and Huntemann [
133], Kruhl [
81], Morgan and Law [
134] and Falleiros et al., [
82] from quartzites deformed at high temperatures (~700–1000 °C) and/or under extreme hydrolytic weakening. C1 + C2 fabric opening angles for samples SB-8, 9 and 10 indicate deformation temperatures of 736, 614 and 600 °C (
Figure 24c) using the linear opening angle thermometer of Faleiros et al., [
82].
Samples SB-9 and 10 have closely similar C1 and C2 angles (
Figure 26) suggesting close to pure shear deformation conditions. However, asymmetric sigma-shaped wings of recrystallized quartz on some of the largest feldspar clasts in SB-10 indicate a component of top down to the ESE shearing. In sample SB-8 a strong asymmetry in C1 and C2 angles is also indicative of a top down to the ESE shear sense and this interpretation is supported by the incipient alignment (Sb) of elongate recrystallized quartz grains.
8. Contrasting Interpretation of Microstructures and Quartz c-Axis Fabrics in Area 4 and Areas 1–3
In Area 4, although apparently higher temperature deformation microstructures suggesting reverse sense motion are observed in the hanging wall to the Sgurr Beag thrust, both microstructures and quartz c-axis fabric indicate pervasive top down to the ESE shearing in the uppermost 550 m of the Moine thrust sheet and the lowermost 270 m of the Sgurr Beag thrust sheet in Area 4. A simple potential explanation of these apparently conflicting observations is that original reverse sense motion on the thrust has been overprinted by pervasive normal sense shearing of the hanging wall and footwall rocks while they remained at close to peak temperatures.
Although the sampling transect in Area 4 is admittedly at a much smaller scale than the transects in Areas 1–3, this indicates a major change in tectonic transport direction and movement sense from top to the WNW shearing documented at the base of the Moine thrust sheet in the western part of Area 1 to top to the N shearing we have documented across the upper part of the Moine thrust sheet and overlying Sgurr Beag thrust sheets in Areas 1–3. As mapped (
Figure 1), the Sgurr Beag thrust in Area 4 appears to be a straight-forward along strike continuation of the thrust in Area 3, and yet the kinematic frameworks deduced from the microstructures and quartz c-axis fabrics in the two areas are totally different.
In Area 4 recrystallized quartz grain size steadily increases from footwall to hanging wall across the Sgurr Beag thrust (
Figure 24b), possibly indicating that the pervasive top down to the ESE shearing postdates the main motion on the thrust which was responsible for placing Glenfinnan Group over Morar Group rocks. In contrast, in Area 3 recrystallized quartz grain size steadily decreases towards the Sgurr Beag thrust both in the footwall and hanging wall (
Figure 21b) suggesting that top to the N motion on the Sgurr Beag thrust was synchronous with larger scale top to the N shearing that we have documented as being pervasive in both the upper part of the Moine thrust sheet and the overlying Sgurr Beag thrust sheet.
Dating these shearing events is made more complex by the undoubtedly Precambrian phases of metamorphism in these rocks. As discussed above, top to the N pervasive shearing and associated foliation/lineation development in the Moine thrust sheet in Areas 2 and 3 is known to be younger than the c. 594 ± 11 Ma Carn Chuinneag granite [
112,
113,
114,
115,
116,
117,
118]. Within the Sgurr Beag thrust sheet in Area 3, monazite ages of 454 ± 1 Ma in Glenfinnan Group metasedimentary rocks surrounding the Carn Gorm pegmatite [
32] provide at least a first hint of the possible age of top to the N shearing which would fall between the classical phases of Grampian and Scandian deformation. In contrast, U-Pb ages of 420 ± 3 Ma from Scandian matrix monazites at the base of the Sgurr Beag thrust sheet in Area 4 [
16,
95,
127] could indicate that top down to ESE shearing is significantly younger and related to the closing stages of Scandian deformation and metamorphism.
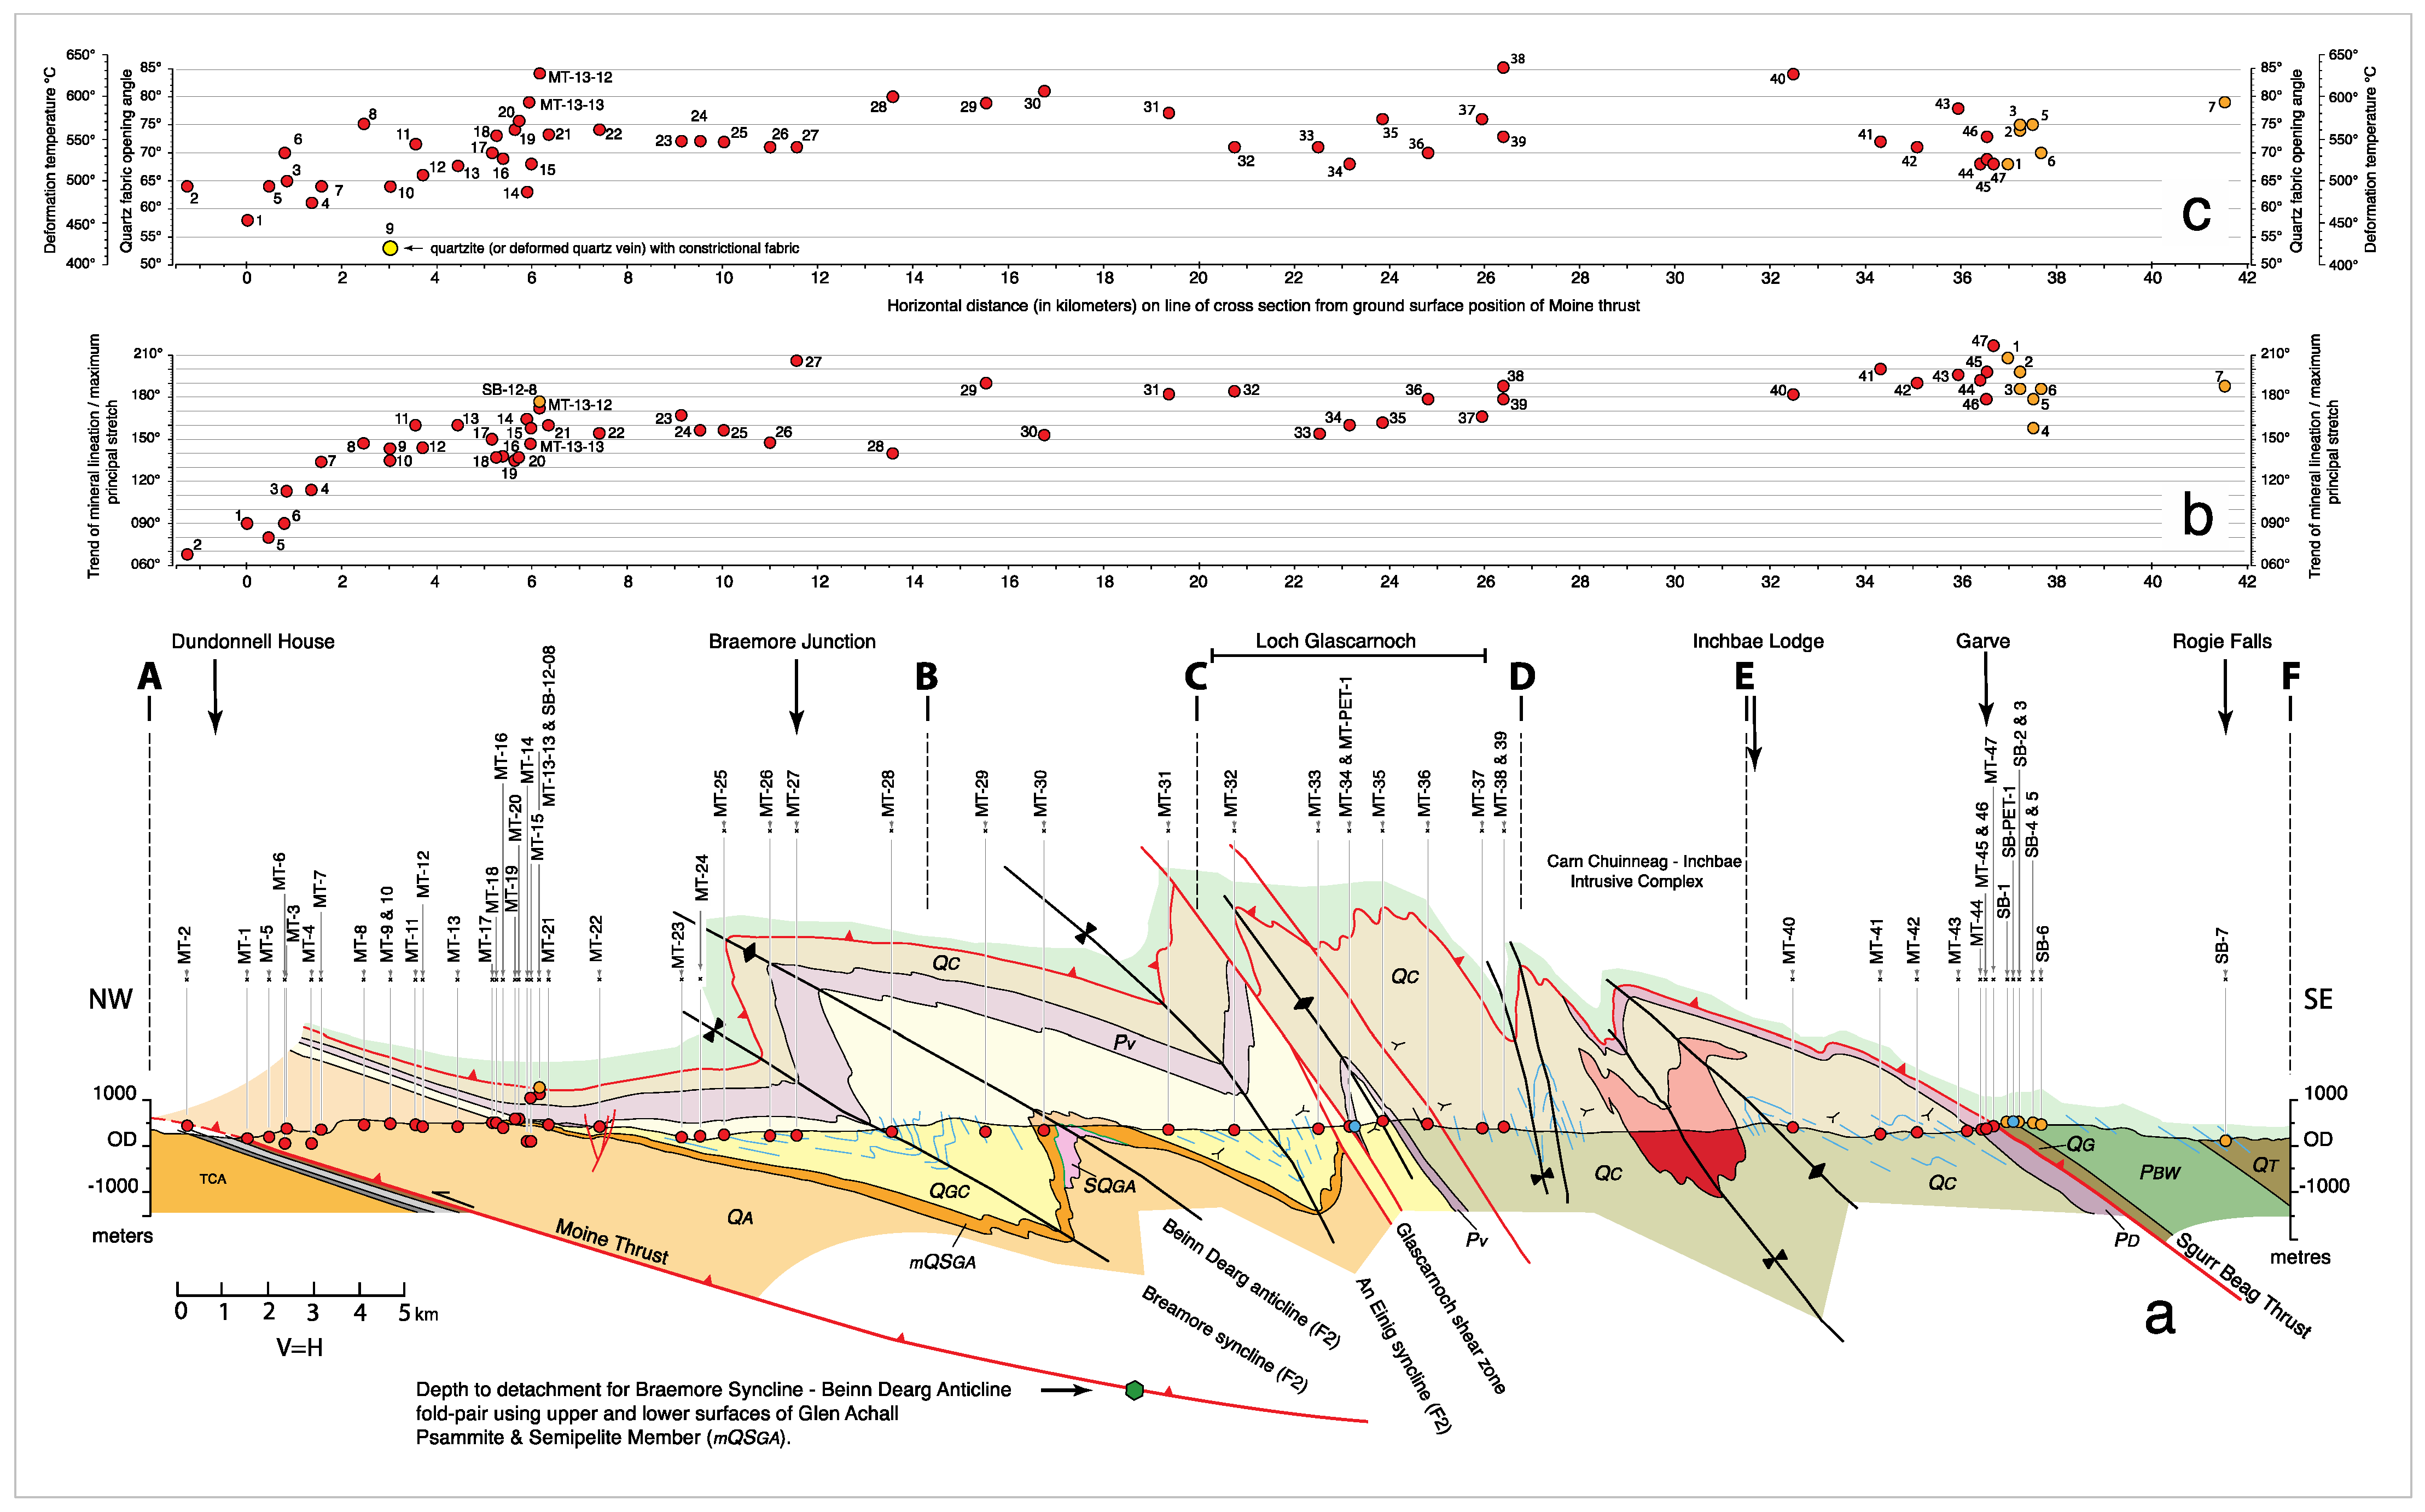
9. Tectonic Summary of Areas 1–3 and Regional Context
Our quartz c-axis fabric analyses of Moine metasedimentary rocks in the Moine and Sgurr Beag thrust sheets in Areas 1–4 (
Figure 1 and
Figure 2) unequivocally demonstrate that macroscopic L2 mineral lineations on foliation planes in all 61 oriented samples analyzed are parallel to the maximum principal stretch direction, indicating they have developed parallel to, and track, the local transport direction.
Microstructures and c-axis fabrics in samples from Area 1 demonstrate a progressive change from top to the W, through top to the NW, to top to the NNW shearing traced southeastward and upwards from the Moine thrust plane over a structural distance (measured perpendicular to the thrust) of ~4200 m (
Figure 3 and
Figure 4). Further to the east in Area 2 microstructures and fabrics (
Figure 17) indicate top to the N shearing that predates formation of km-scale W-vergent folds that are thought to detach on the underlying Moine thrust (
Figure 14 and
Figure 19a). Further east again in Area 3 microstructures and fabrics (
Figure 22) in both the upper part of the Moine thrust sheet and the overlying Sgurr Beag thrust sheet (
Figure 14 and
Figure 20) indicate top to the NNE shearing. Top to the west shearing in the Moine mylonites immediately above the Moine thrust occurred under upper greenschist facies conditions (~450–500 °C), while top to the NW/N/NNE shearing in the overlying and more hinterland parts of the Moine thrust sheet and overlying Sgurr Beag thrust sheet occurred under lower amphibolite facies conditions (~500–630 °C).
Traced from northwest to southeast across Areas 1–3 the zone of top to the NNW/N/NNE shearing is at least 55 km wide in map view after allowing for restoration of the later km-scale W-vergent folds in Area 2 (
Figure 19b), with its easternmost extent unknown as it is overlain by younger Devonian sedimentary rocks. However, even though pervasive top to the N shearing (and top to the W shearing closer to the foreland) is of regional extent across Areas 1–3, preservation of sedimentary structures in relatively low strain parts of the Moine thrust sheet indicate that the Morar Group metasedimentary rocks were stratigraphically right way-up at the regional scale before later W-vergent folding [
56]. The originally right way-up configuration of the Morar Group rocks continues northwards from our sampling transect within the Moine thrust sheet [
20,
56,
70,
92,
116,
120,
128,
135,
136,
137,
138,
139] into the Ben Hope thrust sheet exposed on the north coast in the Kyle of Tongue area [
52,
140] (
Figure 1). Sedimentary way-up indicators are only rarely preserved in the Glenfinnan Group rocks of the Sgurr Beag thrust sheet [
128,
136], but regional scale mapping of their unconformable relationship with underlying Lewisianoid (Archean) inliers and their conformable relationship with the overlying Loch Eil Group (see review by Strachan et al., [
34]), suggests that they are broadly right way-up. The pervasive top to the N shearing that we have documented across Areas 1–3 is not therefore thought to have resulted in regional scale recumbent folding and overturning within the Morar and Glenfinnan groups of metasedimentary rocks.
9.1. Frank Coles Phillips and Early Interpretation of Tectonic Transport Directions
The ~90° clockwise change in trend of L2 mineral lineations traced from the Moine thrust eastwards into the overlying Moine and higher thrust sheets has been extensively documented not only in our study Areas 1–3, but over a much wider area extending from the north coast southwards to at least the Strathconon fault (
Figure 2), with regional mapping by the British Geological Survey in the 1900s to early 1930s followed by more focused studies of individual areas by university-based geologists (see references and locations summarized in
Figure 2 of Law and Johnson [
6]). Speculation on the importance of this arcuate pattern of lineations as a potential indicator of changing transport direction within the Moine metasedimentary rocks was probably first made by Frank Coles Phillips who carried out pioneering quartz c-axis fabric analyses on a suite of 31 oriented hand samples [
141] collected from the area shown in
Figure 2. These fabrics were presented in a geographic reference frame, rather than the sample reference frame (
Figure 9) now employed, making their kinematic interpretation more difficult (see review by Law and Johnson [
6]).
As with the c-axis fabrics we have described in our Study Areas 1–4 (
Figure 10,
Figure 11,
Figure 17,
Figure 22 and
Figure 25) Phillips [
141] noted that the single and cross-girdle c-axis fabrics in his samples were oriented perpendicular to lineation, but followed the prevailing convention of the time that tectonic transport was oriented parallel to the girdle c-axis fabrics and hence perpendicular to lineation in his individual samples. This led to the conclusion that E-trending lineations in the Moine mylonites in the immediate hanging wall to the Moine thrust were associated with a N-S transport direction, while the S trending lineations to the east were associated with E-W transport, although the sense of motion (e.g., top to the north or south) could not be determined from the fabrics at that time (see historical reviews by Howarth and Leake [
142]; Law and Johnson [
6]). As outlined above, we now know that girdle c-axis fabrics develop at right angles to the maximum principal finite stretch direction (
Figure 9) and hence also at right angles to transport. The original combined lineation and petrofabric data described by Phillips [
141] which, supported by a more data intensive study by Crampton [
143], extended from the north coast southwards for ~130 km through our Study Areas 1–3, can now be reinterpreted as indicating W-E trending maximum principal stretch directions and associated tectonic transport in the Moine mylonites immediately above the Moine thrust, that progressively swing clockwise around to NW-SE and then N-S trending stretch directions and associated transport traced eastward into the hinterland.
To the south of our Study Areas 1–3 these conclusions are supported by quartz c-axis fabrics (also presented in geographic reference frames) reported from mylonites immediately above the Moine thrust in the Coulin and Lochcarron areas [
25,
26,
27] (
Figure 2, locations c-e, respectively; W-E to NW-SE trending maximum principal stretch directions) and further to the southeast in the Scardroy [
28], Loch Monar [
29], Loch Luichart [
30] and Glen Orrin [
31] areas (
Figure 2, locations f–i, respectively; NW-SE to N-S trending maximum principal stretch directions). Unfortunately, it has proved impossible to deduce shear senses relative to present day geographic coordinates from any of these historical petrofabric data sets [
144]. Further to the south of our Study Areas in the Glen Garry region (GG in
Figure 2) Holdsworth and Roberts [
145] have described N-S trending mineral lineations associated with ‘test tube’ sheath folds which they argued formed parallel to the maximum principal stretch direction. Shear senses in these local D2 structures could not be determined however, and it remained an open question if they formed during top to the N or top to the S tectonic transport.
9.2. Documentation of Shear Senses Associated with Changing Transport Direction
Top to the W shearing associated with E to ESE trending lineations in the mylonites in the immediate footwall and hanging wall to the Moine thrust has been accepted since the early 1880s (e.g., Lapworth [
146]; Callaway [
147]; Geikie [
1]; Peach and Horne [
148]; Lapworth [
149,
150]; Peach et al., [
151]) and subsequently confirmed using microstructural and crystal fabric shear sense criteria introduced in the 1970s (see review by Law and Johnson [
6]). Within the Moine metasedimentary rocks to the east, however, although the domains of NW-SE and N-S trending lineation (
Figure 2) have often been referred to as being associated with northwest and northward-directed transport, shear sense criteria (either macroscopic or microscopic) supporting this interpretation have rarely been described. Important exceptions to this general observation include microstructural and quartz c-axis fabrics studies (for SE plunging lineations) in the upper parts of the Moine thrust sheet and overlying Ben Hope thrust sheet in the Tongue/Ben Hope area to the east of Loch Eriboll [
52,
152,
153,
154] and the upper part of the Naver thrust sheet and the overlying Skinsdale thrust sheet surrounding the sheared Strath Halladale Granite [
45].
Based on optically measured quartz c-axis fabrics and microstructures, Thigpen et al., [
18], their
Supplementary File S2, have documented a transition from top to the W to top to the NW shearing traced southeastwards from the Moine thrust across the Moine and Ben Hope thrust sheets into the leading edge of Naver thrust sheet (
Figure 1 and
Figure 2, transect labelled b). Similarly, on a transect across the Moine thrust sheet into the leading edge of the Ben Hope thrust sheet located ~5 km to the north of the Thigpen et al., [
18] transect, Lusk and Platt [
155] have recently documented a transition from top to the W to top to the NW shearing, based on microstructures and EBSD-derived quartz c- and a-axis fabrics.
To the best of our knowledge, no previous studies have documented shear senses associated with the domains of N-S trending lineations in the northern part of the Moine and overlying Naver and Swordly thrust sheets (
Figure 1 and
Figure 2). As mentioned above, further to the south in the Ben Wyvis/Garve area (our Area 3) top to the N shear senses have previously been determined by Grant and Harris [
121] and Mazza et al., [
95] from the domain of N-S trending lineations in the immediate hanging wall and footwall to the Sgur Beag thrust, based on microstructures and quartz c-axis fabrics. Our new data build on this earlier work, delineating what was originally an at least 55 km wide domain of top to the N shearing (
Figure 19b) that extends westwards from Rogie Falls to Braemore Junction (Areas 1–3) where there is then a rapid transition from top to the N shearing through top to the NW to top to the W shearing on the underlying Moine thrust.
9.3. Structural Positions of Changing Transport Directions
In Area 1 the transition from top to the W through top the NW to top to the N shearing occurs close to the Moine thrust in map view, with the associated lineations defining an arcuate map pattern of E to SE to S plunging lineations (
Figure 2 and
Figure 3). Measured perpendicular to the map trace of the Moine thrust, SE plunging lineations are first recorded at ~2 km from the thrust. This map distance between the Moine thrust and first appearance of SE plunging lineations remains fairly constant traced from Area 1 southwards towards Loch Carron at the southwestern edge of
Figure 2.
Traced northwards from Area 1 the map distance between the Moine thrust and first appearance of SE plunging lineations within the Moine thrust sheet increases to ~20 km at Knockan Crag (K in
Figure 2). On the north side of the Oykel Transverse Zone in the Cassley Culmination [
21] (OTZ and CC in
Figure 2) the first appearance of SE plunging lineations is within the lower part of the Ben Hope thrust sheet at ~5 km from the Moine thrust. This map distance gradually increases traced towards the north and near the north coast the first appearance of SE plunging lineations is in the upper part of the Ben Hope thrust sheet at ~20 km from the Moine thrust. This regional scale obliquity in map view between the trace of the Moine thrust and the arcuate pattern of lineations suggest that the arcuate pattern is not, at least in any simple way, related to motion on the underlying Moine thrust.
Alsop et al. [
55] (their
Figure 9) have interpreted the swing from E to SSE plunging lineations traced eastwards across the Moine, Ben Hope and Naver thrust sheets (
Figure 2) in terms of spatially and temporally varying components of simple and pure shear within the internally deforming Caledonian orogenic wedge. Alsop and Holdsworth [
156,
157] and Alsop et al., [
158] have noted that their
‘flow perturbation’ folds (generated by variations in flow within underlying mylonitic high strain zones) ‘follow’ this swing in lineations across the thrust sheets suggesting: (a) lineation must remain parallel to transport as it swings; and (b) the folding they observe of overlying thrusts by
‘flow perturbations’ linked to underlying thrusts indicates a broadly foreland-propagating system.
Compared with the arcuate map pattern of E to SE to S plunging lineations mapped in Areas 1-3, the map pattern of lineations to the north of the Cassley Culmination is developed at a larger scale. Measured perpendicular to the Moine thrust the transition from southeast to south trending lineations occurs at distances of 6–15 km in Areas 1–2 (
Figure 3,
Figure 4 and
Figure 14) within the foreland edge of the Moine thrust sheet, but at a map distance of ~30–40 km traced through the Moine, Ben Hope and Naver thrust sheets in the north (
Figure 2). These two arcuate lineation domains are separated from each other by an ~20 km wide WNW-ESE trending band of SE to E trending lineations on the Cassley Culmination (CC in
Figure 1 and
Figure 2) that extends from the southern part of the Assynt Culmination through Lairg towards the east coast.
These two domains may also represent different crustal levels. Traced from Knockan Crag (
Figure 2) southwards the Moine thrust is a brittle fault separating (with the exception of slivers of mylonitic Cambrian quartzite in the Ullapool Valley) [
64] locally brecciated Moine mylonites in the hanging wall from brecciated but non-mylonitic rocks in the footwall. In contrast, from southern Assynt northwards the Moine thrust has mylonitic rocks in both its hanging wall and footwall, suggesting a deeper crustal level (see review by Law and Johnson [
6]). Similarly, Strachan et al., [
23] have suggested the Moine metasedimentary rocks exposed in Sutherland (northern domain) may represent a deeper crustal level than the Moine exposed in Ross-shire and Inverness-shire (southern domain) based on: (a) the focusing of intrusions that are partly mantle-derived along the Naver and Skinsdale thrusts, compared with their absence along the Sgurr Beag thrust; (b) the considerably greater amount of Archean and Paleoproterozoic basement exposed within the Moine thrust sheet in Sutherland. A fourth line of evidence for shallower crustal levels in the south may be the preservation of Neoproterozoic (Knoydartian) xenotime and monazite grains as inclusions in garnet cores and rims within the Sgurr Beag thrust sheet (Areas 1 and 3) [
16,
95] compared with their only very rare preservation [
16,
127] in the Naver thrust sheet, suggesting a far more pervasive Scandian age overprinting of any pre-existing Knoydartian signature in the north [
95,
159].
9.4. Age or Age-Range of Arcuate Lineation Patterns and Their Tectonic Setting
Strachan et al., [
24] have recently argued that the arcuate lineation patterns of the type preserved in the Moine could result from one or more of three possible scenarios: (1) reorientation of a linear fabric by a later deformation event; (2) heterogeneity in the magnitude and direction of shear combined with strain partitioning during regional transpression; (3) different generations of lineations associated with separate deformation events.
9.4.1. Reorientation of a Linear Fabric by a Later Deformation Event
Within our Area 1 the first of the above scenarios—later reorientation of an originally constantly trending linear fabric—is most unlikely as the ~90° swing in lineation trend is entirely recorded within the ~4 km thick belt of planar gently dipping Moine mylonites and schists lying directly above the Moine thrust (
Figure 4,
Figure 5b and
Figure 14). As summarized in
Figure 13c–e, different ranges of lineation trend are recorded at different structural heights above the thrust in these planar tectonites, indicating that transport direction is changing with structural height. It is geometrically unclear how a distinct episode (or episodes) of superimposed deformation could in practice rotate originally constantly trending lineations through 90° while simultaneously leaving the planar fabrics containing the lineations undistorted.
9.4.2. Heterogeneity in the Magnitude and Direction of Shear—Lineations Associated with One Deformation Event
Viewed at the regional scale, the gradual change in lineation trend without any obvious sudden changes in trend intuitively suggests the operation of a continuous tectonic process, rather than a series of discrete tectonic events. For example, traced from Loch Eriboll southeastwards across the Moine, Ben Hope and Naver thrust sheets the gradual 90° change in lineation trend from E trending on the Moine thrust mylonites to S trending in the Naver thrust sheet suggests that all lineations may be of Scandian age. This interpretation is strongly supported by the pervasive and well documented Scandian metamorphism and deformation in the Naver thrust sheet [
16,
23,
24] that overlaps with, and may have outlasted by several Myr., marginal top to the W thrusting on the Moine thrust at 430 Ma in the Assynt region [
48]. Thus, at least in this area, the arcuate lineation pattern may be a ‘snapshot’ of different transport directions, of at least close to contemporaneous Scandian age, operating at different crustal levels.
A remarkably similar arcuate lineation pattern associated with Late Silurian–Early Devonian age northward (orogen-parallel) and northwestward directed tectonic transport has been documented in the Caledonides of NE and SE Greenland [
160,
161,
162,
163,
164], suggesting that tectonic processes responsible for formation of arcuate lineation patterns may operate at the orogen scale. Soper et al., [
165] have argued that such arcuate changes in lineation trend may be due to a gradual change in the strain fields associated with changes in the direction of plate convergence. Dewey and Strachan [
166] have argued that such arcuate lineation patterns in the Caledonian Orogen of northern Scotland and East Greenland may be due to a progressive partitioning of deformation into orogen-parallel flow and orogen perpendicular thrusting within a sinistral orogen-scale transpressional tectonic setting. However, the overall approximately plane strain (k = 1) conditions indicated by our cross-girdle quartz c-axis fabrics in Areas 1–3 may be at odds with a transpressional setting as bulk transpression commonly results in non-plane strains; see reviews by Fossen [
8], Fossen & Teyssier [
167], Dewey et al., [
168] and Fossen [
169], p. 411.
In the case of our study areas in northern Scotland, if the Moine thrust zone in Area 1 was active until c. 420–415 Ma [
51] then brittle upper crustal thrusting along the margin of the orogen (at least to the south of Knockan) may have overlapped with early strike-slip motion on the Great Glen Fault and related structures [
24]. However, if, as suggested above, top to the N shearing in the upper part of the Moine thrust sheet and the overlying Sgurr Beag thrust sheet (Areas 2 and 3) occurred at ~470–450 Ma, this clearly predates both documented motion on the Moine thrust zone and any early strike-slip motion on the Great Glen Fault.
9.4.3. Different Generations of Lineations Associated with Separate Deformation Events
In Sutherland the regional scale arcuate map pattern of lineations has traditionally been regarded as a composite of Grampian and Scandian orogenic events. Scandian reworking associated with broadly NW-directed transport is generally regarded as being dominant in the Moine, Ben Hope and Naver thrust sheets, while both field and isotopic evidence suggest that Grampian structures characterized by N-S trending lineations may predominate in the structurally higher Swordly thrust sheet, although no kinematically consistent indicators have been found that might establish the shear sense/transport direction [
24]. This interpretation has been extended to the Sgurr Beag thrust sheet on the basis of a 470 ± 2 Ma age for titanites in the West Highland Granitic Gneiss near Fort Augustus [
170] (
Figure 2). The titanites were aligned within the foliation which carries a N-S trending mineral lineation.
As discussed above, the E-trending lineations and their associated microstructural and crystal fabric indicators of top to the W shearing in the planar Moine metasedimentary rocks immediately above the Moine thrust in our Area 1 are undoubtedly of Scandian (~435–415 Ma) age, given their Rb-Sr white ages of c. 429–408 Ma that were interpreted by Freeman et al., [
51] as indicating general cessation of ductile deformation in the mylonites at c. 430 Ma, although deformation may have continued in a less pervasive manner until at least 408 Ma. In contrast, the originally at least ~55 km wide domain of SSE to S to SSW trending lineations and their associated top to the N shear indicators in Areas 1, 2 and 3 (
Figure 19b) is demonstrably older as the foliation containing this lineation is folded about west-vergent km-scale folds that appear to detach onto the underlying Moine thrust (
Figure 4a and
Figure 14a). The grain shape fabrics associated with this top to the N shearing are generally accepted as postdating intrusion of the c. 594 Ma Carn Chuinneag granite. On purely structural grounds these observations could be interpreted in terms of either: (1) a progressive Scandian foreland-propagating sequence (albeit with changing transport directions) in which earlier formed structures are deformed by folds that root into lower, later structures, or (2) spatially and temporally discrete tectonic events associated with top to the N and later top to the W shearing.
U-Pb ages from the Sgurr Beag thrust sheet in Area 3 on monazite in metasedimentary rocks and titanite in a sheared amphibolite with S-trending mineral lineation (
Figure 20, locations b and c) of 454 ± 1 Ma and 468 ± 7 Ma, respectively [
16,
32], may be tentatively interpreted as indicating that the grain shape fabrics associated with top to the N shearing in Area 3 may be of Grampian (~460–480 Ma) or slightly younger age. In this scenario the rare N-trending mineral lineations documented by Holdsworth [
54] and Holdsworth et al., [
52] in the Ben Hope thrust sheet exposed in the Kyle of Tongue area on the north coast (
Figure 1), that are overprinted by Scandian D2 fabrics with SE plunging lineations (see
Section 2), could also be of Grampian age.
9.5. Domainal Distribution of Deformation Microstructures and Lineation Trends in Area 1—Tectonic Implications
Plotted in terms of map distance from the trace of the Moine thrust our lineation data for Areas 1–3 suggest a fairly smooth overall transition from E to SE to S trending lineations (
Figure 4b,
Figure 13d and
Figure 14b). Plotting the lineation data in terms of structural height above the thrust, however, indicates a significant variation in trend at specific heights above the thrust (
Figure 13c,e). For example, lineation in the mylonites in the immediate hanging wall to the thrust (0–400 m) range from ~070 to 115° in trend, while lineations at 1000–3500 m above the thrust range from 135 to 165° at all structural heights. Within each domain all lineations regardless of trend are associated with the same quartz recrystallization microstructures, indicating that they have formed under similar deformation temperatures. Assuming that the lineations in each domain are of essentially the same age, then the 35–45° range of lineation trends in each domain would seem to indicate a significant component of rotation associated with thrusting and tectonic transport.
There may be an abrupt change in lineation trends between these domains potentially indicating the presence of distinct structural/kinematic regimes associated with different transport directions (Krabbendam et al., [
56], p. 15), but we only have one sample from the intervening ground (MT-7 in
Figure 13c), making any definitive identification of an abrupt change in transport direction impossible. Certainly, the smooth change from high to relatively low temperature quartz and feldspar recrystallization microstructures traced downwards towards the Moine thrust (
Figure 8) would at first sight seem to indicate a progressive change from top to the N to top to the W shearing under progressively lower temperatures—although the potential influence of increasing strain rate on these microstructures must be kept in mind. However, we regard this apparent progressive change in deformation temperature with distance above the thrust as misleading because, as noted above, the grain shape foliation containing the N-S lineations is folded about km-scale folds that detach onto the underlying Moine thrust and may be of Grampian, rather than Scandian, age.
The precise structural distance above the Moine thrust at which potential Grampian age structures transition downwards into undoubted Scandian structures within the gently dipping sequence of Moine metasedimentary rocks in Area 1 (
Figure 4a) is uncertain. Arguably the most logical position would be at approximately 500–1500 m above the thrust where lobate quartz-feldspar and feldspar-feldspar grain boundaries first appear (
Figure 6). Deformation temperatures inferred from these microstructures are far higher than would be expected given their short distance from the underlying upper greenschist facies Moine mylonites, and therefore they could have formed in an older and unrelated tectonic event at higher metamorphic grade. This structural position also broadly coincides with the transition from mixed SGR-GBM to GBM recrystallization of quartz and a two-fold increase in recrystallized grain size of quartz (
Figure 8).
Our
40Ar-
39Ar white mica data (
Figure 15) indicate that sample MT-10 with a lineation trend of 135° at 1220 m above the Moine thrust in Area 1 was cooling through ~400 °C at c. 432 Ma. These estimates are remarkably similar to findings of Freeman et al., [
51] who, based on petrologic and Rb-Sr data, estimated that white micas in the underlying Moine thrust mylonites in Area 1 dynamically recrystallized at temperatures of 400 ± 50 °C at c. 430 Ma, although deformation may have continued locally on the Moine mylonites in a less pervasive manner until at least 408 Ma. These similarities suggest that MT-10 and the basal mylonites were at very similar crustal depths when pervasive top to the W shearing ceased in the basal mylonites at c. 430 Ma.
As discussed above, the presence of only single grain feldspar clasts (
Figure 7b) in the relatively low temperature basal Moine mylonites close to the underlying Moine thrust in Area 1, and the absence of clasts composed of interlocking earlier plastically deformed quartz and feldspar grains, indicates that the basal mylonites have not been produced by low temperature reworking of overlying higher temperature tectonites in which such microstructures are common. This suggests that the basal section of Moine metasedimentary rocks associated with top to the W shearing (lowermost domain in (
Figure 13e) were originally in a more proximal (foreland) position at a much shallower crustal level than the now overlying higher grade Moine rocks associated with top to the NW and N shearing. This in turn requires the presence of a major previously unrecognized fault or shear zone, probably at a structural distance of ~500–1000 m above the Moine thrust (middle domain in
Figure 13e), on which originally deeper and more hinterland positioned metasedimentary rocks (including most of the Moine thrust sheet and the overlying Sgurr Beag thrust sheet) have been transported laterally to the NW to structurally overlie the shallower more foreland positioned metasedimentary rocks that were mylonitized during top to the W shearing on the underlying Moine thrust. In Area 1, the previously unrecognized fault or shear zone within the Moine approximately coincides with the swing from E to SE trending lineations. It remains to be determined if similar microstructural observations and structural interpretations can be made in the immediate hanging wall to the Moine thrust along the entire length of the thrust from the north coast southwards to Skye or if, for example, such microstructures are limited to the ‘brittle’ Moine thrust located from Knockan southwards.
10. Tectonic Summary of Area 4 and Regional Context
In contrast to Areas 1–3, microstructures and quartz fabrics in the small coastal exposure of the Moine and Sgurr Beag thrust sheets in Area 4, located 30 km along strike to the NE of Area 3 (
Figure 1 and
Figure 2), indicate a top down to the ESE shear sense. Top down to the ESE shearing occurred under uppermost greenschist—lower amphibolite facies conditions (~475–575 °C) in the Moine thrust sheet and lower to possibly upper amphibolite facies conditions (~600–700 °C) in the overlying Sgurr Beag thrust sheet. This shear sense, at least in present day coordinates, suggests normal sense (extensional) motion on the Sgurr Beag thrust, while the presence of apparently hotter rocks in the hanging wall (based on both metamorphic and deformation criteria) suggests reverse sense motion. One simple possible explanation of these apparently conflicting observations is that original reverse sense motion on the thrust has been overprinted by pervasive normal sense shearing of the hanging wall and footwall rocks while they remained at close to peak temperatures.
U-Pb ages of 420 ± 3 Ma from Scandian matrix monazites at the base of the Sgurr Beag thrust sheet in Area 4 [
16,
95,
127] suggest that top down to ESE shearing here is significantly younger than both the top to the N shearing (tentatively interpreted here at 470–450 Ma) on the Sgurr Beag thrust along strike to the south in Area 3 and top to W shearing on the Moine thrust in Area 1 at ~430 Ma, and may be related to the closing stages of Scandian deformation, metamorphism and cooling/exhumation. In the Naver thrust sheet to the north of Area 4 (
Figure 1 and
Figure 2) Mako et al., [
23] have documented peak temperatures of Scandian metamorphism at 425 Ma followed by slow cooling that, possibly promoted by late-stage normal sense faulting near the top of the orogenic wedge [
100], accelerated after 420–415 Ma, with exhumation of the Moine metasedimentary rocks and deposition of overlying Emsian age Devonian sediments by 407–403 Ma.
We are aware of only two other sets of structures in the Caledonides of northern Scotland in which a top down to the east (normal sense) of motion has been documented. On the east side of the Kyle of Tongue, Holdsworth [
171] has described late brittle ESE-vergent outcrop-scale folds that detach onto ESE-dipping foliation planes that were interpreted to have formed in response to late Caledonian gravity-induced thinning of the orogenic wedge. On the Morar Peninsula to the south of Skye, Powell and Glendinning [
172] have documented top down to the east (normal sense) motion in the greenschist facies (chlorite grade) Rhue fault zone. Cross-cutting relationships with dated granitic intrusions indicate that the Rhue fault zone is younger than 425 ± 4.4 Ma, although the absolute age of normal sense motion on this structure is unknown.
11. Conclusions
We report an integrated microstructural and quartz c-axis fabric study from a 45 km long transect across the Caledonian Orogen in northern Scotland that extends from Loch Broom and Dundonnell (Area 1) in the west, through Loch Glascarnoch, Ben Wyvis and Rogie Falls (Areas 2 and 3), to the Creich Peninsula (Area 4) on the east coast. Quartz fabric analyses of Moine metasedimentary rocks in the Moine and Sgurr Beag thrust sheets in our study areas unequivocally demonstrate approximately plane strain deformation conditions for all samples and that mineral grain shape lineations are parallel to the maximum principal stretch direction, indicating they developed parallel to, and track, the local transport direction.
Microstructures and c-axis fabrics in samples from Area 1 demonstrate a progressive change from top to the W, through top to the NW, to top to the NNW shearing traced southeastward and upwards within a ~4 km thick belt of planar, gently dipping Moine mylonites and schists lying directly above the Moine thrust. Further to the east in Area 2 microstructures and fabrics indicate top to the N shearing that predates formation of km-scale W-vergent folds that are thought to detach on the underlying Moine thrust. Further east again in Area 3 microstructures and fabrics in both the upper part of the Moine thrust sheet and the overlying Sgurr Beag thrust sheet indicate top to the NNE shearing. Top to the west shearing in the Moine mylonites immediately above the Moine thrust occurred under greenschist facies conditions, while top to the NW/N/NNE shearing in the overlying and more hinterland parts of the Moine thrust sheet and overlying Sgurr Beag thrust sheet occurred under lower amphibolite facies conditions. Our microstructural data indicate that, at least in the Garve–Ben Wyvis region (Area 3), the Sgurr Beag thrust was active during top to the N shearing. Traced from northwest to southeast across Areas 1-3 the zone of top to the NNW/N/NNE shearing is at least 55 km wide in map view after allowing for restoration of the later km-scale W-vergent folds in Area 2, with its easternmost extent unknown as it is overlain by younger Devonian sedimentary rocks.
Previously published Rb-Sr white mica data indicate that top to the W shearing at c. 430 Ma in mylonites immediately above the Moine thrust in Area 1 is of Scandian age, while U-Pb ages from the Sgurr Beag thrust sheet in Area 3 on matrix monazite in metasedimentary rocks and titanite in a sheared amphibolite of c. 454 and 468 Ma, respectively, are tentatively interpreted as indicating that the grain shape fabrics associated with top to the N shearing may be of Grampian or slightly younger age. Based on microstructural data, we tentatively suggest that the most likely location in Area 1 at which potential Grampian age amphibolite facies structures associated with top to the N shearing transition downwards into undoubted Scandian greenschist facies structures associated with top to the W shearing is at approximately 1000–1500 m above the Moine thrust within the 4 km thick belt of planar gently dipping Moine mylonites and schists lying directly above the thrust surface. Our microstructural data also indicates that the relatively low grade Moine mylonites close to the underlying Moine thrust in Area 1 have not been produced by low temperature reworking of the overlying higher temperature tectonites, suggesting that the basal section of Moine metasedimentary rocks were originally in a more proximal (foreland) position at a much shallower crustal level than the now overlying higher grade Moine rocks associated with top to the NW and N shearing. This in turn requires the presence of a major previously unrecognized fault or shear zone, probably at a structural distance of ~500–1000 m above the Moine thrust, on which originally deeper and more hinterland positioned metasedimentary rocks (including most of the Moine thrust sheet and the overlying Sgurr Beag thrust sheet) have been transported laterally to the NW to structurally overlie the shallower more foreland positioned metasedimentary rocks that were mylonitized during top to the W shearing on the underlying Moine thrust.
In contrast to Areas 1–3, microstructures and quartz fabrics in the small coastal exposure of the Moine and Sgurr Beag thrust sheets on the east coast in Area 4 indicate top down to the ESE shearing under uppermost greenschist–lower amphibolite and lower to possibly upper amphibolite facies conditions, respectively. This shear sense suggests at least local normal sense (extensional) motion on the Sgurr Beag thrust, while the presence of apparently hotter rocks in the hanging wall suggests reverse sense motion. One simple explanation of these apparently conflicting observations is that original reverse sense motion on the thrust has been overprinted by pervasive normal sense shearing of the hanging wall and footwall rocks while they remained at close to peak temperatures. U-Pb ages of c. 420 Ma from Scandian matrix monazites at the base of the Sgurr Beag thrust sheet in Area 4 suggest that top down to ESE shearing here is significantly younger than both the top to the N shearing at c. 470–450 Ma on the Sgurr Beag thrust along strike to the south in Area 3 and top to W shearing at c. 430 Ma, on the Moine thrust in Area 1, and may be related to the closing stages of Scandian deformation, metamorphism and cooling/exhumation.


 ,
, 

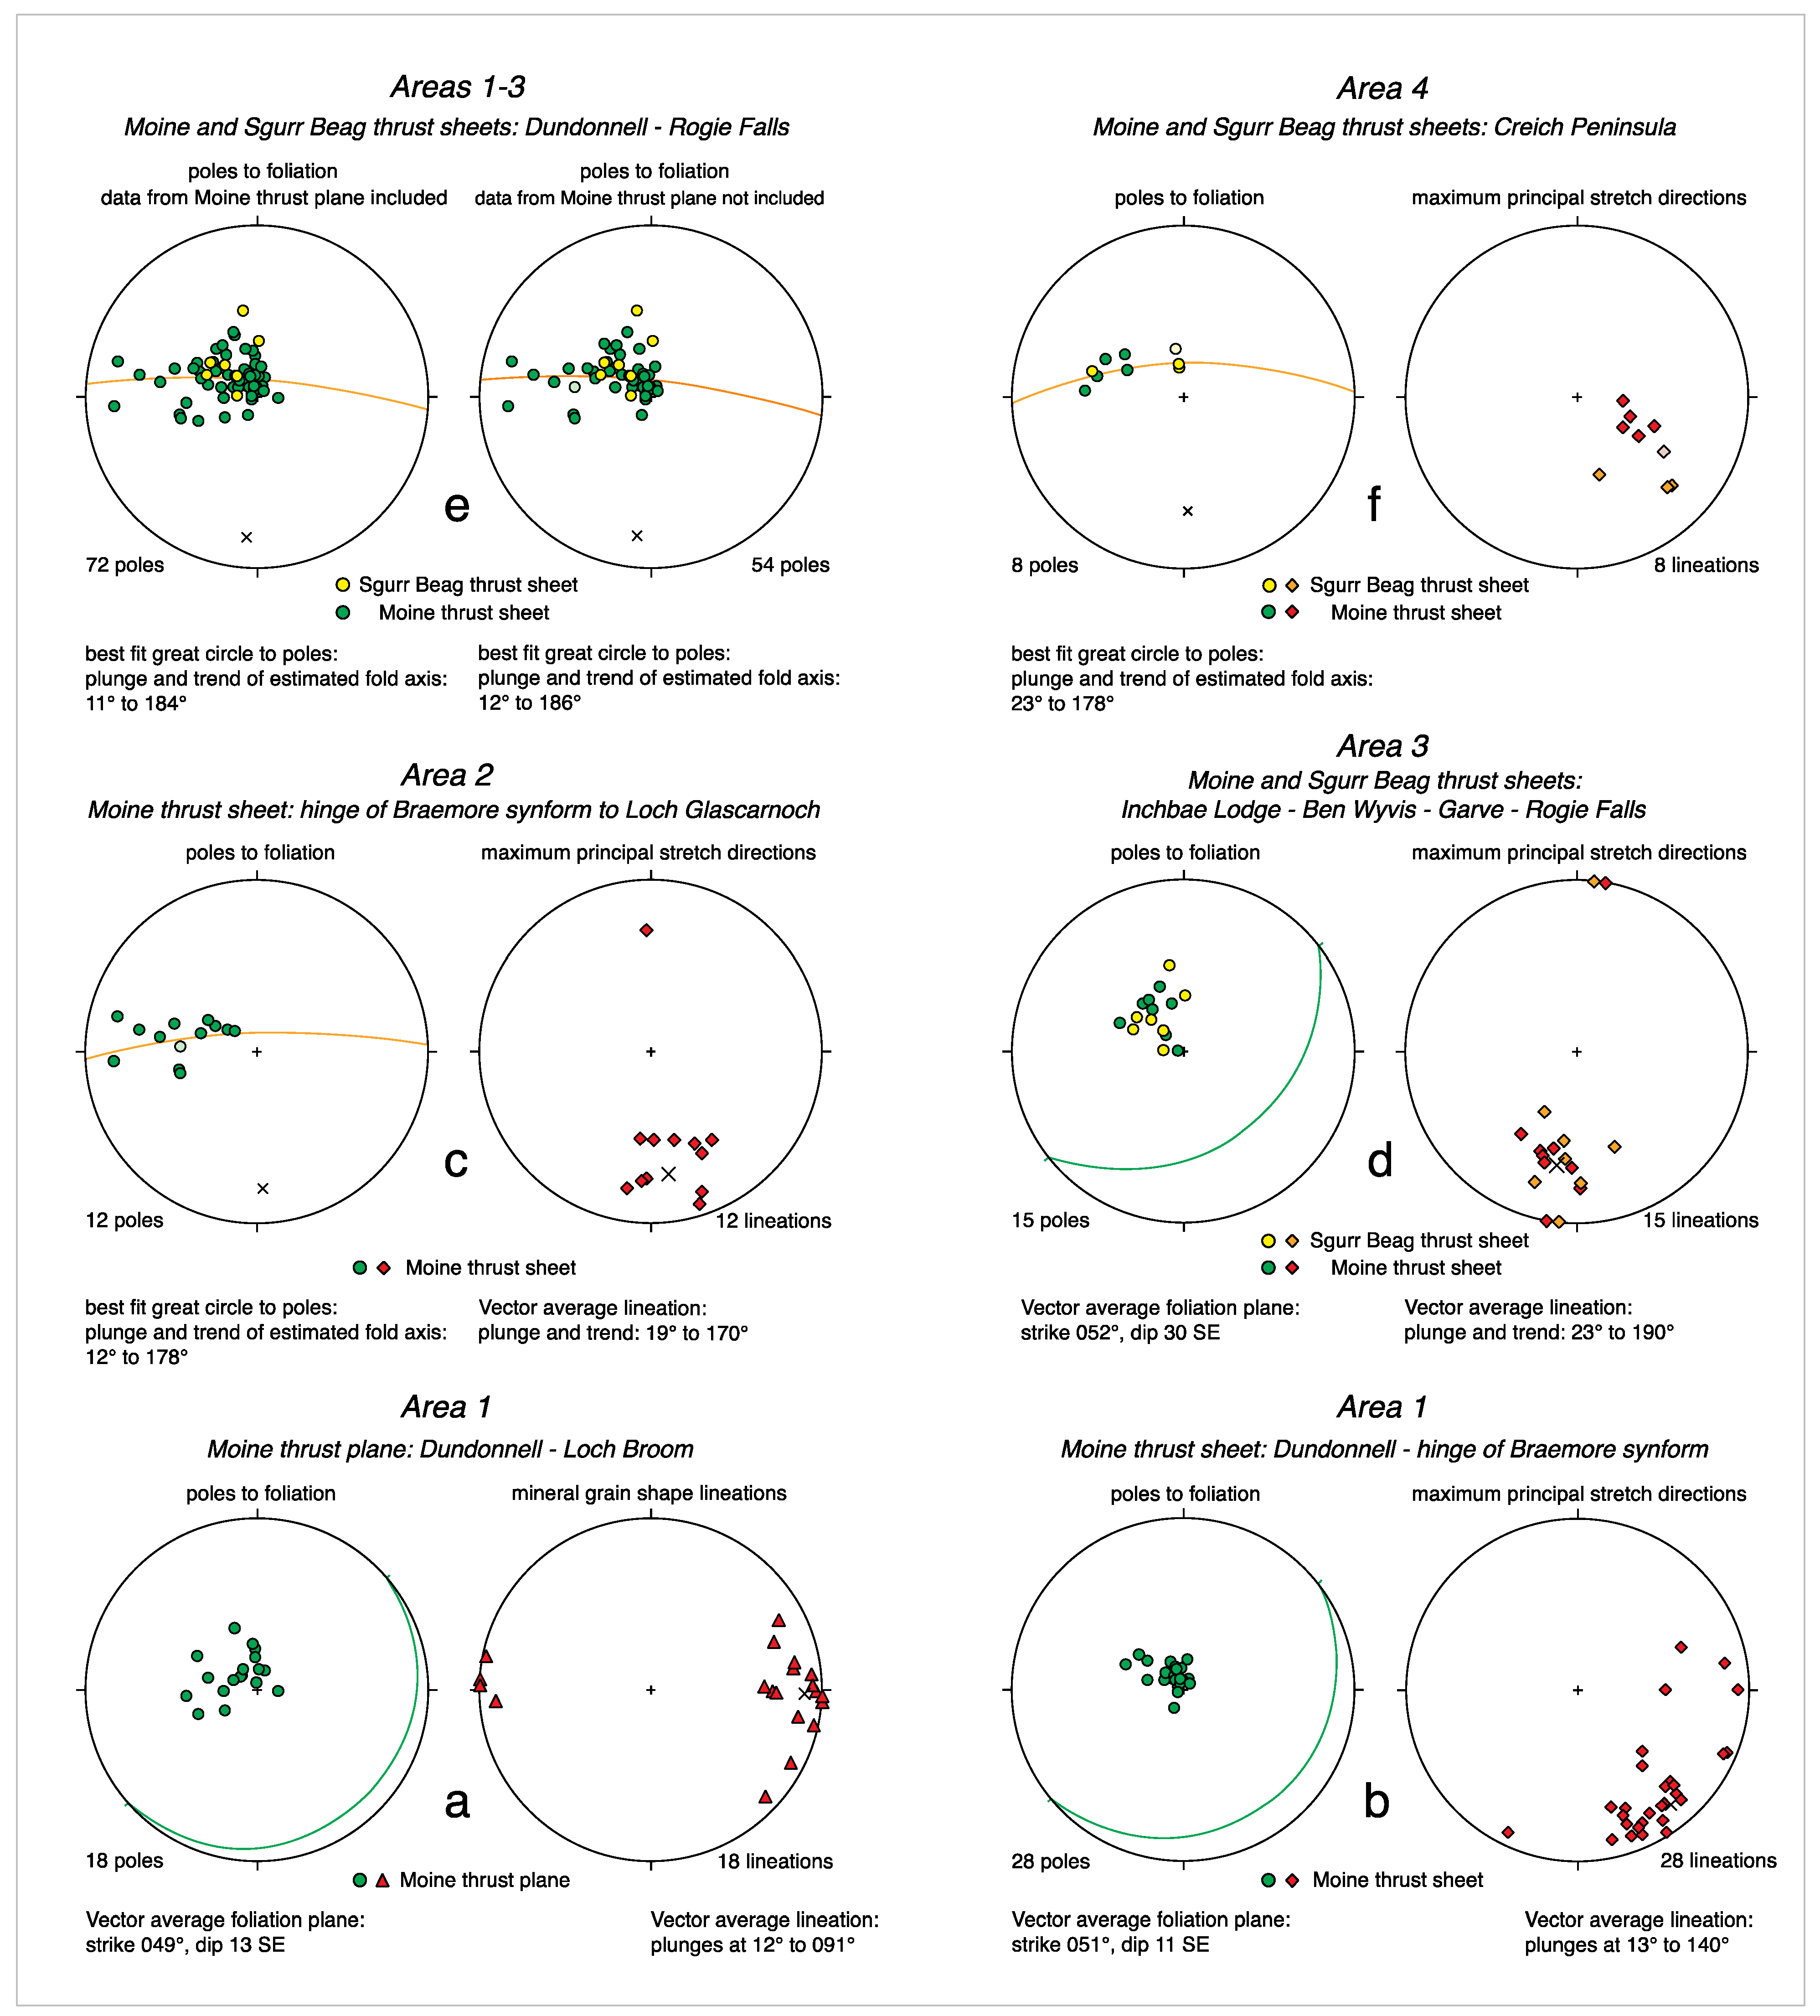
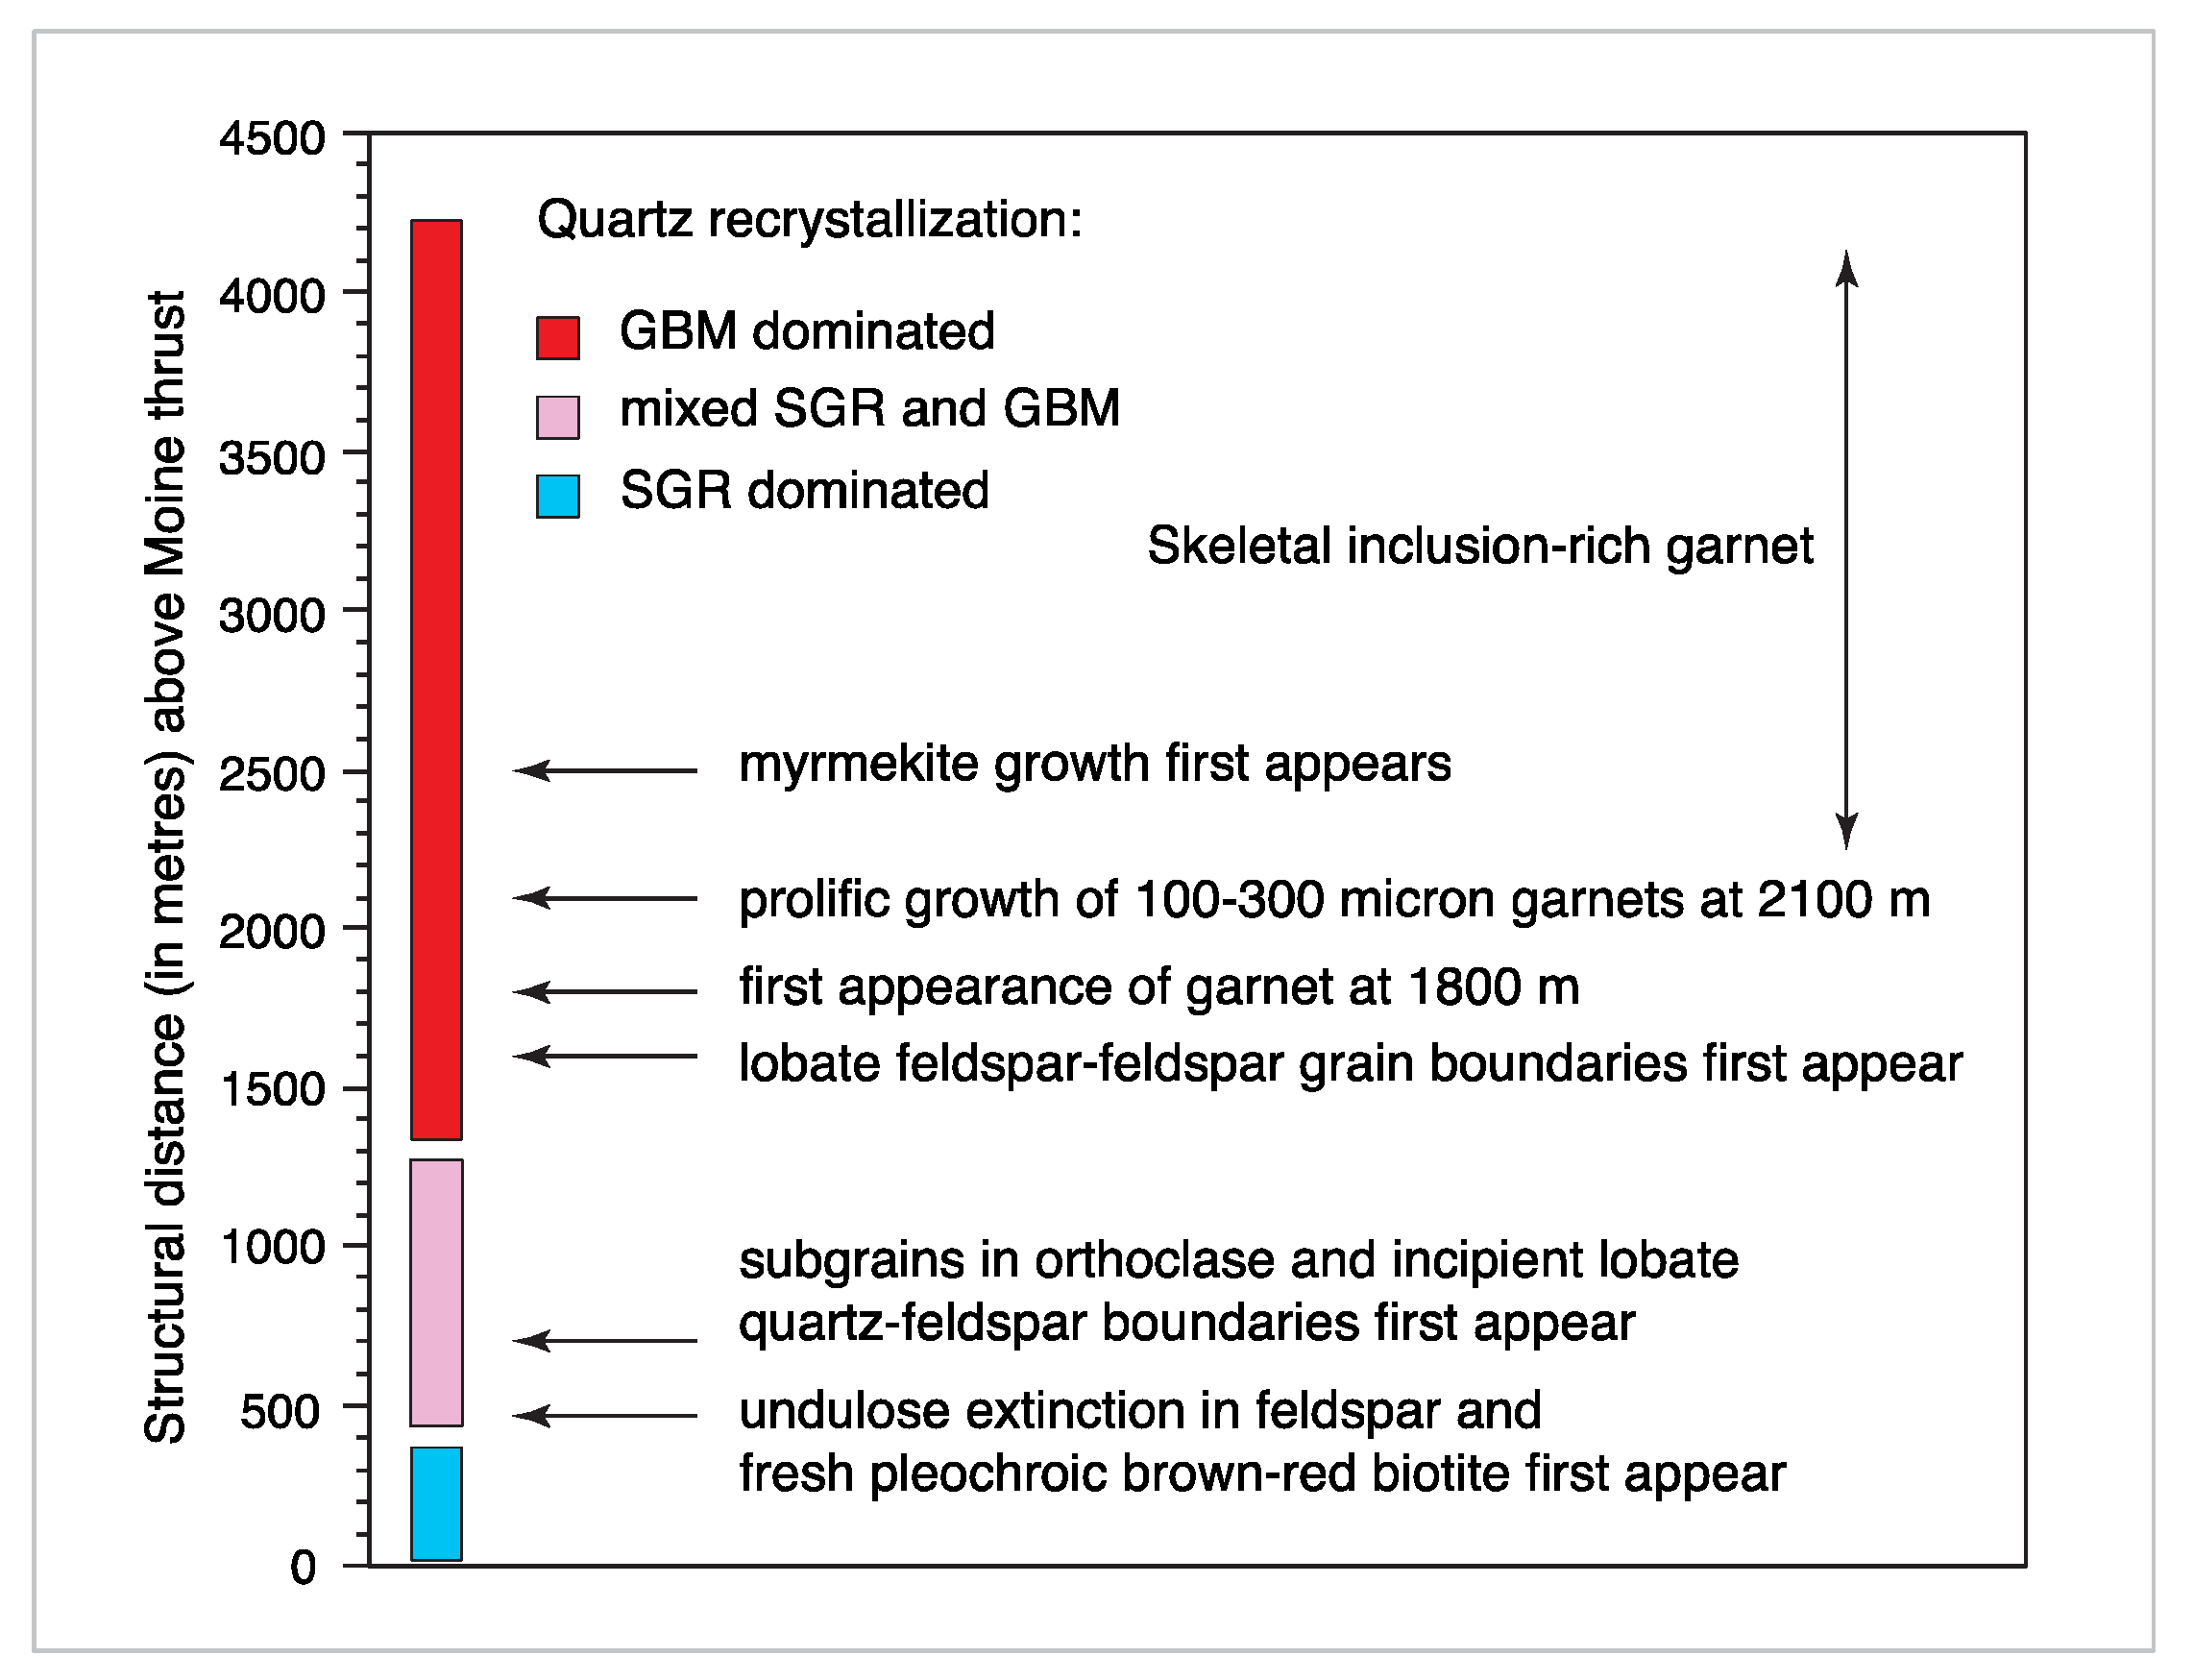
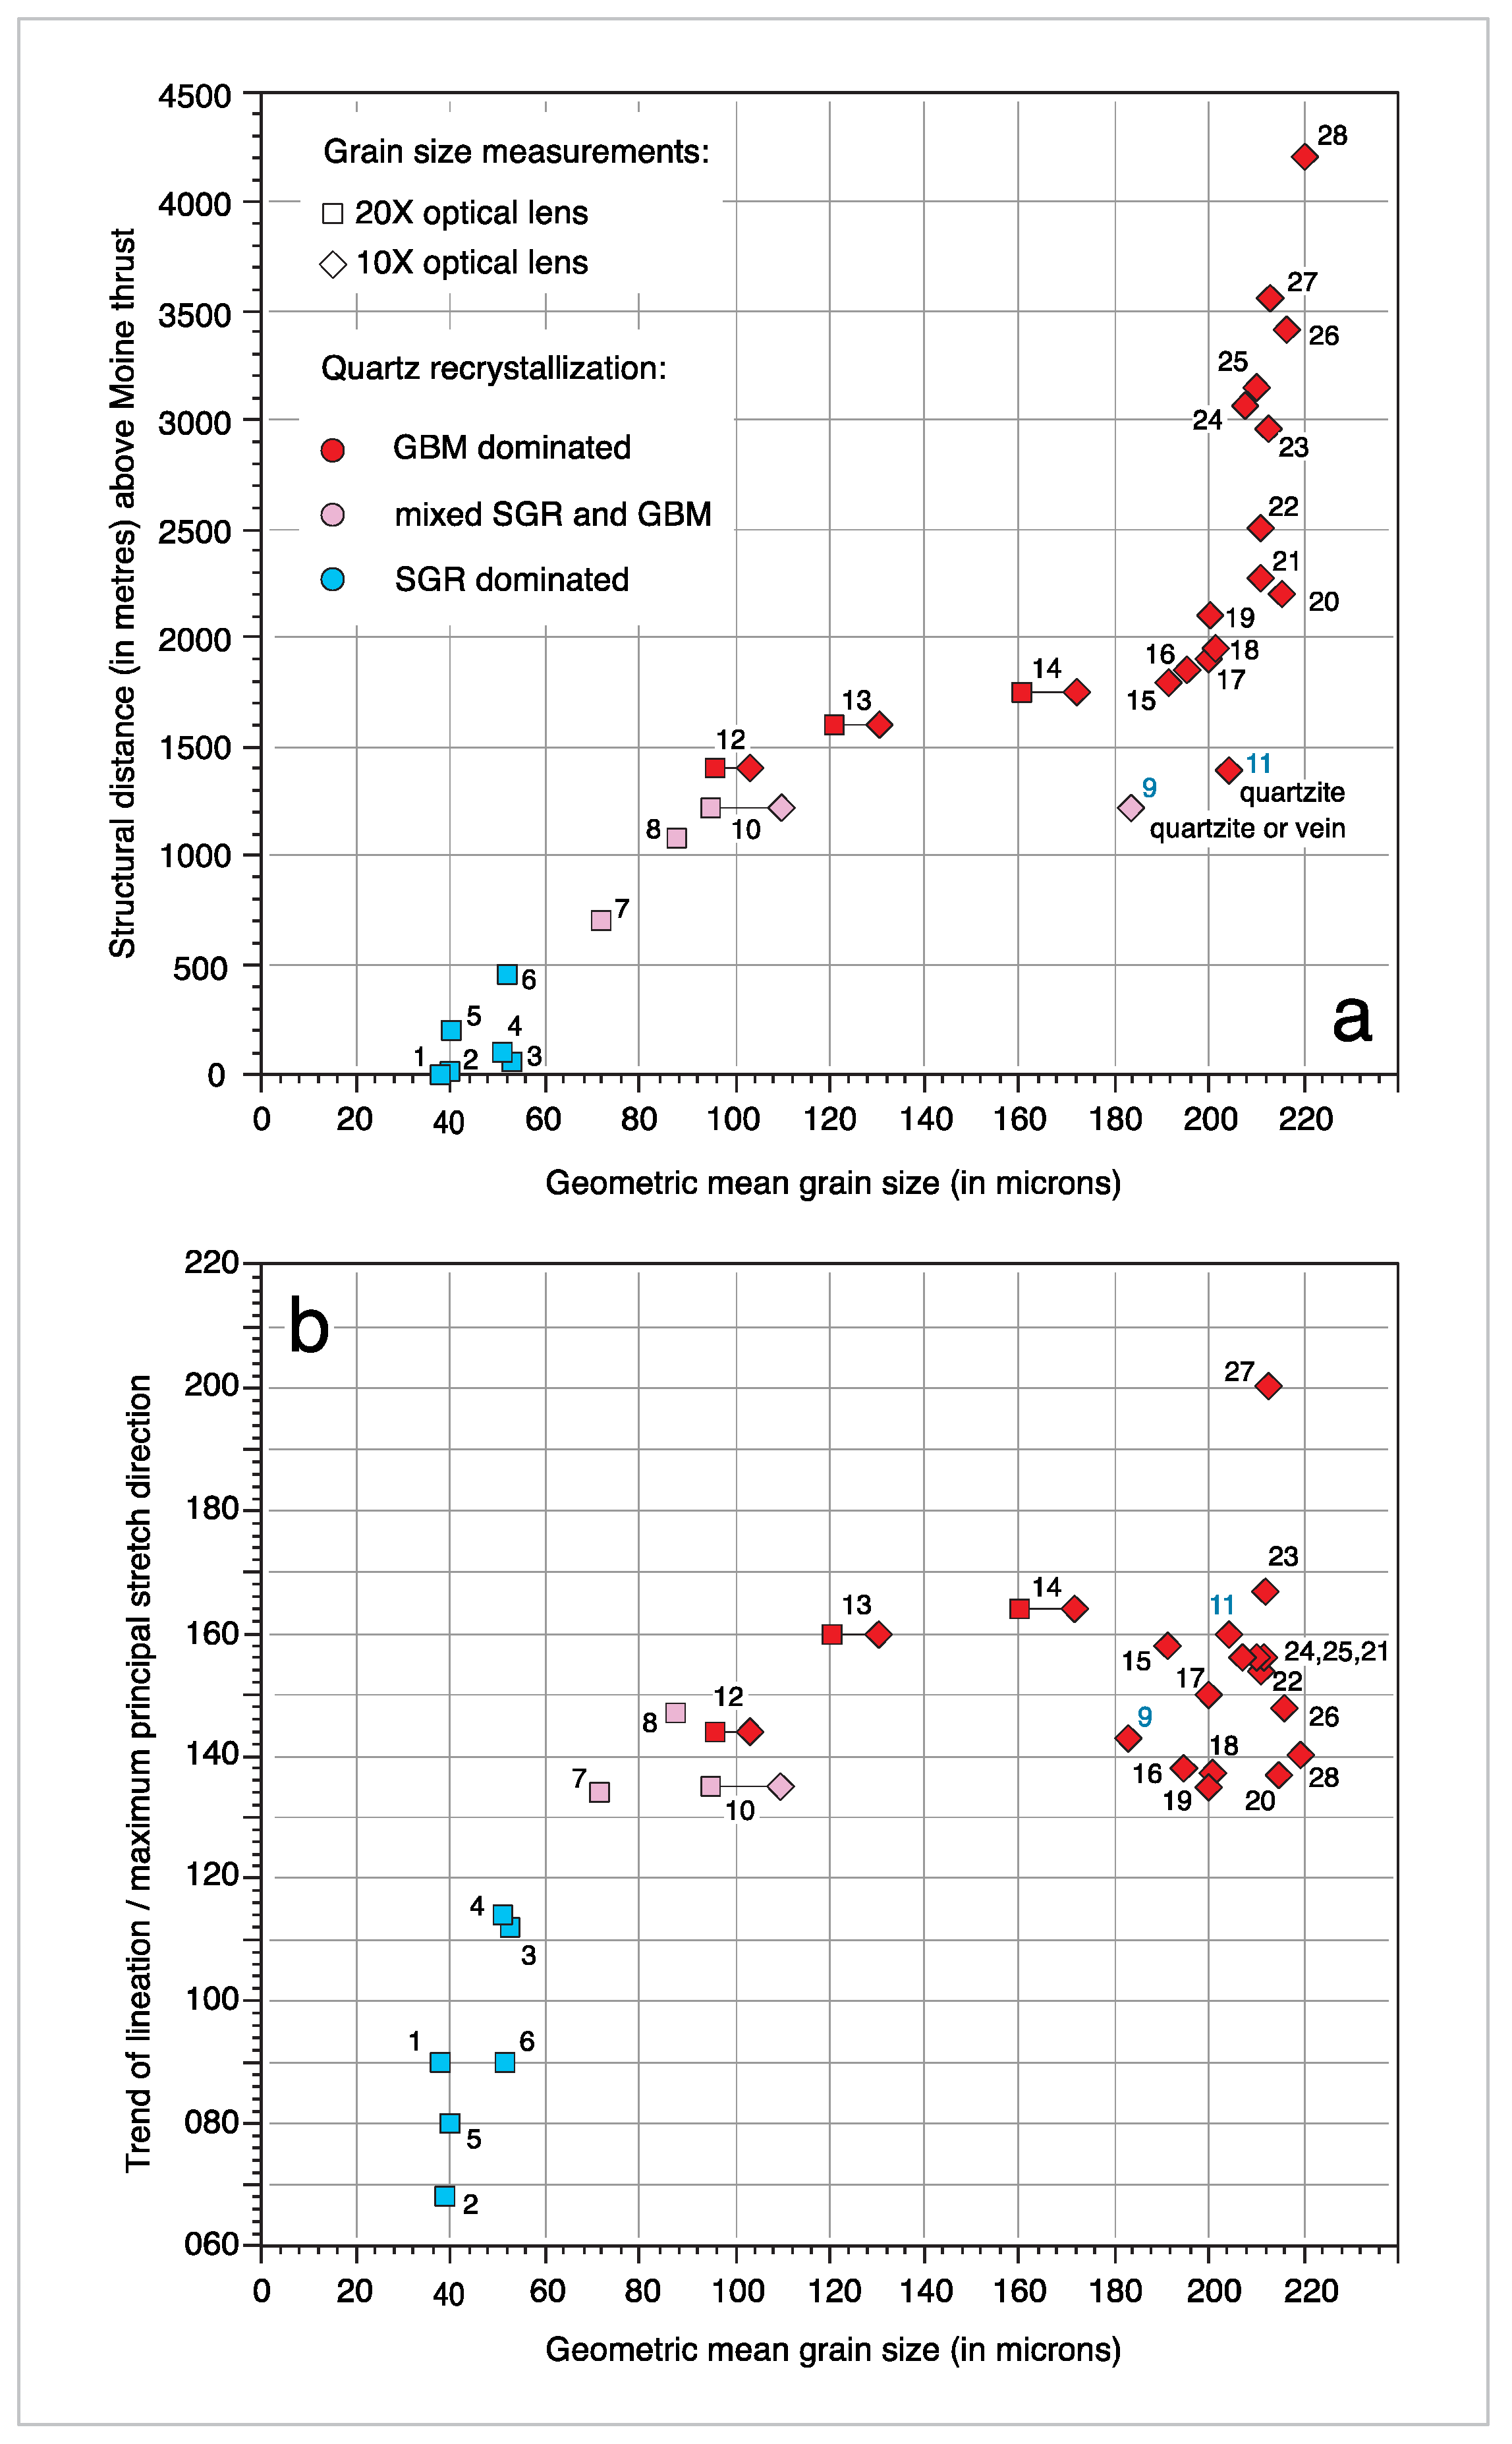
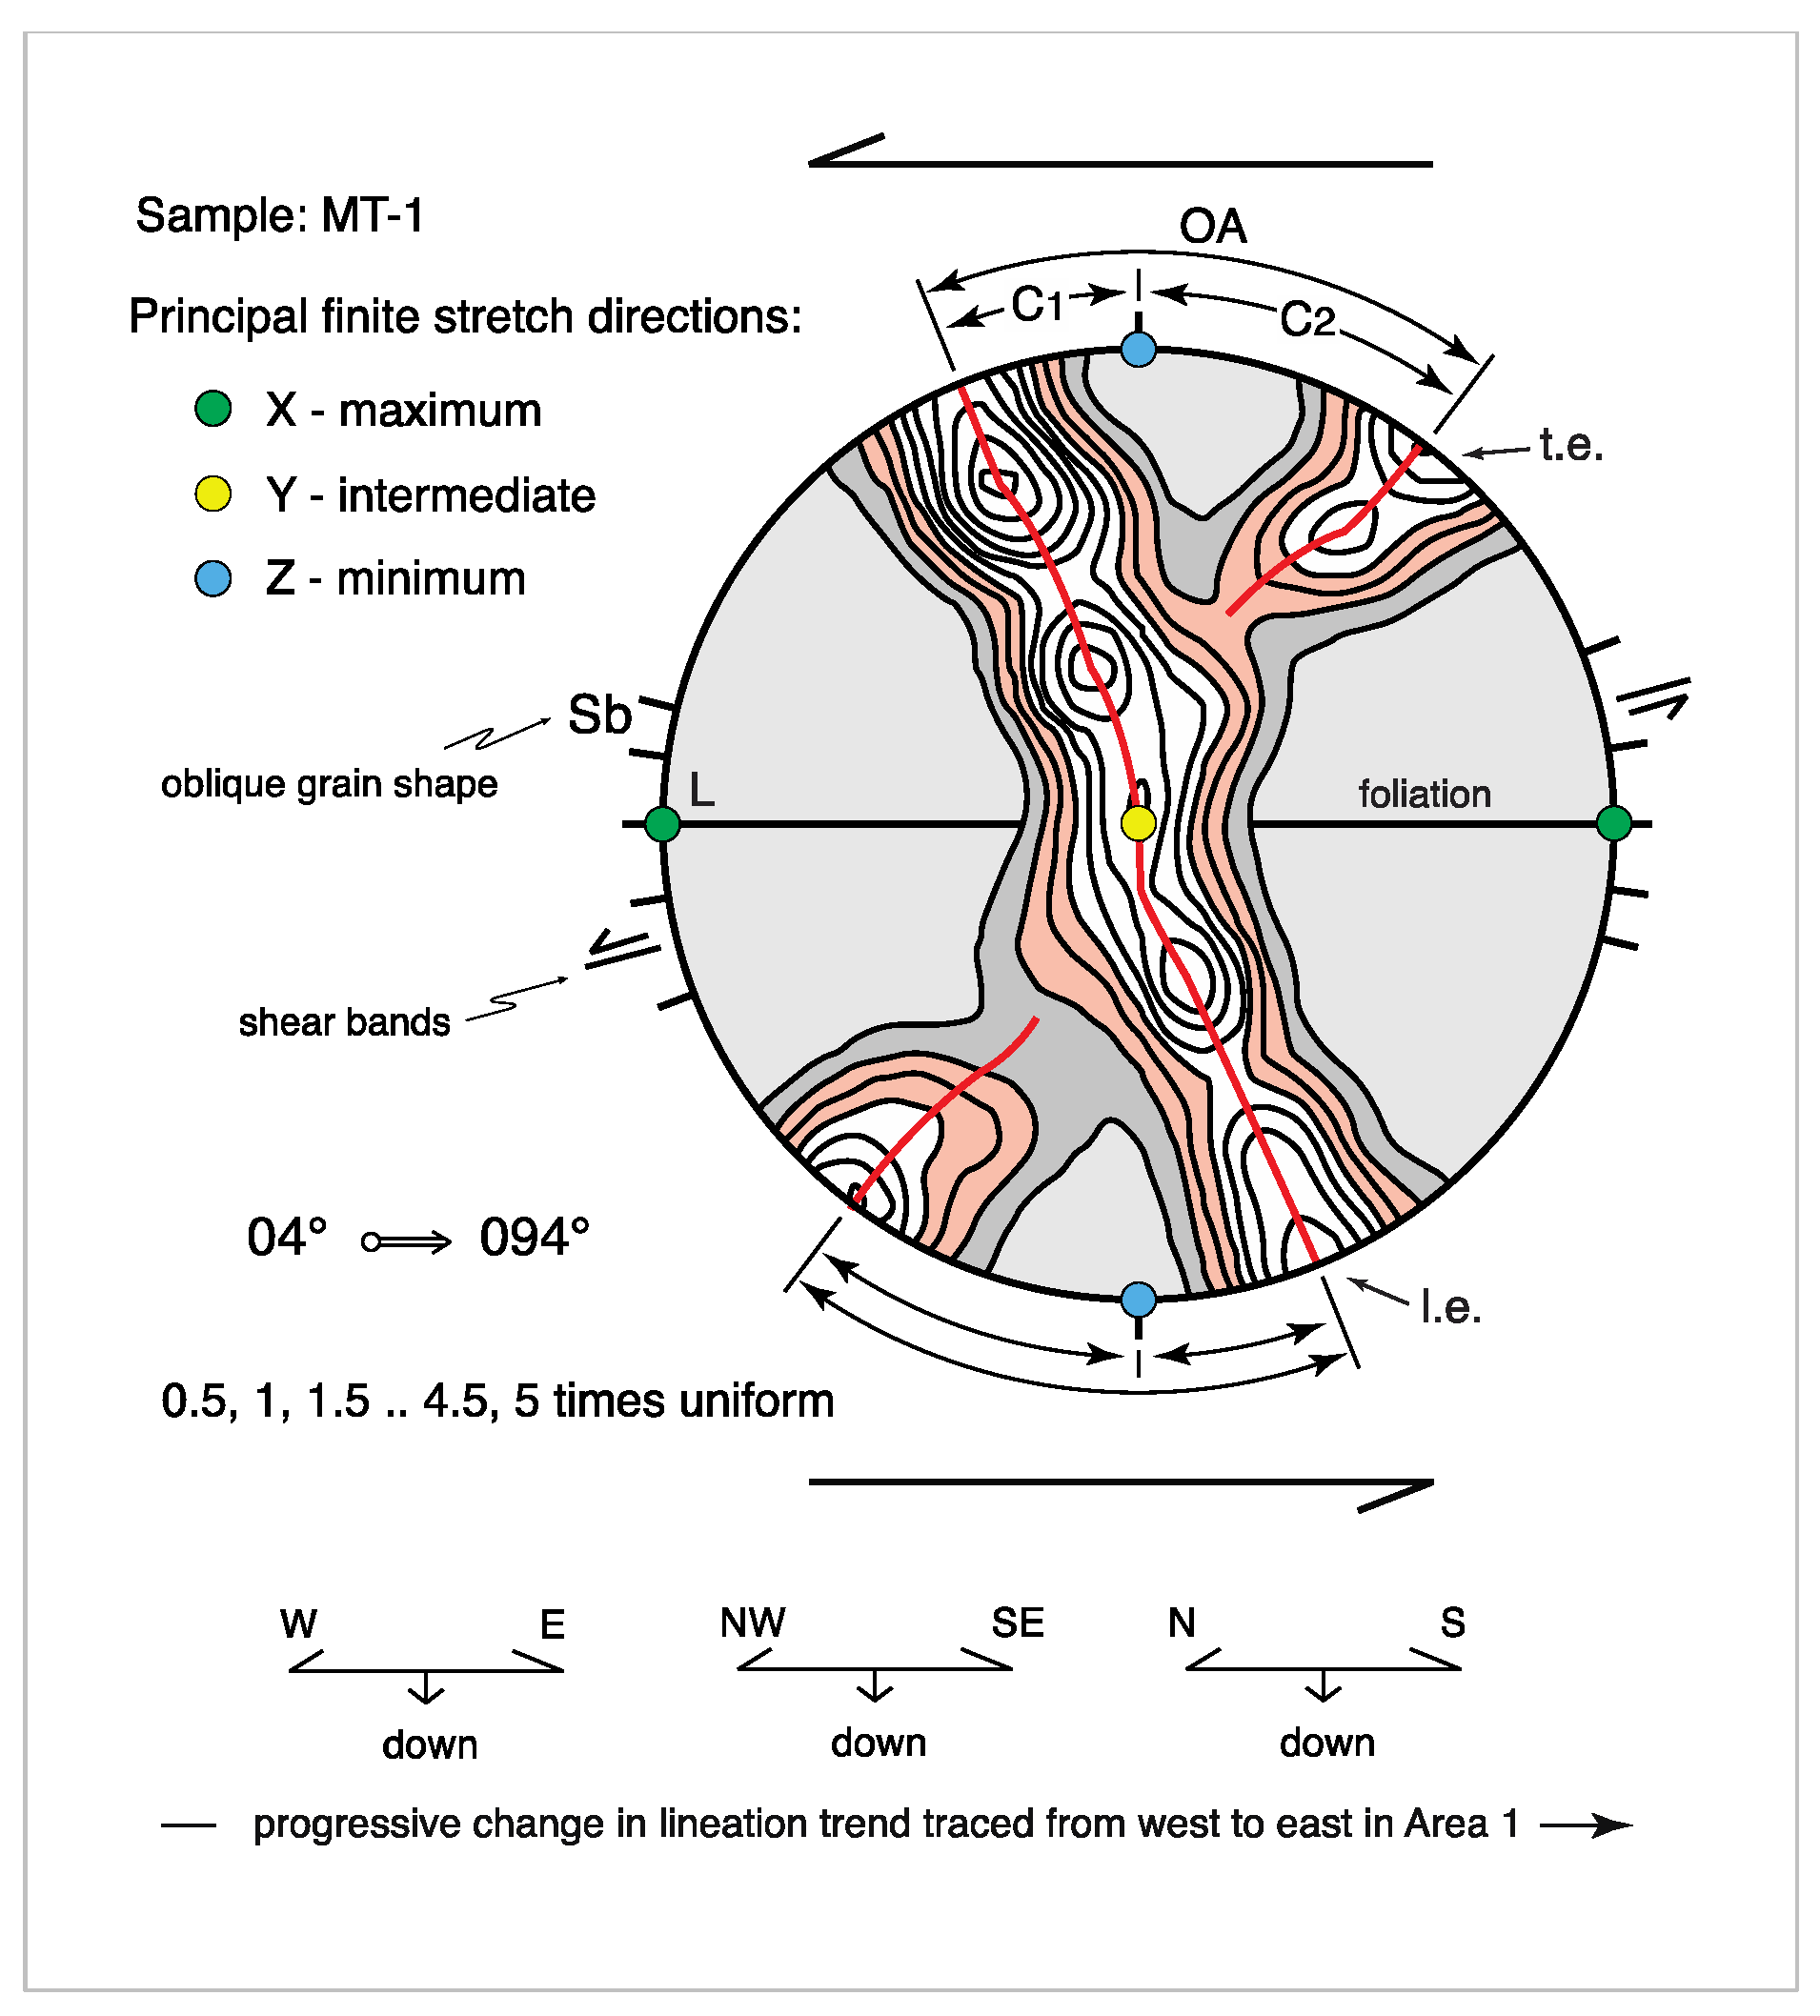