1. Introduction
Fossil fuels have been the mainstay of energy requirements for most of the global community from the earliest to the most recent industrial revolutions. However, the release of carbon, and other greenhouse gases, in significant abundance, has caused global environmental changes that require urgent solutions. Climate change caused by anthropogenically-induced global warming requires the establishment of efficient and effective counter-measures. Response and adaptation to climate change is being sought through the more efficient use of existing energy resources, the supply of new and renewable energy resources, and the reduction and absorption of carbon dioxide and other Greenhouse Gas Emissions [
1].
Some of the Pacific Island Countries and Territories, particularly low-lying atolls, act as ‘early warning systems’ for environmental change impacts, such as sea level rise, variable and less predictable rainfall patterns, and higher average land temperatures. Countries such as Kiribati and Tuvalu, which are low-lying atoll nations, have produced an infinitesimal share of global greenhouse production, and yet may face the most adverse consequences of climate change, even perhaps the loss of their countries to sea-level rise [
2]. The aspirations of the United Nations Sustainable Development Goals (SDGs) [
3] for food <SDG#2>, water <SDG#6>, and energy <SDG#7> is an existential goal for the survival and development of the Pacific Islands, as well as the public prosperity of mankind [
4].
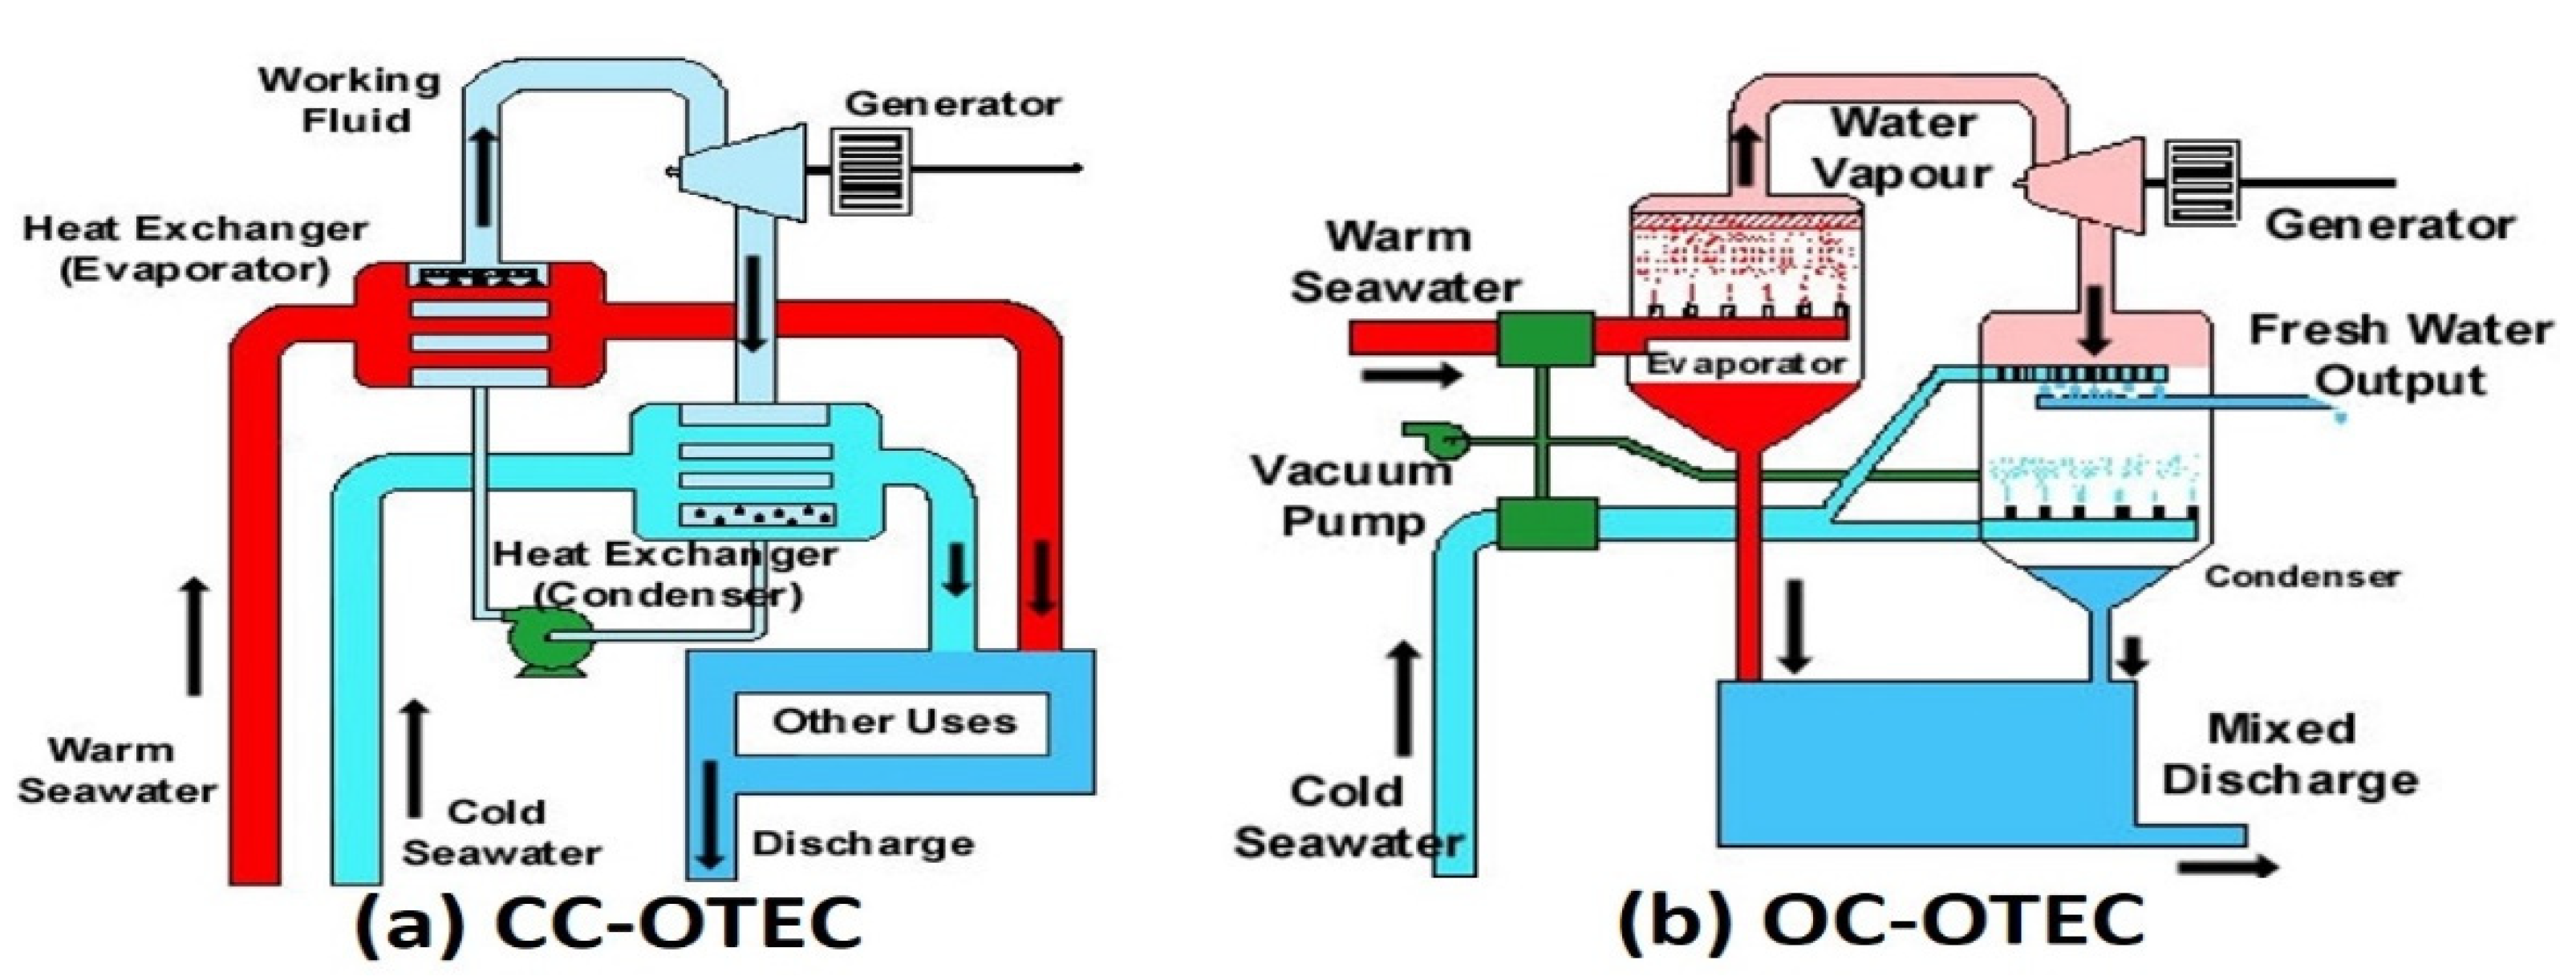
Within the global tropical belts, situated between 20 degrees latitudes, north and south of the equator, warm sea-surface water temperatures (20–30 °C) are present throughout the year, whilst the deeper ocean waters (at depths =/> 1000 m) are at a constant temperature of c. 5 °C. This thermal gradient between surface and deeper seawaters provides the physical background for ocean thermal energy conversion (OTEC). An engineering principle, termed Rankine cycle power generation, can use the thermal gradient to generate power. Whilst at the moment OTEC is not a large-scale commercial reality, a number of organizations are developing small-scale OTEC plants, both land and sea-based, with the vision that, one day, the plants will become large enough to attract commercial interest. Ocean Thermal Energy Conversion (OTEC) power generation has been evaluated as being particularly appropriate to the equatorial Pacific Island countries, due to the excellent temperature conditions, and the existence of small island developing states with more limited energy options compared to large contiguous continental settings. OTEC can continuously generate electricity, day and night, all year round [
5].
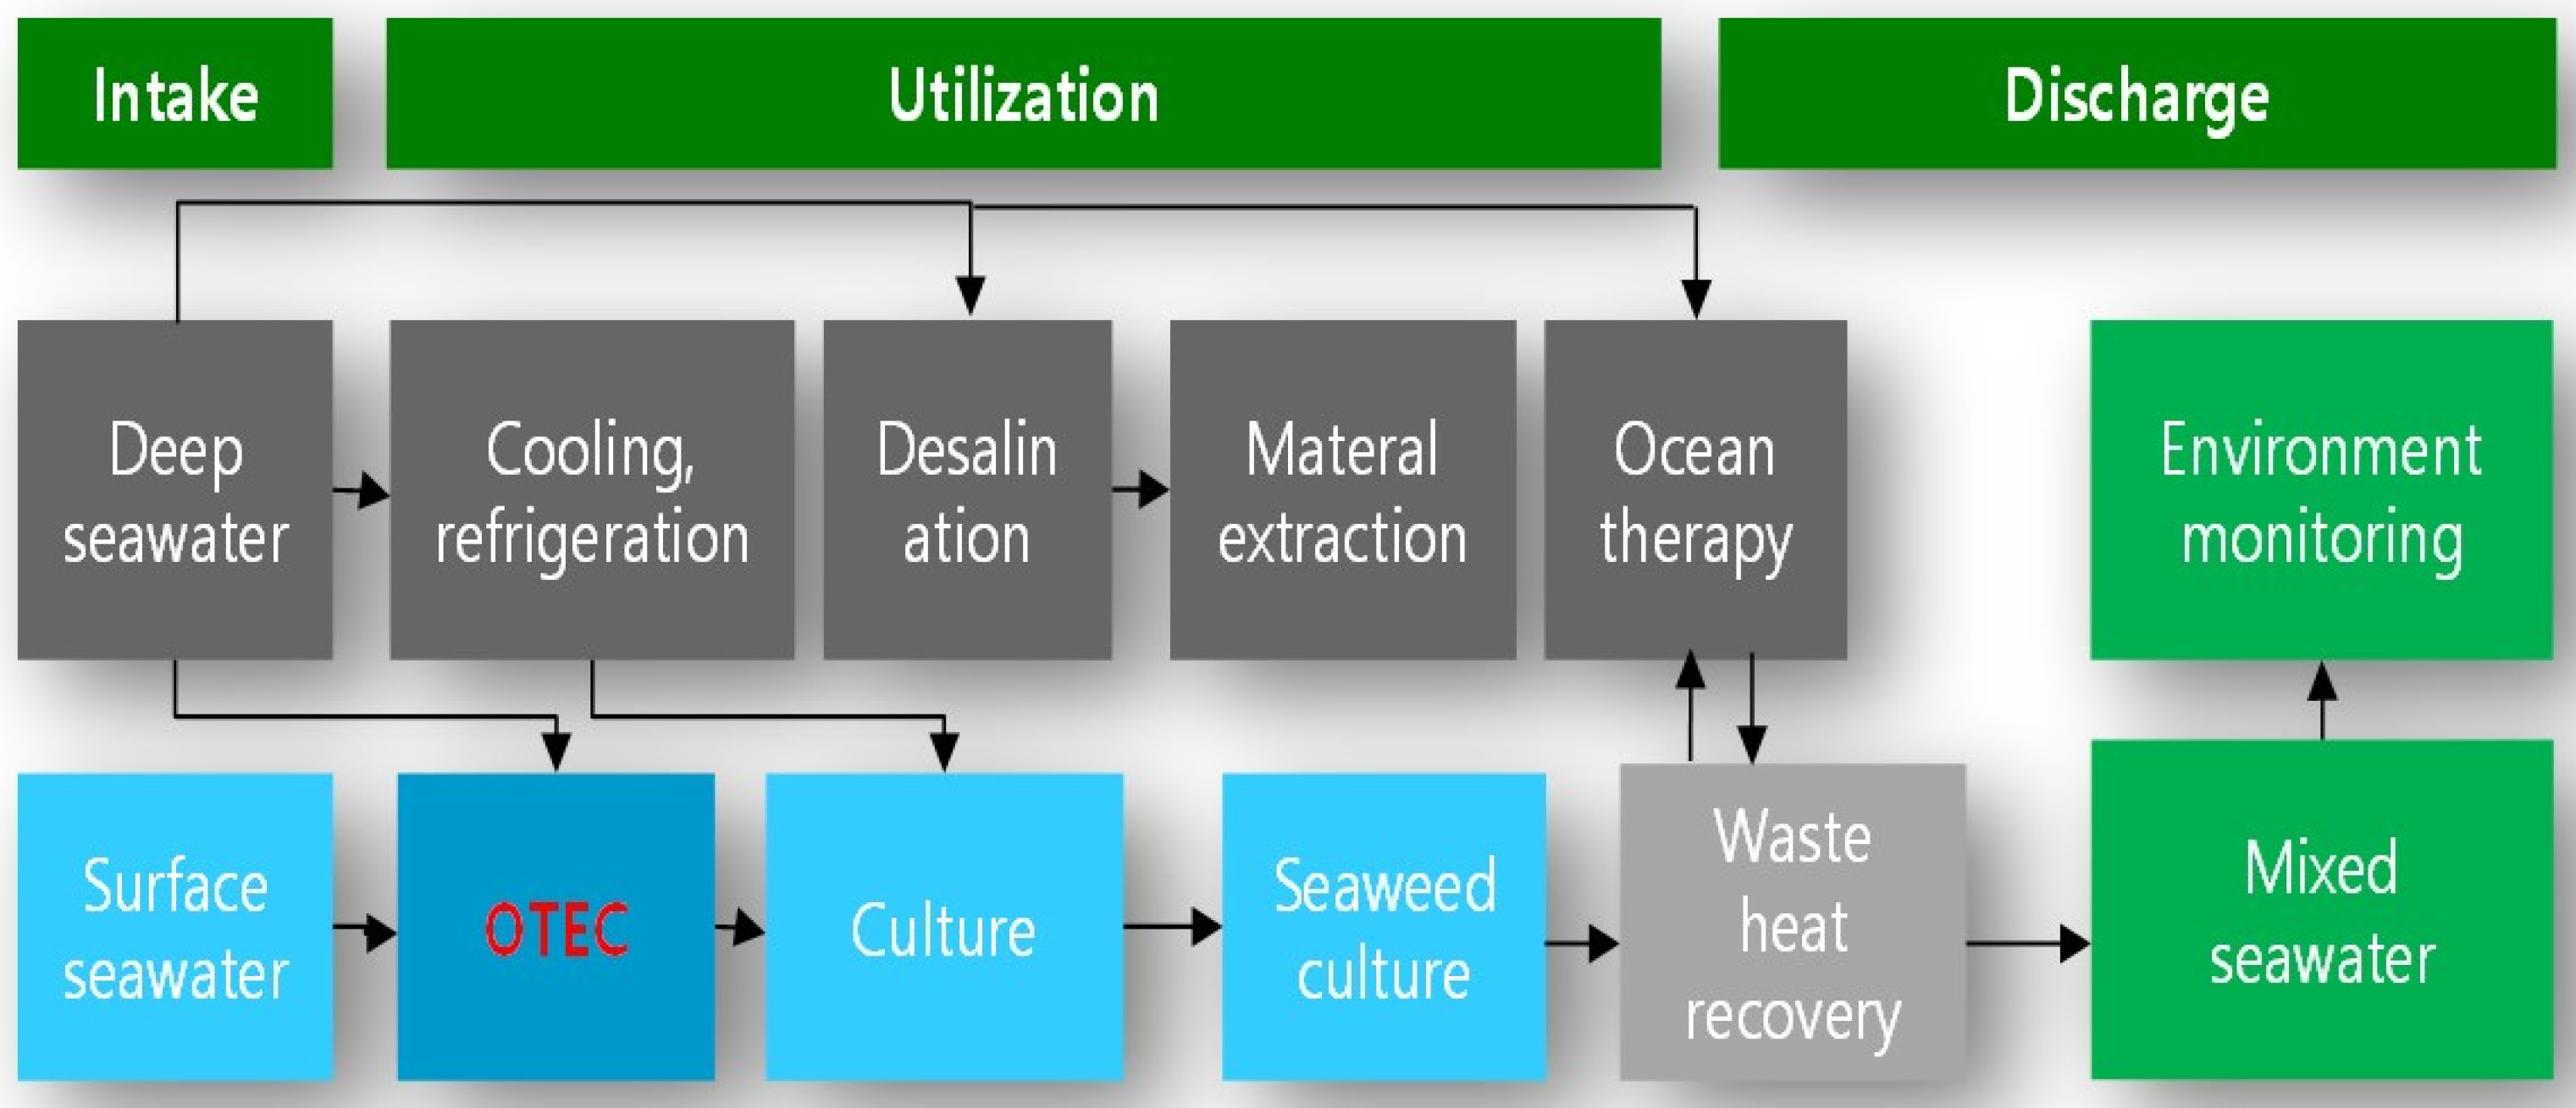
OTEC plants are flexible systems that can provide a lot of outputs, beyond only electricity. For example, OTEC plants can provide regional cooling and heating systems, desalinate seawater, extract seawater minerals, assist with aquaculture through the provision of waters at variable temperatures, and hydroponic cultivation using discharged water, as well as generating green-clean electricity responsible for country-base-load requirements. The Pacific Islands region is also attractive globally to the fishing industry for tuna in particular, and to the mining industry for the development of seabed mining industries [
1]. Currently, tuna caught in the tropical belt fishing grounds are being transported directly to the large Asian and European/North American markets, or overseas processing plants. Whilst Pacific Island states will explore all options available for economic development, we argue that the provision of electricity from OTEC plants, alongside seawater-utilisation technologies, such as seawater-minerals for the cosmetics industry, and aquaculture, offer other opportunities for the diversification of livelihoods. The realisation of OTEC technologies could significantly improve livelihoods and the economy, whilst minimizing carbon footprints [
2].
This paper introduces the Research and Development status from the principle of OTEC, and examines the social acceptance of power generation cost based upon the current status of local electricity supply and rates. Scenarios where OTEC can assist with industries such as seabed deep-sea minerals, aquatic product manufacture, and the provision of freshwater from desalination is reviewed.
3. Distribution and Capacity of Ocean Thermal Energy
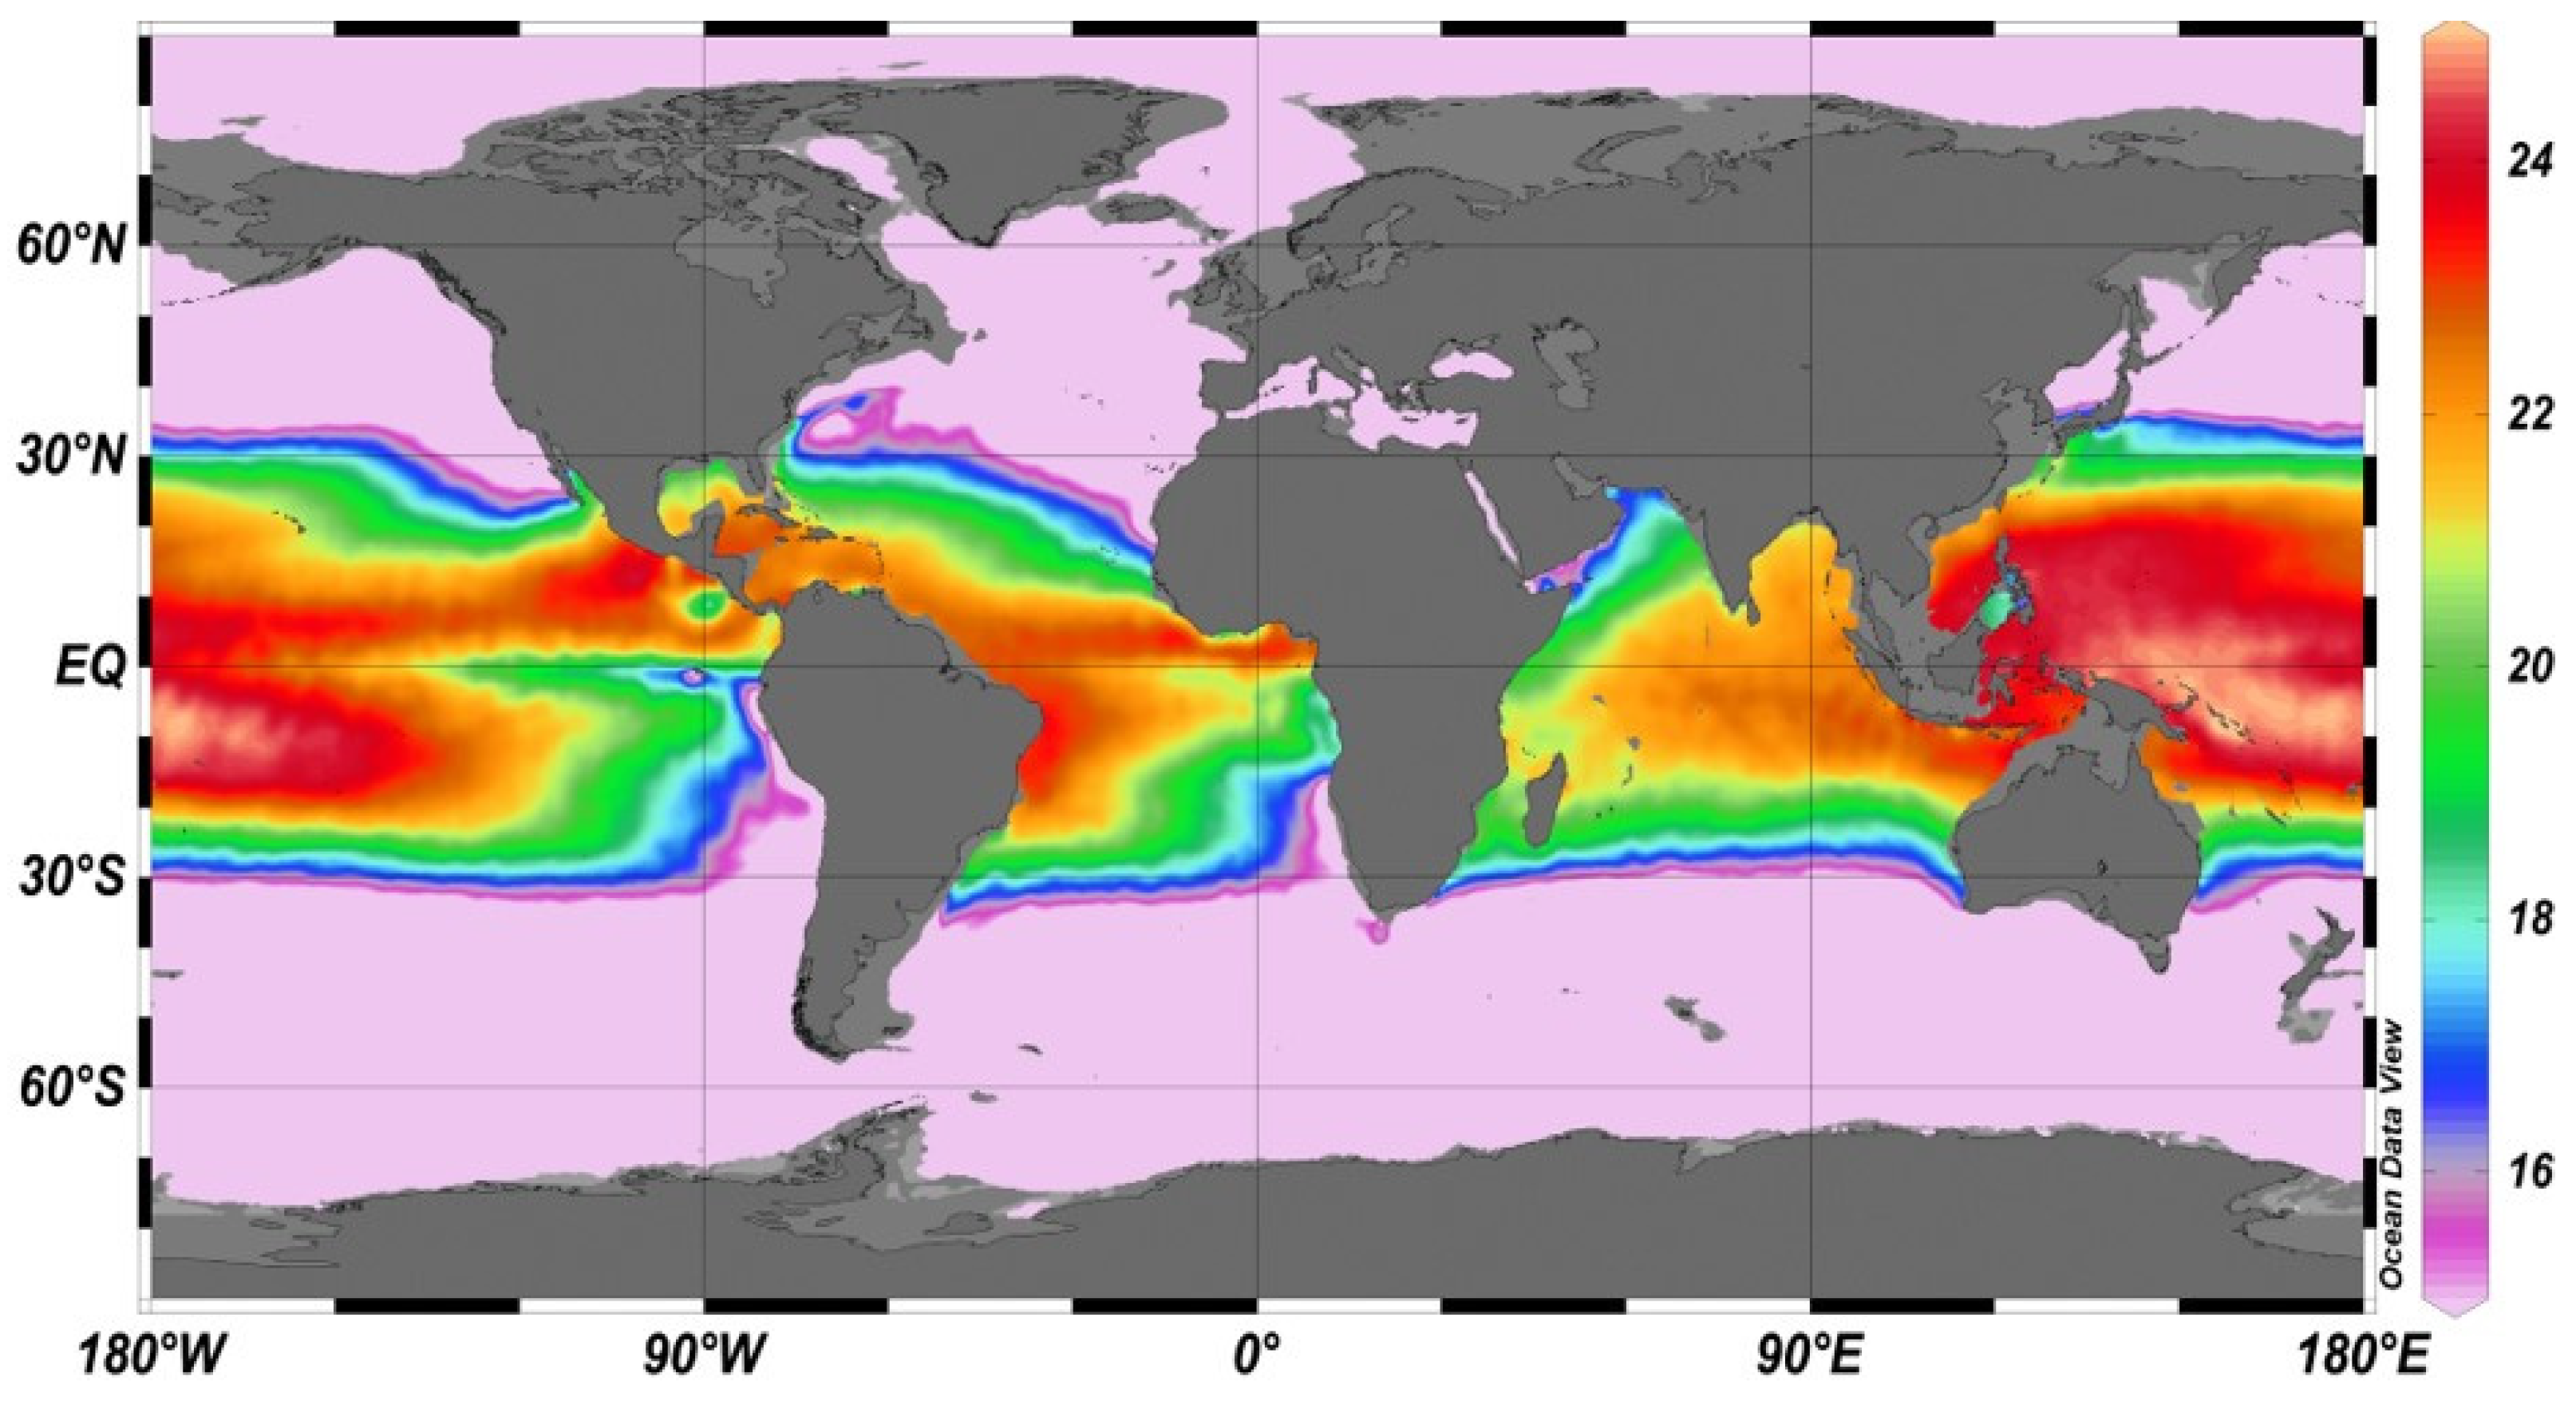
The minimum differential temperature between the surface and deeper ocean waters that can operate an OTEC plant is 17–18 °C. OTEC plants operate to maximum efficiency when located in regions that can sustain a 17–18 °C minimum temperature differential for all or most of the year. The average temperature of the upper part of the ocean that can be used as a seawater heat source is 12.6 °C. The middle ocean depths are maintained at a temperature of around 3.8 °C, and the deepest ocean temperatures are around 1 °C or less. Whilst there is relatively little change in water temperatures in the middle and deep layers of the ocean throughout the year, the upper layers are strongly influenced by ocean currents, solar insolation, and energy flows. Average sea surface temperatures can be higher than 28 °C at the equator, and as low as 0 °C in the polar regions. In the mid-latitude waters around Korea, sea-temperatures at depths of 200 m or more are constant throughout the year, but the upper layer fluctuates between 8 and 26 °C due to seasonal changes [
9]. Therefore, in the case of the Korean sea area, it is estimated that the utilization rate of OTEC (the percentage of time throughout the year whereby OTEC is technically possible) will reach about 38%, based on a temperature difference of 18 °C or more. However, in tropical and subtropical seas (between 20 degrees south latitude and 20 degrees north latitude,
Figure 2) the annual operation rate is judged to be close to 100%.
The annual available capacity of OTEC is estimated to be 80,000 TWh [
10], or more than three times the current global electricity demand (24,000 TWh). OTEC resources are fully renewable, and, in theory, inexhaustible. They can continuously produce electricity and do not require electricity storage devices.
As the change of convection due to global warming has mutual influence with the change of output of OTEC plant as long as the background of thermohaline circulation (THC) is strong enough (e.g., 15.6 Sv at its present-day value), large OTEC flows will not significantly disturb it [
11]. In addition, conditions that can increase the output of OTEC plant occur depending on various variables such as the temperature and change period of global warming, and the intensity of the Atlantic THC [
12].
Traditional OTEC technologies use the temperature difference between deep ocean water and surface seawater (17–24 °C) [
13], and, if it is possible, can additionally utilize other locally available heat resources (e.g., solar energy, geothermal energy, hot water resources, incineration heat, etc.) where deep ocean water is available. OTEC technology efficiencies can be significantly increased by the thermal addition of additional energies (solar, geothermal etc.) as this increases the thermal gradient of the power plant (to 30–80 °C, rather than the c. 18–25 °C from ocean temperature differentials alone) [
14].
4. Technology Development and Industrial Trend of OTEC
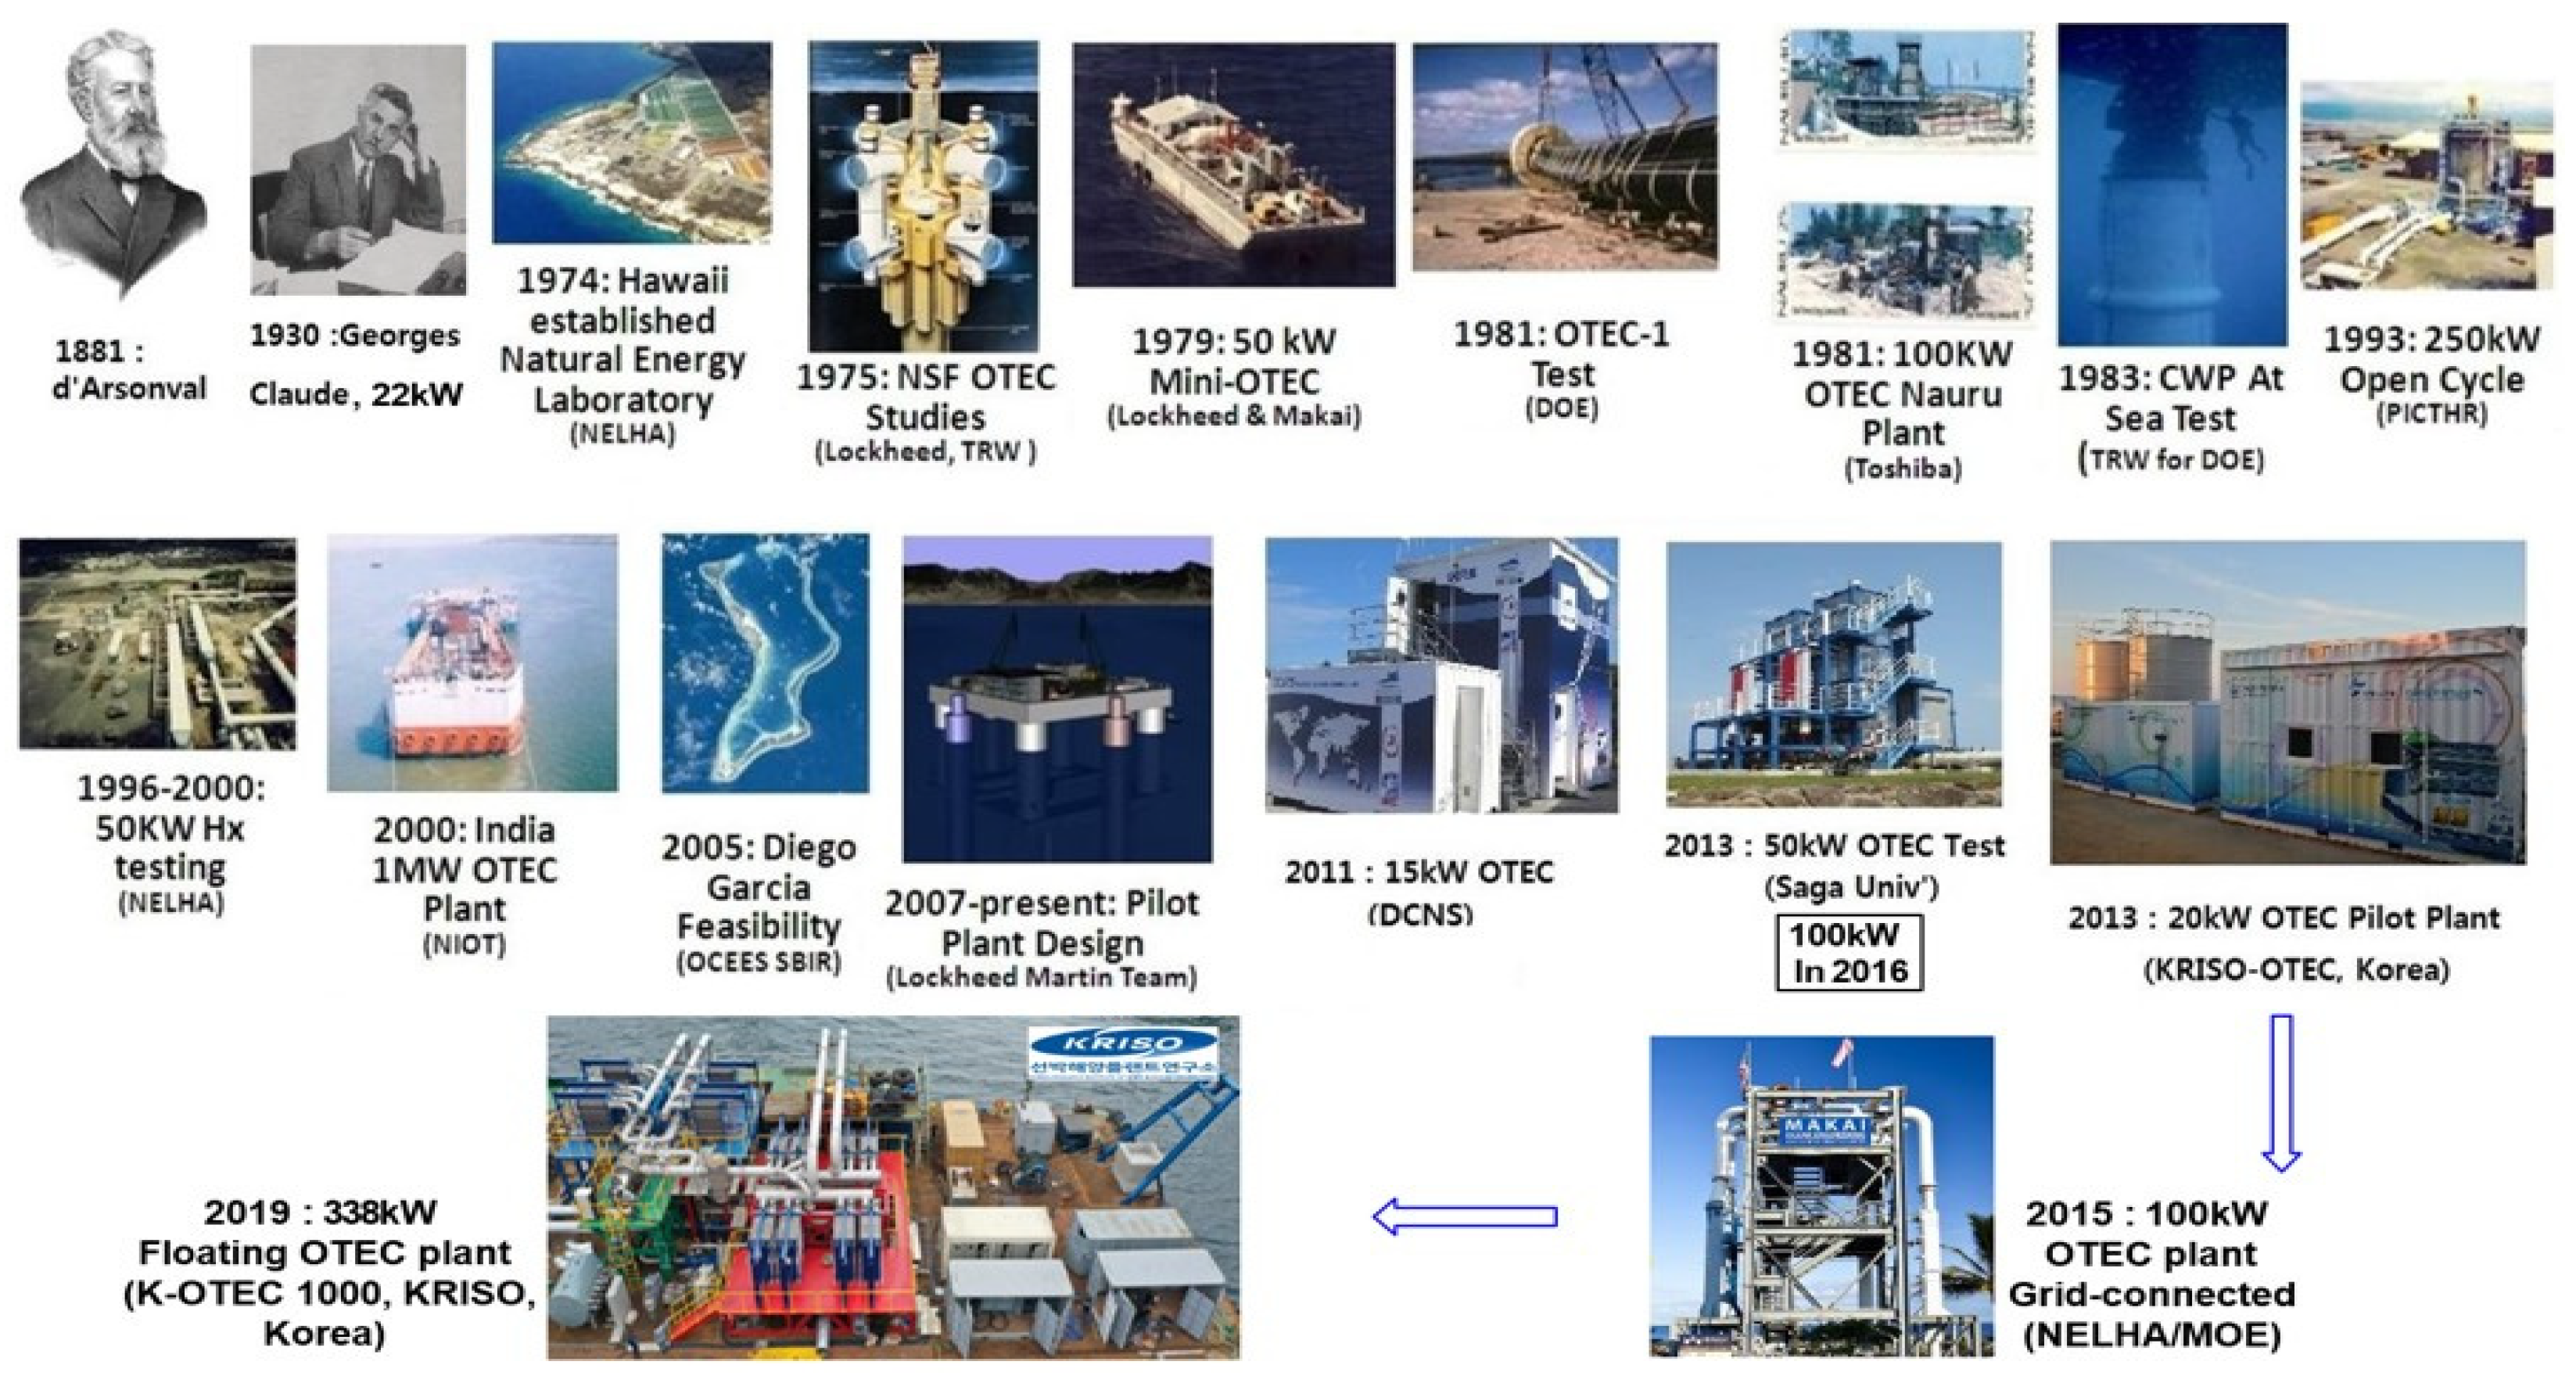
OTEC is one of the marine energy technologies that has not been commercialized in spite of the fact that it has had a long history (
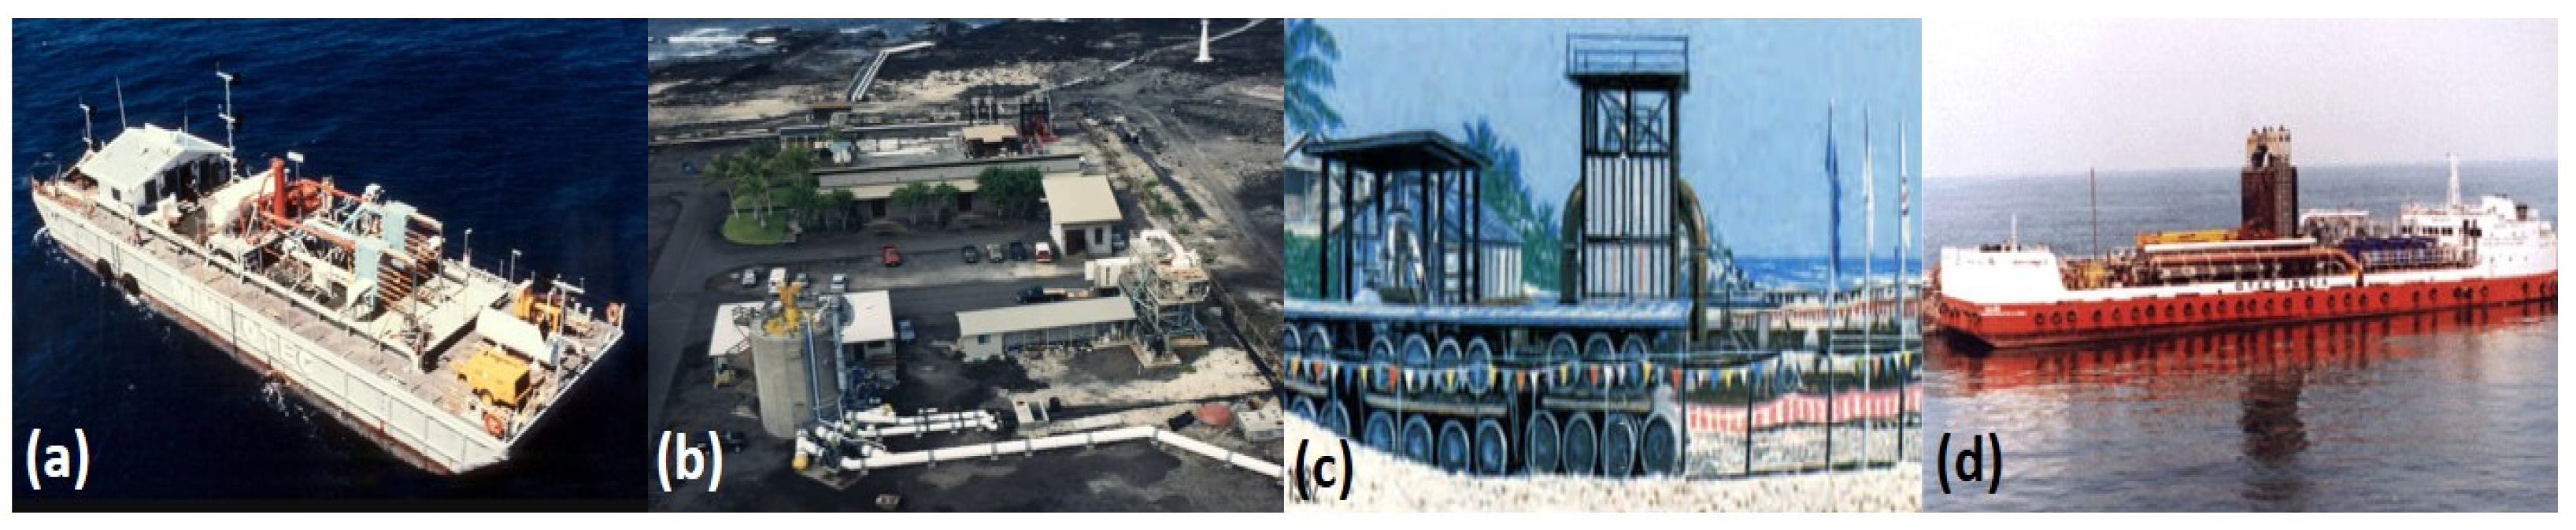
Figure 3). Jules Verne’s marine science novel ‘20,000 Leagues Under the Sea’ published in 1870, brought the existence of ocean thermal gradients to the world. In 1881, the theoretical basis for OTEC was developed by D’Arsonval, with the first electricity generated through OTEC technologies, in 1930, by George Claude. Hydrocarbons, particularly cheap and abundant oil supplies, inhibited further development of OTEC until the global petroleum oil crisis of 1973, which encouraged further research and development in the United States and Japan. In 1978, the U.S. succeeded in the operational realisation of OTEC through its ‘Mini-OTEC’ project (
Figure 4a): a 50 kW offshore closed-cycle OTEC power plant, based in Hawaii, using ammonia as a working fluid [
14].
An additional 210 kW onshore open-cycle OTEC power generation plant (
Figure 4b) was developed in 1983, and tested for long-term operation. Japan conducted a number of demonstration experiments by the Tokyo Electric Power (100 kW plant (
Figure 4c), in Nauru), and Kyushu Electric Power Companies (50 kW plant), and Saga University (75 kW plant). India installed a 1 MW class offshore closed-cycle OTEC power plant (
Figure 4d) using ammonia, in the Indian Ocean, but the plant ceased operation due to the breakage of a key connection part between the plant barge and riser (intake pipe) [
15].
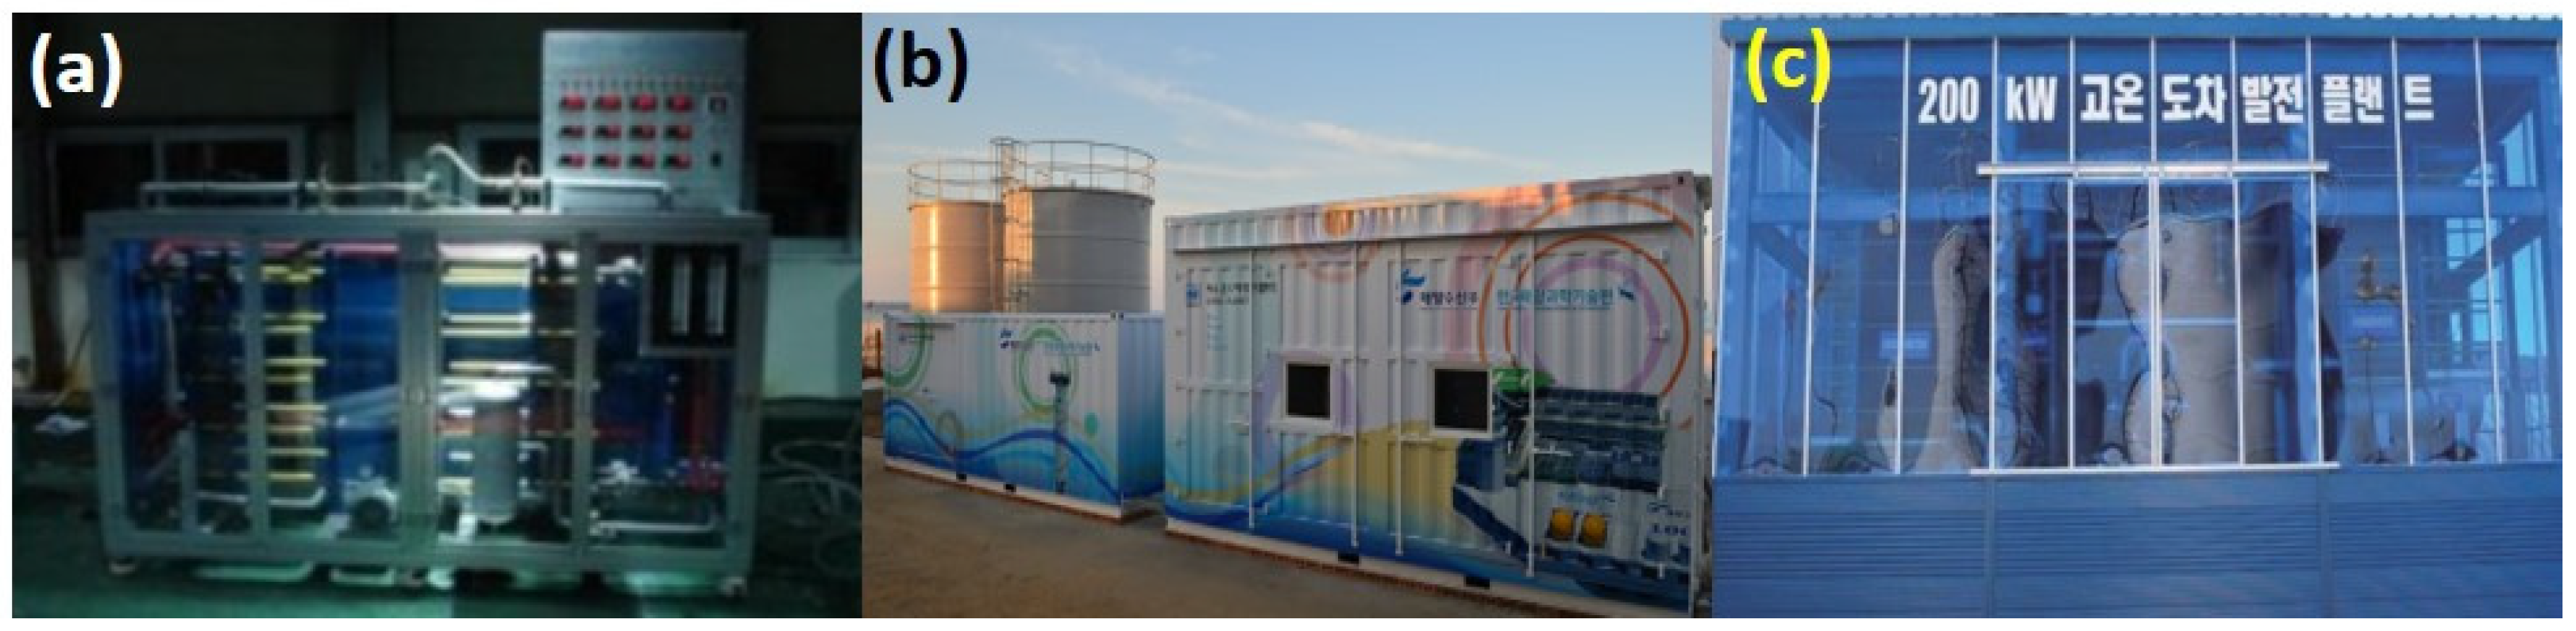
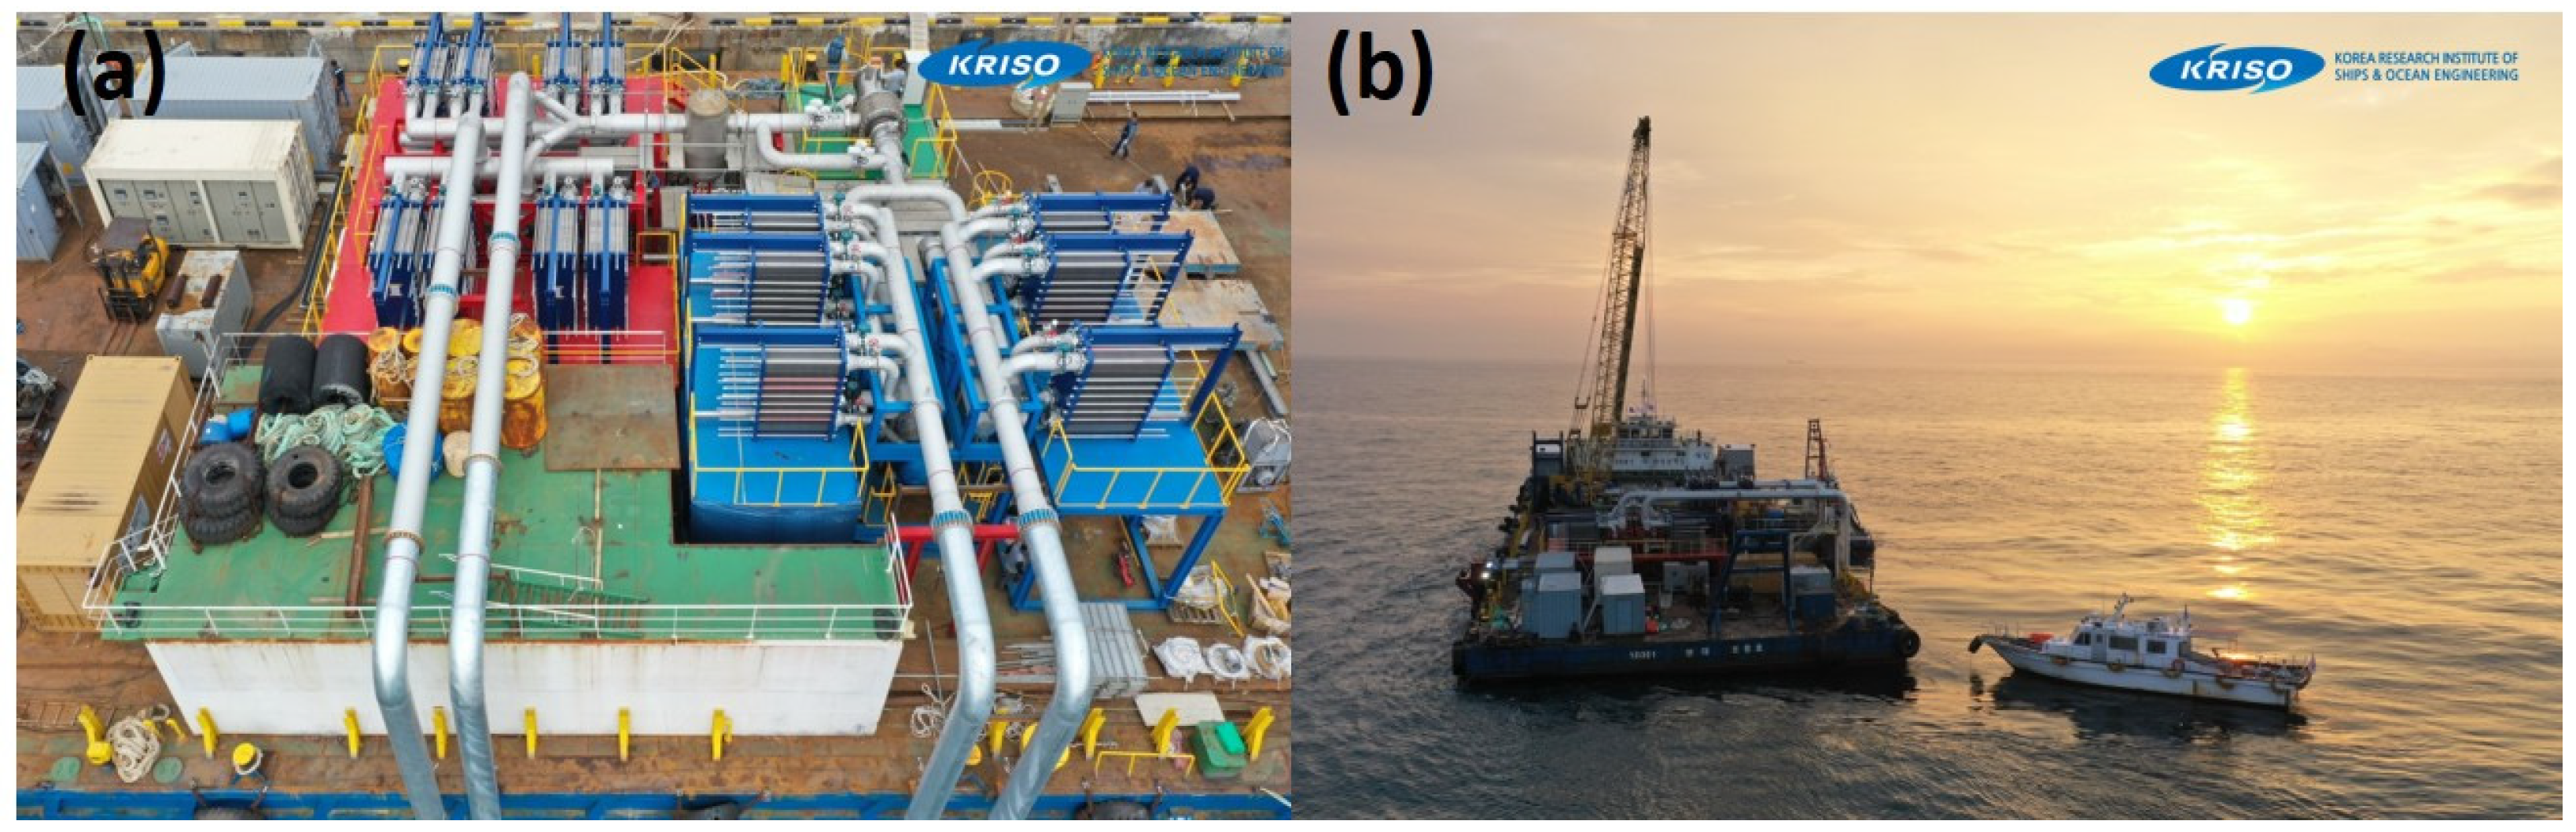
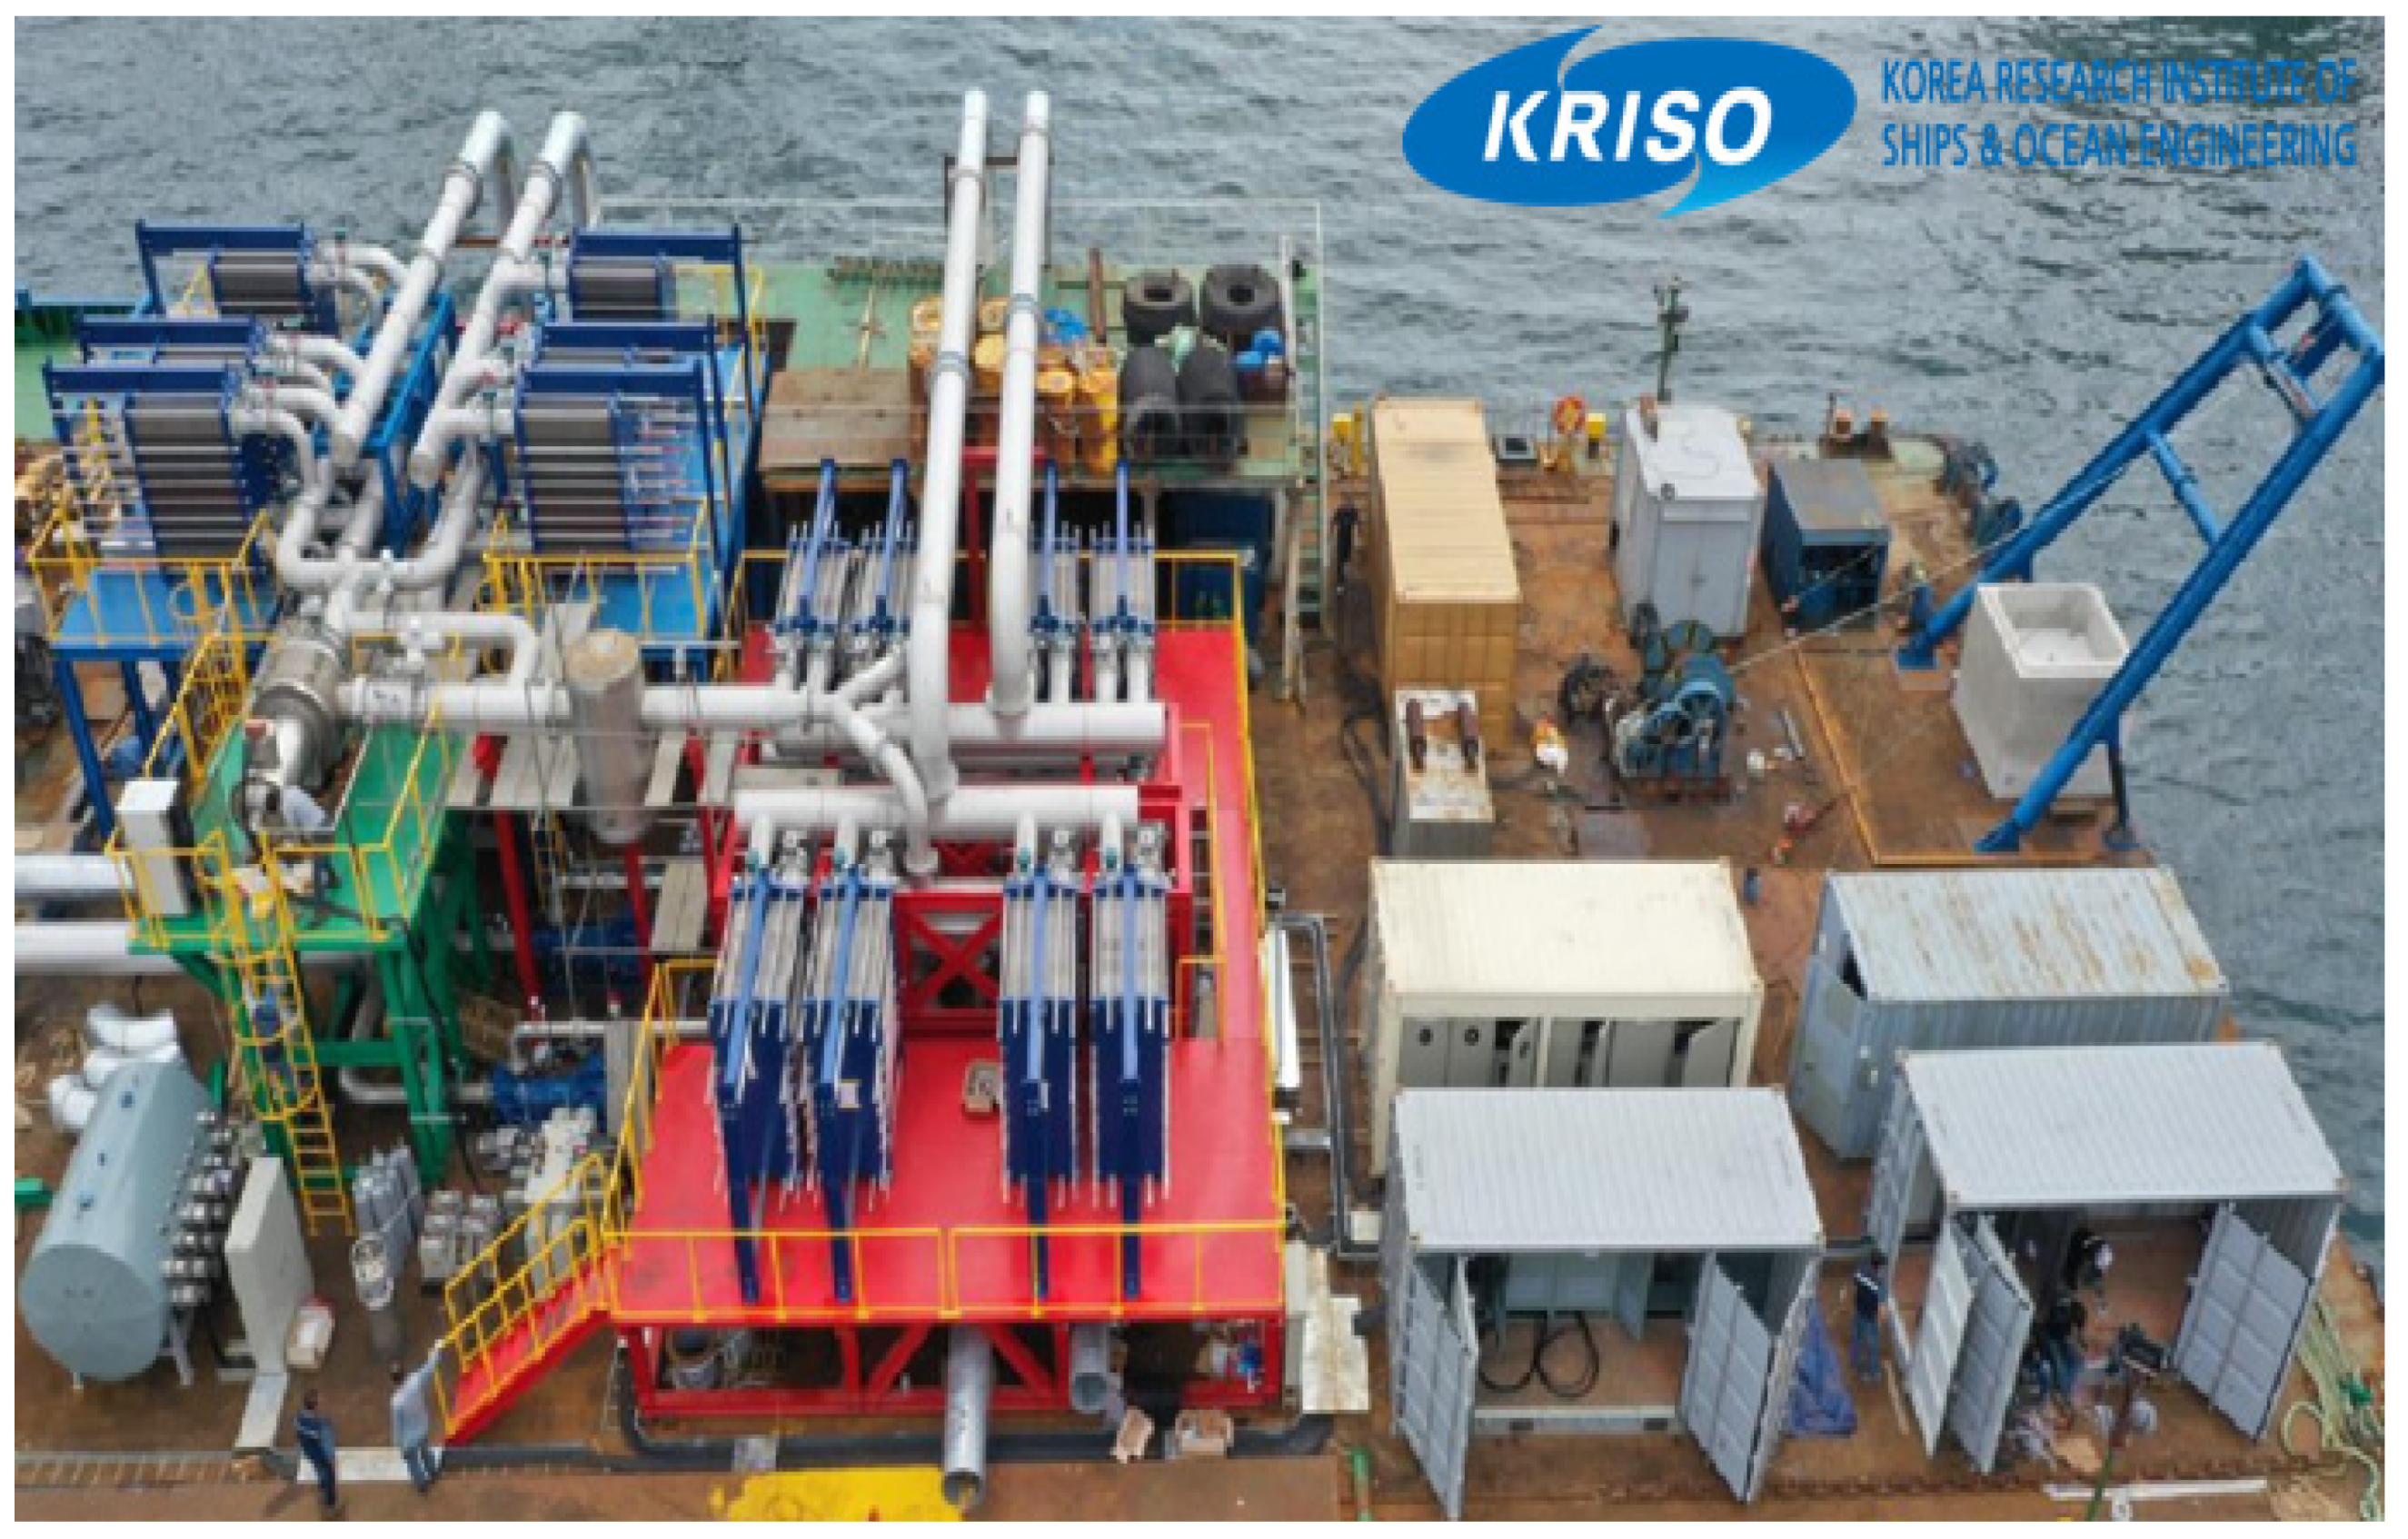
Since 2008, the United States, Japan, and France have resumed research and development for seawater temperature thermal gradient OTEC generation, and additionally, in 2011, Korea, developed a 100 W class land-based proto-type OTEC plant (
Figure 5a), followed by a 20 kW class pilot OTEC plant (
Figure 5b) in 2012–2013 [
13], by the Korea Research Institute of Ships and Ocean Engineering (KRISO) with affiliated clean ships and offshore plants developed from 2011. The hybrid OTEC system to produce about 200 kW (
Figure 5c) was fabricated and demonstrated in 2014, that used deep ocean water as a heat sink (5 °C) and waste heat from a wood gasification generator as a heat source (75 °C) [
16]. Based on this, in 2019, a 1000 kW class OTEC demonstration plant (
Figure 6) was produced, and a performance evaluation field test was successfully conducted in the south eastern sea, of the East Sea of Korea, demonstrating the production of 338 kW of electricity, with a relatively small temperature difference [
17]. If this plant is installed and operated in the equatorial ocean latitudes with local temperature differences of 24 °C or higher, it is estimated that about 1000 kW will be produced.
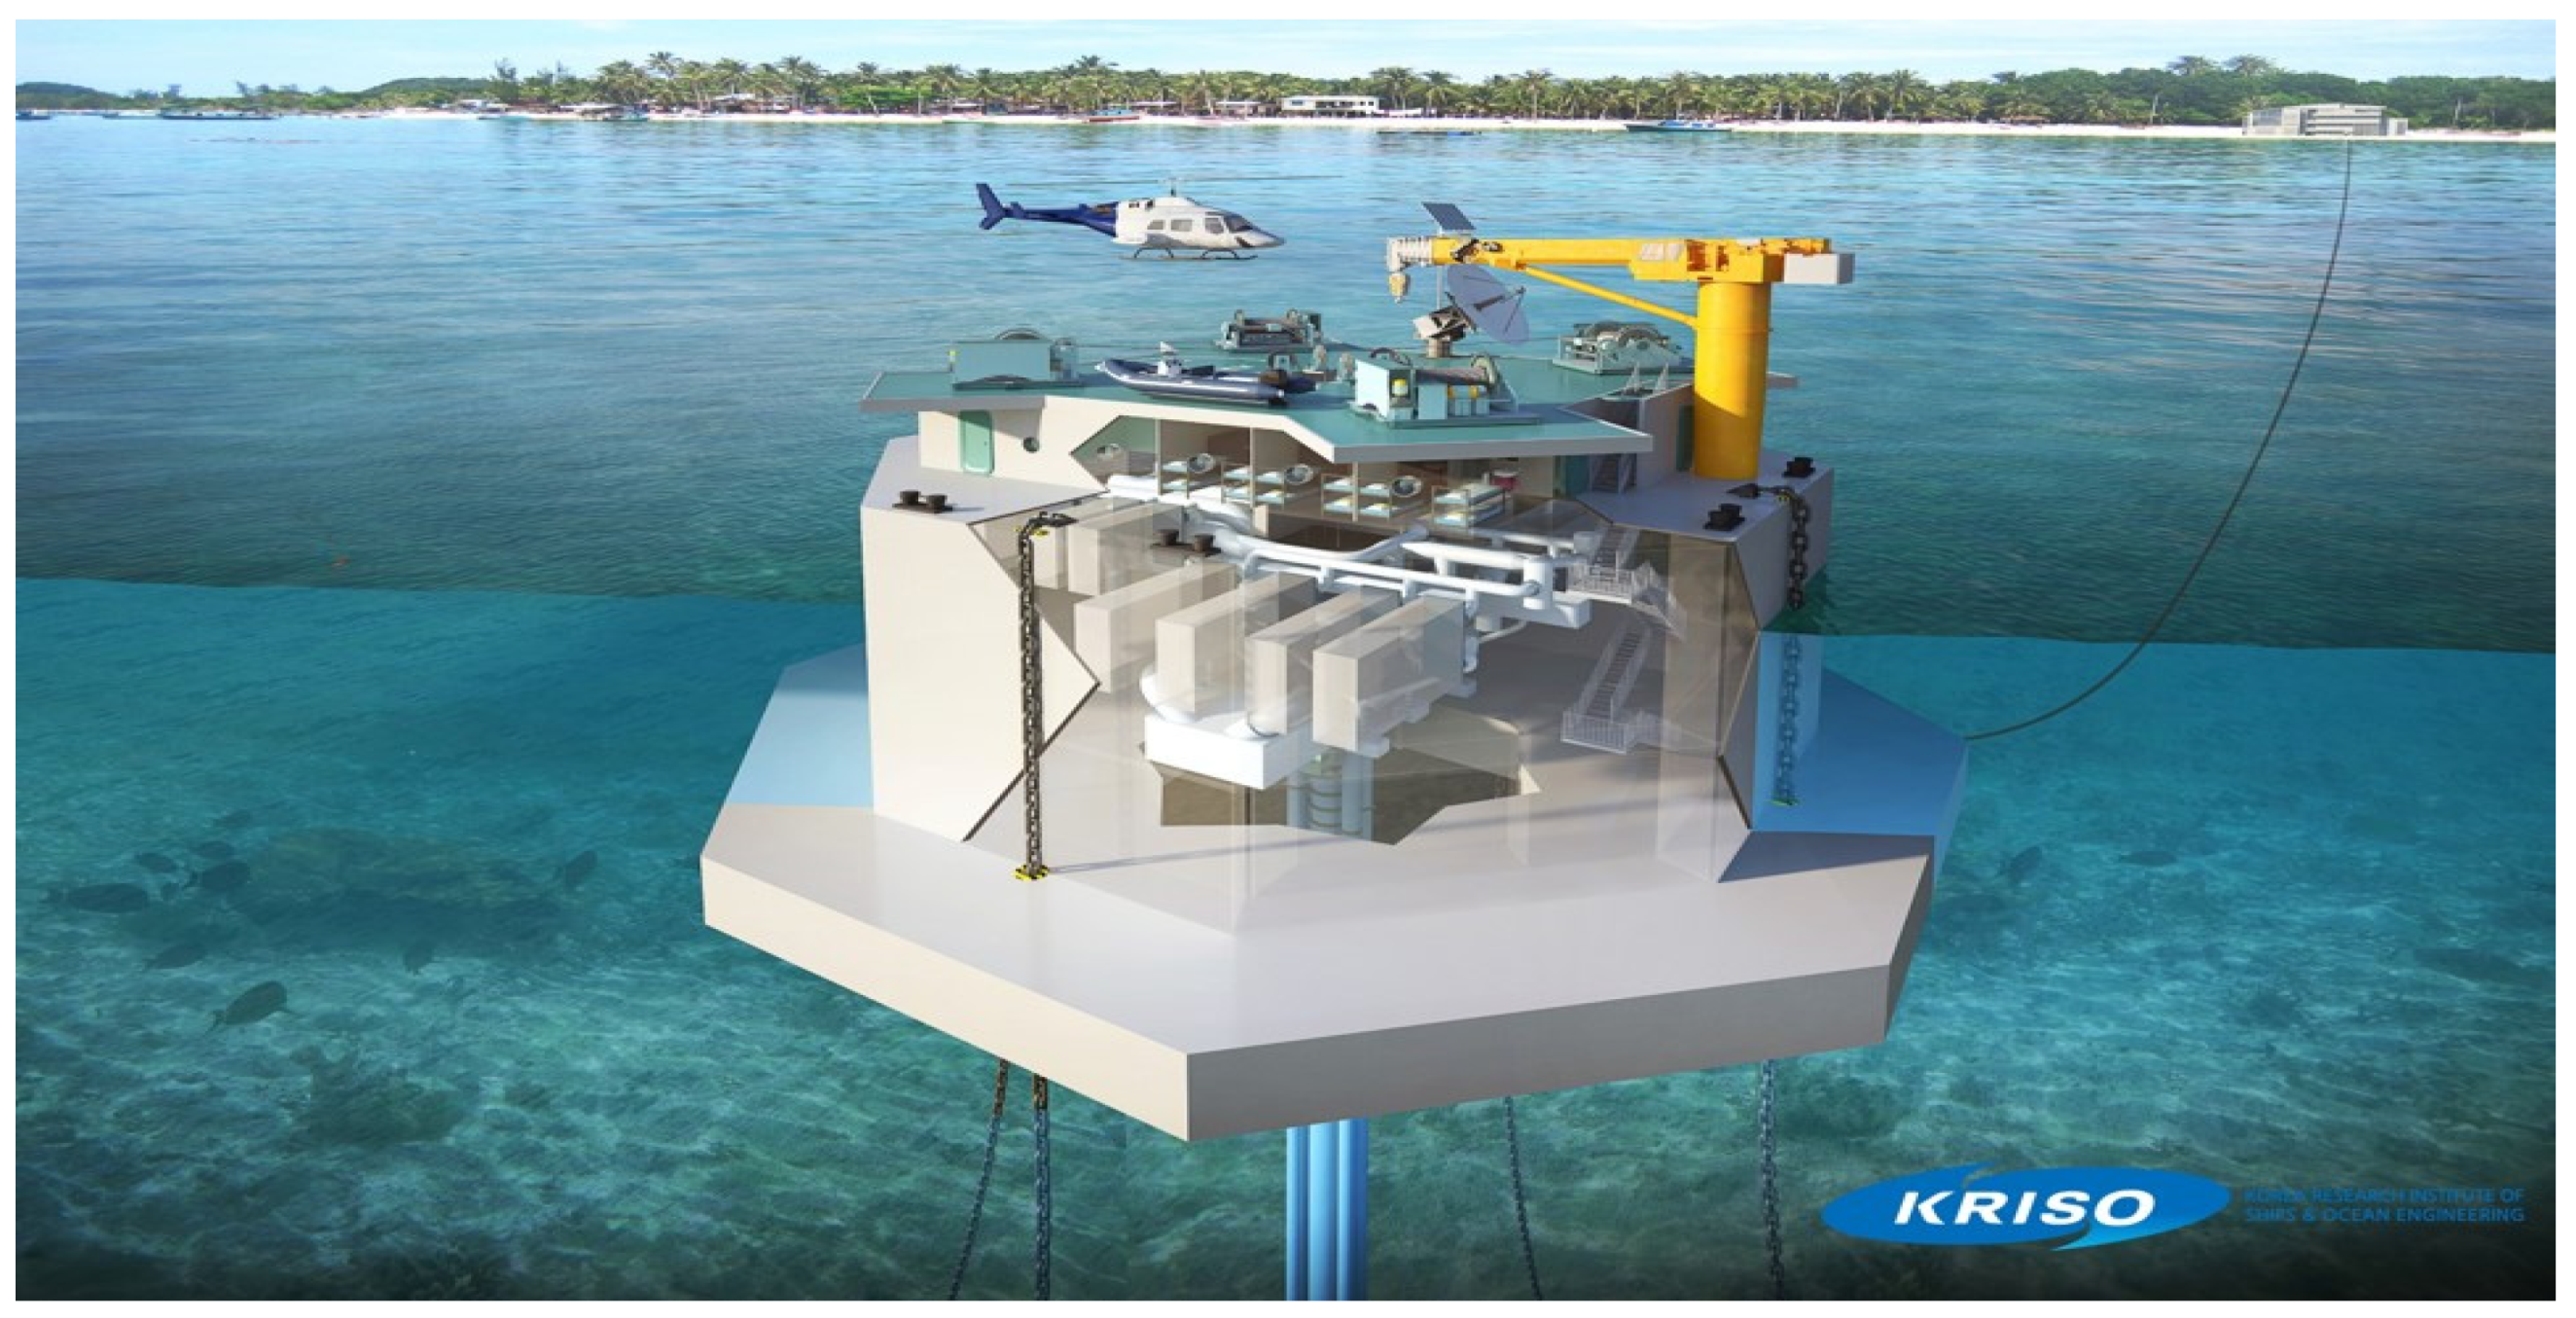
The OTEC industry can be thought of as both a plant manufacturing, and a power generation business. Plant manufacturing is the manufacturing of systems, parts and devices, and consists of turbines, generators, evaporators, condensers, refrigerant pumps, seawater pumps, water intake pipes (risers), power control devices, and plant monitoring and control devices. The seawater temperature difference power plant can be built onshore or installed offshore. When installed within the ocean, a constant position should be maintained, so that the plant does not drift or fluctuate with the waves or ocean currents, and the design of a platform, as well as an appropriate mooring/anchoring system is developed. As an example of the OTEC platform, we introduced a Sevan-type platform (
Figure 7) that acquired AIP from BV [
19]. It aims to manufacture platforms, systems, parts, and devices with high performance, a long life, low cost, and at minimal environmental impact.
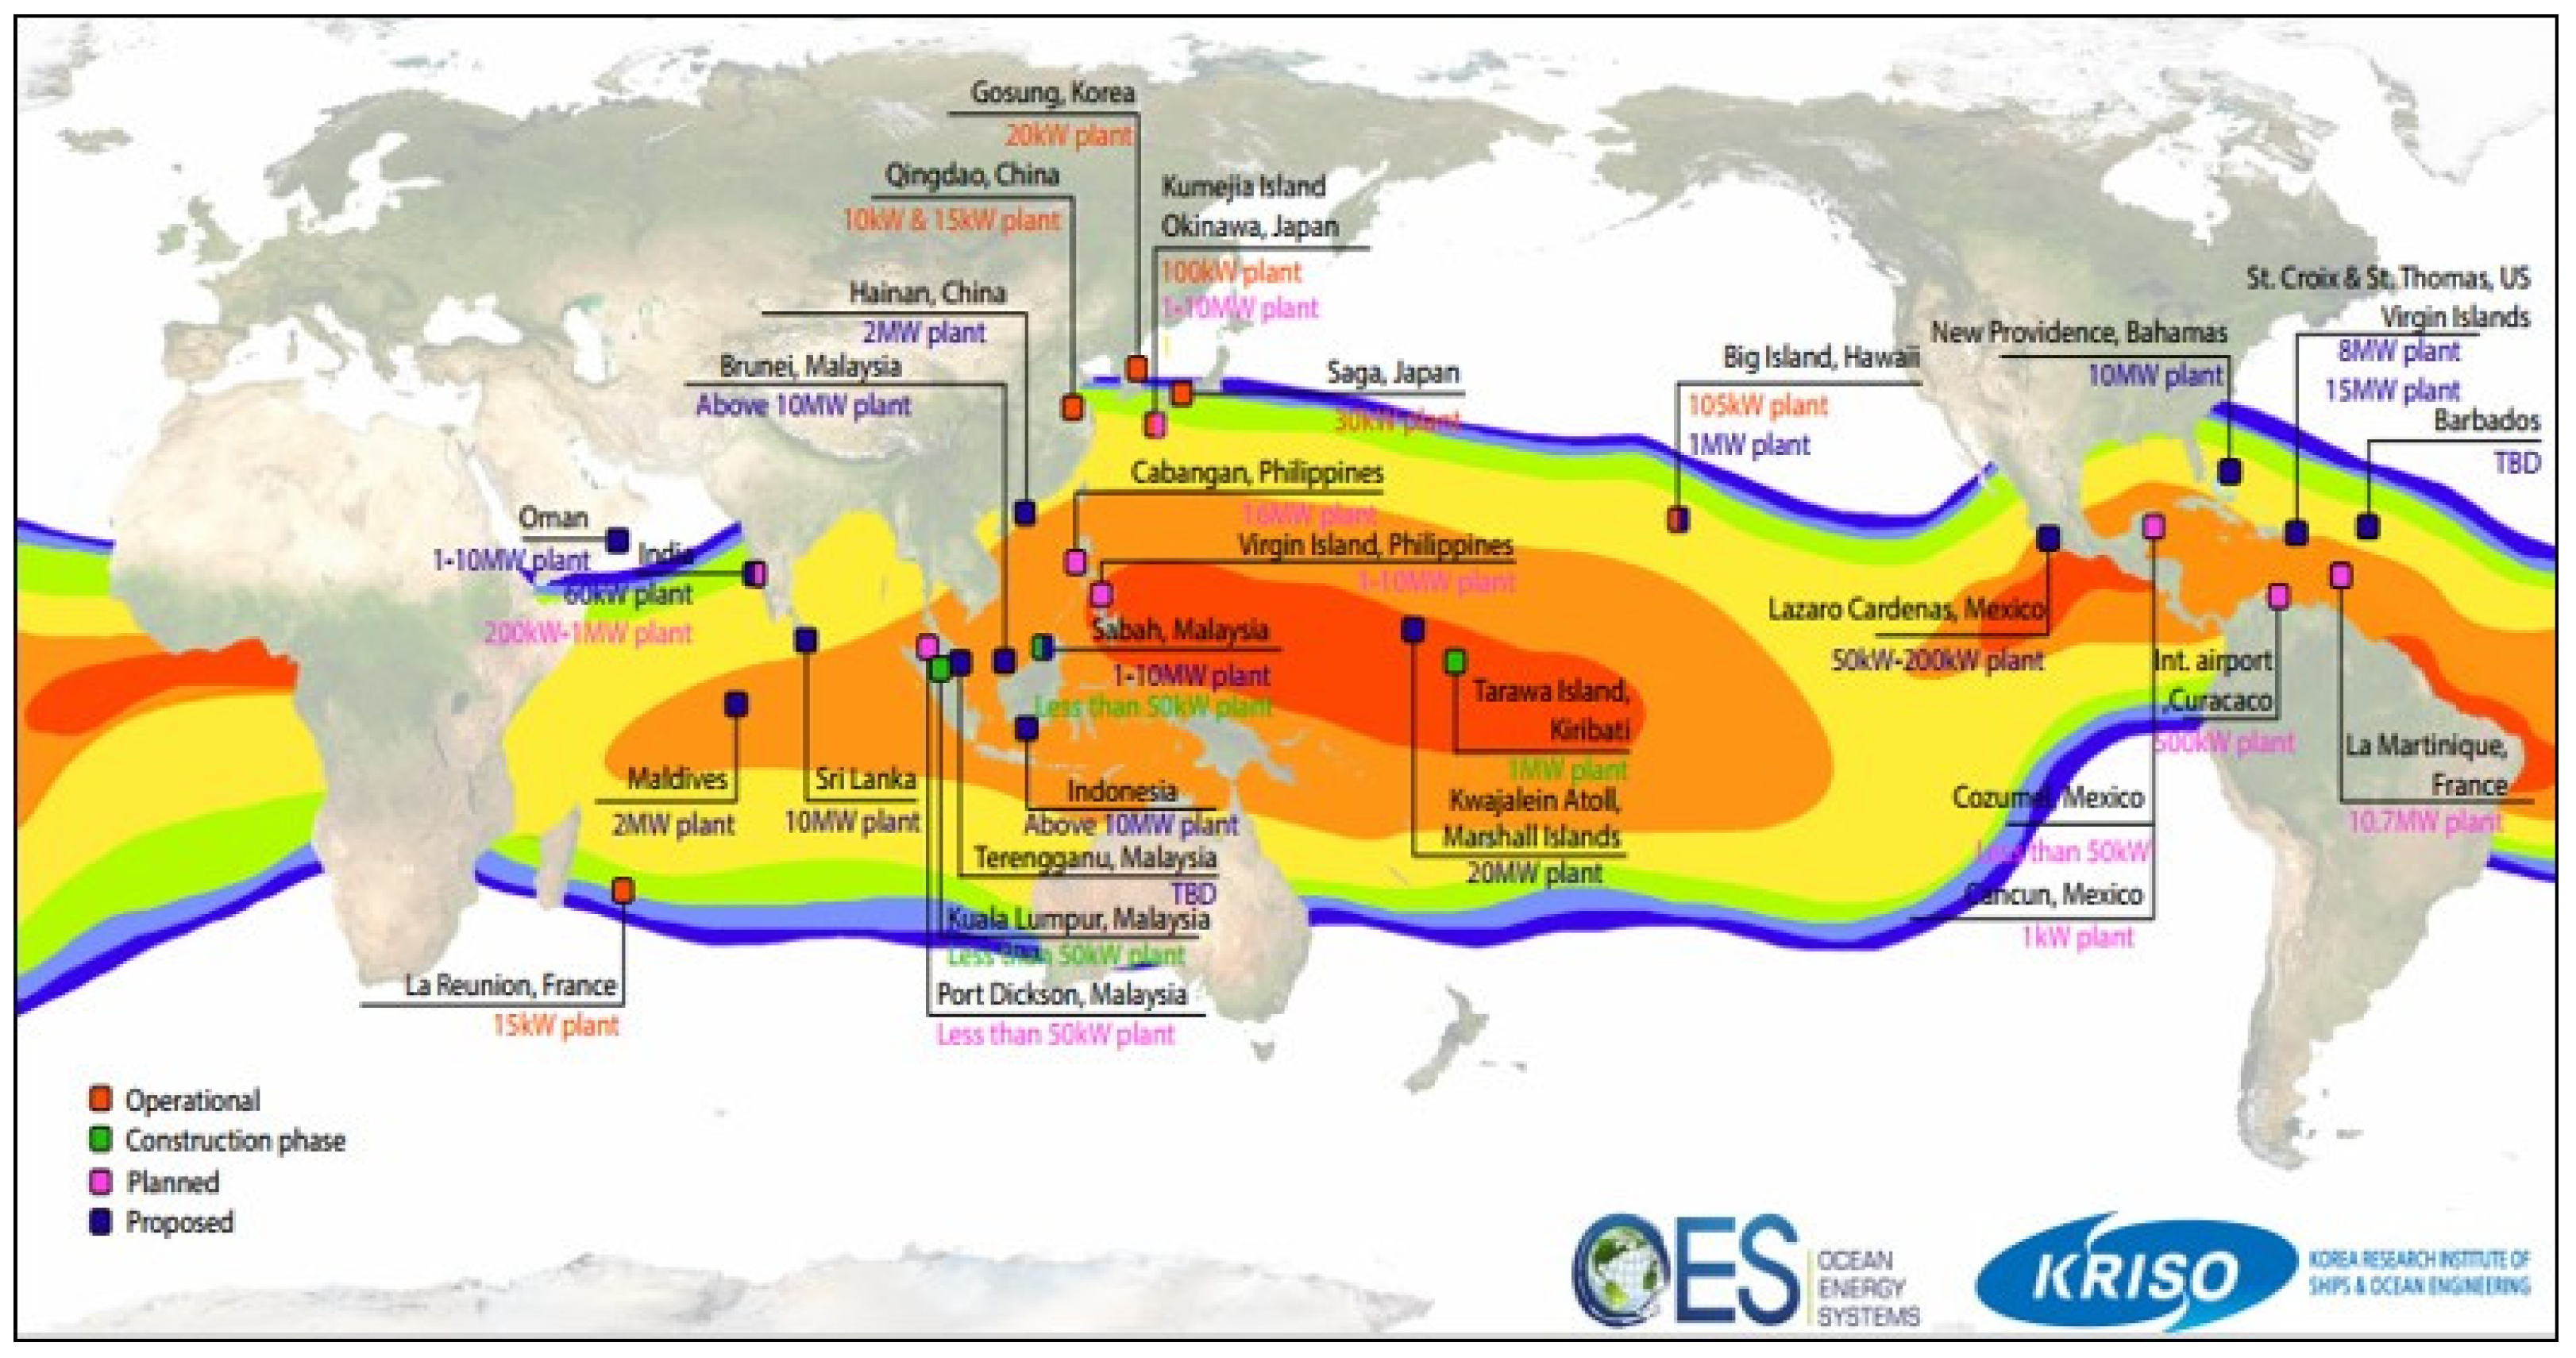
The current status of OTEC-potential for various countries around the world, including research and development, is being investigated and analysed, every three-months, under the commission of IEA-OES [
20,
21]. Currently, planning, installation, and operation of OTEC are in progress at about 20 locations around the world (
Figure 8). The results of on-line surveys of global OTEC status are summarized with respect to type, project stage, generation capacity, heat exchange, working fluid requirements, and so forth (
Figure 9). OTEC Plants can be onshore or offshore, or combinations of both.
6. OTEC-Based Processing Plant and Applicability in Pacific Island Countries
The prescient risks posed by anthropogenically caused climate change are requiring urgent actions to reduce greenhouse gas emissions. The irony in the Pacific region is that the very existence of countries that have produced a tiny proportion of global cumulative greenhouse gases could be threatened by sea level rise (e.g., COP21). Assisting Pacific Island Countries to develop greener economies is part of the global response to CO
2 emission reductions, and helps the region develop future-looking economies [
2,
26]. Whilst there are a variety of solutions (solar, wind, etc.) that are possible within the Pacific region, OTEC offers the opportunity to access huge amounts of stored ocean energy, and develop a range of future-looking seawater utilisation industries (aquaculture, seawater minerals, drinking water, hydrogen-generation) that can generate high quality livelihoods [
1].
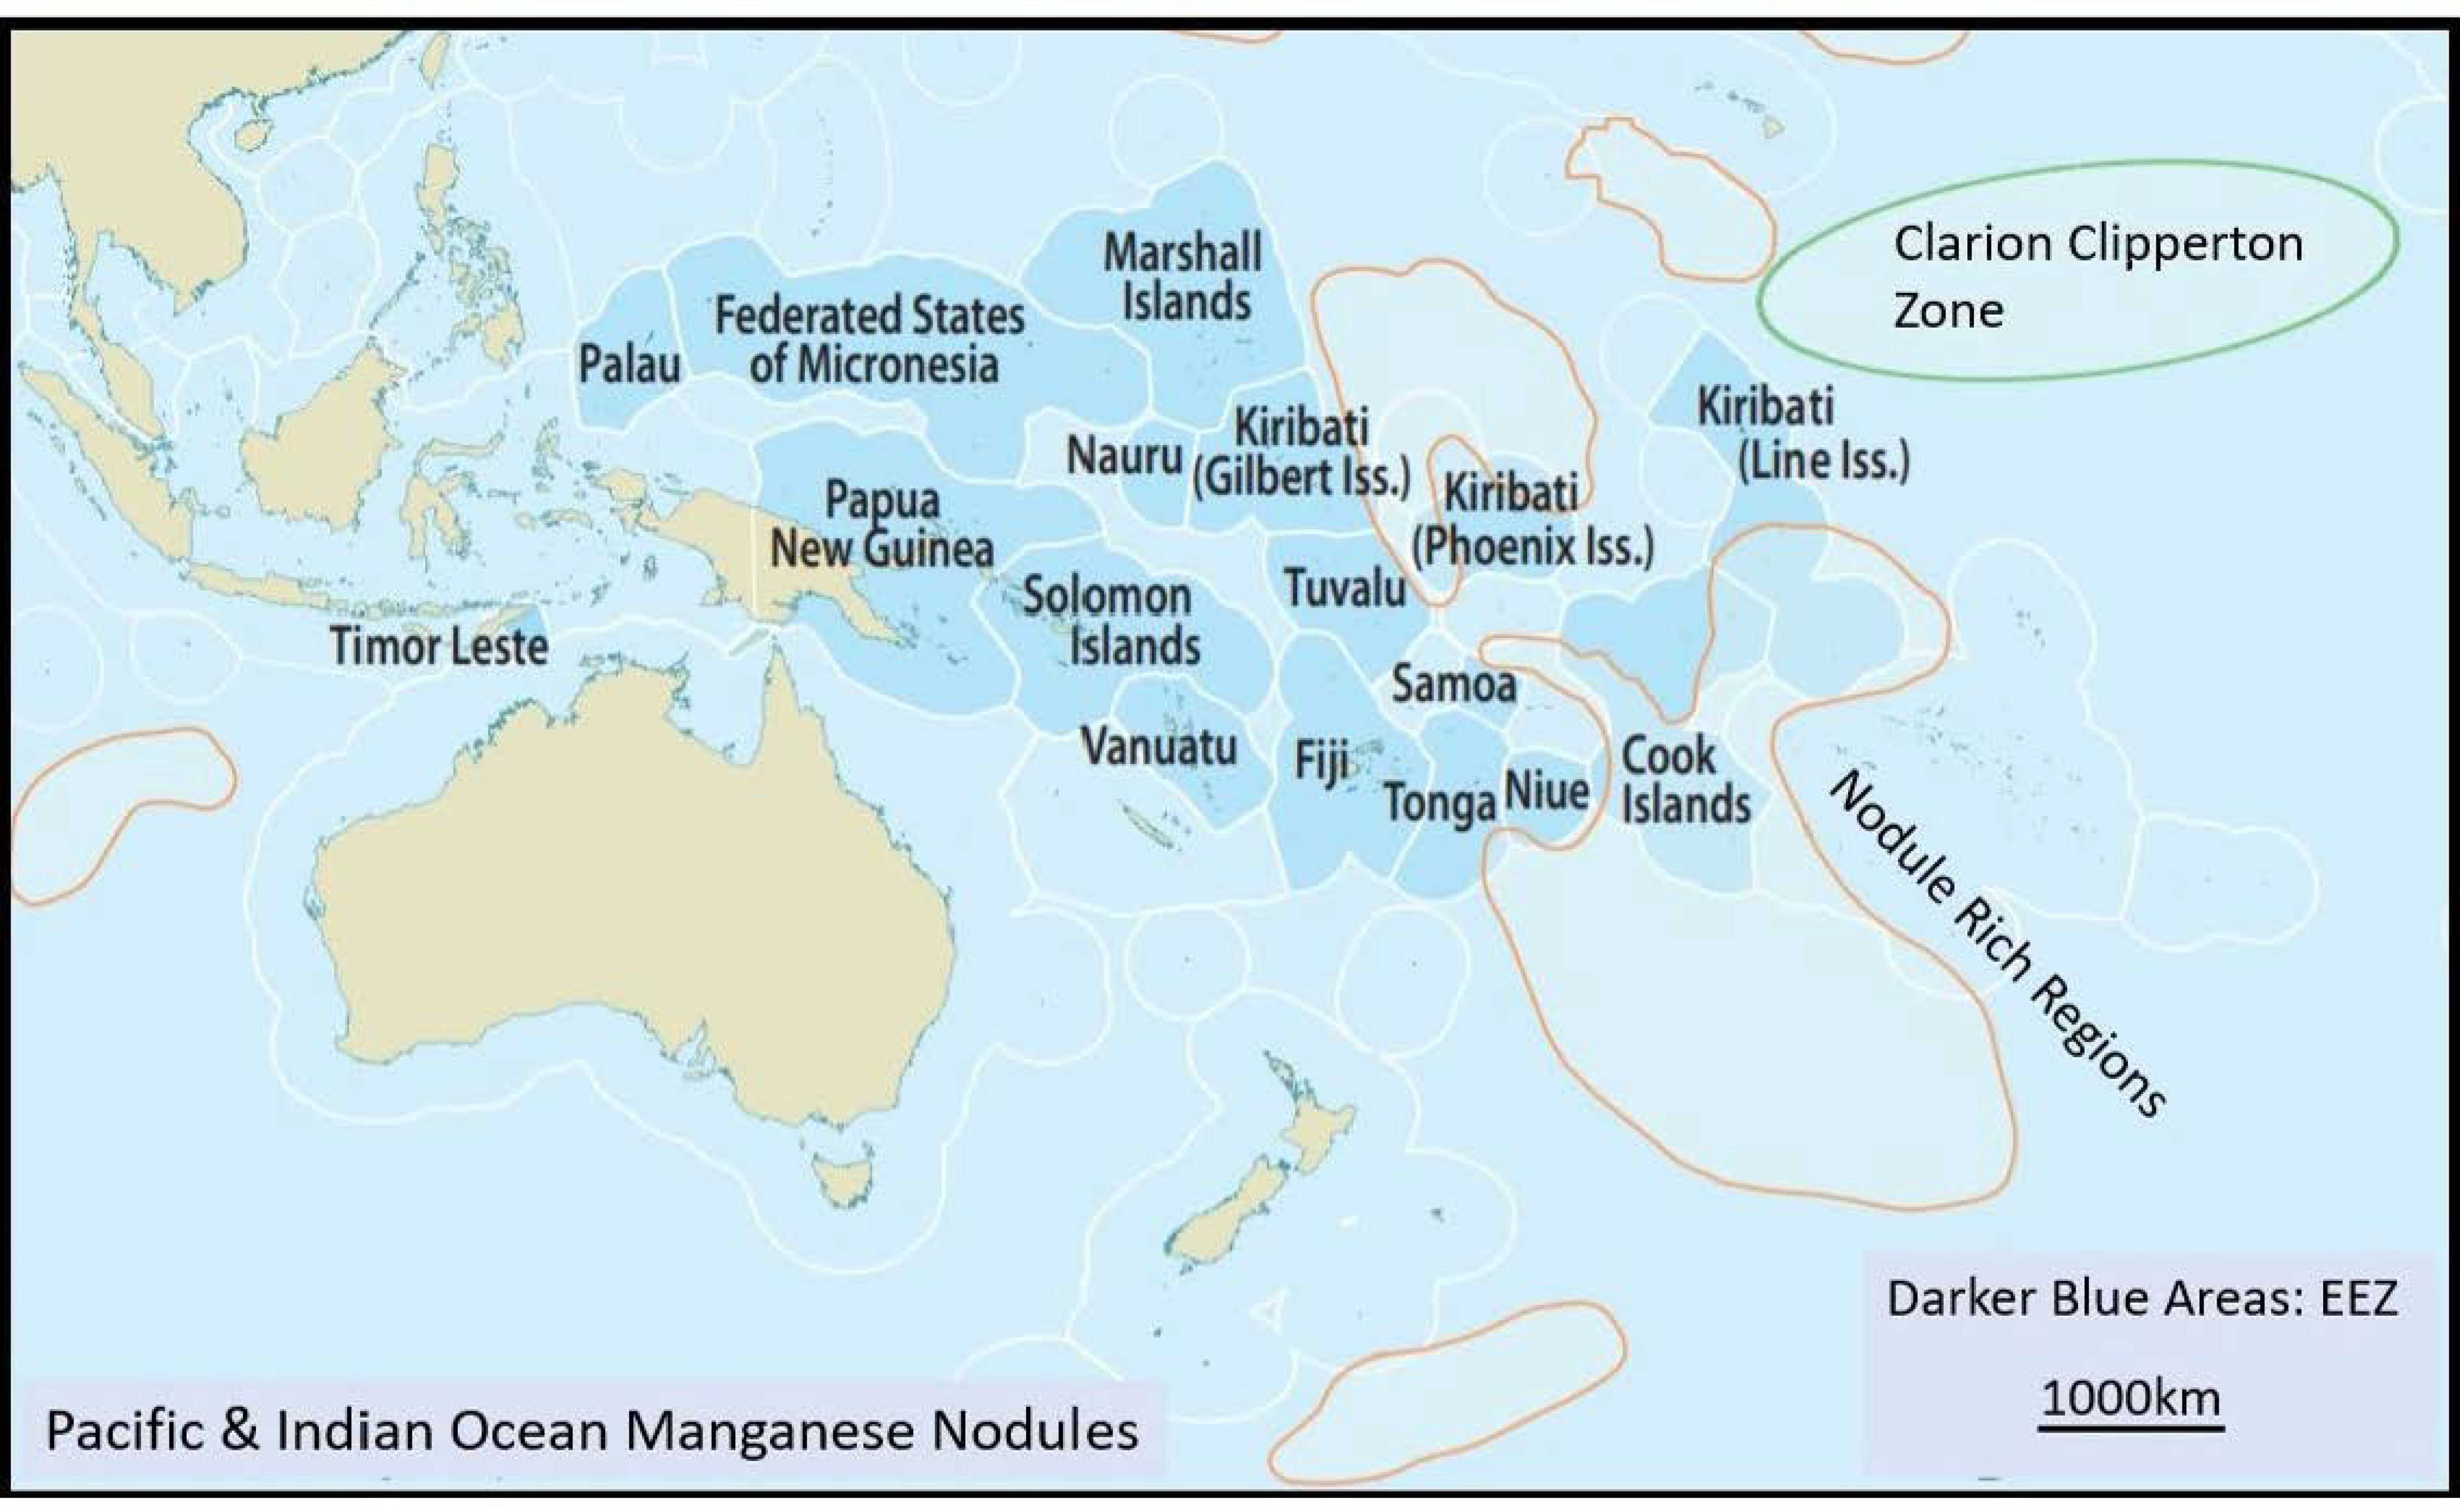
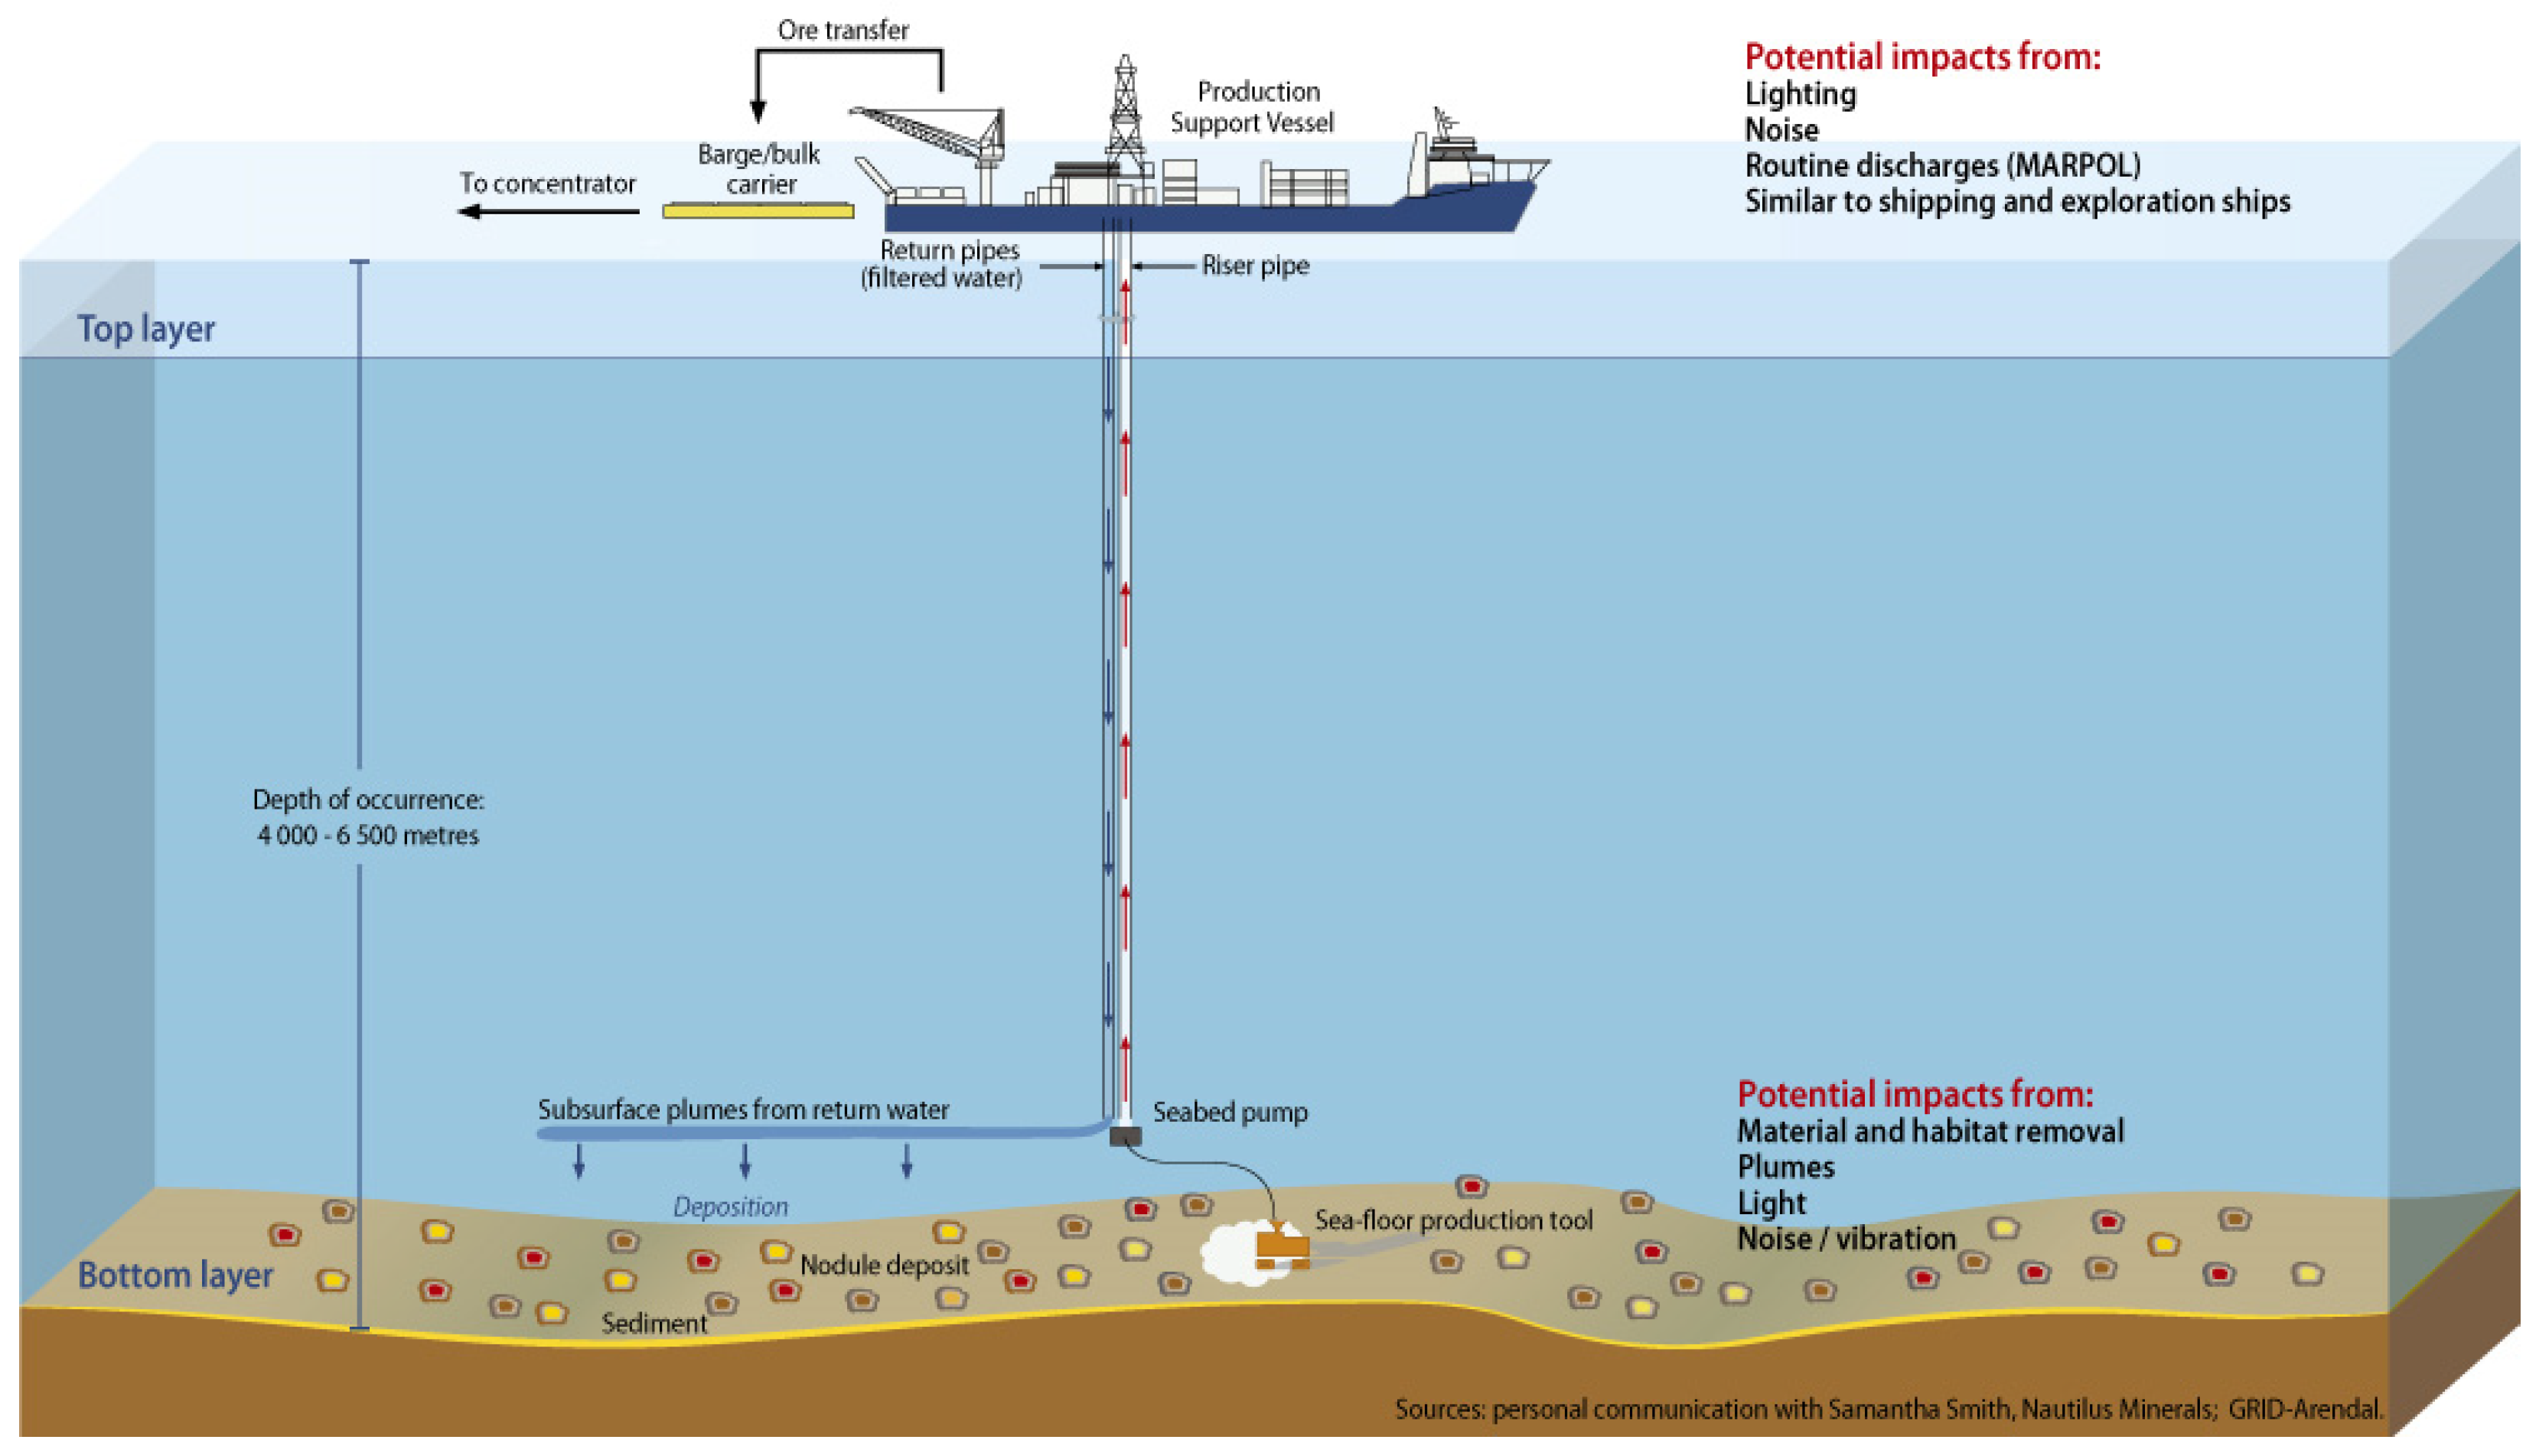
Various useful mineral resources exist on the ocean floor (seabed minerals) (
Figure 10, [
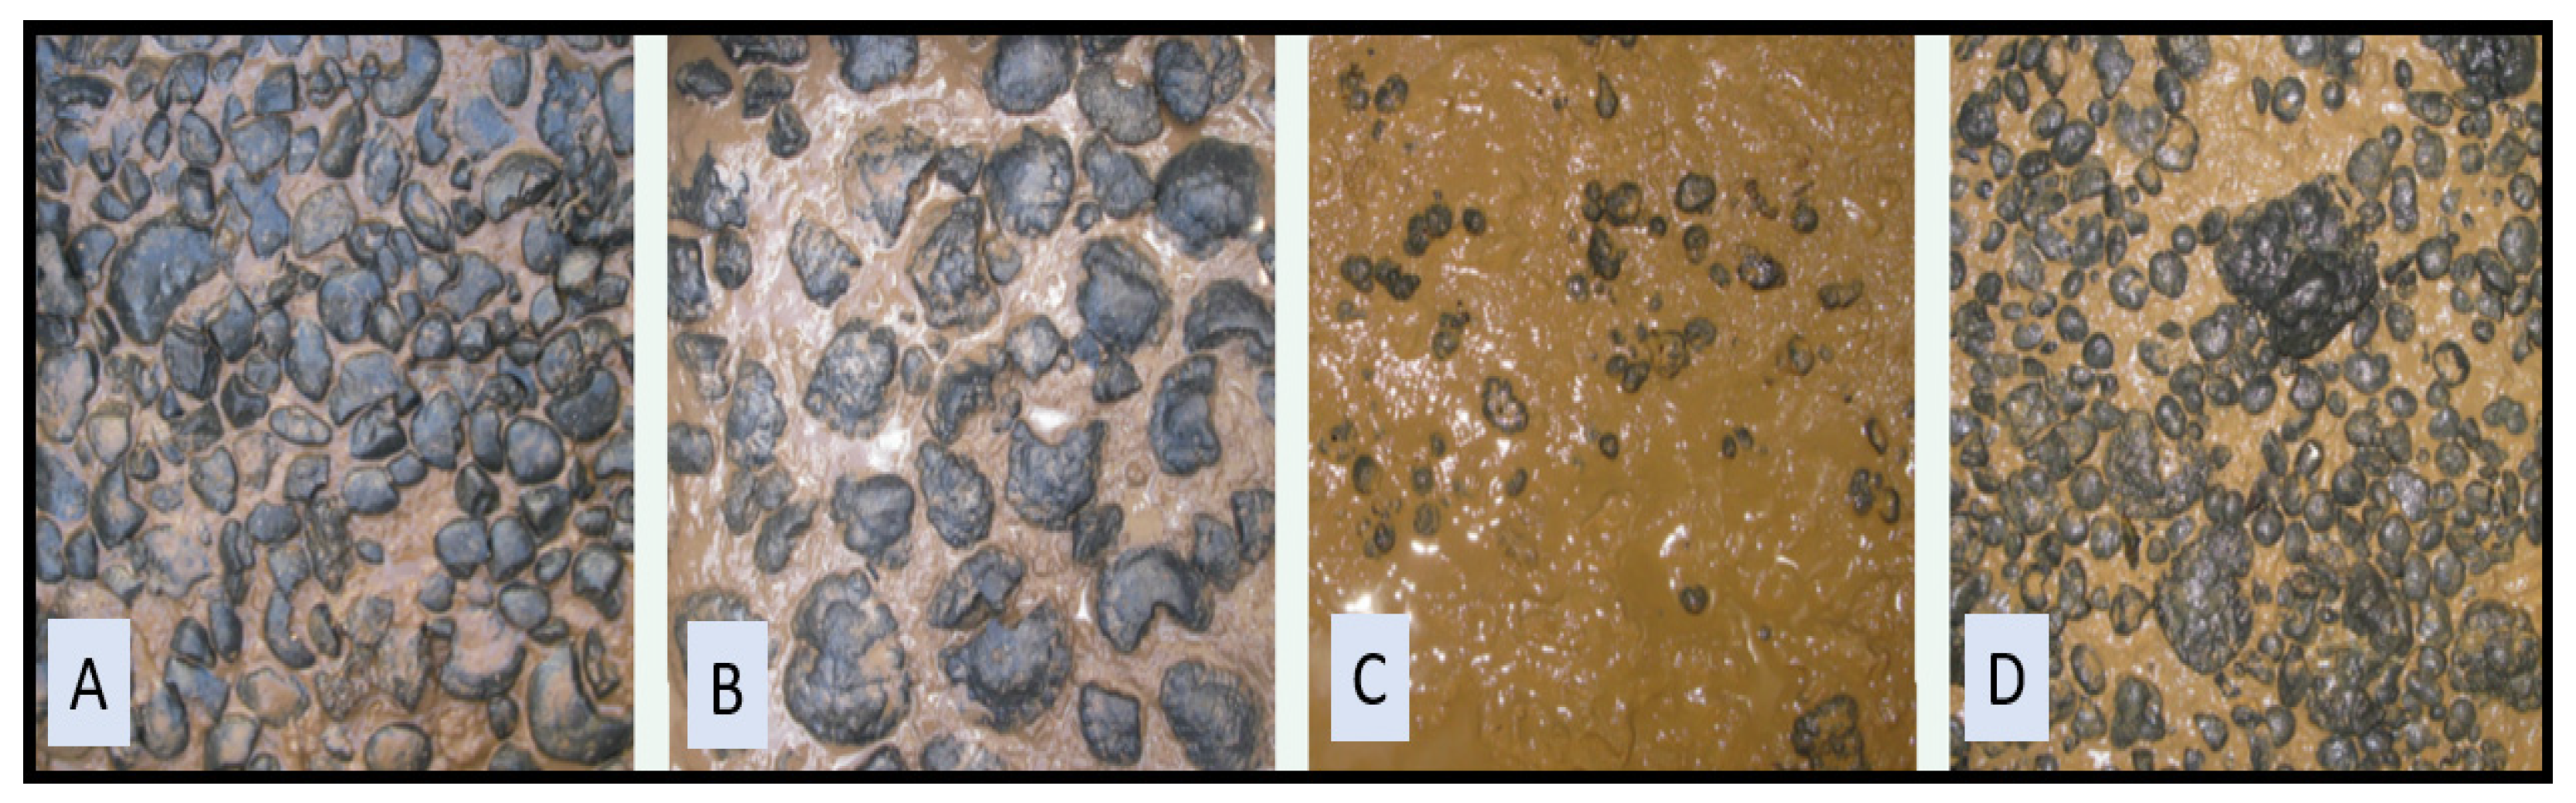
27]). These include polymetallic nodules, polymetallic or seafloor massive sulfides, and cobalt-rich ferromanganese crusts. Manganese nodules (
Figure 11, [
27]) are gravel-potato-sized mineral aggregations that contain manganese, nickel, copper, titanium, cobalt, and rare earth elements. They are situated on the oceanic abyssal plains, at depths of 4000 to 6000 m. There are a range of estimates of metal resources contained within manganese nodules: around 1.7 trillion t of manganese nodules exist in the Pacific Ocean alone. Around 15% of the world’s ocean floors contain manganese nodules, with an average of 15 kg/m
2 [
28]. It is estimated that the global mineable quantity of manganese nodules is around 500 billion t [
29].
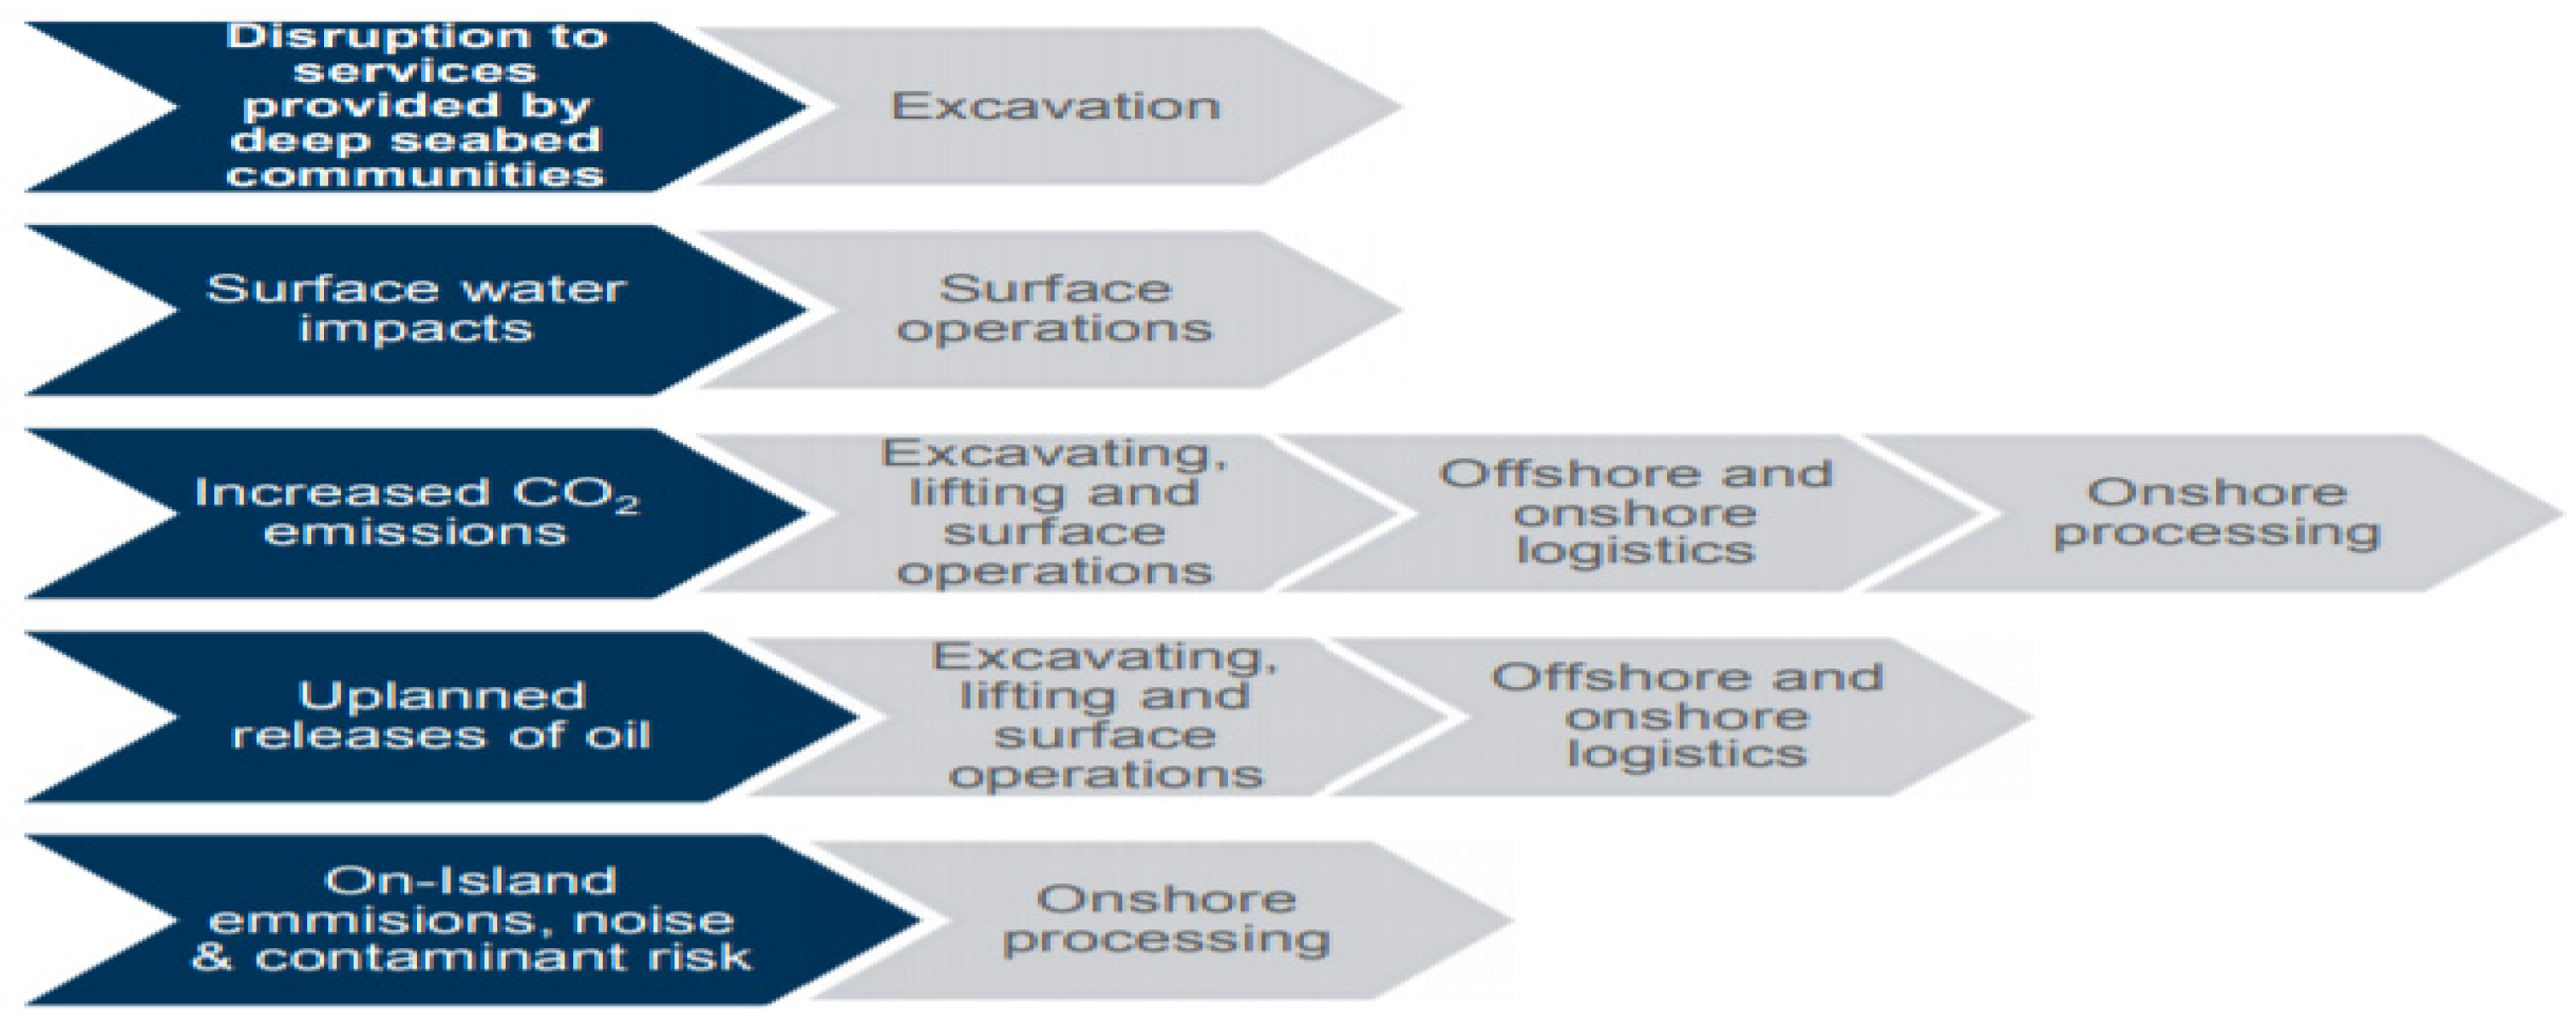
It will be useful to consider the energy requirements of ocean floor mining operations (
Figure 12). The greener energy options will be particularly attractive. The operation of deep-sea mines generates CO
2 through: (1) the operation of ships used to transport ore to the destination port; (2) transportation of personnel and goods through supply lines; and (3) the generation of electricity (
Figure 13). External costs associated with increased CO
2 emissions from shipping and mining operations are based on estimates of total annual fuel use (in tons). Fuel use includes the following activities: (1) submarine mining tools and power supply of production support vessels; (2) barge activities; and (3) crew boats.
The feasibility of manganese nodules mining within the Pacific Ocean has been reviewed by the Secretariat of the Pacific Community (Cardno, 2016 [
30]). The Penrhyn Basin, Cook Islands, is an example of a Pacific region containing high concentrations of nodules, and an abundant resource of nodules (Hein et al., 2015 [
31]). There is a high nodular abundance (>25 kg/m
2) and area of 124,000 km
2, and an estimate mineral resource of 3.6 billion t (Hein et al., 2015 [
31]). The generally accepted economic nodule density cut-off grade for commercial mining, is around 5 kg/m
2, with the nodule density range within the Cook Islands Exclusive Economic Zone ranging from 5 kg/m
2 to over 50 kg/m
2 (Cronan, 2013 [
32]).
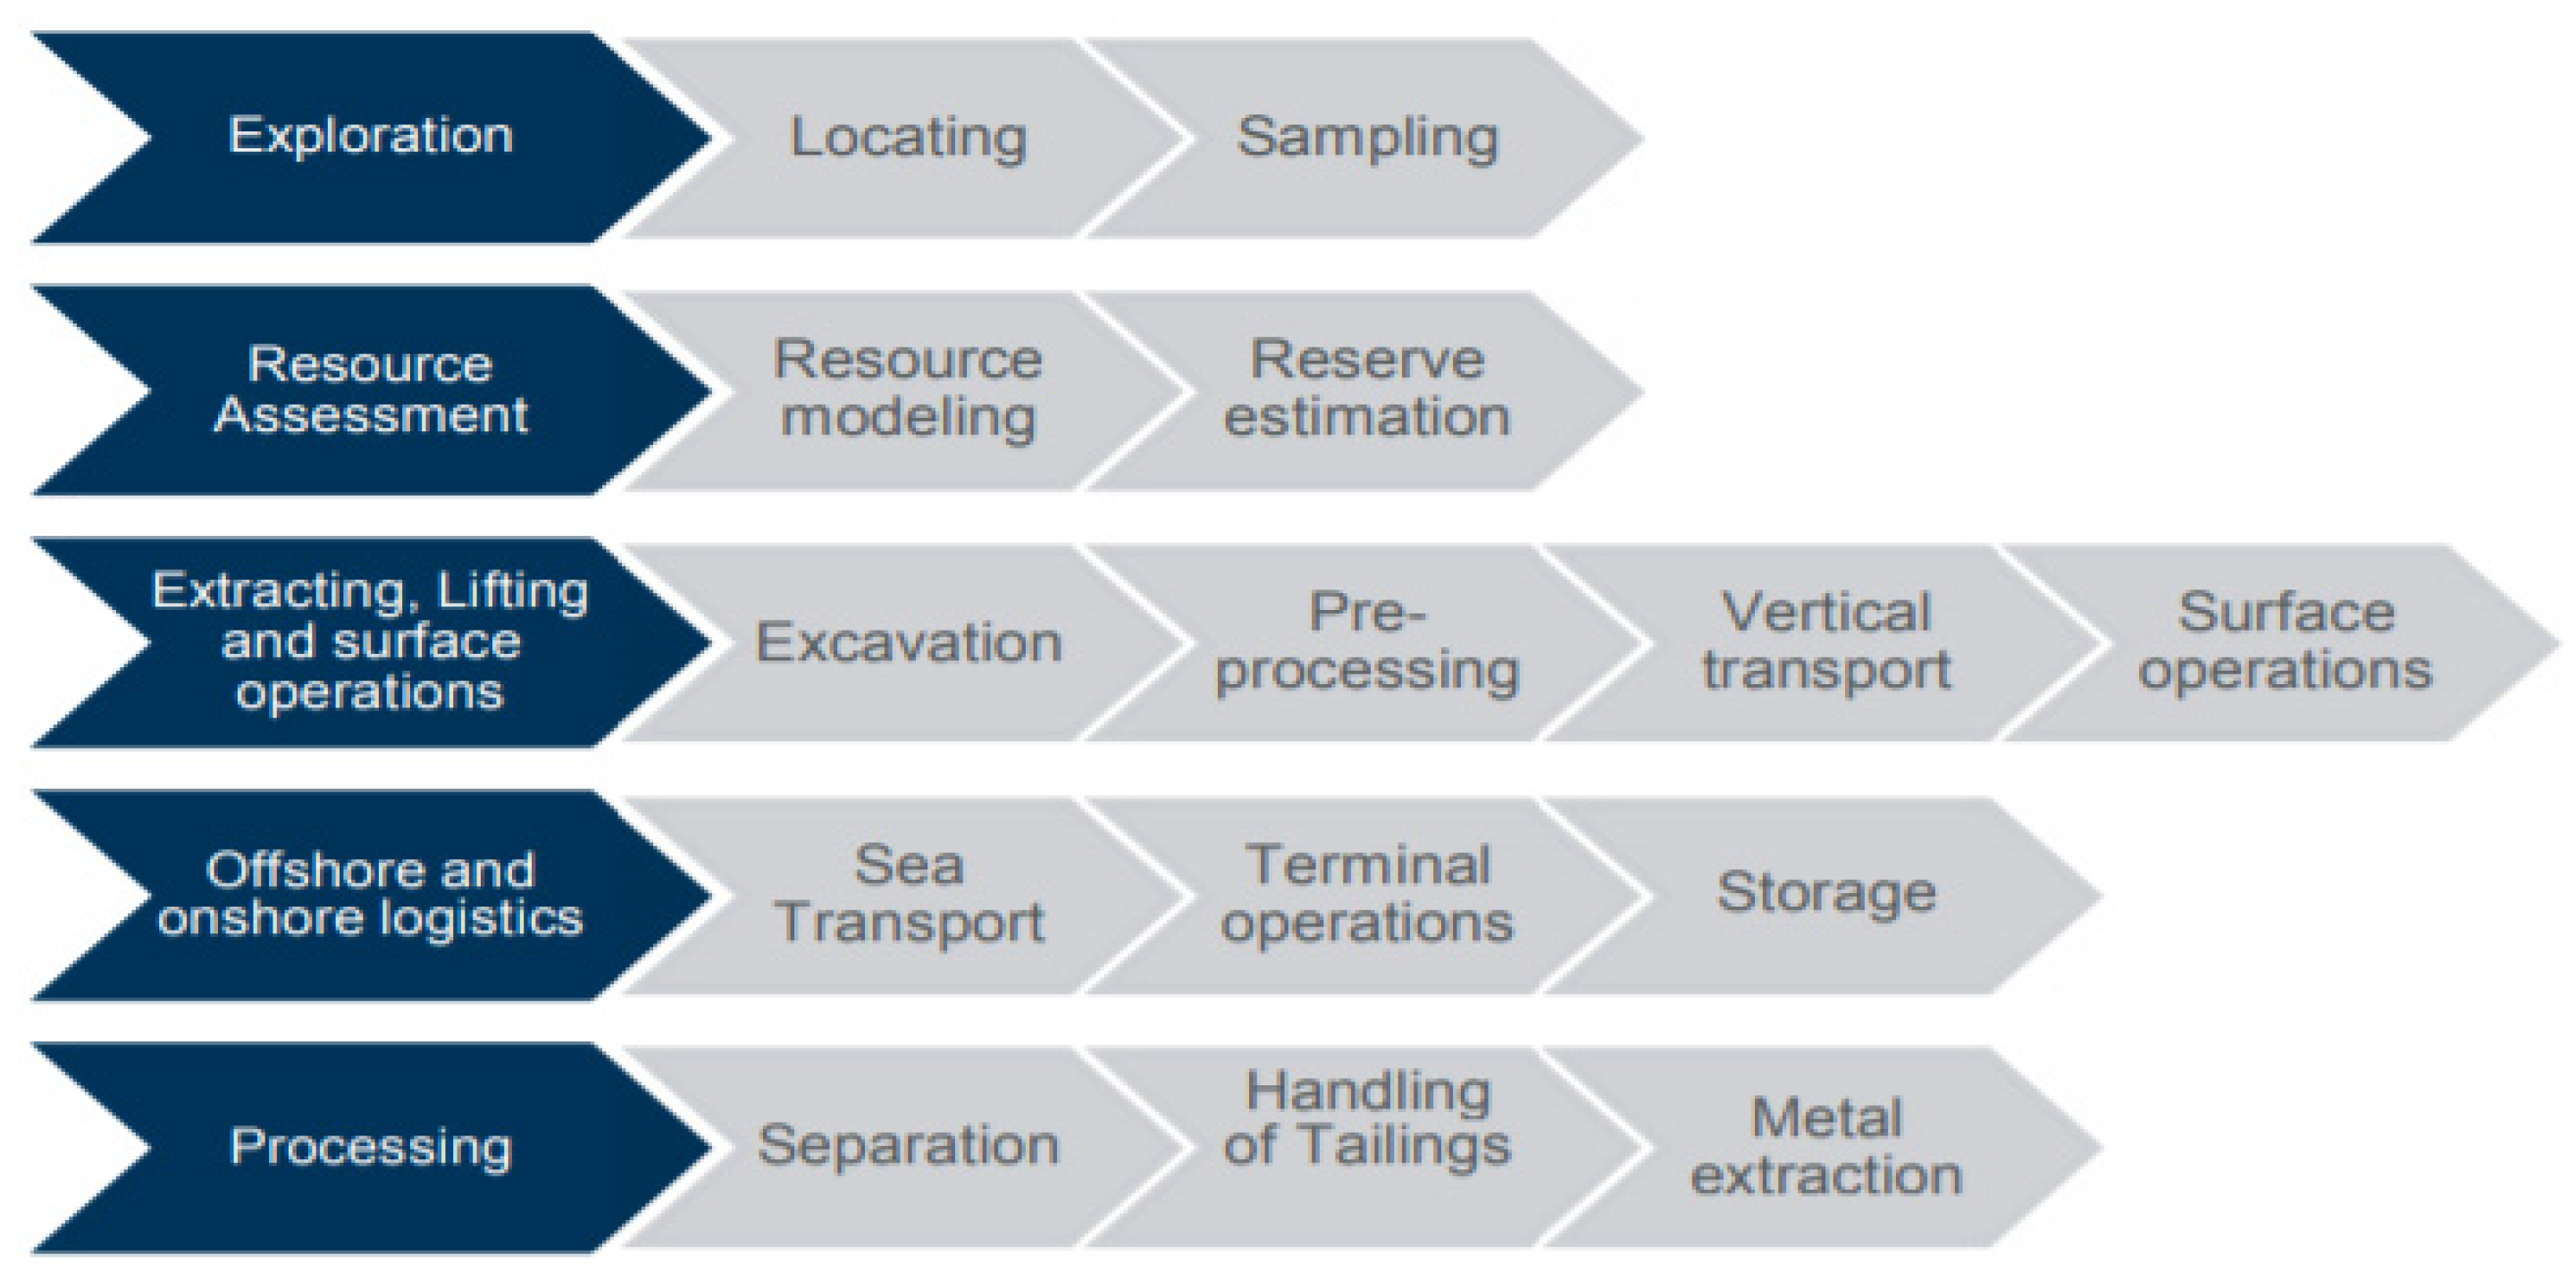
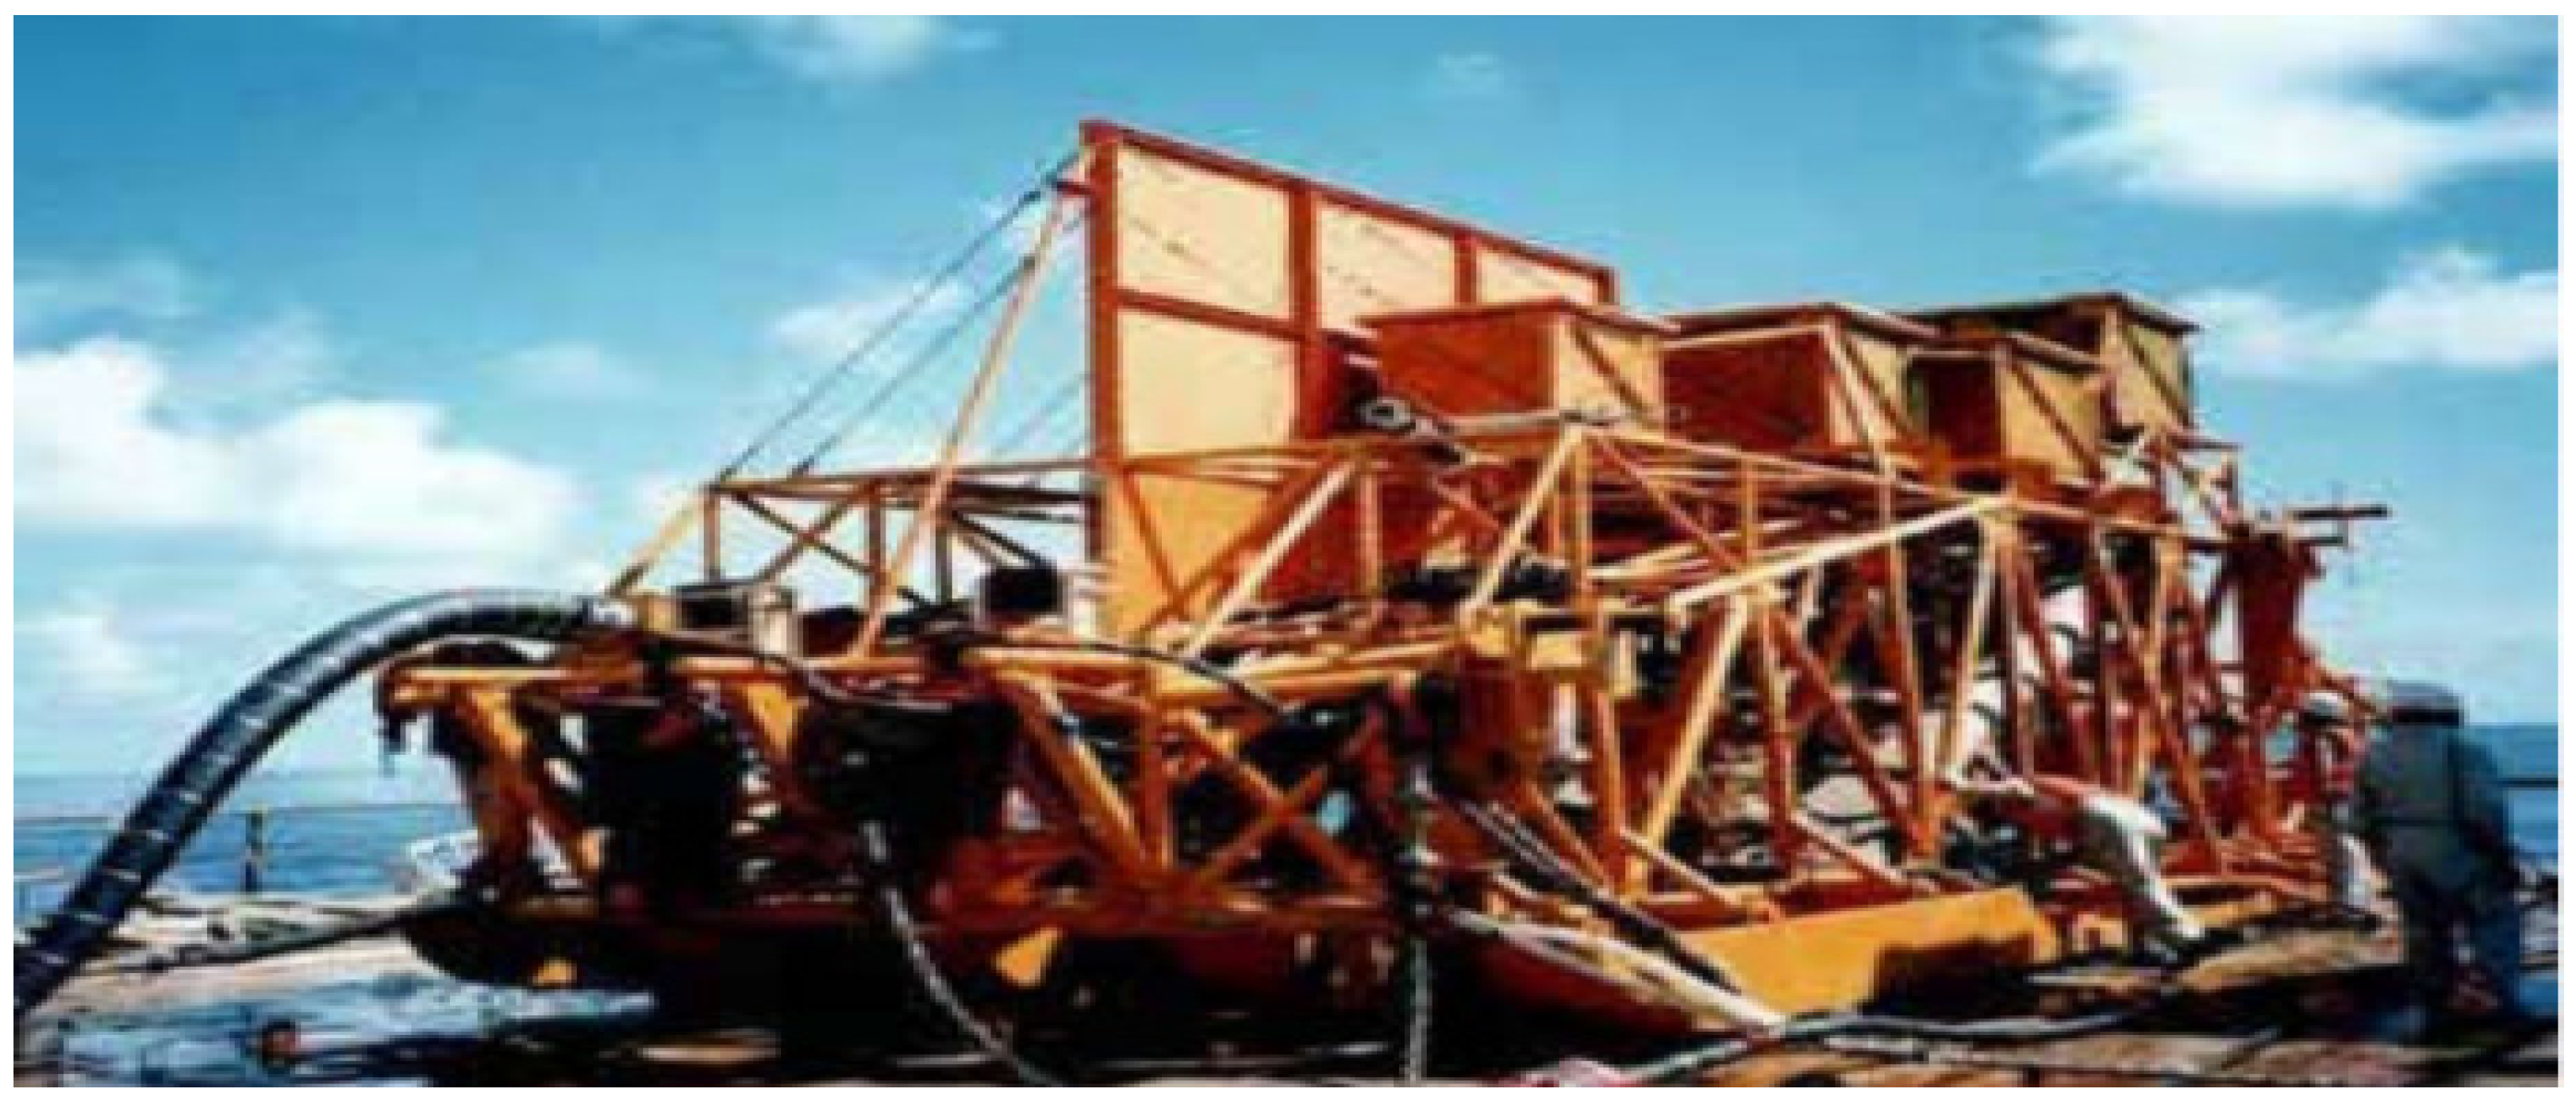
Mining operations are varied and complex, from exploration, to extraction, to refining and final metal production (
Figure 14,
Figure 15 and
Figure 16).
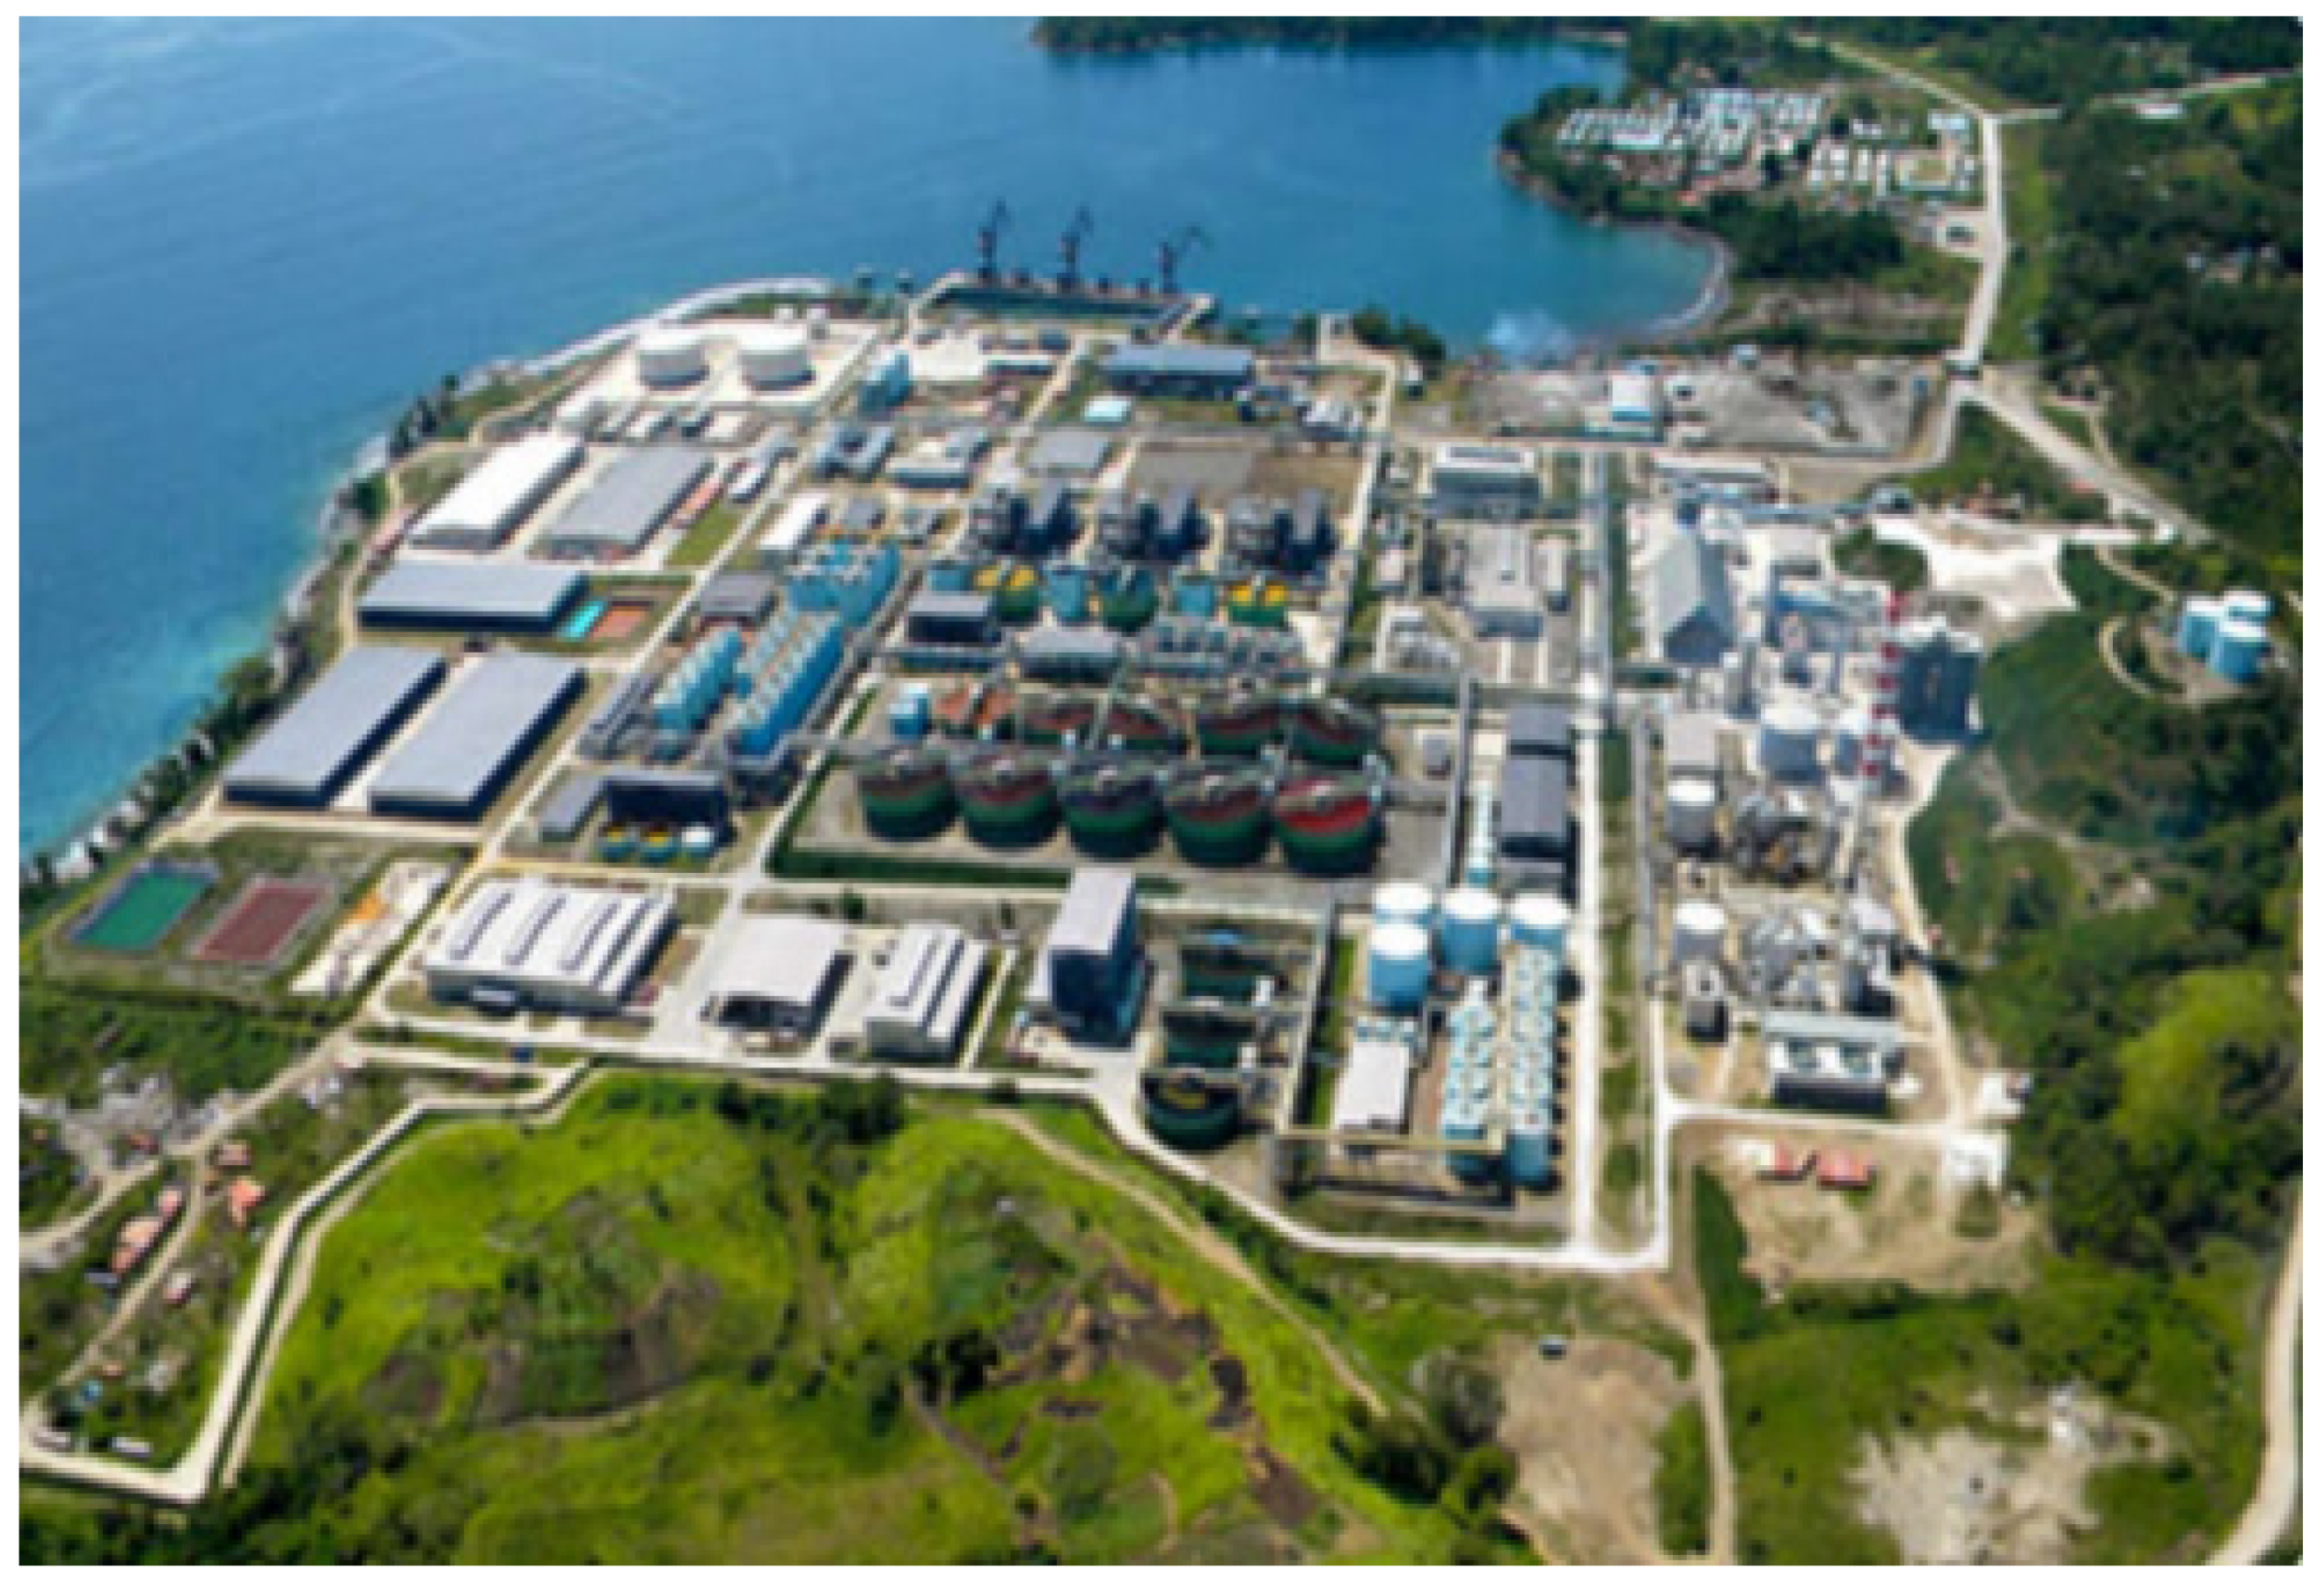
Manganese nodule processing, mineral beneficiation, and smelting plants required for manganese nodules would treat 2.5 million t of manganese nodules per year [
30]. If it is installed on land, a high pressure/high temperature acid leaching facility covering an area of about 180 acres will be required. Refining plants would include processing and support facilities, as well as long-term waste containment areas, with possible separate processing buildings for copper and nickel end-product development, nodule grinding and leaching, pH adjustment and neutralization, and ammonia recovery (Dames and Moore, 1977 [
34]). There would be a boiler-house/power-house and several cooling towers located adjacent to the chemical process areas, alongside offices, laboratories, maintenance shops, warehouses, worker-cafeteria, and other facilities.
The plants in total could occupy an area of 20–40 acres (8.1~16.2 ha), while an additional 20 acres (8.1 ha) would be needed for raw ore storage, settling ponds for treating wastewater, and storage for various other inputs that feed into the process [
34].
In addition to raw nodules and waste, about 5500 t of fuel and process materials would enter the facility, and about 240 t of waste products would be emitted per day [
34].
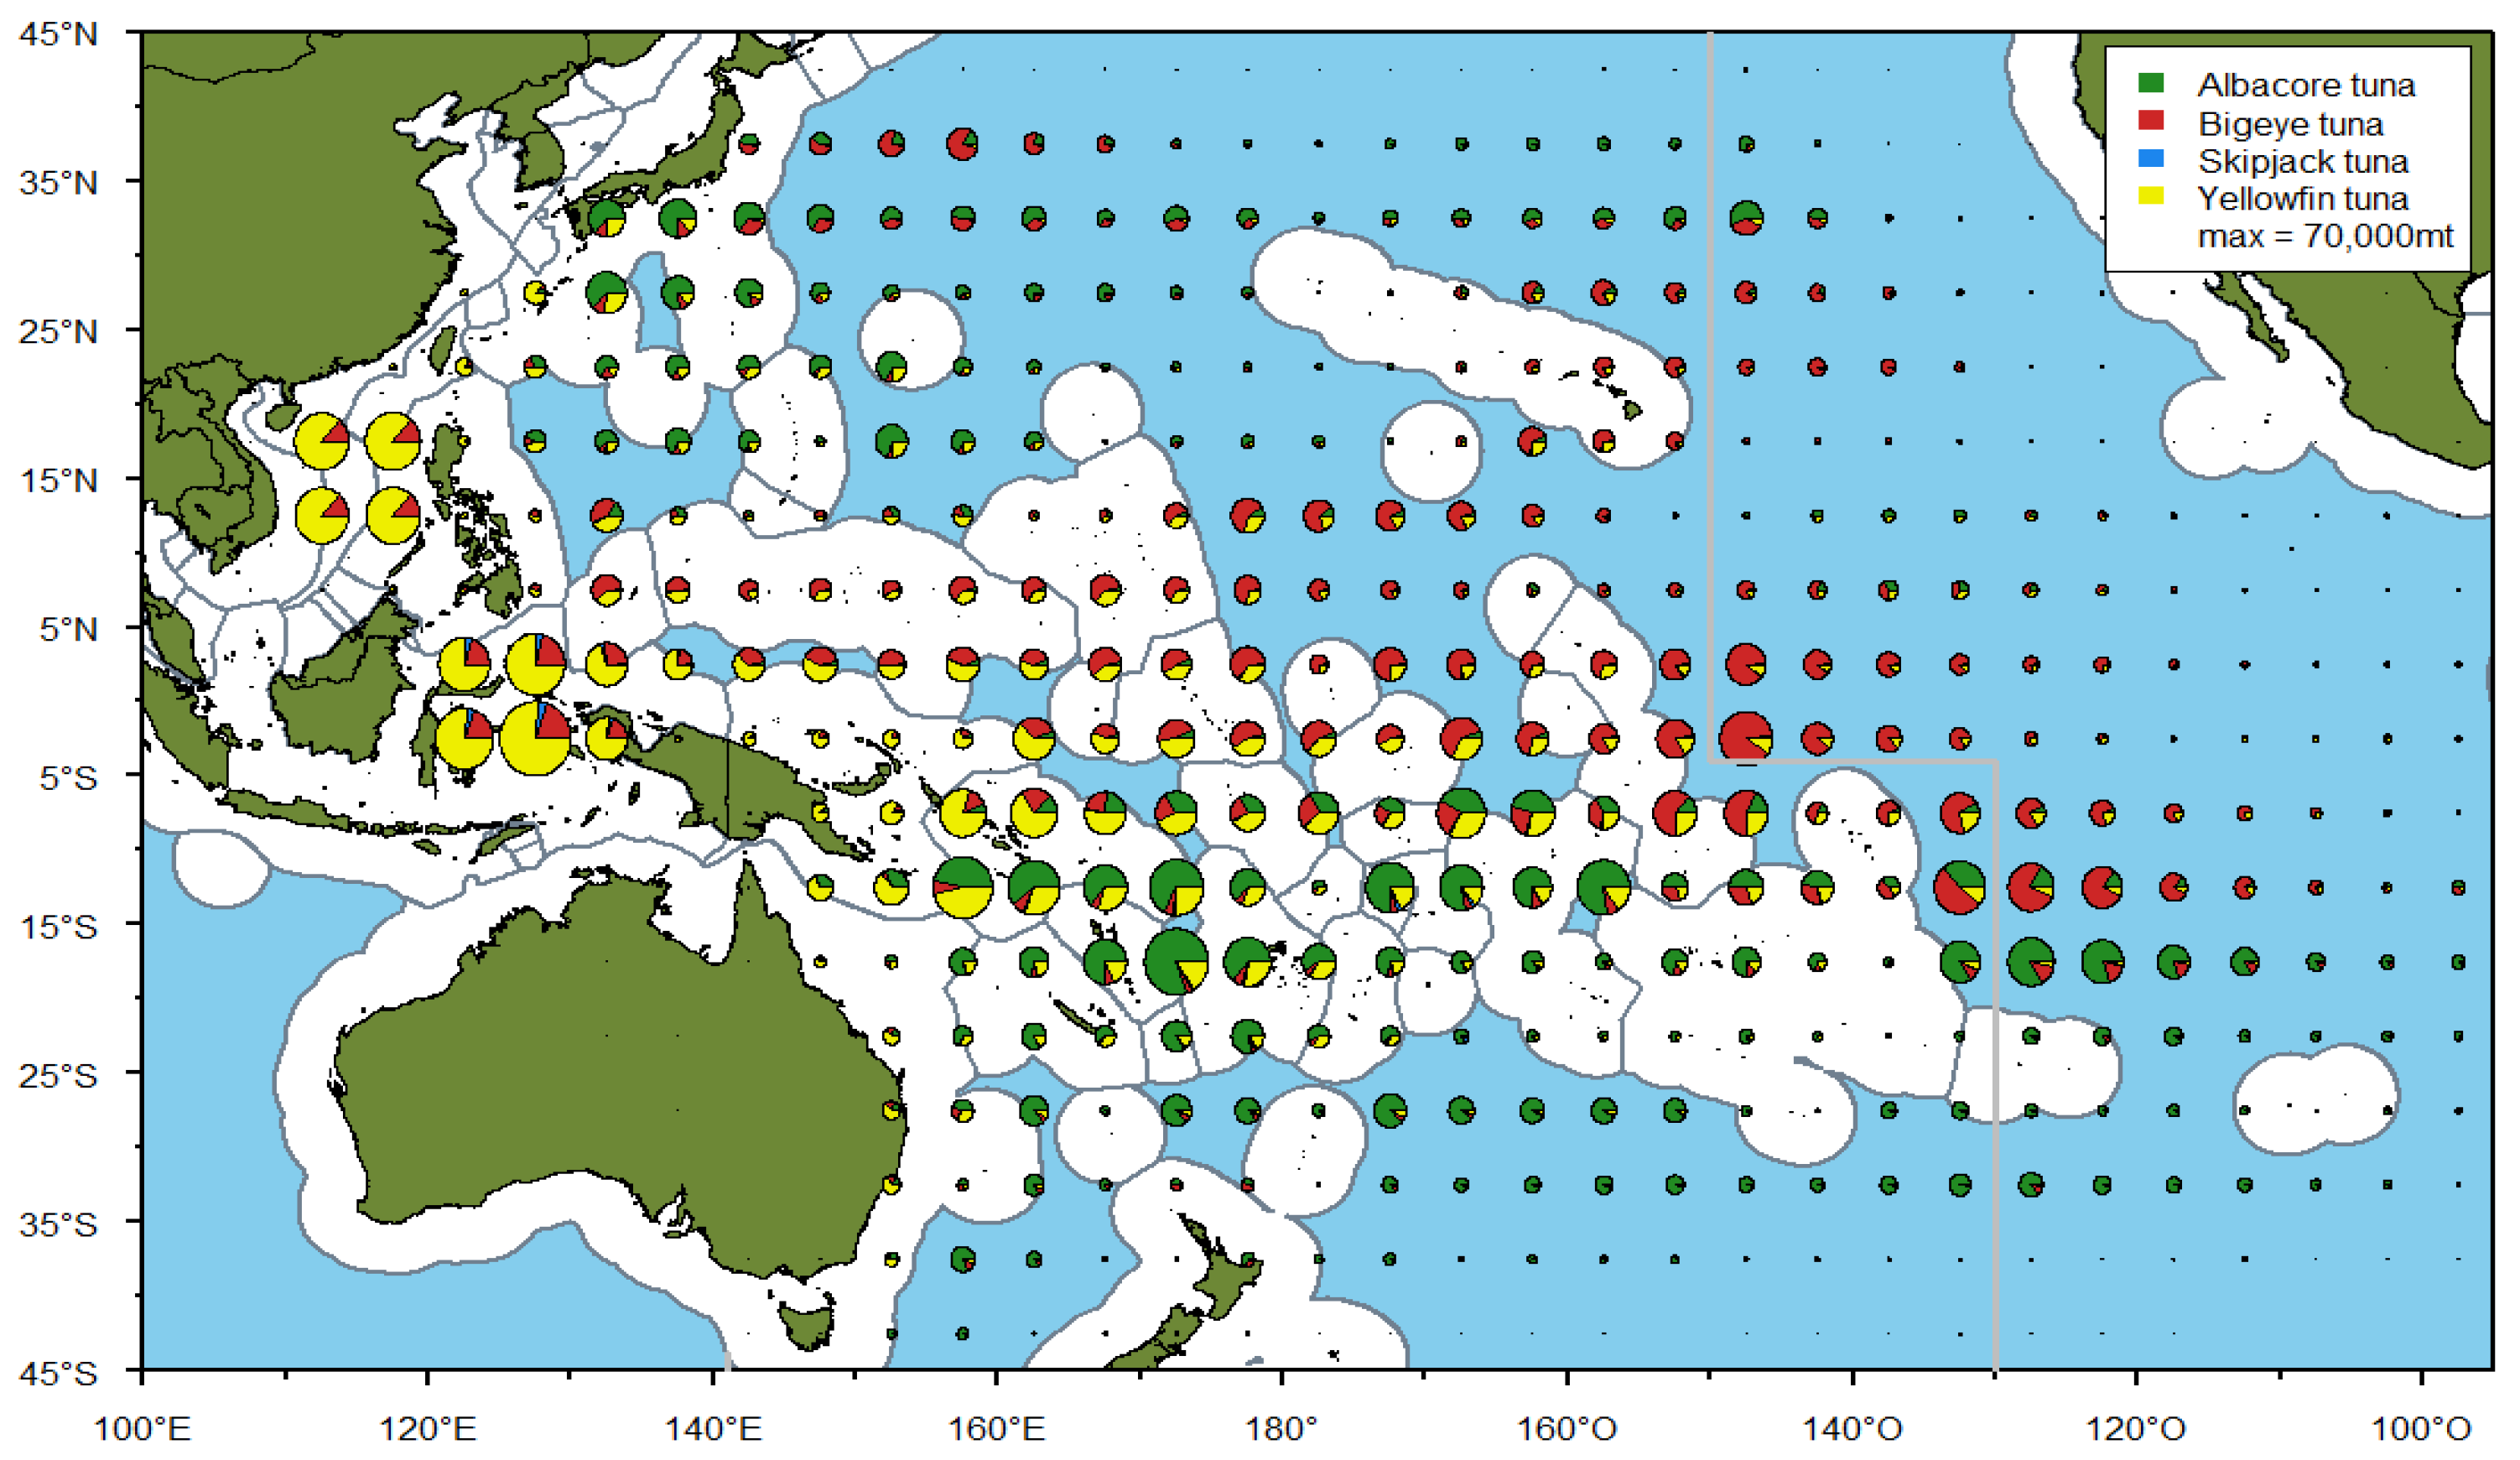
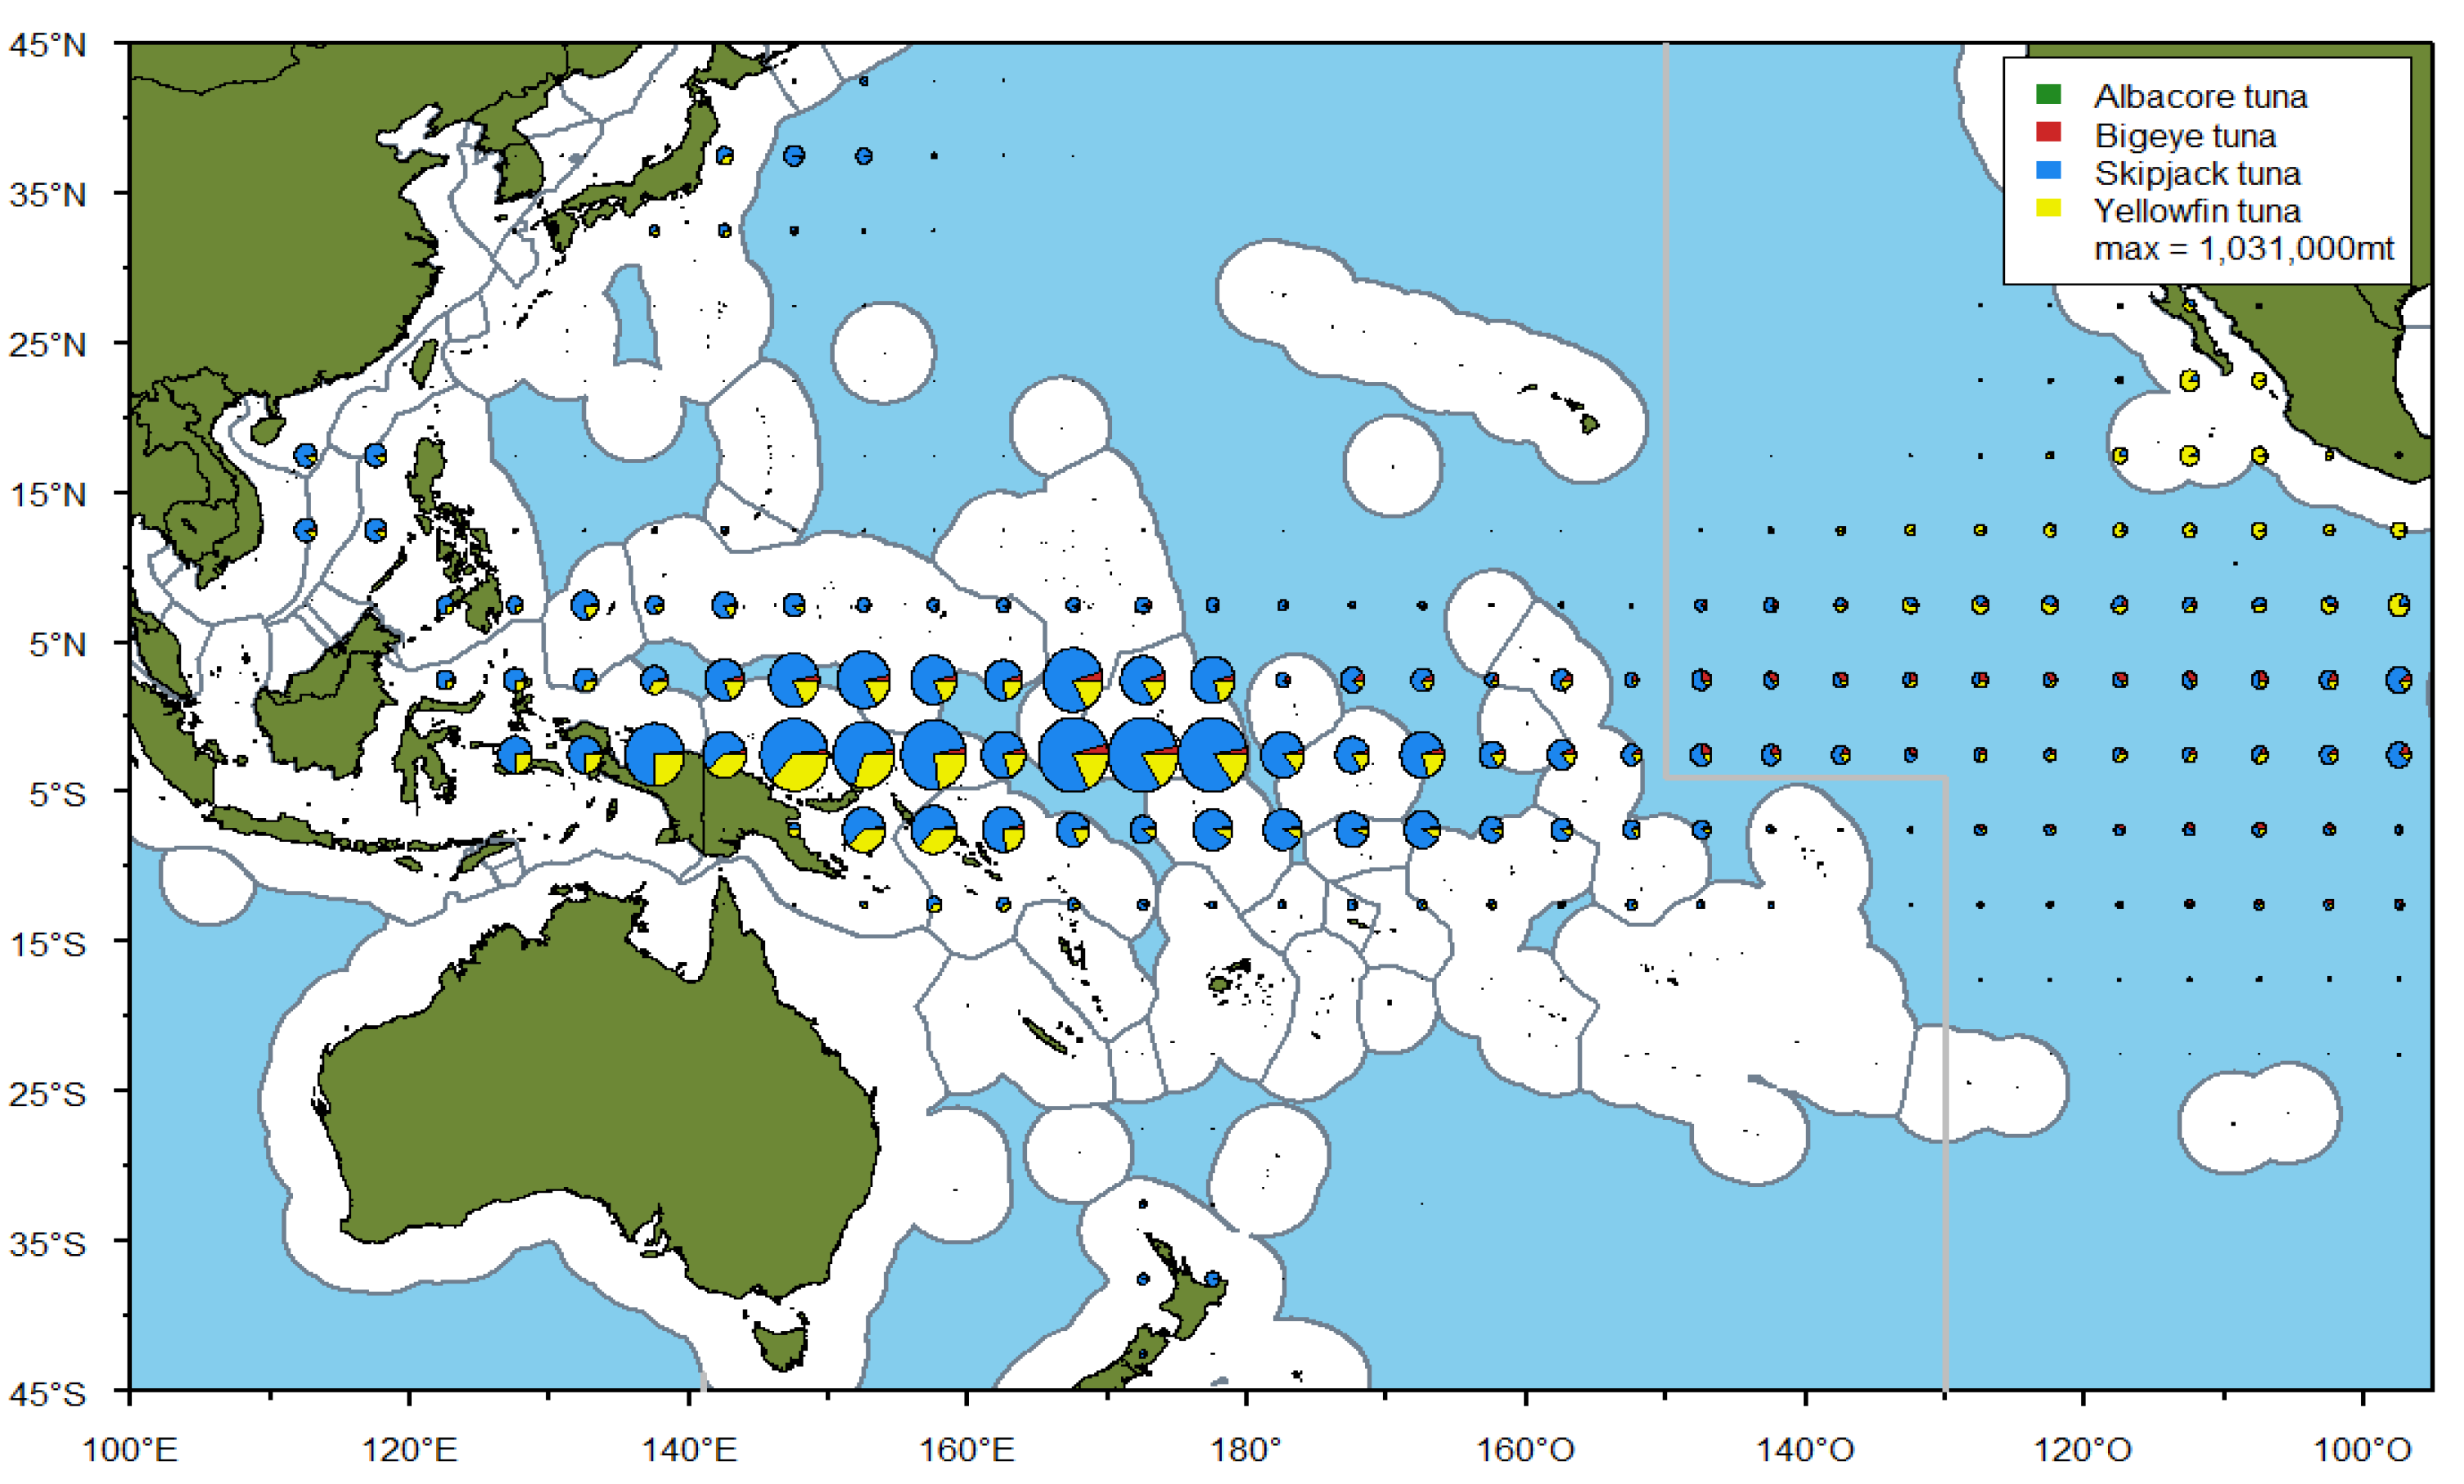
The current marine fisheries industry within the Pacific is an extensive large-volume industry. The distribution of Pacific tuna fisheries is shown in
Figure 17 and
Figure 18. This is also the region where OTEC plants can operate most efficiently and effectively.
Mining and smelting 2.5 million t of manganese nodules per year requires 1.6 billion gallons (6,056,658 m
3) of water and 149 GWh of electricity per year [
30]. Assuming that the electricity demand for seawater desalination is 5 kWh per m
3, some 30.3 GWh of energy will be required. The power demand could be met by installing an OTEC power plant with a net output of 24 MW (total output 40 MW) or more, to supply 179.3 GWh annually to the mineral refining plant, as well as all fresh water requirements from seawater desalination. OTEC plants would prevent the emission of 82,370 t of CO
2 per year. Hydrogen could also be produced by the OTEC plant: this fuel could be used to power ships and transportation related to mining at sea.
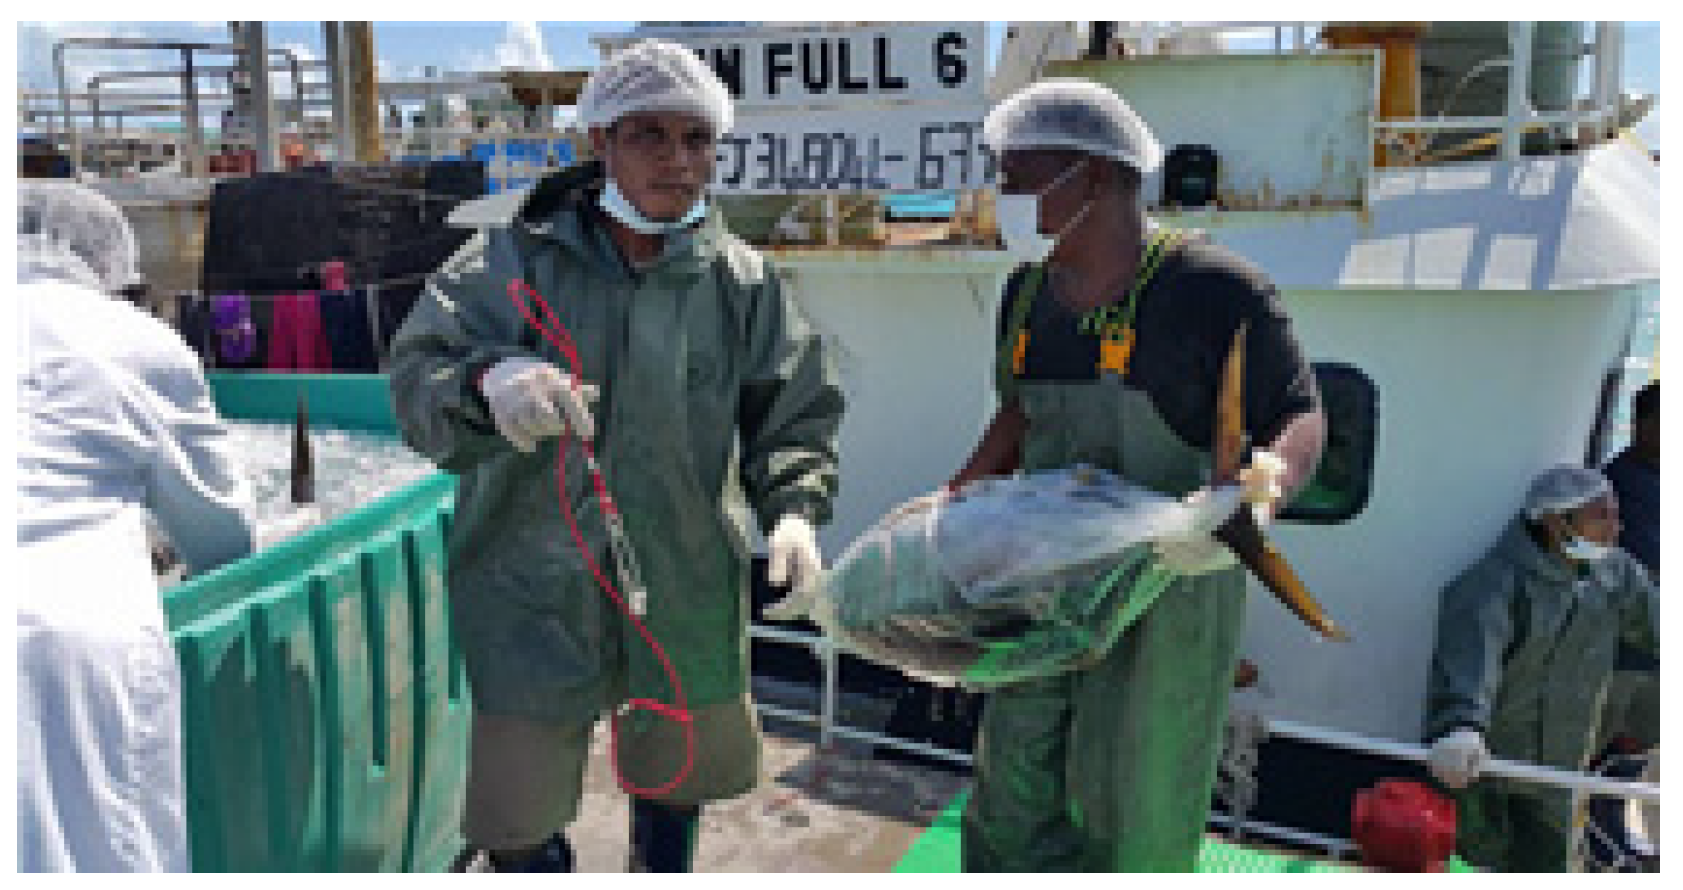
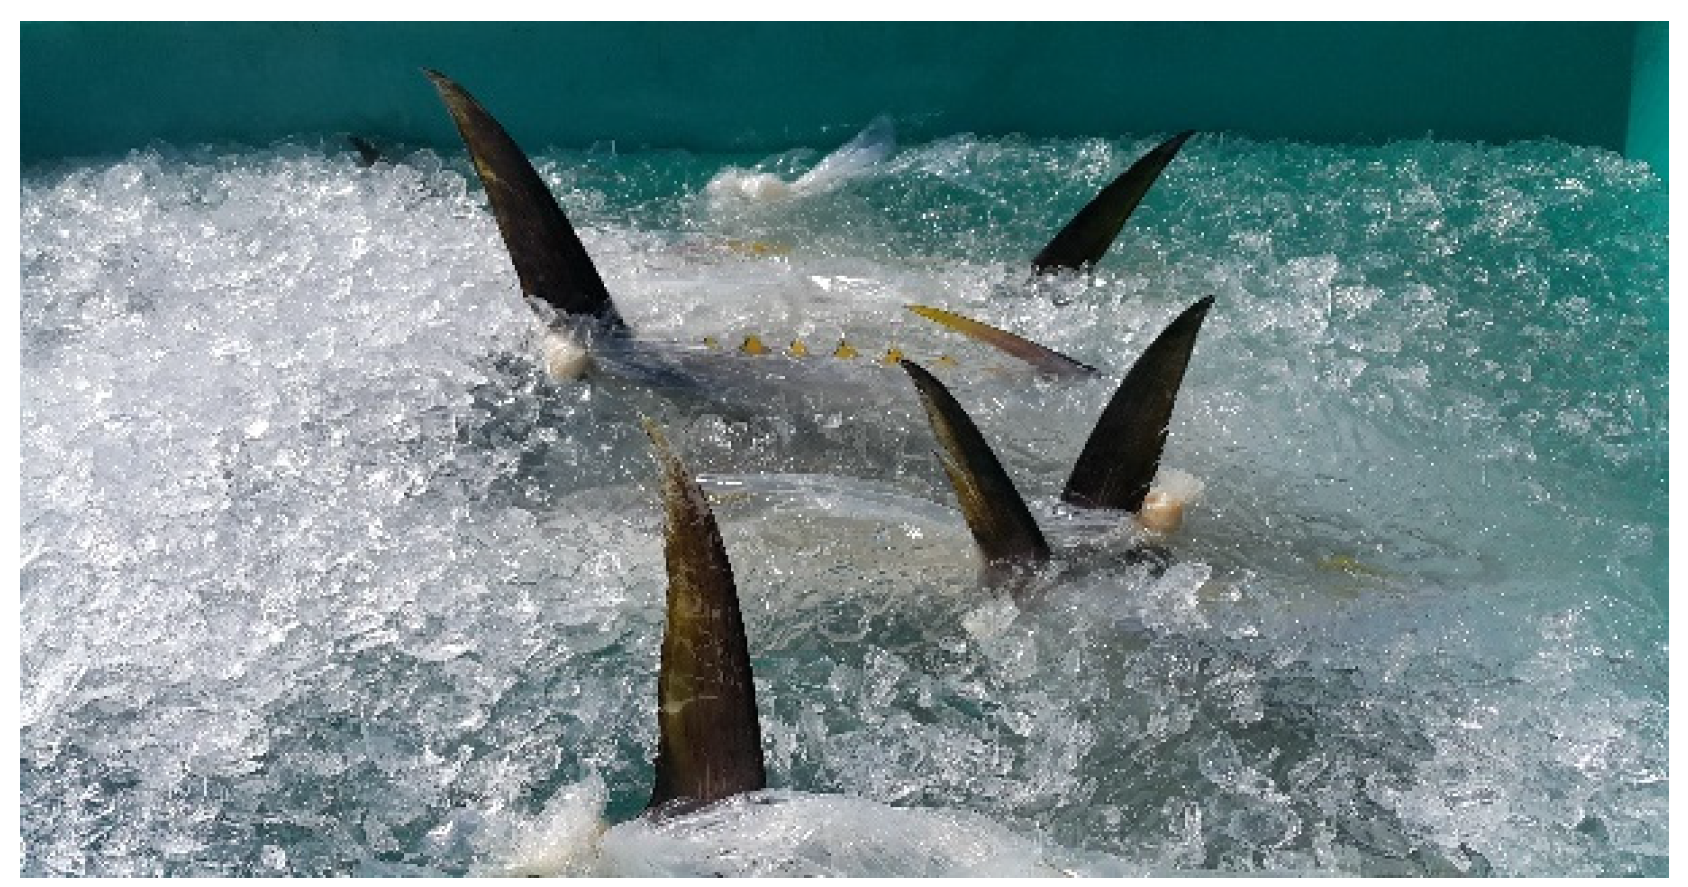
The caught tuna is transported directly to the market through a carrier, or transported to a treatment facility, for processing and sale. Processing is rarely undertaken within the Pacific region itself, for a range of reasons including electricity capacity, water resource availability, and distance from international market. There is scope for increasing the number of fish processing plants within the Pacific region. The case of fish production in Kiribati is considered here from the viewpoint of OTEC assisting this area of economic development.
Kiribati Fish Ltd. [
36] was established in 2010 and completed in 2012. It is located at Betio Port, South Tarawa Island. Fiji and China have invested US
$8 million, contributing to the revitalization of the local economy and job creation. The core businesses of the Kiribati Fisheries Company are tuna fishing, local fisheries, fish processing, and export packaging and transport (
Figure 19 and
Figure 20). This industry has created jobs for 200 people.
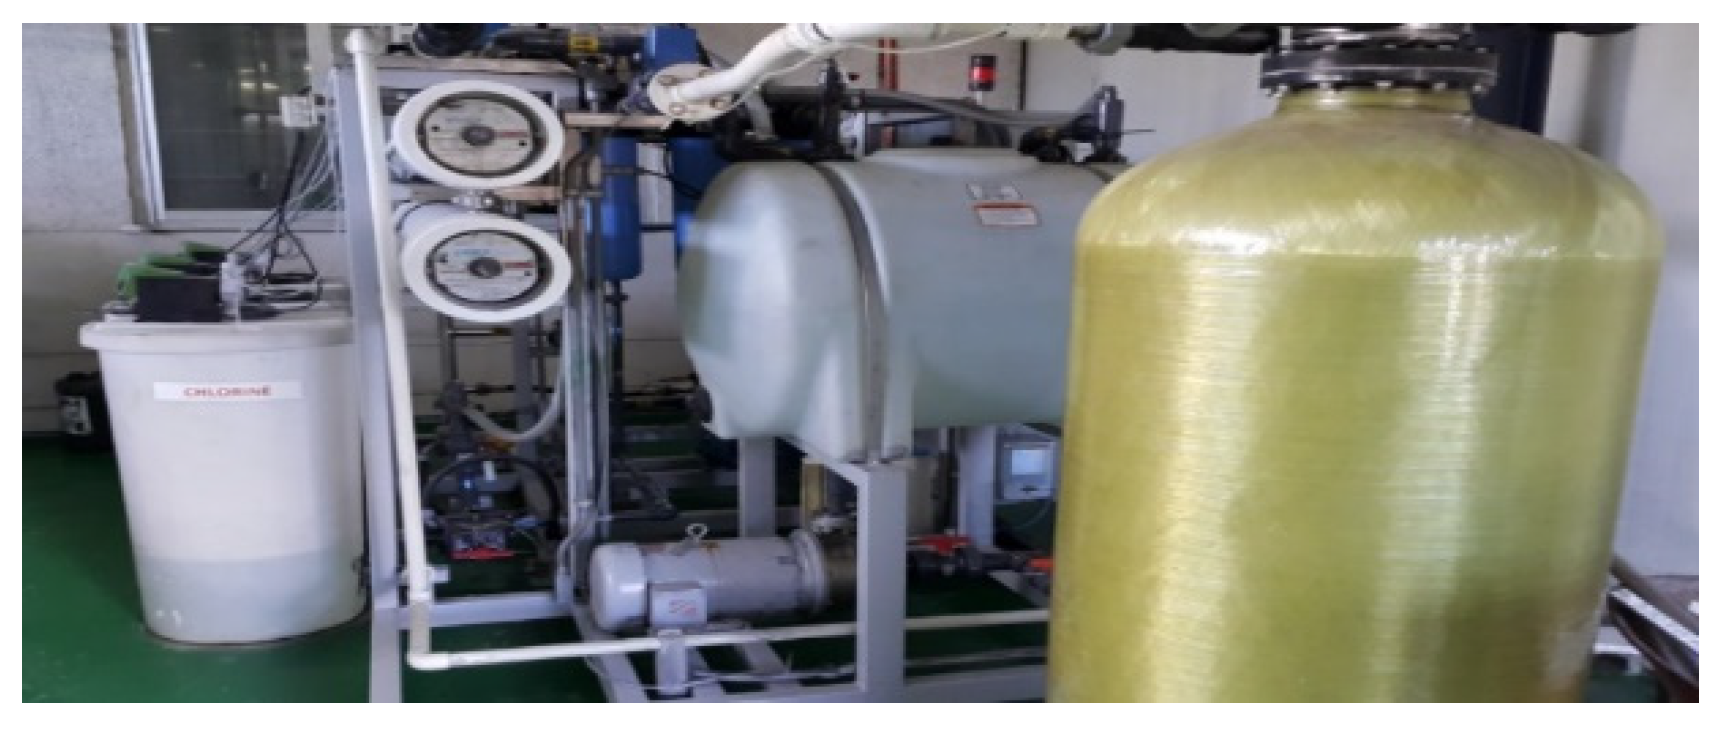
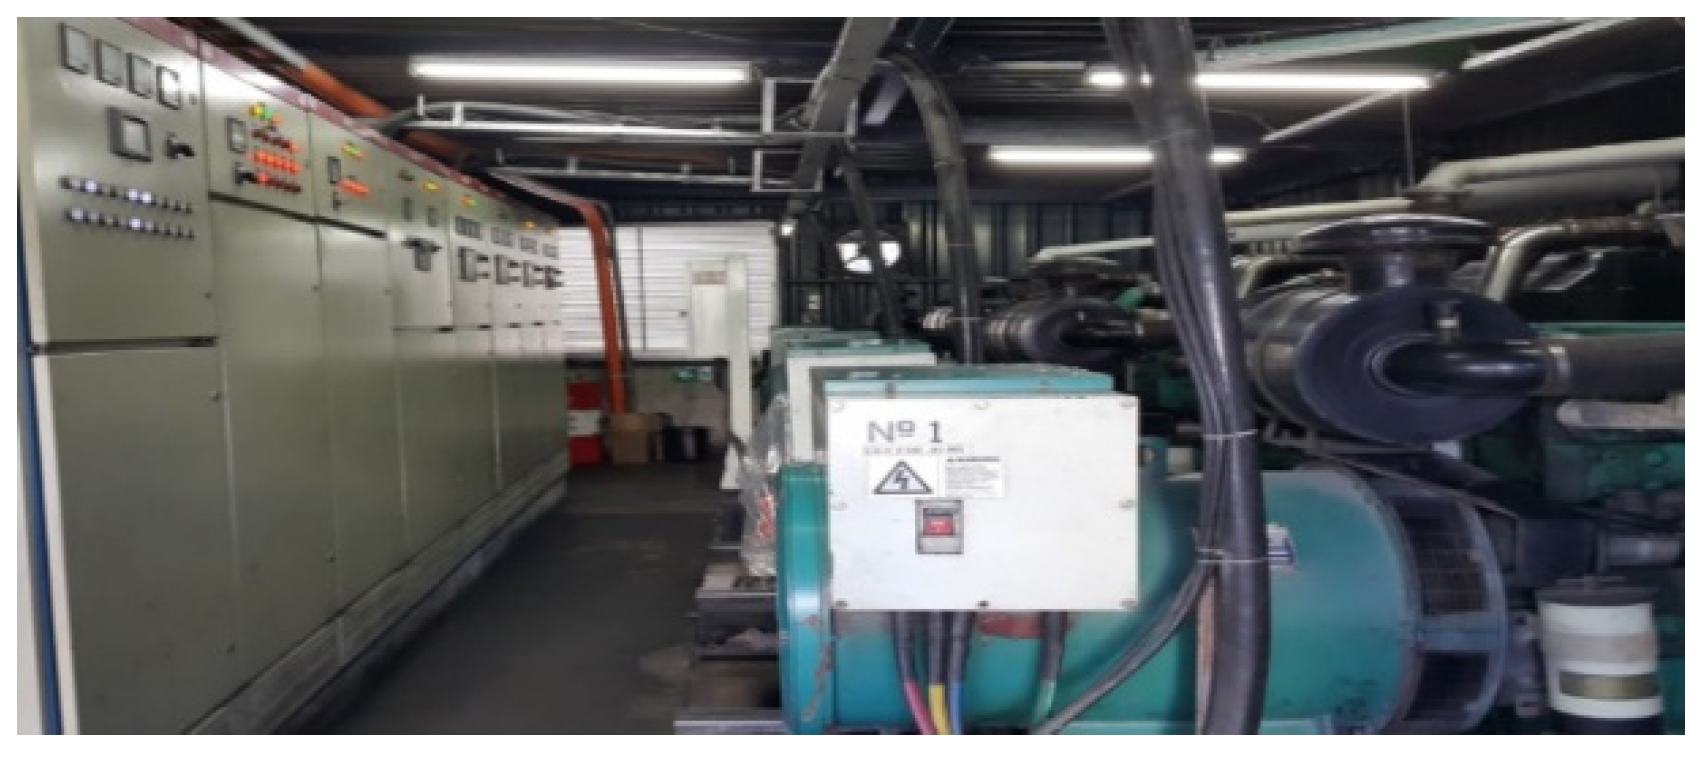
Electricity and fresh water are essential for processing tuna (
Figure 20) and other fish products. At the present time, diesel generators and seawater desalination systems are installed for plant operation purposes. Fuel costs are an important consideration for business such as this, as are carbon emissions, and water costs. The power generation cost of diesel generators depends on the fuel cost: these are relatively expensive in Kiribati, with the resulting power being supplied at rates of AU
$0.55/kWh for commercial and AU
$0.70/kwh for industrial use. Water is also scarce, and expensive at AU
$2/KL, if the monthly usage is less than 2.5 t, and AU
$15.00/KL if it is more than 10 t [
37].
The Kiribati Fisheries Company is operating two 200 kW class diesel generators and two 50 t/day reverse osmosis seawater desalination systems, as shown in
Figure 21 and
Figure 22. It was not easy to estimate the unit cost of power generation and desalination, but when one 200 kW diesel generator is operated for one hour, 59.5 L of diesel is consumed, so the fuel cost is about AU
$73.6. Including depreciation and maintenance costs, it is estimated to be equivalent to commercial electricity rates (AU
$0.55/kWh). To this end, if an OTEC plant with a net output of 0.6 MW (total output of 1 MW) were deployed, the annual carbon emission reduction is estimated to reach 2294 t CO
2.
In South Tarawa, Kiribati, the annual temperature of the sea surface water is c. 28~30 °C, and the deep seawater at a depth of 1000 m is c. 5 °C, which makes OTEC plants located in South Tarawa particularly efficient and able to produce 24/7 year-round power. Assuming that the annual operating cost is 5% of the production cost, based on the production cost of the 1 MW OTEC plant, and experiences within Korea to date for OTEC technologies, (
Figure 23 [
17,
18]), the life cycle power generation cost (LCOE) is estimated to be less than US
$0.39/kWh (
Table 3 [
23]). Based on this, it is estimated that the power generation cost of 10 MW and 100 MW commercial plants will decrease to less than US
$0.18/kWh and US
$0.09/kWh respectively, with efficiency improvements and capacity increase progress [
38]. Therefore, within the oceans of equatorial island countries such as Tarawa, it will be possible to establish a low-carbon, clean production base, through power-generation and desalination, using an appropriately scaled OTEC plant.
Hydrogen generation from OTEC plants is increasingly becoming a realistic proposition, with 100 MW plants generating (
Figure 24 [
39]), 10 MW (83,220 MWh/year) for electricity, and 50 MW (416,100 MWh/year) used for desalination and hydrogen production. Some 19 t of hydrogen could be produced per day (about 7000 t/year).
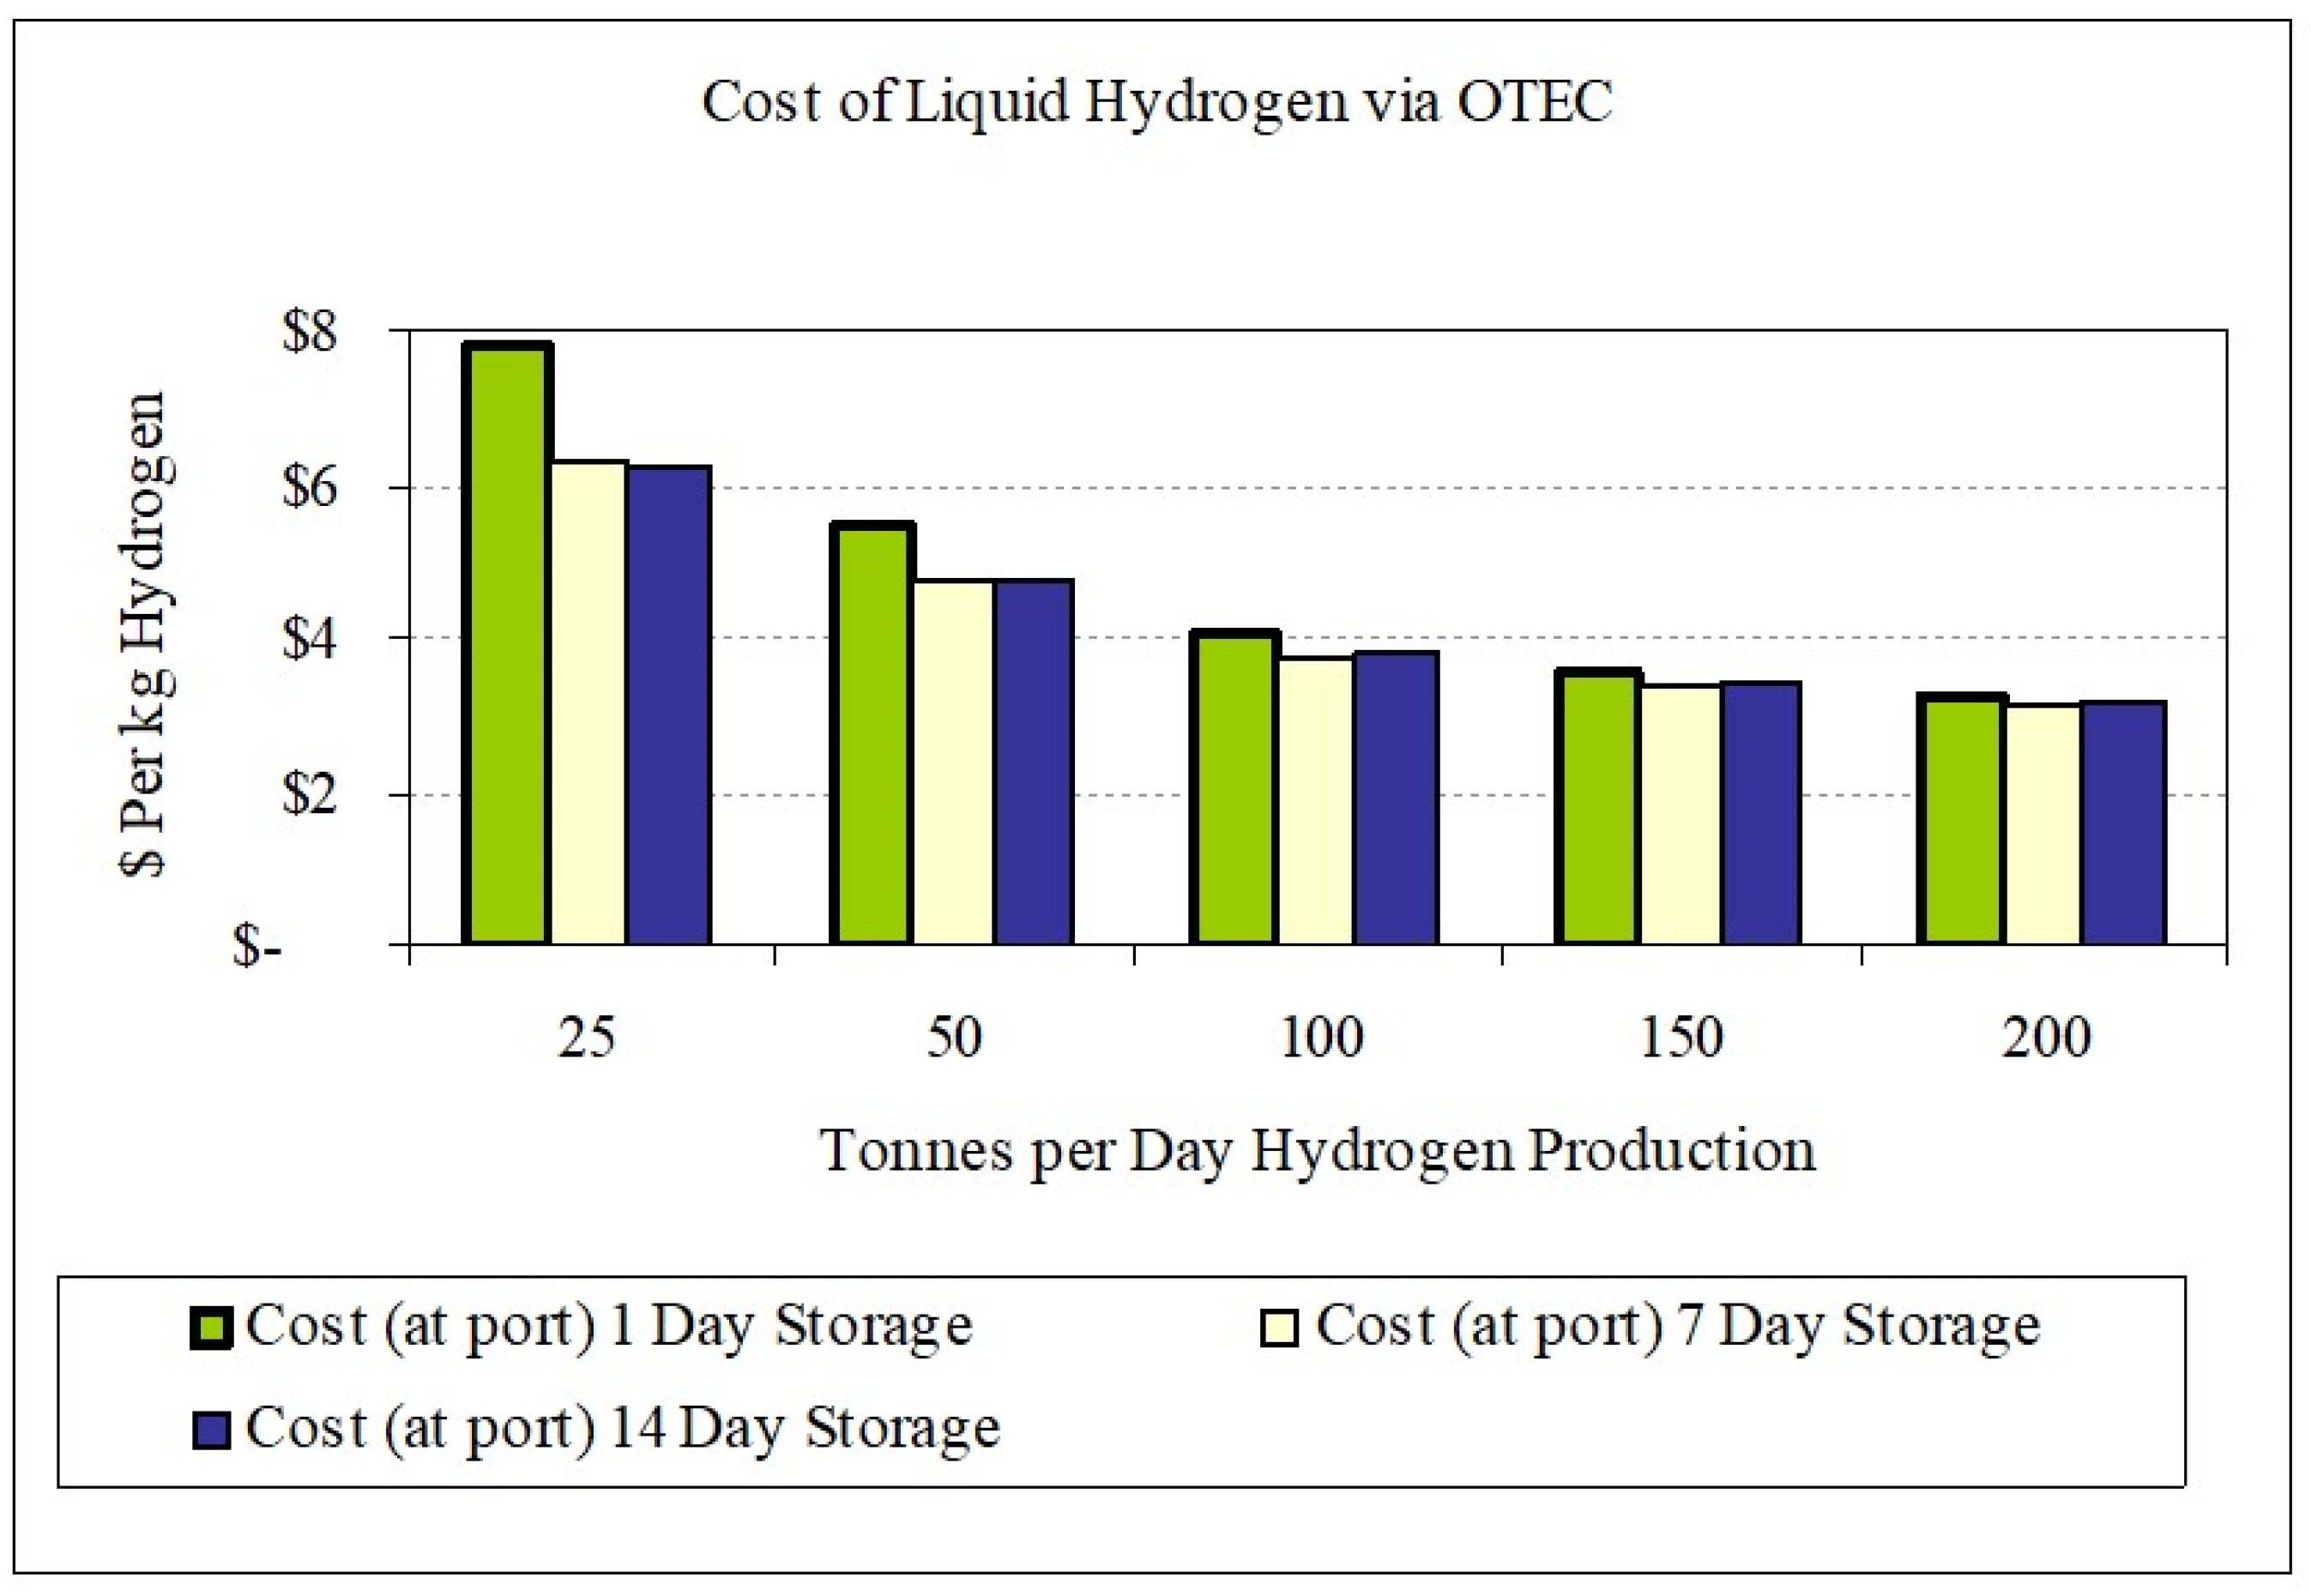
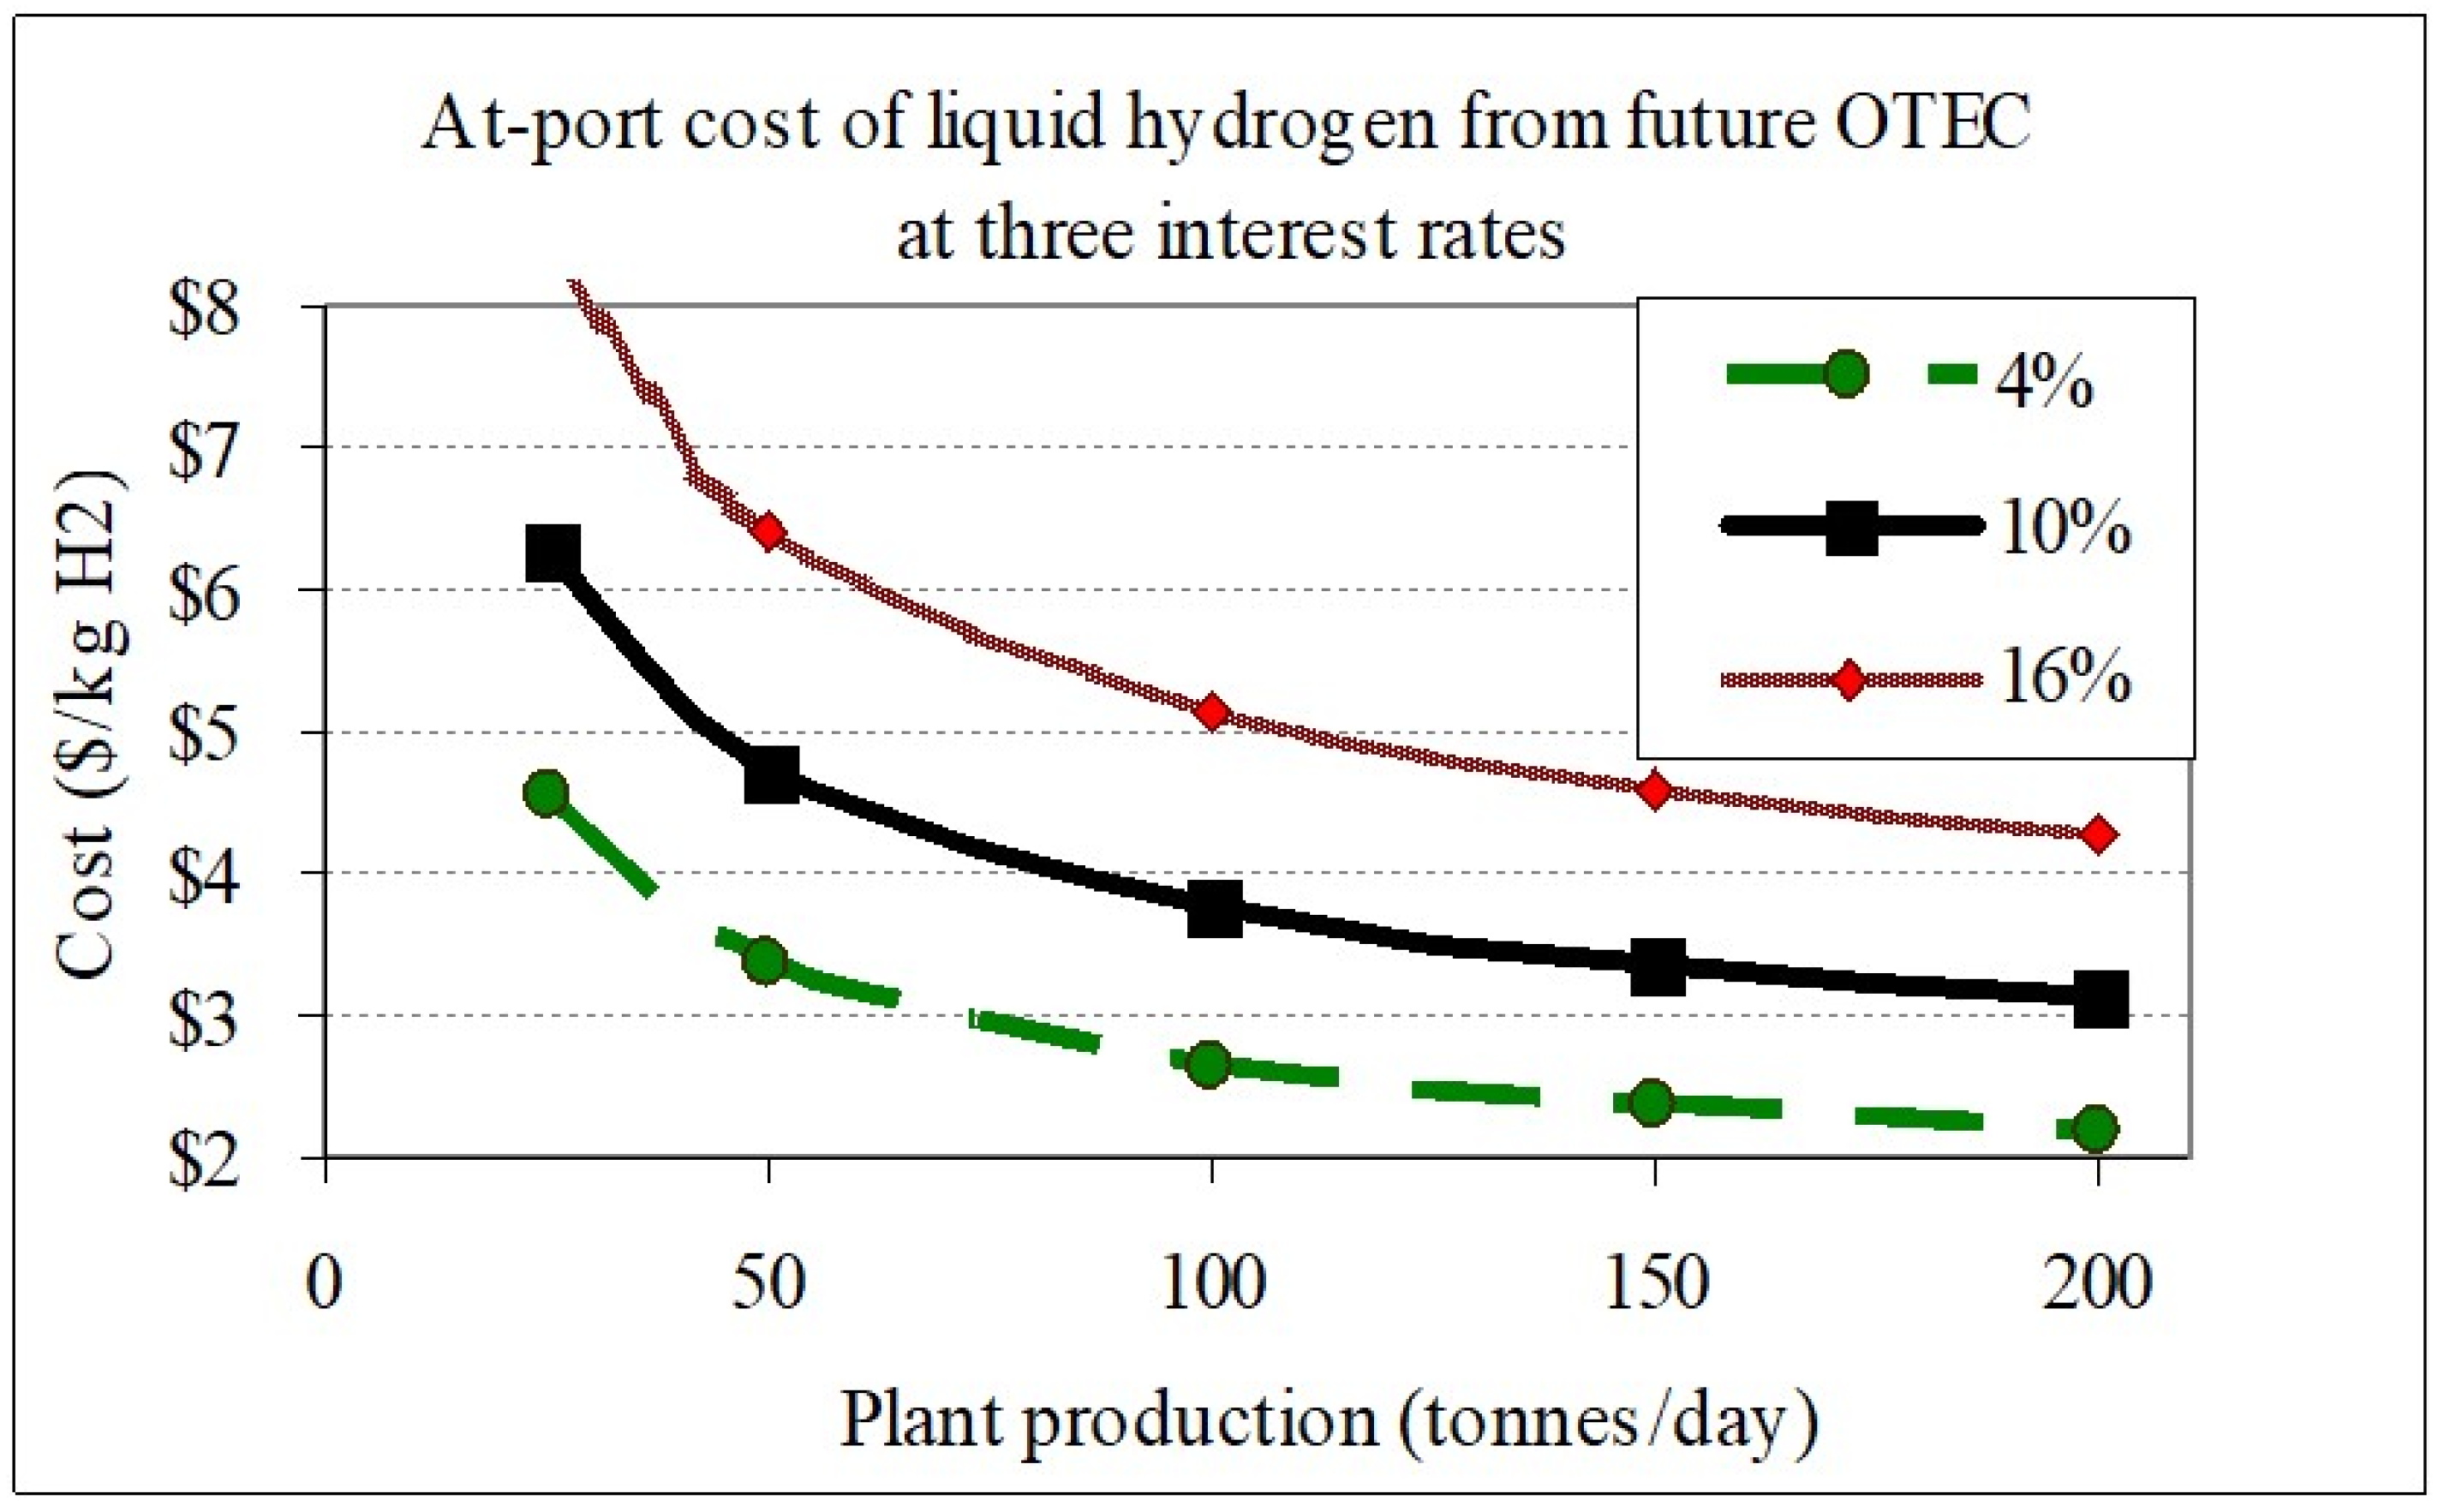
Makai Ocean Engineering. Inc. has estimated the production cost of OTEC power for hydrogen production and transporting it to a demand site, based on a range of scenarios. For the case of using all of the electricity of an OTEC plant, capable of producing 25 to 200 t/day hydrogen, the supply cost, including transportation, was estimated at US
$8 to US
$3/kg H
2 (
Figure 25, [
39]). This accounted for an interest rate on initial investment of 10%. If a discounted c. 4% interest rate were applied, costs reduce to c. US
$4.5–2/kg H
2 (
Figure 26, [
39]). Interest rates of 4–6%, on initial investment costs, could achieve a price for green hydrogen of
$3/kg.
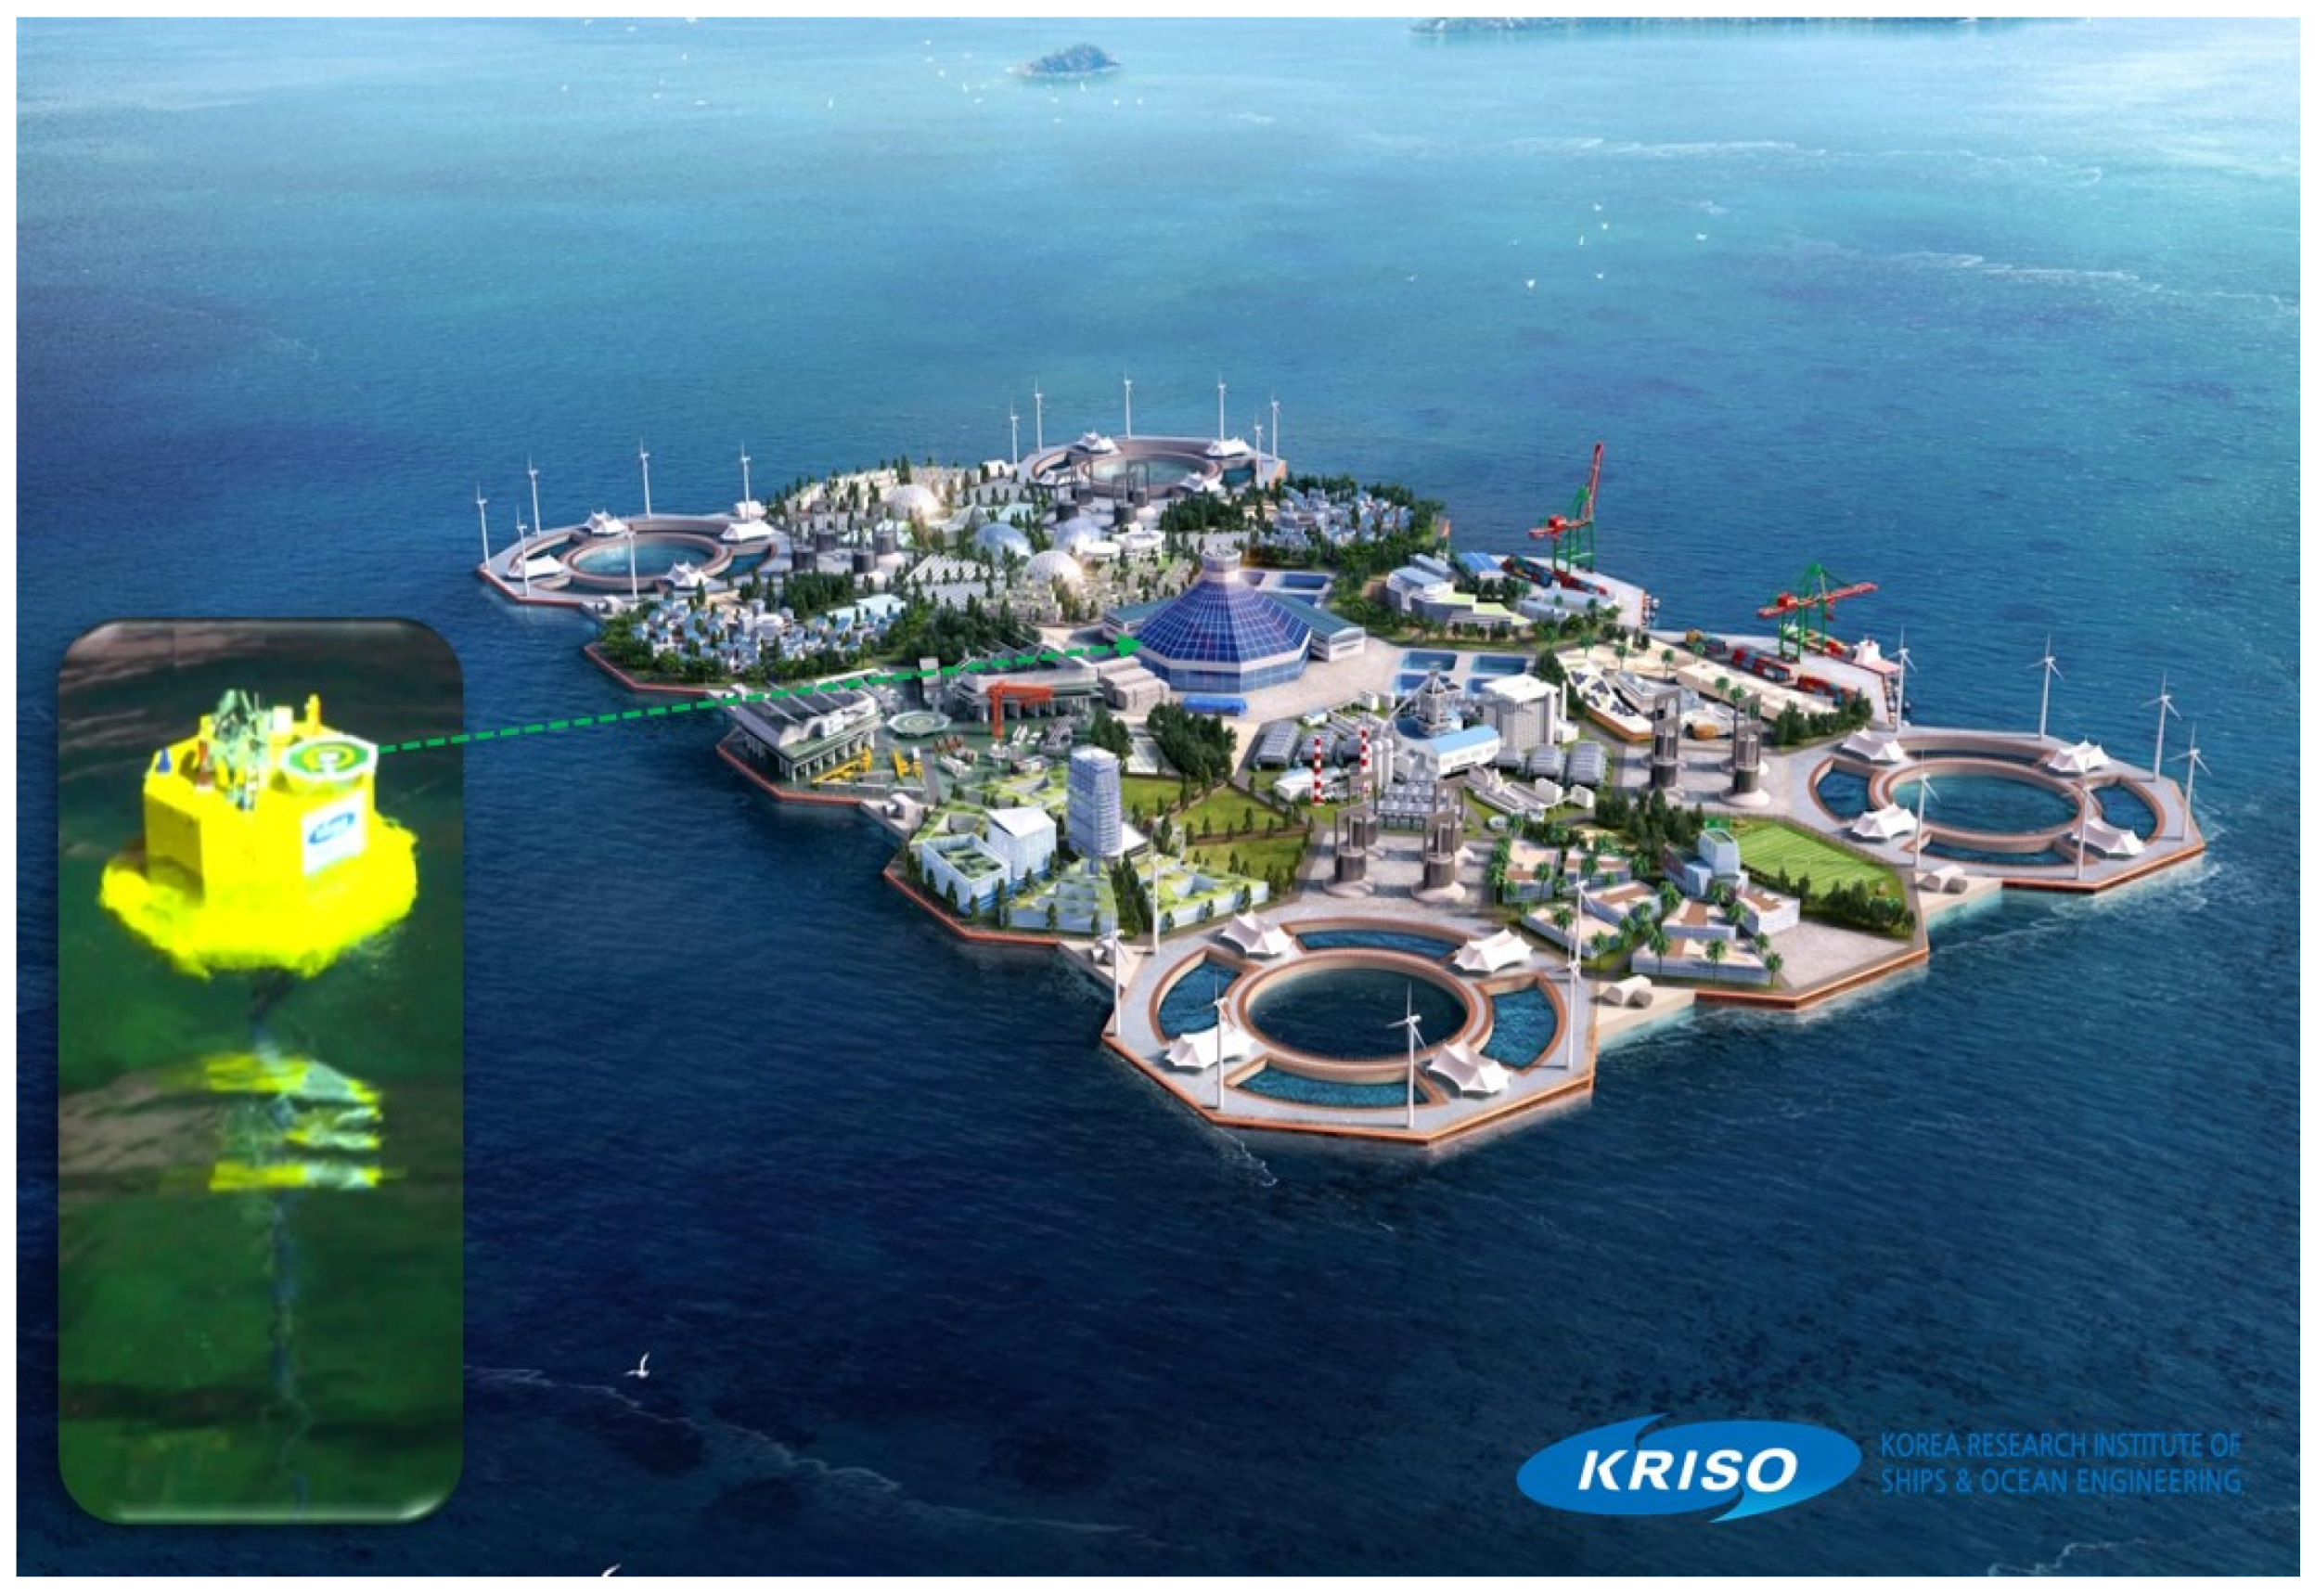
Therefore, if the current OTEC technologies become successful and further improved, the generation of green hydrogen is a distinct technical and economic possibility (
Figure 27, [
40]). A very large floating structure (VLFS) is required for processing of deep-sea mineral resources and pelagic aquatic resources, and hydrogen production in the open sea. VLFS can be fabricated by connecting multiple Octagonal Sevan platforms centering on the OTEC platform, and basic studies were carried out through numerical analysis and Ocean Engineering basin experiments in KRISO [
41,
42].
7. Direction of Use of OTEC to Strengthen Regional Resilience
The climate crisis facing Pacific island nations not only relates to the possible shrinking of island boundaries with sea level rise but, also relates to a number of aspects of life quality and livelihoods. These may relate to the shortage and cost of energy supply, impacts on food and water security, and ecosystem degradation, as well as increasing risks related to coastal erosion, heat waves, cyclone frequency and intensity, drought length and frequency, and other environmental impacts. OTEC technologies can have a place in assisting with more optimistic future scenarios [
43]. These include 24/7 production of green energy from a practically inexhaustible energy source, the provision of fresh water from desalination, opportunities for cooling, refrigeration and heating, contributions to aquaculture and hydroponic agriculture, the potential development of seawater mineral industries (e.g., salt, lithium, sodium, potassium, calcium, strontium, chlorine, etc.), and the generation of hydrogen.
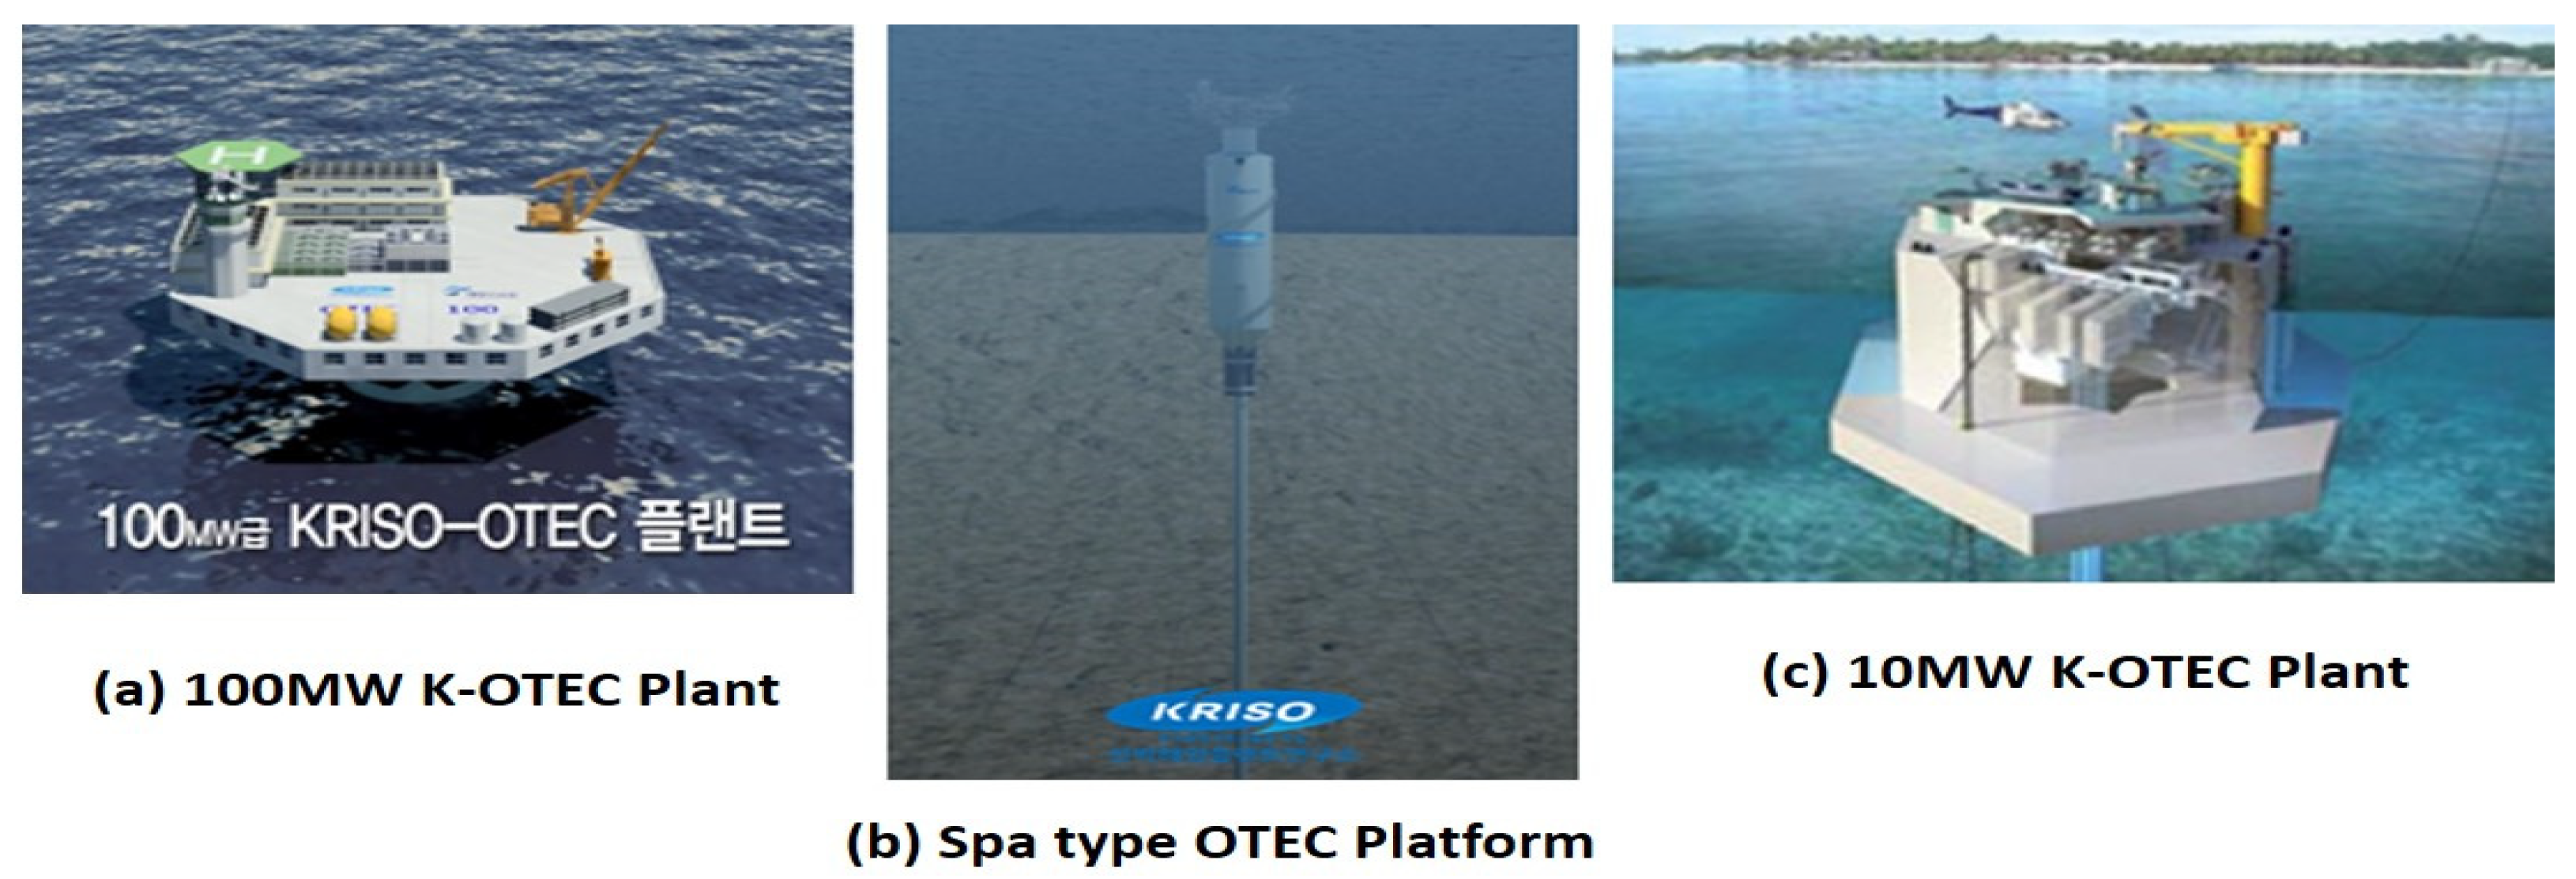
An economically sized OTEC plant will enable the sustainable development of related projects that require a large amount of seawater. For example, the 100 MW class OTEC plant has to take in more than about 10 million t of deep seawater per day, and drain it to about 10 °C with clean seawater quality. This will enable a large scale aquaculture complex that produces more than 50,000 t of salmon per year, or desalination or facility agriculture, microalgae culture, and so on. In addition to green power and fuel supply, district cooling is capable of establishing carbon-neutral communities along Pacific Islands Countries.
This paper focuses on small island developing states (SIDS) that have a number of advantages for small scale to medium scale OTEC plants. However, the return on economic investment is not anticipated to be large, as markets are small. SIDS have an urgent need for reliable green energy and they are excellent ‘testing grounds’ for the further development of OTEC technologies. It is probable that if the proof on concept for OTEC plants in SIDS is realized, there would be a natural progression to larger scale OTEC plants (100 MW to GWs), which would require larger markets and bigger populations. Countries such as Indonesia, Malaysia, Philippines and Mexico, etc. are candidates for the development of large OTEC plants.
OTEC can assist with a range of industries including fisheries, shipping, and seabed mining. These are an impressive combination of potential outputs from one generic technology. These environments, materials, and energy can be used to promote health and improve economic regeneration. In other words, the use of seawater energy and resources could contribute to achieving a range of UN Sustainable Development Goals (SDGs) for the local community (
Figure 28 and
Figure 29).
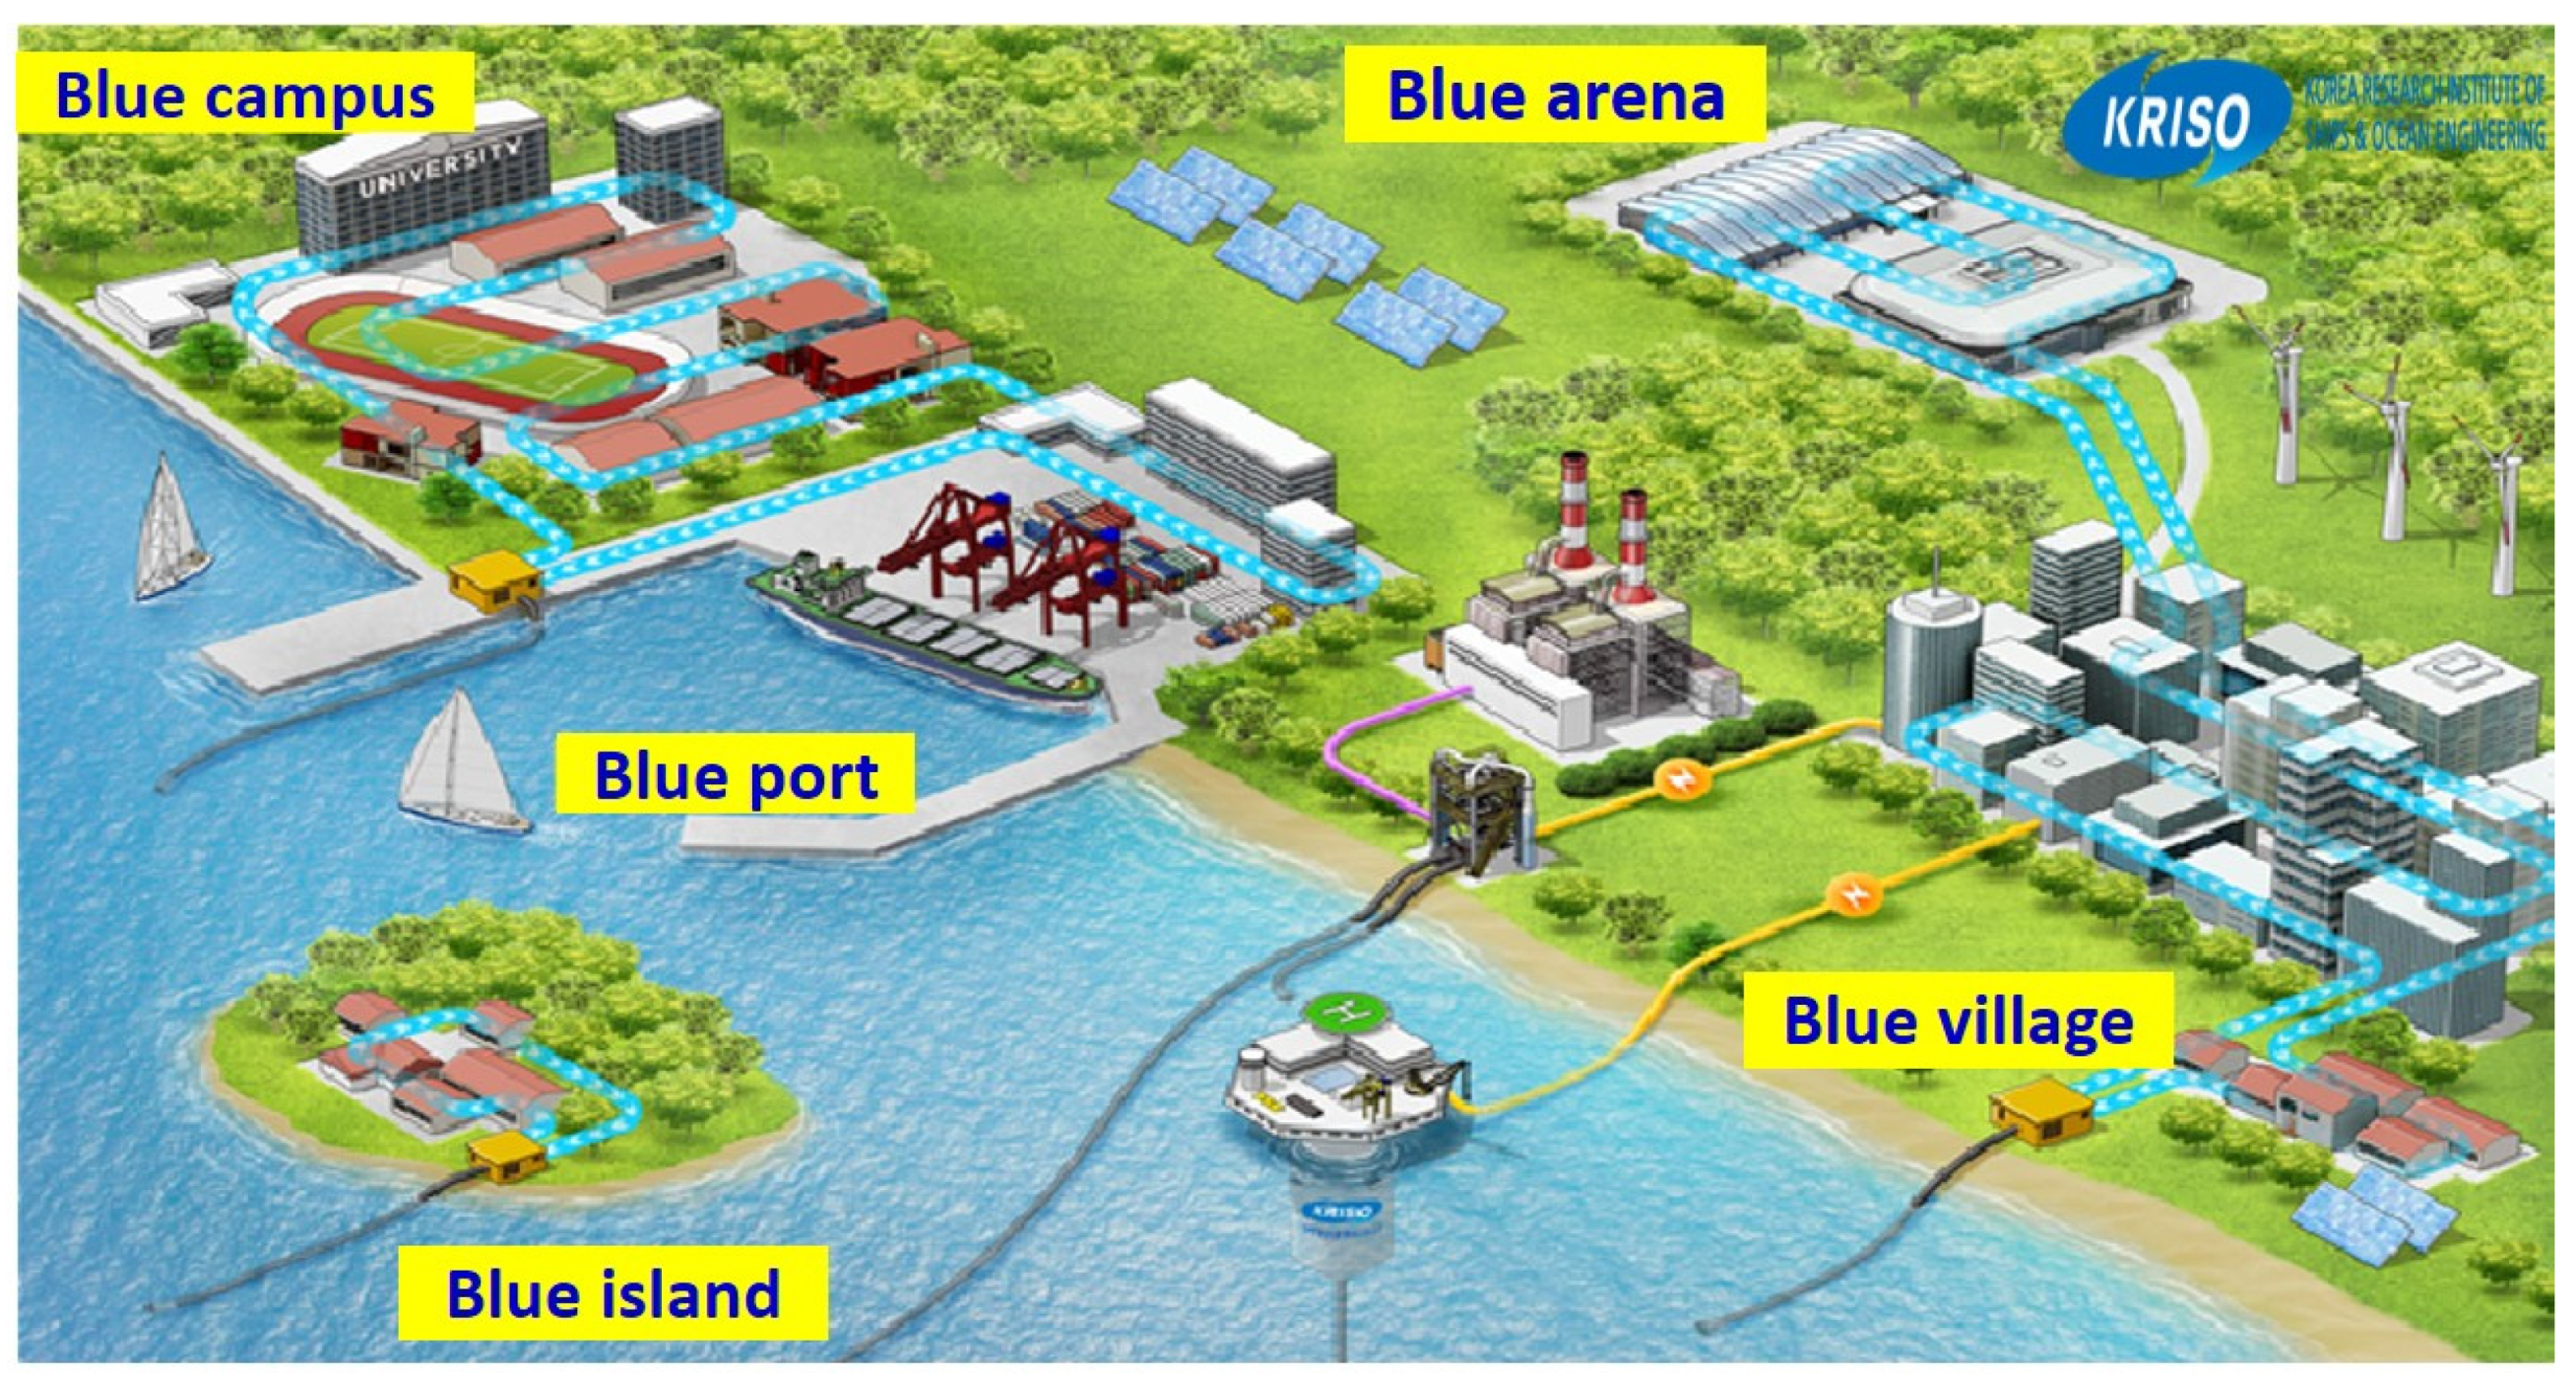
If seawater energy and onshore energy are combined, a range of eco-friendly blue-green infrastructures can be assembled encompassing industry, residences, recreational areas, on and off-shore. OTEC and offshore solar power generation, sea water air conditioning (SWAC) and freezing or refrigeration, seawater desalination and extraction of useful substances, aquaculture and plant factories, and land and sea forest development could be created in urban and rural areas alongside infrastructure such as ports and airports (blue ports), universities, and public institutions. Furthermore, features (
Figure 29) such as the Blue campus, sports, and cultural facilities (Blue arena) [
44], and energy-independent villages and islands, can be created alongside the OTEC and seawater utilization technologies.
8. Conclusions
The human race is facing an existential climate crisis. There is widespread agreement that greenhouse gases must be rapidly reduced to minimise the worst impacts of the climate crisis. Through COP21 and related agreements, over 120 countries have submitted long-term reduction plans (LIDS) for ‘carbon neutrality’ to the United Nations. The International Maritime Organization (IMO) is committed to reduce carbon emissions by 40% compared to 2008 figures for ships ordered after 2030, and by 50% by 2050 [
45]. Shipping emissions amounts to 2.5% (about 1 billion t per year) of total global emissions.
The development of renewable energy resources and the creation of carbon-absorbing ecosystems for residential and industrial activities in Pacific island countries is an area in which OTEC technologies can significantly contribute to a greener and more sustainable future for Pacific Island countries [
46]. Pacific island nations have provided miniscule amounts of global greenhouse gases, but are suffering more than most parts of the world from the negative impacts of the climate crisis. Existential threats include rising sea levels, changing rainfall distributions, increasing cyclone intensities and frequencies, and so forth. Energy and electricity costs for Pacific Island countries are amongst the highest in the world [
25]. Even though all Pacific Island countries are surrounded by abundant seawater and marine resources, they are suffering chronic deficiency of drinkable water and food materials [
2].
Future economic possibilities for Pacific countries include fishing, tourism, and seabed mining. OTEC provides a possibility for the further development of these industries using green energy, and greatly reducing carbon footprints [
47].
Tropical oceanic regions have the highest thermal differentials in the world between surface waters and waters at depths of 1000 m. Furthermore, the Pacific equatorial waters have the advantage of not being exposed to harsh external force environments such as typhoons and high waves. This situation makes OTEC technology particularly viable in this region.
SIDS have an urgent need for reliable green energy and they are excellent ‘testing grounds’ for the further development of OTEC technologies. It is probable that if the proof on concept for OTEC plants in SIDS is realized, there would be a natural progression to larger scale OTEC plants (100 MW to GWs), which would be required larger markets and bigger populations.
OTEC can also provide a range of ancillary industries and outputs including fresh water, a range of heating, cooling and refrigeration services, aquaculture and hydroponic agriculture, green hydrogen generation, seawater mineral production, and so on [
48].
Models are currently being created for a range of possible new modes of living combining OTEC technologies with on-land technologies producing a blue-green ecologically friendly environment to implement sustainable communities along the tropical belt.


