Article

Tracing δ18O and δ2H in Source Waters and Recharge Pathways of a Fractured-Basalt and Interbedded-Sediment Aquifer, Columbia River Flood Basalt Province

1
Department of Geography & Geological Sciences, University of Idaho, Moscow, ID 83844, USA
2
Department of Soil and Water Systems, University of Idaho, Moscow, ID 83844, USA
3
Department of Environmental Engineering, Washington State University, Pullman, WA 99164, USA
4
Department of Chemistry, University of Idaho, Moscow, ID 83844, USA
5
Department of Chemical and Biological Engineering, University of Idaho, Moscow, ID 83844, USA
6
College of Natural Resources, University of Idaho, Moscow, ID 83844, USA
*
Author to whom correspondence should be addressed.
Geosciences 2021, 11(10), 400; https://doi.org/10.3390/geosciences11100400
Submission received: 19 May 2021 / Revised: 21 August 2021 / Accepted: 7 September 2021 / Published: 23 September 2021
(This article belongs to the Collection Early Career Scientists’ (ECS) Contributions to Geosciences)

Abstract

:
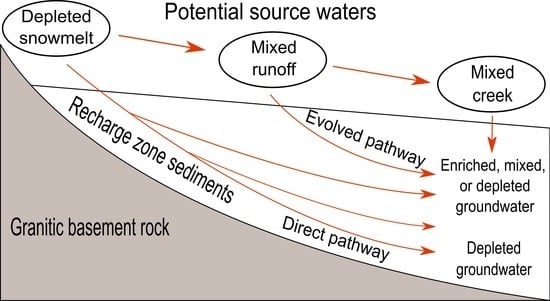
The heterogeneity and anisotropy of fractured-rock aquifers, such as those in the Columbia River Basalt Province, present challenges for determining groundwater recharge. The entrance of recharge to the fractured-basalt and interbedded-sediment aquifer in the Palouse region of north-central Idaho is not well understood because of successive basalt flows that act as restrictive barriers. It was hypothesized that a primary recharge zone exists along the basin’s eastern margin at a mountain-front interface where eroded sediments form a more conductive zone for recharge. Potential source waters and groundwater were analyzed for δ18O and δ2H to discriminate recharge sources and pathways. Snowpack values ranged from −22 to −12‰ for δ18O and from −160 to −90‰ for δ2H and produced spring-time snowmelt ranging from −16.5 to −12‰ for δ18O and from −120 to −90‰ for δ2H. With the transition of snowmelt to spring-time ephemeral creeks, the isotope values compressed to −16 and −14‰ for δ18O and −110 and −105‰ for δ2H. A greater range of values was present for a perennial creek (−18 to −13.5‰ for δ18O and −125 to −98‰ for δ2H) and groundwater (−17.5 to −13‰ for δ18O and −132 to −105‰ for δ2H), which reflect a mixing of seasonal signals and the varying influence of vapor sources and sublimation/evaporation. Inverse modeling and the evaluation of matrix characteristics indicate conductive pathways associated with paleochannels and deeper pathways along the mountain-front interface. Depleted isotope signals indicate quicker infiltration and recharge pathways that were separate from, or had limited mixing with, more evaporated water that infiltrated after greater time/travel at the surface.

Graphical Abstract

1. Introduction

Estimating groundwater recharge is complicated by variations in climate, vegetation, geology, and a limited ability to physically identify recharge pathways, particularly in fractured-rock aquifers [1,2]. Extrapolation of current groundwater use and declining groundwater levels in the South Fork Palouse River Basin (Basin) of north-central Idaho, United States of America (Figure 1), indicates the possibility of insufficient groundwater to meet future needs [3]. Similar declines in groundwater levels are occurring in aquifers across the Columbia Plateau Regional Aquifer System (CPRAS; [4,5]). The Basin’s groundwater is contained in a complex fractured-basalt and interbedded-sediment aquifer system that is common to the CPRAS, which is defined by the basalt flows of the Columbia River Flood Basalt Province. Within the Basin and around the region, recharge pathways have been difficult to identify, and groundwater dating has produced age ranges of modern (after 1950) to 10,000 s of years old [6,7,8]. Within the Basin, past efforts to physically identify recharge pathways and model flow within the aquifer system have yet to yield results that accurately encompass a hypothesized recharge zone along the mountain front and its connection to the upper and lower portions of the aquifer system [9,10,11,12,13]. A recent modeling effort [14] has attempted to resolve aquifer recharge along the eastern margin through incorporation of groundwater isotope values from Duckett et al. [15], but recharge to the aquifer system remains difficult to discriminate. Contributing to the difficulty in identifying recharge has been a willingness to prescribe depleted δ2H and δ18O values of groundwater to Pleistocene recharge in order to support old water ages [7,16,17].
Recent work in the Basin has led to a current recharge conceptual model of the infiltration and percolation of mountain-front snowmelt and runoff in the hypothesized recharge zone outside the extent of the basalt flows. Bush et al. [18,19,20] detailed the extent of the basalt flows and relation to sedimentary units atop the mountain-front interface. Duckett et al. [15] found depleted δ2H and δ18O values in the snowpack of the Basin’s Palouse Range (Figure 1) that resemble the hypothesized Pleistocene recharge. Additionally, Duckett et al. [21] identified a mantle gas source that influenced previous carbon-14 dating resulting in overestimation of groundwater ages in the Basin. These recent findings indicate available and isotopically-depleted source waters and more direct pathways into the aquifer system. Connecting source waters (e.g., snowpack) to groundwater can be difficult because of differences in timescales and nonlinear relations where isotopic signals of seasonal snowpacks are obscured because of multiple entrance points into the subsurface, movement through the vadose zone, and mixing in multiple flowpaths associated with heterogeneous and anisotropic aquifer systems [22,23]. Given the heterogeneity and anisotropic nature of the sedimentary formations composing the recharge zone [18] and past age dating of groundwater in the Basin [7,8,21], it is expected that recharge through the mountain-front sediments is an annual to multi-year process.
In colder climates, snow is an important hydrologic reservoir and source of groundwater recharge [24,25]. The stable isotopes of water (δ2H and δ18O) are primary tools for discriminating recharge sources and groundwater flowpaths [26,27], but tracing snowmelt recharge can be difficult because of the temporal effect on isotope values with sublimation/evaporation during accumulation (snowpack), melt, and infiltration [28,29]. The temporal influence can result in dynamic water stores that contribute potential recharge with a variable isotopic signal throughout the seasonal cycle of snowfall/snowpack/snowmelt [28,30]. Due to the isotopic lapse rate, mountain snow is typically depleted in the heavy isotopes (2H and 18O) compared to rainfall, which provides a basis for connecting the hydrologic reservoir of snow to surface water and groundwater systems [28,31]. Sublimation/evaporation during snowpack aging can increase the presence of heavier isotopes [32,33], but snowpacks typically provide a traceable, depleted signal compared to rainfall [31,34,35]. The goal of this study is the identification of the depleted isotope signal of the Basin’s snowpack and the presence of this depleted signal in the recharge zone, while discriminating more direct, or less evaporated, groundwater pathways along the mountain front. Recharge pathways may originate at different elevations and be fed by differently evolved source waters influenced by seasonal precipitation and evaporation/sublimation [36]. For this study, snowpack, snowmelt, rain, and ephemeral creek samples were collected for comparison of their isotope signal to previously determined groundwater and creekwater δ2H and δ18O values in the recharge zone. This comparison was performed to connect the system’s primary source water (snow) to the recharge zone and evaluate differences in potential groundwater pathways through an unmixing of perceived depleted and enriched source waters entering the aquifer system.
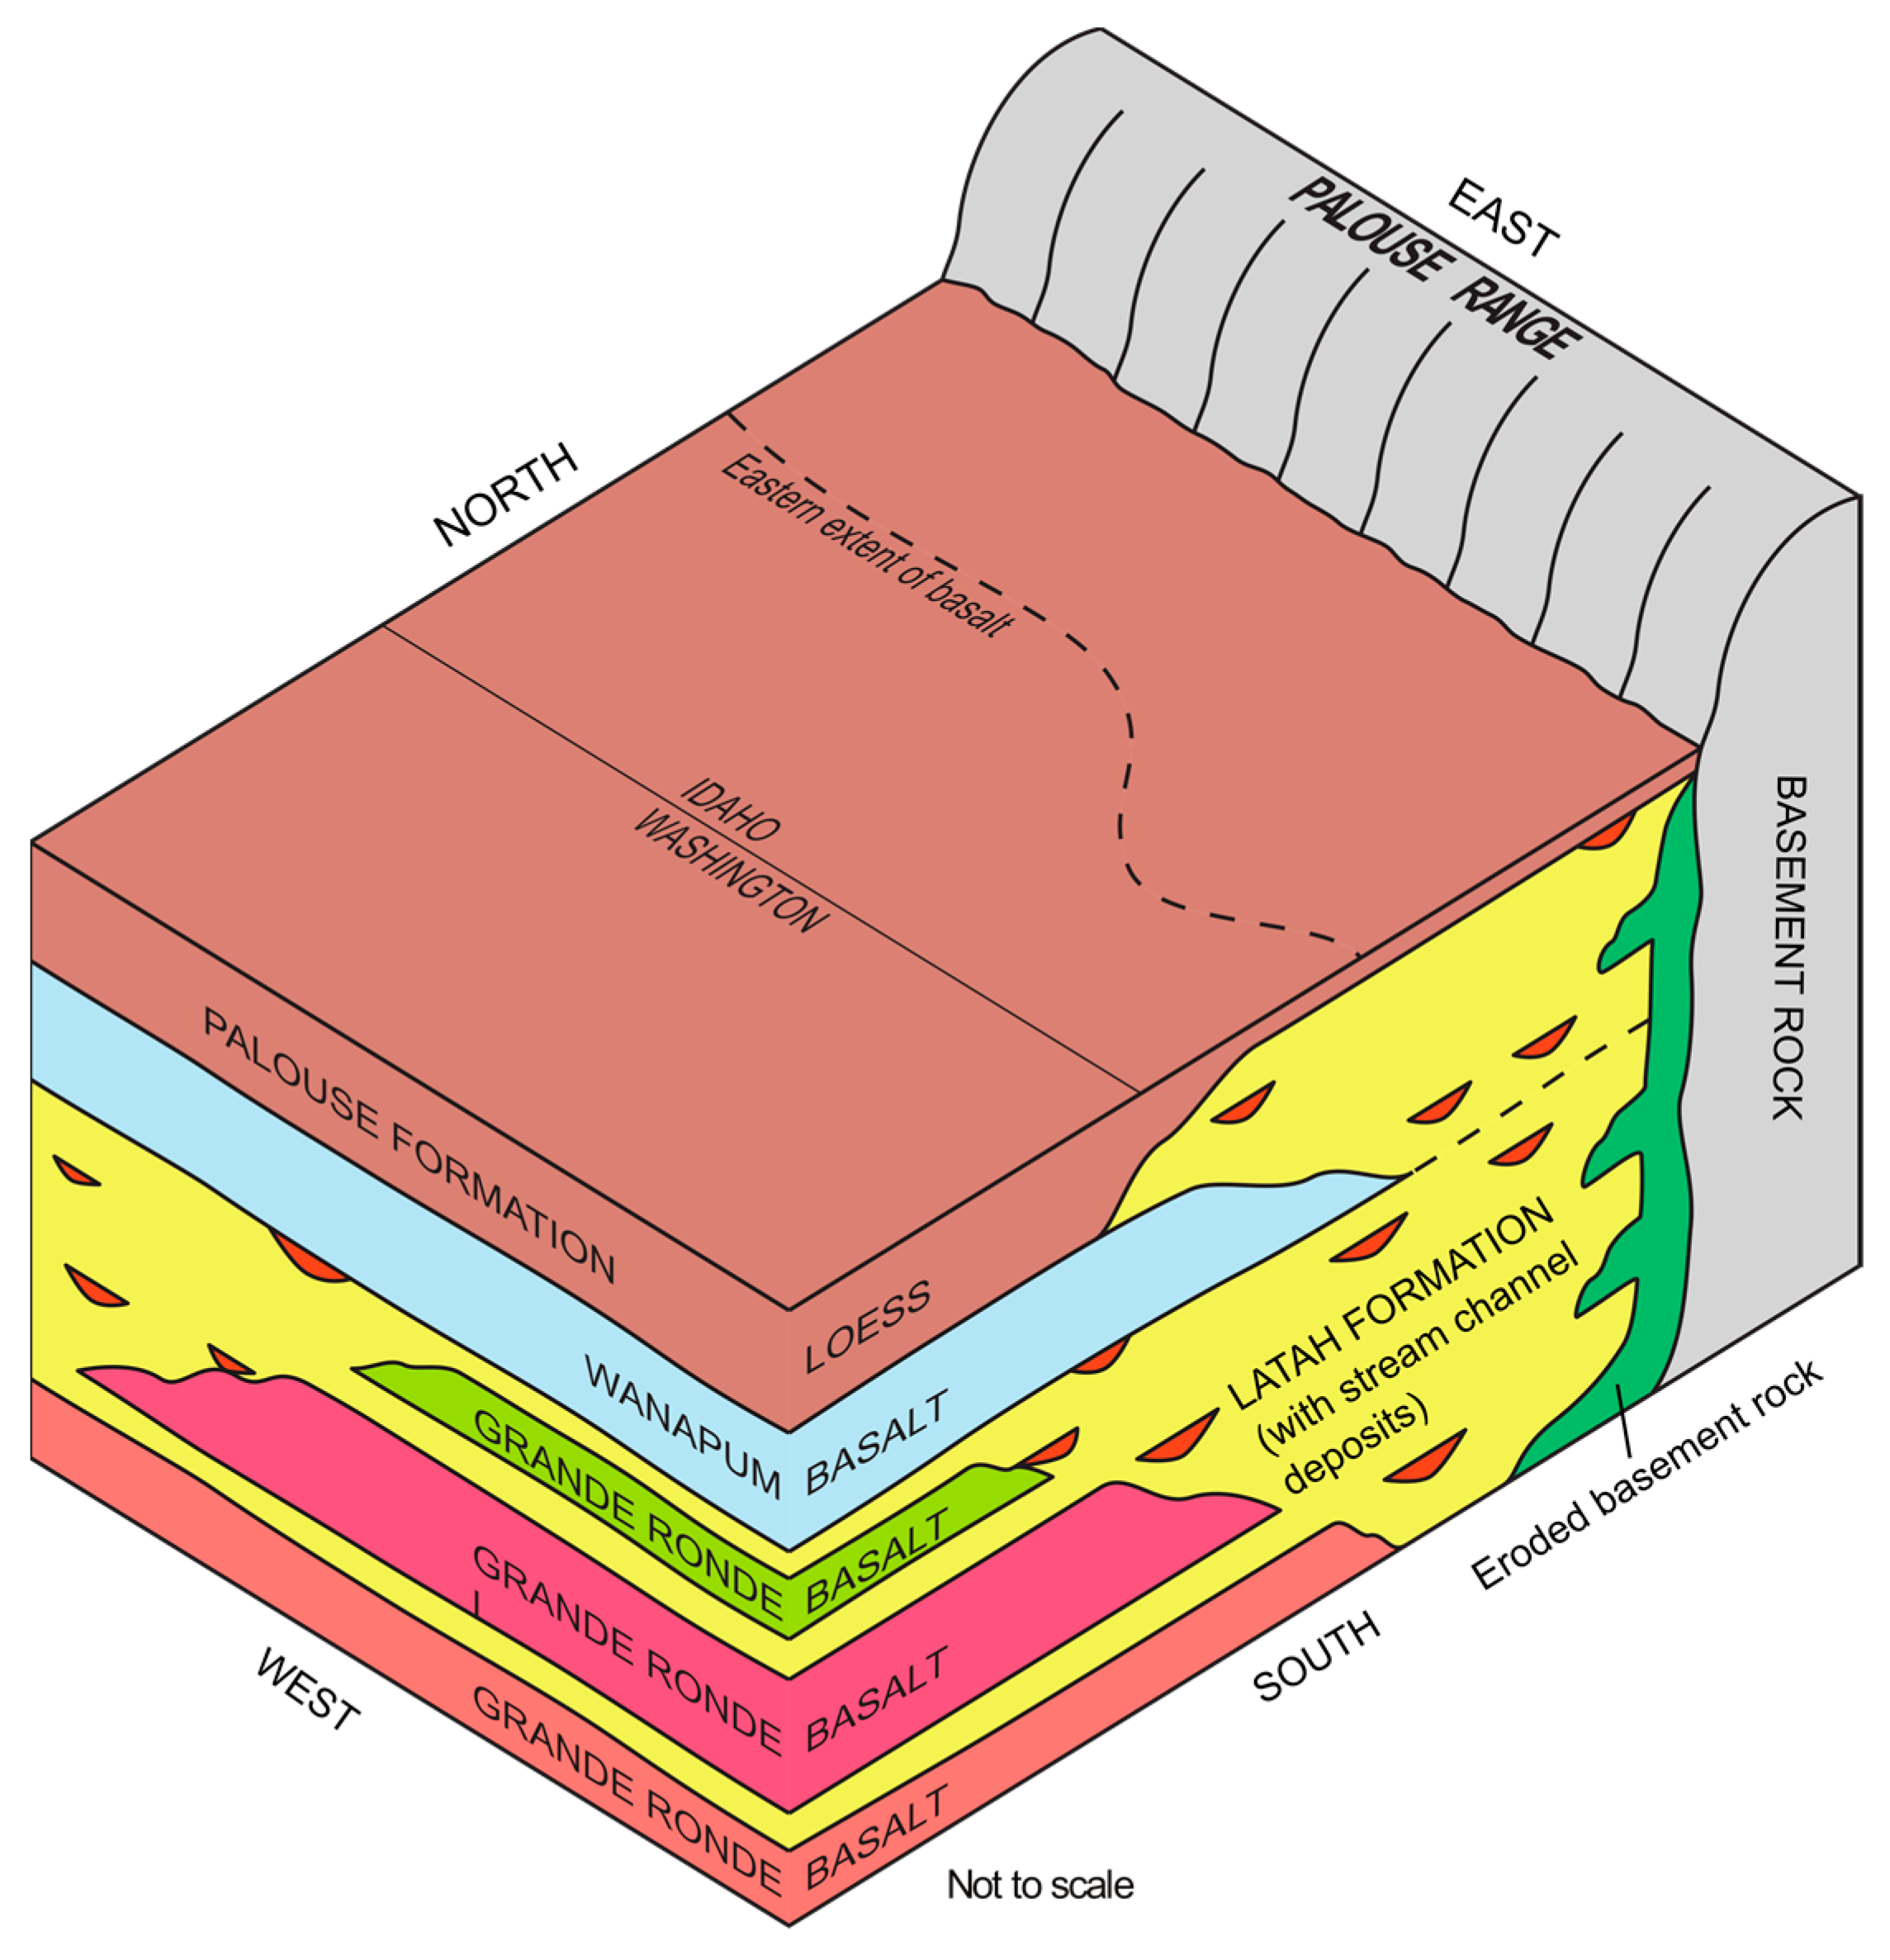
Within this northerly region (~47° N, Csb of Köppen-Geiger climate classification), Basin aquifers are contained in the fractured basalts of the Wanapum and Grande Ronde formations of the Columbia River Basalt Group (CRBG) and interbedded sediments of the Latah Formation (Figure 2) [18,20,37]. The combination of variable permeability, fracture termination, and discontinuity of basalt flows and interbedded sediments produces heterogeneous and anisotropic aquifer matrices that are present in the Basin and throughout the CPRAS where model applications have shown poor replication and prediction of recharge [3,38,39,40,41]. Previous studies have suggested that groundwater recharge is entering the Basin aquifers through pathways in sediments along the eastern margin that likely comprise a primary recharge zone at the mountain front [6,9,15,21,42,43]. This recharge zone contains alluvial/colluvial fans and paleochannels composed of very fine- to coarse-grained material (Latah Formation) along the southwestern flank of the Palouse Range that bounds the eastern margin of the Basin (Figure 3). Very fine- to fine-grained sediments are present in portions of the sedimentary deposits because of low energy environments (e.g., marsh or wetland) that formed with temporary blocking of mountain creeks by each Miocene basalt flow [18,20]. The sediments of the recharge zone are overlain by argillic soils and loess of the Palouse Formation (Figure 3) that can be restrictive to infiltration [44]. The heterogeneity of the sedimentary deposits and differences in the groundwater δ2H and δ18O values downgradient of the recharge zone led to a hypothesis of faster (higher elevation and/or quicker infiltration) and slower (lower elevation and/or more time at the surface) pathways into and through the recharge zone [15].
Bush et al. [18,20,37,45] discriminated Latah Formation units and potential bedrock depths at the mountain-front interface (Figure 2 and Figure 3). This geologic interpretation provides the framework for connecting isotopic signals of snow/snowmelt from the mountain range that can infiltrate at the mountain front and enter the aquifer system, particularly the deeper groundwater system. Groundwater isotope values across this likely recharge zone (wells ranging in elevation from 800 to 950 m NAVD88) were previously discriminated [44,46,47,48] for inclusion in a Basin soil moisture routing model. This model identified likely recharge areas that correlated to less restrictive soil zones because of erosion, more permeable soils along creek channels, and thin soils at higher elevations. Water isotope values for recharge zone groundwater and surface waters described by Moravec et al. [49] and Candel et al. [46] did not align with more depleted water isotope signals found by Duckett et al. [15] in deeper groundwater towards the middle of the Basin. Therefore, this study was conducted to identify the isotope values of source waters (e.g., snow) along the Palouse Range and correlate these source water signals to isotope values previously determined for a lower elevation creek and recharge zone groundwater [46,50]. This correlation allows for evaluation of the evolution of source water signals with greater time at the surface (e.g., lower elevation recharge) or quicker infiltration and percolation to groundwater that is a more direct pathway to the aquifer system (e.g., higher elevation recharge).
Figure 2. West-to-east cross section of the eastern South Fork Palouse River Basin that includes Pullman, Washington, and Moscow, Idaho (modified from Bush et al., 2018 [45]). Transect A–A’ is shown in Figure 1. CRBGs indicates the Columbia River Basalt Group formations.
Geosciences 11 00400 g002
Figure 3. Theorized mountain-front interface of the Palouse Range and sedimentary units of the Latah Formation (modified from Bush et al., 2018 [45]).
Geosciences 11 00400 g003

2. Study Area Climate, Hydrology, and Potential Recharge

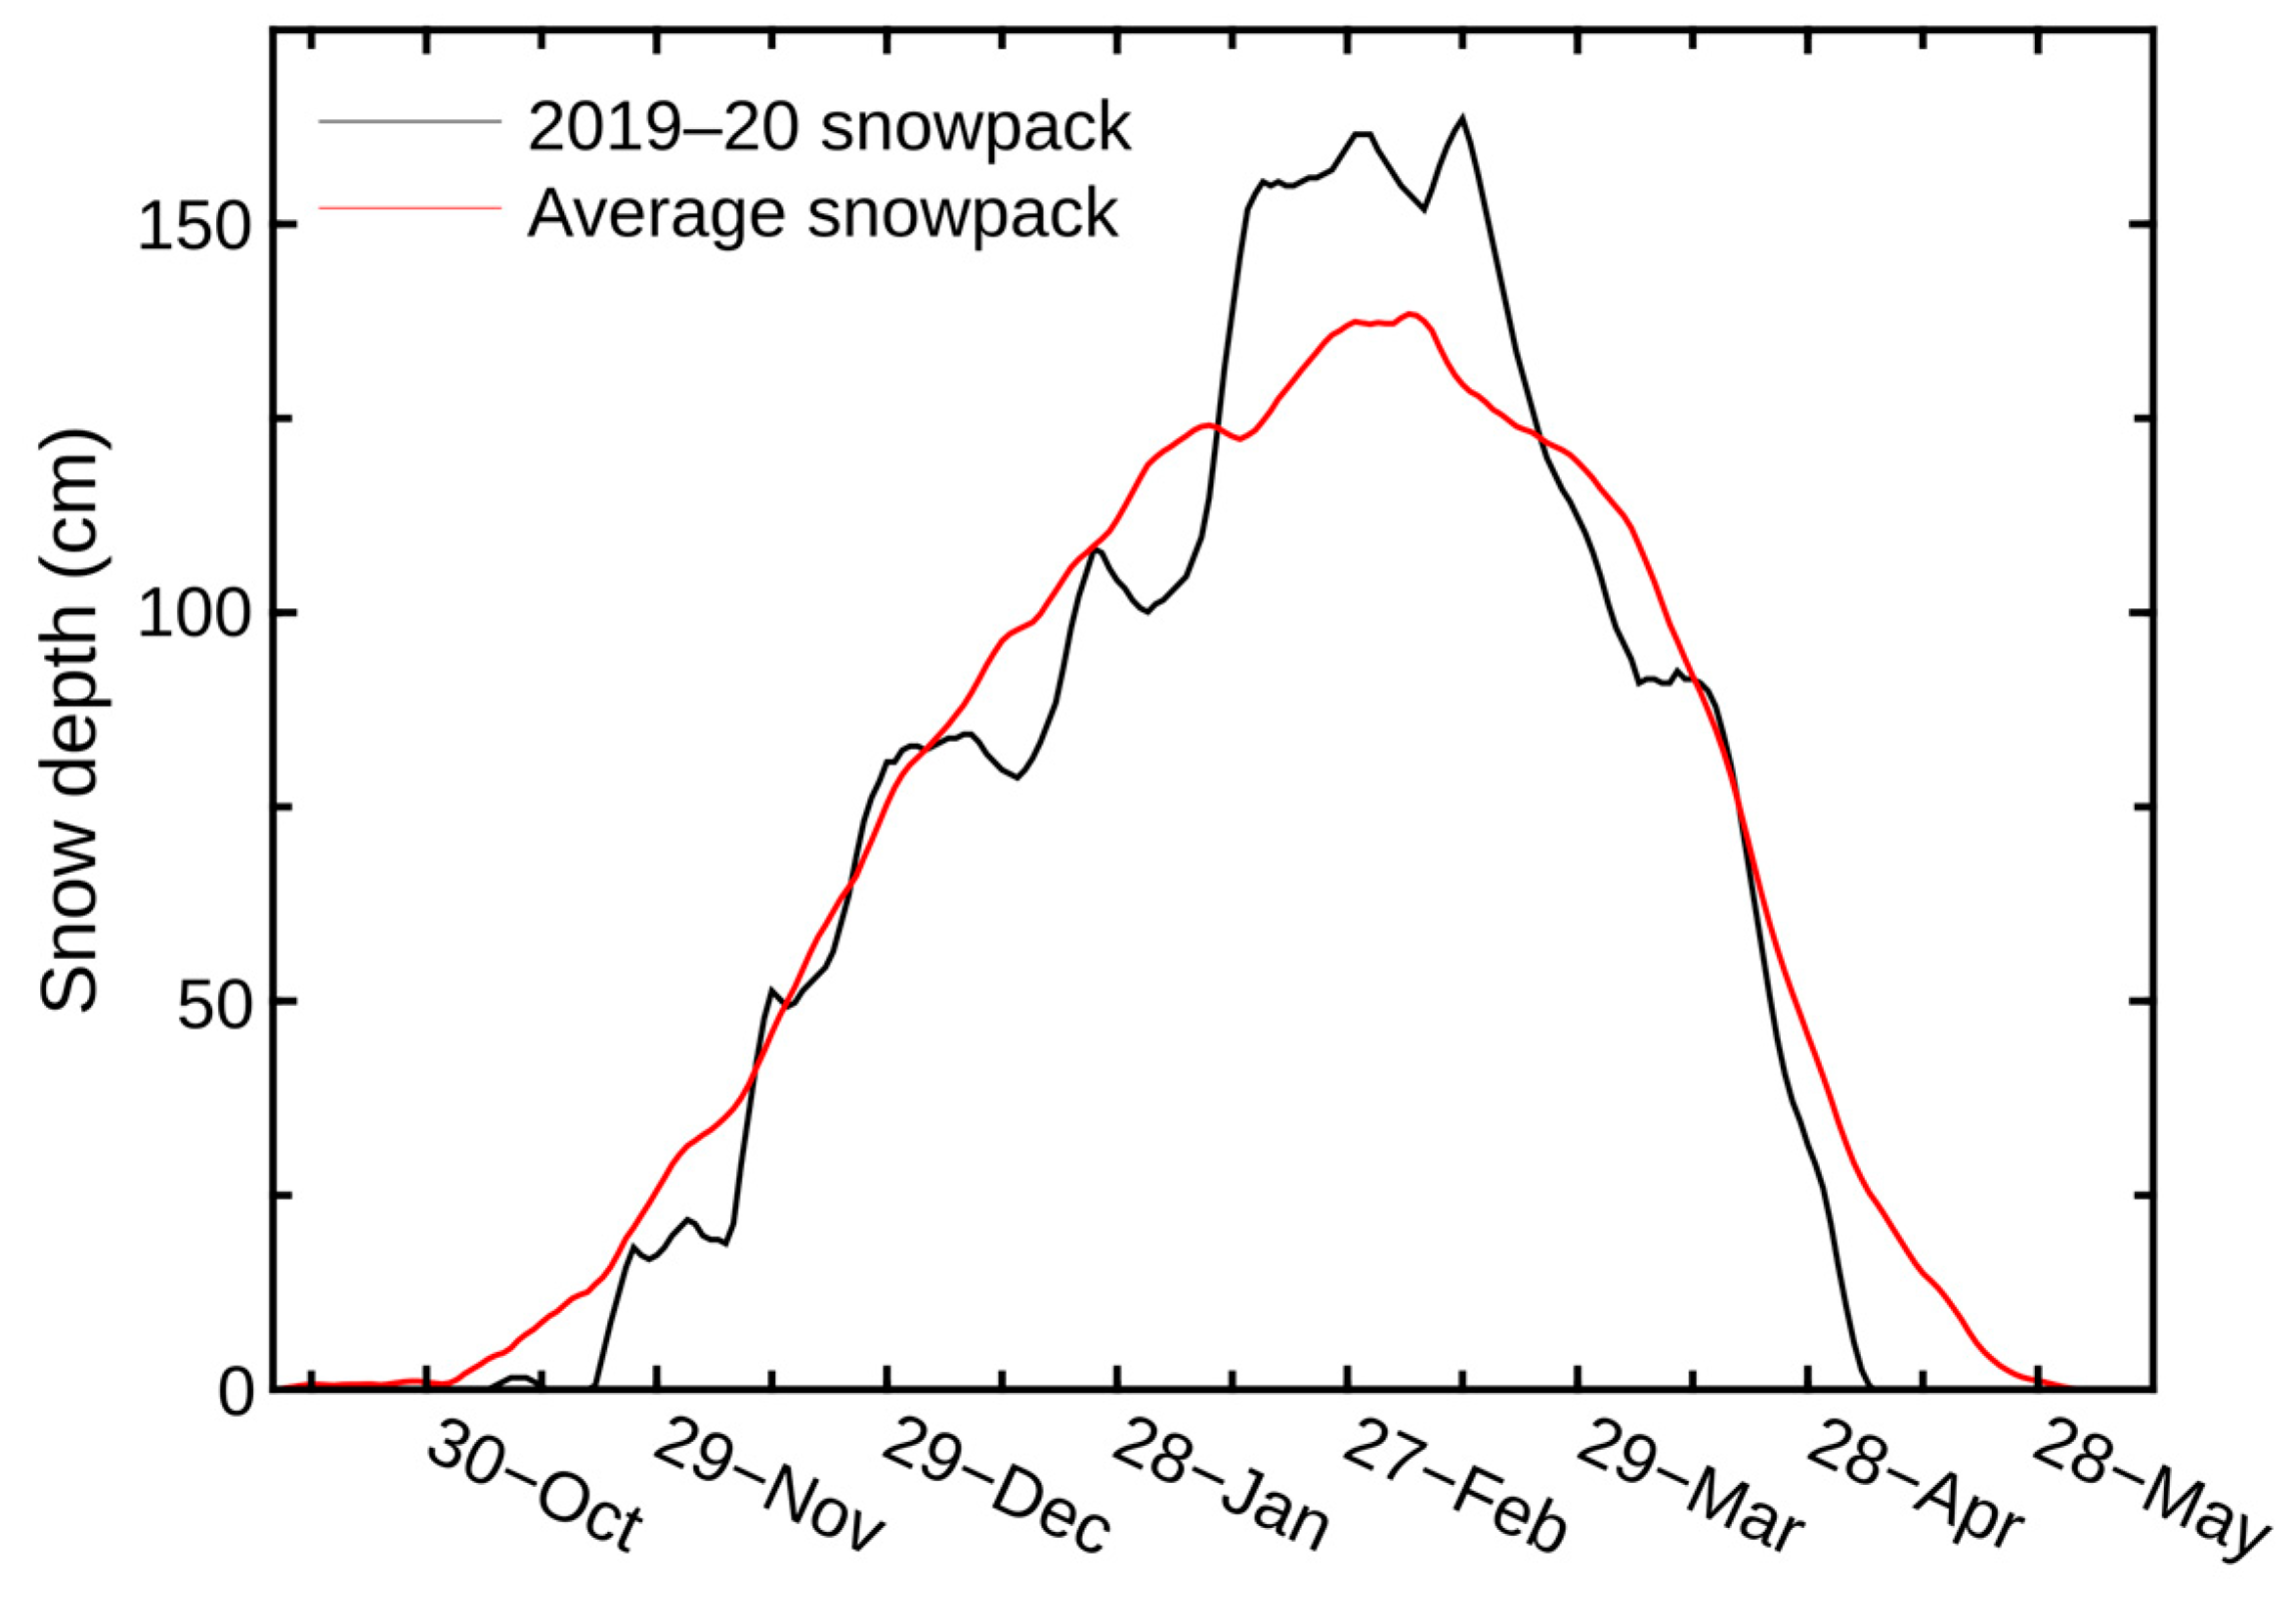
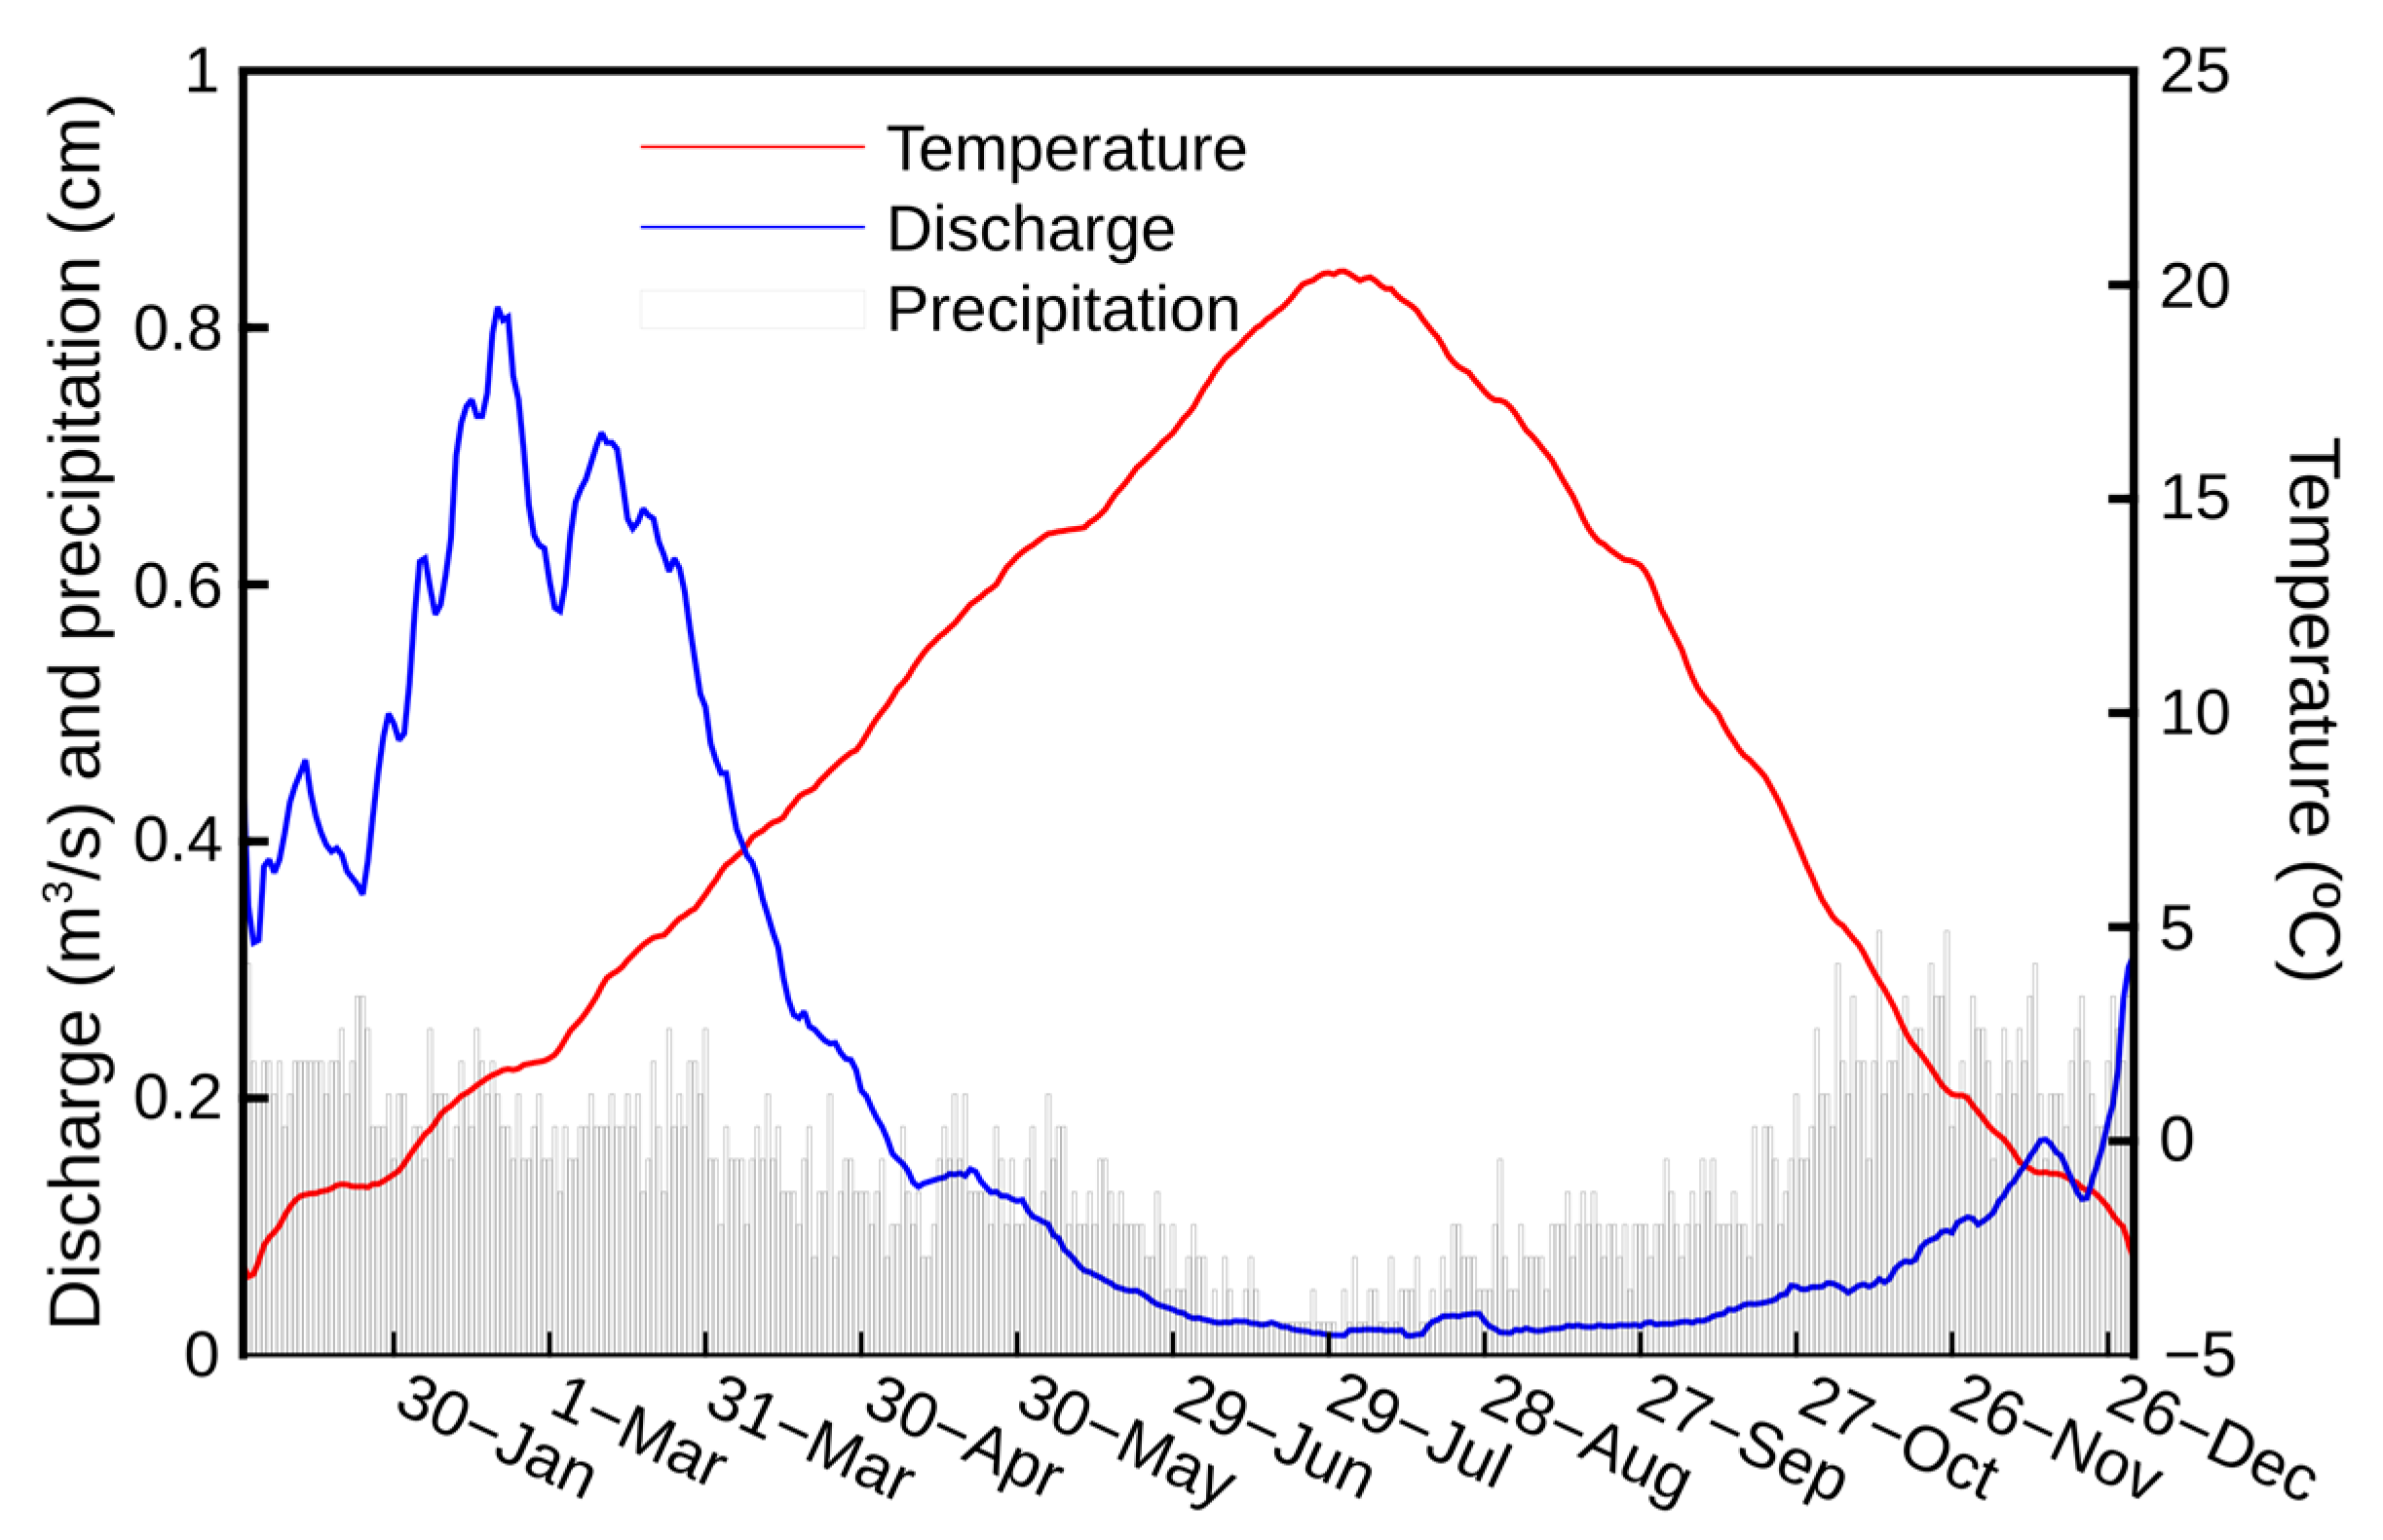
North-central Idaho experiences a winter maritime climate and a summer continental climate driven by the proximity to the Pacific Ocean and northern Rocky Mountains, respectively [51]. Annually, the Basin (Moscow) receives approximately 60 cm of precipitation (water equivalent), including 126 cm of snowfall [52]. The snowfall increases with elevation, and the Palouse Range typically accumulates a peak snowpack equal to 50 cm of water at its highest elevations [53]. This climate regime allows for a mountain snowpack to develop in late fall and be sustained until late spring (Figure 4). Largest streamflows occur in winter/spring (Figure 5), and upper watershed creek flow typically is limited to the duration of winter storms and the decline of the snowpack from March through May (Figure 4).
Precipitation isotope values will vary according to the water vapor source and elevation differences [54,55,56,57]. Snowmelt isotope values will depend on initial snow values, evolution with snowpack aging (sublimation/evaporation), and the amount of time spent at the surface after melting when additional evaporation can occur [28]. Bowen [58,59] estimated precipitation δ18O and δ2H values across North America and indicated potential north-central Idaho January values of −22 to −13‰ and −169 to −133‰ and possible July values of −14 to −8‰ and −103 to −78‰, respectively. This isotope signal variation is a result of vapor source differences attributed to shifts in the northern Pacific jet stream (extension of the East Asian subtropical jet) that influences precipitation patterns in the region [60,61]. The vapor source shift produces not only greater precipitation in the winter-spring period but produces a relatively depleted isotope signal for winter precipitation compared to the enriched values for late spring, summer, or early fall rainfall [62]. Similarly, d-excess values will decrease from larger values associated with winter conditions to the warmer and more humid conditions in spring [63].
Due to twice the precipitation amount and less restrictive soils, Candel et al. [46] and Dijksma et al. [44] indicated that substantial groundwater recharge likely occurs at higher elevations in the Basin. Additionally, Candel et al. [46] indicated a lack of recharge where thick argillic soils are present and the possibility of lateral subsurface flow because of the restrictive soils/sediments of the Palouse Formation that would contribute groundwater to downgradient creeks. Well log information from Bush and Dunlap [18] was available to interpret sedimentary and fractured-granite layers in the recharge zone to connect Candel et al.’s [46] and Dijksma et al.’s [44] prediction of primarily mountain-front recharge. This geologic information allows for interpretation of possible paleochannels (assumed fast or more direct pathways of recharge and flow into the multi-aquifer system) not aligned with the current stream network and relatively higher hydraulic conductivity zones based on sediment/rock type, such as the weathered/fractured granite along the mountain-front interface.

3. Design, Materials, and Methods

This study was designed to collect snowpack, snowmelt, ephemeral creek water, and late spring precipitation from the upper portion (snow band) of the Palouse Range during the 2019–2020 winter-spring period. Isotope values of samples collected from the Palouse Range were compared with existing isotope values for samples collected from a downgradient creek (Crumarine Creek) and groundwater from a lower elevation portion of the recharge zone. The isotope values and associated changes in source-water mixing were compared to the changes in geology to evaluate a possible correlation of greater permeability (e.g., greater sand fraction or likely paleochannel) at each well location to more depleted δ18O values indicative of more direct recharge pathways from the Palouse Range snowpack (isotope values evaluated as part of this study are available as a supplementary file associated with this article).

3.1. Snowpack, Snowmelt, Rain Isotopes

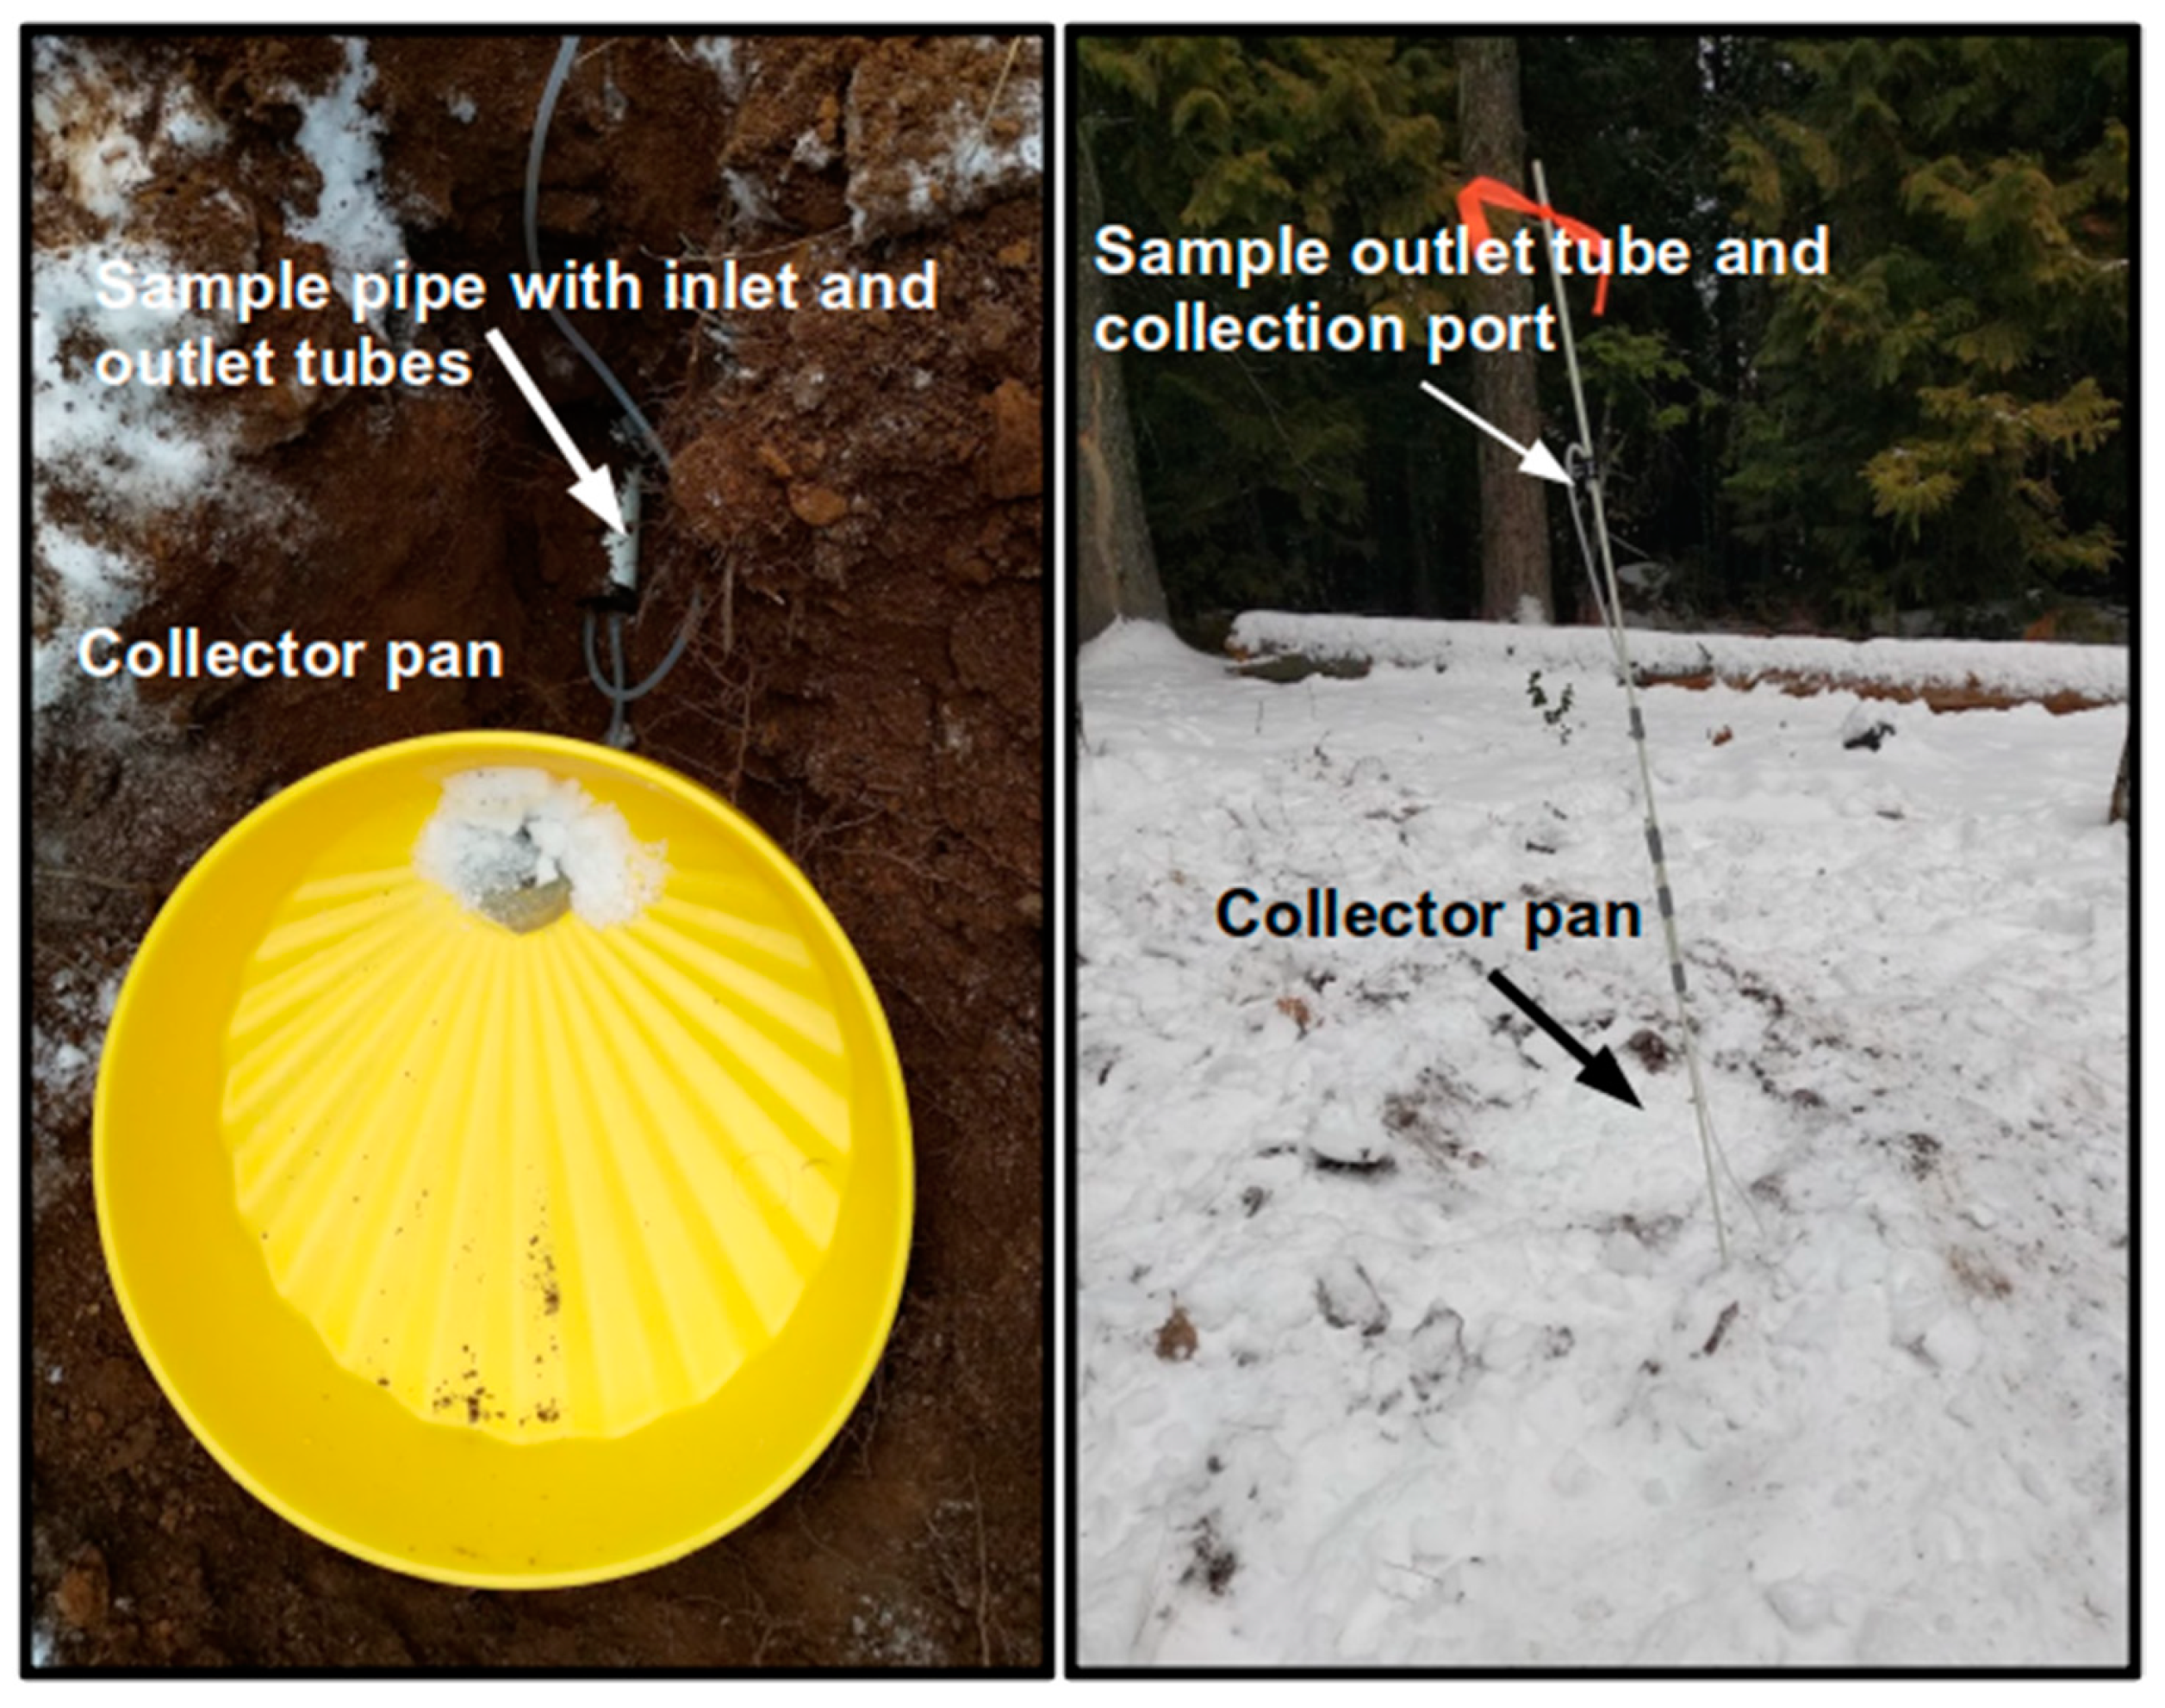
Three sites were chosen for sampling the snowpack and snowmelt of the Palouse Range (Figure 1 and Figure 6). Each site is similar in its open field qualities (example shown in Figure 7) where snow can accumulate with minimal effect from the surrounding forest. Site #1 is a Natural Resources Conservation Service snow telemetry site at an elevation of 1430 m NAVD88. A second site was established at 1300 m (Site #2), and a third site at 1190 m (Site #3). These three sites represent the primary snow band from late November through April. At each site, an approximate 15-m transect was established for interval trenching and collection of snow during each sampling period. A snowmelt collector was installed adjacent to each snowpack transect (Figure 7). Each snowmelt collector consisted of a 30-cm diameter funnel pan with a 1-mm grated cover over a 2.5-cm drain that was stoppered and connected to a buried and stoppered, 5-cm diameter PVC pipe (15 cm in length). Each pan was connected to one opening of the stopper through a rubber nipple and a 0.6-cm Teflon tube to allow drainage into the buried pipe for sample storage. A second opening in the stopper contained a bottom-reaching HDPE tube connected to a 0.6-cm Teflon tube (sample tube) that was run to height of 1.7 m on a snowpole marking the location of the collector (Figure 7). The snowpole tube was crimped to minimize atmospheric influence between sampling periods but allowed for collection of snowmelt through the draw of a 50-mm syringe. The collection pipe was buried at a 45° angle about 0.6 m below the surface. The pan was placed near the buried pipe at a depth of 0.25 m, allowing the lip of the pan to extend above ground surface. During the study period, available snow and snowmelt samples were collected once a month from December through February, every two weeks starting in March, and weekly starting in April (sample weighting towards spring-time conditions). The low to high collection sites were last sampled for snow and snowmelt on 24 April (Site #3, 7 sample collections), 8 May (#2, 9 sample collections), and 29 May (#1, 14 sample collections), respectively. Following the loss of the snowpack, the snowmelt collectors (0–6 sample collections per site (no collection from #2 because of collector failure)) were used to collect rainfall (6–9 sample collections per site, #2 collector fixed following loss of snowpack) until the end of the sampling on 29 May.
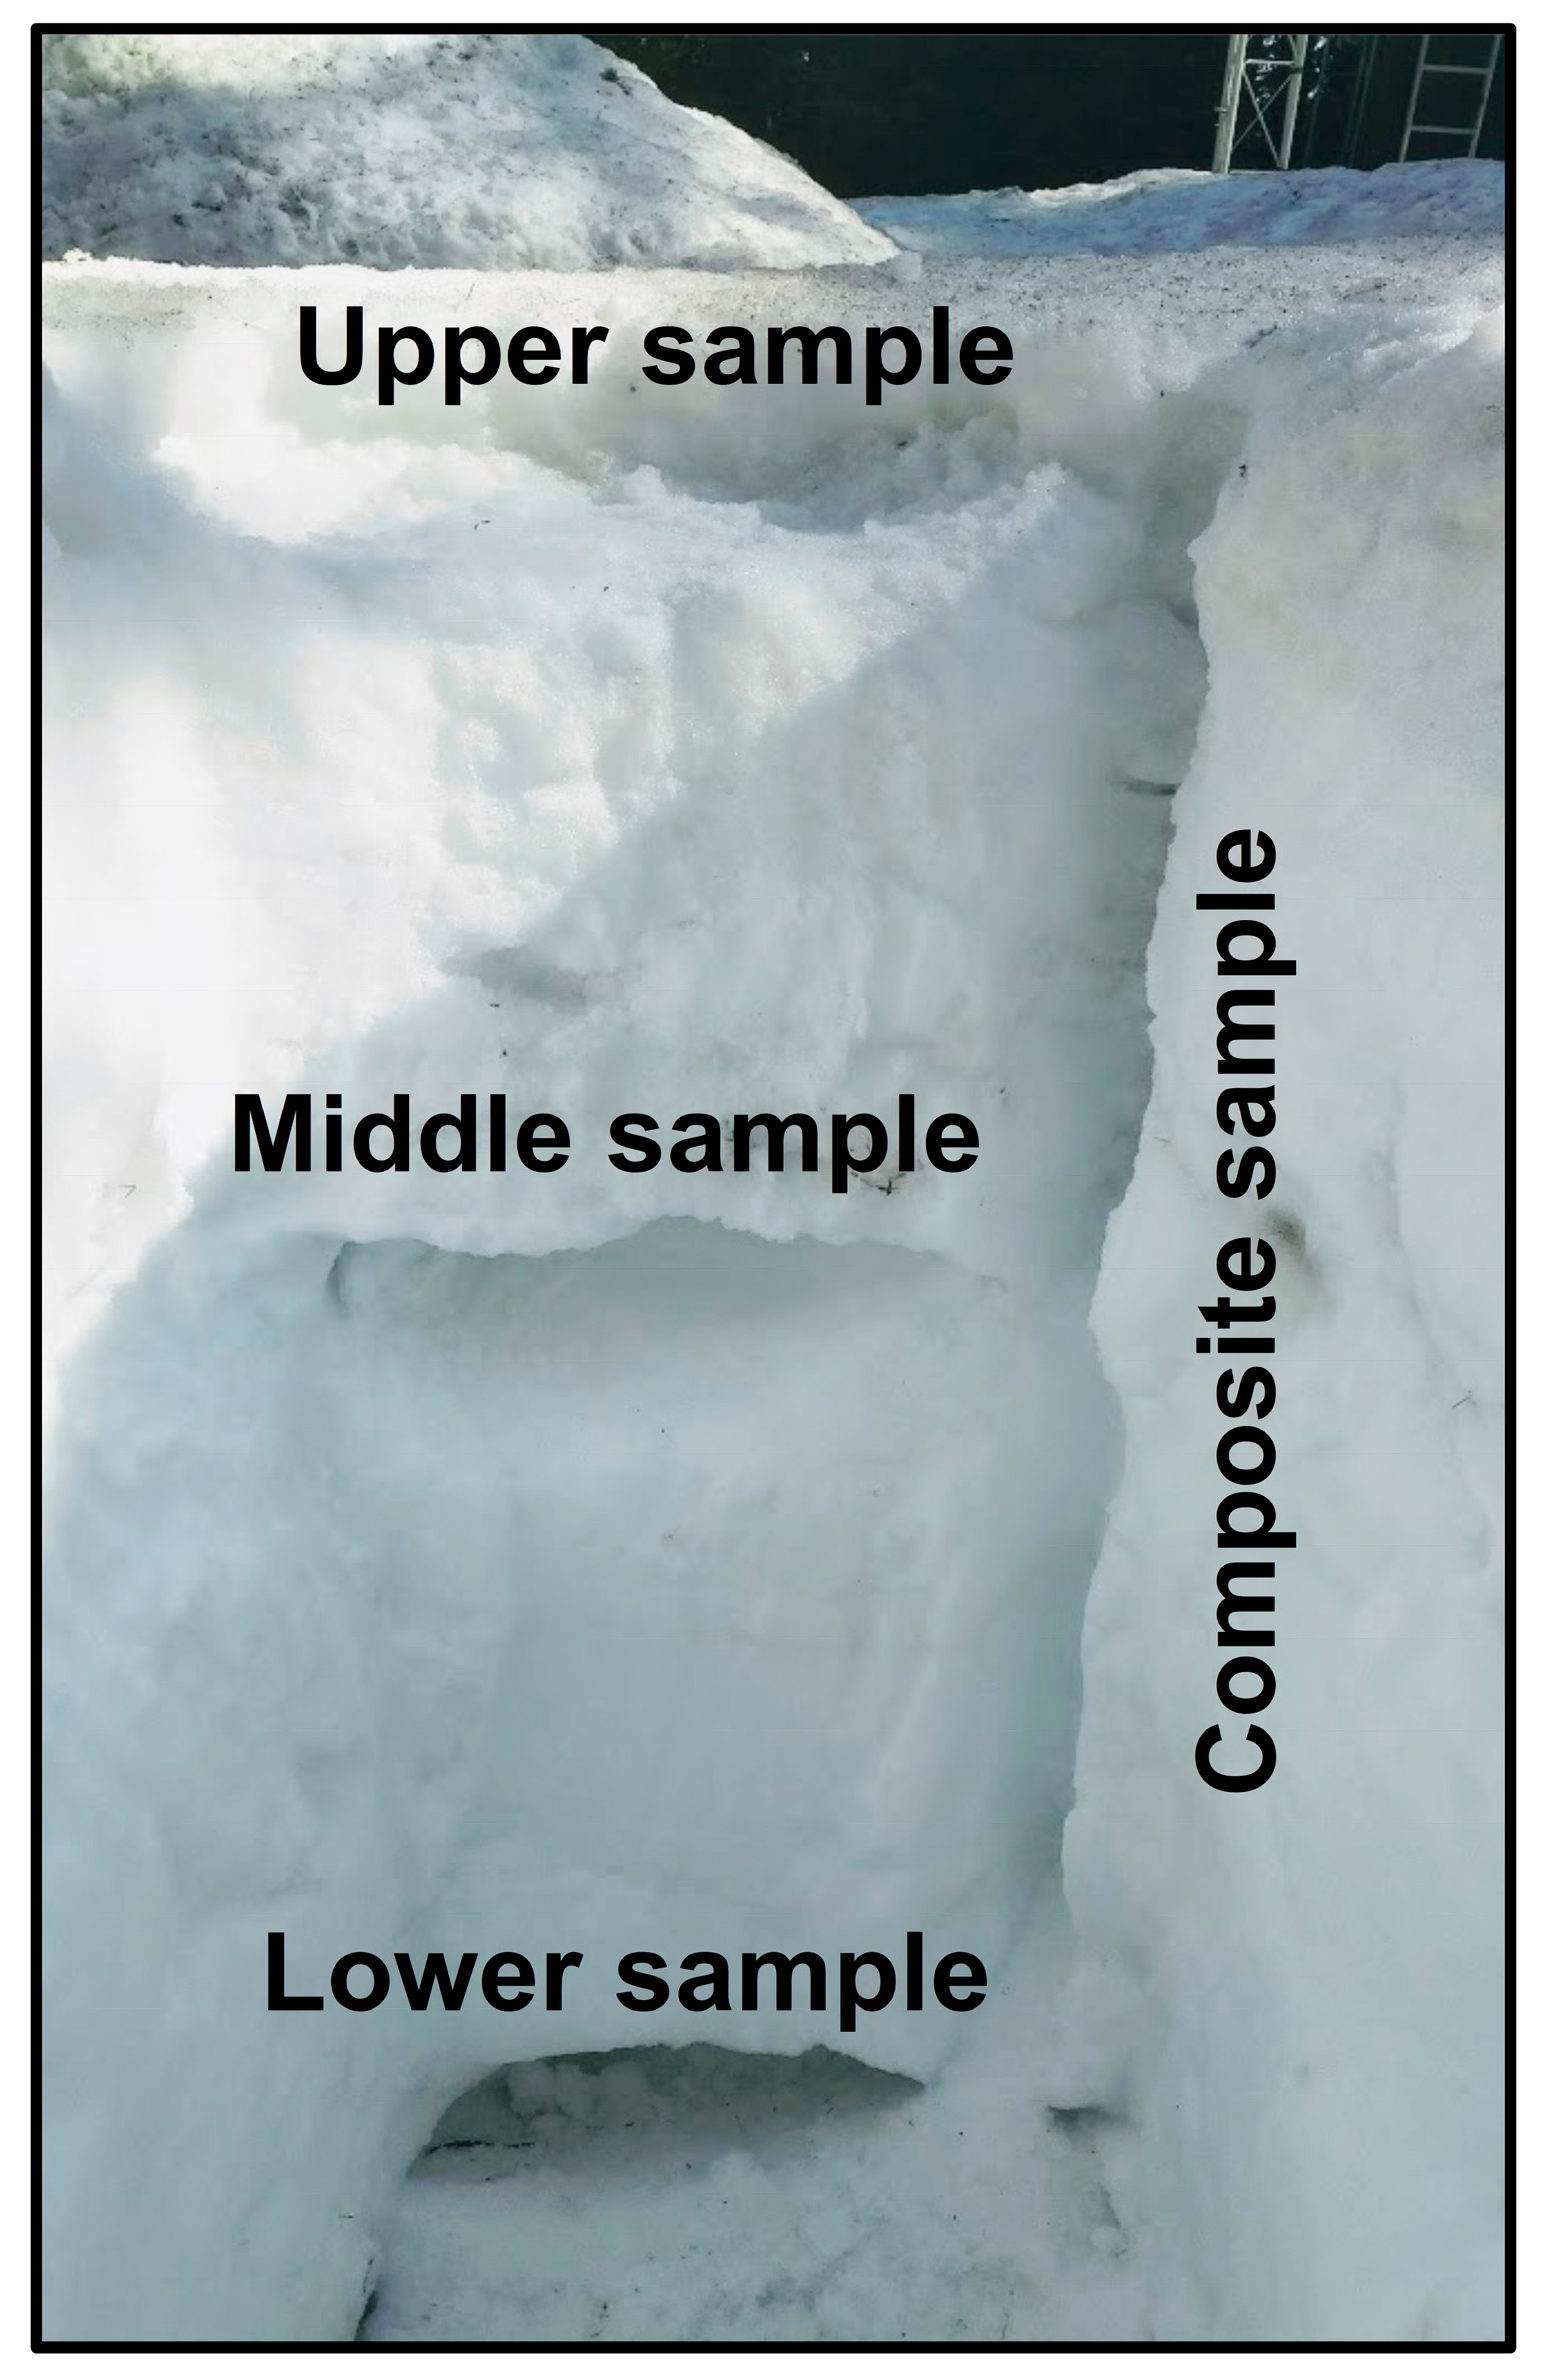
During snow sampling, a 0.5-m wide, vertical trench was cut into the snowpack to open a profile from the top of the snowpack to the ground surface, which allowed for a collection of snow from upper, middle, and lower layers along with a composite sample (Figure 8), similar to the snow sampling performed by Duckett et al. [15] at Site #1 in March 2018. For each new sampling period, an adjacent location (1-m spacing) in the transect was selected for trenching and sampling. Snow samples were vacuum sealed in 1-L vacuum bags. Upon returning to the laboratory, vacuum-sealed samples were melted in an oven and syringe filtered (1 μm) into 60-mL glass containers (no head space) that were sealed with polyseal caps. Snowmelt drawn from a collector were syringe filtered (1 μm) into 60-mL glass containers (no head space) and sealed with polyseal caps. All snow and snowmelt samples were analyzed for δ2H and δ18O with a Los Gatos Research Liquid Water Isotope Analyzer at Washington State University (instrument precision was ±0.25‰ for δ2H and ±0.05‰ for δ18O). A duplicate sample was collected during each sampling trip. The laboratory performed replicate analyses for each sample and four calibration standards were analyzed repeatedly during the analysis period.

3.2. Creek Isotopes

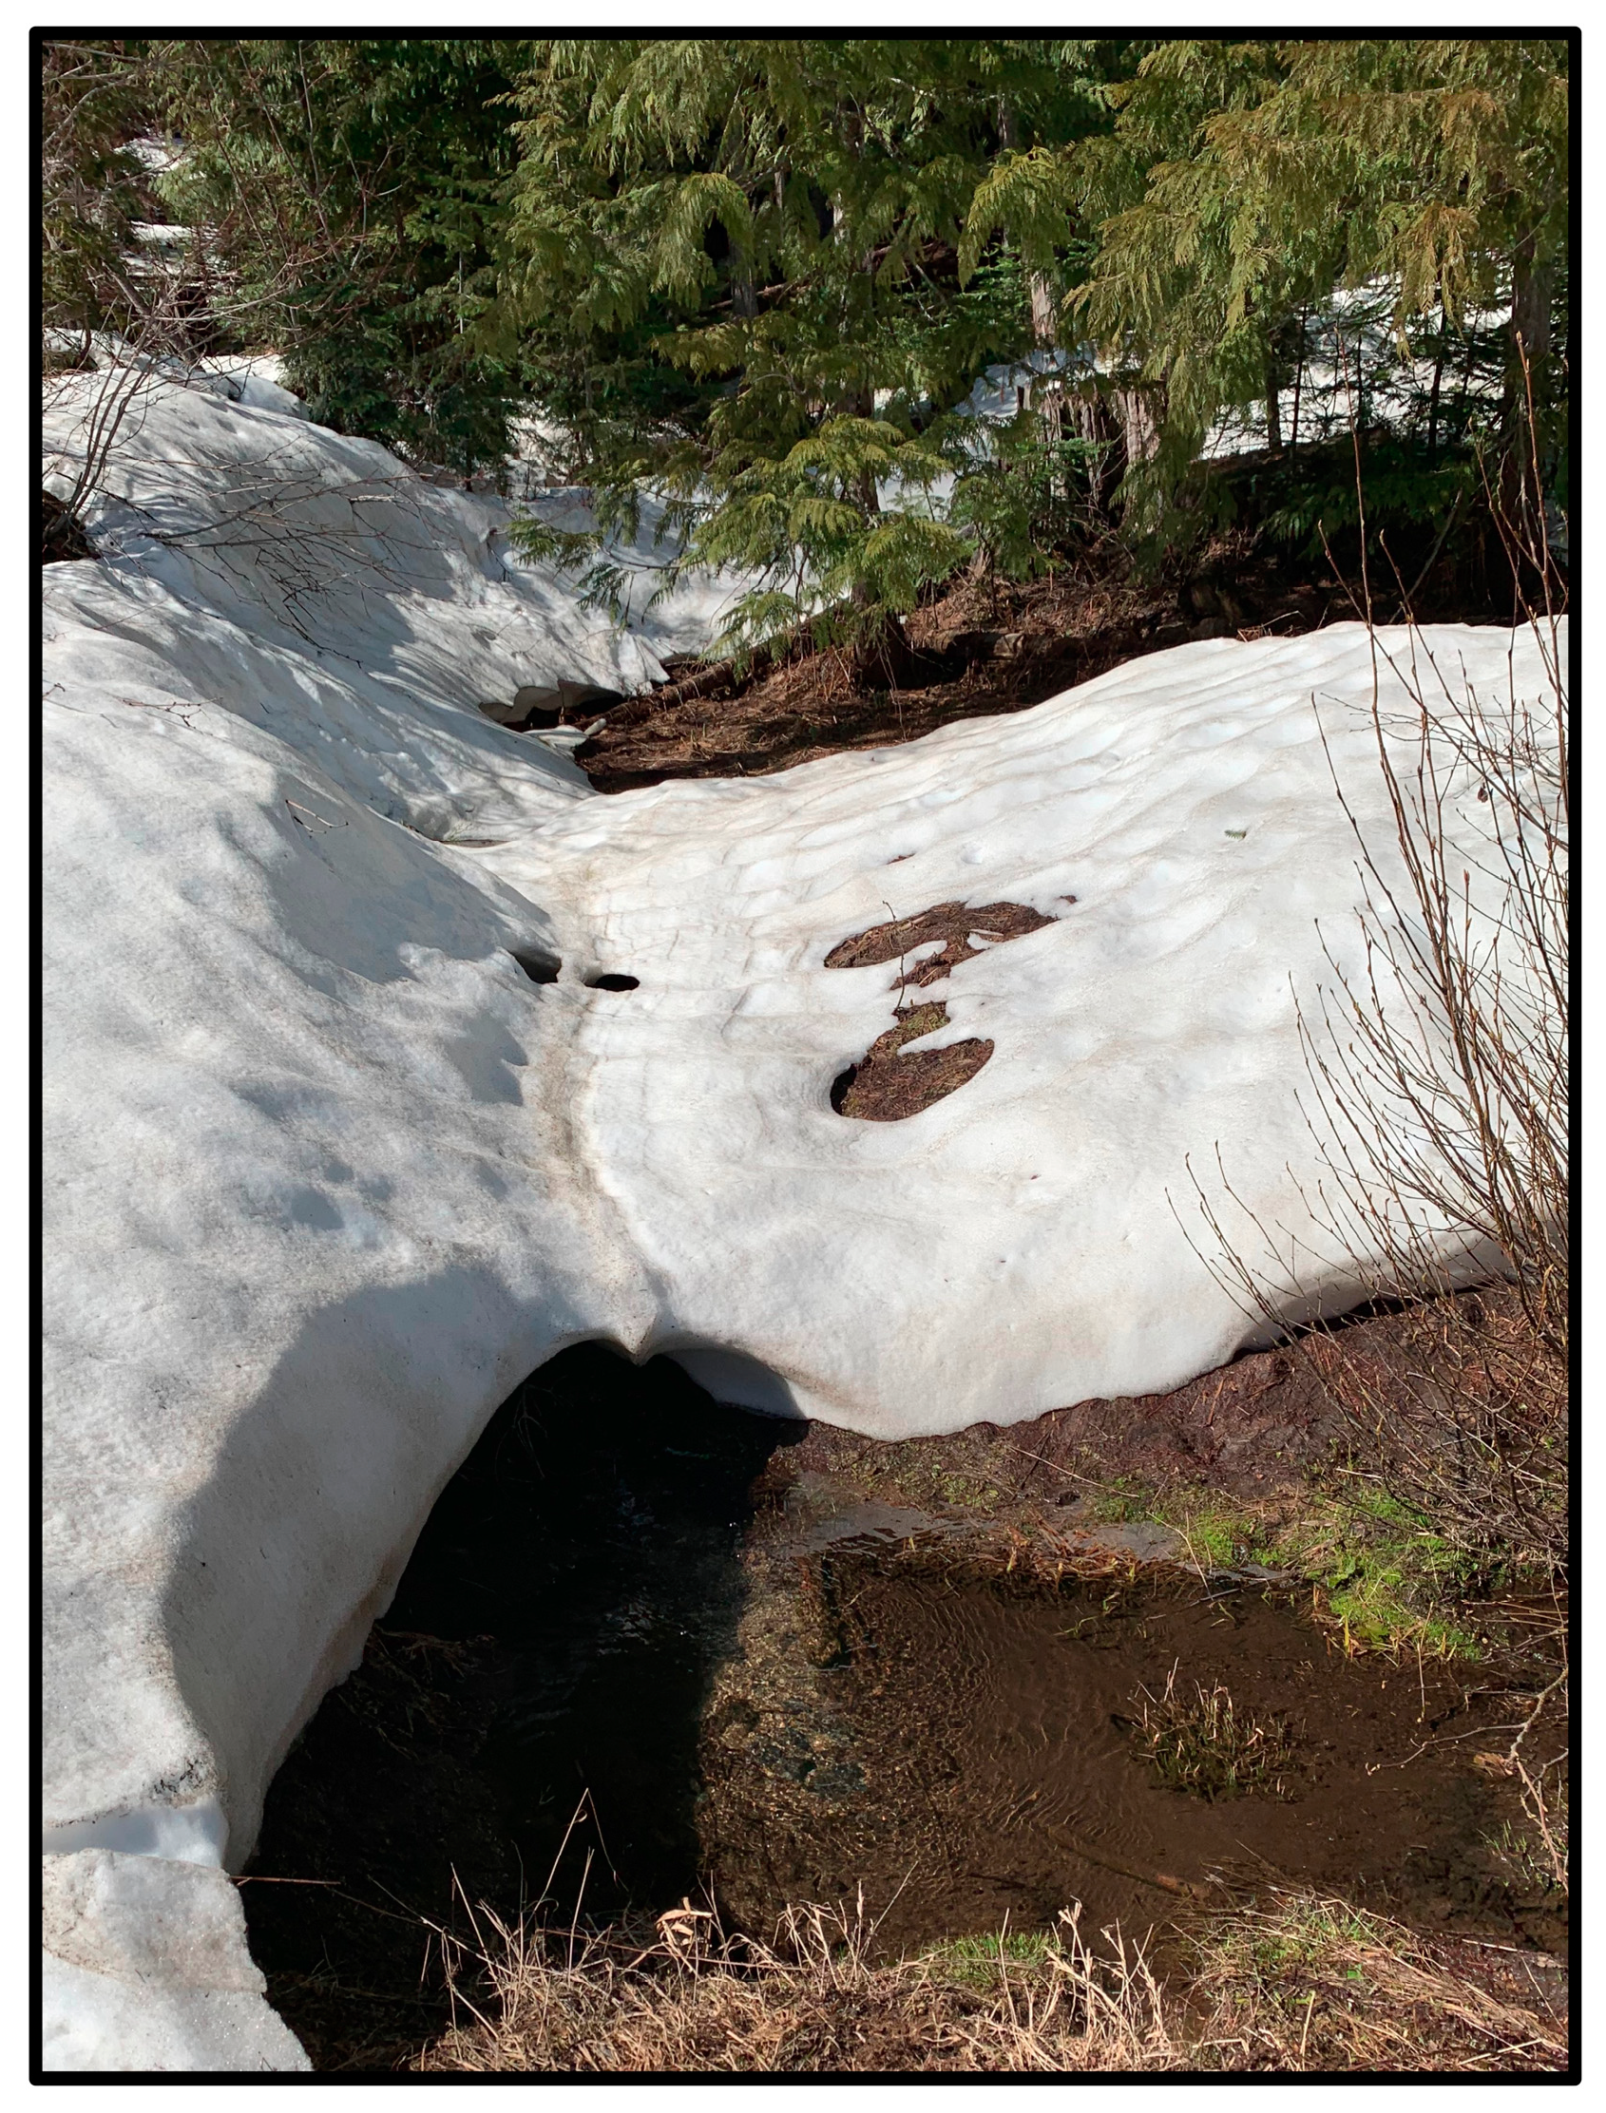
Three ephemeral and unnamed creeks between the #2 and #3 snow collection sites (creeks are not visible in Figure 6 but near the center of the image and referenced as upper, middle, and lower ephemeral creeks) were included in the study sampling to examine possible alteration of isotope signals during spring runoff. These sites were sampled between March and June when runoff was visible and accessible (example in Figure 9). Each creek sample was syringe filtered (1 μm) into 60-mL glass containers (no head space) and sealed with polyseal caps. In addition to creeks near snow collection sites, isotope data from a perennial drainage, Crumarine Creek (Figure 1, tributary of the South Fork of the Palouse River), at a lower elevation (847 m NAVD 88) was included for comparison of isotope values with further travel from the snowpack source. Crumarine Creek was sampled weekly by Sánchez-Murillo et al. [50] from September 2011 to February 2012 for water isotope analysis (total of 245 samples). These surface water samples were collected with an ISCO 3700 automated sampler and analyzed at the University of Idaho Stable Isotope Laboratory using a Picarro water isotope analyzer L1120-i. The laboratory instrument precision was ±0.5‰ for δ2H and ±0.1‰ for δ18O. Replicate samples were used for quality control purposes and multiple calibration standards were analyzed during each analysis period [46,50].

3.3. Groundwater Isotopes

From April 2013 to December 2015, groundwater was collected from 13 private wells (Figure 10 and Table 1) approximately every two weeks (14 to 60 samples per well), as described by Candel et al. [46]. Each well contained a dedicated pump and water samples were taken directly from headwork spigots after sufficient purging (>3 well volumes) and stabilization of groundwater temperature. Water samples were collected in 30-mL, borosilicate glass bottles with polyseal caps that contained no headspace. All groundwater samples were analyzed for δ2H and δ18O with the Picarro L1120-i Analyzer at the University of Idaho, similar to Sánchez-Murillo et al. [50]. These well locations represent the transition from the thinner soil and sediment layers of the forested headwaters to the alluvial/colluvial sedimentary sequences formed at the base of the mountain range and upgradient of the basalt layer termini (Figure 2 and Figure 3).

3.4. Isotope Distribution Analyses

To evaluate the differences in potential source waters and pathways into and through the recharge zone, snowpack, snowmelt, rain, ephemeral creek, Crumarine Creek, and groundwater δ2H and δ18O values were evaluated for linear relations and alteration with evaporation and moisture recycling that produces changes in deuterium excess (d-excess (‰) = δ2H − 8·δ18O) [63,64]. Additionally, groundwater δ18O values for each well’s data set were evaluated using their median values and rank distribution (Kruskal–Wallis test) for grouping by relatively enriched, mixed, or depleted isotope signals. Subsequently, a Kruskal–Wallis test was used to confirm and identify the strength of differences between these groups. This non-parametric analysis of variance on ranks uses a calculated H-value to determine a difference or similarity between groups by comparison of chi squared (χ2) values (p-value < 0.05). To evaluate potential relations between the isotopic signal in groundwater from a specific well and the physical attributes of the well, a principal components analysis (PCA) was performed with each well’s median δ18O value, bottom screen elevation, and screen grain type (e.g., sand or clay (set to a numeric value)). The PCA was performed on the correlation matrix because of differences in scales and without rotation. Component values are presented and represent correlation values for the 1st component (axis) where the orthogonal transformation described a near majority of the variance.

3.5. Isotope Inverse Modeling

To evaluate potential source-water mixing, an enriched δ18O value for Crumarine Creek (evaporated signal) and depleted δ18O value for snowmelt (near snowpack signal) were selected as possible endmember source waters for two-component unmixing (inverse modeling). Using Equation (1), the inverse calculation allows for unmixing of groundwater isotope values (δm) by varying the possible fractions (f1 + f2 = 1) of the selected source water isotope values (δ1 and δ2). Microsoft Excel (Solver for what-if analysis with generalized reduced gradient method) was used to perform the inverse calculation (precision of fraction contribution equal to 0.00001, convergence tolerance set at 0.0001). The inverse calculation is a best-fit scenario where the fractions of likely source waters are varied concurrently to minimize the residual of the model solution compared to the actual δ18O value. The convergence tolerance is the fit parameter that must be met for an output of fractional contributions to be estimated by each inverse calculation or the model was deemed unacceptable.
f1δ1 + f2δ2 = δm

4. Results and Discussion

4.1. Basin Source Waters and Isotope Signals

Snowpack isotope values were highly variable, ranging from −22 to −12‰ for δ18O and −160 to −90‰ for δ2H (Figure 11). The snow samples collected in March 2018 by Duckett et al. [15] (−22 to −17‰ for δ18O and −160 to −135‰ for δ2H) show a strongly depleted signal compared to the 2019–2020 snowpack (−18 to −12‰ for δ18O and −130 to −90‰ for δ2H). The March 2018 values were collected during a single sampling event following a large snow accumulation at Site #1 (highest elevation) and appear to have captured a strongly depleted snow event (most depleted signal = recent snow, relatively enriched signal = aged snowpack). Such strong isotopic variation in snowfall is common in northerly latitudes [65,66] and expected for this region [58,59]. Although the March 2018 isotope values reported by Duckett et al. [15] are more depleted, these values fall along the local meteoric water line (LMWL) for the snowpack (Figure 11; R2 = 0.93) of δ2H = 6.9·δ18O − 5.8. The range and slope of this snowpack’s LMWL is characteristic of a higher latitude, cold climate [64,67]. Because the snowpack sampling frequency increased in the spring, the distribution of the snowpack data is skewed towards a spring-time signal. Correspondingly, the spring-time, snowmelt isotope data indicate less variability than the snowpack, ranging from −16.5 to −12‰ for δ18O and −120 to −90‰ for δ2H (Figure 11). With the transition of spring snowmelt to spring runoff (ephemeral creeks), the isotope values compressed to a range of −16 to −14‰ for δ18O and −110 to −105‰ for δ2H, but the annual isotope data set for the lower elevation and perennial Crumarine Creek had a range of −18 to −13.5‰ for δ18O and −125 to −98‰ for δ2H (Figure 11). Similar to Crumarine Creek, the groundwater isotope values ranged from −17.5 to −13‰ for δ18O and −132 to −105‰ for δ2H (Figure 11). The Crumarine Creek and groundwater appear to be a seasonal mixture of changing contributions of quickly infiltrating early snowmelt (depleted) and more evaporated and slower to infiltrate surface runoff (enriched snowmelt or rainfall). Given the snowpack and snowmelt values, the groundwater in the recharge zone is composed of modern precipitation sources, which aligns with the findings of Duckett et al. [15,21] regarding the enriched to depleted isotope signals from shallow to deep groundwater and an estimated elevation of 900 ± 90 m (NAVD88) based on noble gas concentrations.

4.2. Source Waters and Deuterium Excess

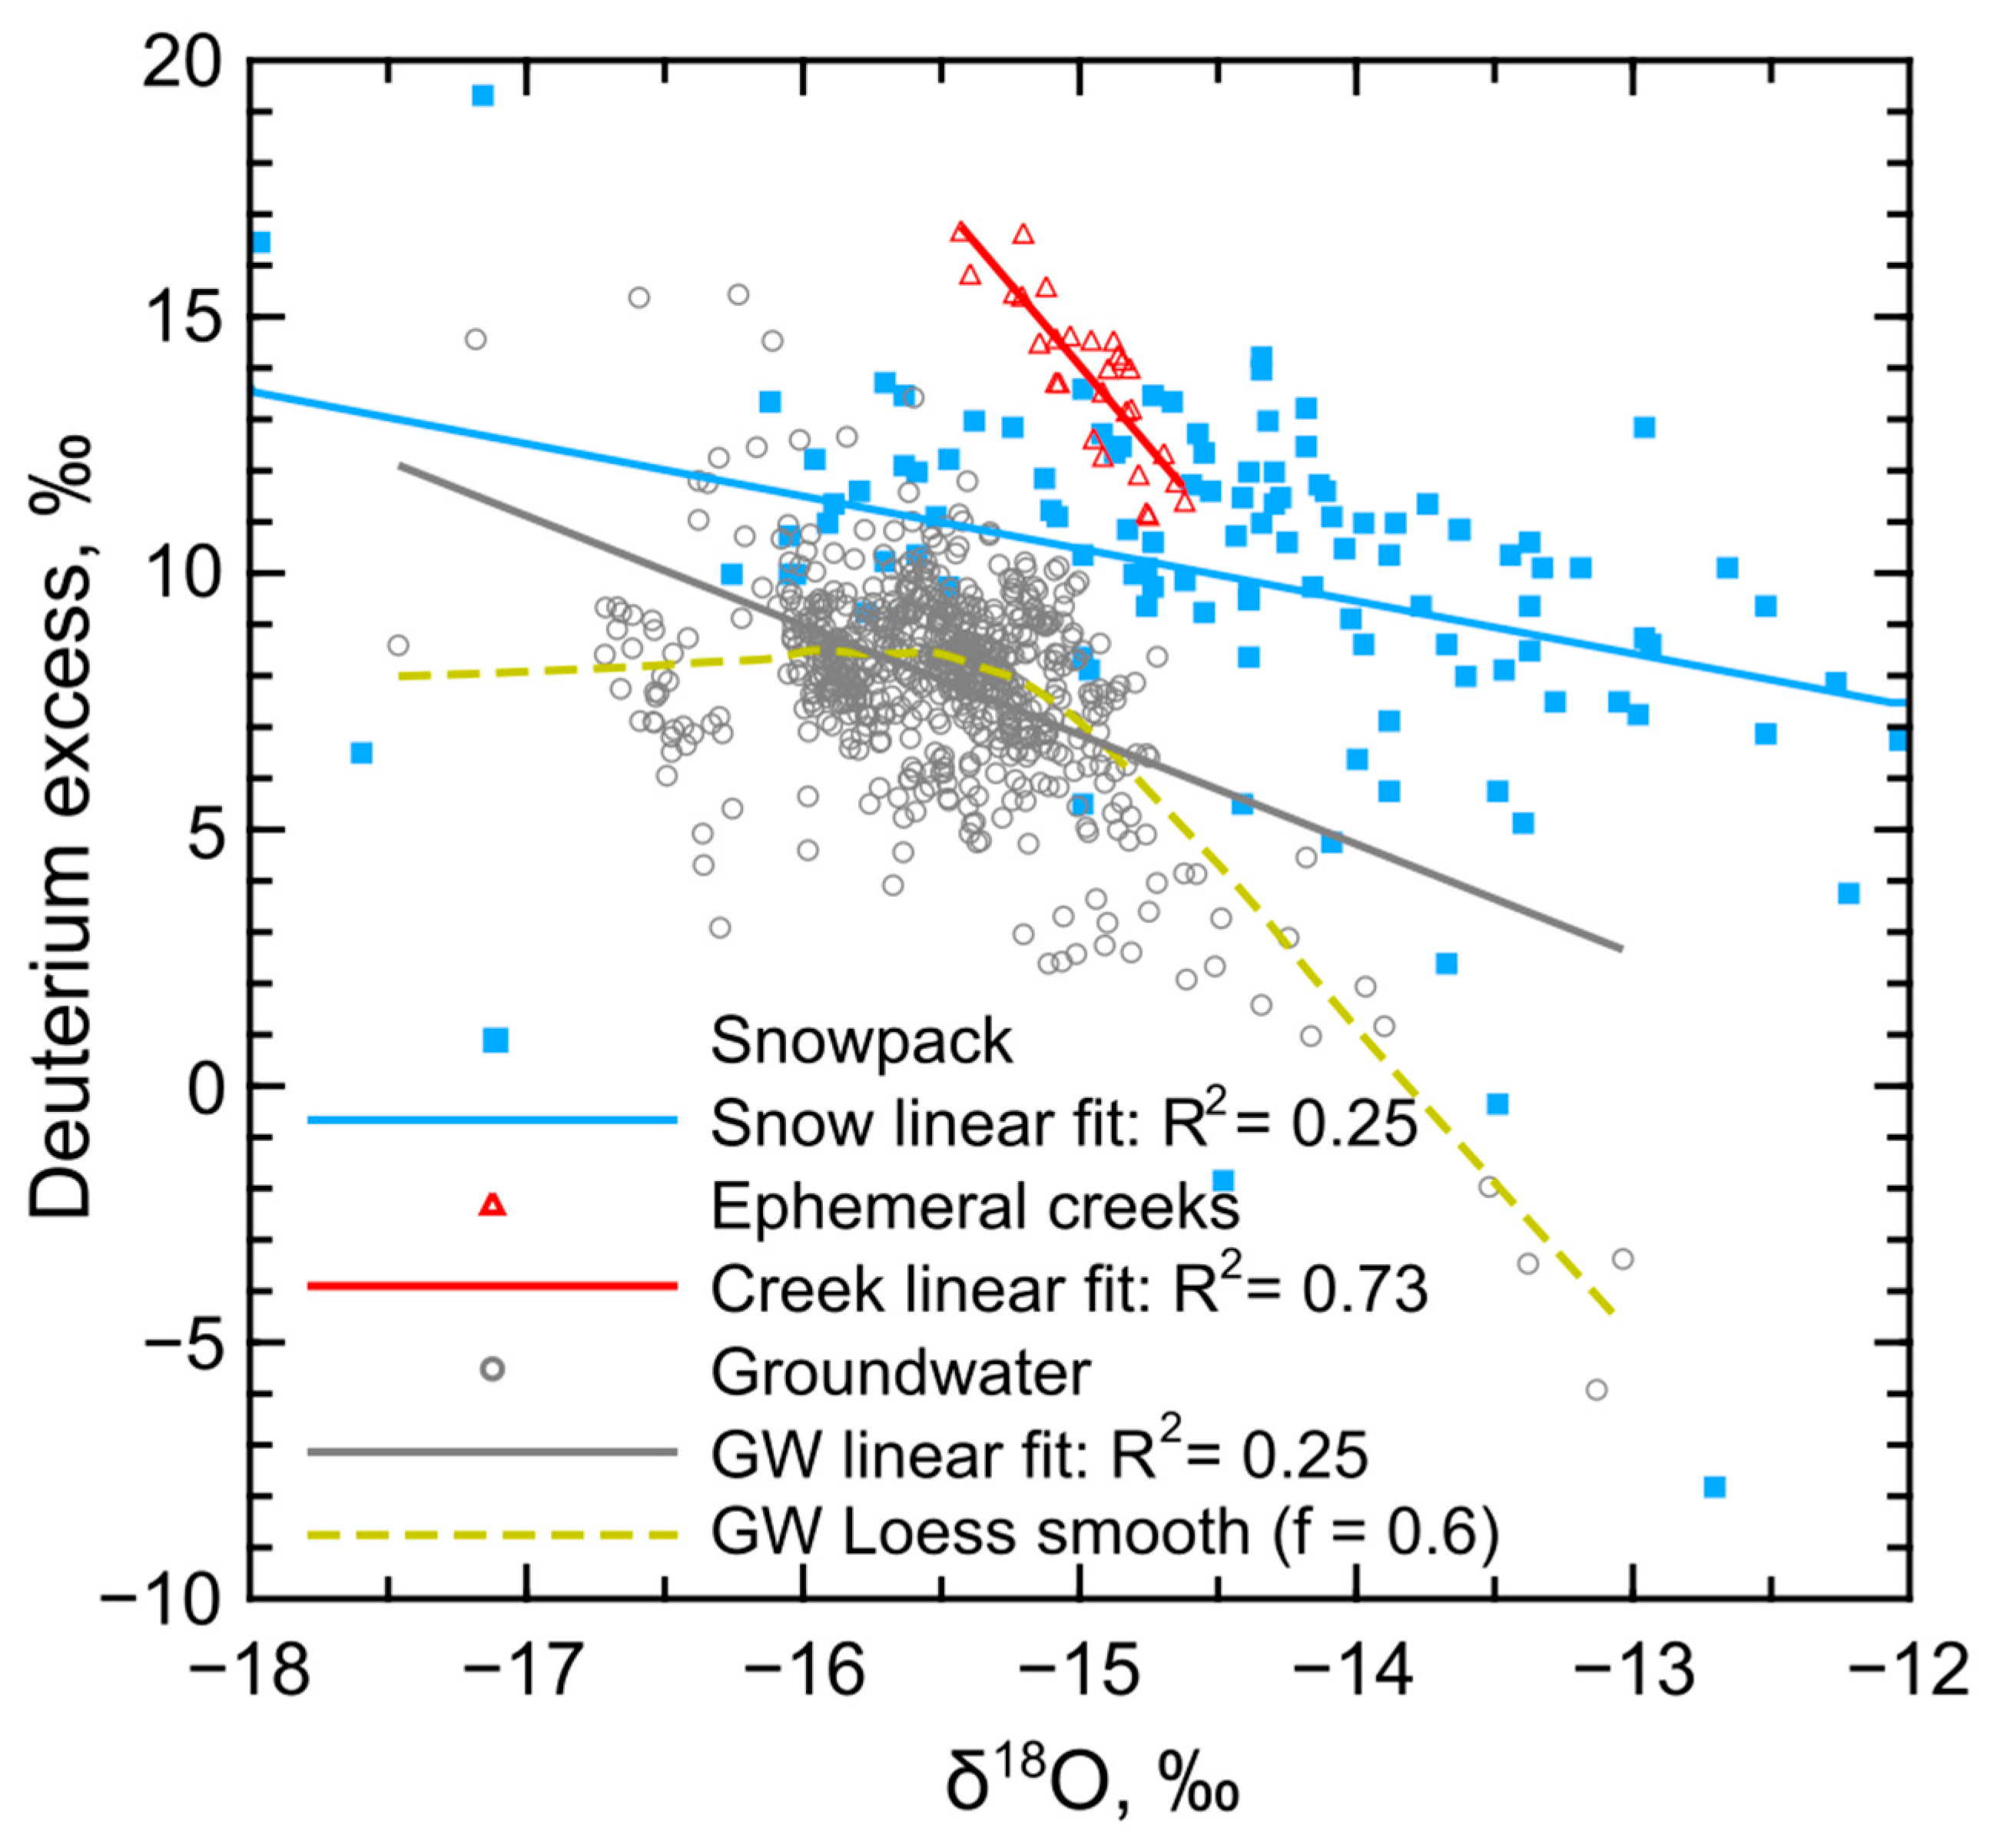
Candel et al. [46] described a variable deuterium excess (d-excess) in the regional groundwater and surface water, reflective of changing proportions of δ2H and δ18O because of precipitation sources and evaporation. The large variability of the snowpack δ18O values and associated d-excess (Figure 12) is a result of changes in the precipitation source(s) and subsequent alteration with snowpack aging (evaporation and moisture recycling within the snowpack) [28,68]. Larger groundwater d-excess values were associated with more depleted δ18O values, particularly from −18 to −15‰ (Figure 12). This groundwater d-excess variation is exemplified by a poor linear fit with δ18O (R2 = 0.25) that is similar to the poor linear fit (R2 = 0.25) for snowpack d-excess and δ18O values (Figure 12). A smoothed fit (LOESS, span(f) = 0.6) of groundwater d-excess and δ18O values indicates a shift in the relation near a δ18O of −15.5‰ where d-excess values do not correlate with δ18O < −15.5‰ (Figure 12). The limited range of d-excess and δ18O values for spring runoff (ephemeral creeks) produces a relatively good linear fit (R2 = 0.73) with large d-excess values indicative of an evaporated water source. The larger d-excess values for depleted δ18O groundwater and the ephemeral creeks indicate similar evaporative processes but at different periods in the source water generation. The ablation of the snowpack increases d-excess in a more depleted δ18O source, while evaporation of spring runoff also increases d-excess but from a less depleted δ18O source (prior enrichment). These multiple source waters and their associated changes in isotopic composition produce a wide range of potential recharge that is reflected in the large range of groundwater isotope values (Figure 11 and Figure 12).
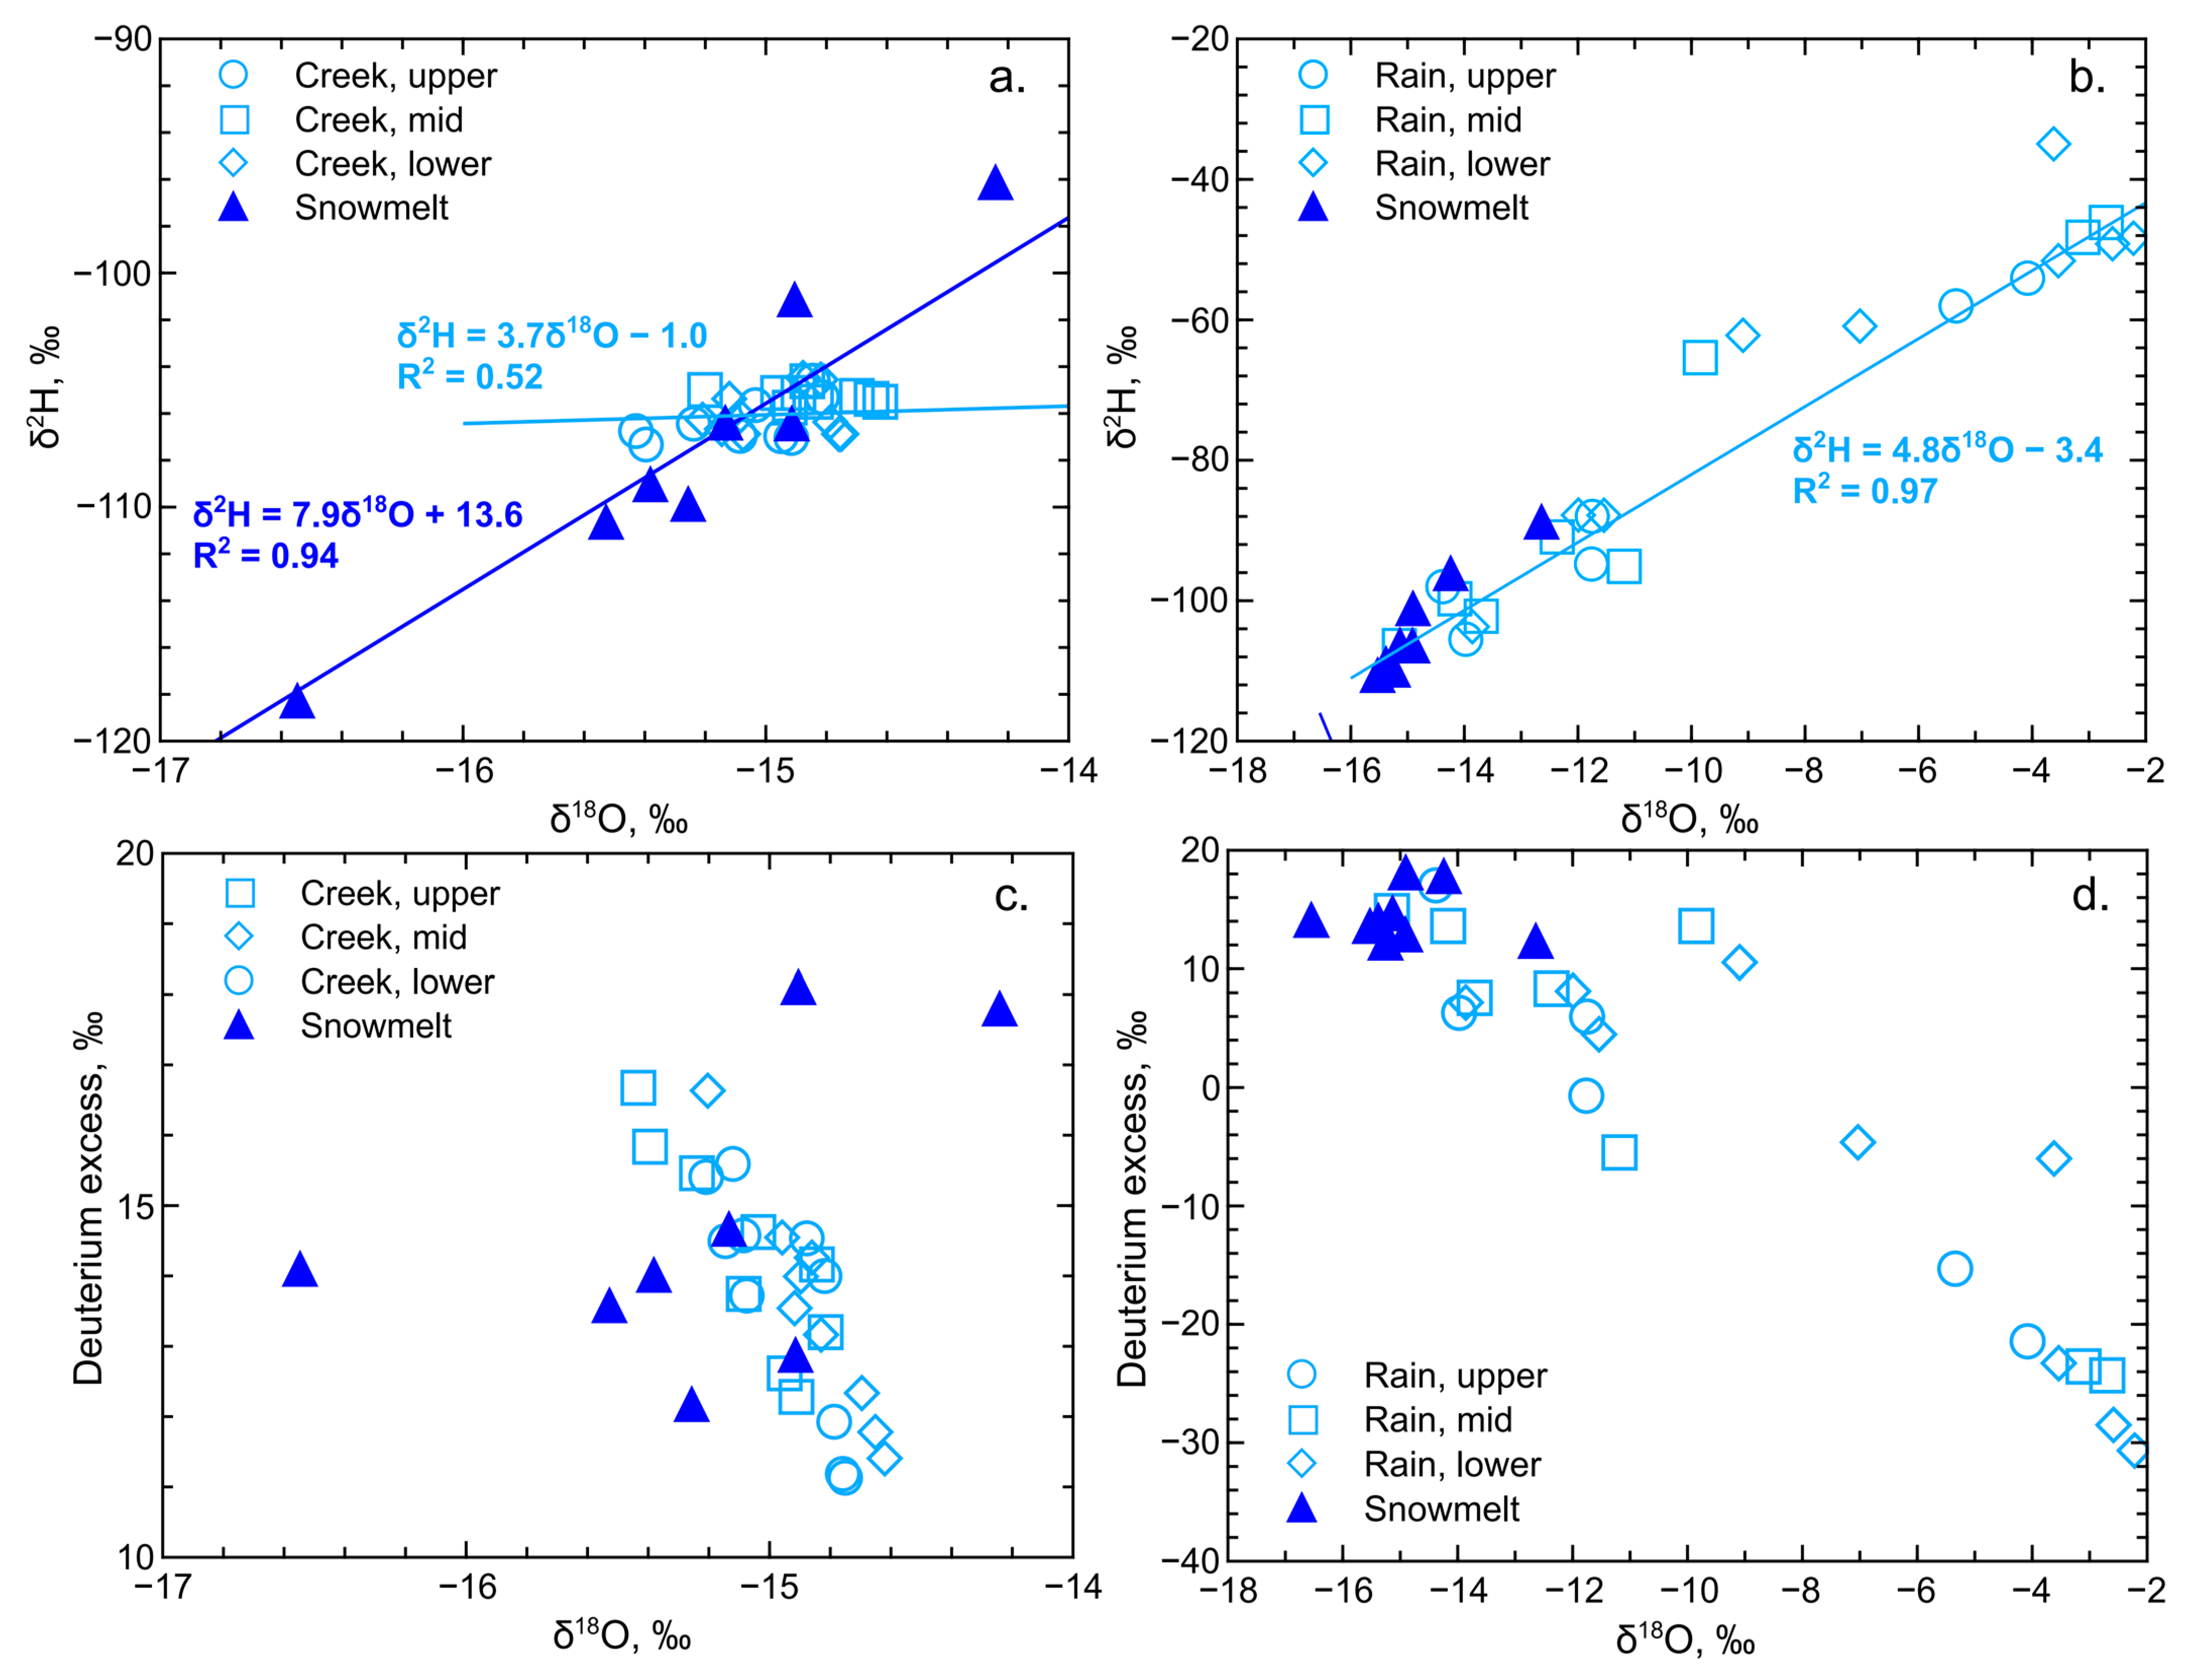
The greater range of isotope values for groundwater compared to the spring-time ephemeral creeks indicates multiple source waters/pathways/timing, recycling of source water moisture, and variable evaporative effects that produce a larger variability of δ18O, δ2H, and d-excess values for waters moving into the recharge zone. A comparison of snowmelt, ephemeral creeks, and rain δ18O, δ2H, and d-excess values indicate a snowmelt isotope relation (δ2H = 7.9·δ18O + 13.6‰) that shifts from the snowpack LMWL to a relation similar to the global meteoric water line (GMWL, Figure 13a). Although, this snowmelt data set is limited because of malfunctioning collectors with variable freezing/unfreezing conditions where most samples were collected in the spring (evaporated source). This spring-time snowmelt LMWL is indicative of the evaporation and recirculation of vapor with snowpack aging and the enrichment of isotope values with the release of spring-time snowmelt [32,33,68], which is exemplified by a variable d-excess and δ18O relation (Figure 13c). A comparison of snowmelt and rain isotope values indicates an enrichment of the precipitation signal with the shift to spring rainfall. The rain LMWL (δ2H = 4.8·δ18O − 3.4‰) indicates a more evaporated signal (lower slope, Figure 13b) as the shift in the precipitation source produced less d-excess (Figure 13d) as compared to the snowpack/snowmelt. The shift towards enriched isotope values with less d-excess for rain did not translate to a shift in spring-time, ephemeral creek isotope values (Figure 13c). This lack of corresponding shift indicates that the concurrently sampled ephemeral creek water was primarily composed of snowmelt sources with a more depleted isotope signal and relatively large d-excess values compared to rainfall.
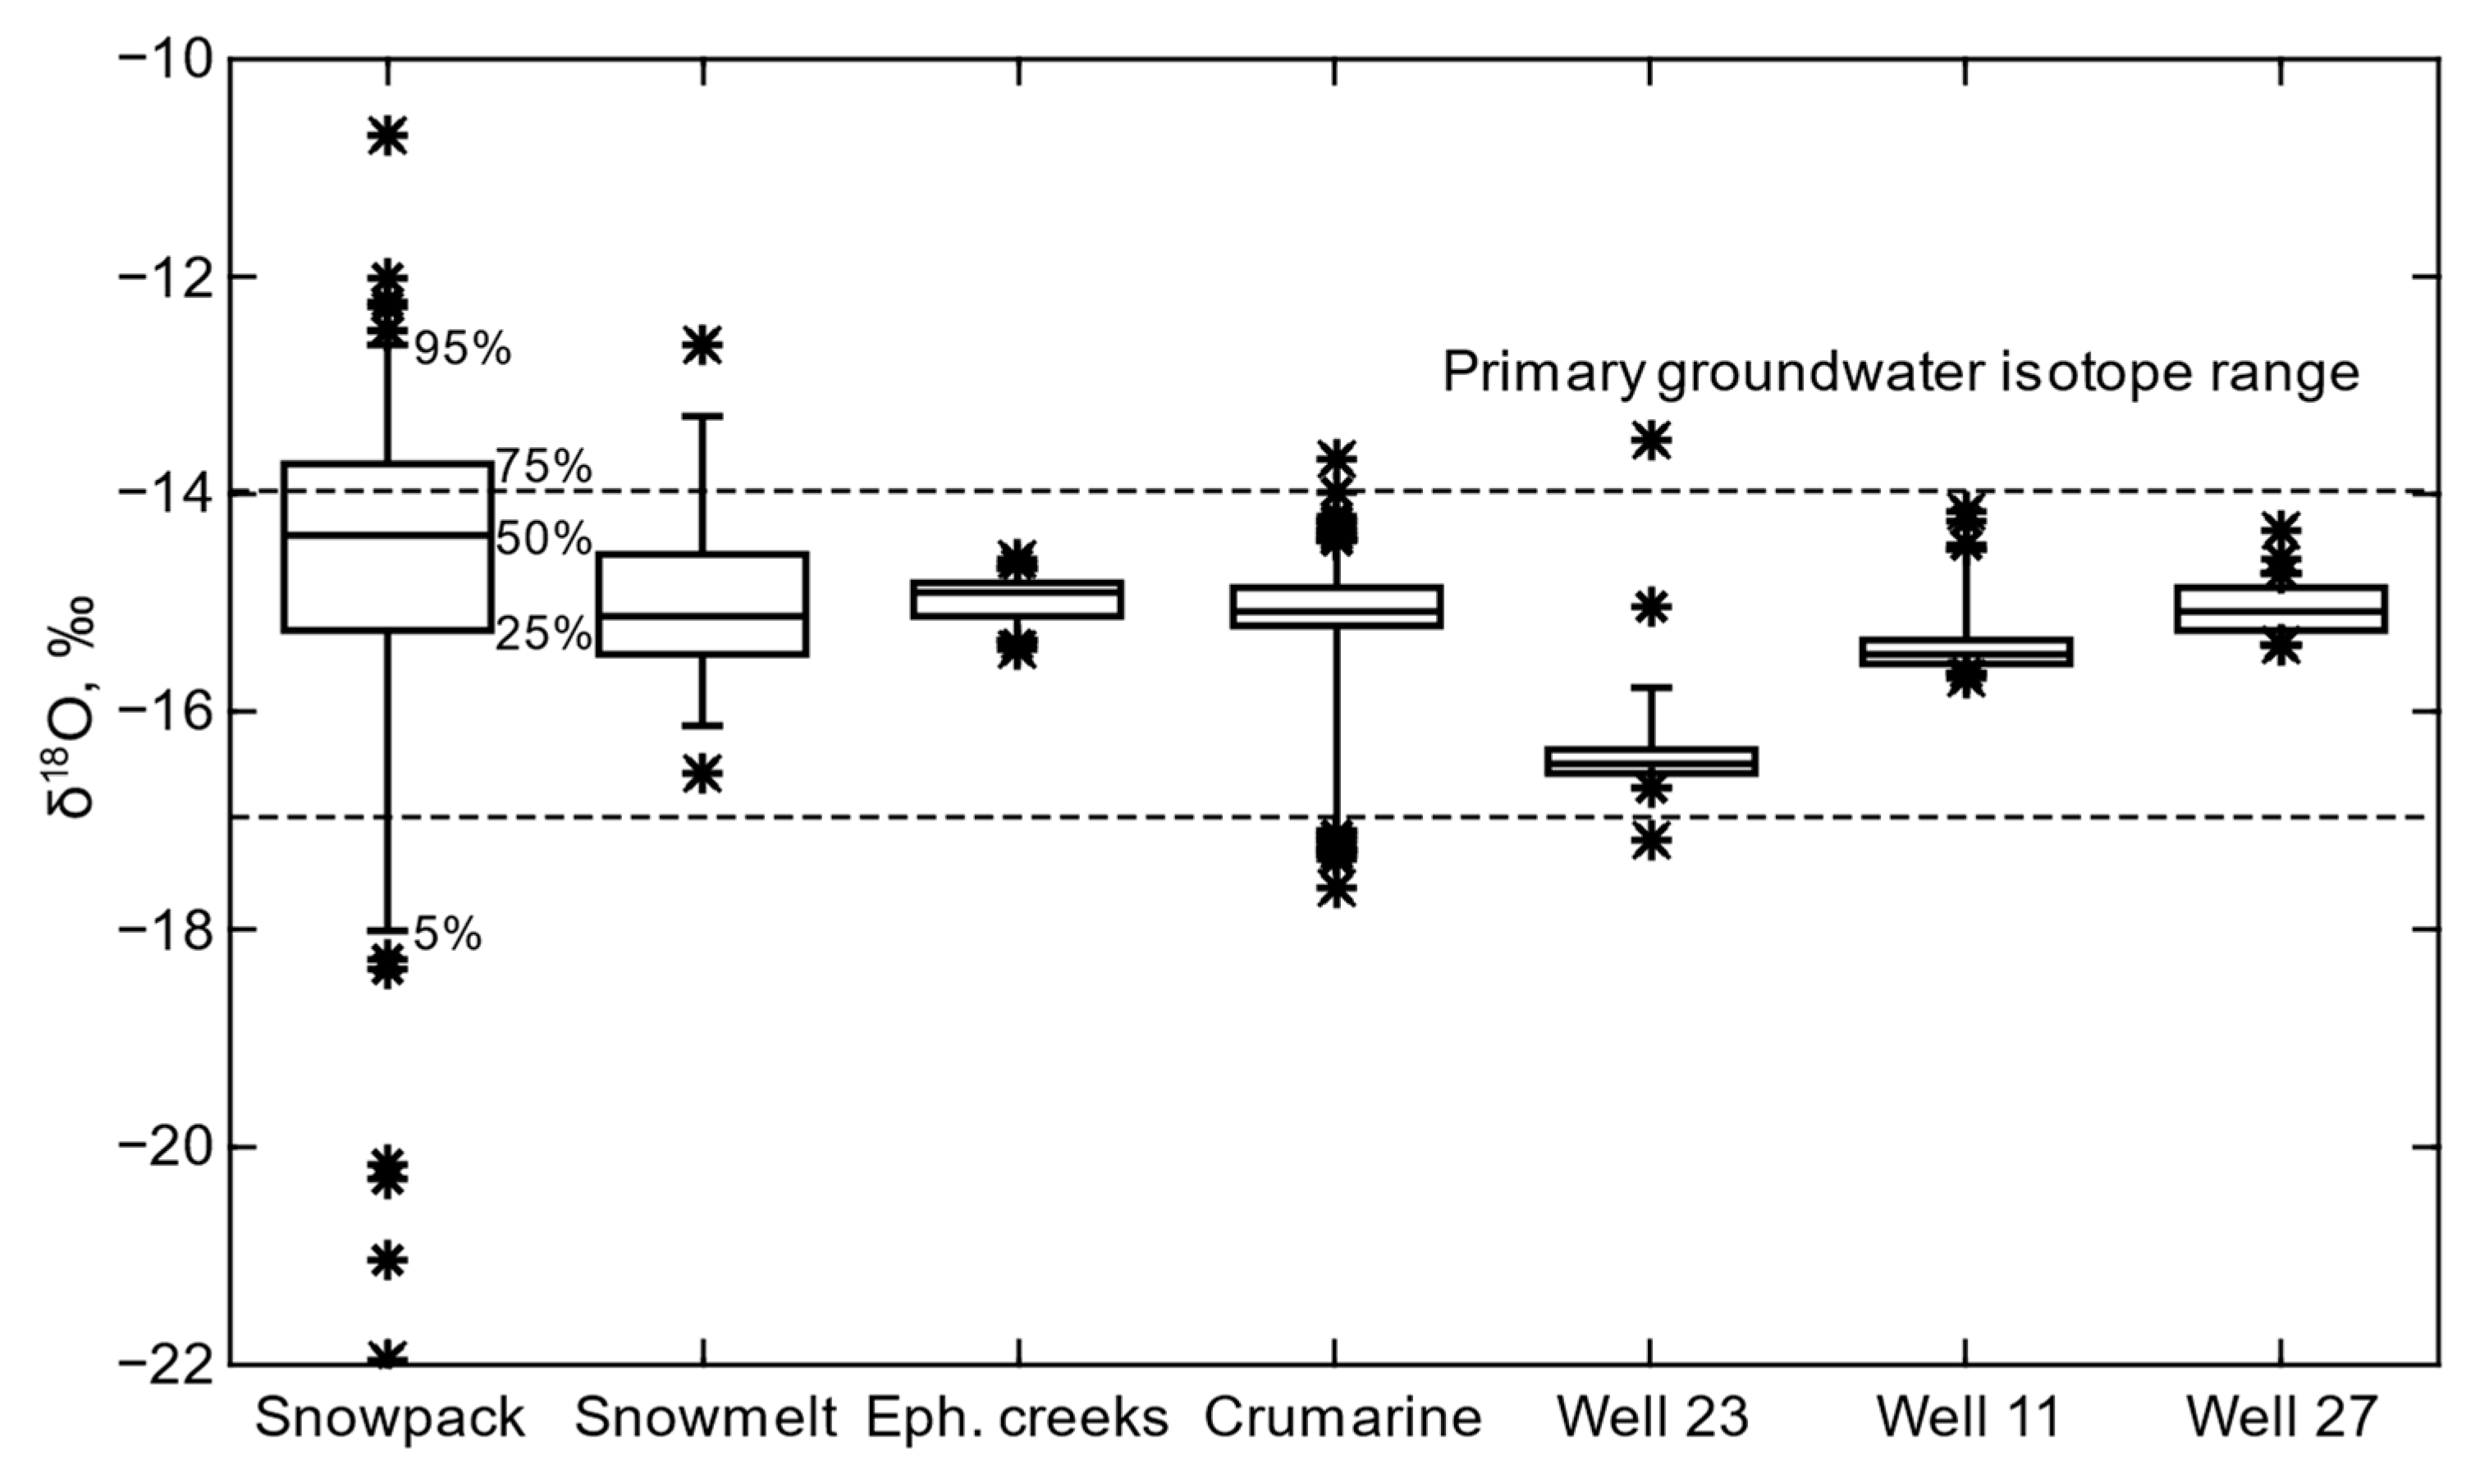
The large variation in snowpack isotope values encompasses the subsequent isotope signals of the surface and subsurface hydrologic systems along the mountain front (Figure 11 and Figure 14). The isotope values for groundwater from Well 27 (Figure 14) are an example of an enriched δ18O water source similar to the values associated with spring-time ephemeral creeks, which indicate a recharge source that has undergone greater evaporation (lower elevation and/or slower or more surface-oriented pathway prior to infiltration/percolation). Alternatively, the more depleted δ18O values for groundwater from Well 23 (Figure 14) indicate an isotope signal aligned with depleted δ18O values of the snowpack or a source water that has not undergone substantial evaporation (higher elevation and/or faster recharge or more direct pathway to groundwater). Isotope values for groundwater from Well 23 also indicate a greater range of possible isotope values indicative of this more direct pathway to groundwater that is more responsive to changes in source waters. With mixing of the depleted and enriched isotope sources in the subsurface, a mixed signal groundwater such as Well 11 (Figure 14) is produced and is reflective of multiple pathways to this location.

4.3. Source Water Groupings

Given the variability of source waters and sedimentary deposits penetrated by wells in the recharge zone, the median δ18O values and their distribution ranks were used to evaluate potential well groupings by their depleted or enriched isotope signals. A Kruskal–Wallis test of all well δ18O distributions provided a mean rank, which, along with median δ18O values, were used to divide the wells (Table 1) into three primary groups—relatively enriched, mixed, or depleted source (Table 2). A second Kruskal–Wallis test was used to confirm the differences between the groups (p value < 0.05) and produce a composite mean rank for each group (Table 2). The groupings are spread across a median δ18O range of −16.48 to −15.06‰ with substantial shifts between the groups in mean rank—258 to 373 for depleted to mixed source and 427 to 467 for mixed to enriched source (Table 2). The ranking of the wells by their isotope signal and the relative groupings were compared to well characteristics to try and identify the parameters associated with the depleted isotope values. The well parameters of bottom screen elevation and the dominant matrix type in the screened interval indicate an association of more depleted isotope signals in groundwater from wells that typically had lower screen elevations and sand or weathered granite as the dominant matrix (Table 2). The results of the PCA assist in understanding the relations between the median δ18O value of the groundwater from a well and a well’s physical characteristics—screen matrix and bottom elevation. The first component of the PCA described 48% of the variance with the median δ18O value and screen elevation having the strongest relation (matrix type = 0.48 loading). The deeper wells in the recharge zone appear to collect groundwater with depleted isotope values suggestive of snowmelt infiltration at higher elevations and travel along the mountain-front interface. This deeper connection along with permeable matrices—sand or weathered granite—aligned with depleted isotope signals. Although, the groundwater with more enriched isotope signals has similar screen interval matrices, but the bottom screen elevations were higher (Table 2). The more limited correlation between the depleted isotopic signals and the matrix type is likely a result of limited drilling depths (private wells) and the heterogeneity of the sediments in the recharge zone.
A depleted isotope signal in groundwater suggests recharge by winter precipitation and a relatively fast/direct infiltration pathway at a higher elevation. An enriched isotope signal suggests an evolved source water that underwent greater sublimation/evaporation prior to infiltration (slower infiltration and/or lower elevation pathway). The heterogeneity and anisotropic nature of the aquifer system is reflected in the recharge zone geology where basalt layers terminate at different distances from the mountain front (Figure 2 and Figure 3) and Latah sediments are a mixture of grain sizes with highly variable sand deposits from the rerouting of the stream network with each subsequent basalt intrusion [20]. Wells in the recharge zone penetrate a variety of sedimentary and fractured/weathered granitic material, which act as controls on the sources/pathways to each layer or well location. An example of the heterogeneity of the recharge zone geology is a line of downgradient wells located along a 0.5 km transect (Wells 24, 23, and 22; Figure 15). Despite their proximity and downgradient alignment, the groundwater ranged from an enriched isotope signal (δ18O median of −15.26‰ and a range of −16.11 to −14.51‰) at the upgradient location (Well 24) to a strongly depleted but widely variable signal (δ18O median of −16.48‰ and a range of −17.18 to −13.52‰) at the shallow intermediary well (Well 23), and lastly, a less depleted and less variable isotope signal (δ18O median of −15.84‰ and a range of −16.59 to −15.11‰) at the deep, downgradient well (Well 22). This lack of perceived connection in the downgradient direction is a result of highly permeable but intermittent sand layers that are associated with paleochannels and the restrictive nature of fine-grained deposits from low energy environments associated with basalt intrusions and stream rerouting [20]. This transect of wells is aligned near a current creek channel (Figure 10), but the underlying deposits do not reflect the coarser deposits of the creek. The lack of connection between these well locations suggests that whether a well location and screened interval contain a depleted groundwater isotope signal depends on the continuity of that permeable pathway to upgradient infiltration/percolation pathways.

5. Inverse Modeling

While some of the Basin’s groundwater has been interpreted as potential Pleistocene water due, in part, to its isotopically-depleted signal [6,7], Sánchez-Murillo et al. [50] found similarly depleted isotopes signals in surface waters, such as Crumarine Creek, following snowmelt. Candel et al.’s [46] indication of the likely rapid travel time between the surface waters and shallow groundwater (as quick as 2–5 weeks) support the Sánchez-Murillo et al. [50] modern source water identification. Duckett et al.’s [15] indication of related isotope signals downgradient of the recharge zone also are indicative of modern recharge pathways. The remaining questions of recharge to the Basin aquifer system are the locations and/or flowpaths of recharge through the sediments overlying the mountain-front interface and the possibility of two primary source waters (deep and depleted or shallow and enriched) suggested by Duckett et al. [15].
Basin source waters vary across a large spectrum of δ18O and δ2H signals (Figure 11); although, groundwater displays a narrower range of isotope signals because of the evolution and mixing of source waters prior to and during aquifer recharge. The three groupings of depleted, mixed, and enriched isotope values of groundwater (Table 2) are discriminated by the relative proportions of those source waters that are derived from the direct infiltration of winter precipitation and snowmelt from the mountain snowpack without substantial travel at the surface. To evaluate the mixing of depleted and enriched source waters across the recharge zone, the groundwater δ18O values were unmixed by inverse modeling (Equation (1)) using an enriched isotope signal represented by the 95th percentile value of Crumarine Creek (−14.4‰) and a depleted isotope signal represented by the 5th percentile value of snowmelt (−16.6‰), which bracket the majority of the groundwater δ18O values (Figure 14). The results of the inverse modeling (Figure 16) indicate that even among the more depleted δ18O groundwater, there is a substantive contribution of an enriched source(s)—upward of 30%. This mixing of likely source waters indicates multiple pathways to locations in the sediments across the recharge zone that provide a range of isotope signals resulting from seasonal variations in precipitation and the alteration of isotope signals with snowpack aging and evaporative processes during transport.
Even with the mixing of source waters in the recharge zone (Figure 16), a potential direct and isotopically-depleted recharge pathway, as suggested by Duckett et al. [15], is centered in the recharge zone between wells 22–24 and 8–9. Wells 22 and 23 are screened in sand deposits and represent a stratigraphically higher elevation and permeable pathway, while wells 8 and 9 are connected to deeper groundwater in the weathered/fractured granite along the mountain-front interface. A second, yet less distinct, direct and isotopically-depleted recharge pathway may exist near well 29 that is likely modified by an input of enriched water near wells 27 and 28. These three wells have similar depths and screen locations. Although, well 29 is slightly deeper (Table 1), which may provide a connection to a more isotopically-depleted, deeper groundwater. The shift to isotopically enriched water for well 27 indicates a connection to a slower or less direct recharge pathway(s). This source water shift likely is related to the large screen interval in this well (Table 2), which connects multiple pathways, such as the higher elevation deposits receiving infiltrated water from lower elevation creeks (farther surface travel). Outside of the perceived faster or more direct recharge pathways from higher elevations toward the center of the recharge zone, the western and eastern peripheries of the recharge zone appear to contain groundwater of more enriched isotope signals, as indicated by the relatively enriched δ18O values for the groundwater from wells 35, 28, 17, and 14. Although, well 35 may not be representative of the western periphery of the recharge zone because of its higher elevation outside the primary sedimentary deposits.

6. Conclusions

Previous studies hypothesized differences in the potential source waters and pathways from precipitation occurring on the eastern edge of the Columbia River Basalt Province within the South Fork of the Palouse River Basin. Snowpack isotope values ranged from −22 to −12‰ for δ18O and −160 to −90‰ for δ2H and produced spring-time snowmelt isotope values ranging from −16.5 to −12‰ for δ18O and −120 to −90‰ for δ2H. With the transition of snowmelt to spring-time ephemeral creeks, isotope values compressed to a range of −16 to −14‰ for δ18O and −110 to −105‰ for δ2H. A greater range of isotope values than the ephemeral creeks was present in the perennial flow of the lower elevation Crumarine Creek (−18 to −13.5‰ for δ18O and −125 to −98‰ for δ2H) and groundwater in the hypothesized recharge zone (−17.5 to −13‰ for δ18O and −132 to −105‰ for δ2H). The evolution of the recharge source waters produced isotopically enriched, mixed, and depleted waters that fed different layers and portions of sediments in the recharge zone that is outside of the extent of the Basin’s basalt layers.
The reworking of sediment deposits with each basalt intrusion and the resetting of the stream network draining the Palouse Range produced highly variable sediment deposits in the recharge zone. This variability resulted in a limited similarity, or connectedness, of groundwater pathways and subsequent isotope signals across the recharge zone. The groundwater that is categorized as having a depleted isotope signal had a median δ18O value of −15.85‰ and was associated with snowmelt that more quickly entered the subsurface and remained relatively separate from the infiltration of isotopically enriched water. The groundwater with depleted isotope signals was generally associated with the mountain-front interface composed of weathered/fractured granite or stratigraphically higher sand deposits that are paleochannel remnants. The depth of screen elevation was a statistically relevant control on the isotopic signal with deeper wells typically containing groundwater with a more depleted signal. The dominant grain type of the aquifer matrix at a well’s screen interval was less relevant. The spatial distribution of the depleted isotope signals in groundwater across the recharge zone indicate a faster or more direct recharge pathway in the central portion of the recharge zone that has a limited association with the current stream network. This more direct recharge pathway is connected to sand units likely from paleochannel(s) and includes a deeper connection to isotopically depleted groundwater along the mountain-front interface associated with higher elevation recharge. In addition to greater depleted isotope signals in the central recharge zone, the peripheries of the recharge zone indicated relatively enriched isotope signals and perceived slower or more evaporated pathways to recharge. This larger view of more direct recharge pathways in the central portion of the recharge zone and slower pathways along the peripheries aligns with the results from the investigations that found similarly depleted, mixed, and enriched isotope values in the groundwater downgradient from the recharge zone.

Supplementary Materials

The following are available online at https://www.mdpi.com/article/10.3390/geosciences11100400/s1. Isotope values of this study.

Author Contributions

Conceptualization, J.B.L.; methodology, J.B.L.; validation, D.B., J.B.L., E.S.B., J.B., K.W. and J.G.M.; formal analysis, D.B. and J.B.L.; investigation, D.B., J.B.L., J.B., J.K.D. and J.W.D.; resources, J.B.L.; data curation, D.B.; writing—original draft preparation, D.B. and J.B.L.; writing—review and editing, D.B., J.B.L., E.S.B., J.B., K.W. and J.G.M.; visualization, D.B. and J.B.L.; supervision, J.B.L.; project administration, D.B. and J.B.L.; funding acquisition, J.B.L. All authors have read and agreed to the published version of the manuscript.

Funding

This project was funded in part by the Palouse Basin Aquifer Committee and the US Geological Survey 104b program as administered through the Idaho Water Resources Research Institute (grant # G16AP00050).

Institutional Review Board Statement

Not applicable.

Informed Consent Statement

Not applicable.

Data Availability Statement

The data presented in this study are openly available as Supplementary Materials to this article.

Acknowledgments

We acknowledge the support of the Palouse Basin Aquifer Committee (PBAC) to make this research possible, including the funding provided for David Behrens’ research assistantship for the 2019–2020 academic year. Special thanks to John Bush and Pam Dunlap for their always prompt advice and expertise in interpreting the local geology. We would also like to acknowledge the contribution of Robert Kane in the snowmelt sampling and processing. We would also like to acknowledge Ricardo Sánchez-Murillo, Jasper Candel, William J. Elliot, George Grader, and Roel Dijksma who were responsible for the articles that contributed the groundwater and Crumarine Creek stable isotope data. We thank the anonymous reviewers for their thorough and thoughtful reviews, which helped to improve this manuscript.

Conflicts of Interest

The funding agency had no role in the design of the study; in the collection, analyses, or interpretation of data; in the writing of the manuscript, or in the decision to publish the results.

References

  1. Meixner, T.; Manning, A.H.; Stonestrom, D.A.; Allen, D.M.; Ajami, H.; Blasch, K.W.; Brookfield, A.E.; Castro, C.L.; Clark, J.F.; Gochis, D.J.; et al. Implications of Projected Climate Change for Groundwater Recharge in the Western United States. J. Hydrol. 2016, 534, 124–138. [Google Scholar] [CrossRef] [Green Version]
  2. Frisbee, M.D.; Tolley, D.G.; Wilson, J.L. Field Estimates of Groundwater Circulation Depths in Two Mountainous Watersheds in the Western U.S. and the Effect of Deep Circulation on Solute Concentrations in Streamflow. Water Resour. Res. 2017, 53, 2693–2715. [Google Scholar] [CrossRef]
  3. Dhungel, R.; Fiedler, F. Water Balance to Recharge Calculation: Implications for Watershed Management Using Systems Dynamics Approach. Hydrology 2016, 3, 13. [Google Scholar] [CrossRef] [Green Version]
  4. Ely, D.M.; Burns, E.R.; Morgan, D.S.; Vaccaro, J.J. Numerical Simulation of Groundwater Flow in the Columbia Plateau Regional Aquifer System, Idaho, Oregon, and Washington; Scientific Investigations Report; U.S. Geological Survey: Reston, VA, USA, 2014; Volume 2014—5127, p. 102.
  5. Vaccaro, J.J. Summary of the Columbia Plateau Regional Aquifer-System Analysis, Washington, Oregon, and Idaho; Professional Paper; U.S. Geological Survey: Reston, VA, USA, 1999; p. 64.
  6. Douglas, A.A.; Osiensky, J.L.; Keller, C.K. Carbon-14 Dating of Ground Water in the Palouse Basin of the Columbia River Basalts. J. Hydrol. 2007, 334, 502–512. [Google Scholar] [CrossRef]
  7. Carey, L. Evaluation of Oxygen and Hydrogen Isotopes in Groundwater of the Palouse Basin and Moscow Sub-Basin. Master’s Thesis, University of Idaho, Moscow, ID, USA, 2011. [Google Scholar]
  8. Moxley, N. Stable Isotope Analysis of Surface Water and Precipitation in the Palouse Basin: Hydrologic Tracers of Aquifer Recharge. Master’s Thesis, Washington State University, Pullman, WA, USA, 2012. [Google Scholar]
  9. Lum, W.E., II; Smoot, J.L.; Ralston, D.R. Geohydrology and Numerical Model Analysis of Ground-Water Flow in the Pullman-Moscow Area, Washington and Idaho; U.S. Geological Survey: Reston, VA, USA, 1990; Volume 79.
  10. Owsley, D. Characterization of Grande Ronde Aquifers in the Palouse Basin Using Large Scale Aquifer Tests. Master’s Thesis, University of Idaho, Moscow, ID, USA, 2003. [Google Scholar]
  11. Folnagy, A.J.B. Long-Term Grande Ronde Aquifer Stress Testing to Delineate Compartmentalization and Water Level Responses in the Palouse Basin. Master’s Thesis, University of Idaho, Moscow, ID, USA, 2012. [Google Scholar]
  12. Moran, K. Interpretation of Long-Term Grande Ronde Aquifer Testing in the Palouse Basin of Idaho and Washington. Master’s Thesis, University of Idaho, Moscow, ID, USA, 2011. [Google Scholar]
  13. Folnagy, A.J.B.; Osiensky, J.L.; Kobayashi, D.; Sprenke, K.F. Specific Storage from Sparse Records of Groundwater Response to Seismic Waves. J. Hydrol. 2013, 503, 22–28. [Google Scholar] [CrossRef]
  14. Medici, G.; Engdahl, N.B.; Langman, J.B. A Basin-Scale Groundwater Flow Model of the Columbia Plateau Regional Aquifer System in the Palouse (USA): Insights for Aquifer Vulnerability Assessment. Int. J. Environ. Res. 2021, 15, 299–312. [Google Scholar] [CrossRef]
  15. Duckett, K.A.; Langman, J.B.; Bush, J.H.; Brooks, E.S.; Dunlap, P.; Welker, J.M. Isotopic Discrimination of Aquifer Recharge Sources, Subsystem Connectivity and Flow Patterns in the South Fork Palouse River Basin, Idaho and Washington, USA. Hydrology 2019, 6, 15. [Google Scholar] [CrossRef] [Green Version]
  16. Larson, K.R.; Keller, C.K.; Larson, P.B.; Allen-King, R.M. Water Resource Implications of 18O and 2H Distributions in a Basalt Aquifer System. Ground Water 2000, 38, 947–953. [Google Scholar] [CrossRef]
  17. Brown, K.B.; McIntosh, J.C.; Baker, V.R.; Gosch, D. Isotopically-Depleted Late Pleistocene Groundwater in Columbia River Basalt Aquifers: Evidence for Recharge of Glacial Lake Missoula Floodwaters? Geophys. Res. Lett. 2010, 37, L21402. [Google Scholar] [CrossRef]
  18. Bush, J.H.; Dunlap, P. Geologic Interpretations of Wells and Important Rock Outcrops in the Moscow-Pullman Basin and Vicinity, Idaho and Washington; Technical Report; Idaho Geological Survey: Moscow, ID, USA, 2018; p. 1993.
  19. Bush, J.H.; Dunlap, P. Structure Contours on the Top of the Grande Ronde Basalt in the Moscow-Pullman Basin and Vicinity, Idaho and Washington; Technical Report; Idaho Geological Survey: Moscow, ID, USA, 2018; p. 1.
  20. Bush, J.H.; Dunlap, P.; Reidel, S.P. Miocene Evolution of the Moscow-Pullman Basin, Idaho and Washington; Technical Report; Idaho Geological Survey: Moscow, ID, USA, 2018; p. 44.
  21. Duckett, K.A.; Langman, J.B.; Bush, J.H.; Brooks, E.S.; Dunlap, P.; Stanley, J.R. Noble Gases, Dead Carbon, and Reinterpretation of Groundwater Ages and Travel Time in Local Aquifers of the Columbia River Basalt Group. J. Hydrol. 2020, 581, 124400. [Google Scholar] [CrossRef]
  22. Scheliga, B.; Tetzlaff, D.; Nuetzmann, G.; Soulsby, C. Groundwater Isoscapes in a Montane Headwater Catchment Show Dominance of Well-Mixed Storage. Hydrol. Process. 2017, 31, 3504–3519. [Google Scholar] [CrossRef]
  23. Koeniger, P.; Gaj, M.; Beyer, M.; Himmelsbach, T. Review on Soil Water Isotope-Based Groundwater Recharge Estimations. Hydrol. Process. 2016, 30, 2817–2834. [Google Scholar] [CrossRef]
  24. Barnett, T.P.; Adam, J.C.; Lettenmaier, D.P. Potential Impacts of a Warming Climate on Water Availability in Snow-Dominated Regions. Nature 2005, 438, 303–309. [Google Scholar] [CrossRef]
  25. Carroll, R.W.H.; Deems, J.S.; Niswonger, R.; Schumer, R.; Williams, K.H. The Importance of Interflow to Groundwater Recharge in a Snowmelt-Dominated Headwater Basin. Geophys. Res. Lett. 2019, 46, 5899–5908. [Google Scholar] [CrossRef] [Green Version]
  26. Gat, J.R. Oxygen and Hydrogen Isotopes in the Hydrologic Cycle. Annu. Rev. Earth Planet. Sci. 1996, 24, 225–262. [Google Scholar] [CrossRef] [Green Version]
  27. Birkel, C.; Soulsby, C. Advancing Tracer-Aided Rainfall–Runoff Modelling: A Review of Progress, Problems and Unrealised Potential. Hydrol. Process. 2015, 29, 5227–5240. [Google Scholar] [CrossRef]
  28. Beria, H.; Larsen, J.R.; Ceperley, N.C.; Michelon, A.; Vennemann, T.; Schaefli, B. Understanding Snow Hydrological Processes through the Lens of Stable Water Isotopes. Wiley Interdiscip. Rev. Water 2018, 5, e1311. [Google Scholar] [CrossRef] [Green Version]
  29. Penna, D.; Ahmad, M.; Birks, S.J.; Bouchaou, L.; Brenčič, M.; Butt, S.; Holko, L.; Jeelani, G.; Martínez, D.E.; Melikadze, G.; et al. A New Method of Snowmelt Sampling for Water Stable Isotopes. Hydrol. Process. 2014, 28, 5637–5644. [Google Scholar] [CrossRef]
  30. Ala-aho, P.; Tetzlaff, D.; McNamara, J.P.; Laudon, H.; Kormos, P.; Soulsby, C. Modeling the Isotopic Evolution of Snowpack and Snowmelt: Testing a Spatially Distributed Parsimonious Approach. Water Resour. Res. 2017, 53, 5813–5830. [Google Scholar] [CrossRef]
  31. Earman, S.; Campbell, A.R.; Phillips, F.M.; Newman, B.D. Isotopic Exchange between Snow and Atmospheric Water Vapor: Estimation of the Snowmelt Component of Groundwater Recharge in the Southwestern United States. J. Geophys. Res. Atmos. 2006, 111. [Google Scholar] [CrossRef]
  32. Moser, H.; Stichler, W. Deuterium and Oxygen-18 Contents as an Index of the Properties of Snow Covers. Int. Assoc. Hydrol. Sci. 1974, 114, 122–135. [Google Scholar]
  33. Zongxing, L.; Qi, F.; Wei, L.; Tingting, W.; Xiaoyan, G.; Zongjie, L.; Yan, G.; Yanhui, P.; Rui, G.; Bing, J.; et al. The Stable Isotope Evolution in Shiyi Glacier System during the Ablation Period in the North of Tibetan Plateau, China. Quat. Int. 2015, 380, 262–271. [Google Scholar] [CrossRef]
  34. Winograd, I.J.; Riggs, A.C.; Coplen, T.B. The Relative Contributions of Summer and Cool-Season Precipitation to Groundwater Recharge, Spring Mountains, Nevada, USA. Hydrogeol. J. 1998, 6, 77–93. [Google Scholar] [CrossRef]
  35. Jasechko, S.; Perrone, D.; Befus, K.M.; Bayani Cardenas, M.; Ferguson, G.; Gleeson, T.; Luijendijk, E.; McDonnell, J.J.; Taylor, R.G.; Wada, Y.; et al. Global Aquifers Dominated by Fossil Groundwaters but Wells Vulnerable to Modern Contamination. Nat. Geosci. 2017, 10, 425–429. [Google Scholar] [CrossRef] [Green Version]
  36. Sophocleous, M. Interactions between Groundwater and Surface Water: The State of the Science. Hydrogeol. J. 2002, 10, 52–67. [Google Scholar] [CrossRef]
  37. Bush, J.H.; Garwood, D.L.; Dunlap, P. Geology and geologic history of the Moscow-Pullman basin, Idaho and Washington, from late Grande Ronde to late Saddle Mountains time. In Exploring the Geology of the Inland Northwest; Lewis, R.S., Schmidt, K.L., Eds.; Geological Society of America Field Guide; Geological Society of America: Boulder, CO, USA, 2016; pp. 151–174. ISBN 978-0-8137-0041-0. [Google Scholar]
  38. Ryu, J.H.; Contor, B.; Johnson, G.; Allen, R.; Tracy, J. System Dynamics to Sustainable Water Resources Management in the Eastern Snake River Plain Aquifer under Water Supply Uncertainty. JAWRA J. Am. Water Resour. Assoc. 2012, 48, 1204–1220. [Google Scholar] [CrossRef]
  39. Royer, P.D.; Tonkin, M.; Hammond, T. Conjunctive Water Use in Confined Basalt Aquifers: An Evaluation Using Geochemistry, a Numerical Model, and Historical Water Level. JAWRA J. Am. Water Resour. Assoc. 2014, 50, 963–976. [Google Scholar] [CrossRef]
  40. Niraula, R.; Meixner, T.; Ajami, H.; Rodell, M.; Gochis, D.; Castro, C.L. Comparing Potential Recharge Estimates from Three Land Surface Models across the Western US. J. Hydrol. 2017, 545, 410–423. [Google Scholar] [CrossRef] [PubMed] [Green Version]
  41. Alley, W.M.; Clark, B.R.; Ely, D.M.; Faunt, C.C. Groundwater Development Stress: Global-Scale Indices Compared to Regional Modeling. Groundwater 2018, 56, 266–275. [Google Scholar] [CrossRef] [PubMed]
  42. Ackerman, D.J. Transmissivity of the Snake River Plain Aquifer at the Idaho National Engineering Laboratory, Idaho; U.S. Geological Survey: Reston, VA, USA, 1991; Volume 39.
  43. Hernandez, H.P. Observations of Recharge to the Wanapum Aquifer System in the Moscow Area, Latah County, Idaho. Master’s Thesis, University of Idaho, Moscow, ID, USA, 2007. [Google Scholar]
  44. Dijksma, R.; Brooks, E.S.; Boll, J. Groundwater Recharge in Pleistocene Sediments Overlying Basalt Aquifers in the Palouse Basin, USA: Modeling of Distributed Recharge Potential and Identification of Water Pathways. Hydrogeol. J. 2011, 19, 489–500. [Google Scholar] [CrossRef] [Green Version]
  45. Bush, J.H.; Dunlap, P.; Reidel, S.P.; Kobayashi, D. Geologic Cross Sections across the Moscow-Pullman Basin, Idaho and Washington; Technical Report; Idaho Geological Survey: Reston, VA, USA, 2018; p. 3.
  46. Candel, J.; Brooks, E.; Sánchez-Murillo, R.; Grader, G.; Dijksma, R. Identifying Groundwater Recharge Connections in the Moscow (USA) Sub-Basin Using Isotopic Tracers and a Soil Moisture Routing Model. Hydrogeol. J. 2016, 24, 1739–1751. [Google Scholar] [CrossRef] [Green Version]
  47. Brooks, E.S.; Boll, J.; McDaniel, P.A. Distributed and Integrated Response of a Geographic Information System-Based Hydrologic Model in the Eastern Palouse Region, Idaho. Hydrol. Process. 2007, 21, 110–122. [Google Scholar] [CrossRef]
  48. Frankenberger, J.R.; Brooks, E.S.; Walter, M.T.; Walter, M.F.; Steenhuis, T.S. A GIS-Based Variable Source Area Hydrology Model. Hydrol. Process. 1999, 13, 805–822. [Google Scholar] [CrossRef]
  49. Moravec, B.G.; Keller, C.K.; Smith, J.L.; Allen-King, R.M.; Goodwin, A.J.; Fairley, J.P.; Larson, P.B. Oxygen-18 Dynamics in Precipitation and Streamflow in a Semi-Arid Agricultural Watershed, Eastern Washington, USA. Hydrol. Process. 2010, 24, 446–460. [Google Scholar] [CrossRef]
  50. Sánchez-Murillo, R.; Brooks, E.S.; Elliot, W.J.; Boll, J. Isotope Hydrology and Baseflow Geochemistry in Natural and Human-Altered Watersheds in the Inland Pacific Northwest, USA. Isotopes Environ. Health Stud. 2015, 51, 231–254. [Google Scholar] [CrossRef] [Green Version]
  51. Finklin, A.I. Climate of Priest River Experimental Forest, Northern Idaho; General Technical Report INT-159 Ogden UT; U.S. Department of Agriculture, Forest Service, Intermountain Forest and Range Experimental Station: Ogden, UT, USA, 1983; Volume 159, 53p. [CrossRef] [Green Version]
  52. Western Regional Climate Center. Cooperative Climatological Data Summaries, NOAA Cooperative Stations, Pullman Experimental Station—Climate Summary. Available online: https://wrcc.dri.edu/cgi-bin/cliMAIN.pl?id6152 (accessed on 9 January 2019).
  53. Northwest River Forecast Center. Temperature and Precipitation Monthly Means. Available online: https://www.nwrfc.noaa.gov/snow/snowplot.cgi?MSCI1 (accessed on 19 April 2021).
  54. Clark, I.D.; Fritz, P.; Fritz, P. Environmental Isotopes in Hydrogeology; CRC Press: Boca Raton, FL, USA, 2013; ISBN 978-0-429-06957-4. [Google Scholar]
  55. Kendall, C.; Caldwell, E.A. Chapter 2—Fundamentals of Isotope Geochemistry. In Isotope Tracers in Catchment Hydrology; Kendall, C., McDonnell, J.J., Eds.; Elsevier: Amsterdam, The Netherlands, 1998; pp. 51–86. ISBN 978-0-444-81546-0. [Google Scholar]
  56. Ingraham, N.L. Chapter 3—Isotopic Variations in Precipitation. In Isotope Tracers in Catchment Hydrology; Kendall, C., McDonnell, J.J., Eds.; Elsevier: Amsterdam, The Netherlands, 1998; pp. 87–118. ISBN 978-0-444-81546-0. [Google Scholar]
  57. Bowen, G.J.; Putman, A.; Brooks, J.R.; Bowling, D.R.; Oerter, E.J.; Good, S.P. Inferring the Source of Evaporated Waters Using Stable H and O Isotopes. Oecologia 2018, 187, 1025–1039. [Google Scholar] [CrossRef] [PubMed]
  58. Bowen, G.J. Spatial Analysis of the Intra-Annual Variation of Precipitation Isotope Ratios and Its Climatological Corollaries. J. Geophys. Res. Atmos. 2008, 113. [Google Scholar] [CrossRef]
  59. Bowen, G.J. Statistical and Geostatistical Mapping of Precipitation Water Isotope Ratios. In Isoscapes: Understanding Movement, Pattern, and Process on Earth Through Isotope Mapping; West, J.B., Bowen, G.J., Dawson, T.E., Tu, K.P., Eds.; Springer: Dordrecht, The Netherlands, 2010; pp. 139–160. ISBN 978-90-481-3354-3. [Google Scholar]
  60. Ellis, A.W.; Barton, N.P. Characterizing the North Pacific Jet Stream for Understanding Historical Variability in Western United States Winter Precipitation. Phys. Geogr. 2012, 33, 105–128. [Google Scholar] [CrossRef]
  61. Zhang, W.; Villarini, G. Uncovering the Role of the East Asian Jet Stream and Heterogeneities in Atmospheric Rivers Affecting the Western United States. Proc. Natl. Acad. Sci. USA 2018, 115, 891–896. [Google Scholar] [CrossRef] [PubMed] [Green Version]
  62. Welker, J.M. Isotopic (δ18O) Characteristics of Weekly Precipitation Collected across the USA: An Initial Analysis with Application to Water Source Studies. Hydrol. Process. 2000, 14, 1449–1464. [Google Scholar] [CrossRef]
  63. Froehlich, K.; Gibson, J.J.; Aggarwal, P.K. Deuterium Excess in Precipitation and Its Climatological Significance; International Atomic Energy Agency (IAEA): Wienna, Austria, 2002; pp. 54–66. [Google Scholar]
  64. Dansgaard, W. Stable Isotopes in Precipitation. Tellus 1964, 16, 436–468. [Google Scholar] [CrossRef]
  65. Kendall, C.; Coplen, T.B. Distribution of Oxygen-18 and Deuterium in River Waters across the United States. Hydrol. Process. 2001, 15, 1363–1393. [Google Scholar] [CrossRef]
  66. Lyon, S.W.; Ploum, S.W.; van der Velde, Y.; Rocher-Ros, G.; Mörth, C.-M.; Giesler, R. Lessons Learned from Monitoring the Stable Water Isotopic Variability in Precipitation and Streamflow across a Snow-Dominated Subarctic Catchment. Arct. Antarct. Alp. Res. 2018, 50, e1454778. [Google Scholar] [CrossRef] [Green Version]
  67. Welker, J.M. ENSO Effects on Δ18O, Δ2H and d-Excess Values in Precipitation across the U.S. Using a High-Density, Long-Term Network (USNIP): Precipitation Isotopes across the USA. Rapid Commun. Mass Spectrom. 2012, 26, 1893–1898. [Google Scholar] [CrossRef]
  68. Unnikrishna, P.V.; McDonnell, J.J.; Kendall, C. Isotope Variations in a Sierra Nevada Snowpack and Their Relation to Meltwater. J. Hydrol. 2002, 260, 38–57. [Google Scholar] [CrossRef]
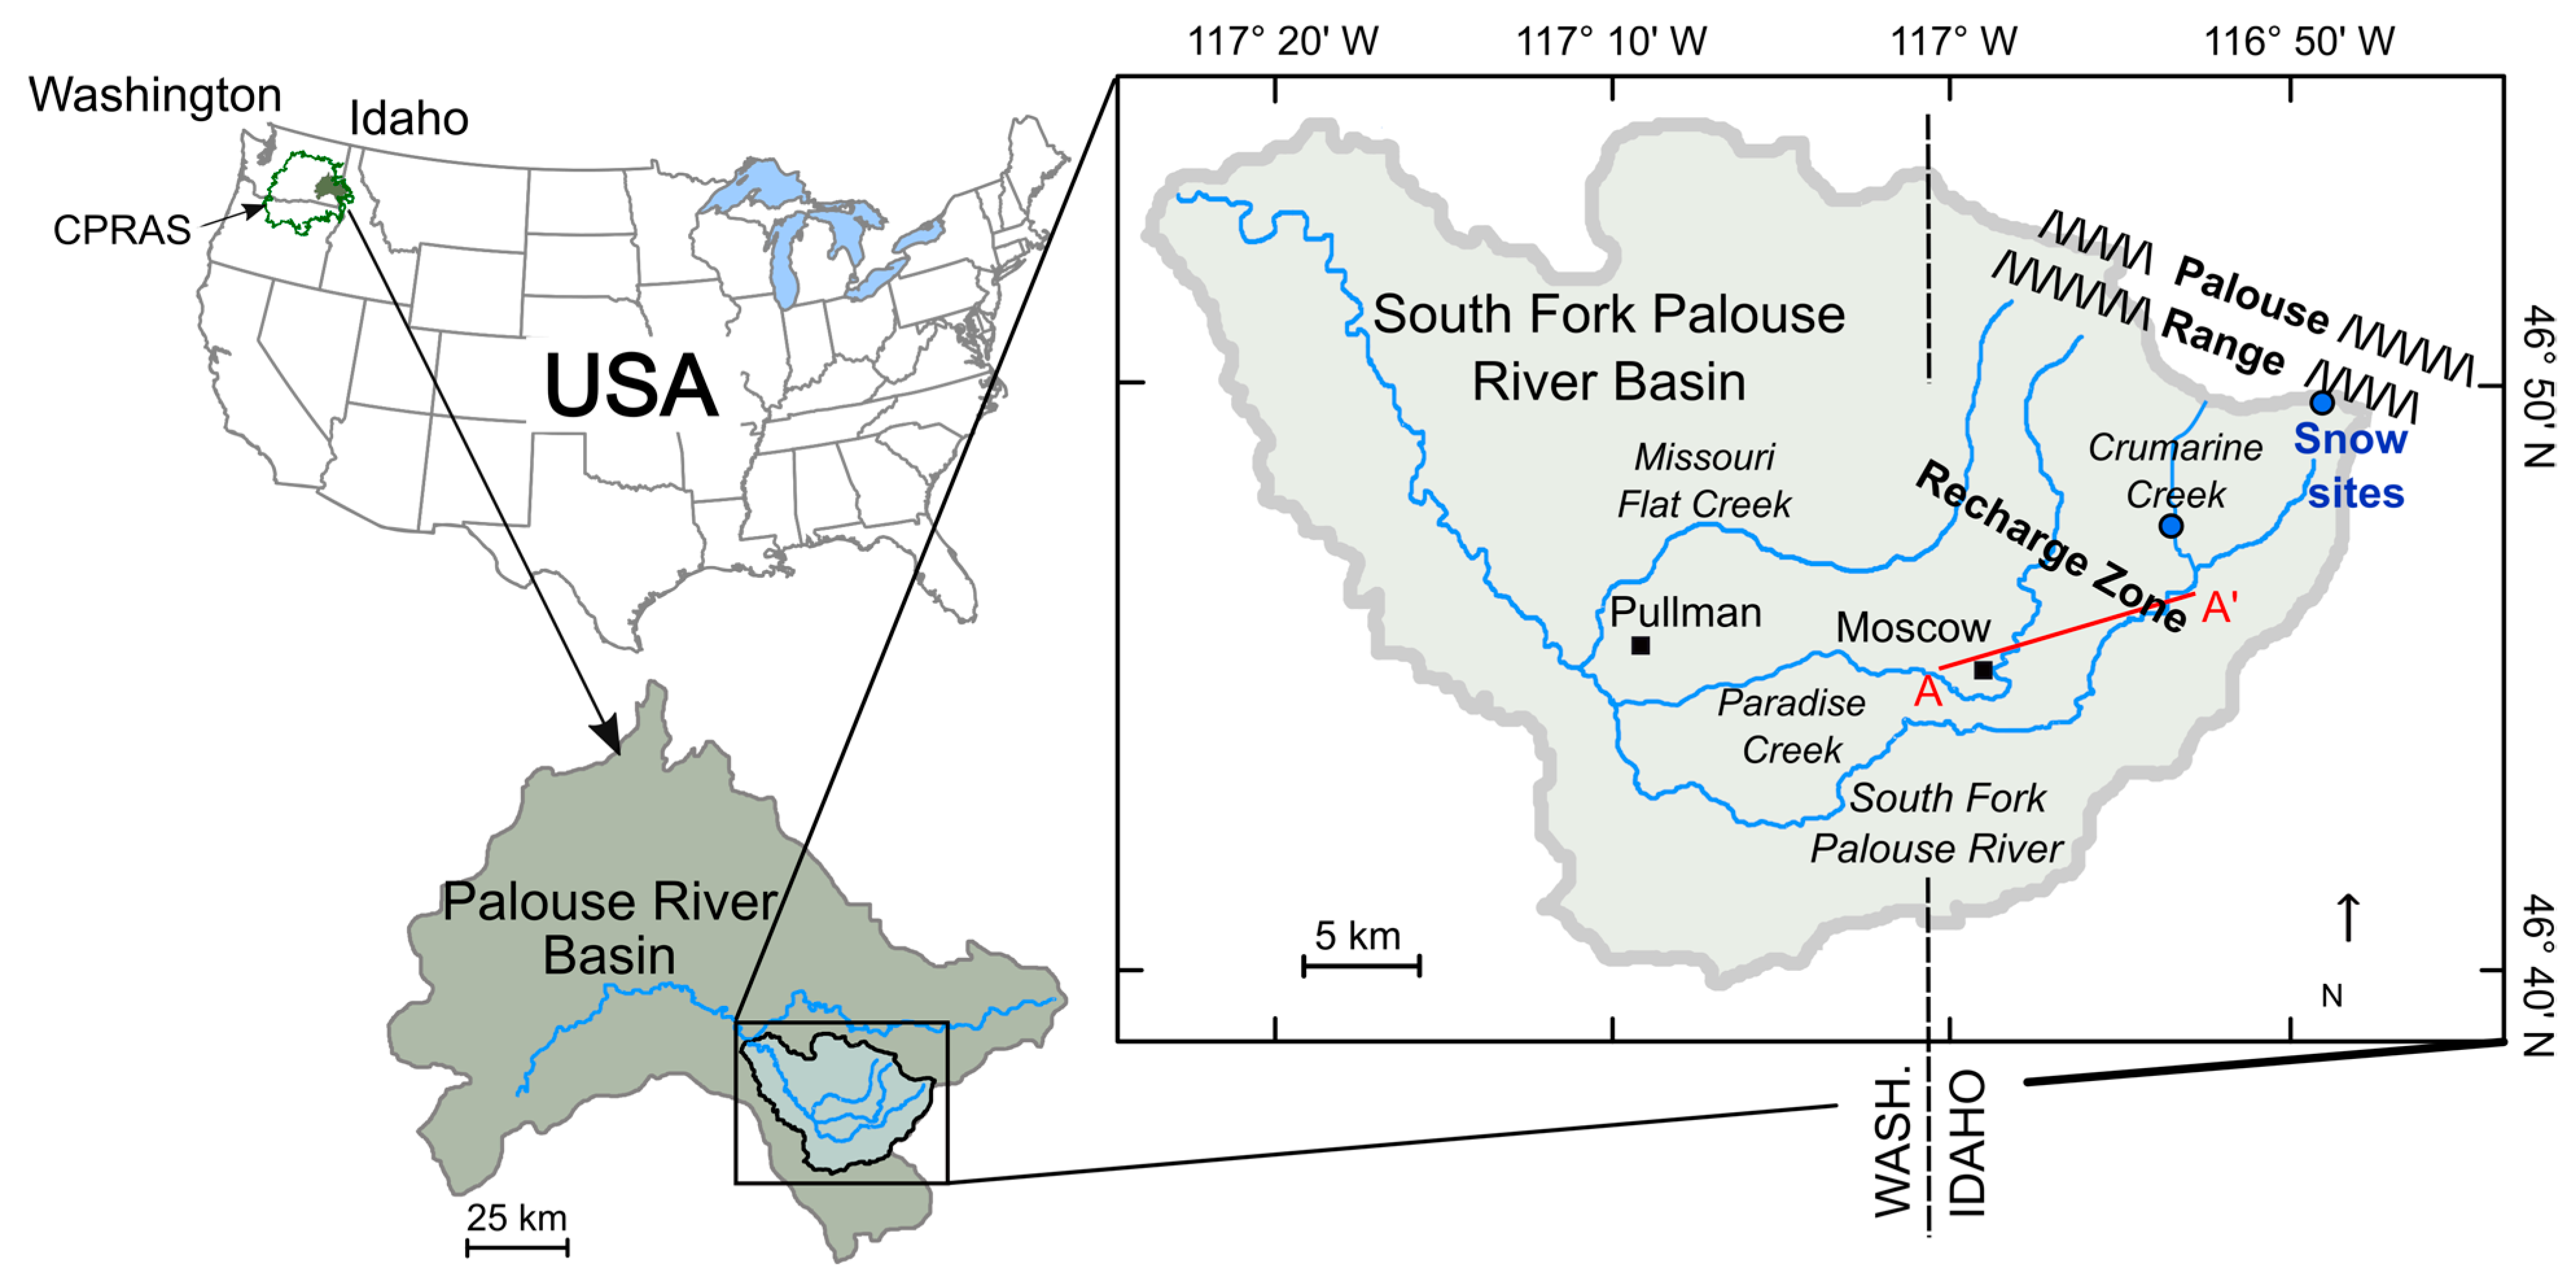
Figure 1. South Fork Palouse River Basin in the Palouse River Basin of the Columbia Plateau Regional Aquifer System (CPRAS), USA (modified from Duckett et al. [15]). Transect A–A’ pertains to the cross section shown in Figure 2.
Geosciences 11 00400 g001
Figure 4. Snowpack of 2019–2020 and average snowpack trend, 1981–2010, for the Natural Resources and Conservation Service snow telemetry site at Moscow Mountain (Site #989) [53].
Geosciences 11 00400 g004
Figure 5. Composited annual streamflow (1979–2020), precipitation (1981–2010), and temperature (1981–2010) for Moscow, Idaho (data from U.S. Geological Survey streamgage at Paradise Creek (3346800) and Western Regional Climate Center climate summary of Moscow, Idaho).
Geosciences 11 00400 g005
Figure 6. Snow/snowmelt collection locations along the eastern Palouse Range from a drone view looking towards Moscow, Idaho. The mountain-front interface is indicated along the lower slope where the forest transitions to farmland and represents the primary recharge zone.
Geosciences 11 00400 g006
Figure 7. Snowmelt collection installation at Site #3.
Geosciences 11 00400 g007
Figure 8. Snow collection at snowpack face from trenching along the sample transect (upper, middle, lower, and composite sample regions labeled).
Geosciences 11 00400 g008
Figure 9. Example of snowmelt runoff in an ephemeral creek in the Palouse Range during spring 2020. In the foreground is a small pond that fills then drains into a subsequent channel.
Geosciences 11 00400 g009
Figure 10. Wells and locations of available water isotope data for bimonthly groundwater samples collected from 2013 to 2015 in the recharge zone [46].
Geosciences 11 00400 g010
Figure 11. δ2H and δ18O for snow, snowmelt, ephemeral creeks, Crumarine Creek, and groundwater in the South Fork Palouse River Basin. The colored trendlines indicate the local meteoric water line (LMWL) for the potential source waters. The Global Meteoric Water Line (GMWL) is shown for reference.
Geosciences 11 00400 g011
Figure 12. Deuterium excess and δ18O in source waters and groundwater in the South Fork Palouse River Basin.
Geosciences 11 00400 g012
Figure 13. Comparison of spring 2020 values of δ2H, δ18O, and deuterium excess for snowmelt and ephemeral creeks (a,c) and snowmelt and rain (b,d).
Geosciences 11 00400 g013
Figure 14. Boxplots of δ18O values for snow, snowmelt, surface water, and groundwater in the South Fork Palouse River Basin. The three included wells contain groundwater with δ18O values that are relatively depleted, mixed, and enriched compared to all groundwater samples collected throughout the recharge zone (Figure 11). Snowpack, snowmelt, ephemeral creek sampling were weighted towards spring-time sampling (enrichment period).
Geosciences 11 00400 g014
Figure 15. Stratigraphy of sediment deposits for wells 22, 23, and 24 (Table 1 and Figure 10), displaying the heterogeneity of the aquifer matrix.
Geosciences 11 00400 g015
Figure 16. Map view of shifts in groundwater δ18O values relative to depleted and enriched values associated with snowmelt and Crumarine Creek, respectively. Arrows indicate locations of perceived faster or more direct recharge pathways containing groundwater with more depleted isotope signals.
Geosciences 11 00400 g016
Table 1. Well information for wells located in the recharge zone along the mountain front of the Palouse Range.
Well No. 1LS Elev. 2 (m)TOS Elev. 2 (m)BOS Elev. 2 (m)TD Elev. 2 (m)Geology of the Screen Interval(s)
(Formation Sequences)
8841.5655.0628.0628.0Basement rock: fractured/weathered granite
9832.0794.0758.0755.0Sediments of Bovill 3: sand and clay
11848.5828.5824.0821.0Basement rock: fractured/weathered granite
14823.5760.0 4750.0 4721.0Basement rock: fractured/weathered granite 5
17829.0791.5785.0785.0Sediments of Bovill: sand and gravel
22817.5775.0712.0712.0Vantage member 6: sand and clay
23827.5805.0798.0765.0Sediments of Bovill: sand and clay
24832.0780.0771.0739.0Vantage member: sand with fingers of Lolo basalt
26817.5800.0792.0771.0Vantage member: clay and sand with fingers of Lolo basalt
27824.0771.0760.0757.0Sediments of Bovill: clay, sand, weathered granite (basement)
28832.0763.5759.5759.5Vantage member: sand and clay
29839.0755.0751.0746.0Basement rock: fractured/weathered granite
35950.0880.0 4856.0856.5Basement rock: fractured/weathered granite 7
1 Well number corresponds to well numbers assigned in Candel et al. [46]. 2 Elevation in meters referenced to NAVD88. 3 Sediments of Bovill (Miocene) are an upper layer of the Latah Formation consisting of clay, silt, sand, and gravel [19,20,37]. 4 Screen interval elevation estimated from adjacent wells indicating productive strata at this interval. 5 Geology was interpreted from a nearby well because of missing information in the well log. The nearby well was drilled to a similar depth, indicated fractured granite at a depth of 6 m below land surface, and was screened in the fractured granite. 6 Vantage member (Miocene) is a middle layer of the Latah Formation that consists of interlayered sand, silt, and clay and may contain wood fragments and poorly sorted sand units indicative of landslides [18,19,45]. 7 Geology was interpreted from two nearby wells because of missing information in the well log. The nearby wells were drilled to a similar depth, indicated fractured granite at a depth of 5 m below land surface, and were screened in fractured granite. LS, land surface; TOS, top of screen; BOS, bottom of screen; TD, depth or bottom of well; basement rock, granite forming the mountain-front interface; all well information was derived from drill logs from the Idaho Department of Water Resources.
Table 2. Groundwater groupings based on an interpretation of median δ18O values and mean rank of the distribution of δ18O values by well location.
GroupWell NumberNo. of SamplesMedian (‰)Mean RankBottom of Screen Elev. (NAVD 88)Screen
Matrix
Group
Median (‰)
Group
Mean Rank
PCA, 1st component loading:0.78 0.780.4848% of variance explained
Depleted δ18O source(s)2338−16.4857798sand−15.85166
860−15.93146628granite
2257−15.84157712mixed
952−15.85173758sand
2958−15.66258751granite
Mixed δ18O source(s)2644−15.47373792clay−15.42393
1450−15.48374750clay
2859−15.43384760sand
1714−15.40415785clay
1158−15.37427824granite
Enriched δ18O source(s)2458−15.26467771sand−15.17526
3556−15.14556856granite
2747−15.06562760granite
Median: median of δ18O values for each well data set; Mean rank, distribution rank for all δ18O values in each well’s data set; elev., meters above North American Vertical Datum 1988 (NAVD 88); Screen matrix, dominant sediment or weathered rock type in the screened interval; Group mean rank, distribution rank of relative groups of depleted, mixed, and enriched groundwater δ18O values; PCA, principal components analysis.
Publisher’s Note: MDPI stays neutral with regard to jurisdictional claims in published maps and institutional affiliations.