Article

Mineralogical and Microstructure Analysis for Characterization and Provenance of Ceramic Artifacts from Late Helladic Kastrouli Settlement, Delphi (Central Greece)

by
Vayia Xanthopoulou
1,2,3,
Ioannis Iliopoulos
1,2,3,4 and
Ioannis Liritzis
1,5,6,*
1
Key Research Institute of Yellow River Civilization and Sustainable Development, School of Geography & College of Environment and Planning, Henan University, Kaifeng 475001, China
2
Department of Geology, University of Patras, 26500 Rio Patras, Greece
3
Laboratory of Electron Microscopy and Microanalysis, School of Natural Sciences, University of Patras, 26500 Rio Patras, Greece
4
ERAAUB, Departament d’Història i Arqueologia, Facultat de Geografia i Història, Universitat de Barcelona, 08001 Barcelona, Spain
5
Laboratory of Achaeometry, Department of Mediterranean Studies, University of the Aegean, 85132 Rhodes, Greece
6
Department of Archaeology, School of History, Classics and Archaeology, College of Arts, Humanities & Social Sciences, The University of Edinburg, 4 Teviot Pl, Edinburgh EH8 9AG, UK
*
Author to whom correspondence should be addressed.
Geosciences 2021, 11(1), 36; https://doi.org/10.3390/geosciences11010036
Submission received: 9 November 2020 / Revised: 2 January 2021 / Accepted: 7 January 2021 / Published: 13 January 2021
(This article belongs to the Section Geochemistry)

Abstract

:
The present study deals with the characterization of a ceramic assemblage from the Late Mycenaean (Late Helladic III) settlement of Kastrouli, at Desfina near Delphi, Central Greece using various analytical techniques. Kastrouli is located in a strategic position supervising the Mesokampos plateau and the entire peninsula and is related to other nearby coeval settlements. In total 40 ceramic sherds and 8 clay raw materials were analyzed through mineralogical, petrographic and microstructural techniques. Experimental briquettes (DS) made from clayey raw materials collected in the vicinity of Kastrouli, were fired under temperatures (900 and 1050 °C) in oxidizing conditions for comparison with the ancient ceramics. The petrographic analysis performed on thin sections prepared from the sherds has permitted the identification of six main fabric groups and a couple of loners. The aplastic inclusions recognized in all fabric groups but one confirmed the local provenance since they are related to the local geology. Fresh fractures of representative sherds were further examined under a scanning electron microscope (SEM/EDS) helping us to classify them into calcareous (CaO > 6%) and non-calcareous (CaO < 6%) samples (low and high calcium was noted in earlier pXRF data). Here, the ceramic sherds with broad calcium separation are explored on a one-to-one comparison on the basis of detailed mineralogical microstructure. Moreover, their microstructure was studied, aiming to estimate their vitrification stage. The mineralogy of all studied samples was determined by means of X-ray powder diffraction (XRPD), permitting us to test the validity of the firing temperatures revealed by the SEM analysis. The results obtained through the various analytical techniques employed are jointly assessed in order to reveal potters’ technological choices.

1. Introduction

The Late Mycenaean (Late Helladic III) settlement of Kastrouli is located about 3 km east of Desfina and southeast of one of the most important sanctuaries of Greek antiquity Delphi (Figure 1). The archaeological site of Kastrouli was discovered by Dasios [1] and Raptopoulos [2] continued with the rescue excavation and cleaning of three Mycenaean graves unearthed therein. The systematic investigation of the site was the focus of a new Project started in 2016 by the University of the Aegean and the University of California San Diego [3,4] and with subsequent excavation in 2017 and 2018 [5,6]. The Mycenaean site of Kastrouli is located on a 700 m height hill having a strategic position for controlling the Mesokampos plateau and is certainly related to other coeval settlements in the vicinity. Throughout centuries, the Kastrouli fort was a checking point controlling the communication between the two important harbors of Itea and Antikyra and possibly a seaport at Steno [7,8]. Recently it has been identified as the Homeric site of Anemoreia in Homer’s Catalogue of Ships (Iliad, 2.521). Although the site is not discussed more by Homer with its heroes, Schedius and Epistrophus, remaining among the most obscure [7,9].
The findings brought to light through the excavation campaign include figurines of type phi and psi, fragments of gold jewelry, animal bones and many human bones adhere to skeletons (degraded burials). Of special interest is the large amount of pottery unearthed, which includes fragments of amphorae, deep and shallow cups as well alabasters [3,5]. Based on typology and decoration the pottery has been dated to the Late Helladic III (LH III) period [10]. More information about the typology of LH III pottery from Kastrouli are given elsewhere [11,12]. Earlier analytical work on the Kastrouli unearthed finds includes luminescence dating of the tomb and ceramics [13,14] characterization study by portable XRF [12,15] and aDNA collagen [16,17]. Characterization, provenance and firing ceramic technology have been reported in various cases in the past [12,18].
The present study is a follow up of earlier work (see above relevant references) and deals with a major analytical task involving the mineralogical and petrographic study of a ceramic assemblage from the Late Mycenaean (Late Helladic III) settlement of Kastrouli, aiming to unveil their technological characteristics in terms of their microtexture and the determination of firing temperature. Furthermore, experimental briquettes (DS) prepared from clayey raw materials collected in the vicinity of the settlement were fired at temperatures 900 and 1050 °C, in order to compare them with the ancient ceramics in terms of mineralogy for provenance purposes. We herein report the results of the petrographic description, mineralogical determination and micro-textural analysis of the ceramic samples. Our aim is to explore the ceramic artifacts provenance and unveil the firing technology through the evaluation of the sintering of the ceramic pastes and the identification of the new formed mineral phases and shed light to the degree of ceramic technology development in the periphery of Mycenean World.

2. Geological Setting

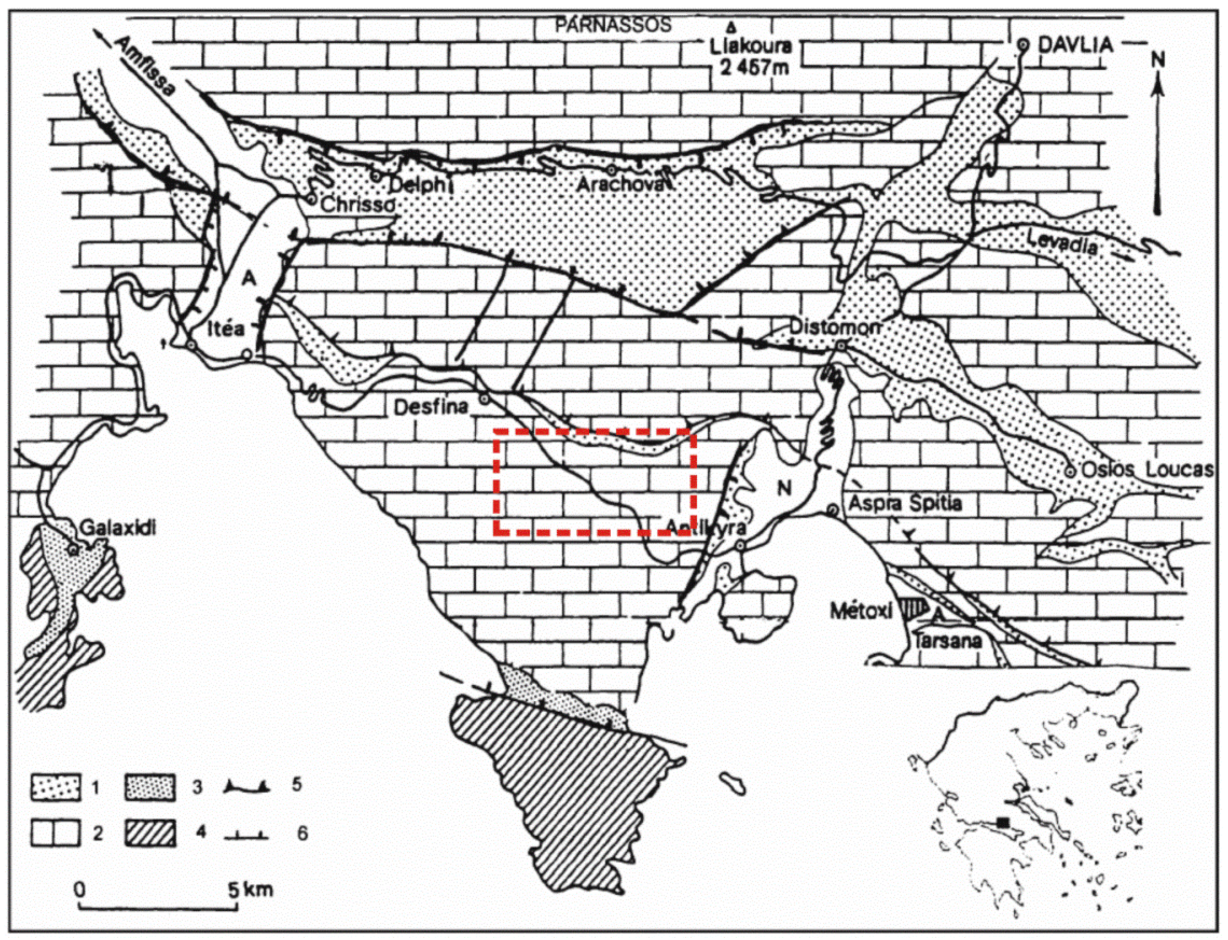
The broader region of Kastrouli consists mainly of Alpine formations of the Parnassus-Ghiona zone and is partly covered by Neogene-Quaternary terrestrial loose deposits. At the coastal zone south of Kastrouli there is a small outcrop of Pindos Zone (Figure 2). The Parnassus-Ghiona zone consists of a limestone sequence with bauxite intercalations. Limestones are neritic, medium to thick bedded of Triassic to Cretaceous age and are underlain by flysch [19,20], which comprises brown-red siltstones, mudstones and sandstones.

3. Materials and Methods

A total of forty ceramic sherds were selected from well stratified digitally recorded loci ([4,11], their Figure 2 i.e., tomb, and house foundations ~30 cm below surface), for further laboratory analysis through mineralogical, petrographic and microstructural techniques. Petrographic analysis was performed on thin sections made from the ceramic samples, using a Zeiss AxioScope A1 polarizing microscope coupled with a Jenoptik ProgRes C3 digital camera. Their petrographic description was undertaken following the classification scheme proposed by Whitbread [21]. Fresh fractures obtained from some of the ceramic sherds were examined under the scanning electron microscope (SEM), aiming to characterize their microstructure and identify their firing temperature. The microstructural examination and the microanalysis were performed on gold coated specimens of the pottery using a JEOL 6300 SEM equipped with an energy dispersive spectrometer (EDS), in the Laboratory of Electron Microscopy and Microanalysis at the University of Patras, Greece.
The clayey raw materials (n = 8), labeled DS from Desfina Soils, were collected from the banks of streams close to Kastrouli settlement and come from Quaternary sediments originate from the flysch of Parnassus-Ghiona zone. They are mainly characterized by a good workability, apart from sample DS5 (Table 1). Workability encompasses significant properties of clays expressing how plastic they are. Table 1 shows the color (based on Munsell Chart) of the unfired raw materials. All the studied samples were coarsely ground, mixed with tap water and left to soak a few days. Excess water was subsequently removed and the clays were left to dry to a workable state, at which point three briquettes were prepared from each sample. The (DS) briquettes were left to dry for a week at room temperature and subsequently were fired at different temperatures (900 and 1050 °C). Firing took place in oxidizing conditions, with the maximum temperature being held for 6 h and the briquettes left to cool to room temperature with the oven door closed. The briquettes were then left at room temperature for at least one week, allowing any lime re-hydration to develop and subsequently to observe its impact on the fabric consistency. All the briquettes were then thin sectioned and examined under the polarizing microscope.
The mineralogy of all studied samples was determined by means of X-ray powder diffraction (XRPD) using a Bruker D8 Advance diffractometer in the Department of Geology, University of Patras, Greece. The diffractometer is equipped with a Ni filtered Cu-Ka tube, operates at 40 kV/40 mA and employs a Bruker Lynx Eye fast detector. The evaluation of the diffractograms obtained was performed using the DIFFRACplus EVA software (Bruker-AXS, Madison WI, USA) based on the ICDD Powder Diffraction File (2006 version). More details for the diffractometric analysis can be found elsewhere [16,22,23,24].

4. Results and Discussion

Analysis of the Ceramic Sherds

The results obtained from the analysis of the ceramic sherds were provided by means of their petrographic examination through optical microscopy, their mineralogical evaluation through X-ray powder diffraction (XRPD) and complementary scanning electron microscopy (SEM/EDS) performed on 27 selected sherds, aiming to observe microstructural changes due to firing and obtain compositional information for the clay matrix.

4.1.1. Petrographic Description of the Ancient Ceramics

The thin section petrographic analysis of the sherds from Kastrouli led to their assignment in six main petrographic fabric groups, whereas some few of them were unclassified (i.e., loners) due to their peculiar petrographic characteristics. The detailed systematic description of the various fabrics was based on the examination of thin sections under the polarizing microscope (Zeiss Axioscope A1). The grouping assessment was based on the specific compositional and textural characteristics shared amongst the studied samples. The six main groups—Groups 1, 2, 3, 4, 5, Fine (with four sub-groups), and the Loners (Fine and Coarse)—are described below.
Fabric Group 1: Quartz-Fabric Group
Fabric group 1 comprises five samples (K21, K22, K24, K28 and K59) and is mainly characterized by the predominant presence of the semi-fine (<1 mm) silicate inclusions. Its micromass interference color ranges from reddish dark brown, yellowish brown and reddish brown to brownish or grayish red (Figure 3a–c). Interference colors constitute a mean for evaluating the composition of the raw material and/or the atmosphere conditions inside the kiln. Grey interference colors may be attributed to reducing or incomplete firing conditions. Red color of the matrix is indicative of the presence of hematite or the possible oxidation state of iron, thus reflecting oxidizing conditions. Orange and yellowish hues of the interference colors are due to the calcareous raw material. The optical state of the micromass (ranges from moderate optically active to optically active. Sample K22 is distinguished from the rest due to its inhomogeneity in terms of the distribution of the interference colors, showing a brownish red interference color at the core and a dark red interference color at the rim (dark brown and reddish brown under PPL, respectively). The porosity is less than 5% of the field and is represented mainly by meso-vughs. The grain size distribution of the aplastic inclusions is characterized by c:f:v10μ ratio around 3:72:5, they are moderately sorted and exhibit a double-spaced porphyric related distribution. Monocrystalline quartz is the predominant constituent and its size ranges up to the fine sand class (<0.15 mm), reaching only rarely the coarse sand (<0.72 mm). The brown and white micas are significantly fewer and their size falls in the class of coarse silt (<0.04 mm). Samples K28 and K59 (Figure 3d) are considered as outliers to the group due to the presence of specific aplastic inclusions and textural characteristics. Sample K28 exhibits higher packing, whereas the particle size reaches up to very coarse sand (~1.1 mm). Its dominant constituents are represented by quartz, polycrystalline quartz, whereas plagioclase, quartzite fragments, biotite, sandstone clasts with iron cement and decomposed calcite due to the firing conditions were sporadically observed. In sample K59, the grain size of the aplastics reaches up to the class of medium sand (~0.3 mm). Thermally altered serpentinite (with brown and orange interference colors) and gneiss fragments are rare.
Fabric Group 2: Flysch Fabric
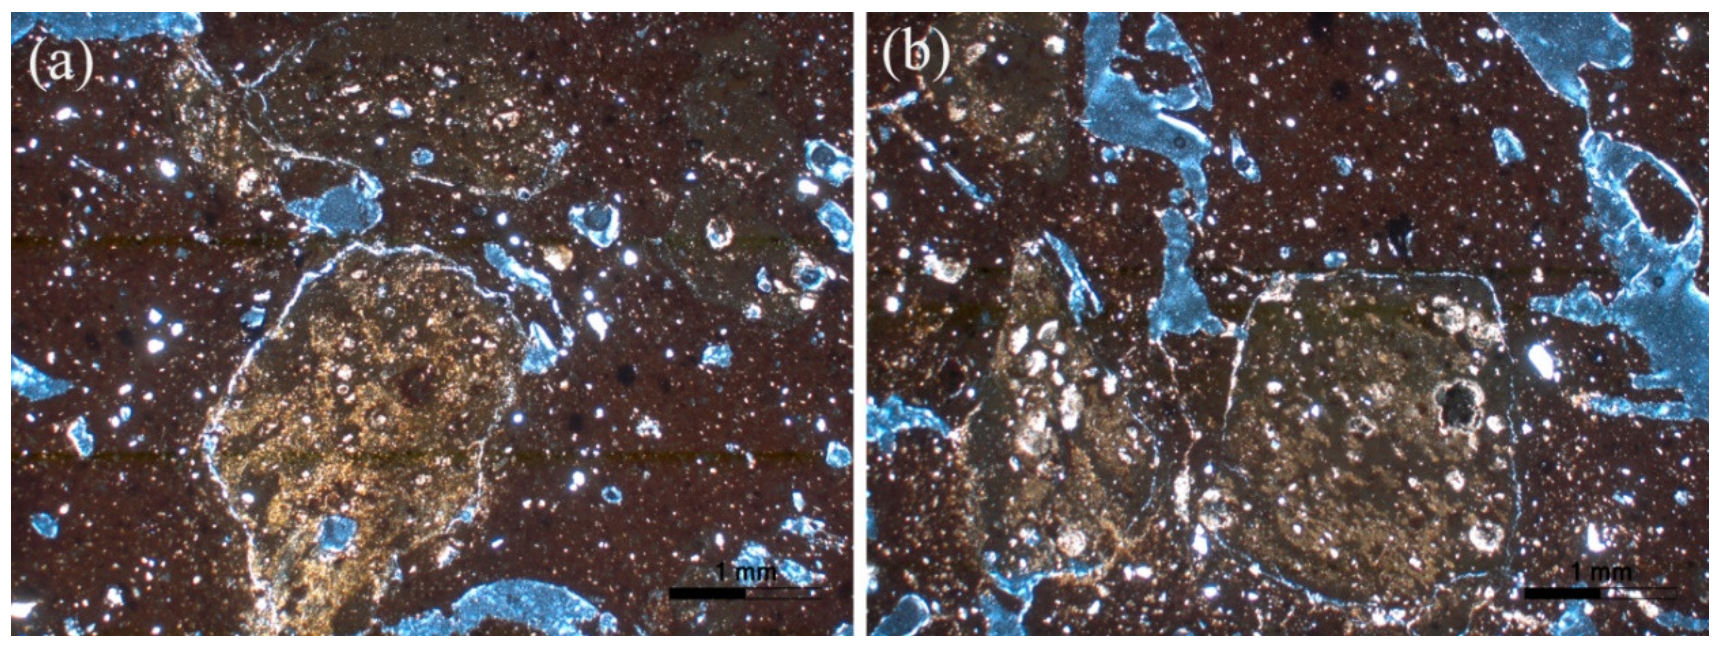
Fabric group 2 encompasses four samples (K3, K123, K125 and K126) and is represented mainly by the presence of fragment of various types of clastic sedimentary rocks (e.g., siltstones and sandstones), which are attributed to a flysch formation. It is characterized by an optically active clay matrix with dark grayish brown to reddish brown interference colors. The size, angular shape and distribution of flysch fragments suggest that they were intentionally added as temper. The grain size reaches up to the class of the very coarse sand (~1.8 mm). The porosity is less than 5% and is represented by meso-planar voids and meso-vughs. Inclusions have a c:f:v10μ ratio around 30:65:5 exhibiting a closed-spaced porphyric related distribution (Figure 4a,b). In the case of sample K123 pores are oriented parallel to the external surface of the artifact, whereas the grains exhibit a higher packing than the rest of the samples belonging to this group. Flysch fragments are the dominant inclusions, while monocrystalline quartz is frequent. The presence of muscovite is common, whereas plagioclase is rarely encountered. Similarly, polycrystalline quartz, zircon and gypsum and sandstone fragments have been rarely noticed.
Fabric Group 3: Fossiliferous Limestone Fabric
Fabric group 3 is a small group represented by only two samples (K8 and K84), which are differentiated due to the presence of fossiliferous limestone fragments (Figure 5a,b). Its clay matrix is moderately optical active with reddish brown interference color. The particle size reaches up to pebbles size class (<5 mm). The porosity is represented by macro-vughs and is around 3%. The grain size frequency distribution is bimodal and an open close-spaced related distribution is evident, while the aplastic inclusions have a c:f:v10μ ratio around 20:77:3. The predominant constituent is the fossiliferous limestone fragments and their prominent angularity is indicative of tempering. Sandstone fragments are only rarely encountered and have an iron oxide cement. The finest inclusions are represented by quartz and micrite which are the dominant constituents in the fine fraction, whereas plagioclase has been rarely noticed. The size of the fine aplastic inclusions does not exceed the very fine sand class size (<0.1 mm).
Fabric Group 4: Mudstone Tempered Fabric
This fabric group consists of three samples (K4, K7 and K127) bearing inclusions which are mainly sized up to granules size class (<2.8 mm) and are predominantly composed of angular mudstone fragments. The micromass is optically active but interference color variability across the samples of this fabric is significant. Sample K4 exhibits brownish olive interference color, whereas samples K7 and K127 have a yellowish-brown interference color (Figure 6b). The porosity is less than 5% and is represented mainly by meso- and less by macro-planar voids which are orientated parallel to the external surface of the artifacts. Inclusions have a c:f:v10μ ratio 20:75:5, exhibiting a bimodal grain size distribution and an open-spaced porphyric related distribution. Limestone fragments are also present. The rest of the constituents such as mono- and poly-crystalline quartz and micrite are sized up to fine sand class (<0.2 mm) and are fewer. A chert fragment and a limestone (sparitic) fragment were identified only in samples K4 and K7, respectively (Figure 6a).
Fabric Group 5: White Mica Fabric
The fifth fabric group consists of six samples (K2, K12, K27, K85, K95 and K124), which has as main characteristic feature the micaceous clay matrix. The grain size reaches up to the coarse silt size class (<0.05 mm). The micromass interference color ranges from reddish brown to yellowish brown and is moderately optically active (Figure 7a–d). White mica is the dominant mineral, whereas brown mica is fewer and monocrystalline quartz is common. Samples K2 and K95 contain few decomposed micrite grains, whereas sample K12 has few coarse sandstone fragments with cement rich in iron oxides. Plagioclase and epidote were only rarely noticed.

4.1.2. Fine Fabric

For a significant number of samples (13 out of 40) their attribution to a specific group in terms of the composition of their aplastic inclusion was hindered due to their significantly fine size. For this reason, our effort was to group them mainly based upon their textural features and less upon their composition in terms of their aplastic inclusions.
Fine Fabric Group F1
This group encompasses four samples (K18, K62, K76 and K81). The inclusions are sized up to fine sand (<0.18 mm) and their packing is around 30%. There are very few inclusions that are sized from 0.2 to 0.6 mm (medium to coarse sand). They exhibit a continuous grain size distribution and single- to double-spaced porphyric related distribution. The micromass is moderately optically active and exhibits very dark brown interference color (Figure 8a,d). Monocrystalline quartz is the dominant constituent, whereas white mica is common. Iron clay pellets with diffuse boundaries are few.
Fine Fabric Group F2
The samples assigned to this group (K9, K26, K70 and K71) are characterized by the smaller abundance of aplastic inclusions (10%) in relation to the “Quartz”-fabric group (Fabric group 1). The grain size reaches up to the class of coarse silt (<0.04 mm) and the inclusions exhibit open-spaced porphyric related distribution. Its micromass has interference color which ranges from reddish brown to dark brown (Figure 8b). All the samples have as dominant constituents the quartz and micas. The latter are mainly represented by laths of sub-idiomorphic biotite and less of muscovite flakes. K-feldspar has also been encountered.
Fine Fabric Group F3
This group consists of three samples (K46, K57 and K112), which exhibit a very pure clay matrix with only rarely present monocrystalline quartz. Micromass has orange to olive interference color and ranges from moderately optically active to optically inactive, whereas the sintering of the clay matrix is apparent (Figure 8c). Amorphous (Acf) and textural (Tcf) concentration features, such as iron-rich clay pellets and opaque material, respectively, have been also observed.
Fine Fabric Group F4
This group comprises only two samples (K1 and K20), which are characterized by a crystallitic and striated b-fabric. Their micromass has an interference color that ranges from yellowish to olive brown and is optically active Micritic calcite and quartz are frequent, whereas white and brown micas are common. Plagioclase was encountered only rarely. Secondary calcite has been precipitated within the micromass as fine-grained calcite or has been deposited in the voids in the form of micro-sparite, due to the post-depositional conditions.

5. Loners

5.1. Coarse Fabrics

Sample K6 is characterized a non-calcareous clay matrix and the bimodal distribution of the aplastic inclusions. They also exhibit a closed-spaced porphyric related distribution. The coarse:fine (c:f) ratio is 30:70. The micromass is optically active and has a dark brown interference color (Figure 8e). The size of most of the inclusions ranges from the fine sand to medium sand with a mode around 0.36 mm and is composed by monocrystalline quartz, micritic limestone and K-feldspars. The coarser of the inclusions reach up to the class of pebble (4 mm) and are represented by fragments of limestone (sparitic) and shale. Another characteristic is the presence of textural concentration features (Tcf), such as clay pellets.
Sample K16 is characterized by a sandwich structure and the micromass interference color is dark brown in the core and light yellow to yellowish brown in the margins. Regarding its optical state, it is optically active in the core and slightly optically active in the margins of the artifact. The aplastic inclusions are sized up to the granules class size (2.4 mm), exhibit a moderate sorting and have an open- to close-spaced porphyric related distribution (Figure 8f). The coarse:fine (c:f) ratio is 10:90, whereas the void percentage is under 1%. Monocrystalline quartz is the dominant constituent, whereas polycrystalline quartz and limestone fragments are fewer. Fragments of marble, siltite, mica schist and chert as well as grains of plagioclase are rare constituents.
Sample K48 is rich in angular mudstone fragment and exhibits a bimodal distribution, which is indicative of tempering. The grain size reaches up to granules class size (3.6 mm) and exhibits an open- to close-spaced porphyric related distribution. The interference color of the micromass is light brown, whereas is grayish in the rim of the artifact. Micromass is optically active throughout the whole field. The coarse:fine (c:f) ratio is 5:95 and the participation of voids very low (<%). Shale fragments, micritic limestone and calcarenite fragments are few. The fine inclusions are represented mainly by micritic limestone, micritic calcite and quartz.
Sample K51 is characterized by an inhomogeneous calcareous micromass. The interference color ranges from yellowish and reddish brown to grayish brown, whereas a “sandwich” structure has been observed. Optical activity is moderate. It exhibits a crystallitic b-fabric and has an open-spaced porphyric related distribution. The grain size reaches up to the pebble class size (4 mm), whereas the inclusions are poorly-sorted. The coarse:fine (c:f) ratio is 5:95 and the voids presence is under 1%. The coarse fragments are represented by the dominant participation of siltstone, flysch-related and limestone fragments and rare calcarenite fragments with opaque minerals. The fine fraction is represented by quartz, micritic calcite and less white and brown mica.

5.2. Fine Fabrics

Sample K19 is characterized as a very fine fabric with a striated b-fabric. The micromass has an olive interference color and is optically inactive (Figure 8g). Silt sized quartz and white and brown mica are rarely encountered. Iron-rich argillaceous inclusions with diffuse boundaries have also been observed.
Sample K23 is rich in very fine quartz, which is the predominant constituent. The micromass has an olive brown to grayish interference color and is moderately optically active (Figure 8h). Clay pellets with diffuse and clear boundaries are encountered.
Sample K78 is a very fine fabric with predominant constituent the white mica. It is characterized by an optically active micromass which has a yellowish-brown interference color. Monocrystalline quartz is common, and the size of the inclusions is finer than the coarse silt (<0.045 mm).

5.2.1. X-ray Powder Diffraction (XRPD) Analysis of the Ancient Ceramics

The evaluation of the X-ray diffractograms led to the establishment of five main mineralogical classes (Ia, Ib, III, IV and V), based upon the determination of the mineralogical phases. The mineralogical phases that were recognized are quartz, calcite, plagioclase, k-feldspar, illite, gehlenite, diopside, hematite and rarely, analcime. All the mineralogical assemblages for each class are given in Table 2.
The equivalent firing temperature (EFT) of the ancient ceramics was estimated according to the mineralogical assemblages that represent each class, as well as the presence of diagnostic minerals which either are decomposed (e.g., calcite, phyllosilicates) or newly formed (e.g., clinopyroxene, gehlenite), depending on the firing conditions. Analcime was detected in few samples, as a product of the post-depositional alteration of the glassy phase developed in the higher fired pottery [25].
The first class (I) includes twelve samples and is further subdivided in two sub-classes (Ia and Ib) due to the presence or absence (or trace contents) of calcite in class Ia, which suggests a different composition (Figure 9). Subclass Ia encompasses only two samples and is represented by the mineralogical assemblage quartz + calcite + illite + plagioclase (all assemblages are given in diminishing order of mineral presence). Subclass Ib includes ten samples and has the mineralogical assemblage quartz + illite + plagioclase ± calcite ± k-feldspar ± hematite.
Class II is represented by two samples that are characterized by the mineralogical assemblage quartz + calcite + illite + plagioclase + gehlenite and is differentiated from class I because of the gehlenite presence. The presence of the basal reflection (001) of illite in the diffractogram (Figure 9) indicates that the firing temperature did not exceed ~850–950 °C, which is further confirmed by the gehlenite presence.
The mineralogical class III encompasses twelve samples and is characterized by the assemblage quartz + diopside + plagioclase + k-feldspar ± hematite ± illite. The low intensity and the width of the main peak of diopside indicate a non-well crystallized phase (Figure 9), a fact that helps us estimate a firing temperature around ~850–950 °C.
Class IV includes five samples and is characterized by the mineralogical assemblage quartz + diopside + plagioclase ± gehlenite ± K-feldspar ± analcime (Figure 9). Diopside reflections are higher, thus differentiating this class from class V. The diopside intensities in class V are higher suggesting the higher content of diopside (Figure 9). Furthermore, the presence of calcite in class V and in such high temperature indicates a secondary origin, formed by the filtration of calcareous water solution during burial conditions, followed by the recrystallization of secondary calcite.

5.2.2. Scanning Electron Microscopy (SEM/EDS)

A selection of the pottery samples, (n = 27), were examined under the scanning electron microscope aiming to recognize any microtextural changes occurred due to the firing conditions and obtain compositional information for the clay matrix. SEM results will complement those obtained from the petrographic analysis as well as the X-ray powder diffraction analysis, focusing on the ceramic microstructure and estimating eventually the firing temperature, in relation to equivalent Teq (Table 3) [26,27,28]. The study of the microtexture of the ceramic samples and the microanalyses performed by means of EDS, revealed two main compositional groups, based on the semi-quantitative estimation of the chemical composition of the ceramic samples.
The first group includes thirteen samples and is characterized as calcareous (CaO > 6 wt. %). Seven samples (K7, K9, K20, K21, K84, K85 and K112) from the calcareous group show a collapse of clay minerals shape due to the process of the dehydroxylation (Figure 10a–f). This in turn favors the development of sintering as the particles join together, occasionally forming smooth areas and filaments indicative of initial vitrification stage. These features indicate a relatively high temperature of firing and specifically around 850–950 °C. This is in accordance to the firing temperatures estimated through XRPD, except for samples K84 and K112. The microtexture of these later samples suggests a higher temperature than that recorded for the rest ones falling in this group, without however exceeding 900–1100 °C. Extensive vitrification and the formation of fine bloating pores are common in samples K18, K23, K24, K51, K85 and K95 (Figure 10g–i) of the same group. In calcareous ceramic samples these structures usually indicate a firing temperature in the range of 900–1100 °C [26]. However, the presence of illite in samples K51 and K95 indicates that the temperature did not exceed 950 °C.
The second group encompasses fourteen samples which have a low content of CaO (<6 wt.%). Samples K3, K4, K6, K16, K22, K26, K28, K46, K78 and K123, show the development of smooth areas, the sintering of the particles and the formation of vitrified areas (Figure 11a–d). The estimated firing temperature is about 850–950 °C and concurs with the one determined through XRPD analysis. In sample K2, clay minerals maintain the characteristic flakes, a fact which indicates a low firing temperature (<700 °C). This result contrasts with XRPD outcome, wherein a higher firing temperature was estimated. Samples K59, K62 and K70 exhibit an extensive vitrification and the formation of a cellular structure with bloating pores. These features are usually produced in non-calcareous clays and in temperature range 900–1100 °C [26].

5.3. Analysis of the Clayey Raw Material and Firing Test

The quest of the starting material is a key aspect for unveiling ancient ceramic manufacture. The clay samples collected from the study area were treated in order to prepare experimental briquettes which had permitted us to document the clay materials behavior during molding and their response to the various firing regimes through the identification of the mineral phase transformations. This could be a mean of comparison with the archaeological ceramics and determination of their provenance.

5.3.1. Petrographic Description of the Experimental Briquettes

Petrographic description of the experimental briquettes was performed in order to be compared texturally and compositionally with the ancient ceramics and to determine the provenance of their raw materials. At 900 °C the clay minerals sinter and adhere together contributing to the reduction of the optical activity. The dominant constituents are monocrystalline quartz and fragments of mudstone and siltstone, whilst brown mica still persists in sample DS1 (Figure 12). The micromass is optically inactive and its interference color tends to be darker and ranges from yellowish brown and olive brown to dark olive. In higher temperature (1050 °C), the sintering is extensive and the remained inclusions are quartz and brown mica. The photomicrograph of sample DS7 fired at 1050 °C shows the “calcite ghost”, which is deposited in the edges of the pores. The interference color of the micromass is getting darker and is olive, brownish olive and grayish olive. In comparison with the ancient ceramics, it is worth noting the presence and preservation of brown mica as well as the participation of the mudstone fragments, which offer evidence for the local provenance of some of the studied ancient ceramics.
The samples DS3 and DS4 are described individually due to the formation of the core and margins and the absence of the carbonate components. The interference color of micromass at 900 °C is dark olive in the core and dark red at the margins, whereas at 1050 °C it changes to light olive in the core and red at the margins. In relation with the ceramic sherds, two samples (K22 and K16) have been characterized as non-calcareous, and in addition both are distinguished for the development of “sandwich microtexture” (Figure 13).

5.3.2. X-ray Powder Diffraction (XRPD) of the Clayey Sediments and the Experimental Briquettes

The mineralogy of the unfired clayey sediments as well as the fired samples was determined using X-ray Powder Diffraction (XRPD). All the samples (DS1, DS2, DS5, DS6, DS7 and DS8) apart from two are characterized as calcareous and have as main mineralogical assemblage quartz + calcite + plagioclase + illite + chlorite (Figure 14a). The samples DS3 and DS4 contain very low quantities of calcite and have the mineralogical assemblage quartz + plagioclase + illite + chlorite ± kaolinite ± hematite (Figure 14b).
The mineralogical phases produced because of the mineralogical transformations that took place during the firing course of the calcareous materials are gehlenite, larnite, wollastonite and less diopside. At 900 °C, the disappearance of illite and calcite and the formation of gehlenite constitute the the products of the reaction: KAl2(Si3Al)O10(OH)2 + 6CaCO3 3Ca2Al2SiO7 + 6CO2 + 2H2O + K2O + SiO2. The new-formed phases larnite and portlandite have been produced after the reactions; 2CaCO3 + SiO2 Ca2SiO4 + 2CO2 or 2CaO + SiO2 Ca2SiO4 and CaO + 2H2O Ca (OH)2 respectively. Portlandite is the result of the transformation of lime due to its re-hydration, during the storage of the experimental briquettes at room temperature. In higher temperature (1050 °C), the peaks of larnite and gehlenite are increased (Figure 15). Wollastonite creation results after the reaction SiO2 + CaO CaSiO3.
The non-calcareous samples (DS3 and DS4), as it is aforementioned, differ microscopically at temperatures of 900 °C, since DS4 displayed a black core structure, whereas at 1050 °C both samples developed the same feature. Specifically, in sample DS3 and at temperature of 900 °C illite was decomposed, whereas hematite is the new mineral formed. With the increaseof temperature and always under oxidizing conditions, the disapperance of hematite in the dark core of the specimen and the formation of the hercynite together with metallic iron are recorded. The same is observed for sample DS4. In the margin, hematite is maintained and the newly formed phases is corundum and less hercynite (Figure 16). In the latter sample illite exists at the margin of the specimen at 900 °C.
The structure of core and rim or the “sandwich structure” and the formation of hercynite are attributed to the reducing firing conditions [29]. This aspect could not be taken into consideration in our case, because the prevailed conditions inside the furnace were oxidizing. According to Maritan [30] these characteristics may also attributed to the decomposition of the organic matter contained in the clayey sediments. Maniatis [31] suggests that in the low calcareous clays, limited crystallization occurs during firing, whereas the clay minerals destruction is completed in temperatures higher than 800 to 850 °C. Clay minerals are transformed to amorphous material, whilst their disengaged iron forms iron oxides (such as a-Fe2O3).
The combination of different analytical techniques assists to the characterization of the ceramic artifacts concerning their provenance and the technological choices followed by the ancient potters, such as recipes or temperature firing. In the present study, the combination and comparison of the petrographic, XRPD and SEM/EDS results led us to estimate the firing temperature and eventually reveal the choice of the practices and recipes followed by the ancient potters for the ceramics from Kastrouli.

5.4. Comparative Examination of the Ancient Ceramics and Experimental Briquettes

Thin section analysis has permitted to fully characterize 40 samples from the Late Mycenaean (Early Helladic III) settlement of Kastrouli. All the analyzed samples, but those of the petrographic fabric group 1, contain minerals and rocks which are similar in terms of composition to the lithology of the studied area. In fabric group 1 the moderate sorting of the coarse sand size of quartz highlights the possible use of a shelf (naturally) tempered clayey raw material, which could easily be procured by the ancient potters. The noteworthy characteristic of this fabric is the presence of serpentinite fragments which are not related to the local lithology. The closest area, where outcrops of similar rocks are reported, is Boeotia wherein the ophiolite sequence of Parnassus zone is found. The fabric groups 2, 3 and 4 have as a common practice the tempering. Although these groups are characterized by diverse lithological components, these later can all be found locally, indicating a local provenance of the sherds these groups encompass. That suggests either the existence of different workshops or the choice of various recipes by the ancient potter. On the other hand, fabric group 5 and the Fine group have petrographic characteristics which highlight a more sophisticated preparation of the raw materials. Craftsmen probably were following different processes for removing the coarse matter, since a range of the particle size, from the coarse sand to pure clay has been observed. The difference between these latter two fabric groups is the source of the raw material employed for their manufacture, because fabric group 5 is distinguished for the micaceous clay matrix. The experimental briquette of sample DS1is also characterized by the presence of brown mica, confirming in that way the local provenance of the ancient ceramics.
The studied samples were chemically analyzed in an earlier paper, in which the statistical elaboration of the chemical analyses was carried out [12]. Figure 17 shows a dendrogram corresponding to a different agglomerative clustering (the so called dendrogram) that of Average Linkage after the standardization of the data using Euclidean distance. In fact, several linkages, for example, single, complete median, centroid, Ward’s and measure of distances have been tried [12]. A common conclusion derived from the majority of the resulting clustering is that a group of samples consisted of a subset of local clay DS samples is clearly separated from the remaining set of observations. As a first observation, we can report that all DS sources apart from DS3, DS4 and some mixings, differentiate with respect to chemical composition from the ceramic samples found in the area. A further exploration of the notable characteristics of both DS and ceramics groups confirms clear differences in many chemical elements. More specifically, the DS group has ratio measurements with much higher concentration in Ca when compared to ceramic group, and the ceramic group has higher concentration in Ti. At any rate, the grouping of ceramics and any provenance study requires due attention for drawing lightly definite conclusions. The preparation of clays from raw materials may affect: (a) major element composition, and, also, (b) color from firing temperature. However, regarding the possibilities that during the ceramic production the raw materials may have been sieved and cleaned, or tempered with other rock types, not originally present in the clay deposits, may affect the final bulk chemical composition. In general, our present petrographic study, did not differentiate rock inclusions in the studied ceramics. Post-depositional effects such as cation exchange, soluble salts, phosphates, may play a role; though most of the mobile chemical elements (P, Cs, Na, U, Th) were excluded from analysis, possible alterations of others (Mg, Ca) is assumed to fall within the error of the analysis. For both reasons, in ceramics, the cation exchange and dissolution with surrounding sediment is a strong factor. Regarding clay samples, for example, the DS 4 and DS 8, Meteles (close to Kastrouli), though from the same location they have different behavior in the firing and color. This may imply different blend. The whitish clays are found in several locations around Kastrouli, some from Aghia Eirini (St Irene) site called “asproyia” (=whitish earths) by locals. From the local clay sampling it was noted that the hueing of this whitish clay ranges from white to light pink or yellow. For the other clay locations, DS1 is very light brown, DS3 and DS4 develop sandwich pattern upon firing and DS8 is light brown. From DS fired in 900 °C, the DS4 (Meteles) the red-green-blue (RGB) intensity is medium to low, while in 1050 °C the R increases and B, G are low [11]. At any rate Figure 17 chemical groupings show a correlation with the petrographic groups and what it seems interesting is that most of the first petrographic groups fall into a cluster with the most ceramics, confirming the local origin. Moreover, because the samples identified as possible imports, fall in this cluster, one may argue that in this case the petrography serves to provide information which was not obtained with the geochemical analyses.
Concerning the firing choices, most of the samples have undergone high or very high firing temperatures, indicating the use of traditional kilns which reaches these temperatures. The mineralogical analysis of the clays confirmed further the use of the local sources. In fact, two sources of clays were recognized regarding their content in calcium. That comes in agreement with the recognition of two groups from the ceramic artifacts as calcareous and non-calcareous. The development of Ca-silicate newformed phases (larnite and wollastonite) is attributed to the high quantity of calcium and the CaO/SiO2 ratio in the unfired raw material and the heating conditions inside the furnace [32]. While some of the firing conditions and petrologic results are in concordance to an earlier preliminary study of six samples [33].

6. Conclusions

The thin section analysis, the mineralogical determination and the microstructure examination of a selective number of ancient ceramics from the Late Mycenaean settlement of Kastrouli enabled us to characterize them in terms of technological and provenance issues. The samples are classified to six fabric groups wherein certain petrographic characteristics allowed us to draw the following conclusions on technological issues concerning the ceramic production in Kastrouli settlement.
The samples of fabric group 1 (fine whitish-yellow ware) could be considered as either imported, suggesting possible social or trade networks of the Kastrouli settlement, or another not yet identified local clay source, that is within the same geological background of the region. Regarding fabric groups 2, 3 and 4, it was observed the choice of a similar way of manufacturing (tempering), but the use of different additives, all relative with the local lithology. In contrast, fabric group 5 exhibits a completely different recipe and manufacturing, since it is characterized by a micaceous clay matrix and a fine-grained groundmass. Latter feature highlights the possible procurement of the raw material and the remove of the coarse material. Thirteen samples were classified as a broad fine fabric group due to its textural characteristics. The very fine aplastic inclusions or/and the pure clay matrix noticed in that fabric suggests the choice of a different source of clayey raw material. The high skillfulness of Kastrouli people from possible use of various clay sources exploited in their environment and recipes, makes the peripheral Mycenaean settlement of particular importance.
The examination of the microstructure through scanning electron microscopy enabled us to determine the prevailed firing conditions, which were predominantly high giving us an indication, about potters’ technological choices for the maximum firing temperatures. XRPD complemented and helped us further test the validity of the firing temperatures revealed by the SEM analysis, and ranged from less than 850 °C, 850–950 °C and 900–1100 °C.

Author Contributions

I.L.: Conceptualization and investigation of the whole Kastrouli Mycenaean Project (www.kastrouli.org), methodology, project administration, supervision on material curation and archaeometry, writing-review, editing, V.X.: data curation, methodology, writing original draft preparation, formal analysis, visualization, software, editing, I.I.: formal analysis, methodology, methodology, writing-review & editing, co-supervision. All authors have read and agreed to the published version of the manuscript.

Funding

This research received no external funding.

Institutional Review Board Statement

Not applicable.

Informed Consent Statement

Not applicable.

Acknowledgments

We thank Ephoreia of Antiquities of Phokis and the Ministry of Culture & Sports, Greece, for granting permission for sampling and analysis. We thank I. Papageorgiou for providing Figure 17. Ioannis Liritzis is thankful for support of Sino-Hellenic Academic Project (www.huaxiahellas.com) from Key Research Institute of Yellow River Civilization and Sustainable Development & Collaborative Innovation Center on Yellow River Civilization of Henan Province, Henan University, Kaifeng, China.

Conflicts of Interest

The authors declare no conflict of interest.

References

  1. Dasios, F. Contribution to the Phokis topography (Contribution to the topography of ancient Phokis). Fokika Khronika 1992, 4, 18–97. (In Greek) [Google Scholar]
  2. Raptopoulos, S. Mycenaean Tholos Tomb in Desfina of Phokis. In Arkheologiko Ergo Thessalias kai Stereas Elladas 2009; Laboratory of Archeology, University of Thessaly & Ministry of Culture: Volos, Greece, 2012; Volume 3, pp. 1071–1078. (In Greek) [Google Scholar]
  3. Sideris, A.; Liritzis, I.; Liss, L.; Howland, M.D.; Levy, T.E. At-risk cultural heritage: New excavations and finds from the Mycenaean site of Kastrouli, Phokis. Greece Mediterr. Archaeol. Archaeom. 2017, 17, 271–285. [Google Scholar]
  4. Levy, E.T.; Sideris, T.; Howland, M.; Liss, B.; Tsokas, G.; Stambolidis, A.; Fikos, E.; Vargemezis, G.; Tsourlos, P.; Georgopoulos, A.; et al. At-Risk World Heritage, Cyber, and Marine Archaeology: The Kastrouli–Antikyra Bay Land and Sea Project. In Cyber-Archaeology and Grand Narratives, One World Archaeology; Levy, T.E., Jones, I.W.N., Eds.; Springer International Publishing AG: Phokis, Greece, 2018; pp. 143–230. [Google Scholar]
  5. Sideris, A.; Liritzis, I. The Mycenaean site of Kastrouli, Phokis, Greece: Second excavation season, July 2017. Mediterr. Archaeol. Archaeom. 2018, 18, 209–224. [Google Scholar]
  6. Koh, A.J.; Birney, K.J.; Roy, I.M.; Liritzis, I. The Mycenaean citadel and environs of Desfina-Kastrouli: A transdisciplinary approach to southern Phokis. Mediterr. Archaeol. Archaeom. 2020, 20, 47–73. [Google Scholar] [CrossRef]
  7. Philippson, A.; Kirsten, E. Das Östliche Mittelgriechenland und die Insel Euboea. Die Griech. Landsch. 1951, I. part II (Frankfurt am Main). [Google Scholar]
  8. McInerney, J. The Folds of Parnassus. In Land and ethnicity in Ancient Phokis; University of Texas Press: Austin, TX, USA; Available online: https://bmcr.brynmawr.edu/2000/2000.11.29/ (accessed on 9 November 2020).
  9. Liritzis, I. Kastrouli fortified settlement (Desfina, Phokis, Greece): A Chronicle of research. Sci. Cult. 2021, (in press). [Google Scholar]
  10. Furumark, A. Mycenaean Pottery I, Analysis and Classification; SkrAth 20, 1; Svenska Institutet i Athen: Stockholm, Sweeden, 1972; pp. 175–179 & 557–567. [Google Scholar]
  11. Bratitsi, M.; Liritzis, I.; Vafiadou, A.; Xanthopoulou, V.; Palamara, E.; Iliopoulos, I.; Zacharias, N. Critical assessment of chromatic index in archaeological ceramics by Munsell and RGB: Novel contribution to characterization and provenance studies. Mediterr. Archaeol. Archaeom. 2018, 18, 175–212. [Google Scholar] [CrossRef]
  12. Liritzis, I.; Xanthopoulou, V.; Palamara, E.; Papageorgiou, I.; Iliopoulos, I.; Zacharias, N.; Vafiadou, A.; Karydas, A.G. Characterization and provenance of ceramic artifacts and local clays from Late Mycenaean Kastrouli (Greece) by means of p-XRF screening and statistical analysis. J. Cult. Herit. 2020, 46, 61–81. [Google Scholar] [CrossRef]
  13. Liritzis, I.; Jin, Z.; Fan, A.; Sideris, A.; Drivaliari, A. Late Helladic and later reuse phases of Kastrouli settlement (Greece): Preliminary dating results. Mediterr. Archaeol. Archaeom. 2016, 16, 245–250. [Google Scholar]
  14. Liritzis, I.; Polymeris, G.S.; Vafiadou, A.; Sideris, A.; Levy, T.E. Luminescence dating of stone wall, tomb and ceramics of Kastrouli (Phokis, Greece) Late Helladic settlement: Case study. J. Cult. Herit. 2018, 35, 76–85. [Google Scholar] [CrossRef]
  15. Xanthopoulou, V.; Iliopoulos, I.; Liritizis, I. Characterization techniques of clays for the archaeometric study of ancient ceramics: A review. Sci. Cult. 2020, 6, 73–86. [Google Scholar]
  16. Kontopoulos, I.; Penkman, K.; Liritzis, I.; Collins, M.J. Bone diagenesis in a Mycenaean secondary burial (Kastrouli, Greece). Archaeol. Anthropol. Sci. 2019, 11, 5213–5230. [Google Scholar] [CrossRef] [Green Version]
  17. Kontopoulos, I.; Penkman, K.; Mullin, V.E.; Winkelbach, L.; Unterländer, M.; Scheu, A.; Kreutzer, S.; Hansen, H.B.; Margaryan, A.; Teasdale, M.D.; et al. Screening archaeological bone for palaeogenetic and palaeoproteomic studies. PLoS ONE 2020. [Google Scholar] [CrossRef]
  18. Liritzis, I.; Laskaris, N.; Vafiadou, A.; Karapanagiotis, I.; Volonakis, P.; Papageorgopoulou, C.; Bratitsi, M. Archaeometry: An overview. Sci. Cult. 2020, 6, 49–98. [Google Scholar] [CrossRef]
  19. Marinos, P.; Rondoyanni, T. The Archaeological Site of Delphi, Greece: A Site Vulnerable to Earthquakes, Rockfalls and Landslides. In Landslides; Sassa, K., Fukuoka, H., Wang, F., Wang, G., Eds.; Springer: Berlin/Heidelberg, Germany, 2005. [Google Scholar]
  20. Celet, P. Quelques aspects de l’hydrogeology des regions calcaires meridionales du parnasse-Helicon (Grece). Ann. Sci. Pays Hell. 1971, 3, 13–16. [Google Scholar]
  21. Whitbread, I.K. Greek Transport Amphorae: A Petrological and Archaeological Study; British School: Athens, Greece, 1995; Fitch Laboratory Occasional Paper 4. [Google Scholar]
  22. Iliopoulos, I.; Xanthopoulou, V.; Tsolis-Katagas, P. A Petrographic Assessment of Houseware and Storage Pithoi in the Early Helladic Settlement of Helike, Achaea, Greece. In Helike IV, Ancient Helike and Aigialeia: Protohelladika, the Southern and Central Greek Mainland; Katsonopoulou, D., Ed.; The Helike Society: Athens, Greece, 2011; pp. 127–142. [Google Scholar]
  23. Katsonopoulou, D.; Iliopoulos, I.; Katsarou, S.; Xanthopoulou, V. Craftsmanship of big storage pithoi in the Early Helladic settlement of Helike, Achaea. In BAR S2780 Proceedings of the 6th Symposium of the Hellenic Society for Archaeometry; Bassiakos, Y., Filippaki, E., Hein, A., Karatasios, I., Kilikoglou, V., Kouloumpi, E., Eds.; BAR International Series; British Archaeological Reports Ltd.: Oxford, UK, 2016; pp. 13–20. [Google Scholar]
  24. Xanthopoulou, V. Assessment of Clayey Raw Material Suitability for Ceramic Production in Northern Peloponnese: An Archaeometric Approach. Ph.D. Dissertation, Department of Geology, Nemertes Library Information System, University of Patras, Patras, Greece, 2019. [Google Scholar]
  25. Schewedt, A.; Mommsen, H.; Zacharias, N. Post-depositional elemental alterations in pottery: Neutron activation analyses of surface and core samples. Archaeometry 2004, 46, 85–101. [Google Scholar] [CrossRef]
  26. Maniatis, Y.; Tite, M.S. Technological examination of Neolithic–Bronze Age pottery from central and southeast Europe and from the Near East. J. Archaeol. Sci. 1981, 8, 59–76. [Google Scholar] [CrossRef]
  27. Wilson, D.E.; Day, P.M. Ceramic regionalism in prepalatial central Crete: The Mesara imports from EM I to EM IIA Knossos. Annu. Br. Sch. Athens 1994, 89, 1–87. [Google Scholar] [CrossRef]
  28. Day, P.M.; Kilikoglou, V. Analysis of ceramics from the kiln. In: Shaw J W, van de Moortel A, Day P M and Kilikoglou V, A LMIA ceramic kiln in south-Central Crete. Function and pottery production. Hesperia Suppl. 2001, 30, 111–133. [Google Scholar] [CrossRef]
  29. Maggetti, M.; Schwab, H. Iron Age fine pottery from Chatillon-s-Glane and the Heuneburg. Archaeometry 1982, 24, 21–36. [Google Scholar] [CrossRef]
  30. Maritan, L.; Nodari, L.; Mazzoli, C.; Milano, A.; Russo, U. Influence of firing conditions on ceramic products: Experimental study on clay rich in organic matter. Appl. Clay Sci. 2006, 31, 1–15. [Google Scholar] [CrossRef]
  31. Maniatis, Y.; Simopoulos, A.; Kostikas, A. Effect of reducing atmosphere on minerals and iron oxides developed in fired clays: The role of Ca. J. Am. Ceram. Soc. 1983, 66, 773–781. [Google Scholar] [CrossRef]
  32. Peters, T.J.; Iberg, R. Mineralogical study of the firing characteristics of brick clays. Am. Ceram Soc. Bull. 1978, 57, 503–505, 509. [Google Scholar]
  33. Baziotis, I.; Xydous, S.; Manimanaki, S.; Liritzis, I. An integrated method for ceramic characterization: A case study from the newly excavated Kastrouli site (Late Helladic). J. Cult. Herit. 2020, 42, 274–279. [Google Scholar] [CrossRef]
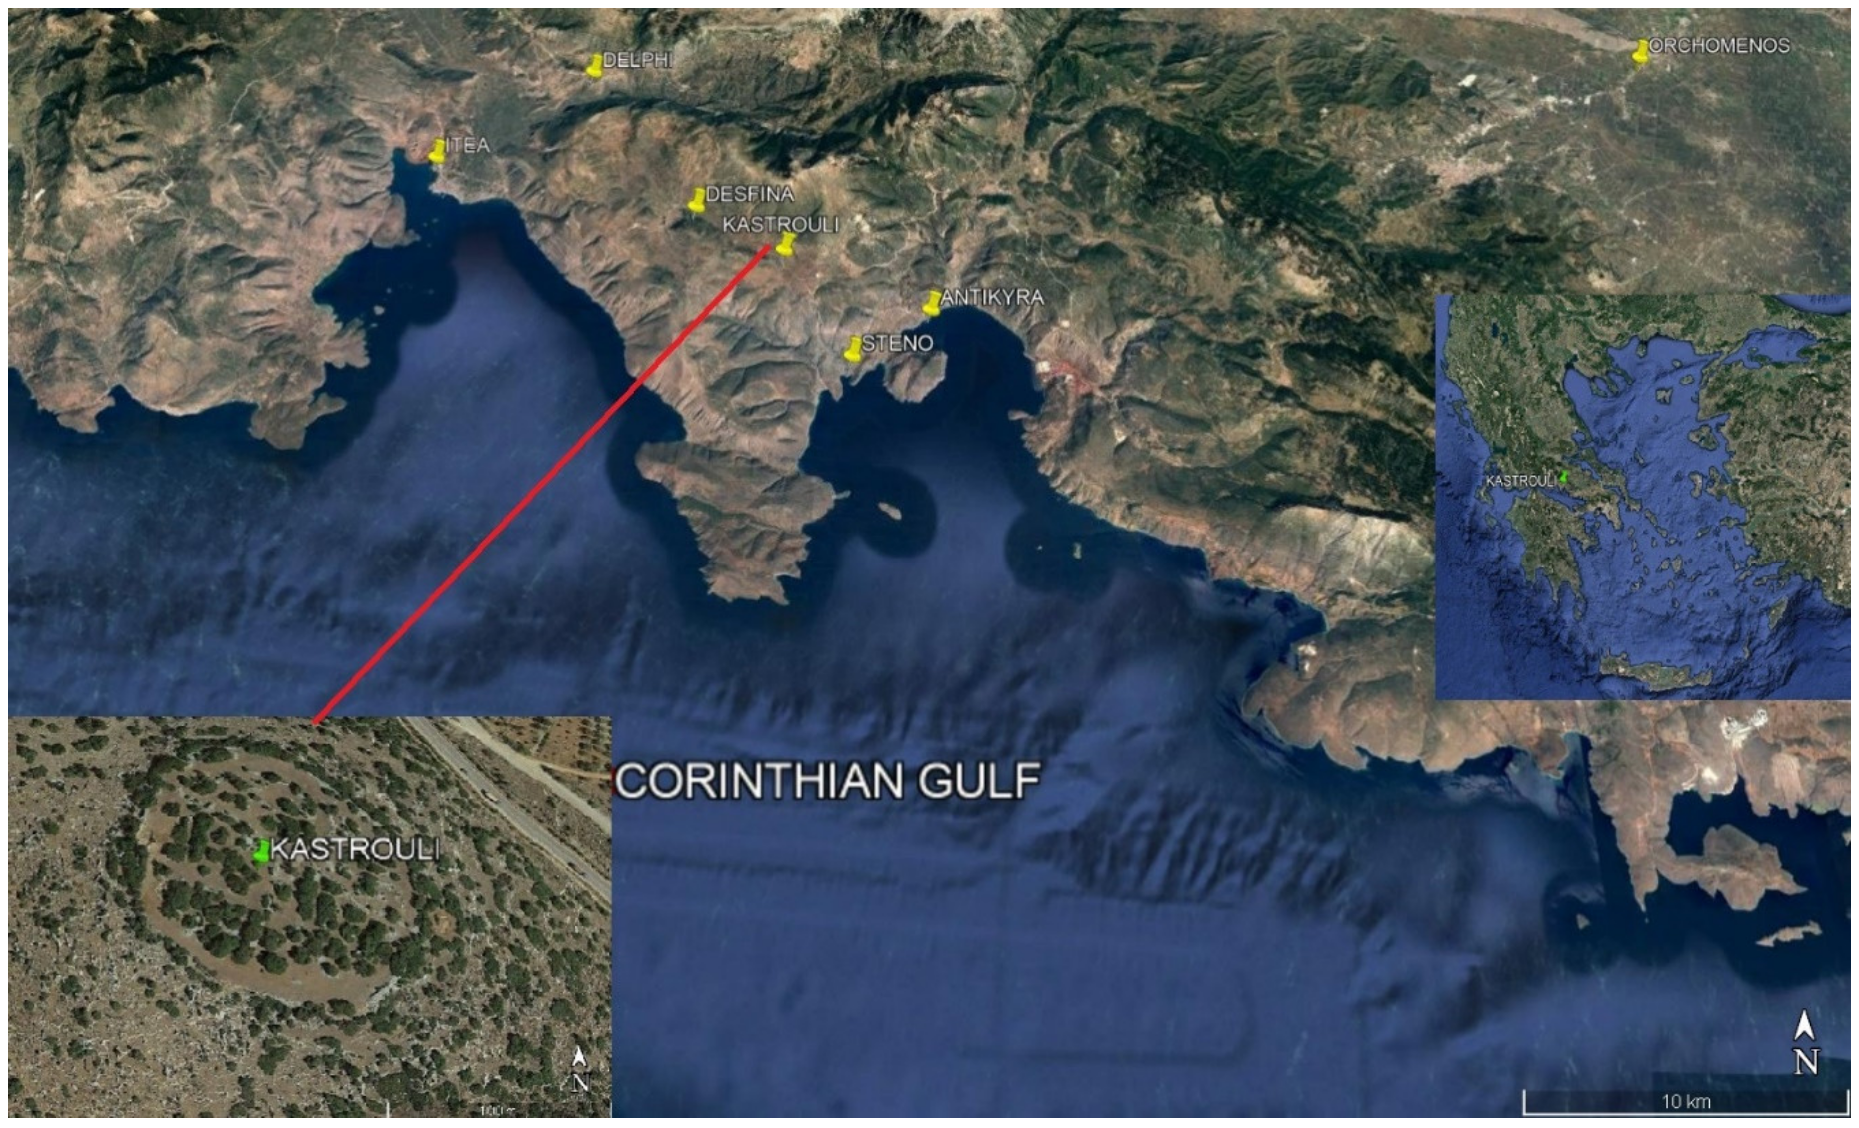
Figure 1. Location of the main sites reported in the text on the map of central Greek mainland. The inset picture is an oblique aerial view of the Kastrouli settlement (coordinates: 37° 54′19.56 E, 42° 50′792.35 N; Google Earth).
Geosciences 11 00036 g001
Figure 2. Simplified geological map of the studied area (by Marinos; modified by Celet) [19,20]. Parnassus-Ghiona zone: 1. Flysch; 2. Limestones; Pindos Zone: 3. Flysch; 4. Limestones and cherts; 5. Overthrust; 6. Fault. The red dashed framework outlines the studied area.
Geosciences 11 00036 g002
Figure 3. Representative photomicrographs of group 1: (a) sample K21; (b) sample K22; (c) sample K24 and (d) K59. All photomicrographs are taken under crossed Nicols (XP).
Geosciences 11 00036 g003
Figure 4. Representative photomicrographs of group 2: (a) sample K3 and (b) sample K126. All photomicrographs are taken under crossed Nicols (XP).
Geosciences 11 00036 g004
Figure 5. Representative photomicrographs of group 3: (a) sample K8 and (b) sample K84. All photomicrographs are taken under crossed Nicols (XP).
Geosciences 11 00036 g005
Figure 6. Photomicrographs of the fabric group 4: (a) sample K7 and (b) K127. All photomicrographs are taken under crossed Nicols (XP).
Geosciences 11 00036 g006
Figure 7. Representative photomicrographs of the fabric group 5. (a) Sample K2; (b) K12; (c) K27 and (d) K95. All photomicrographs are taken under crossed Nicols (XP).
Geosciences 11 00036 g007
Figure 8. (ad) Representative photomicrographs of the Fine fabric group: Samples K9; K26; K57 and K18, respectively; (e,f) representative photomicrographs of the coarse loners: Samples K6 and K16, respectively; (g,h) representative photomicrographs of the fine loners: Samples K19 and K23, respectively. All photomicrographs are taken under crossed Nicols (XP).
Geosciences 11 00036 g008
Figure 9. Composite graph displaying representative diffractograms of each class. Abbreviations: Qz = quartz, Di = diopside, Gh = gehlenite, Kfs = k-feldspar, Pl = plagioclase, Ill = illite, Hm = hematite, Anl = analcime. Dashed circles show the illite and hematite reflections.
Geosciences 11 00036 g009
Figure 10. Secondary electron micrographs of fresh fractures from representative samples of the calcareous group: (a) K84, (b) K26, (c) K21, (d) K9, (e) K20, (f) K7, (g) K18, (h) K59 and (i) K51.
Geosciences 11 00036 g010
Figure 11. Secondary electron micrographs of fresh fractures from representative samples of the low calcareous ceramic samples (representative samples): (a) K4, (b) K6, (c) K22 and (d) K70.
Geosciences 11 00036 g011
Figure 12. Photomicrographs of the thin sections made from the DS briquettes of the calcareous raw materials. All photomicrographs are taken under crossed Nicols (XP). (Width of field of view: 4.4 mm).
Geosciences 11 00036 g012
Figure 13. Photomicrographs of the thin sections made from the DS briquettes of the non-calcareous raw materials. All photomicrographs are taken under crossed Nicols (XP). (Width of field of view: 4.4 mm).
Geosciences 11 00036 g013
Figure 14. Composite graphs of the X-ray patterns (a) of the unfired calcareous raw materials and (b) of the non-calcareous raw material. Abbreviations: Qz = quartz, Cc = calcite, Pl = plagioclase, Ill = illite, Chl = chlorite, Hm = hematite.
Geosciences 11 00036 g014
Figure 15. Composite graphs of the X-ray patterns from the fired calcareous material (700–1050 °C). Abbreviations: Qz = quartz, Lrn = larnite, Po = portlandite, Gh = gehlenite, Wo = wollastonite, Cc = calcite.
Geosciences 11 00036 g015
Figure 16. Composite graphs of the X-ray patterns from the fired non-calcareous material (700–1050 °C). Abbreviations: Qz = quartz, Cc = calcite, Pl = plagioclase, Ill = illite, Hm= hematite, Hc = hercynite, Fe= metal iron, Crn = corundum, M = margin, C = core.
Geosciences 11 00036 g016
Figure 17. Dendrogram (average linkage agglomerative hierarchical clustering) of chemical analyses presented in Liritzis et al. (2020a). Clustering is based upon the chemical results presented in Liritzis et al., 2020a, in order to be coherent and facilitate distribution of present groupings). Rectangles represent petrographic groups: black—group 1; red—group 2; blue—group 3; green—group 4; magenta—group 5; orange—fine fabric; yellow—loners.
Geosciences 11 00036 g017
Table 1. The color of the unfired (leather dried) clays and their behavior during molding.
SampleMunsell ColorMolding Behavior
DS17.5YR 7/2 pinkish grayGood workability
DS27.5YR 7/2 pinkish grayGood workability
DS35YR 5/4 reddish brownVery good workability
DS45YR 5/4 reddish brownVery good workability
DS57.5YR 8/1 whitePoor workability
DS610YR 7/3 very pale brownGood workability
DS77.5YR 7/2 pinkish grayVery good workability
DS85YR 6/3 light reddish brownVery good workability
Table 2. Summary of the mineralogical classes and the respective mineralogical assemblages by means of XRPD analysis. (EFT = Equivalent Firing Temperature; ± = not detected in all samples or detected in traces).
ClassSamplesMineralogical Assemblages
Class Ia
EFT: <850 °C
K7, K127quartz + calcite + illite + plagioclase
Class Ib
EFT: <850 °C
K2, K3, K4, K6, K16, K78, K95, K123,K125, K126quartz + illite + plagioclase ± calcite ± k-feldspar ± hematite
Class II
EFT: ~850–950 °C
K48, K51quartz + calcite + illite + plagioclase + gehlenite
Class III
EFT: ~850–950 °C
K9, K12, K21, K22, K24, K26, K28, K46, K59, K62, K70, K85quartz + diopside + plagioclase + k-feldspar ± hematite ± illite
Class IV
EFT:~900–1100 °C
K18, K19, K20, K71, K81quartz + diopside + plagioclase ± gehlenite ± k-feldspar ± analcime
Class V
EFT: ~900–1100 °C
K8, K23, K27, K57, K76, K84,K112, K124quartz + diopside + plagioclase ± k-feldspar ± calcite ± analcime
Table 3. Summary of XRPD and SEM-EDS results and determination of the equivalent firing temperature (EFT) according to the SEM. Non-calc (CaO < 6%) and calc (CaO > 6%).
SampleXRPDSEM-EDSEFT
ClassCompositionMicrostructure
K2Ibnon-calcno vitrification<700 °C
K3Ibnon-calcsintering-initial vitrification<850 °C
K4Ibnon-calcinitial vitrification<850 °C
K6Ibnon-calcno vitrificaation-sintering<850 °C
K7Iacalcinitial vitrification<850 °C
K9IIIcalcinitial vitrification850–950 °C
K16Ibnon-calcsintering<850 °C
K18IVcalcextensive vitrification900–1100 °C
K20IVcalcsintering-initial vitrification850–950 °C
K21IIIcalcsintering-initial vitrification850–950 °C
K22IIInon-calcsintering-initial vitrification850–950 °C
K23Vcalcvitrification900–1100 °C
K24IIIcalcvitrification900–1100 °C
K26IIInon-calcsintering-initial vitrification850–950 °C
K28IIInon-calcsintering-initial vitrification850–950 °C
K46IIInon-calcsintering-initial vitrification850–950 °C
K51IIcalcextensive vitrification1000–1100 °C
K59IIInon-calcextensive vitrification900–1100 °C
K62IIInon-calcextensive vitrification900–1100 °C
K70IIInon-calcextensive vitrification900–1100 °C
Κ78Ibnon-calcsintering-initial vitrification850–950 °C
Κ81IVcalcvitrification900–1100°C
Κ84Vcalcsintering850–950 °C
Κ85IIIcalcsintering-initial vitrification850–950 °C
Κ95Ibcalcvitrification900–1100 °C
Κ112Vcalcsintering-initial vitrification850–950 °C
Κ123Ibnon-calcsintering-initial vitrification850–950 °C
Publisher’s Note: MDPI stays neutral with regard to jurisdictional claims in published maps and institutional affiliations.