1. Introduction
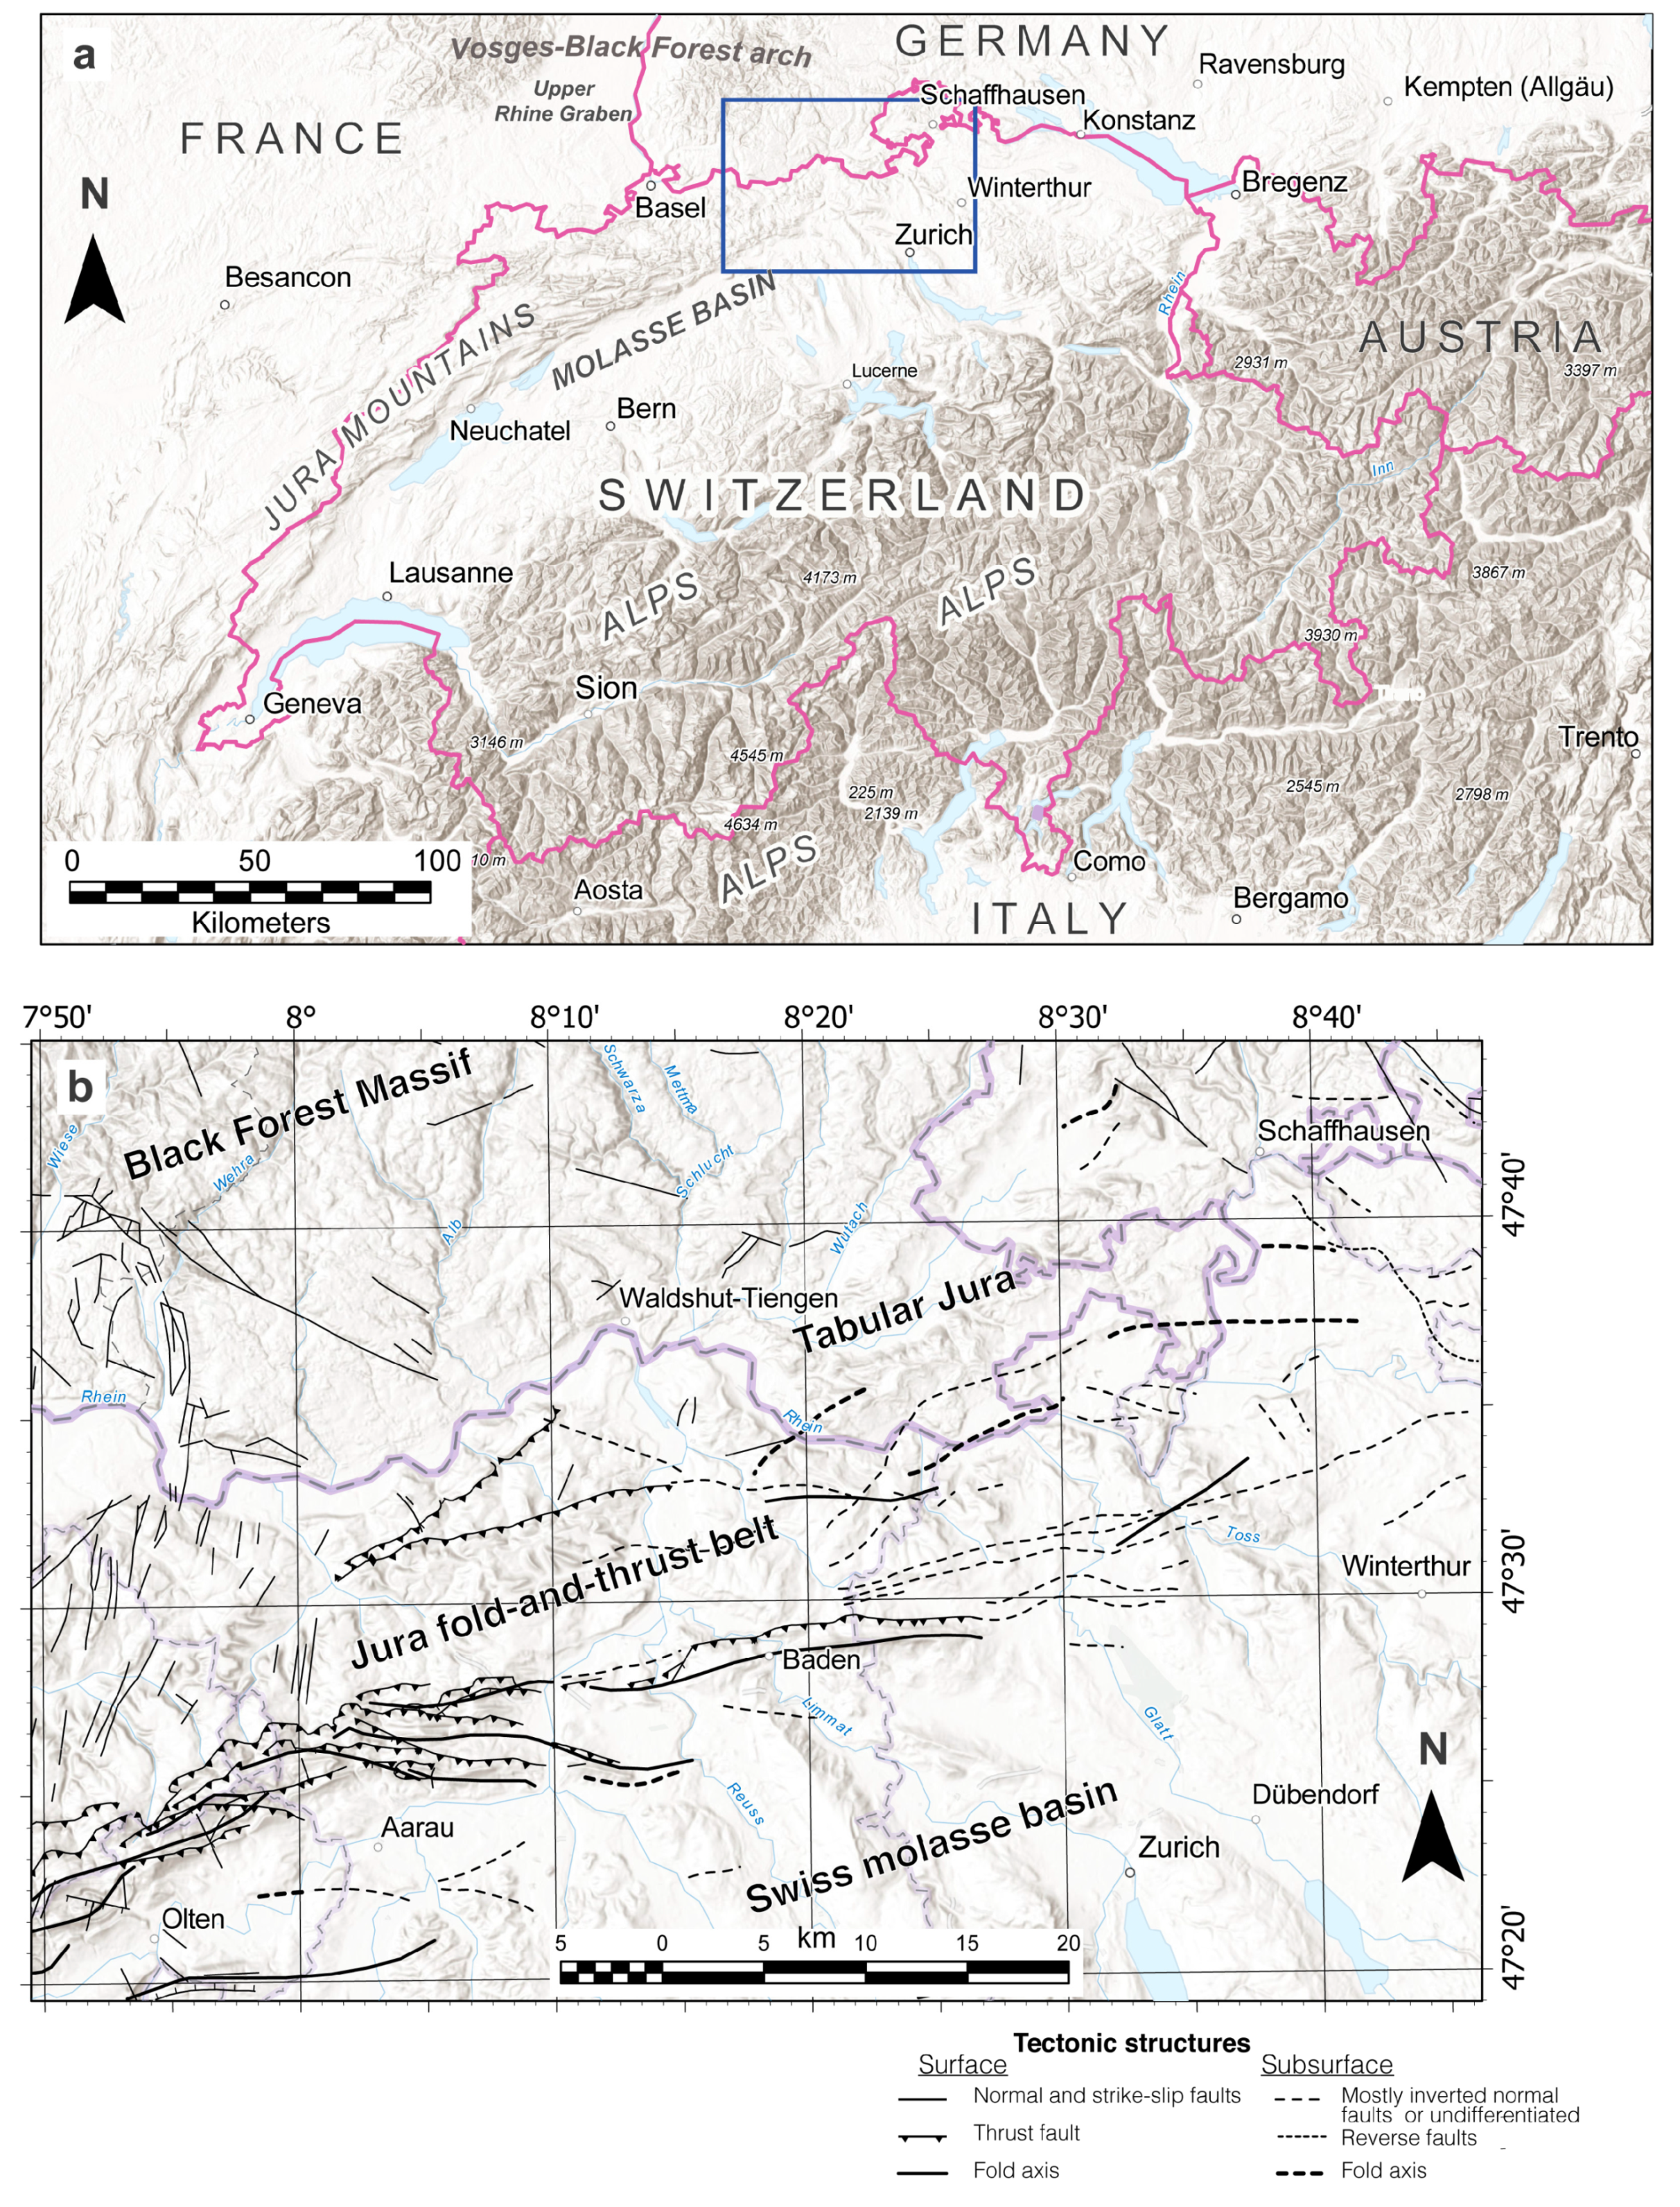
A vast amount of research has been carried out to understand the geological evolution of the Swiss Jura Mountains (Jura fold-and-thrust belt and the Tabular Jura) and the Swiss Molasse Basin (SMB, also referred to as the North Alpine Foreland Basin, NAFB) in north-eastern Switzerland (
Figure 1a,b). Published research includes detailed geological mapping [
1,
2], structural, sedimentological, and seismic coverage generated by various exploration companies and synthetized by several authors [
3,
4,
5], as well as deep and shallow drilling reports [
6,
7,
8,
9,
10,
11].
Despite this long history of research and publications, there are still uncertainties on the timing of the main tectonic events and the amount of exhumation that likely accompanied these events. The main shortcomings are due to the lack of an accurate determination of the onset and duration of two of the most important deformational and erosional events observed in the region, which are represented by two regional unconformities: (i) the Jurassic–Eocene unconformity and (ii) the Miocene–Quaternary unconformity.
The Jurassic–Eocene unconformity observed in seismic images is arguably a consequence of the northward migration of the forebulge, as the proto NAFB formed and started to subside as a consequence of the uploading of the neo-forming Alpine Chain [
12]. The timing of this erosional event has not been properly established, but it is considered to be Late Cretaceous–Middle Paleocene, as observed in the German part of the NAFB [
13] or Paleocene [
12,
14]. The amount of pre-Eocene missing section has been estimated between 600 and 1800 m [
14,
15].
The Miocene–Quaternary unconformity is readily observed in the Jura fold-and-thrust belt (FTB), as well as in the entire SMB [
15,
16]. Some authors claim that the deformation of the Jura FTB started at around 12 Ma and lasted until about 5–4 Ma [
17,
18,
19,
20]. Synchronous deformation was recorded in the adjacent SMB [
18], whose onset is debatably constrained between 10 [
14,
21] and 5 Ma [
17,
18,
22,
23]. While there have been no attempts to determine the amount of Miocene sedimentary section eroded from the Swiss Jura mountains, the thickness of the Miocene section missing in the SMB has been roughly estimated between 350 m and up to 3 km [
14,
15,
22,
23].
This work addresses some of the aforementioned standing problems: the timing and magnitude of exhumation due to the tectonic events in the Swiss Jura Mountains and in the adjacent SMB. To achieve this objective, we have employed apatite fission track dating from selected deep borehole cores, which were drilled in Northern Switzerland in the 1980s by Nagra (Swiss National Cooperative for the Disposal of Radioactive Waste) and that reached the crystalline basement.
2. Regional Geological Setting
2.1. Major Morphotectonic Units in Northern Switzerland
In northern Switzerland, the Paleozoic crystalline basement of the Black Forest Massif (
Figure 1b and
Figure 2) is unconformably overlain by a series of Permo-Carboniferous to Jurassic sedimentary units usually referred to as the Tabular Jura (or the Plateau Jura). The Tabular Jura is considered autochthonous, and it is bounded to the south by the Jura FTB, which is a thin-skinned belt of Mesozoic sedimentary units (
Figure 2).
Both the Tabular Jura and the Jura FTB form the Jura Mountains in northern Switzerland and are considered the most external deformation zone of the Alps [
24] (
Figure 1a). The Jura FTB probably detached from basement along Triassic evaporite layers [
20,
25,
26] during the last phases of alpine deformation in Miocene times [
18].
The SMB located between the northern flank of the Alps and the Jura Mountains is an early Oligocene–late Miocene peripheral foreland basin. The SMB is mainly undeformed with the exception of the Subalpine Molasse Unit, which is the external part of the Alpine thrust wedge. Mild deformation occurs also along isolated faults and folds [
27] or near the margins of the basin, close to the Alps and the Jura Mountains [
28].
2.2. Stratigraphic Evolution
At the end of the Variscan orogeny, strike-slip transpression controlled the formation of a series of long, narrow (5 km to 20 km) and relatively deep (up to 6 km; [
4,
29]) troughs, which are currently only observed in seismic lines, gravity data, or penetrated by a few deep wells [
4,
20,
29,
30,
31]. These troughs were filled by Permo-Carboniferous continental sediments that were likely buried and heated at elevated geothermal gradients (up to 100 °C/km; [
14,
15,
32]) as a response to crustal thinning and magmatic underplating following the Variscan orogeny [
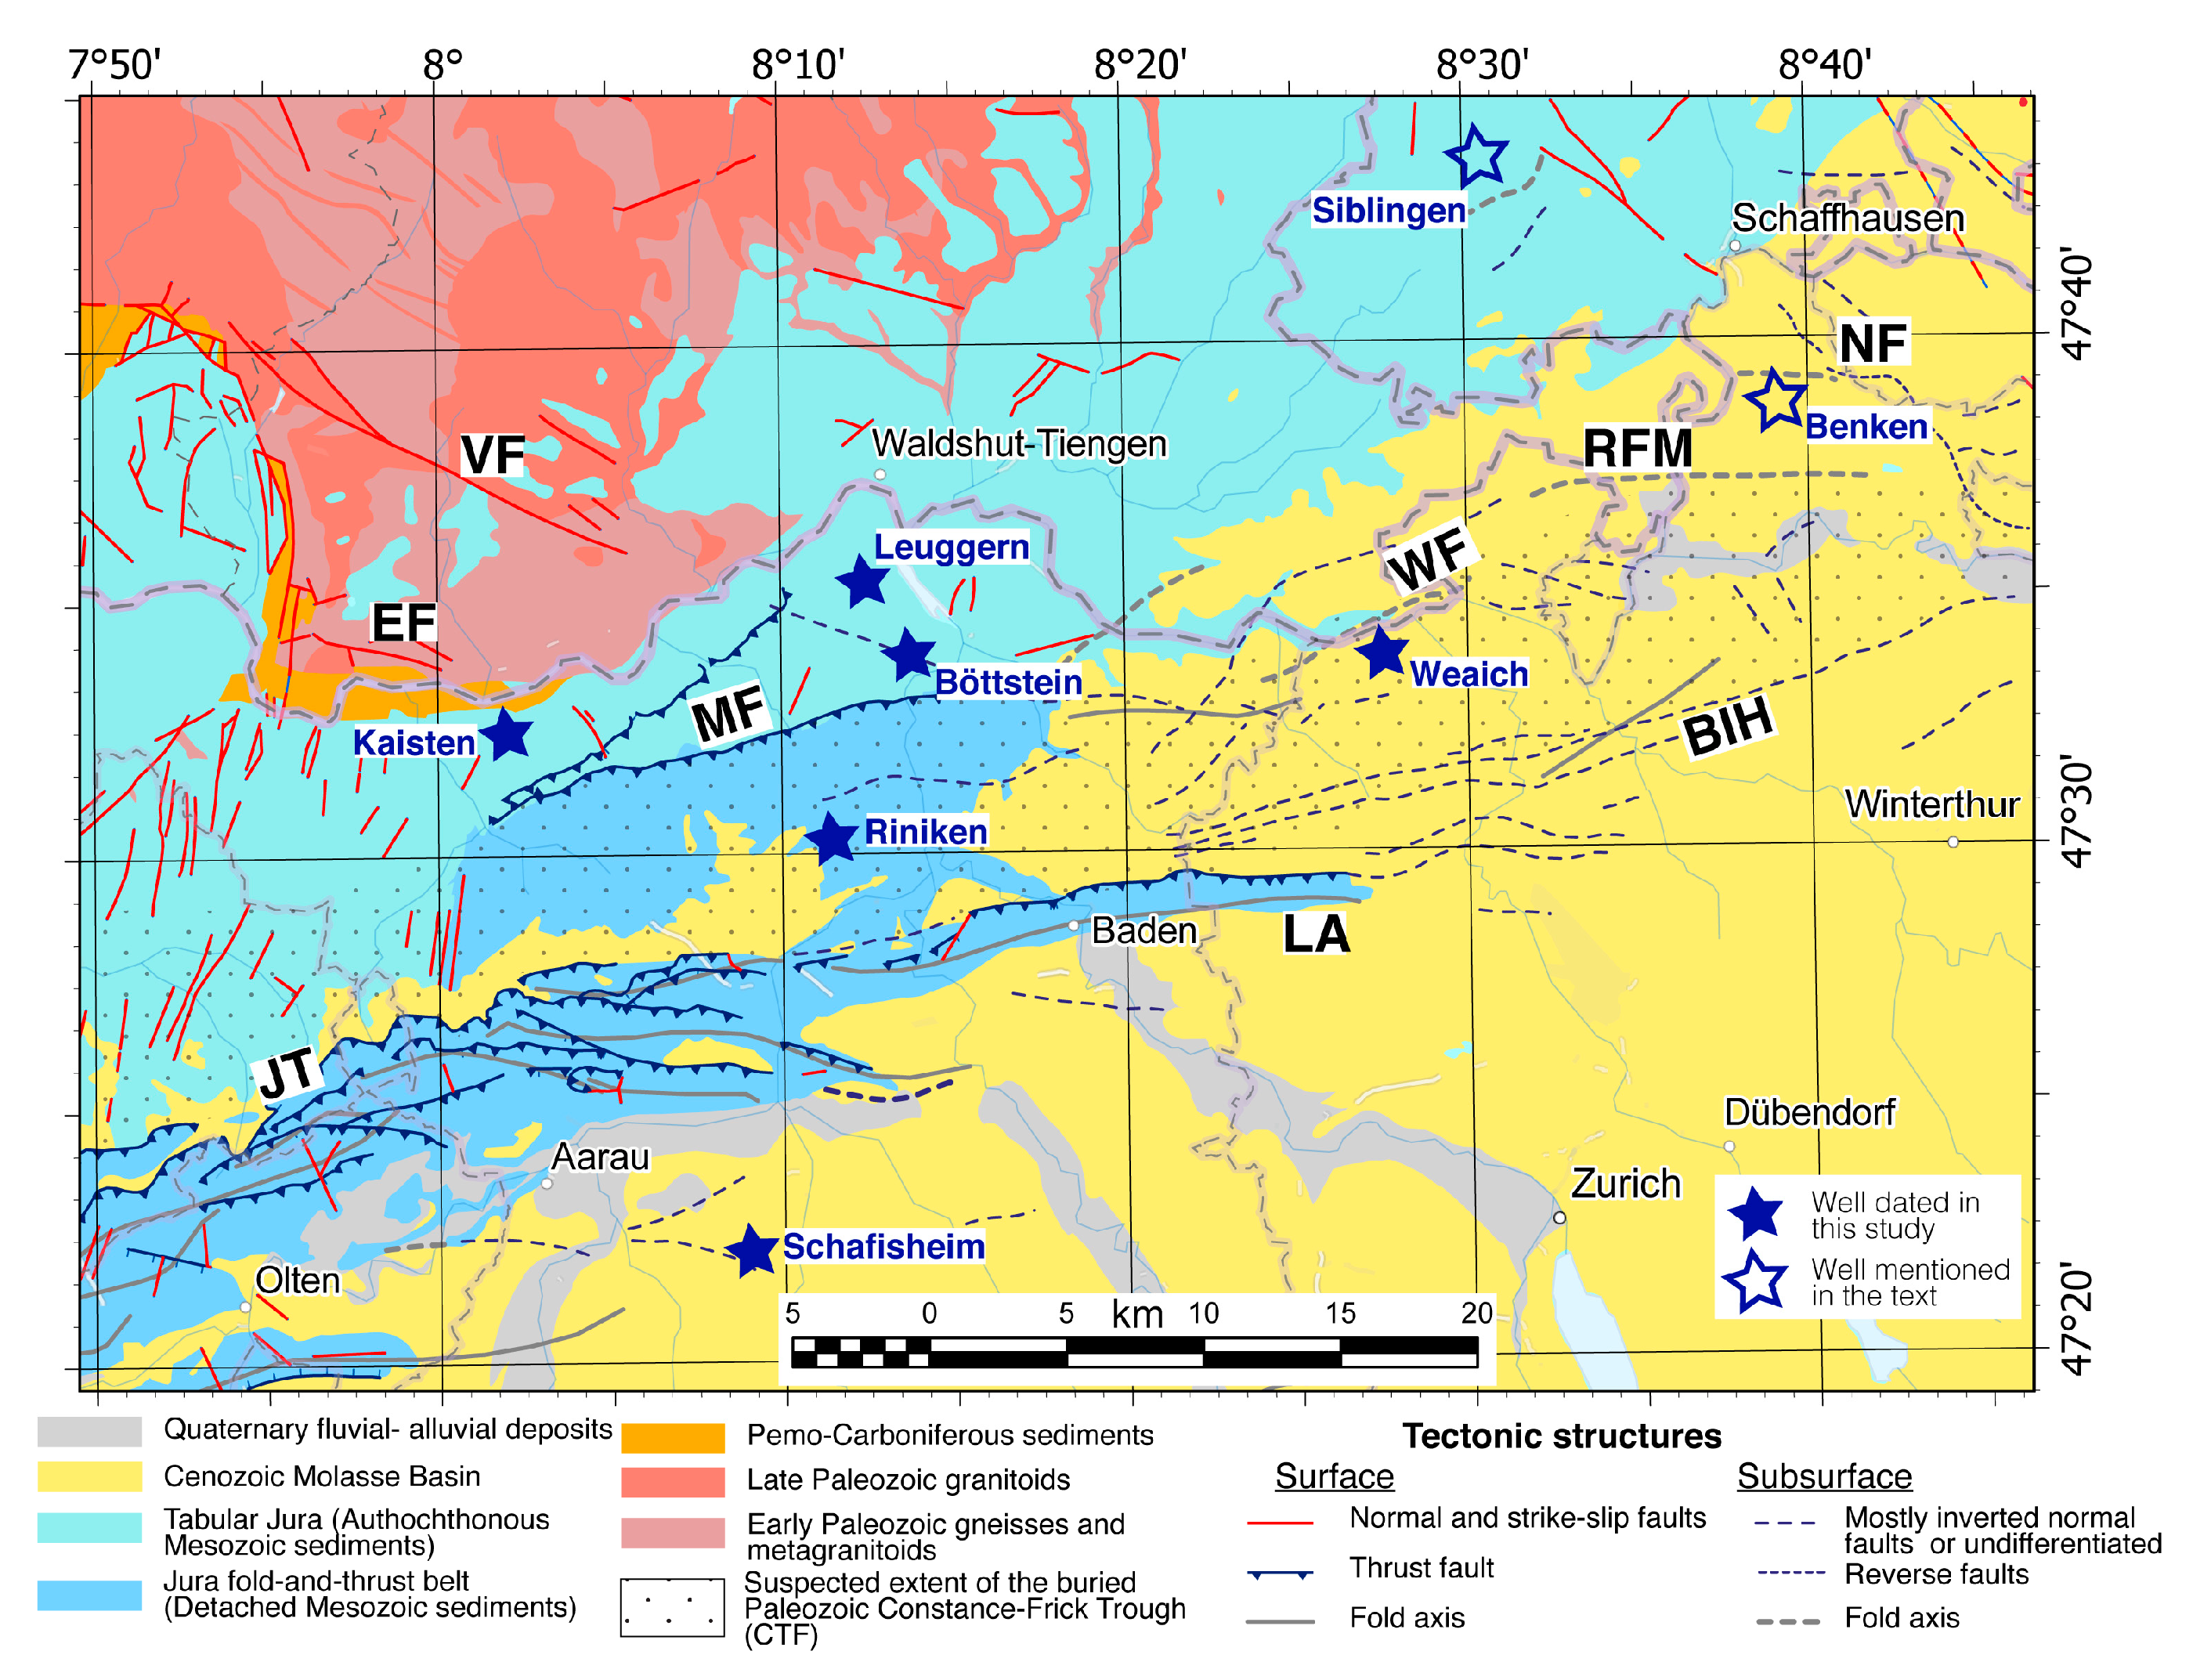
33]. For instance, a well-described Permo-Carboniferous trough in north-eastern Switzerland is the Constance–Frick Trough (CTF;
Figure 2), which started to subside in Late Carboniferous times, reaching maximum depth during Early Permian [
4].
The Late Permian/Early Triassic was characterized by a long-term rift-related thermal subsidence [
32], which regionally led to the opening of the Tethys Ocean. In Central Europe, this was followed by marine sedimentation during the Middle Triassic in an epicontinental sea environment [
34] that lasted at least until the latest Jurassic. During the Jurassic–Cretaceous, the geothermal gradients were cooler (30–50 °C/km) when compared to the Permo-Carboniferous ones [
15].
Although the contact Jurassic–Eocene appears to be conformable on seismic lines, there is a major disconformity between the youngest preserved Jurassic sediments and their overlying Eocene sediments in the north-eastern SMB and the Jura FTB. This important gap in the depositional record has led several authors to propose that a major erosional event occurred prior to Eocene times [
13,
35]. Most authors believe that deposition occurred throughout the Cretaceous, and it is now missing [
14,
15,
36] in north-eastern Switzerland.
Eocene and younger sedimentation in the SMB developed into two main wedge-shaped cycles of shallowing upward deposition. The entire sequence comprises the early underfilled Lower Marine and Lower Freshwater units (UMM and USM, respectively using German acronyms) followed by the overfill deposition of the Upper Marine and Upper Freshwater molasses (OMM and OSM, respectively). The total sedimentary thickness was variable across the basin reaching several kilometers close to the alpine front [
15].
2.3. Some Important Tectonic Structures in the Region
As previously mentioned, one of the best-known Late Paleozoic troughs is the Constance–Frick Trough [
4,
37,
38], which is seismically defined as a low-angle half graben. The Constance–Frick Trough extends beneath the present-day Cenozoic molasse basin north of Zürich and extends westwards beneath the Tabular Jura possibly straddling the border of the Jura FTB through the Jura Main Thrust [
4] (
Figure 2). The northernmost limit of the Constance–Frick Trough is the seismically-defined Mandach Fault (
Figure 2), which is a steeply dipping normal fault that was inverted in Late Neogene times [
4]. The Mandach Fault probably extends at depth as a listric detachment fault [
4].
The faults bordering the Late Paleozoic troughs were probably reactivated during Early Jurassic extension [
34]. The Constance–Frick Trough border faults most likely also played a major role in the compressive Miocene deformation observed in the area, and they were probably reactivated during the Late Neogene Alpine orogeny [
4,
20].
3. Published Thermochronological Work–Conflicting Thermal Histories on the Basin
Existing thermal histories in the SMB have been mostly constrained by vitrinite reflectance and apatite fission track (AFT) data from core samples collected from deep wells throughout the basin [
14,
17,
39] and from surface sedimentary samples [
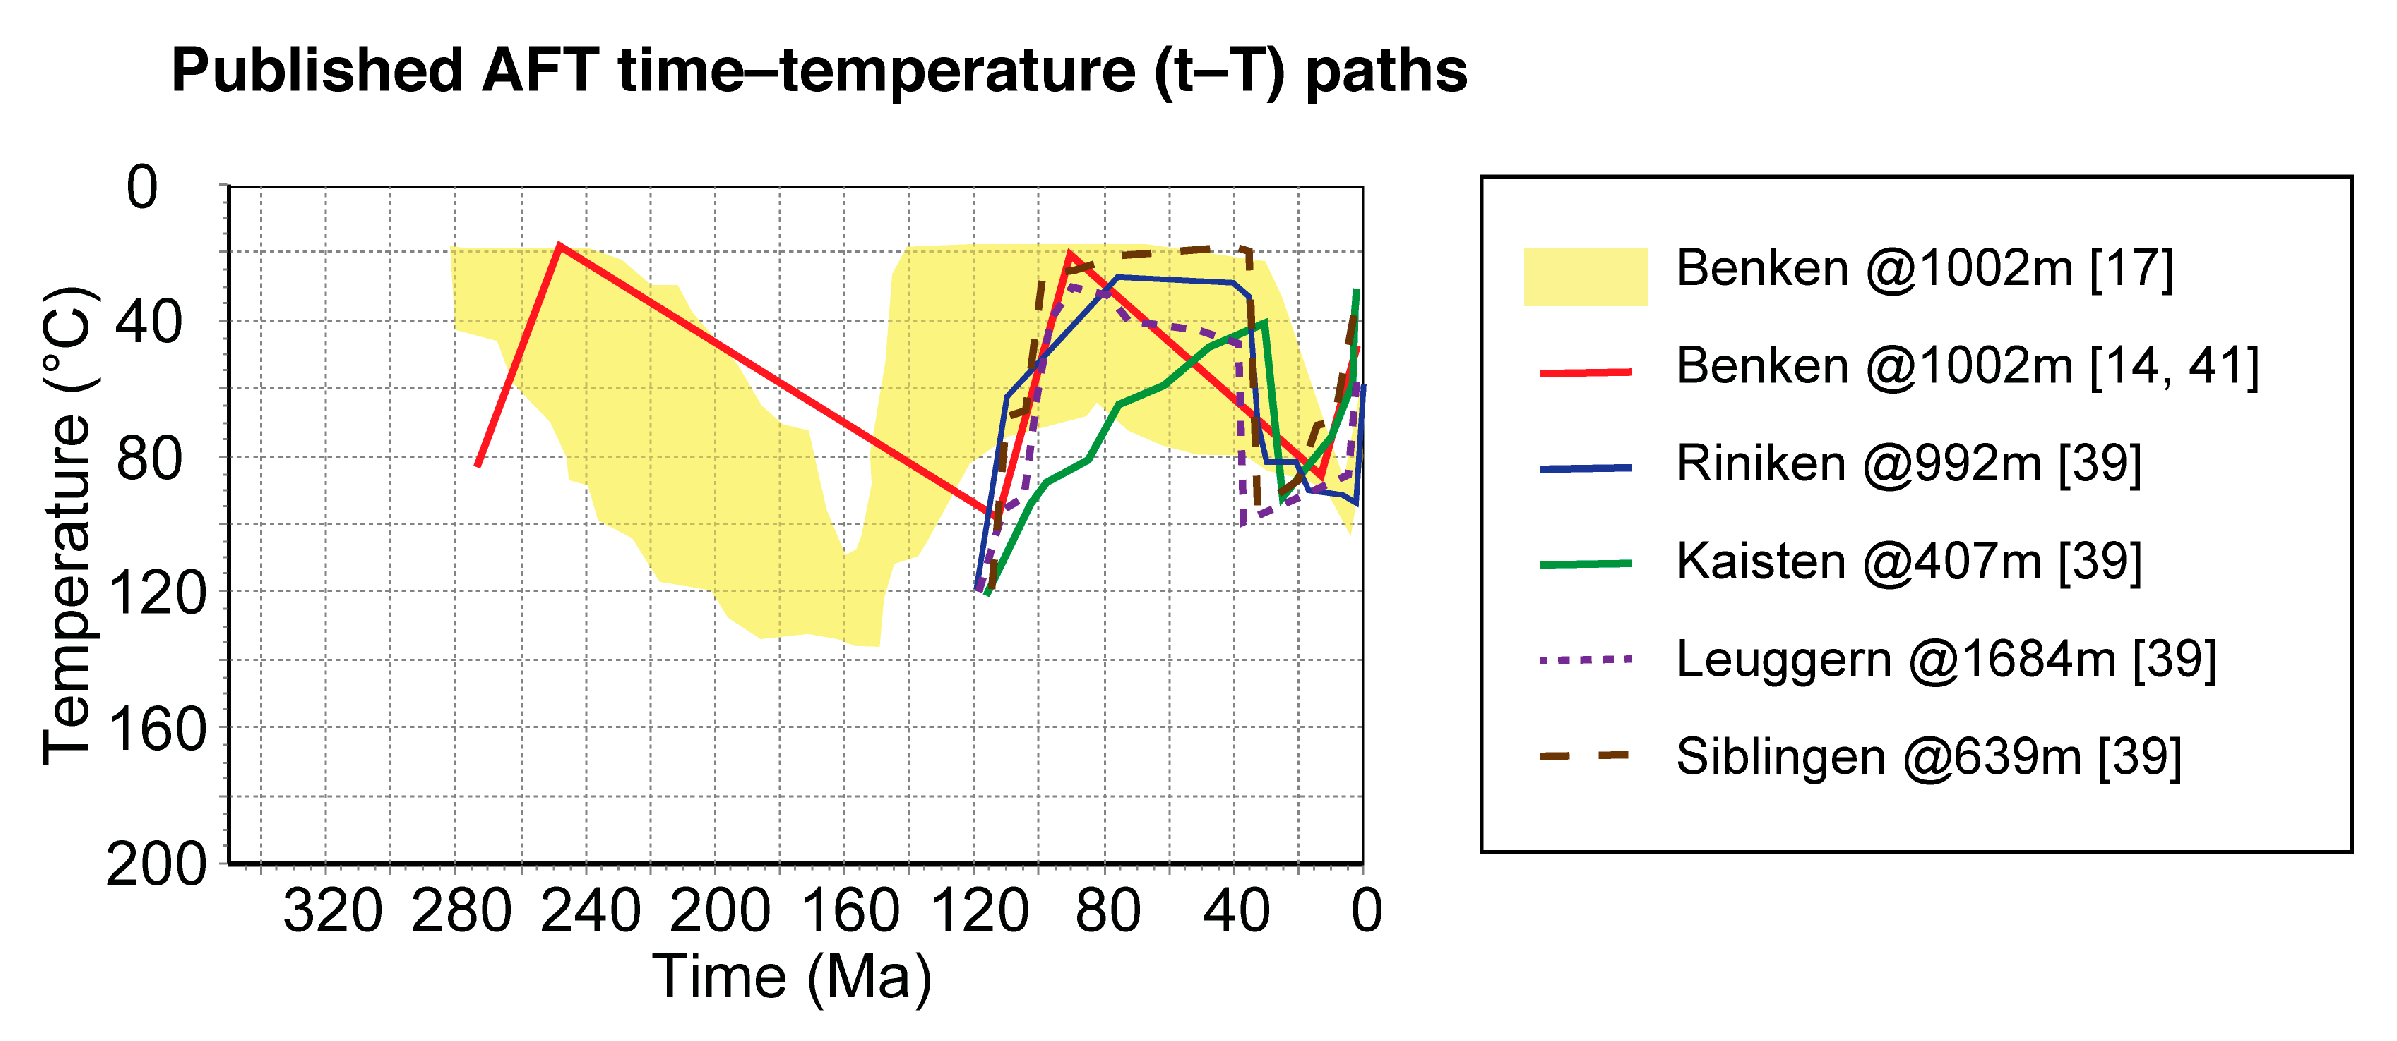
40]. The thermal histories proposed by these works show contrasting solutions.
One of the most referenced works in the region is [
14], which included a series of AFT data obtained commercially by Nagra in the early 1990s [
41]. The results (obtained from borehole samples) presented by [
14] showed a complex basin evolution with high geothermal gradients in Permo-Carboniferous times followed by modest erosion (<1 km) during the Permian. This erosional period was followed by Mesozoic deposition, on which the lowermost deposits reportedly reached up to 100 °C by the end of the Cretaceous. Milder geothermal gradients (30–50 °C/km) were probably present throughout the Mesozoic. Interpretations by [
14] suggested that erosion (removal of 600–700 m of Jurassic and Cretaceous sediments) was responsible for Late Cretaceous–Paleocene cooling. In turn, Miocene molasse sedimentation was responsible for variable heating across the basin. Finally, the SMB was inverted during late Miocene and part of the Miocene molasse section was reportedly eroded (estimates between 750 and 1050 m).
However, a closer look at AFT thermal models by [
14] suggests that the whole Mesozoic section was almost completely exhumed (
Figure 3), and the basement rocks reached near-surface temperatures by the Late Cretaceous (see for instance Benken borehole data [
14]). The best-fit forward model for the Benken well in [
14] (location shown in
Figure 2) calls also for a slow Cenozoic heating event (reaching about 90 °C in the late Miocene) followed by latest Miocene cooling. AFT thermal history interpretations by [
14] are admittedly complicated because they call for rapid changes in lithospheric heat flow coupled with the thermal effects of burial and erosion.
A completely different thermal history than that of [
14] for the same Benken borehole (and same depth) was obtained by a different author [
17]. The latter thermal history rather suggested an important Late Jurassic/Early Cretaceous cooling event followed by isothermal conditions throughout most of the Cretaceous–early Cenozoic and followed by an important heating event from Late Eocene through Miocene (
Figure 3).
Other examples of dissimilar thermal models were presented by [
39] on the same wells (Kaisten, Riniken, Leuggern, Siblingen; locations shown in
Figure 2) analyzed by [
14]. Although the AFT ages from the same wells were roughly similar within error, the thermal models obtained by [
39] suggested two extremely fast Early Cretaceous (cooling) and Eocene (heating) events (
Figure 3). The unreported fast Eocene heating event was ascribed by [
39] to represent hydrothermal fluid circulation during Eocene times.
The evident discrepancies on the thermal models from boreholes of the same region [
14,
17,
39] clearly leave us with doubts regarding the actual thermal history of the basin. In this respect, most of the discrepancies between the published AFT thermal models might be explained by several analytical reasons:
(i) Key parameters used for apatite thermal modelling, which are currently standard practice, were not included in some of the previous publications such as kinetic proxies (e.g., Cl, Dpar) or annealing anisotropy corrections (e.g., c-axis projection).
(ii) Some of the publications [
14] included mainly “forward” modeling leaving, most AFT data unextracted, as opposed to most modern and computer-intensive “inverse” modeling.
(iii) Thermal models from previous publications [
14,
39] were derived using an AFT annealing model [
42] that is known for providing spurious late cooling events, which usually lead to an over interpretation of a kilometer or more of unroofing. The latter cooling is usually considered a modeling artefact with no geological significance (see discussion in [
43]).
(iv) The recent annealing models for thermal history inversion are based on more extensive laboratory annealing experiments than their older counterparts (see discussion in [
44]).
For these reasons, we acquired new AFT data using a state-of-the-art LA–ICP–MS (Laser Ablation Inductively Coupled Plasma Mass Spectrometry) analytical approach (see below) using the latest thermal annealing model available [
44] in order to quantitatively determine the amount of cooling and heating during the Meso–Cenozoic time period.
4. Methodology
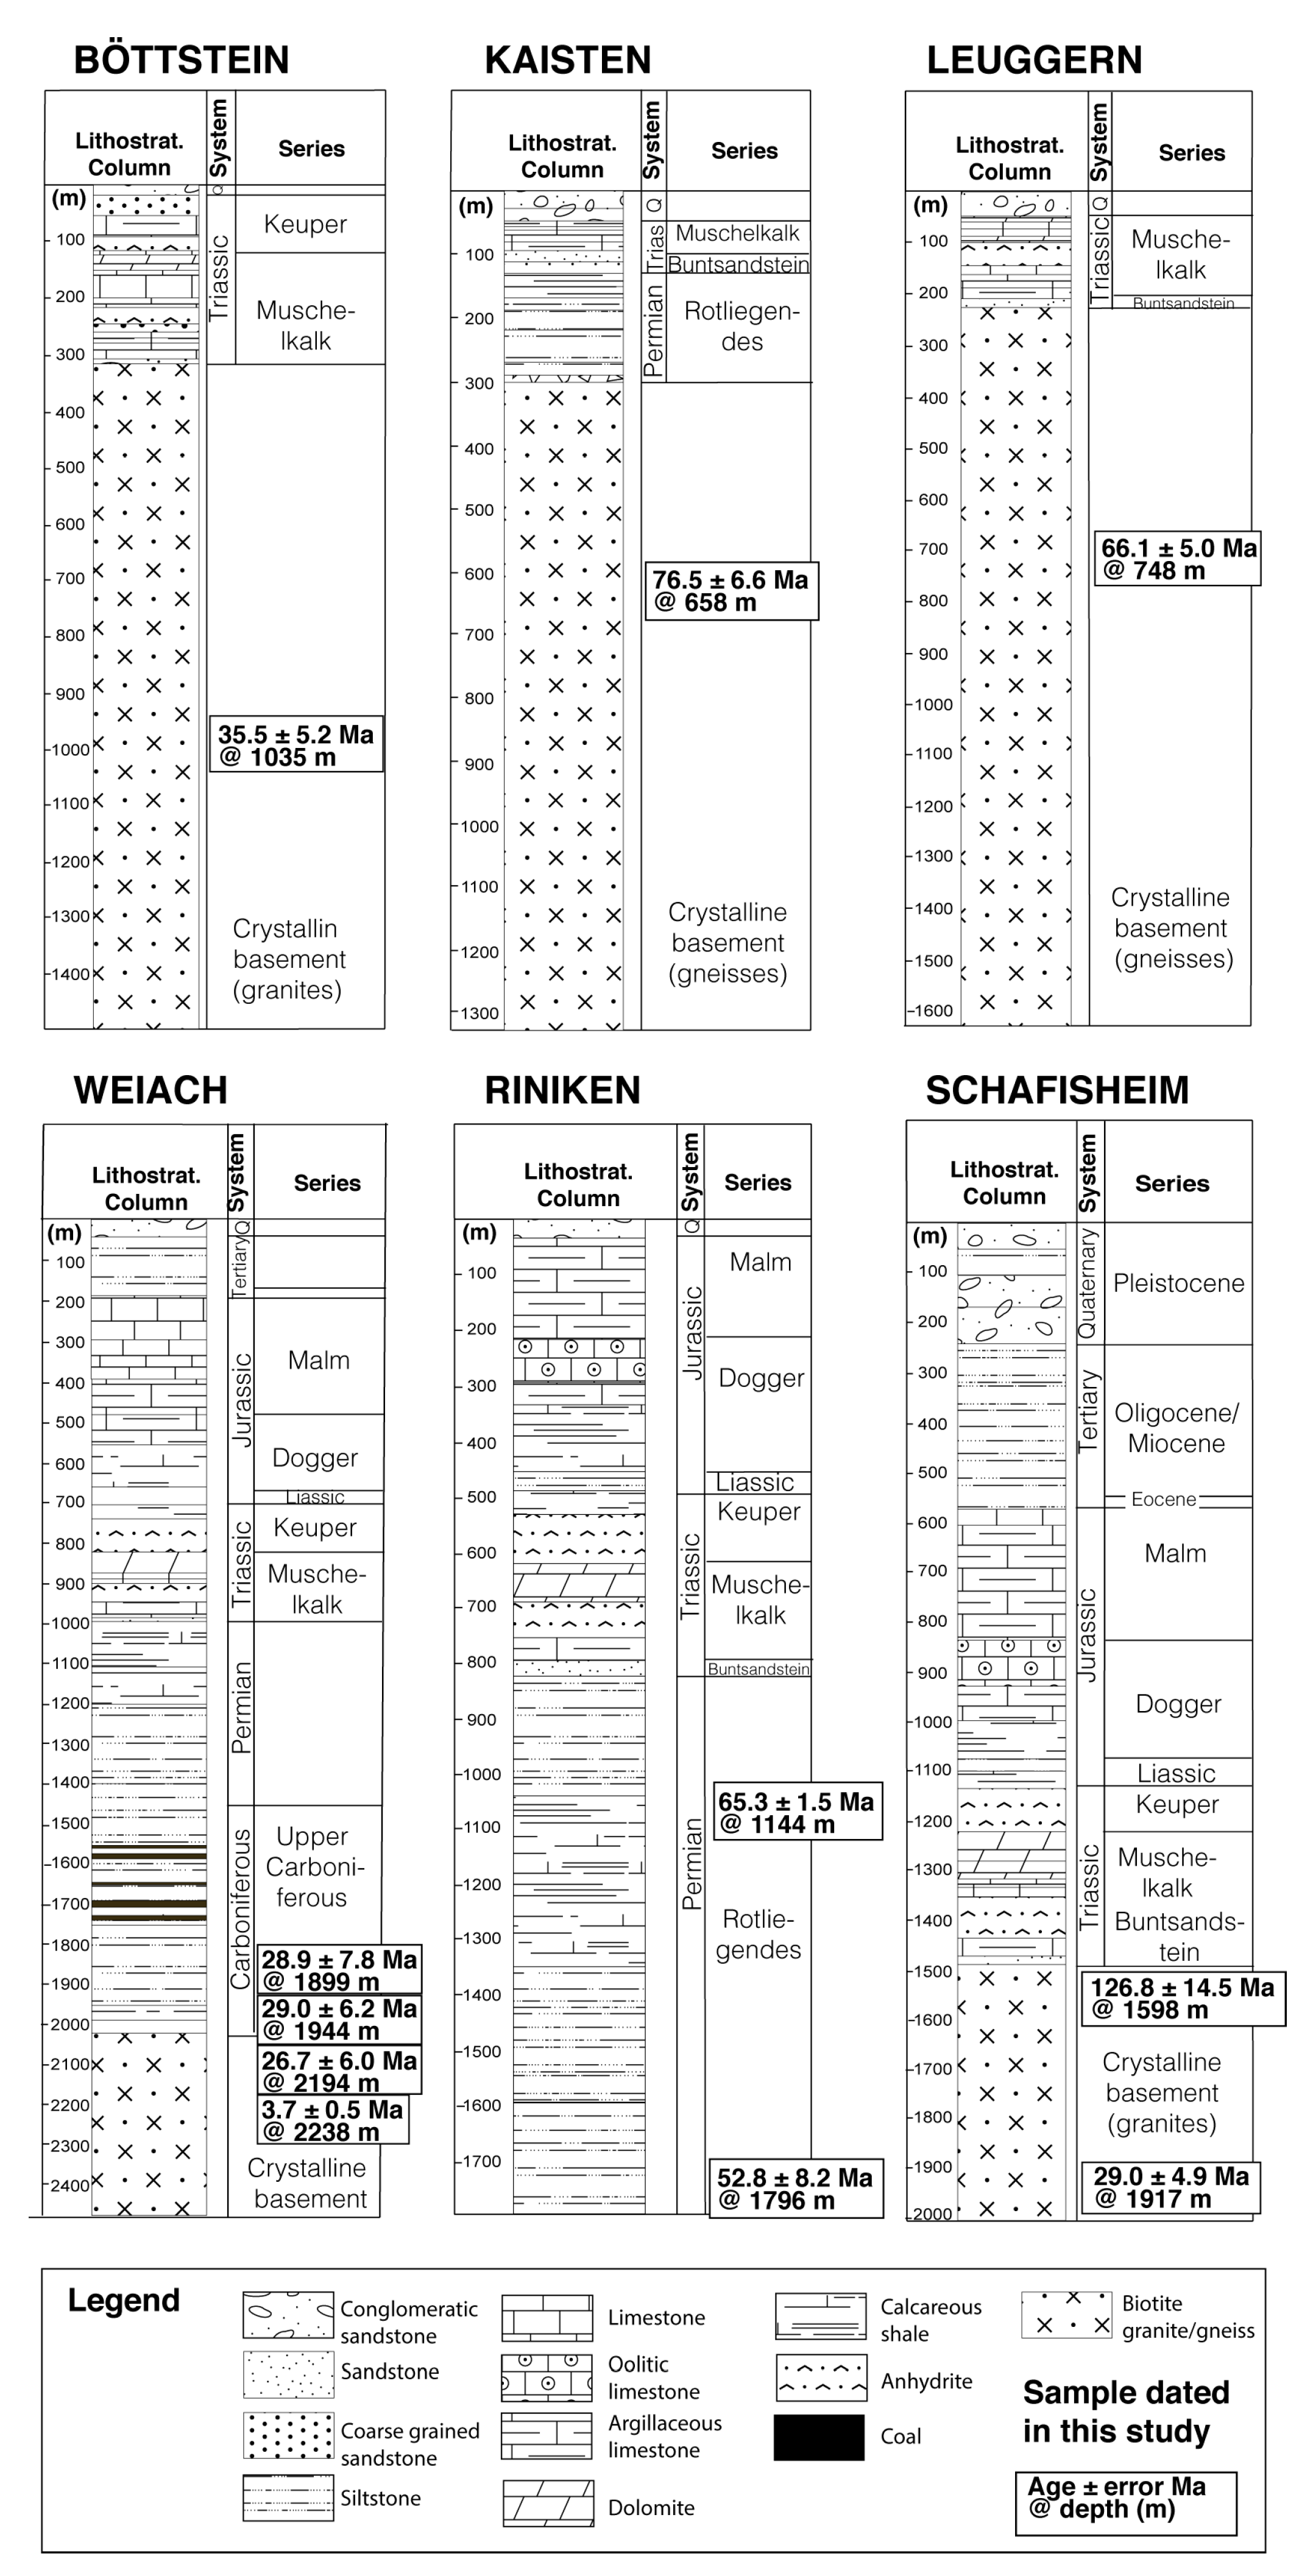
4.1. Sampling
Pre-Triassic units were sampled from borehole cores (
Figure 2) collected from the Swiss Geological Survey (Swisstopo) core repository, located in Hochdorf (Canton of Luzern). The wells analyzed form part of a Nagra drilling campaign (carried out between 1983 and 1984), which aimed to characterize the crystalline basement in order to evaluate the feasibility of nuclear waste repository [
6,
7,
8,
9,
10,
11]. The stratigraphic sections for each well are shown in
Figure 4. All samples were collected from depths between 658 and 2238 m and include:
(a) Mid–Late Paleozoic granitoids and metasediments in the Böttstein, Kaisten, Leuggern, Weiach, and Schafisheim wells, which were sampled immediately below the major Mesozoic unconformity (
Figure 4).
(b) Permian and Carboniferous non-metamorphosed sediments in the Riniken and Weiach wells, respectively (
Figure 4).
4.2. Methods
Apatite fission track (AFT) thermochronology provides quantitative thermal history information between ≈120 and 60 °C, corresponding to the upper 2–4 km of the crust depending on the geothermal gradient [
45]. Apatite fission tracks partially anneal within the apatite partial annealing zone (APAZ), which has been defined by both laboratory time-scale experiments and field observations [
46]. Thus, track annealing kinetics and the temperature bounds of the APAZ are also a function of apatite composition [
47,
48].
AFT age data were acquired by the Laser Ablation Inductively Coupled Plasma Mass Spectrometry (LA–ICP–MS) approach at the University of Geneva and the University of Lausanne in an identical approach to [
49,
50]. Natural fission tracks crossing the polished apatite grains surface were etched for counting using: 5.5 N HNO
3 for 20.0 (±0.5) seconds at 21.0 °C with a high-precision water bath. Mounts were scanned to search for the best apatite grains for age dating and grain location, and pictures were digitally recorded with a high-resolution camera for potential reinvestigations. Spontaneous fission tracks were counted on-screen, using a Microscope Zeiss Axio–Imager.z1, which is digitally connected to a high-resolution screen.
Grain localities were further revisited using a LA–ICP–MS facility (an Element XR sector-field ICP-MS interfaced to a Resolution 193 nm excimer ablation system equipped with an S155 two-volume ablation cell) at the University of Lausanne in order to determine
238U concentrations and other elemental compositions. The analyses used a single laser spot (laser spot size was kept constant during all sessions at 38 μm). The cylindrical pit was excavated to a depth beyond which uranium did not contribute fission tracks to the etched grain surface (the depth of the pit was about 7 μm). We used SRM612 as primary reference material for trace element composition. The raw elemental data were reduced using LAMTRACE, using only SRM612 glass as the primary trace element abundance standard.
42Ca served as an internal standard (all extra analytical details, as well as age calculations are described in [
51].
Potential thermal history solutions are derived by inverse modelling the AFT age data, track lengths, and compositional data using the HeFTy
® software (v.1.9.3) [
52]. We used
Dpar (mean maximum diameter of fission track etch figures parallel to the crystallographic c-axis) [
53] as a proxy for the apatite chemistry required for the multi-compositional annealing algorithms. The inverse modelling is a controlled random search procedure that predicts thermal history paths that closely match the observed AFT analytical data. The procedure was performed using the annealing algorithm of [
44].
5. Results
5.1. AFT Ages and Length Results
Sample details and AFT data from the Tabular Jura mountains (Böttstein, Kaisten, Leuggern wells), the Jura FTB domain (Riniken, Weiach wells), and from the SMB (Schafisheim well) are shown in
Table 1 and
Figure 4. AFT ages obtained from the Tabular Jura mountains samples range from 35.5 ± 5.2 to 76.5 ± 6.6 Ma, whereas AFT ages from the Jura FTB samples range from 65.3 ± 1.5 to 3.7 ± 0.5 Ma. A few samples from the SMB have AFT ages of 126.8 ± 14.5 and 29.0 ± 4.94 Ma. All samples show evidence of prolonged partial annealing, with mean track lengths ranging between 10.18 ± 2.12 and 12.57 ± 0.80 μm (
Table 1,
Supplementary Table S1).
5.2. AFT Modeling Constraints
In the absence of a reliable and comprehensive bottom hole temperature (BHT) data set to determine the present-day temperature required by the modeling, we have modeled the AFT data assuming a regional present-day geothermal gradient of 35 °C/km and an average surface temperature of 15 °C. The assumed geothermal gradient is in line with existing well temperature data, and it is also within the expected range for stable continental areas. Present-day temperature gradients for the Riniken, Kaisten, and Leuggern wells is in the order of 35 °C/km below shallow depths of 300 m [
8,
9,
10]. The Schafisheim well has an average gradient of 37 °C/km for depths below 1000 m [
11]. The Böttstein well has a geothermal gradient of 34 °C/km measured along the whole crystalline section [
6]. The Weiach well has reportedly an average 41 °C/km (although with a highly scattered determination; [
7]).
Nonetheless, the inverse modeling performed with HeFTy
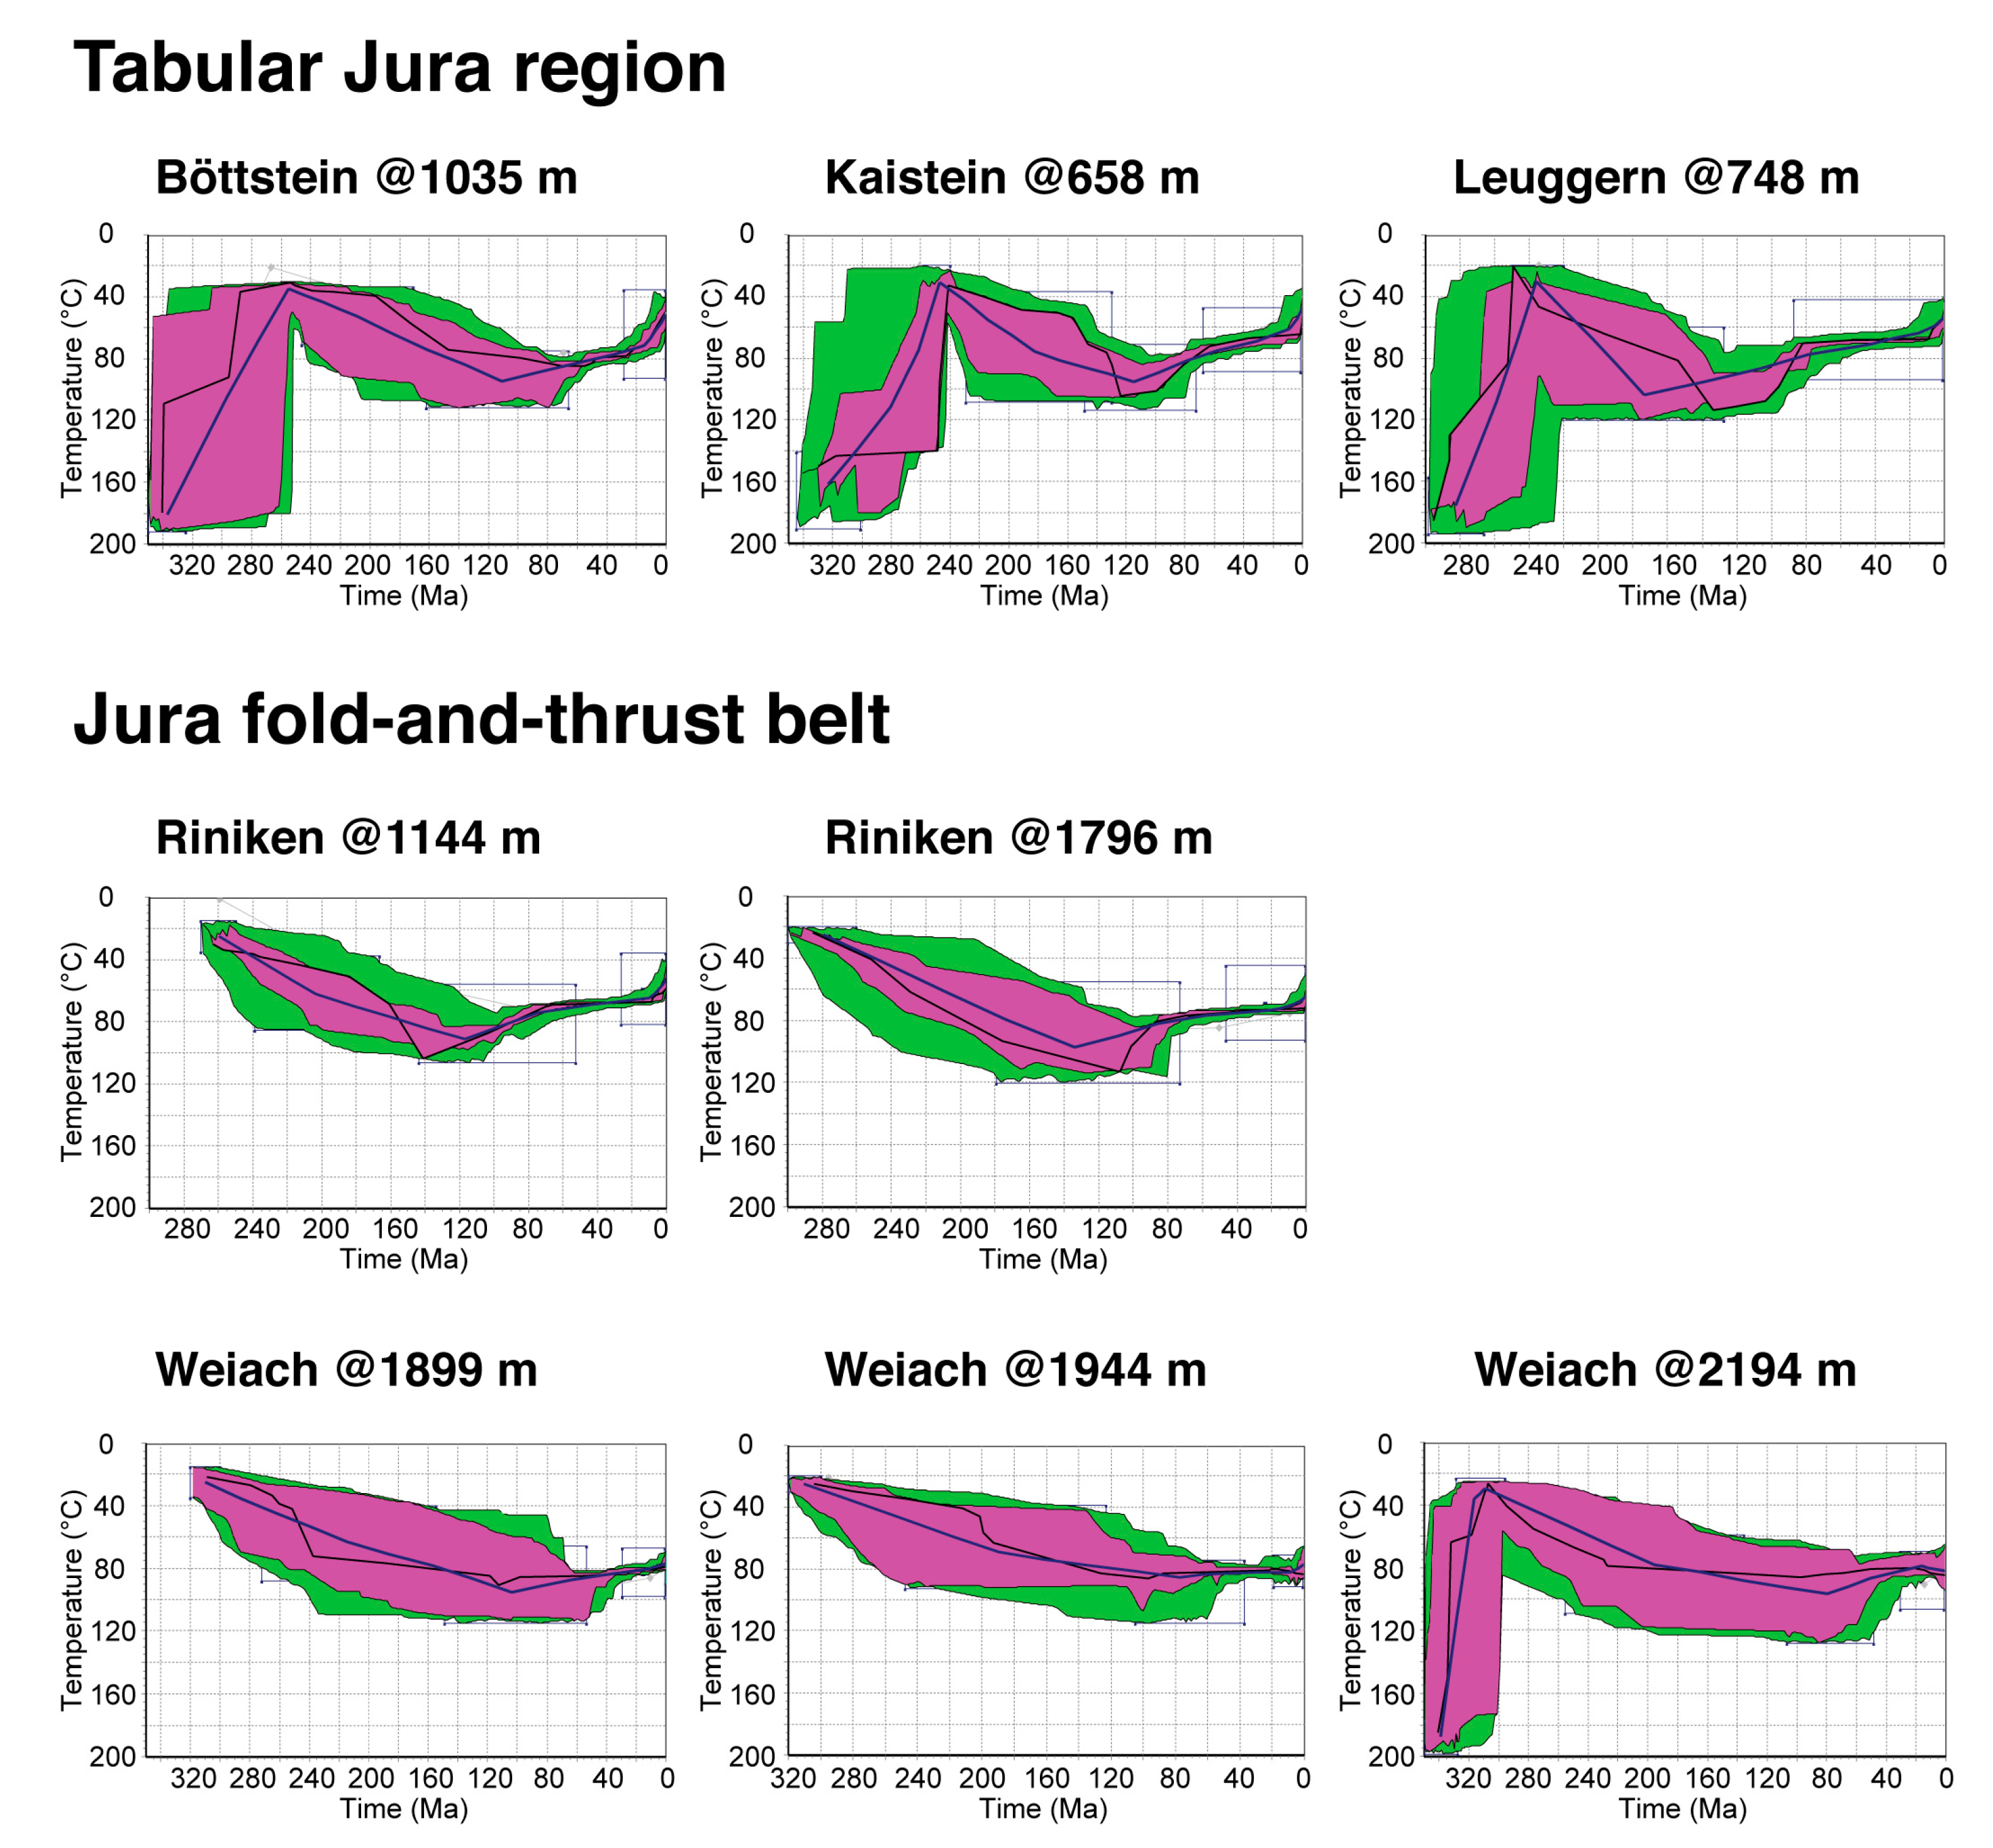
® included a relatively open (±10 °C) present day-temperature value at the appropriate sample depth in order to account for possible uncertainties. Goodness of fit parameters, which indicate the fit between measured length distribution and the modeled data, resulted in values close to 1. Our interpretations are based upon the best-fit model, the good-fit, and acceptable-fit envelope of solutions yielded by the thermal models (see
Figure 5).
5.3. AFT Thermal Histories
- ▪
Metasedimentary basement samples from the Tabular Jura region (Böttstein, Kaisten, and Leuggern wells):
All the basement rocks dated from this region are overlain by non-metamorphosed Triassic sediments (
Figure 4), meaning that they were exposed at the surface at least toward the end of the Permian. The good-fit solutions suggest that these samples were heated continuously from Late Permian until the Early Cretaceous to temperatures close to 100 °C (
Figure 5). Thus, the basement rocks immediately underlying the Mesozoic sediments were never heated above 120 °C (corresponding to the total annealing zone). The thermal models suggest a very slow Late Cretaceous cooling (100 Ma to 70 Ma) from 100 °C to about 80–70 °C at rates of ≈1 °C/My. In addition, the good-fit models (
Figure 5) suggest that these samples roughly stayed at isothermal conditions throughout the early Cenozoic and were finally slowly cooled at around 20–15 Ma (early–mid Miocene) from 70 °C until present-day well temperatures (≈50 °C).
- ▪
Sedimentary and crystalline basement samples from the Jura FTB (Riniken and Weiach wells):
In these wells, both Permo-Carboniferous sediments and older crystalline basement rocks were sampled (
Figure 4). The AFT models show that all samples were continuously heated from Permian to Early Cretaceous (≈100 Ma) until temperatures were between 80 and 100 °C (
Figure 5). An episode of very slow cooling, Late Cretaceous (100 to 80 Ma) in age, was observed in the Riniken well, where samples cooled from 90 to about 70 °C at rates as low as 1 °C/My.
The good-fit thermal solutions show more or less isothermal conditions for most of the Cenozoic. A net drop in temperature by a ≈10 °C (final temperatures depending on the well) is recorded after 10 Ma. This late Miocene cooling postdates onset of cooling observed in the Tabular Jura region (early–mid Miocene).
- ▪
Granitoids flooring the SMB s.s. (Schafisheim well):
No samples from granitoid rocks yielded enough AFT data for a robust AFT thermal modeling of the basement flooring the SMB.
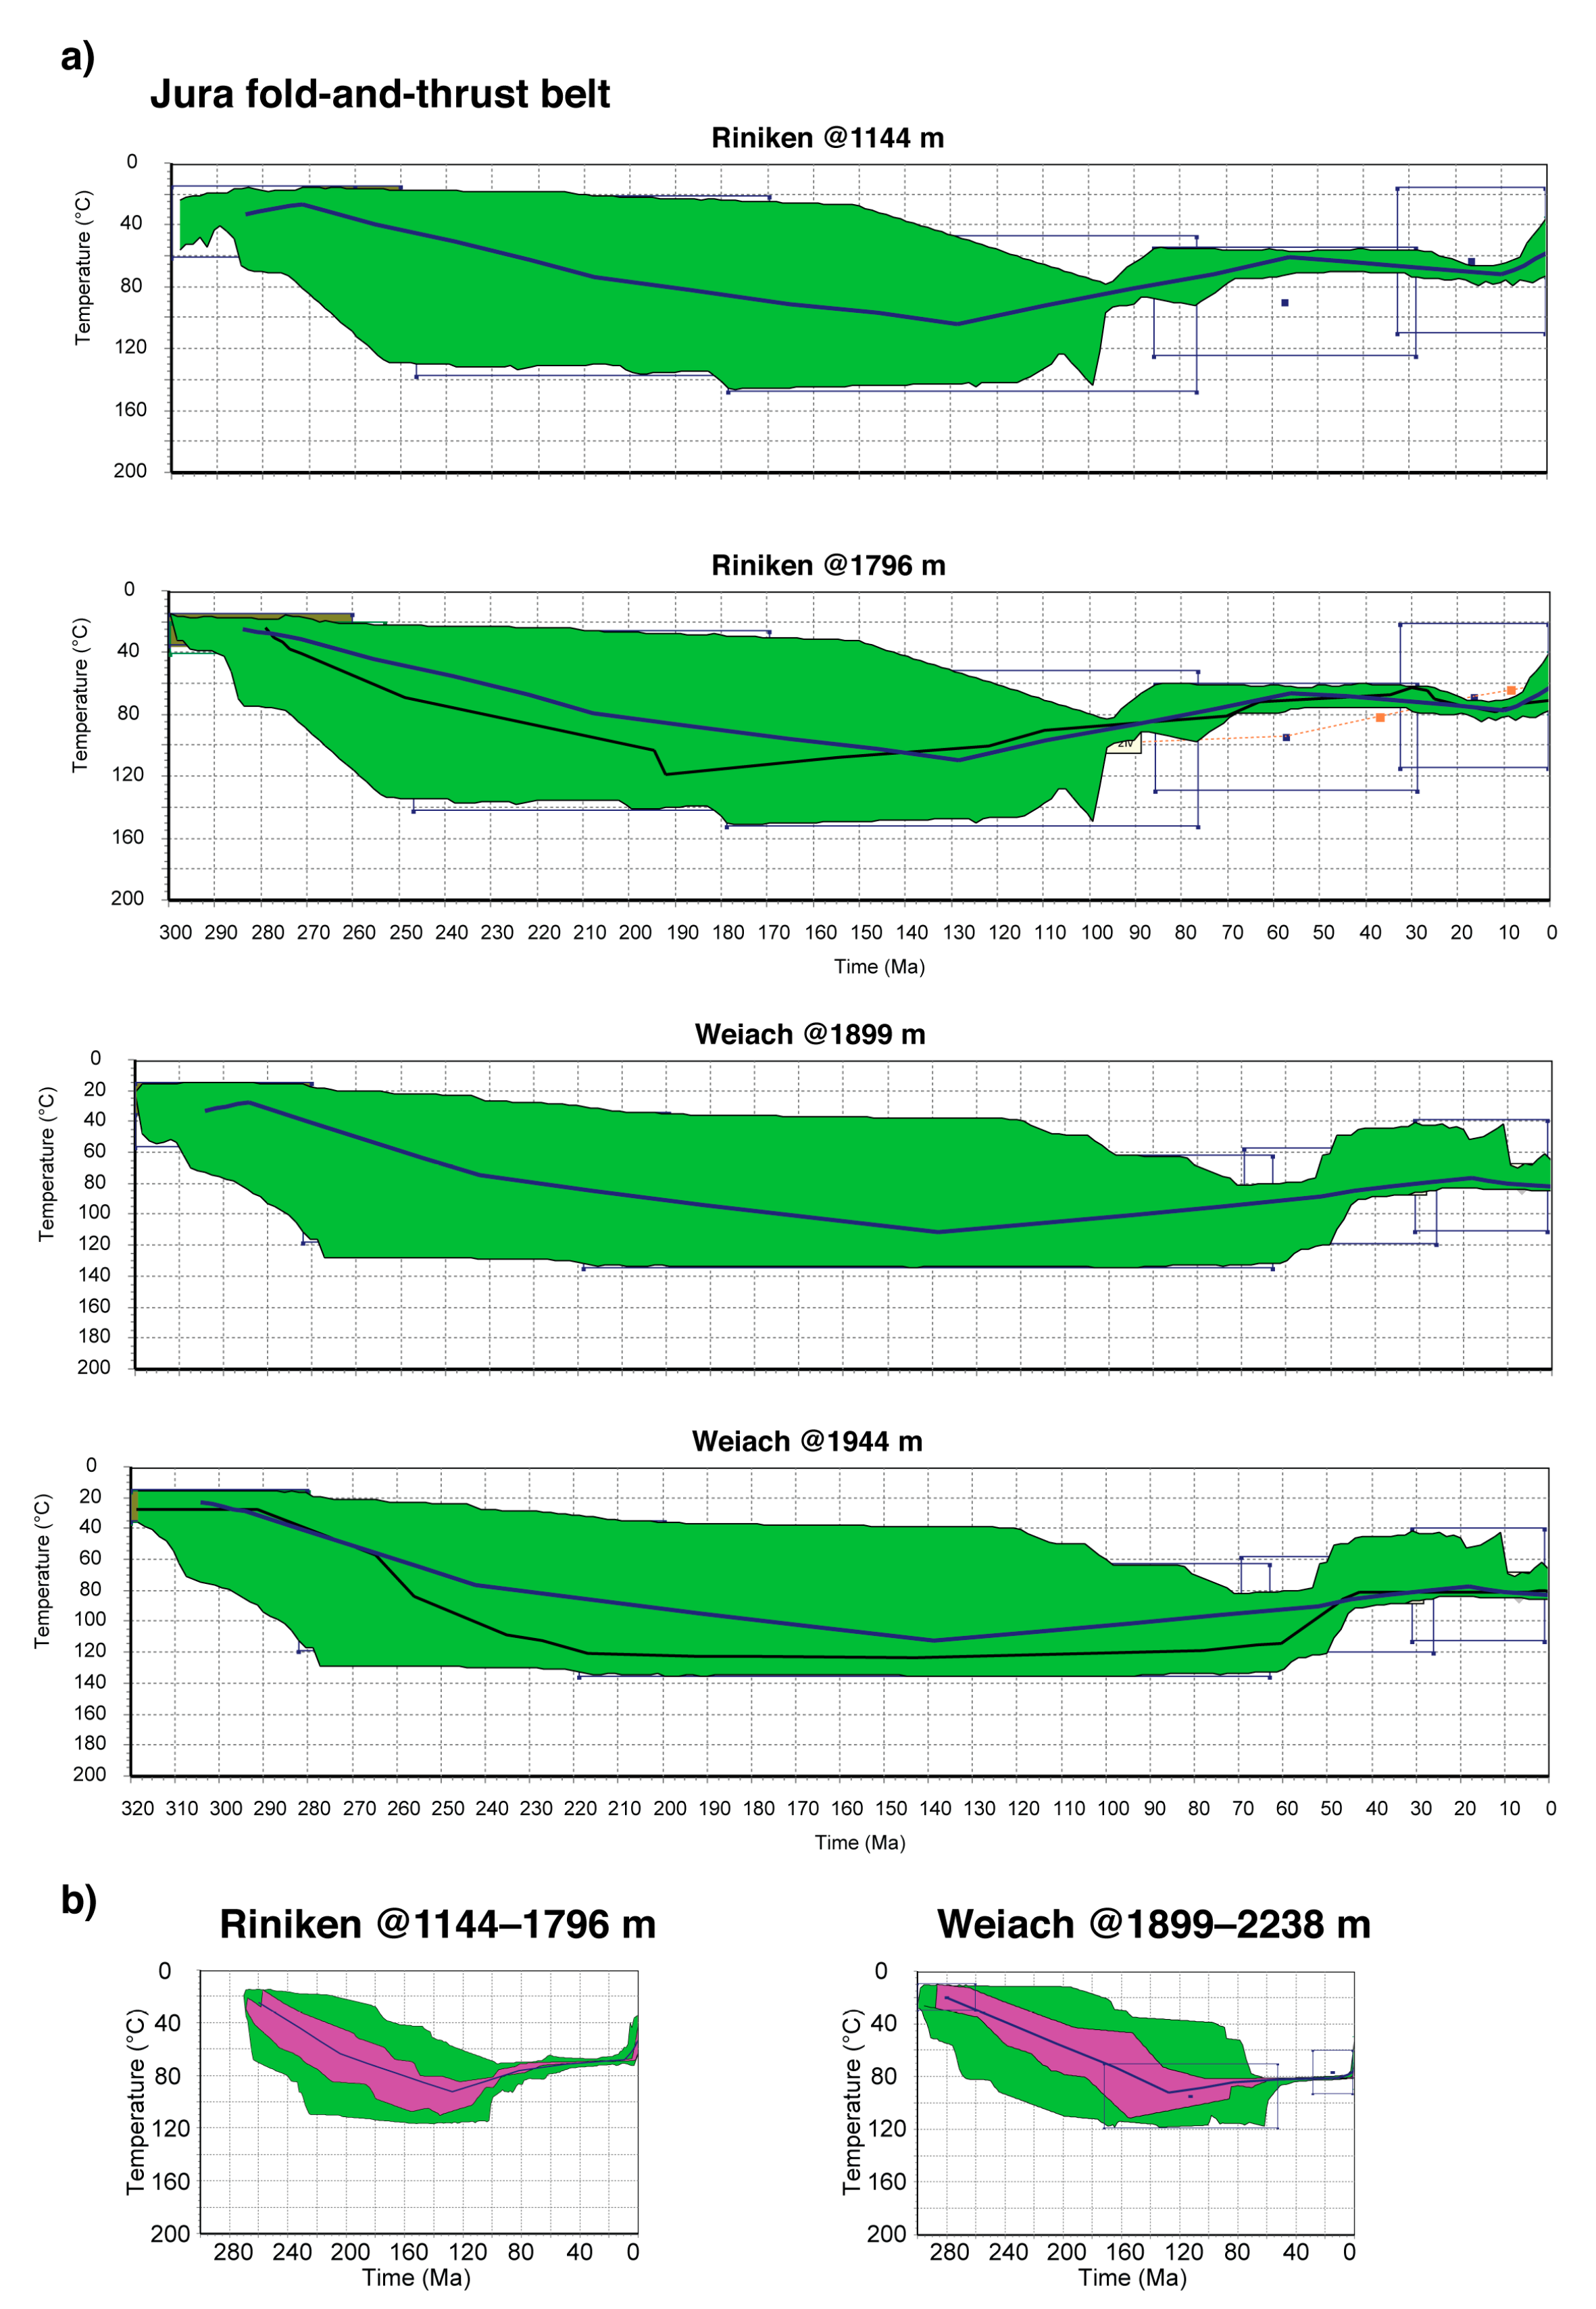
We also modeled samples from the same well in parallel assuming continuous burial between samples that are not separated by unconformities, following the approach of [
60]. Results are shown in
Figure 6A and correspond to samples @1144 m and @1796 m for Riniken and samples @1899 m and @1944 m for Weiach. Although the modeling did not yield good solutions fitting all data, the simultaneous modeling shows a wider acceptable solution range, with the best-fit solution following roughly the same path observed in
Figure 5 (single-sample modeling). This wider acceptable range of the combined inversion broadens possibilities of Miocene heating and cooling but still rules out extreme events of heating and cooling.
For visualization purposes and to increase robustness, we have grouped and remodeled all the AFT age and length data from samples of the same boreholes (
Figure 6b). Samples possibly correspond to the same geological units (no missing section between samples). The results for wells Weiach and Riniken in the Jura FTB are shown in
Figure 6b, and their integrated thermal models do not differ substantially from the single-sample models (
Figure 5). The integrated results show that despite the limited amount of data, the complex thermal history (with extreme heating and cooling events) suggested by previous authors is probably not accurate.
6. Interpretation of the Thermal History
The AFT thermal models of basement rocks in the Tabular Jura and Jura FTB areas provide significant information on the thermo-tectonic history of the region. Herein, we assume that heating is mainly driven by sedimentary burial and cooling caused by erosional exhumation. We use the term erosional exhumation to mean vertical upward movement of rocks with respect to the Earth’s surface, representing a reduction of overburden due to erosion. Changes in lithospheric heat flow following the thinning of the lithosphere for rifting can be also a factor controlling basement temperature [
61,
62,
63], as suggested by previous authors for the Mesozoic rifting events registered in the SMB substratum [
14,
15,
64]. Unfortunately, this cannot be constrained by our dataset, and we take our Early Mesozoic cooling/heating rates as maximum exhumation/burial estimates. In the absence of more reliable constrains for Early Mesozoic, we consider the paleo-geothermal average gradient of 40 °C/km proposed by [
15] as a maximum estimate (see below).
Lithospheric heat flux changes in temperature probably did not impact significantly the latest Cretaceous–Cenozoic part of the history once Early Mesozoic rifting ended. Therefore, constant normal geothermal gradient between 30 and 25 °C/km is used to convert cooling into exhumation during the Latest Cretaceous–Cenozoic.
Although the Weiach well shows an important record of Carboniferous sediments (>500 m), herein below, we are interested in the Late Permian and younger part of the thermal history.
6.1. Latest Permian to Early Cretaceous Burial in the Tabular Jura and Jura FTB
The thermal histories of the basement yielded by the AFT models (
Figure 5) show a continuous heating (differential heating of more than ≈70 °C) that is consistent with a continued sedimentation from Late Permian to Early Cretaceous.
The maximum preserved thickness of Permian to Jurassic sediments is found in the Riniken and Weiach wells (up to 1.7 km;
Figure 4), which are located along the Paleozoic Constance–Frick Trough. In all the other wells, only a few hundred meters or a complete absence of Permian deposits is observed, whereas Triassic to Jurassic preserved deposits range from 100 to 300 m (Böttstein, Kaisten, Leuggern wells) to 1000 m (Schafisheim well) (
Figure 4). The preserved thickness of Permian to Upper Jurassic sediments clearly does not account for the observed heating (differential heating of ≈70 °C), meaning that the original section should have been thicker and/or the geothermal gradients operating during that time should have been higher. Although [
15] suggested that Mesozoic prevailing geothermal gradients averaged 40 °C/km, we prefer a more conservative estimate of 30–35 °C/km, given that rift-related setting had already ceased by the Middle Triassic. Therefore, we estimate that about 2 km of sediments were deposited during this time period over most of the region.
6.2. Late Cretaceous Exhumation in the Tabular Jura and Jura FTB
The Late Cretaceous cooling from ≈100 to 80 °C between 100 and 80 Ma is observed in most of the wells, in particular in Tabular Jura. This cooling event can be related to the erosional exhumation and removal of part of the Lower Cretaceous/Jurassic section. In this case, by considering a Late Cretaceous geothermal gradient of 30 °C/km, such slow cooling rates (up to 1 °C/My) imply a removal of 1 km of the sedimentary pile during the 100 and 80 Ma time interval.
6.3. Early–Mid Cenozoic Burial History in the Tabular Jura and Jura FTB
The thermal history of the basement rocks in the region supports relatively stable conditions throughout most of the Cenozoic. This implies that a reduced sediment thickness was deposited on the Jura mountains area during this period. This is somehow reflected in the present day-sections of the Riniken, Kaisten, and Leuggern wells, where a reduced thickness of Cenozoic deposits is preserved (less than 100 m,
Figure 4).
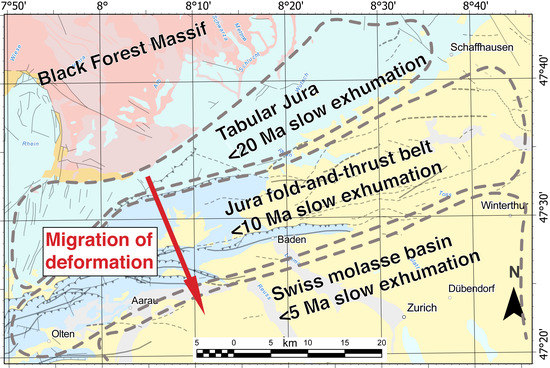
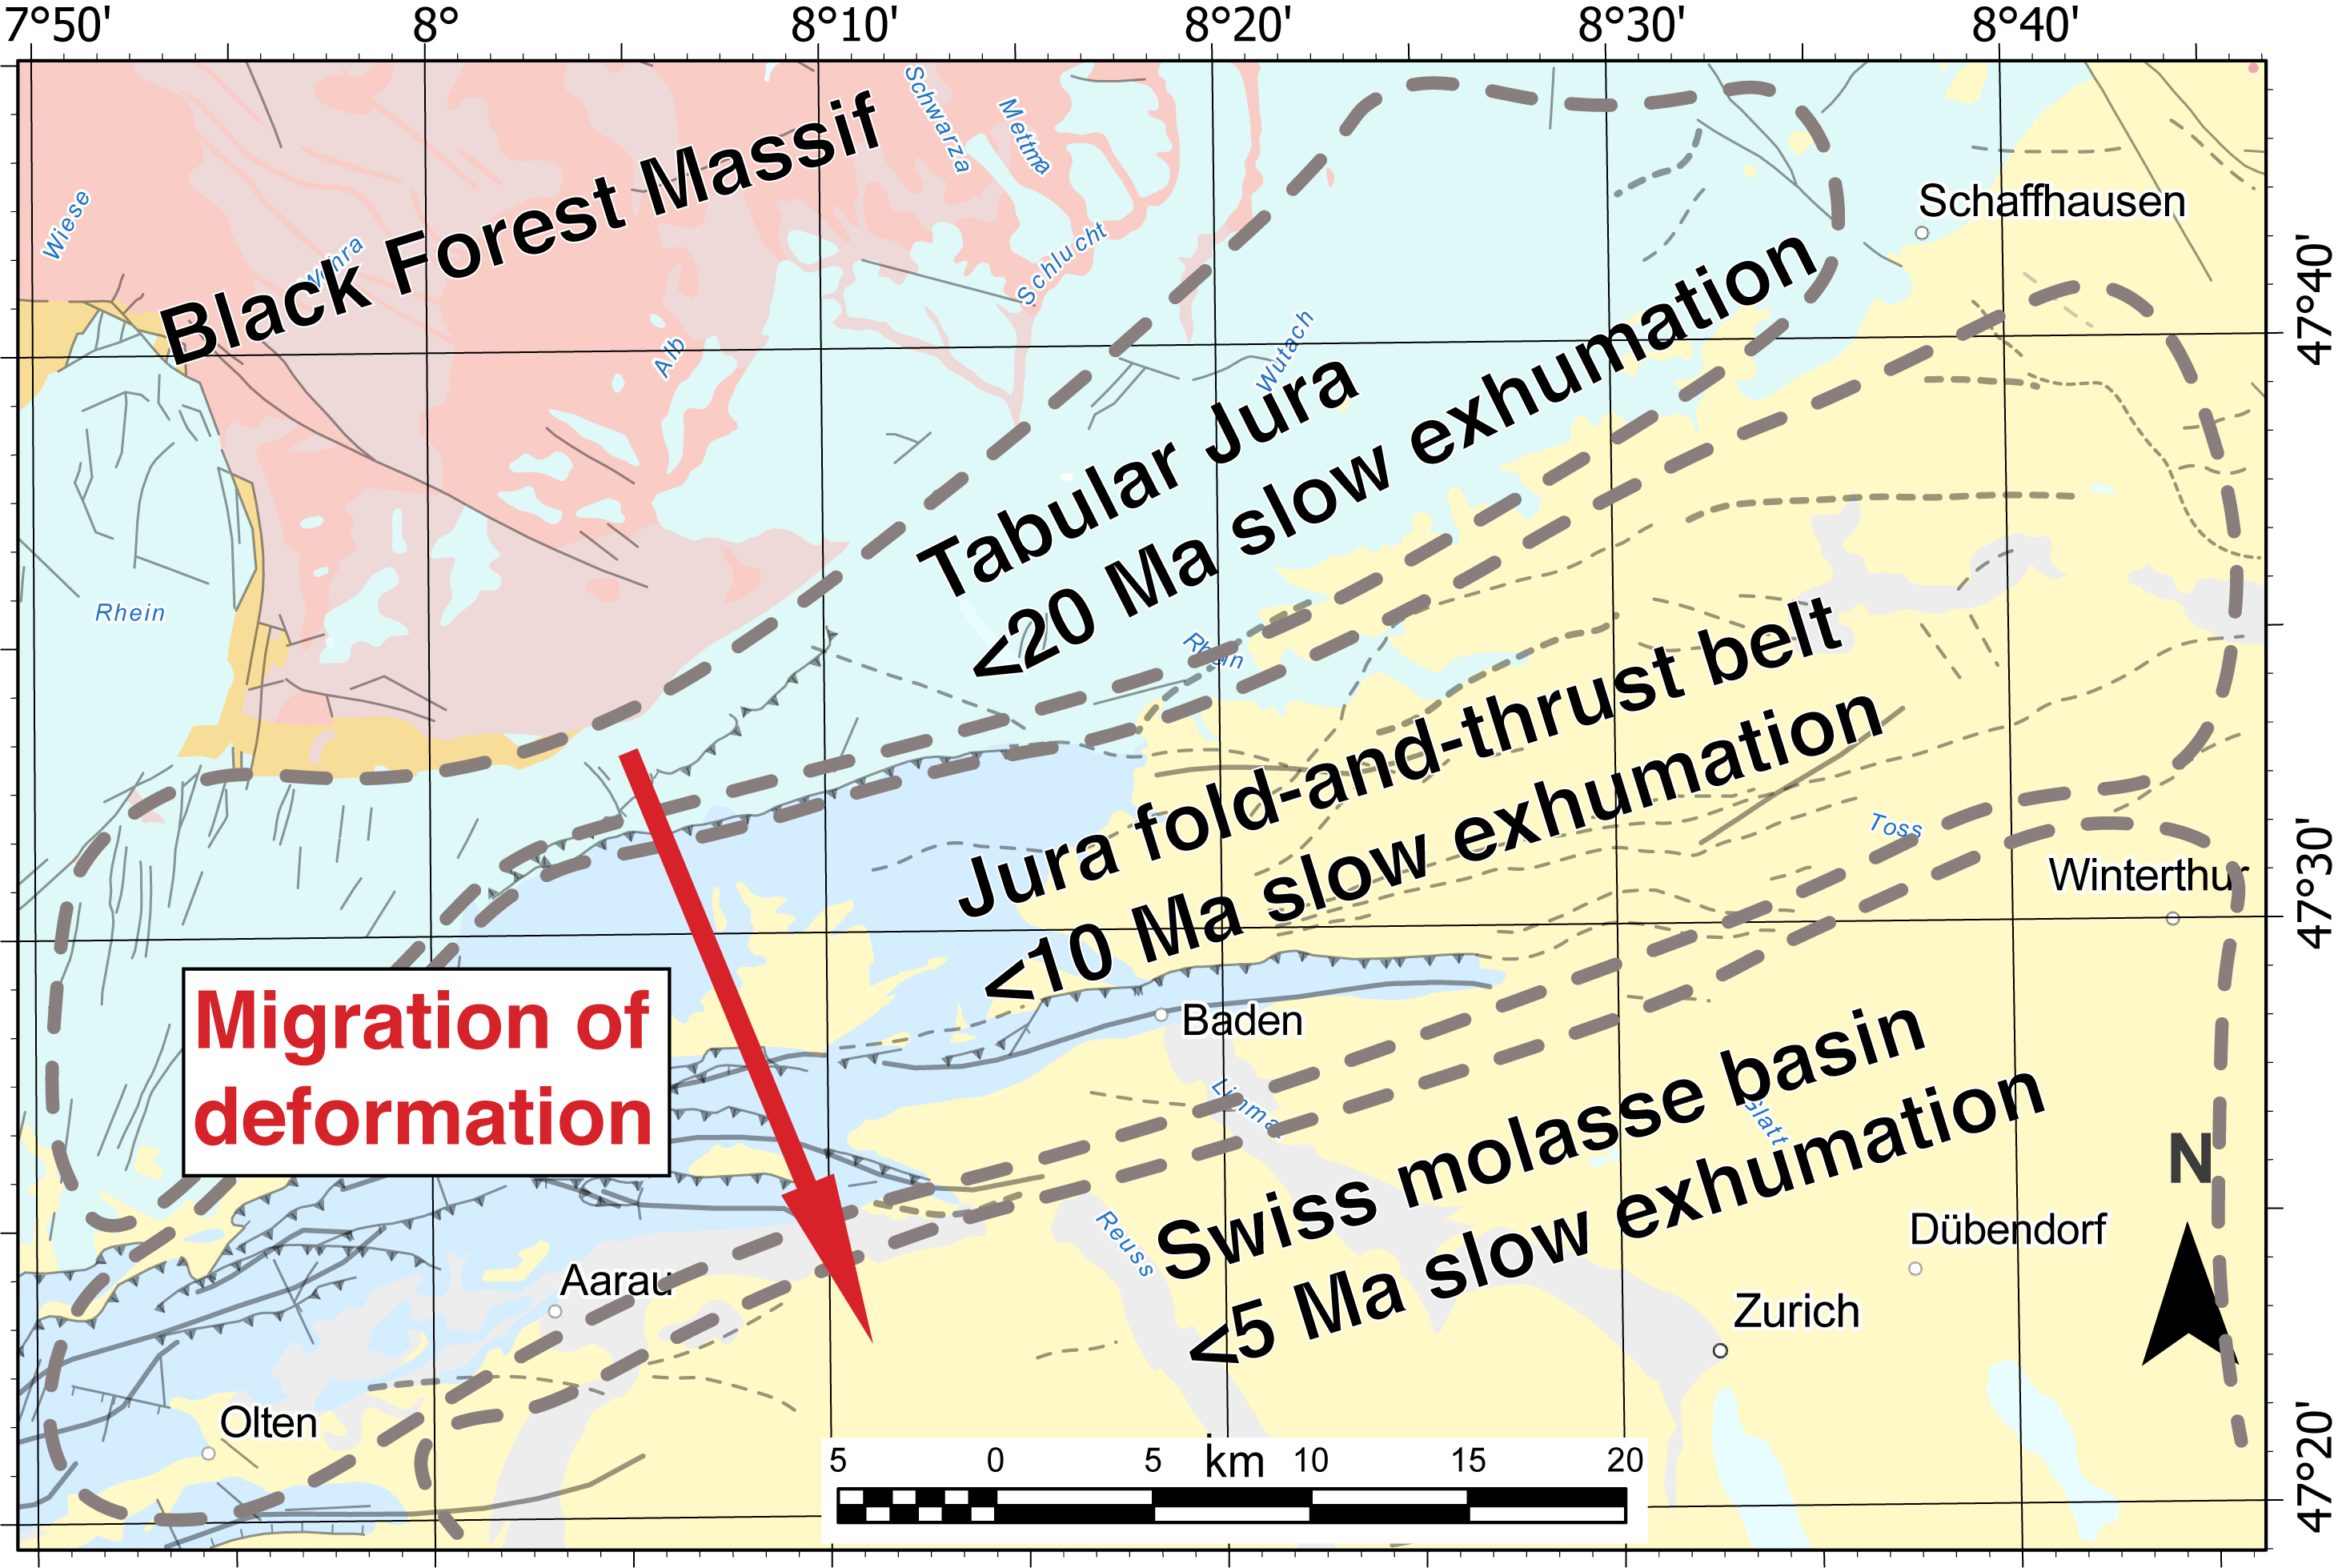
6.4. Miocene Exhumation in the Tabular Jura and Jura FTB
In the Miocene, a net cooling ranging between 10 (Jura FTB) and 20 °C (Tabular Jura) is observed in the Jura Mountains samples, and we ascribe this cooling to uplift and exhumation. Our thermal models show that cooling in the Tabular Jura region started in early–middle Miocene times (between 20 and 15 Ma), whereas cooling in the Jura FTB started in the latest Miocene (between 10 and 5 Ma), and it seems to be continuing today based on the cooling paths.
This early–late Miocene cooling and exhumation imply a further removal of ≈1000–700 m and ≈500–300 m of sediments in the Tabular Jura region and the Jura FTB, respectively. The material removed was arguably the very thin Cenozoic molasse section and—more probably—part of the remaining Lower Cretaceous and Jurassic sediments.
7. Discussion
7.1. Jurassic–Eocene Unconformity and the Missing Mesozoic Sedimentary Section
Based on indicators such as porosity, vitrinite reflectance, and fission track dating, the amount of missing Mesozoic section for most of north-western Switzerland has been constrained between 600 and 1800 m in thickness by [
15], 600–700 m by [
14], or 3000 m by [
65]. In the Zürich (High) area, an erosion of only about 600 m (consisting of 400 m of Upper Jurassic and 200 m of Cretaceous sediments eroded) has been estimated [
15]. The large range of the erosion values estimated by previous authors probably comes from the uncertainties in the modeling procedure, as well as from the assumed paleogeothermal gradient.
On the other hand, our estimates suggest that the first exhumation event observed in the Tabular Jura and Jura FTB occurred in the Late Cretaceous and involved the removal of a maximum of 1 km of sedimentary section, which is in line with estimates made by [
15]. The widespread Jurassic–Eocene unconformity was most likely a consequence of the northward migration of the forebulge, as the NAFB started to subside [
12]. This early phase of Alpine development was arguably contemporaneous with the Subhercynian intraplate deformation observed in Central Germany [
66].
7.2. Miocene Erosion and Tectonics of the Jura Mountains
The main deformation in the Jura FTB reportedly started between 15 and 12 Ma [
18,
20,
28,
67,
68,
69] and lasted until about 5–4 Ma [
19,
20], although a few authors [
70] suggest—based on geodetic evidence—that slow uplift of the Jura FTB is still ongoing.
Our data suggest that erosional exhumation of the Tabular Jura and the Jura FTB started at around 20 and 10 Ma, respectively. The Tabular Jura experienced the removal of maximum ≈1 km of overburden, while the Jura fold-and-thrust belt had a net reduction of only ≈500 m of sedimentary thickness throughout the Miocene.
We observe that the deformation and exhumation of the Jura mountains have migrated toward the hinterland throughout most of the Miocene. Therefore, the Black Forest Massif is possibly acting as a frontal buttress that hampers forward propagation, while it is possibly also being subtly uplifted. Although an earliest Miocene exhumation of the Black Forest Massif was probably localized in the Upper Rhine Graben shoulders [
71], a lithospheric-scale uplift in the Vosges–Black Forest arch (
Figure 1a) has been constrained to occur since 18 Ma [
72,
73], which is coincident with our timing for the onset of deformation in the Tabular Jura region. Existing paleogeographic reconstructions [
74] also suggest that by mid-Burdigalian times (≈18 Ma), the Vosges–Black Forest arch and the southern part of the Upper Rhine Graben started to supply detrital material to the SMB.
The deformational trend (starting at 20 Ma in the Tabular Jura/Black Forest Massif and 10 Ma in the Jura FTB) seems to indicate that probably major tectonic limits (e.g., the Mandach Fault) separating the Tabular Jura from the Jura FTB have played a role in the latest Miocene deformation observed in the region. The onset of the Jura FTB deformation, uplift, and exhumation (≈10 Ma) likely represent the timing when the Jurassic sequence detached from basement along Triassic evaporite layers [
20,
25].
Our thermochronological data indicate that uplift and exhumation of the Jura FTB might still be occurring although at very low rates, as corroborated by earthquake activity [
75]. This differs from [
18] on their view that uplift and deformation of the Jura FTB ended at 5 Ma.
7.3. Miocene Sedimentation and Subsequent Erosion in the Swiss Molasse Basin
The lack of AFT length data prevents us from determining the onset of exhumation of the SMB area during the Miocene. Although the youngest preserved sediments in the SMB are Tortonian in age (ca. 11 Ma; [
76]), it is believed that sedimentation lasted until 5 Ma [
19,
22,
23] or until 10 Ma [
14].
Pinch-out geometries may attest that sedimentation in the SMB was partially synchronous with deformation of the Jura FTB, and the molasse deposits likely rode “piggy-back” style above the Jura décollement as suggested by previous authors [
18].
Sedimentation in the SMB was followed by uplift and erosional-driven exhumation [
77]. The timing of the exhumation is poorly constrained, but it has been ongoing since 10 Ma [
14,
21] or—most likely—since 5 Ma [
17,
18,
22,
23]. The general southward-younging deformation trend observed in our data from the Jura mountains suggests that the onset of deformation of the SMB might have occurred at 5 Ma.
The amount of molasse sediments that eroded during the late Miocene exhumation event is poorly known, but it was certainly variable along and across the SMB. Based on stratigraphy and thermal indicators from well data, [
15] estimated elevated amounts of erosion (up to 2.5 km) in the south-western part of the basin (e.g., Geneva area) with modest values (about 350 m) in north-eastern Switzerland (e.g., Zürich area). These values differ from those constrained by [
14] in northernmost Switzerland, which are in the order of 750 and 1050 m. A post-5 Ma erosion and denudation south of Zürich of around 1.5 km was constrained by [
17], while [
22,
23] estimate a missing section of about 1 km in the plateau south of Zürich and 2–3 km in the subalpine molasse regions. Summing up, the sedimentary thickness eroded during the Miocene in the SMB has been estimated to range from 350 to 3 km, depending on the distance from the Alpine Chain.
The low (<1 km) Miocene exhumation estimated by our data in the Jura mountains suggest conservative values also for the eroded material in the SMB, which are probably in the order of only a few hundred meters near the region of Zürich (similar to values proposed by [
15]). As mentioned previously, some of the elevated exhumation values proposed by previous authors were probably an artefact of the thermal modelling procedure.
7.4. Main Drivers of the Miocene Uplift
The Late Cenozoic uplift and exhumation event is considered a consequence of deep-seated mechanisms such as isostatic rebound due to the diminution or termination of downwelling of mantle material beneath the Alps [
78], tectonic underplating [
75], or mantle delamination [
79]. Alternative shallower mechanisms suggest that erosion in the SMB accelerated due to an increased material flux from the Alps, which in turn was induced by humid conditions at the end of the late Miocene glacial period [
80]. Most recent models [
18,
23] highlight the importance of climate-triggered erosion of the Swiss Alps producing rebound and exhumation of the entire Swiss foreland regions.
The regional trend of exhumation observed by our data—with uplift starting in the Tabular Jura and migrating southwards toward the Jura FTB—would suggest that uplift occurs in an out-of-sequence fashion, leading to a delayed erosion of the SMB when compared to northern regions. Out-of-sequence thrusting derived from our data has also been suggested to operate in the subalpine region and south-western part of the SMB in the Geneva area [
75].
Although Cenozoic climatic changes probably played an important role in erosion [
18,
23], deeper tectonic processes involving the reactivation of major detachment faults (e.g., Mandach Fault) might be the main factor responsible for the deformation and uplift observed in the region. Therefore, early–late Miocene uplift of the Jura mountains is ultimately a consequence of increased uplift of the external Alpine massifs that transferred deformation through thrust faults beneath the foreland basin.
7.5. Further Implications for Basin Modeling and Natural Resources Exploration
The new data shed light on the depositional and erosional history of the region, including the tectonic activity of major bordering faults. Our data show that all the samples experienced a long history (>220 My) of heating and cooling, which was likely due to burial and exhumation processes, confirming some of the most conservative Jurassic–Early Cretaceous erosion estimates [
15]. We believe that any future work should seek a more robust determination of the thermal histories than the one presented here by means of increased sampling through the borehole column, improved AFT length statistics (probably irradiating apatites with Cf particles to increase the revelation of more confined tracks), and the use of other thermochronometers such as U–Th/He. Nevertheless, our findings improve the reconstruction of the thermal history of the northern sector of the NAFB, in particular refining the timing and the potential maximum paleo-temperature that were attained by its sedimentary units. The new thermochronological dataset also allows us to calibrate thermal models that integrate vitrinite reflectance (VR) in the same region [
81,
82]. This integration of VR and AFT allowed [
83] better estimating the amount of erosion for the main unconformities recognized in the basin, as well as the maximum burial depth of the main stratigraphic units. Overall, the new VR and AFT data are fundamental to evaluate the maturity of hydrocarbon source rocks, as well as evaluate the risk for geothermal exploration associated to hydrocarbon manifestations in the subsurface [
82]. Ongoing collaborative works [
82,
83,
84] are addressing issues of potential generation and circulation of hydrocarbon fluids that may represent a risk for the safety of nuclear waste repository envisaged for this area [
85,
86,
87,
88] and, eventually, for future deep geological CO
2 storage.
8. Conclusions
Despite sampling limitations, the new apatite fission track LA–ICP–MS data presented here provide valuable information on the post-Late Paleozoic history of the region, a long period of time in which the apatite fission track ages were never fully reset.
Permo-Carboniferous sedimentation occurred almost exclusively along the Constance–Frick Trough. Subsequent widespread Lower Triassic to Lower Cretaceous sedimentation occurred throughout the region, leading to the deposition of maximum 2 km of sediments. Part of the Lower Cretaceous and the Upper Jurassic sediments were subsequently eroded during the Late Cretaceous, from 100 to 70 Ma. This very slow erosional event was responsible for the conspicuous post-Jurassic unconformity observed in the whole area, and it was arguably caused by the northward migration of the forebulge, following the onset of the NAFB.
Our data show that the Jura Mountains experienced relatively minor subsidence during the Paleogene. The Tabular Jura region started to exhume in early–middle Miocene times (≈20–15 Ma), whereas exhumation in the Jura FTB likely started in the late Miocene (≈10–5 Ma). This shows an out-of-sequence migration of the deformation in north-eastern Switzerland. As a consequence, it is expected that the deformational trend continued toward the SMB at around 5 Ma.
The exhumation history of the Jura Mountains suggests that the Tabular Jura area, along with its underlying Black Forest Massif, and the Jura FTB should be considered as a potential source of sediments that have fed the SMB since the early–middle Miocene.
The sedimentary overburden that has been removed from the Jura Mountains during the Miocene is about 1 km for the Tabular Jura and 500 m for the Jura FTB, which is significantly lower than some of the traditionally accepted estimates.
Although this work does not represent the first quantitative attempt to determine the timing of deformation and exhumation of the Jura Mountains and the SMB, it is the first providing a time framework for a regional out-of-sequence deformational Miocene trend. In northern Switzerland, the Black Forest Massif is possibly acting as a frontal buttress that hampers forward propagation.
This trend might suggest that tectonic factors are above climate-controlled factors when it comes to explaining the erosional exhumation of the region. It appears that major thrusts operating at depth (e.g., Mandach Fault) play a major role in the uplift and exhumation of the area. Our thermal models suggest that the Jura mountains, although very slowly, are still experiencing uplift and exhumation, as corroborated by earthquake activity.
Author Contributions
Conceptualization, D.V.D. and S.O.-S.; methodology, D.V.D. and A.U.; software, D.V.D.; validation, D.V.D., A.U., S.O.-S.; formal analysis, D.V.D.; investigation, D.V.D., S.O.-S.; resources, D.V.D. and A.M.; data curation, D.V.D.; writing—original draft preparation, D.V.D.; writing—review and editing, D.V.D., S.O.-S., A.U., A.M.; visualization, D.V.D.; supervision, A.M.; project administration, A.M. and S.O.-S.; funding acquisition, A.M. All authors have read and agreed to the published version of the manuscript.
Funding
This pilot thermochronological project was part of the major UNCONGEO Project (
https://uncongeo.geoenergy.ch/), run by the University of Geneva (GE-RGBA group) and funded by the Swiss Federal Office of Energy (SFOE), the Federal Office of Topography (Swisstopo), Nagra (National Cooperative for the Disposal of Radioactive Waste) and the Cantons of Geneva and Vaud.
Acknowledgments
We wholeheartedly thank Swisstopo and in particular Peter Hayoz for providing access to the core samples. Urs Schaltegger is thanked for partial financial support. We are grateful to three anonymous reviewers for very helpful reviews. We thank Jean-Marie Boccard for his technical support with sample preparation.
Conflicts of Interest
The authors declare no conflict of interest.
References
- Swisstopo. Tektonische Karte der Schweiz 1:500,000; Modified by Institut für Geologie, Universität Bern and Bundesamt für Wasser und Geologie, GeoKarten 500, Bundesamt für Landestopografie: Wabern, Switzerland, 2005; ISBN 3-906723-56-9.
- Swisstopo. Geologische Karte der Schweiz 1:500,000; Modified by Institut für Geologie, Universität Bern and Bundesamt für Wasser und Geologie, GeoKarten 500, Bundesamt für Landestopografie: Wabern, Switzerland, 2005; ISBN 3-906723-39-9.
- Sommaruga, A.; Eichenberger, U.; Marillier, F. Seismic Atlas of the Swiss Molasse Basin; Swiss Geophysical Commission and Swisstopo: Wabern, Switzerland, 2012; Volume 44, 90p.
- Madritsch, H.; Naef, H.; Meier, B.; Franzke, H.J.; Schreurs, G. Architecture and Kinematics of the Constance-Frick Trough (Northern Switzerland): Implications for the Formation of Post-Variscan Basins in the Foreland of the Alps and Scenarios of Their Neogene Reactivation. Tectonics 2018, 37, 2197–2220. [Google Scholar] [CrossRef]
- Allenbach, R.; Baumberger, R.; Kurmann, E.; Salomé Michael, C.; Reynolds, L. GeoMol: Geologisches 3D-Modell des Schweizer Molassebeckens—Schlussbericht; Band 10 von Berichte der Landesgeologie; Swisstopo: Wabern, Switzerland, 2017; ISSN 1661-9285.
- Nagra. Technischer Bericht 85-01 Sondierbohrung Bȯttstein Untersuchungsbericht Beilagenband; National Cooperative for the Disposal of Radioactive Waste: Wettingen, Switzerland, 1985. [Google Scholar]
- Nagra. Technischer Bericht 88-08 Sondierbohrung Weiach Untersuchungsbericht Beilagenband; National Cooperative for the Disposal of Radioactive Waste: Wettingen, Switzerland, 1989. [Google Scholar]
- Nagra. Technischer Bericht 88-09 Sondierbohrung Riniken Untersuchungsbericht Beilagenband; National Cooperative for the Disposal of Radioactive Waste: Wettingen, Switzerland, 1990. [Google Scholar]
- Nagra. Technischer Bericht 88-12 Sondierbohrung Kaisten Untersuchungsbericht Beilagenband; National Cooperative for the Disposal of Radioactive Waste: Wettingen, Switzerland, 1991. [Google Scholar]
- Nagra. Technischer Bericht 88-10 Sondierbohrung Leuggern Untersuchungsbericht Beilagenband; National Cooperative for the Disposal of Radioactive Waste: Wettingen, Switzerland, 1991. [Google Scholar]
- Nagra. Technischer Bericht 88-11 Sondierbohrung Schafisheim Untersuchungsbericht Beilagenband; National Cooperative for the Disposal of Radioactive Waste: Wettingen, Switzerland, 1992. [Google Scholar]
- Crampton, S.L.; Allen, P.A. Recognition of forebulge unconformities associated with early stage foreland basin development: Example from the North Alpine Foreland Basin. AAPG Bull. 1995, 79, 1495–1514. [Google Scholar]
- Bachmann, G.H.; Müller, M.; Weggen, K. Evolution of the Molasse Basin (Germany, Switzerland). Tectonophysics 1987, 137, 77–92. [Google Scholar] [CrossRef]
- Mazurek, M.; Hurford, A.J.; Leu, W. Unravelling the multi-stage burial history of the Swiss Molasse Basin: Integration of apatite fission track, vitrinite reflectance and biomarker isomerisation analysis. Basin Res. 2006, 18, 27–50. [Google Scholar] [CrossRef]
- Schegg, R.; Leu, W. Analysis of erosion events and palaeogeothermal gradients in the North Alpine Foreland Basin of Switzerland. Geol. Soc. Lond. Spec. Publ. 1998, 141, 137–155. [Google Scholar] [CrossRef]
- Kuhlemann, J.; Kempf, O. Post-Eocene evolution of the North Alpine Foreland Basin and its response to Alpine tectonics. Sediment. Geol. 2002, 152, 45–78. [Google Scholar] [CrossRef]
- Kuhlemann, J.; Rahn, M. Plio-Pleistocene landscape evolution in Northern Switzerland. Swiss J. Geosci. 2013, 106, 451–467. [Google Scholar] [CrossRef]
- Willett, S.D.; Schlunegger, F. The last phase of deposition in the Swiss Molasse Basin: From foredeep to negative-alpha basin. Basin Res. 2010, 22, 623–639. [Google Scholar] [CrossRef]
- Schlunegger, F.; Norton, K.P. Headward retreat of streams in the Late Oligocene to Early Miocene Swiss Alps. Sedimentology 2013, 60, 85–101. [Google Scholar] [CrossRef]
- Mock, S.; Herwegh, M. Tectonics of the central Swiss Molasse Basin: Post-Miocene transition to incipient thick-skinned tectonics? Tectonics 2017, 36, 1699–1723. [Google Scholar] [CrossRef]
- Müller, W.H.; Naef, H.; Graf, H.R. Nagra Technischer Bericht, Wettingen, NTB 99–08; Geologische Entwicklung der Nordwestschweiz, Neotektonik und Langzeitszenarien Zürcher Weinland: Wettingen, Switzerland, 2002; 237p. [Google Scholar]
- Cederbom, C.E.; Sinclair, H.D.; Schlunegger, F.; Rahn, M.K. Climate-induced rebound and exhumation of the European Alps. Geology 2004, 32, 709–712. [Google Scholar] [CrossRef]
- Cederbom, C.E.; Van Der Beek, P.; Schlunegger, F.; Sinclair, H.D.; Oncken, O. Rapid extensive erosion of the North Alpine foreland basin at 5–4 Ma. Basin Res. 2011, 23, 528–550. [Google Scholar] [CrossRef]
- Sommaruga, A. Geology of the Central Jura and the Molasse Basin: New Insight into an Evaporite-Based Foreland Fold and Thrust Belt. Ph.D. Thesis, Soc. Neuchâteloise des Sciences Naturelles, Neuchâtel, Switzerland, 1997. [Google Scholar]
- Laubscher, H.P. Die Fernschubhypothese der Jurafaltung. Eclogae Geol. Helv. 1961, 54, 221–282. [Google Scholar]
- Sommaruga, A. Décollement tectonics in the Jura foreland fold-and-thrust belt. Mar. Petrol. Geol. 1999, 16, 111–134. [Google Scholar] [CrossRef]
- Gorin, G.E.; Signer, C.; Amberger, G. Structural configuration of the western Swiss Molasse Basin as defined by reflection seismic data. Eclogae Geol. Helv. 1993, 86, 693–716. [Google Scholar]
- Burkhard, M. Aspects of the large-scale Miocene deformation in the most external part of the Swiss Alps (sub-Alpine molasse to Jura fold belt). Eclogae Geol. Helv. 1990, 83, 559–583. [Google Scholar]
- Diebold, P.; Naef, H.; Ammann, M. Zur Tektonik der Zentralen Nordschweiz. Interpretation Aufgrund Regionaler Seismik, Oberflächengeologie und Tiefbohrungen (Nagra Tech. Ber. NTB 90–04); Nagra—National Cooperative for the Disposal of Radioactive Waste: Wettingen, Switzerland, 1991. [Google Scholar]
- Green, A.G.; Merz, K.; Marti, U.; Spillmann, T. Gravity Data in Northern Switzerland and Southern Germany (Nagra Arbeitsber. NAB 13–40); Nagra: Wettingen, Switzerland, 2013. [Google Scholar]
- Malz, A.; Madritsch, H.; Kley, J. Improving 2D seismic interpretation in challenging settings by integration of restoration techniques: A case study from the Jura fold-and-thrust belt (Switzerland). Interpretation 2015, 3, SAA37–SAA58. [Google Scholar] [CrossRef]
- Ziegler, P.A.; Schumacher, M.E.; Dèzes, P.; van Wees, J.-D.; Cloetingh, S. Post-variscan evolution of the lithosphere in the Rhine Graben area: Constraints from subsidence modelling. In Permo-Carboniferous Magmatism and Rifting in Europe; Wilson, M., Neumann, E.-R., Davies, G.R., Timmerman, M.J., Heeremans, M., Larsen, B.T., Eds.; Geological Society of London: London, UK, 2004; Volume 223, pp. 289–317. [Google Scholar]
- Marchant, R.; Ringgenberg, Y.; Stampfli, G.; Birkhäuser, P.; Roth, P.; Meier, B. Paleotectonic evolution of the Zürcher Weinland (northern Switzerland), based on 2D and 3D seismic data. Eclogae Geol. Helv. 2005, 98, 345–362. [Google Scholar] [CrossRef]
- Wetzel, A.; Allenbach, R.; Allia, V. Reactivated basement structures affecting the sedimentary facies in a tectonically “quiescent” epicontinental basin: An example from NW Switzerland. Sediment. Geol. 2003, 157, 153–172. [Google Scholar] [CrossRef]
- Bachmann, G.H.; Müller, M. The Molasse basin, Germany: Evolution of a classic petroliferous foreland basin. In Generation, Accumulation, and Production of Europe’s Hydrocarbons; Springer: Berlin/Heidelberg, Germany, 1991; Volume 1, pp. 263–276. [Google Scholar]
- Ziegler, P.A. Geological Atlas of Western and Central Europe 1990; Shell Internationale Petroleum Maatschappij: The Hague, The Netherlands, 1990; 239p, 56 encl. [Google Scholar]
- Laubscher, H.P. Die tektonische Entwicklung der Nordschweiz. Eclogae Geol. Helv. 1987, 80, 287–303. [Google Scholar]
- McCann, T.; Pascal, C.; Timmerman, M.J.; Krzywiec, P.; López-Gómez, J.; Wetzel, L.; Krawczyk, C.M.; Rieke, H.; Lamarche, J. Post-Variscan (end Carboniferous-Early Permian) basin evolution in western and central Europe. Geol. Soc. Lond. Mem. 2006, 32, 355–388. [Google Scholar] [CrossRef]
- Timar-Geng, Z.; Fügenschuh, B.; Wetzel, A.; Dresmann, H. The low-temperature thermal history of northern Switzerland as revealed by fission track analysis and inverse thermal modelling. Eclogae Geol. Helv. 2006, 99, 255–270. [Google Scholar] [CrossRef]
- Von Hagke, C.V. Coupling between Climate and Tectonics: Low Temperature Thermochronology and Structural Geology Applied to the Pro-Wedge of the European Alps. Scientific Technical Report STR12/14. Master’s Thesis, Erlangung des Doktorgrades im Fachbereich Geowissenschaften an der Freien Universität, Berlin, Germany, 2012; 189p. [Google Scholar]
- Hurford, A. Fission Track Analysis of Apatite from the Nagra Boreholes of Büttstein, Weiach, Schafisheim and Riniken, Northern Switzerland, Internal Report; Nagra—National Cooperative for the Disposal of Radioactive Waste: Wettingen, Switzerland, 1993. [Google Scholar]
- Laslett, G.M.; Green, P.F.; Duddy, I.R.; Gleadow, A.J.W. Thermal annealing of fission tracks in apatite 2. A quantitative analysis. Chem. Geol. Isot. Geosci. Sect. 1987, 65, 1–13. [Google Scholar] [CrossRef]
- Ketcham, R.A.; Donelick, R.A.; Carlson, W.D. Variability of apatite fission-track annealing kinetics: III. Extrapolation to geological time scales. Am. Mineral. 1999, 84, 1235–1255. [Google Scholar] [CrossRef]
- Ketcham, R.A.; Carter, A.; Donelick, R.A.; Barbarand, J.; Hurford, A.J. Improved modelling of fission-track annealing in apatite. Am. Mineral. 2007, 92, 799–810. [Google Scholar] [CrossRef]
- Kohn, B.P.; Gleadow, A.J.W.; Brown, R.W.; Gallagher, K.; Lorencak, M.; Noble, W.P. Visualizing thermotectonic and denudation histories using apatite fission track thermochronology. Rev. Mineral. Geochem. 2005, 58, 527–565. [Google Scholar] [CrossRef]
- Green, P.F.; Duddy, I.R.; Gleadow, A.J.W.; Tingate, P.R.; Laslett, G.M. Thermal annealing of fission tracks in apatite. Chem. Geol.–Isot. Geosci. Sect. 1986, 59, 237–253. [Google Scholar] [CrossRef]
- O’Sullivan, P.B.; Parrish, R.R. The importance of apatite composition and single-grain ages when interpreting fission track data from plutonic rocks: A case study from the Coast Ranges, British Columbia. Earth Planet. Sci. Lett. 1995, 132, 213–224. [Google Scholar] [CrossRef]
- Carlson, W.D.; Donelick, R.A.; Ketcham, R.A. Variability of apatite fission-track annealing kinetics: I. Experimental results. Am. Mineral. 1999, 84, 1213–1223. [Google Scholar] [CrossRef]
- Villagómez, D.; Pindell, J. Thermochronology of the southern Mexican Margin (Xolapa Belt), Acapulco to Puerto Angel: Crustal dynamics of a trench–trench–transform triple junction. In Southern and Central Mexico: Basement Framework, Tectonic Evolution, and Provenance of Mesozoic–Cenozoic Basins, Geological Society of America Special Paper; Martens, U., Molina-Garza, R., Eds.; The Geological Society of America: Boulder, CO, USA, 2020; Volume 546. [Google Scholar] [CrossRef]
- Villagómez, D.; Pindell, J.; Spikings, R. Thermal history of the crystalline basement from the western and southern Gulf of Mexico. In Southern and Central Mexico: Basement Framework, Tectonic Evolution, and Provenance of Mesozoic–Cenozoic Basins, Geological Society of America Special Paper; Martens, U., Molina-Garza, R., Eds.; The Geological Society of America: Boulder, CO, USA, 2020; Volume 546. [Google Scholar] [CrossRef]
- Villagómez, D.; Ulyanov, A. Optimization of the fission track laboratory at the University of Geneva. New calibrations for the Apatite Fission Track LA–ICP–MS method. Tech. Rep. 2018, 17. [Google Scholar] [CrossRef]
- Ketcham, R.A. Forward and inverse modelling of low-temperature thermochronometry data. Rev. Mineral. Geochem. 2005, 58, 275–314. [Google Scholar] [CrossRef]
- Donelick, R.A. Method of Fission Track Analysis Utilizing Bulk Chemical Etching of Apatite. U.S. Patent US5267274A, 30 November 1993. [Google Scholar]
- Hiess, J.; Condon, D.J.; McLean, N.; Noble, S.R. 238U/235U systematics in terrestrial uranium-bearing minerals. Science 2012, 335, 1610–1614. [Google Scholar] [CrossRef] [PubMed]
- Jaffey, A.; Flynn, K.; Glendenin, L.; Bentley, W.; Essling, A. Precision measurement of half-lives and specific activities of 235U and 238U. Phys. Rev. 1971, 4, 1889. [Google Scholar]
- Holden, N.E.; Hoffman, D.C. Spontaneous fission half-lives for ground-state nuclide (Technical report). Pure Appl. Chem. 2000, 72, 1525–1562. [Google Scholar] [CrossRef]
- Guedes, S.; Hadler, J.C.; Iunes, P.J.; Zuniga, A.; Tello, C.A.; Paulo, S.R. The use of the U (n, f) reaction dosimetry in the determination of the λf value through fission-track techniques. In Nuclear Instruments and Methods in Physics Research Section A: Accelerators, Spectrometers, Detectors and Associated Equipment; Elsevier: Amsterdam, The Netherlands, 2003; Volume 496, pp. 215–221. [Google Scholar]
- Iwano, H.; Danhara, T. A re-investigation of the geometry factors for fission-track dating of apatite, sphene and zircon. In Advances in Fission-Track Geochronology; Springer: Dordrecht, The Netherlands, 1998; pp. 47–66. [Google Scholar]
- Jonckheere, R. On methodical problems in estimating geological temperature and time from measurements of fission tracks in apatite. Radiat. Meas. 2003, 36, 43–55. [Google Scholar] [CrossRef]
- Ketcham, R.A.; Mora, A.; Parra, M. Deciphering exhumation and burial history with multi-sample down-well thermochronometric inverse modelling. Basin Res. 2018, 30, 48–64. [Google Scholar] [CrossRef]
- Allen, P.A.; Allen, J.R. Basin Analysis: Principles and Application to Petroleum Play Assessment, 3rd ed.; Wiley-Blackwell: Oxford, UK, 2013; 619p. [Google Scholar]
- Royden, L.; Keen, C.E. Rifting process and thermal evolution of the continental margin of eastern Canada determined from subsidence curves. Earth Planet. Sci. Lett. 1980, 51, 343–361. [Google Scholar] [CrossRef]
- Royden, L. A simple method for analyzing subsidence and heat flow in extensional basins. In Thermal Modelling in Sedimentary Basins; Thechnip, Institut Français du Pétrole, Centre National de la Recherche Scientifique: Paris, France, 1986; pp. 49–73. [Google Scholar]
- Omodeo-Salé, S.; Eruteya, O.E.; Cassola, T.; Baniasad, A.; Moscariello, A. A basin thermal modelling approach to mitigate geothermal energy exploration risks: The St. Gallen case study (eastern Switzerland). Geothermics 2020, 87, 101876. [Google Scholar] [CrossRef]
- Brink, H.J.; Burri, P.; Lunde, A.; Winhard, H. Hydrocarbon habitat and potential of Swiss and German Molasse Basin: A comparison. Eclogae Geol. Helv. 1992, 85, 715–732. [Google Scholar]
- Voigt, T.; Wiese, F.; von Eynatten, H.; Franzke, H.J.; Gaupp, R. Facies evolution of syntectonic Upper Cretaceous deposits in the Subhercynian Cretaceous Basin and adjoining areas (Germany). Z. Deutsch. Ges. Geowiss. 2006, 157, 203–243. [Google Scholar] [CrossRef]
- Laubscher, H.P. Jura kinematics and the Molasse Basin. Eclogae Geol. Helv. 1992, 85, 653–675. [Google Scholar]
- Philippe, Y.; Colletta, B.; Deville, E.; Mascle, A. The Jura fold-and-thrust belt: A kinematic model based on map-balancing. In Memoires du Museum National d’Histoire Naturelle; Ziegler, P.A., Horvath, F., Eds.; Editions du Muséum: Paris, France, 1996; Volume 170, pp. 235–261. [Google Scholar]
- Burkhard, M.; Sommaruga, A. Evolution of the western Swiss Molasse basin: Structural relations with the Alps and the Jura belt. Geol. Soc. Lond. Spec. Publ. 1998, 134, 279–298. [Google Scholar] [CrossRef]
- Ziegler, P.A.; Fraefel, M. Response of drainage systems to Neogene evolution of the Jura fold-thrust belt and Upper Rhine Graben. Swiss J. Geosci. 2009, 102, 57–75. [Google Scholar] [CrossRef]
- Egli, D.; Mosar, J.; Ibele, T.; Madritsch, H. The role of precursory structures on Tertiary deformation in the Black Forest—Hegau region. Int. J. Earth Sci. 2017, 106, 2297–2318. [Google Scholar] [CrossRef]
- Dèzes, P.; Schmid, S.M.; Ziegler, P.A. Evolution of the European Cenozoic Rift System: Interaction of the Alpine and Pyrenean orogens with their foreland lithosphere. Tectonophysics 2004, 389, 1–33. [Google Scholar] [CrossRef]
- Ziegler, P.A.; Dèzes, P. Cenozoic uplift of Variscan Massifs in the Alpine foreland: Timing and controlling mechanisms. Glob. Planet. Chang. 2007, 58, 237–269. [Google Scholar] [CrossRef]
- Berger, J.P.; Reichenbacher, B.; Becker, D.; Grimm, M.; Grimm, K.; Picot, L.; Storni, A.; Pirkenseer, C.; Derer, C.; Schaefer, A. Paleogeography of the upper Rhine Graben (URG) and the Swiss Molasse basin (SMB) from Eocene to Pliocene. Int. J. Earth Sci. 2005, 94, 697–710. [Google Scholar] [CrossRef]
- Mosar, J. Present-day and future tectonic underplating in the western Swiss Alps: Reconciliation of basement/wrench-faulting and décollement folding of the Jura and Molasse basin in the Alpine foreland. Earth Planet. Sci. Lett. 1999, 173, 143–155. [Google Scholar] [CrossRef]
- Rahn, M.K.; Selbekk, R. Absolute dating of the youngest sediments of the Swiss Molasse basin by apatite fission track analysis. Swiss J. Geosci. 2007, 100, 371–381. [Google Scholar] [CrossRef]
- Schlunegger, F.; Mosar, J. The last erosional stage of the Molasse Basin and the Alps. Int. J. Earth Sci. 2011, 100, 1147–1162. [Google Scholar] [CrossRef]
- Lyon-Caen, H.; Molnar, P. Constraints on the deep structure and dynamic processes beneath the Alps and adjacent regions from an analysis of gravity anomalies. Geophys. J. Int. 1989, 99, 19–32. [Google Scholar] [CrossRef]
- Kissling, E.; Schmid, S.M.; Lippitsch, R.; Ansorge, J.; Fügenschuh, B. Lithosphere structure and tectonic evolution of the Alpine arc: New evidence from high-resolution teleseismic tomography. Geol. Soc. Lond. Mem. 2006, 32, 129–145. [Google Scholar] [CrossRef]
- Willett, S.D.; Schlunegger, F.; Picotti, V. Messinian climate change and erosional destruction of the central European Alps. Geology 2006, 34, 613–616. [Google Scholar] [CrossRef]
- Hamidi, Y. Thermal Modelling of the Northern Swiss Foreland Basin: Implication on Geo-Energy Resources. Master’s Thesis, Université de la Sorbonne, Paris, France, 2019; 41p. [Google Scholar]
- Omodeo-Salé, S.; Hamidi, Y.; Villagómez, D.; Moscariello, A. Quantify multiple erosion events combining thermal modelling and apatite fission tracks data: The external sector of the Northern Alpine Foreland Basin (North-eastern Switzerland). Geosciences 2020. in review. [Google Scholar]
- Moscariello, A. Exploring for geo-energy resources in the Geneva Basin (Western Switzerland): Opportunities and challenges. Swiss Bull. Angew. Geol. 2019, 24, S105–S124. [Google Scholar]
- Moscariello, A.; Guglielmetti, L.; Omodeo-Salé, S.; De Haller, A.; Eruteya, O.E.; Lo, H.Y.; Clerc, N.; Makloufhi, Y.; Do Couto, D.; De Ferreira Oliveira, G.; et al. Heat production and storage in Western Switzerland: Advances and challenges of intense multidisciplinary geothermal exploration activities, an 8 years progress report. In Proceedings of the World Geothermal Congress, Reykjavik, Iceland, 26 April–2 May 2020; pp. 1–12. [Google Scholar]
- Nagra. SGT Etappe 2: Vorschlag Weiter zu Untersuchender Geologischer Standortgebiete mit Zugehörigen Standortarealen für die Oberflächenanlage. In Geologische Grundlagen—Dossier II: Sedimentologische und Tektonische Verhältnisse Nagra Tech. Ber. NTB 14–02; National Cooperative for the Disposal of Radioactive Waste: Wettingen, Switzerland, 2014; 76p. [Google Scholar]
- Nagra. Preliminary horizon and structure mapping of the Nagra 3D seismic JO-15 (Jura Ost) in time domain. In Nagra Arb; National Cooperative for the Disposal of Radioactive Waste: Wettingen, Switzerland, 2019; 76p. [Google Scholar]
- Nagra. Preliminary horizon and structure mapping of the Nagra 3D seismic NL 16 (Nördlich Lägern) in time domain. In Nagra Arb; National Cooperative for the Disposal of Radioactive Waste: Wettingen, Switzerland, 2019; Volume NAB 18–35, 77p. [Google Scholar]
- Nagra. Preliminary horizon and structure mapping of the Nagra 3D seismic ZNO 96/17 (Zürich Nordost) in time domain. In Nagra Arb; National Cooperative for the Disposal of Radioactive Waste: Wettingen, Switzerland, 2019; Volume NAB 18–36, 77p. [Google Scholar]
| Publisher’s Note: MDPI stays neutral with regard to jurisdictional claims in published maps and institutional affiliations. |
© 2020 by the authors. Licensee MDPI, Basel, Switzerland. This article is an open access article distributed under the terms and conditions of the Creative Commons Attribution (CC BY) license (http://creativecommons.org/licenses/by/4.0/).


