Characteristics of Sedimentary Organic Matter and Phosphorus in Minor Rivers Discharging into Zhejiang Coast, China
Abstract
1. Introduction
2. Materials and Methods
2.1. Study Areas and Sampling
2.2. Analytical Methods
2.2.1. Bulk Elemental and Lignin Analysis
2.2.2. Sedimentary P Species
3. Results
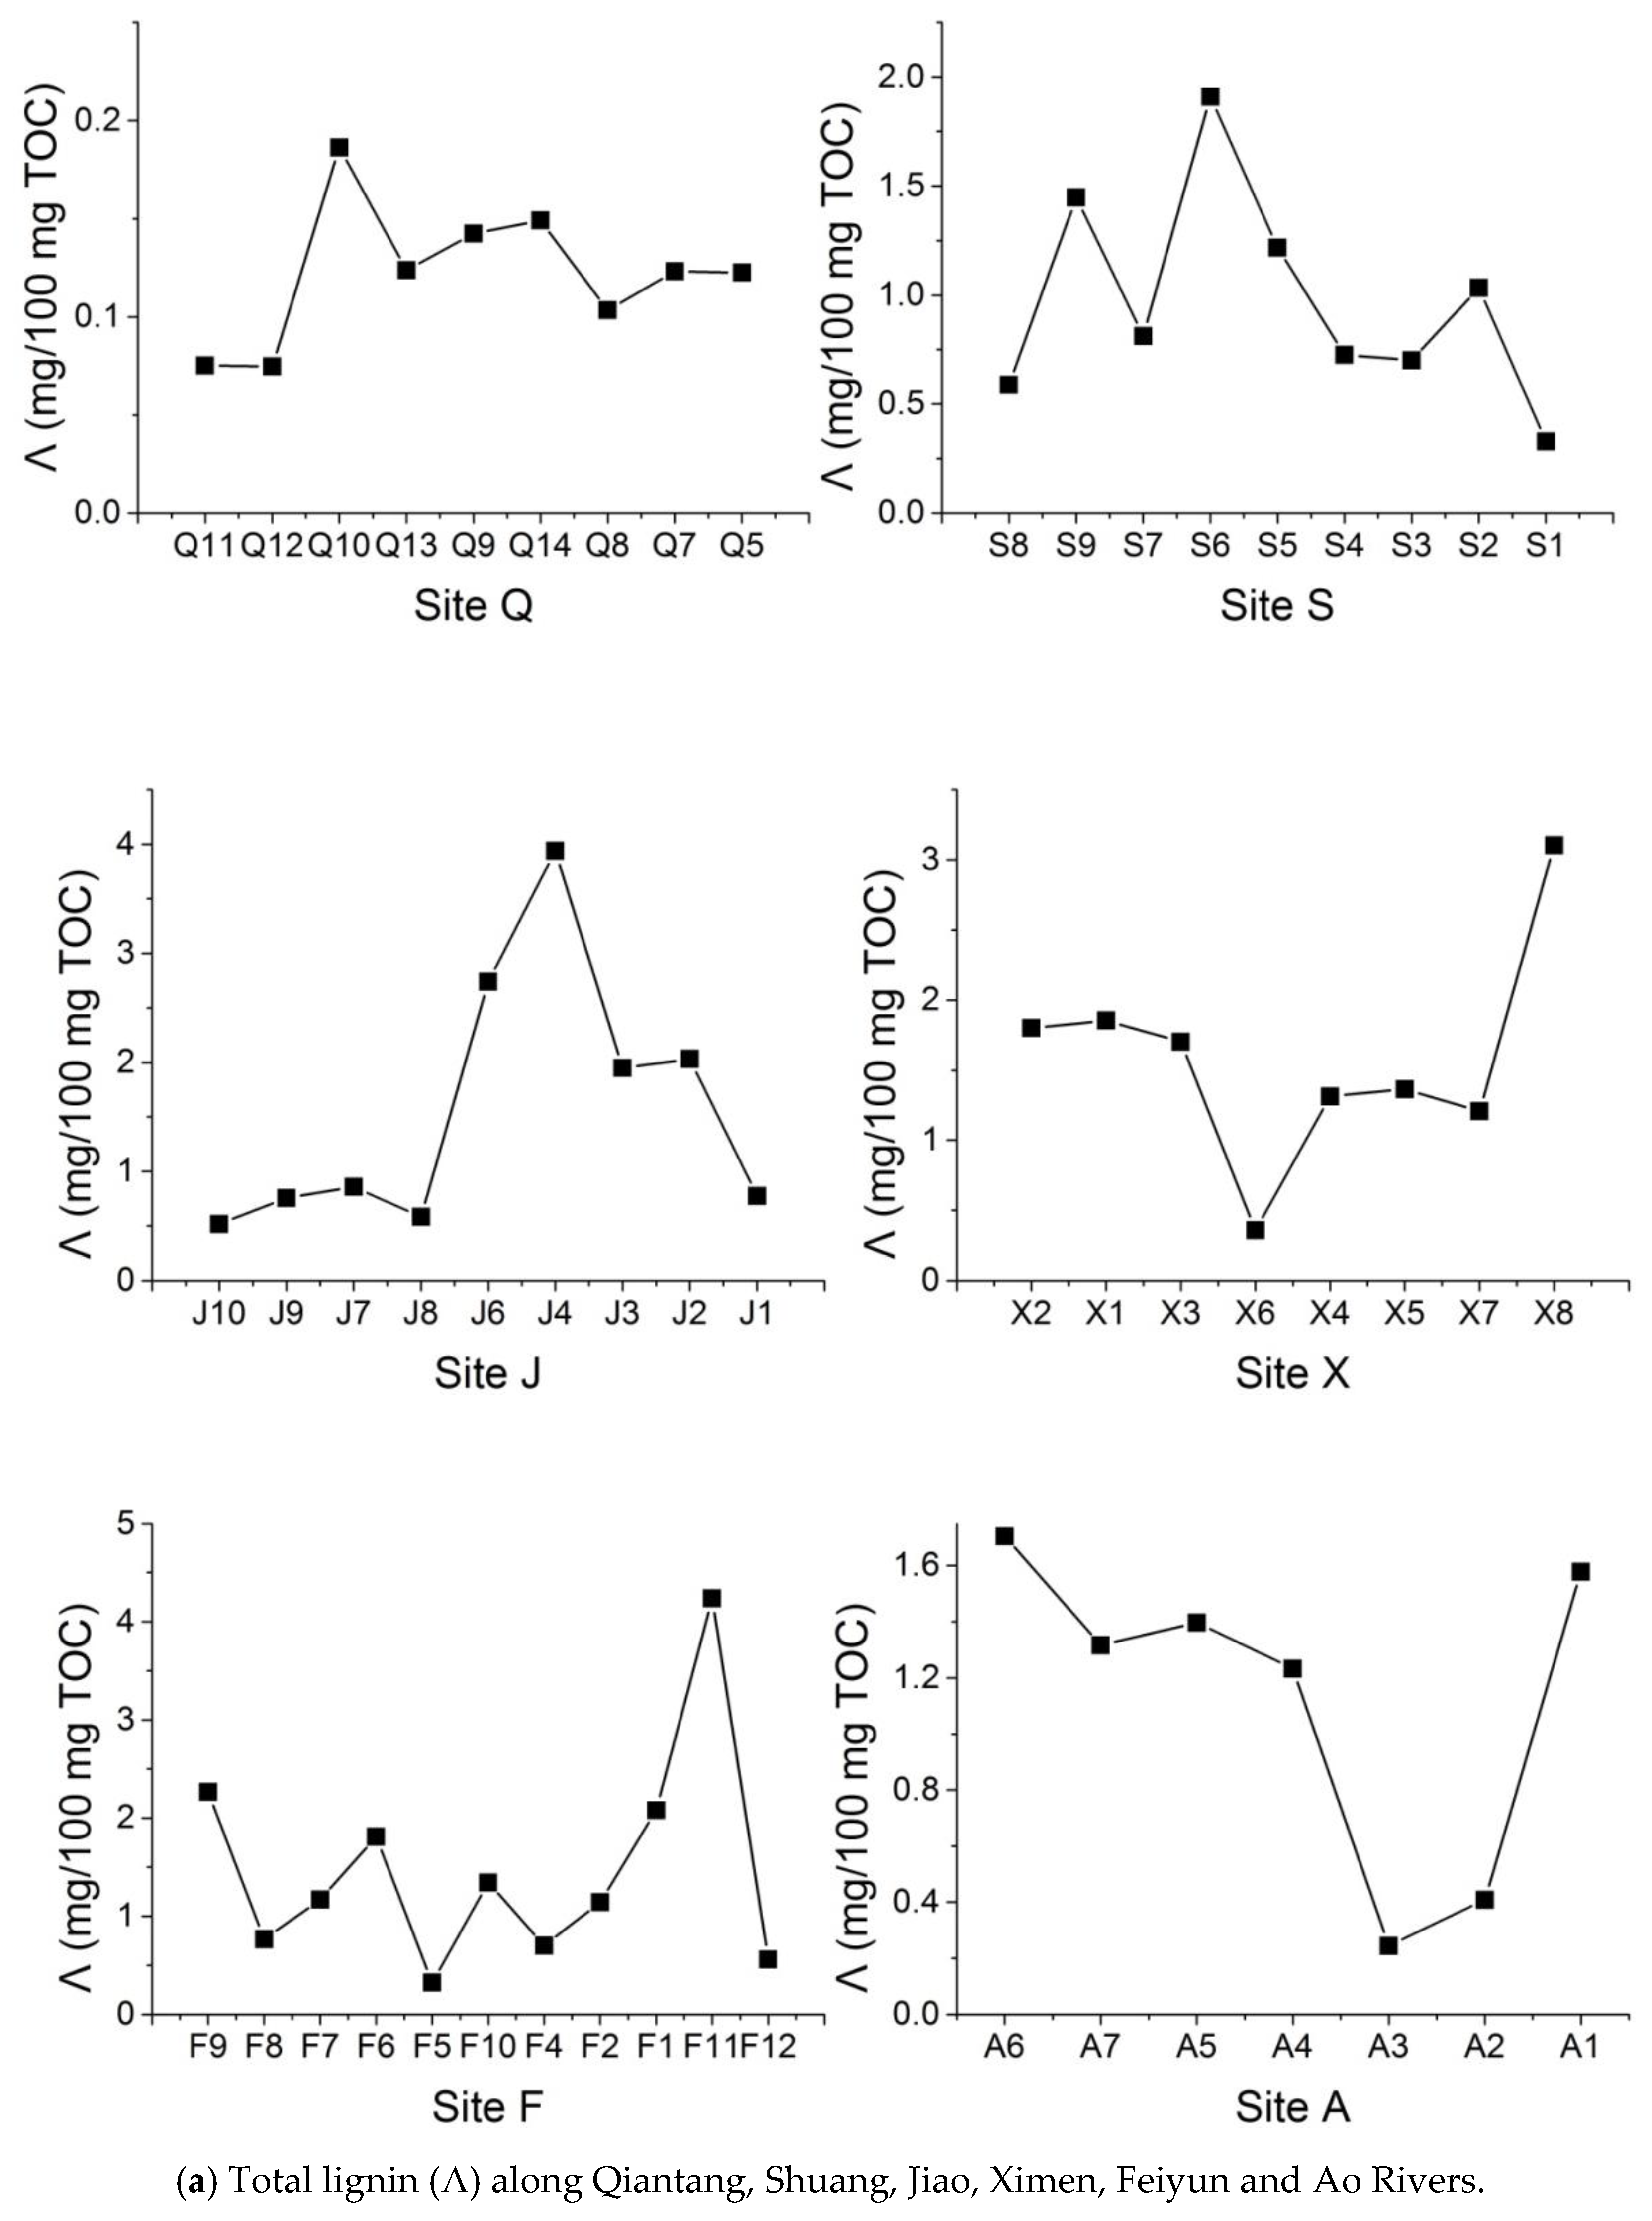
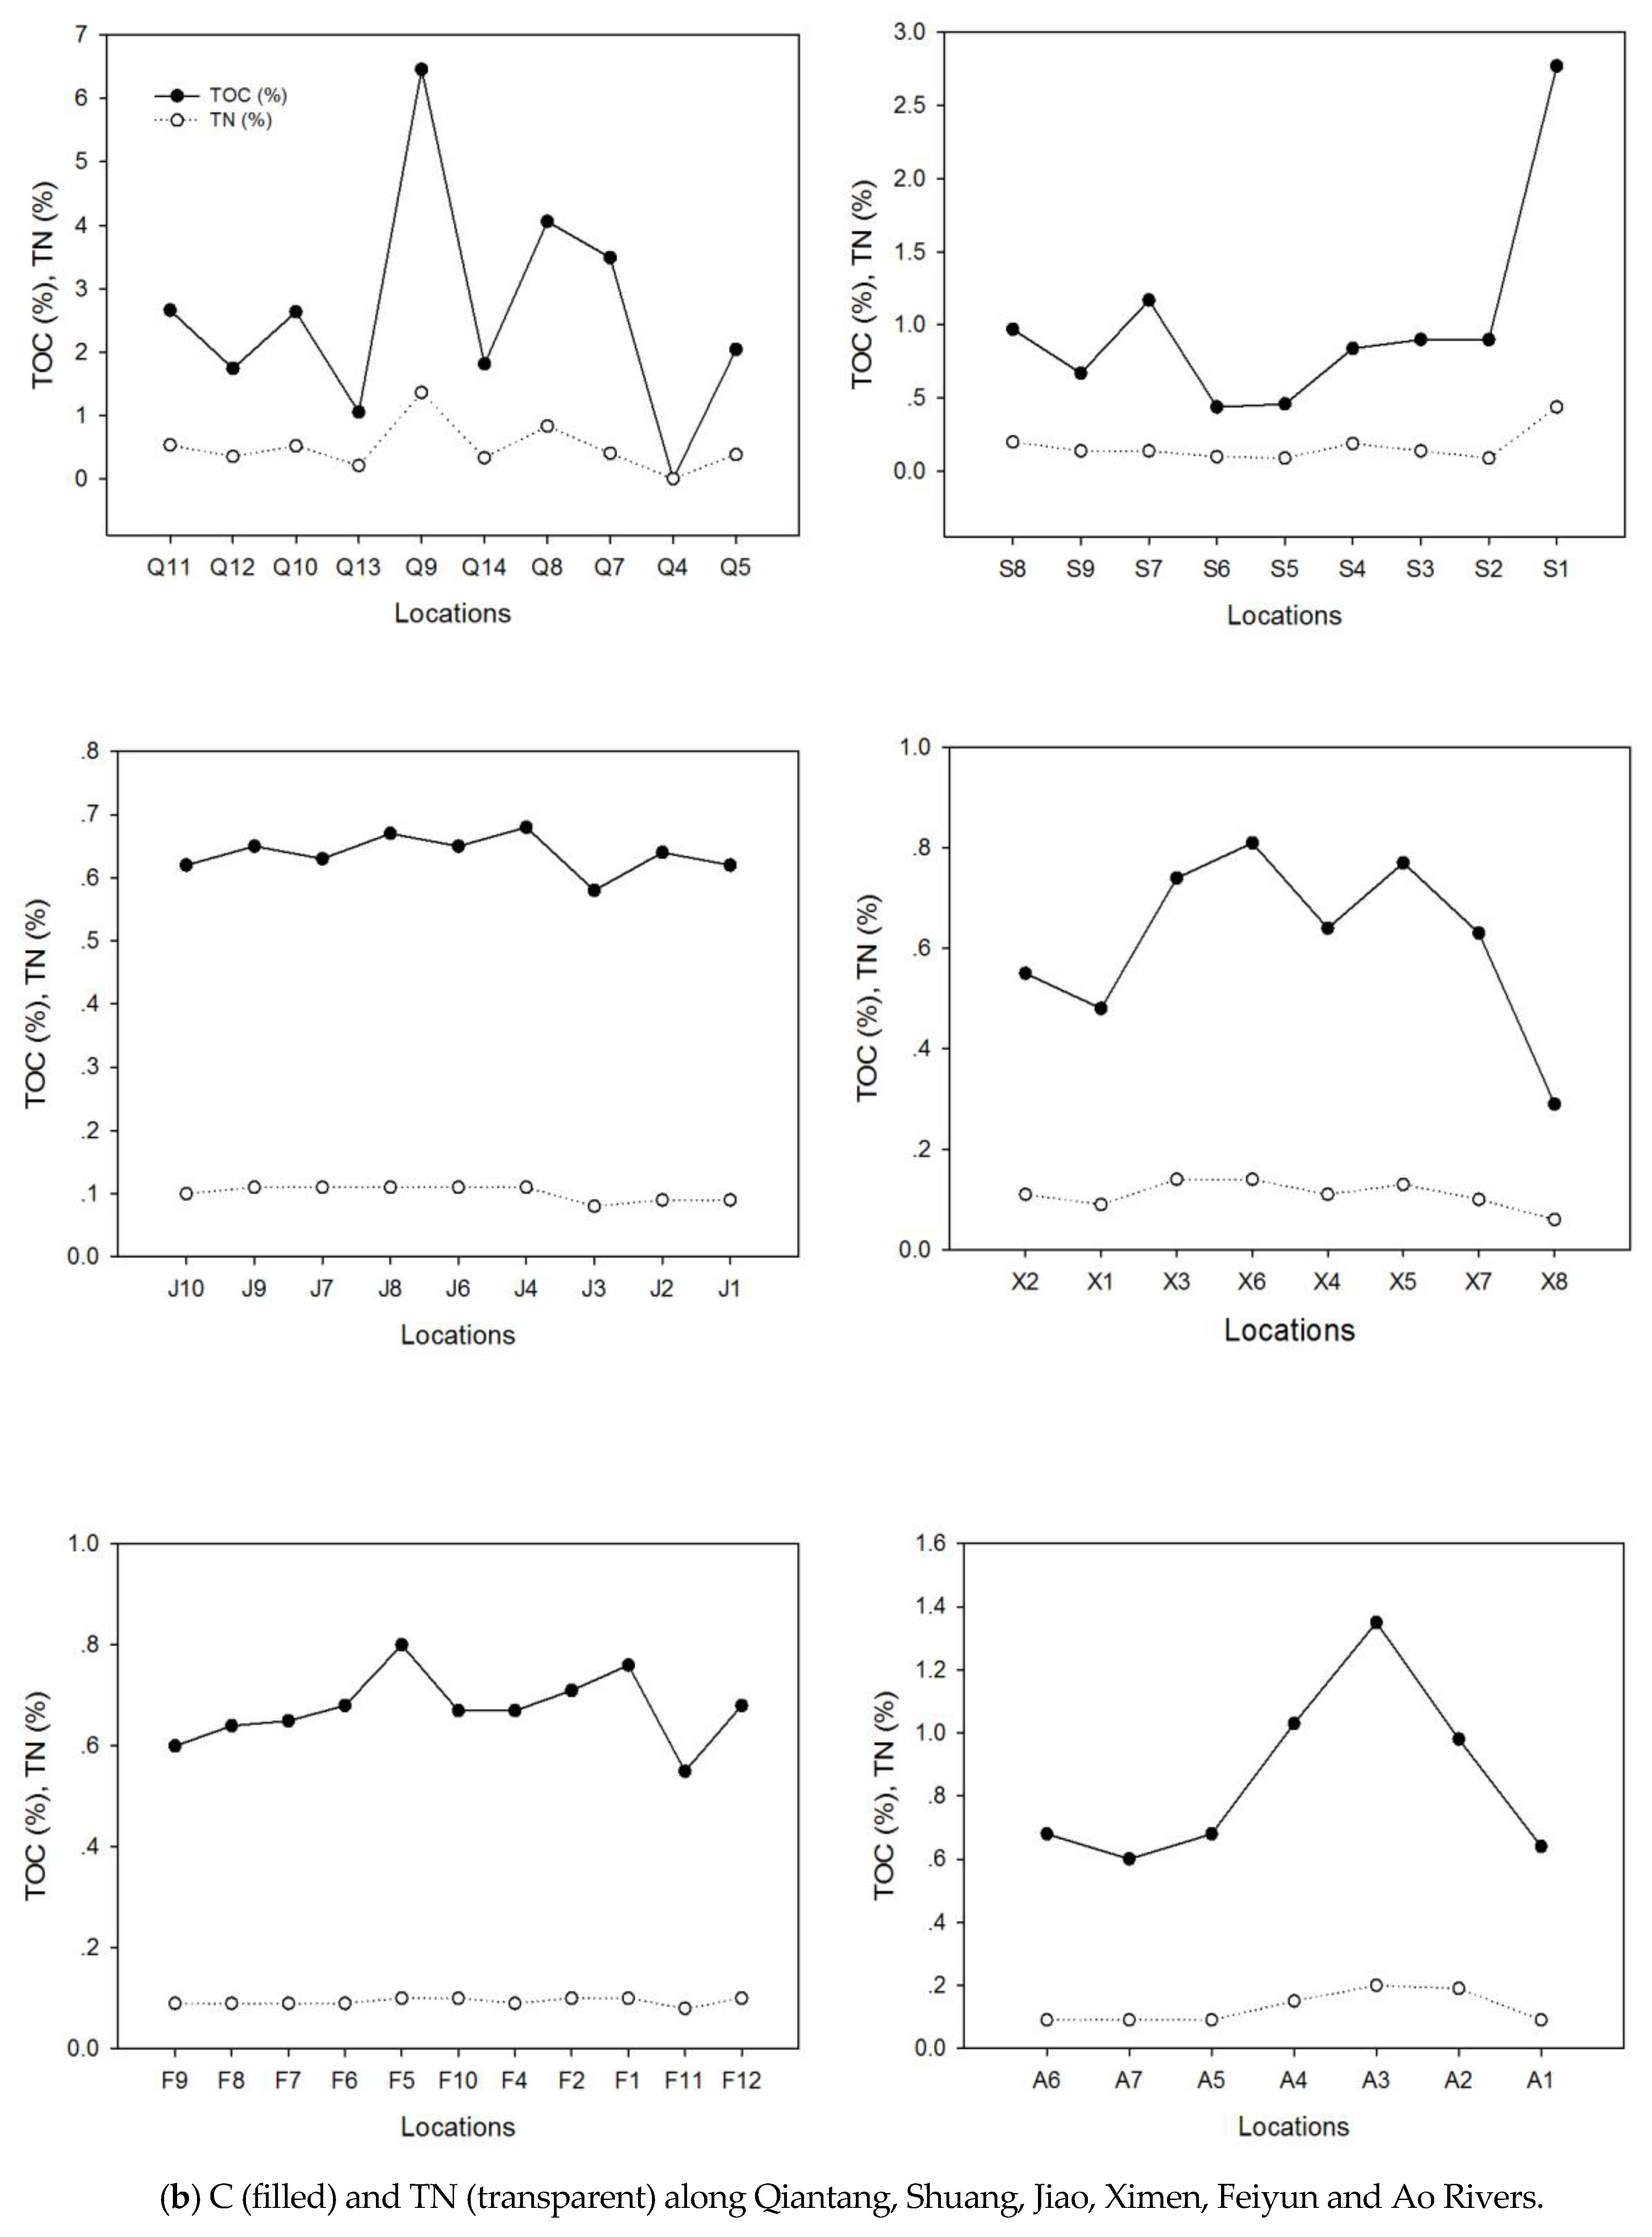
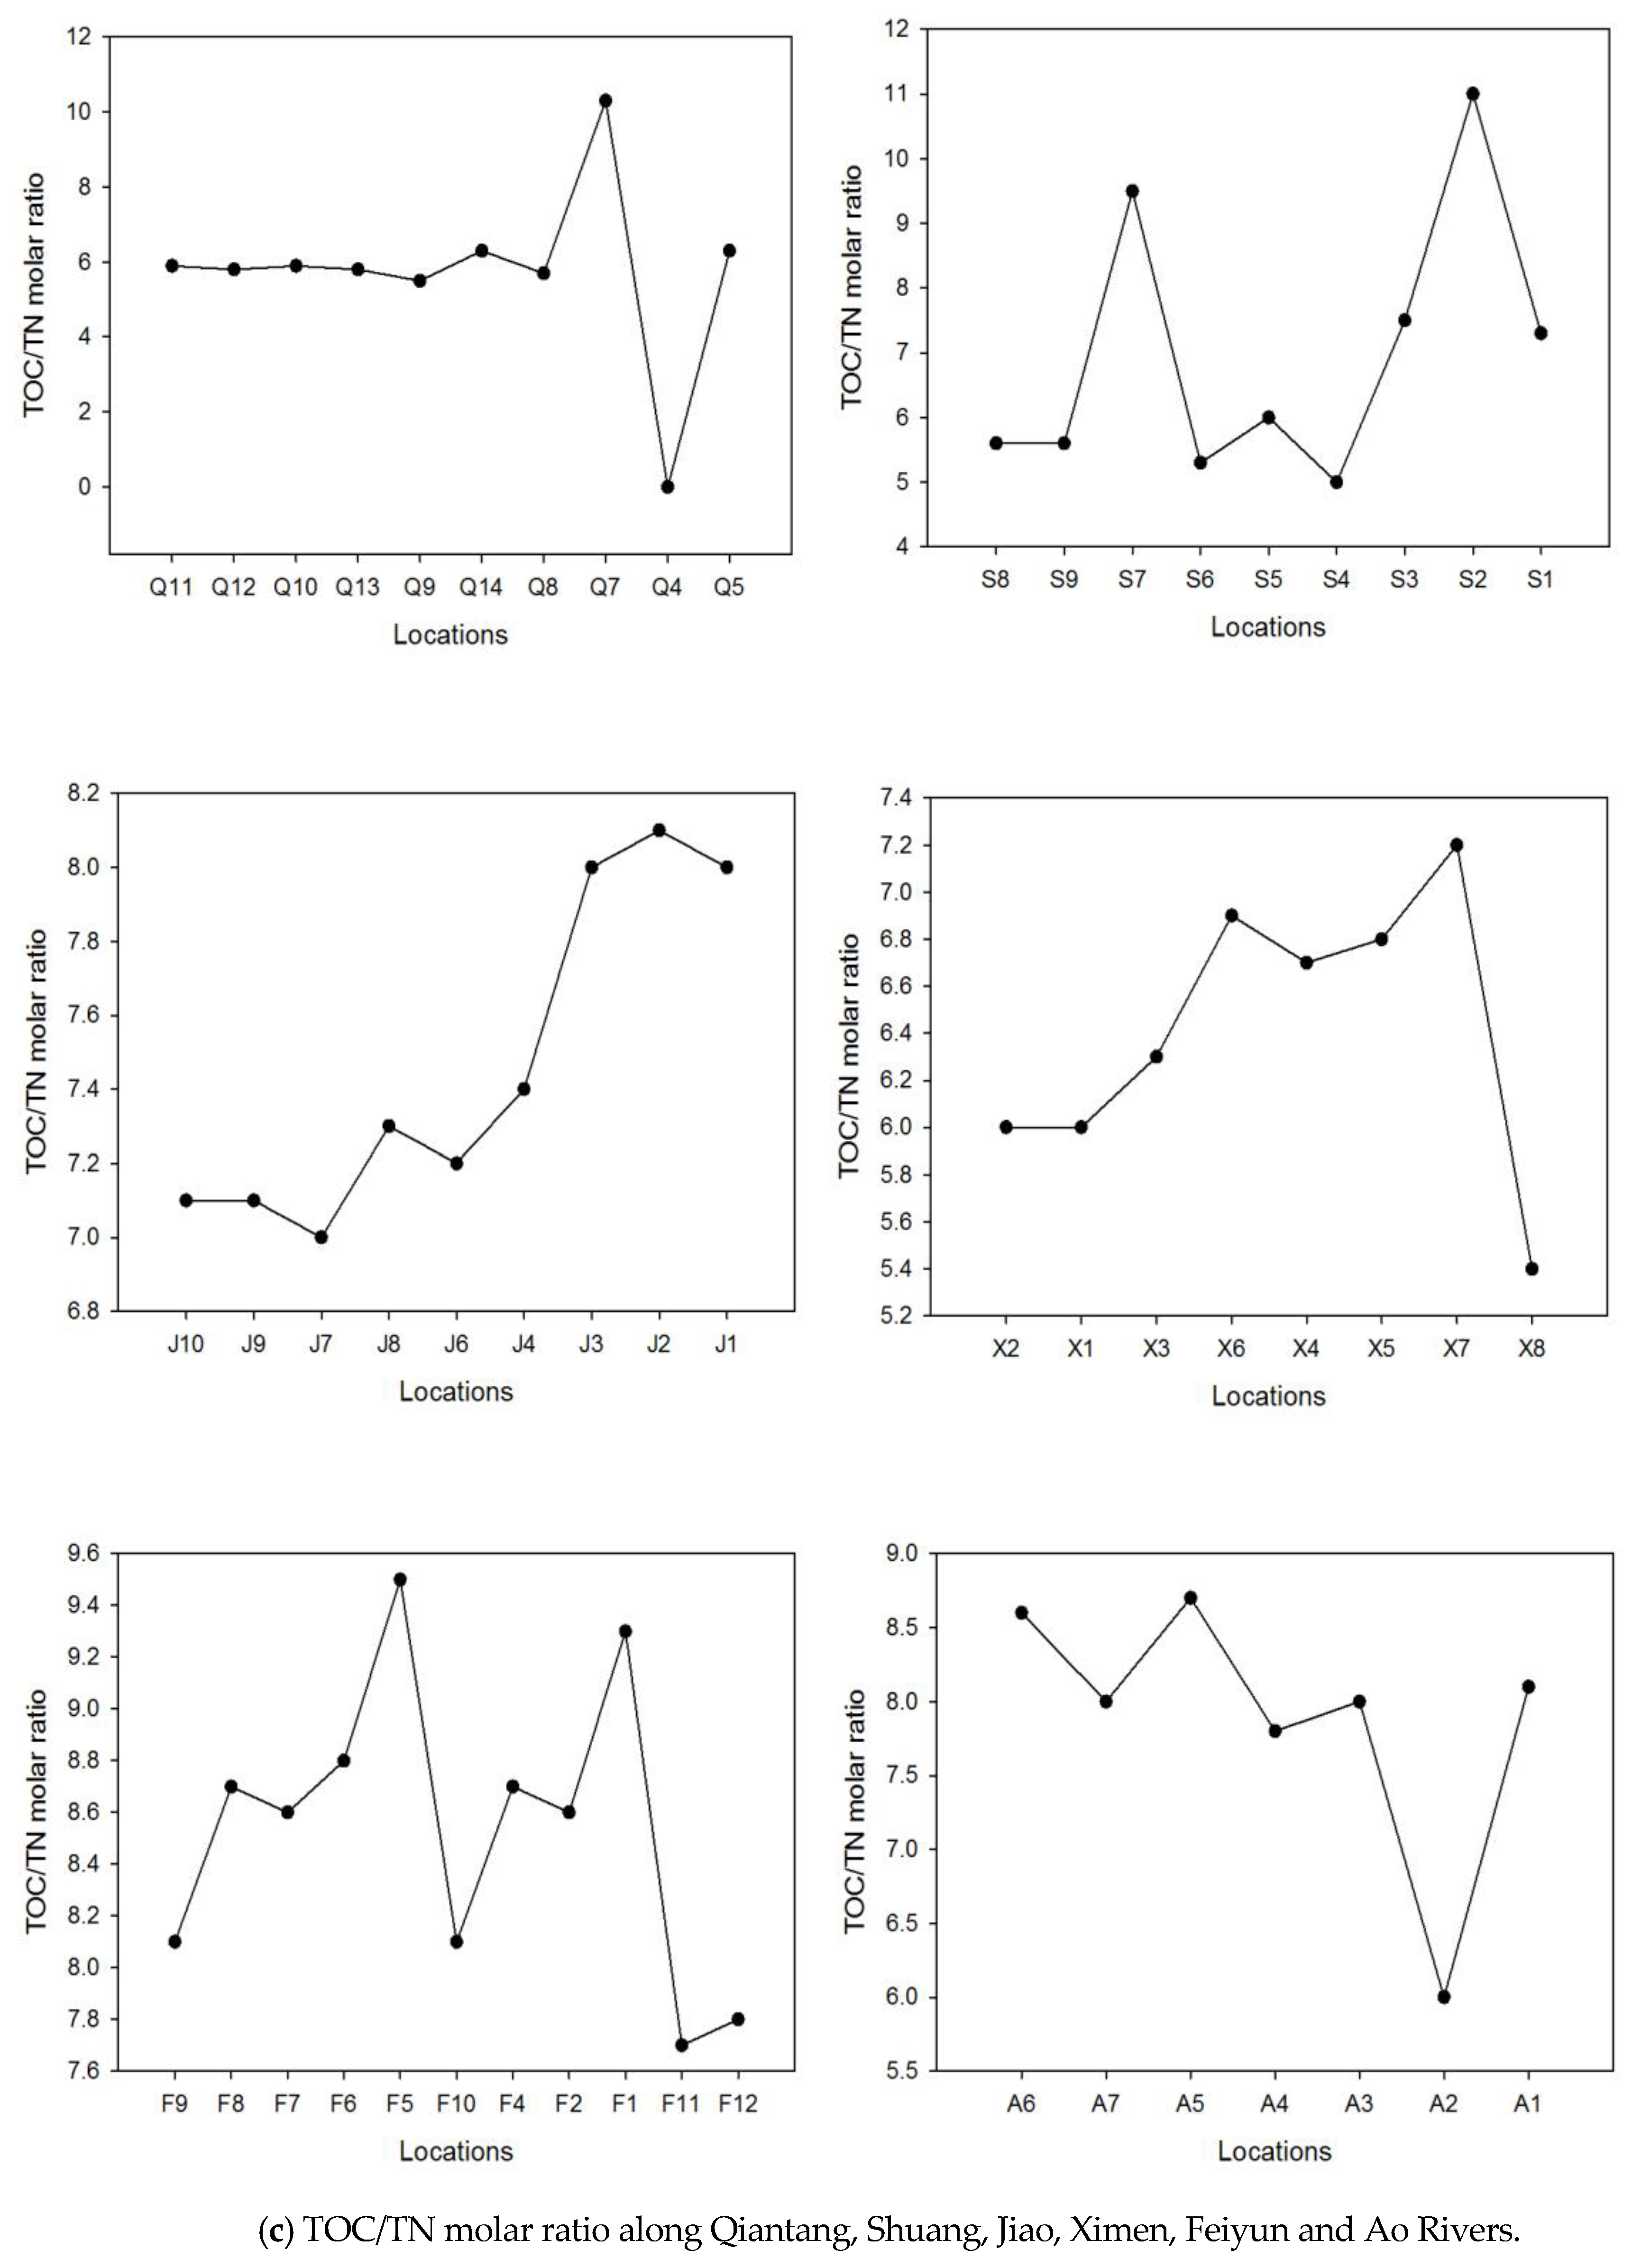
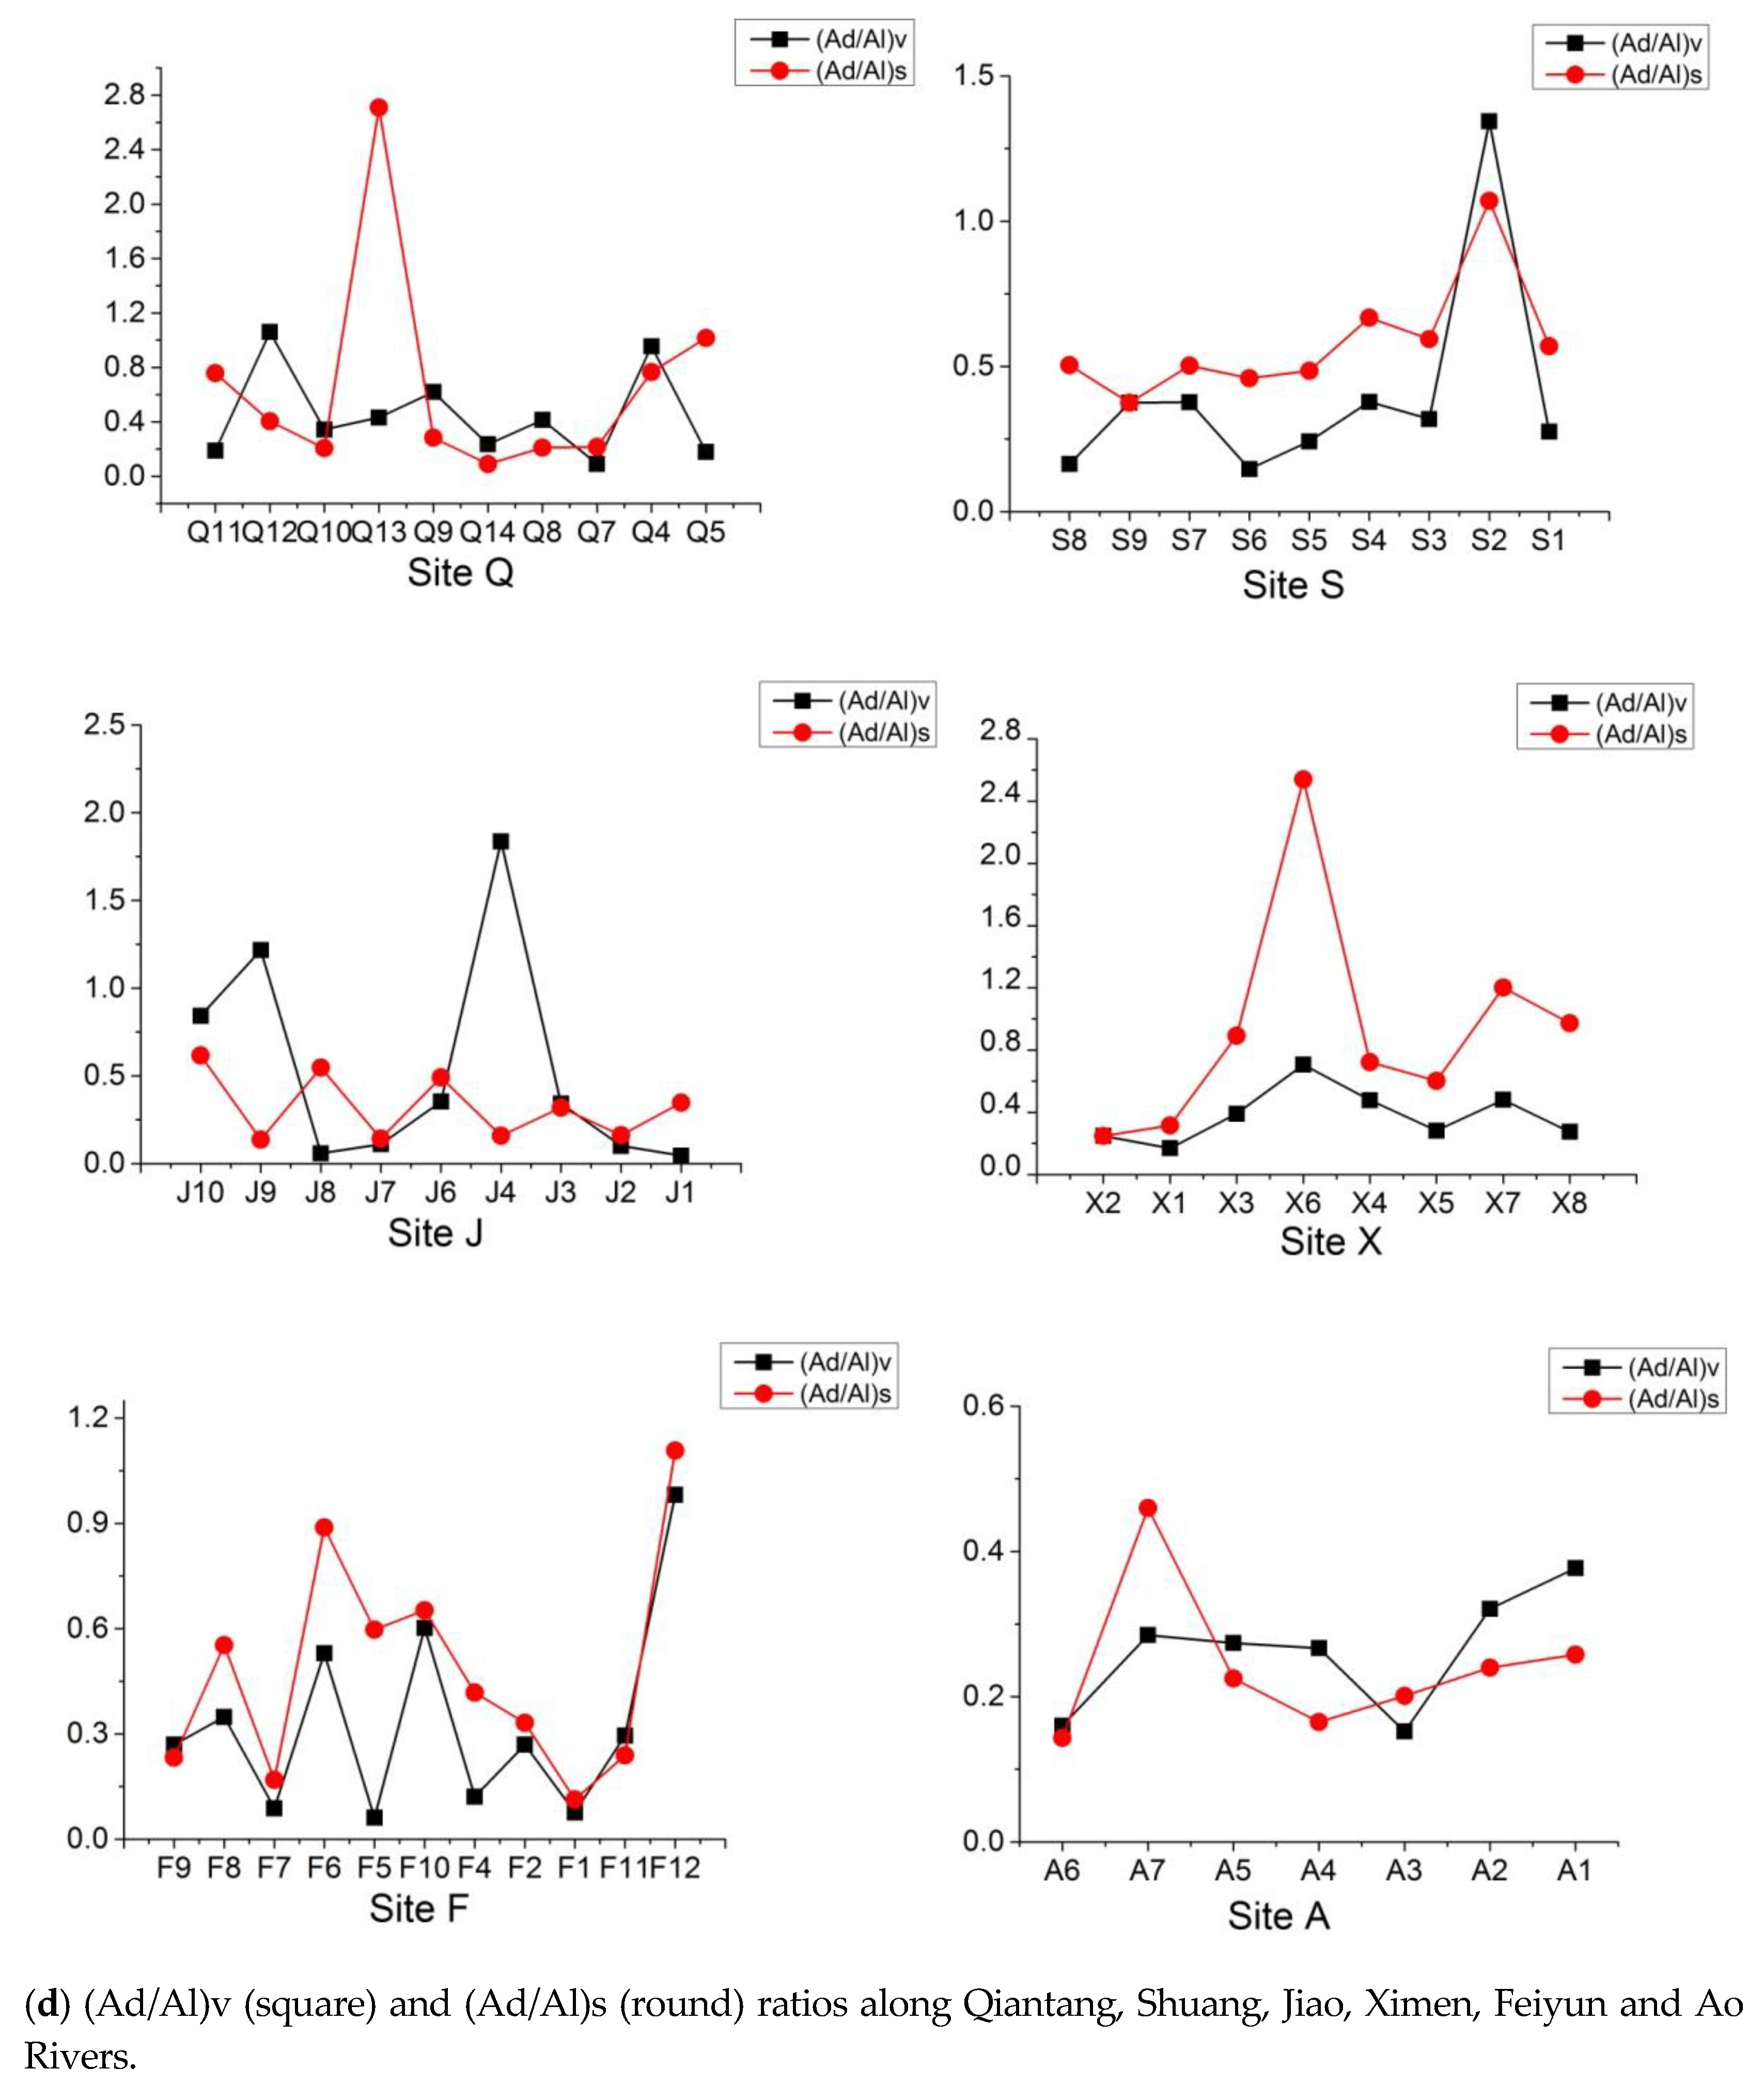
3.1. Sedimentary Organic Matter
3.2. Sedimentary P Species
4. Discussion
4.1. Sources of Sedimentary Organic Matter
4.2. P Pollution
4.3. Dynamics of Sedimentary Organic Matter and P
5. Conclusions
Author Contributions
Funding
Acknowledgments
Conflicts of Interest
Appendix A
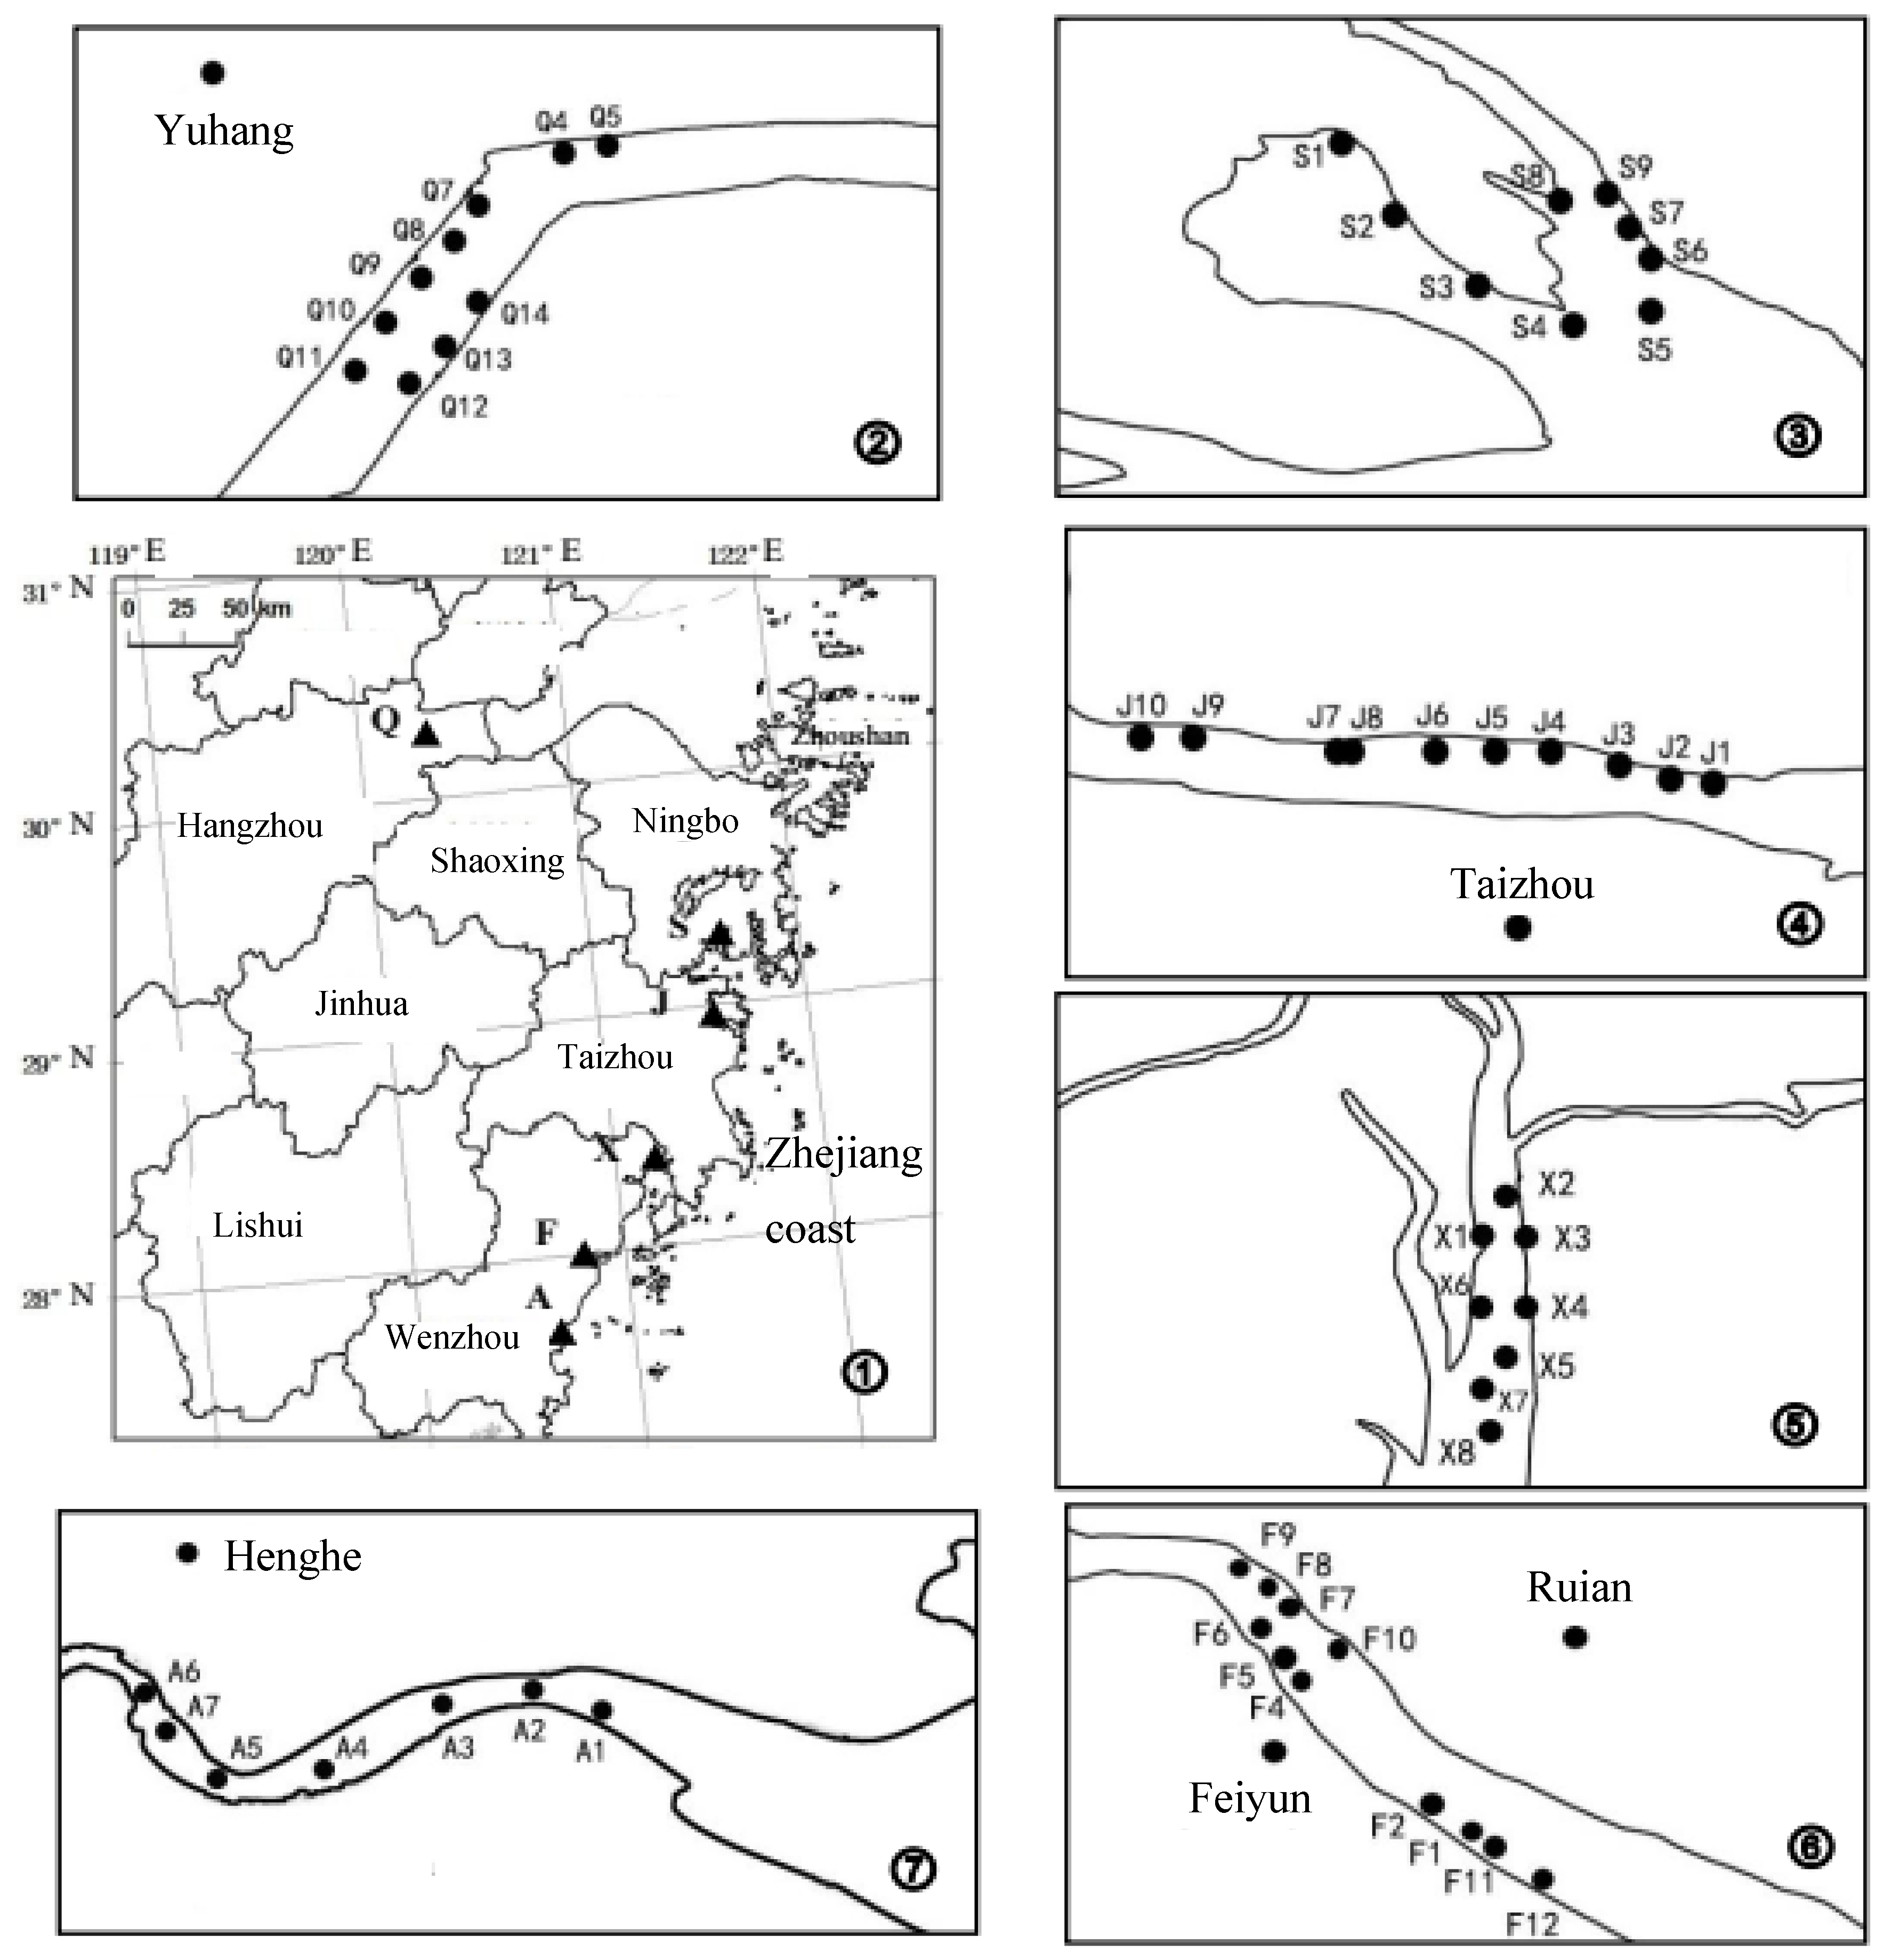
| Date | Station | Longitude (°) | Latitude (°) | Date | Station | Longitude (°) | Latitude (°) |
|---|---|---|---|---|---|---|---|
| 2014.10.16 | A1 | 120.6009 | 27.5884 | 2014.10.18 | J1 | 121.4632 | 28.6900 |
| Ao River | A2 | 120.5952 | 27.5901 | Jiao River | J2 | 121.4511 | 28.6930 |
| A3 | 120.5827 | 27.5873 | J3 | 121.4421 | 28.6958 | ||
| A4 | 120.5725 | 27.5803 | J4 | 121.4265 | 28.6992 | ||
| A5 | 120.5620 | 27.5793 | J5 | 121.4206 | 28.6991 | ||
| A6 | 120.5546 | 27.5864 | J6 | 121.4115 | 28.7001 | ||
| A7 | 120.5562 | 27.5879 | J7 | 121.3905 | 28.7028 | ||
| 2014.10.17 | F1 | 120.6456 | 27.7355 | J8 | 121.3928 | 28.7014 | |
| Feiyun River | F2 | 120.6371 | 27.7426 | J9 | 121.3675 | 28.7036 | |
| F4 | 120.6242 | 27.7604 | J10 | 121.3522 | 28.7058 | ||
| F5 | 120.6200 | 27.7664 | 2014.10.19 | S1 | 121.5572 | 29.2164 | |
| F6 | 120.6170 | 27.7734 | Shuang River | S2 | 121.5702 | 29.1933 | |
| F7 | 120.6193 | 27.7807 | S3 | 121.5905 | 29.1744 | ||
| F8 | 120.6170 | 27.7877 | S4 | 121.6085 | 29.1631 | ||
| F9 | 120.6130 | 27.7924 | S5 | 121.6238 | 29.1669 | ||
| F10 | 120.6282 | 27.7703 | S6 | 121.6252 | 29.1808 | ||
| F11 | 120.6455 | 27.7341 | S7 | 121.6253 | 29.1883 | ||
| F12 | 120.6526 | 27.7275 | S8 | 121.6073 | 29.1961 | ||
| 2014.10.18 | X1 | 121.2078 | 28.3264 | S9 | 121.6217 | 29.1997 | |
| Ximen Island | X2 | 121.2127 | 28.3306 | 2014.10.20 | Q4 | 120.4421 | 30.3903 |
| X3 | 121.2166 | 28.3261 | Qiantang River | Q5 | 120.4533 | 30.3921 | |
| X4 | 121.2144 | 28.3194 | Q7 | 120.4224 | 30.3635 | ||
| X5 | 121.2121 | 28.3118 | Q8 | 120.4176 | 30.3520 | ||
| X6 | 121.2085 | 28.3193 | Q9 | 120.4128 | 30.3405 | ||
| X7 | 121.2103 | 28.3082 | Q10 | 120.4067 | 30.3266 | ||
| X8 | 121.2112 | 28.3035 | Q11 | 120.4019 | 30.3133 | ||
| Q12 | 120.4185 | 30.3074 | |||||
| Q13 | 120.4244 | 30.3185 | |||||
| Q14 | 120.4292 | 30.3308 |
| (a) Qiantang River (Q) | ||||||||||||
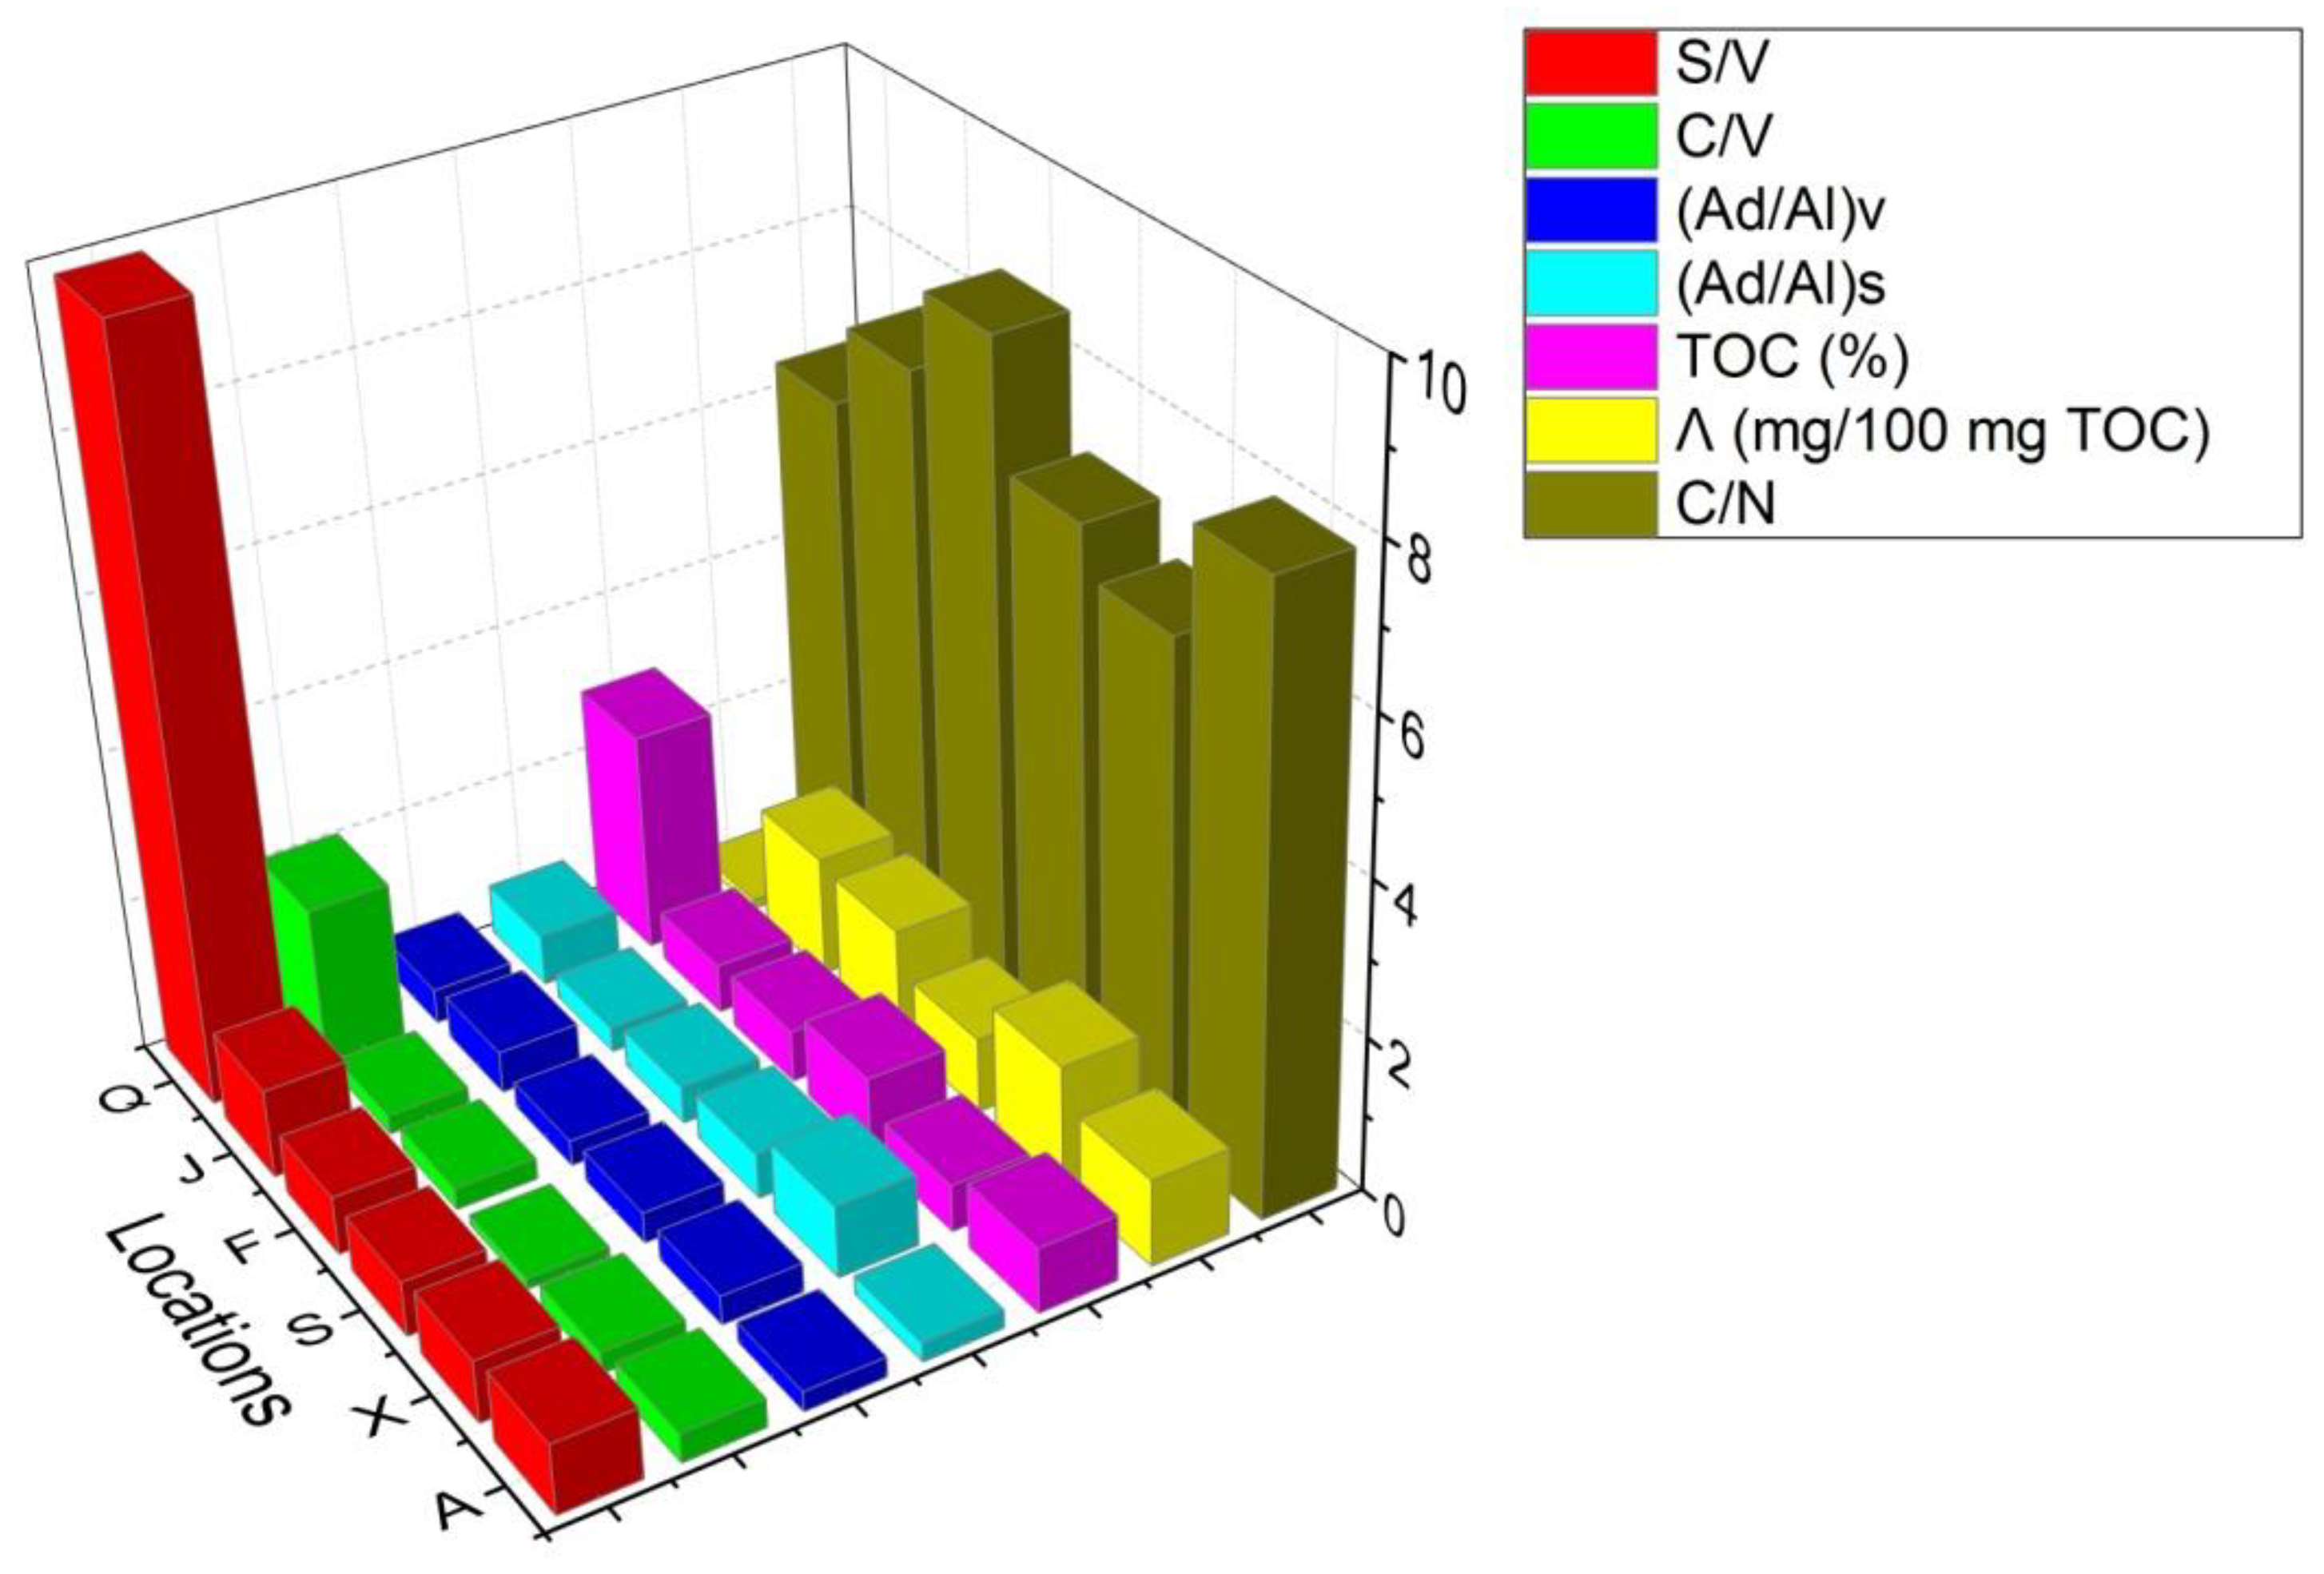
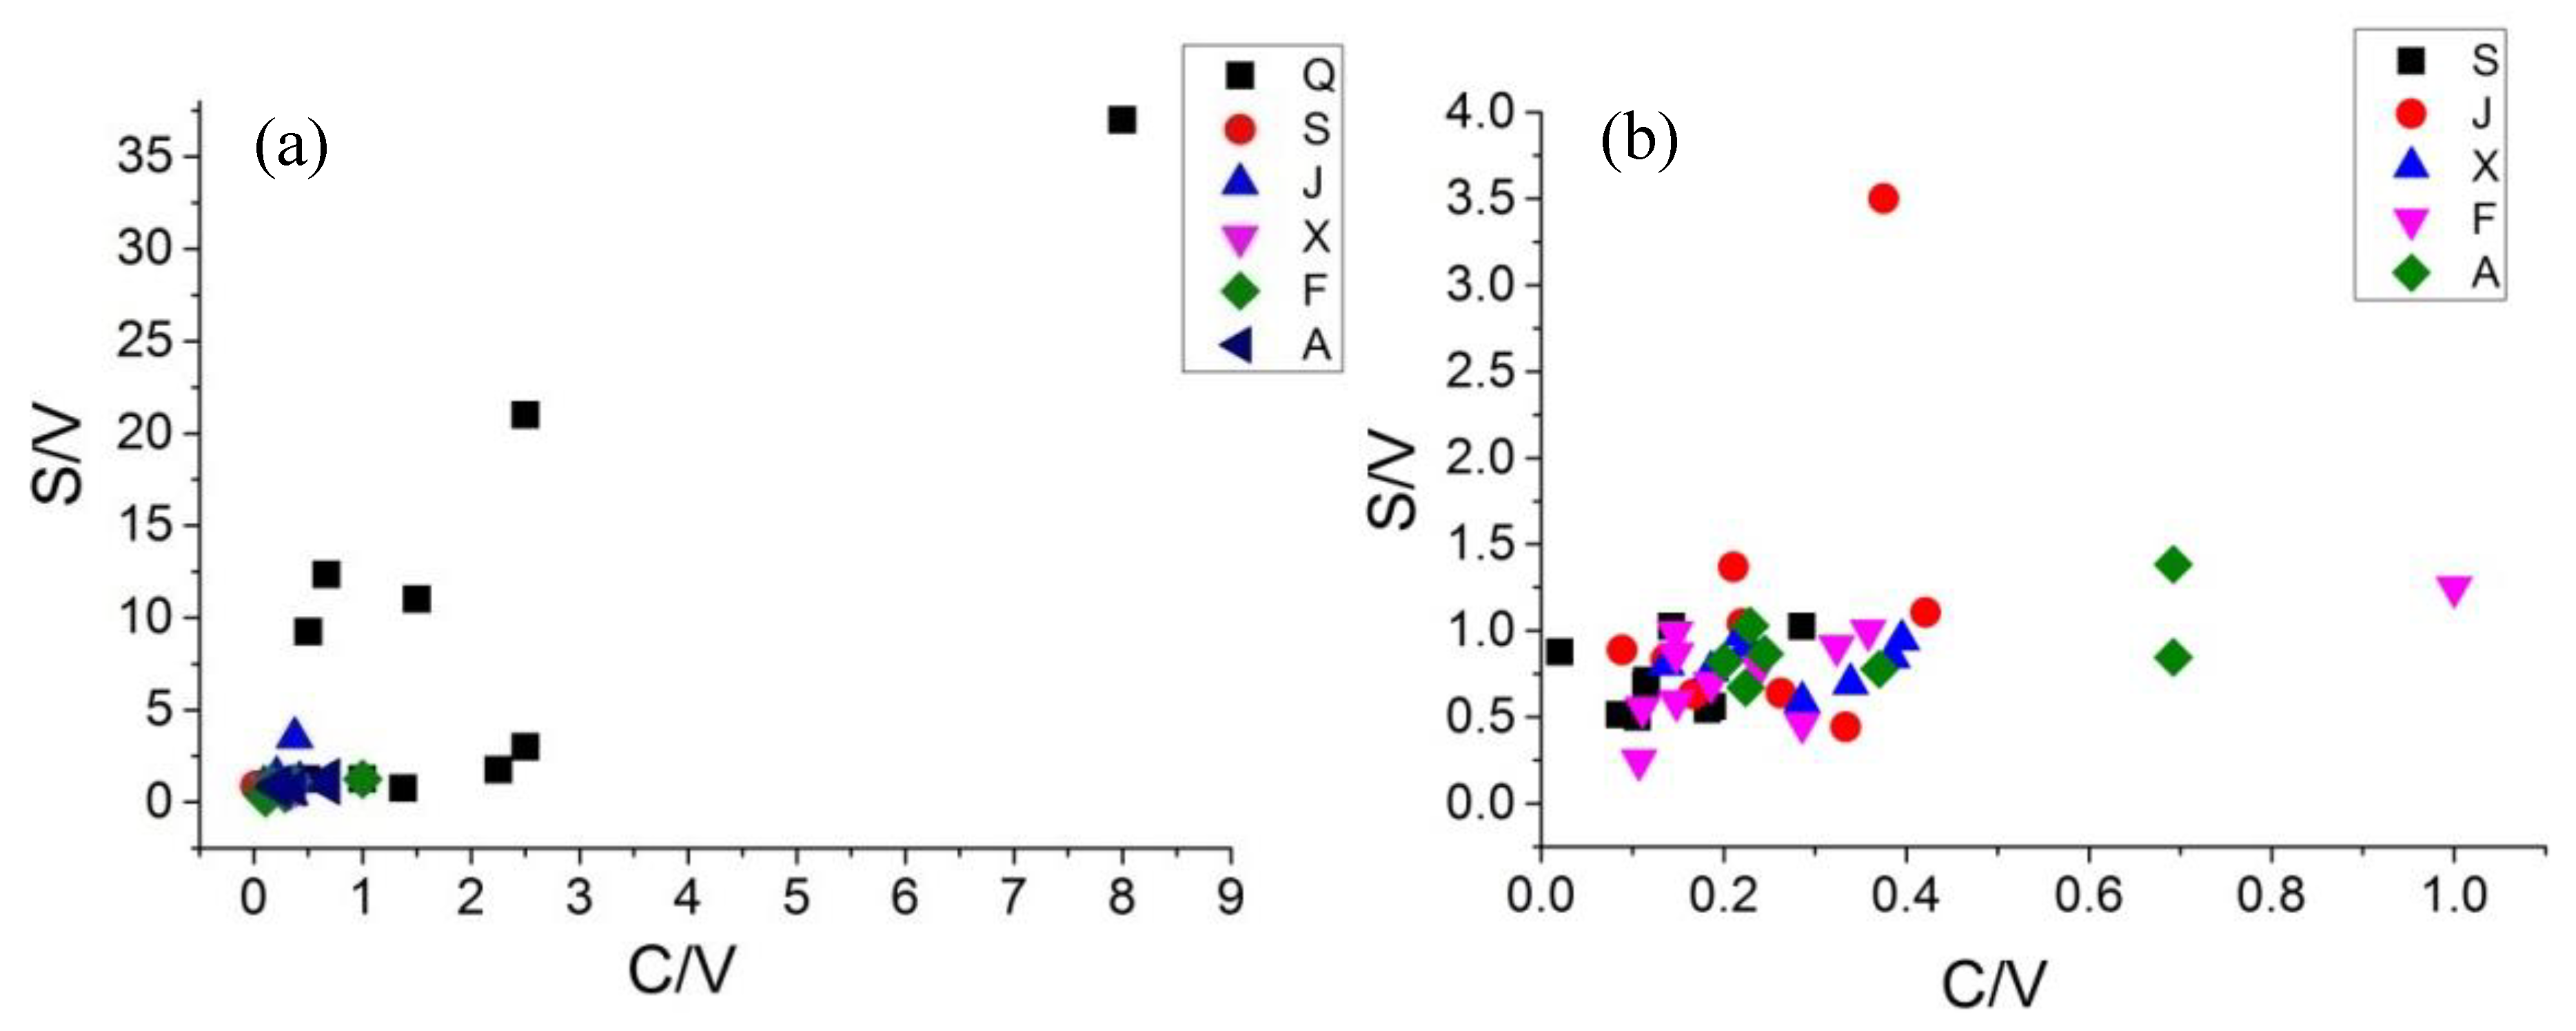
| Qiantang | S (mg/g) | V (mg/g) | C (mg/g) | Total (mg/g) | S/V | C/V | (Ad/Al)v | (Ad/Al)s | TOC (%) | TN (%) | C/N | Λ (mg/100 mg TOC) |
| Q11 | 0.007 | 0.004 | 0.009 | 0.020 | 1.750 | 2.250 | 0.188 | 0.757 | 2.66 | 0.53 | 5.9 | 0.075 |
| Q12 | 0.006 | 0.002 | 0.005 | 0.013 | 3.000 | 2.500 | 1.060 | 0.403 | 1.74 | 0.35 | 5.8 | 0.075 |
| Q10 | 0.042 | 0.002 | 0.005 | 0.049 | 21.000 | 2.500 | 0.343 | 0.206 | 2.63 | 0.52 | 5.9 | 0.186 |
| Q13 | 0.005 | 0.004 | 0.004 | 0.013 | 1.250 | 1.000 | 0.432 | 2.709 | 1.05 | 0.21 | 5.8 | 0.124 |
| Q9 | 0.074 | 0.002 | 0.016 | 0.092 | 37.000 | 8.000 | 0.619 | 0.283 | 6.46 | 1.36 | 5.5 | 0.142 |
| Q14 | 0.022 | 0.002 | 0.003 | 0.027 | 11.000 | 1.500 | 0.235 | 0.088 | 1.81 | 0.33 | 6.3 | 0.149 |
| Q8 | 0.037 | 0.003 | 0.002 | 0.042 | 12.333 | 0.667 | 0.414 | 0.209 | 4.06 | 0.83 | 5.7 | 0.103 |
| Q7 | 0.037 | 0.004 | 0.002 | 0.043 | 9.250 | 0.500 | 0.091 | 0.216 | 3.49 | 0.40 | 10.3 | 0.123 |
| Q4 | 0.047 | 0.037 | 0.018 | 0.102 | 1.270 | 0.486 | 0.955 | 0.765 | ||||
| Q5 | 0.006 | 0.008 | 0.011 | 0.025 | 0.750 | 1.375 | 0.178 | 1.016 | 2.04 | 0.38 | 6.3 | 0.123 |
| Mean | 0.028 | 0.007 | 0.008 | 0.043 | 9.860 | 2.078 | 0.451 | 0.665 | 2.88 | 0.55 | 6.4 | 0.122 |
| (b) Shuang River (S) | ||||||||||||
| Shuang | S (mg/g) | V (mg/g) | C (mg/g) | Total (mg/g) | S/V | C/V | (Ad/Al)v | (Ad/Al)s | TOC (%) | TN (%) | C/N | Λ (mg/100 mg TOC) |
| S8 | 0.018 | 0.033 | 0.006 | 0.057 | 0.545 | 0.182 | 0.164 | 0.504 | 0.97 | 0.20 | 5.6 | 0.588 |
| S9 | 0.043 | 0.042 | 0.012 | 0.097 | 1.008 | 0.284 | 0.375 | 0.357 | 0.67 | 0.14 | 5.6 | 1.454 |
| S7 | 0.037 | 0.052 | 0.006 | 0.095 | 0.712 | 0.115 | 0.377 | 0.503 | 1.17 | 0.14 | 9.5 | 0.812 |
| S6 | 0.027 | 0.048 | 0.009 | 0.084 | 0.563 | 0.188 | 0.147 | 0.459 | 0.44 | 0.10 | 5.3 | 1.909 |
| S5 | 0.018 | 0.035 | 0.003 | 0.056 | 0.514 | 0.086 | 0.242 | 0.485 | 0.46 | 0.09 | 6.0 | 1.217 |
| S4 | 0.019 | 0.038 | 0.004 | 0.061 | 0.500 | 0.105 | 0.378 | 0.668 | 0.84 | 0.19 | 5.0 | 0.726 |
| S3 | 0.024 | 0.035 | 0.004 | 0.063 | 0.686 | 0.114 | 0.319 | 0.594 | 0.90 | 0.14 | 7.5 | 0.700 |
| S2 | 0.043 | 0.049 | 0.001 | 0.093 | 0.878 | 0.020 | 1.344 | 1.070 | 0.90 | 0.09 | 11.0 | 1.033 |
| S1 | 0.043 | 0.042 | 0.006 | 0.091 | 1.024 | 0.143 | 0.275 | 0.570 | 2.77 | 0.44 | 7.3 | 0.329 |
| Mean | 0.030 | 0.042 | 0.006 | 0.077 | 0.714 | 0.137 | 0.402 | 0.579 | 1.01 | 0.17 | 7.0 | 0.974 |
| (c) Jiao River (J) | ||||||||||||
| Jiao | S (mg/g) | V (mg/g) | C (mg/g) | Total (mg/g) | S/V | C/V | (Ad/Al)v | (Ad/Al)s | TOC (%) | TN (%) | C/N | Λ (mg/100 mg TOC) |
| J10 | 0.008 | 0.018 | 0.006 | 0.032 | 0.444 | 0.333 | 0.842 | 0.616 | 0.62 | 0.10 | 7.1 | 0.516 |
| J9 | 0.026 | 0.019 | 0.004 | 0.049 | 1.368 | 0.211 | 1.217 | 0.136 | 0.65 | 0.11 | 7.1 | 0.754 |
| J7 | 0.019 | 0.030 | 0.005 | 0.054 | 0.633 | 0.167 | 0.058 | 0.547 | 0.63 | 0.11 | 7.0 | 0.857 |
| J8 | 0.028 | 0.008 | 0.003 | 0.039 | 3.500 | 0.375 | 0.110 | 0.143 | 0.67 | 0.11 | 7.3 | 0.582 |
| J6 | 0.080 | 0.090 | 0.008 | 0.178 | 0.889 | 0.089 | 0.353 | 0.491 | 0.65 | 0.11 | 7.2 | 2.738 |
| J4 | 0.090 | 0.141 | 0.037 | 0.268 | 0.638 | 0.262 | 1.837 | 0.158 | 0.68 | 0.11 | 7.4 | 3.941 |
| J3 | 0.052 | 0.050 | 0.011 | 0.113 | 1.040 | 0.220 | 0.342 | 0.319 | 0.58 | 0.08 | 8.0 | 1.948 |
| J2 | 0.055 | 0.066 | 0.009 | 0.13 | 0.833 | 0.136 | 0.101 | 0.161 | 0.64 | 0.09 | 8.1 | 2.031 |
| J1 | 0.021 | 0.019 | 0.008 | 0.048 | 1.105 | 0.421 | 0.045 | 0.346 | 0.62 | 0.09 | 8.0 | 0.774 |
| Mean | 0.042 | 0.049 | 0.010 | 0.101 | 1.161 | 0.246 | 0.545 | 0.324 | 0.64 | 0.10 | 7.5 | 1.571 |
| (d) Ximen Island (X) | ||||||||||||
| Ximen | S (mg/g) | V (mg/g) | C (mg/g) | Total (mg/g) | S/V | C/V | (Ad/Al)v | (Ad/Al)s | TOC (%) | TN (%) | C/N | Λ (mg/100 mg TOC) |
| X2 | 0.041 | 0.051 | 0.007 | 0.099 | 0.804 | 0.137 | 0.249 | 0.249 | 0.55 | 0.11 | 6.0 | 1.800 |
| X1 | 0.036 | 0.038 | 0.015 | 0.089 | 0.947 | 0.395 | 0.170 | 0.316 | 0.48 | 0.09 | 6.0 | 1.854 |
| X3 | 0.043 | 0.062 | 0.021 | 0.126 | 0.694 | 0.339 | 0.391 | 0.892 | 0.74 | 0.14 | 6.3 | 1.703 |
| X6 | 0.011 | 0.013 | 0.005 | 0.029 | 0.846 | 0.385 | 0.706 | 2.540 | 0.81 | 0.14 | 6.9 | 0.358 |
| X4 | 0.033 | 0.043 | 0.008 | 0.084 | 0.767 | 0.186 | 0.478 | 0.722 | 0.64 | 0.11 | 6.7 | 1.313 |
| X5 | 0.033 | 0.056 | 0.016 | 0.105 | 0.589 | 0.286 | 0.282 | 0.603 | 0.77 | 0.13 | 6.8 | 1.364 |
| X7 | 0.032 | 0.036 | 0.008 | 0.076 | 0.889 | 0.222 | 0.481 | 1.203 | 0.63 | 0.10 | 7.2 | 1.206 |
| X8 | 0.040 | 0.041 | 0.009 | 0.090 | 0.976 | 0.220 | 0.275 | 0.973 | 0.29 | 0.06 | 5.4 | 3.103 |
| Mean | 0.034 | 0.043 | 0.011 | 0.087 | 0.814 | 0.271 | 0.379 | 0.937 | 0.61 | 0.11 | 6.4 | 1.588 |
| (e) Feiyun River (F) | ||||||||||||
| Feiyun | S (mg/g) | V (mg/g) | C (mg/g) | Total (mg/g) | S/V | C/V | (Ad/Al)v | (Ad/Al)s | TOC (%) | TN (%) | C/N | Λ (mg/100 mg TOC) |
| F9 | 0.053 ± 0.0065 | 0.067 ± 0.0113 | 0.016 ± 0.0062 | 0.137 | 0.798 ± 0.0497 | 0.244 ± 0.0749 | 0.269 ± 0.1485 | 0.232 ± 0.0842 | 0.60 | 0.09 | 8.1 | 2.294 |
| F8 | 0.013 | 0.028 | 0.008 | 0.049 | 0.464 | 0.286 | 0.348 | 0.553 | 0.64 | 0.09 | 8.7 | 0.766 |
| F7 | 0.031 | 0.034 | 0.011 | 0.076 | 0.912 | 0.324 | 0.088 | 0.169 | 0.65 | 0.09 | 8.6 | 1.169 |
| F6 | 0.053 | 0.061 | 0.009 | 0.123 | 0.869 | 0.148 | 0.530 | 0.888 | 0.68 | 0.09 | 8.8 | 1.809 |
| F5 | 0.010 | 0.008 | 0.008 | 0.026 | 1.250 | 1.000 | 0.061 | 0.597 | 0.80 | 0.10 | 9.5 | 0.325 |
| F10 | 0.030 | 0.054 | 0.006 | 0.090 | 0.556 | 0.111 | 0.602 | 0.652 | 0.67 | 0.10 | 8.1 | 1.343 |
| F4 | 0.016 | 0.027 | 0.004 | 0.047 | 0.593 | 0.148 | 0.121 | 0.417 | 0.67 | 0.09 | 8.7 | 0.701 |
| F2 | 0.030 | 0.043 | 0.008 | 0.081 | 0.698 | 0.186 | 0.269 | 0.331 | 0.71 | 0.10 | 8.6 | 1.141 |
| F1 | 0.067 | 0.067 | 0.024 | 0.158 | 1.000 | 0.358 | 0.076 | 0.113 | 0.76 | 0.10 | 9.3 | 2.079 |
| F11 | 0.108 | 0.109 | 0.016 | 0.233 | 0.991 | 0.147 | 0.295 | 0.239 | 0.55 | 0.08 | 7.7 | 4.236 |
| F12 | 0.007 | 0.028 | 0.003 | 0.038 | 0.250 | 0.107 | 0.981 | 1.107 | 0.68 | 0.10 | 7.8 | 0.559 |
| Mean | 0.038 | 0.048 | 0.010 | 0.096 | 0.762 | 0.278 | 0.331 | 0.482 | 0.67 | 0.09 | 8.5 | 1.493 |
| (f) Ao River (A) | ||||||||||||
| Ao | S (mg/g) | V (mg/g) | C (mg/g) | Total (mg/g) | S/V | C/V | (Ad/Al)v | (Ad/Al)s | TOC (%) | TN (%) | C/N | Λ (mg/100 mg TOC) |
| A6 | 0.042 | 0.054 | 0.020 | 0.116 | 0.778 | 0.370 | 0.160 | 0.143 | 0.68 | 0.09 | 8.6 | 1.706 |
| A7 | 0.036 | 0.035 | 0.008 | 0.079 | 1.029 | 0.229 | 0.285 | 0.460 | 0.60 | 0.09 | 8.0 | 1.317 |
| A5 | 0.039 | 0.045 | 0.011 | 0.095 | 0.867 | 0.244 | 0.274 | 0.225 | 0.68 | 0.09 | 8.7 | 1.397 |
| A4 | 0.045 | 0.067 | 0.015 | 0.127 | 0.672 | 0.224 | 0.267 | 0.165 | 1.03 | 0.15 | 7.8 | 1.233 |
| A3 | 0.011 | 0.013 | 0.009 | 0.033 | 0.846 | 0.692 | 0.152 | 0.201 | 1.35 | 0.20 | 8.0 | 0.244 |
| A2 | 0.018 | 0.013 | 0.009 | 0.040 | 1.385 | 0.692 | 0.321 | 0.240 | 0.98 | 0.19 | 6.0 | 0.408 |
| A1 | 0.041 | 0.050 | 0.010 | 0.101 | 0.820 | 0.200 | 0.377 | 0.258 | 0.64 | 0.09 | 8.1 | 1.578 |
| Mean | 0.033 | 0.040 | 0.012 | 0.084 | 0.914 | 0.379 | 0.262 | 0.242 | 0.85 | 0.13 | 7.9 | 1.126 |
| (a) Qiantang River (Q): N = 10 | ||||||||
| Q | S/V | C/V | (Ad/Al)V | (Ad/Al)S | Λ | TOC | TN | C/N |
| S/V | 1 | 0.692 * | −0.031 | −0.669 * | 0.501 | 0.861 ** | 0.871 ** | 0.124 |
| C/V | 1 | 0.261 | −0.171 | 0.009 | 0.661 | 0.764 * | −0.393 | |
| (Ad/Al)V | 1 | 0.344 | −0.387 | 0.058 | 0.199 | −0.468 | ||
| (Ad/Al)S | 1 | −0.490 | −0.545 | −0.439 | −0.287 | |||
| Λ | 1 | 0.127 | 0.112 | 0.054 | ||||
| TOC | 1 | 0.954 ** | 0.037 | |||||
| TN | 1 | −0.262 | ||||||
| C/N | 1 | |||||||
| (b) Shuang River (S): N = 9 | ||||||||
| S | S/V | C/V | (Ad/Al)V | (Ad/Al)S | Λ | TOC | TN | C/N |
| S/V | 1 | −0.209 | 0.464 | 0.446 | −0.396 | 0.779 * | 0.572 | 0.664 |
| C/V | 1 | −0.723 * | −0.656 | 0.144 | 0.006 | 0.227 | −0.683 * | |
| (Ad/Al)V | 1 | 0.967 ** | −0.026 | −0.024 | −0.225 | 0.778 * | ||
| (Ad/Al)S | 1 | −0.112 | 0.020 | −0.152 | 0.646 | |||
| Λ | 1 | −0.704 * | −0.681 * | −0.212 | ||||
| TOC | 1 | 0.939 * | 0.243 | |||||
| TN | 1 | −0.094 | ||||||
| C/N | 1 | |||||||
| (c) Jiao River (J): N = 9 | ||||||||
| J | S/V | C/V | (Ad/Al)V | (Ad/Al)S | Λ | TOC | TN | C/N |
| S/V | 1 | 0.265 | −0.203 | −0.367 | −0.260 | 0.454 | 0.351 | −0.166 |
| C/V | 1 | 0.040 | 0.312 | −0.460 | −0.024 | −0.127 | 0.108 | |
| (Ad/Al)V | 1 | 0.110 | 0.514 | 0.429 | 0.374 | −0.336 | ||
| (Ad/Al)S | 1 | −0.362 | −0.306 | −0.106 | −0.255 | |||
| Λ | 1 | 0.382 | 0.140 | 0.110 | ||||
| TOC | 1 | 0.796 * | −0.423 | |||||
| TN | 1 | −0.865 ** | ||||||
| C/N | 1 | |||||||
| (d) Ximen Island (X): N = 8 | ||||||||
| X | S/V | C/V | (Ad/Al)V | (Ad/Al)S | Λ | TOC | TN | C/N |
| S/V | 1 | −0.056 | 0.457 | 0.544 | 0.263 | −0.347 | −0.462 | −0.031 |
| C/V | 1 | 0.076 | 0.394 | −0.241 | 0.288 | 0.299 | 0.070 | |
| (Ad/Al)V | 1 | 0.843 ** | −0.655 | 0.602 | 0.505 | 0.662 | ||
| (Ad/Al)S | 1 | −0.519 | 0.388 | 0.321 | 0.391 | |||
| Λ | 1 | −0.845 ** | −0.766 * | −0.831 * | ||||
| TOC | 1 | 0.961 ** | 0.800 ** | |||||
| TN | 1 | 0.618 | ||||||
| C/N | 1 | |||||||
| (e) Feiyun River (F): N = 11 | ||||||||
| F | S/V | C/V | (Ad/Al)V | (Ad/Al)S | Λ | TOC | TN | C/N |
| S/V | 1 | 0.590 | −0.490 | −0.376 | 0.396 | 0.207 | −0.258 | 0.433 |
| C/V | 1 | −0.523 | −0.158 | −0.335 | 0.639 * | 0.290 | 0.710 * | |
| (Ad/Al)V | 1 | 0.798 ** | −0.070 | −0.183 | 0.204 | −0.603 * | ||
| (Ad/Al)S | 1 | −0.497 | 0.220 | 0.416 | −0.168 | |||
| Λ | 1 | −0.632 * | −0.655 * | −0.455 | ||||
| TOC | 1 | 0.810 ** | 0.806 ** | |||||
| TN | 1 | 0.378 | ||||||
| C/N | 1 | |||||||
| (f) Ao River (A): N = 7 | ||||||||
| A | S/V | C/V | (Ad/Al)V | (Ad/Al)S | Λ | TOC | TN | C/N |
| S/V | 1 | −0.221 | 0.560 | 0.193 | 0.157 | −0.628 | −0.341 | −0.364 |
| C/V | 1 | −0.397 | 0.485 | −0.888 ** | 0.742 | 0.844 * | −0.574 | |
| (Ad/Al)V | 1 | −0.001 | 0.176 | −0.449 | −0.242 | −0.365 | ||
| (Ad/Al)S | 1 | −0.636 | 0.226 | 0.377 | −0.376 | |||
| Λ | 1 | −0.825 * | −0.931 ** | −0.666 | ||||
| TOC | 1 | 0.931 ** | −0.360 | |||||
| TN | 1 | −0.688 | ||||||
| C/N | 1 | |||||||
| (a) Qiantang River (Q) | ||||||||
| Locs | Concentration of P fraction (mg/kg) | OC (%) | OC/OP molar ratio | |||||
| NaOH-P | HCl-P | IP | OP | TP | BAP | |||
| Q11 | 2.55 | 2.85 | 9.37 | 3.48 | 12.85 | 6.03 | 2.66 | 19741 |
| Q12 | 4.30 | 1.54 | 9.28 | 3.44 | 12.72 | 7.74 | 1.74 | 13050 |
| Q10 | 1.12 | 2.21 | 6.77 | 4.01 | 10.78 | 5.13 | 2.63 | 16921 |
| Q13 | 2.53 | 2.15 | 10.71 | 5.41 | 16.12 | 7.94 | 1.05 | 5005 |
| Q9 | 1.73 | 2.14 | 9.26 | 3.70 | 12.96 | 5.43 | 6.46 | 45130 |
| Q14 | 2.03 | 5.41 | 11.79 | 6.63 | 18.42 | 8.66 | 1.81 | 7050 |
| Q8 | 1.08 | 1.90 | 7.93 | 3.66 | 11.59 | 4.74 | 4.06 | 28621 |
| Q7 | 1.78 ± 0.24 | 2.74 ± 1.29 | 8.35 ± 0.14 | 4.42 ± 0.59 | 12.77 | 6.20 | 3.49 | 20410 |
| Q4 | 7.16 | 15.1480 | 14.45 | 5.53 | 19.98 | 12.69 | ||
| Q5 | 1.40 | 5.5449 | 2.39 | 4.10 | 6.49 | 5.50 | 2.04 | 12853 |
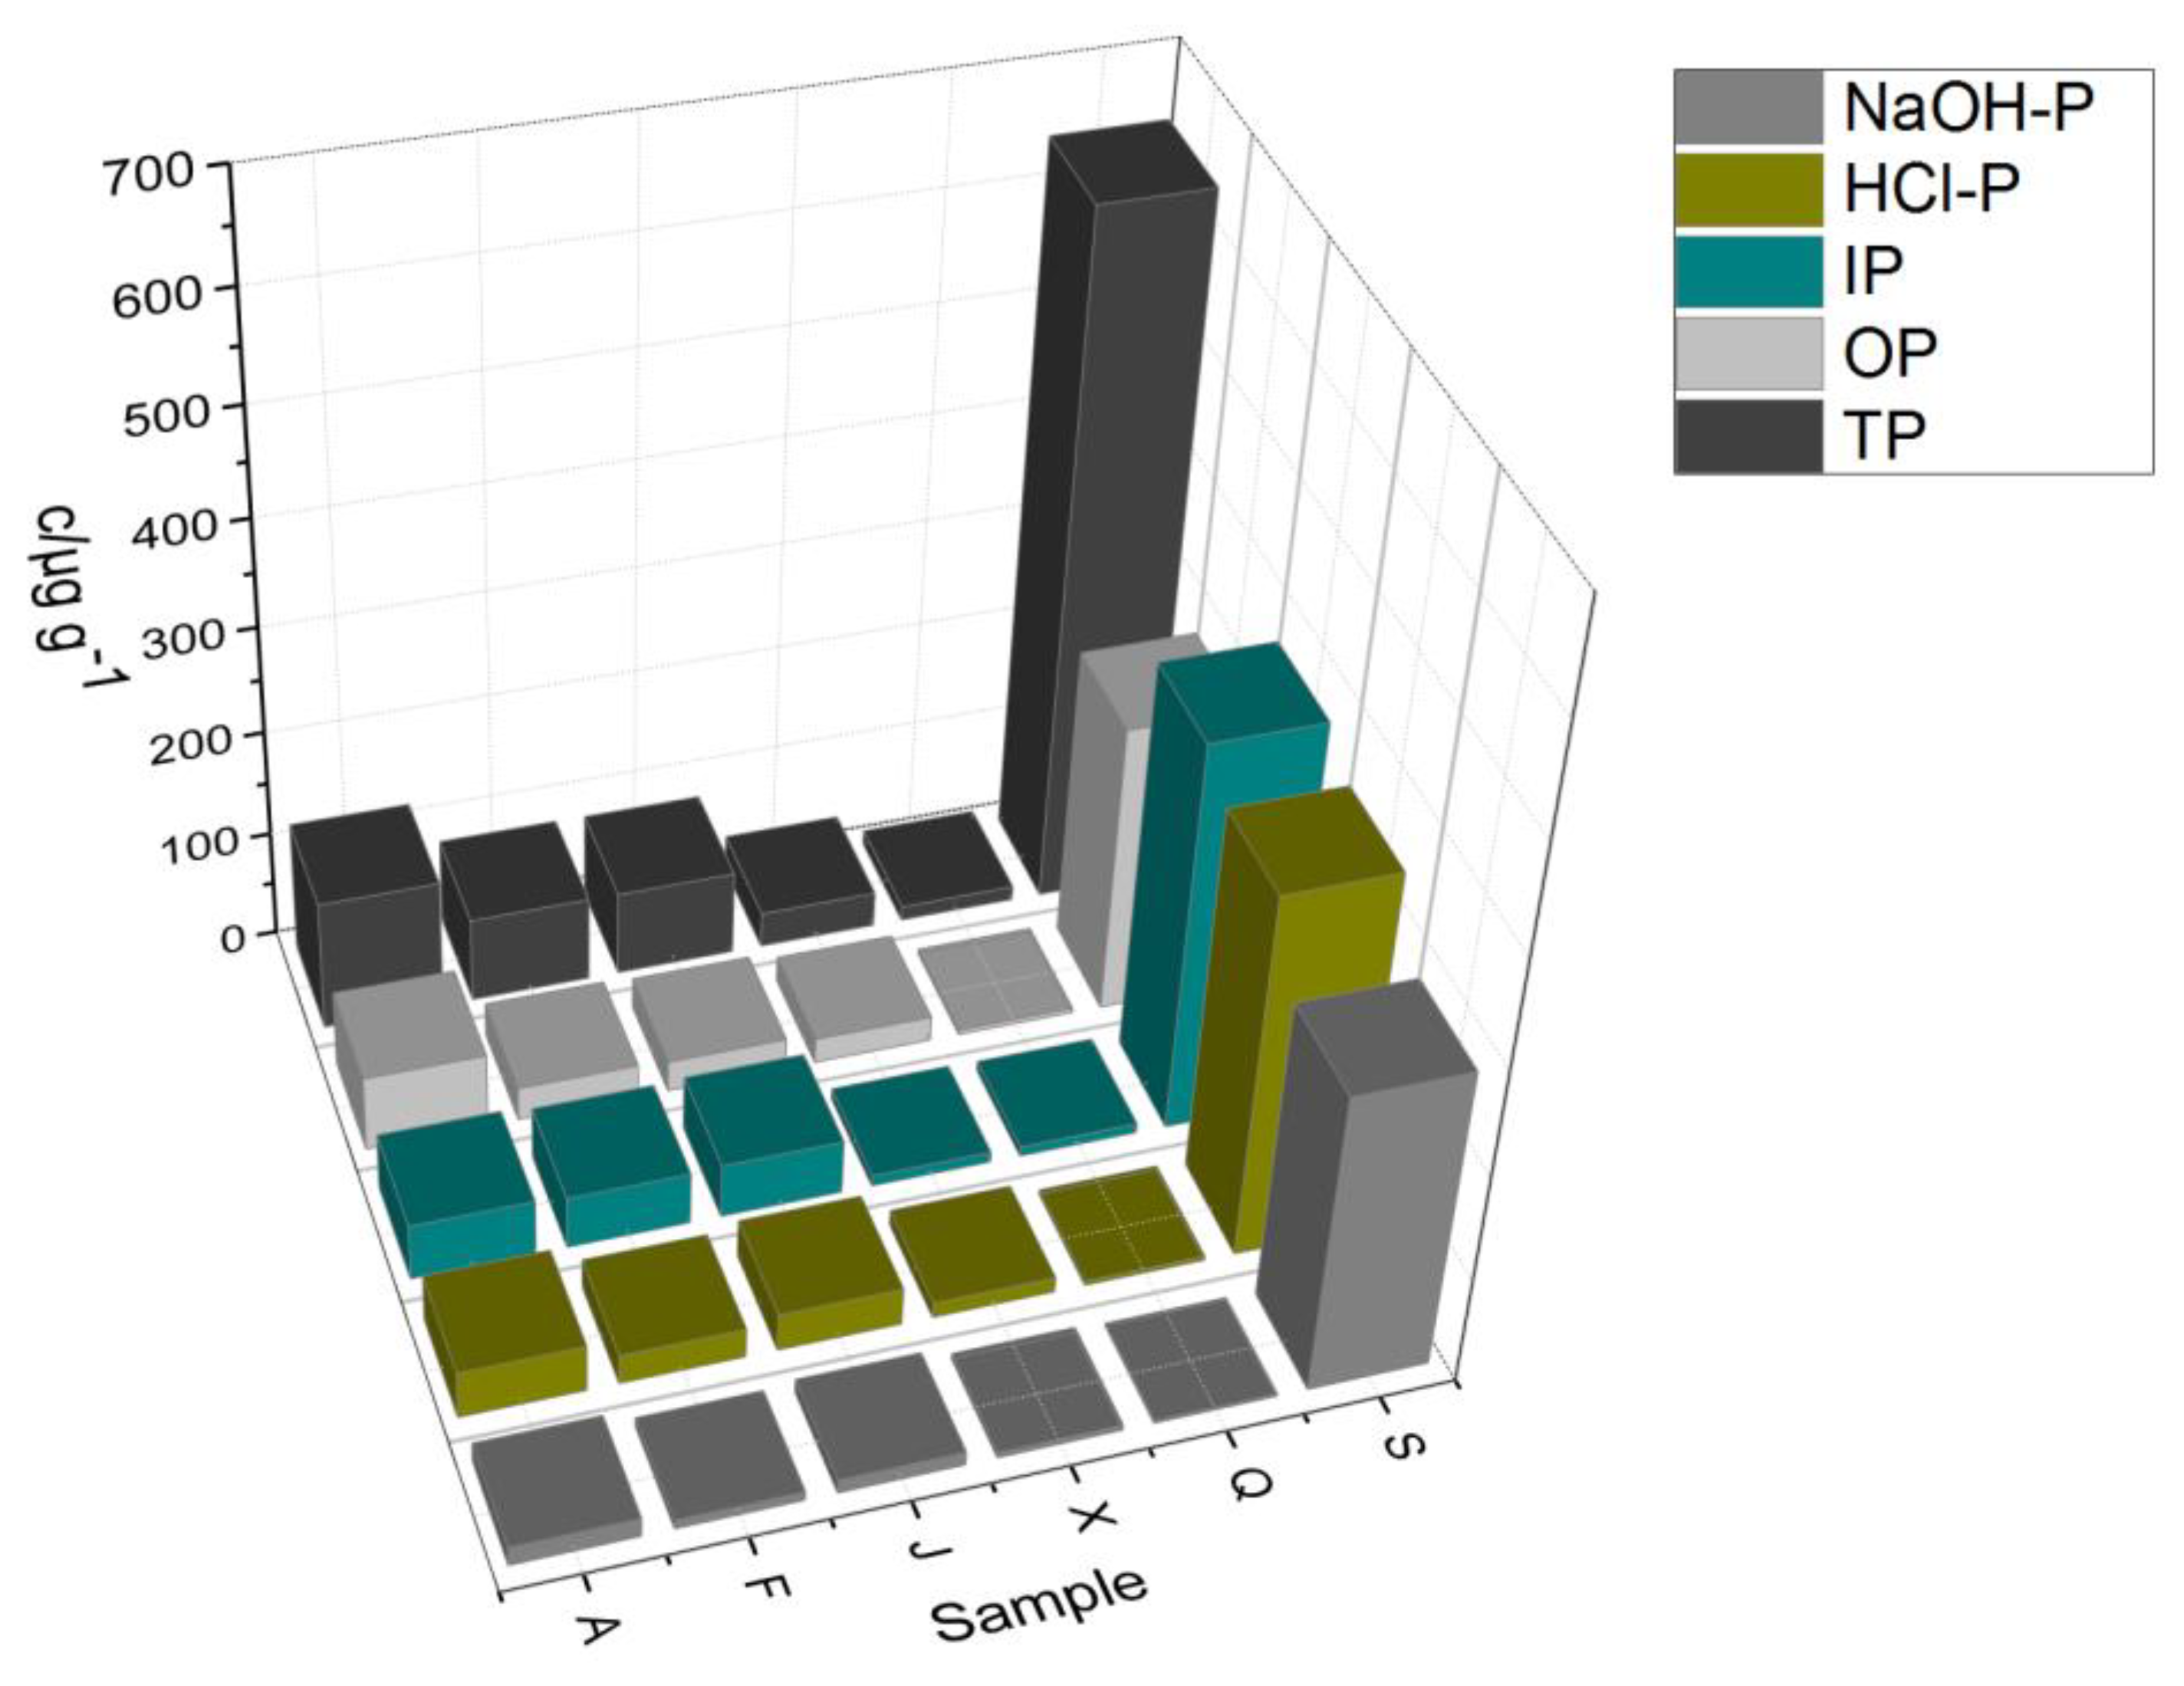
| Mean | 2.57 | 4.16 | 9.03 | 4.44 | 13.47 | 7.01 | 2.88 | 18753 |
| stdev | ± 1.87 | ± 4.11 | ± 3.18 | ± 1.07 | ± 3.87 | ± 2.39 | ± 1.63 | ± 12214 |
| (b) Shuang Creek (S) | ||||||||
| Locs | Concentration of P fraction (mg/kg) | OC (%) | OC/OP molar ratio | |||||
| NaOH-P | HCl-P | IP | OP | TP | BAP | |||
| S8 | 379.14 | 315.42 | 375.00 | 311.60 | 686.60 | 690.74 | 0.97 | 80 |
| S9 | 442.12 ± 17.41 | 303.34 ± 2.39 | 338.37 ± 2.80 | 261.85 ± 8.87 | 600.22 | 703.97 | 0.67 | 66 |
| S7 | 349.51 | 313.79 | 354.98 | 275.26 | 630.24 | 624.77 | 0.71 | 66 |
| S6 | 288.74 | 378.91 | 339.34 | 278.53 | 617.87 | 567.27 | 0.44 | 41 |
| S5 | 175.60 | 352.34 | 395.93 | 270.21 | 666.14 | 445.81 | 0.46 | 44 |
| S4 | 231.12 | 339.26 | 370.65 | 303.27 | 673.92 | 534.39 | 0.84 | 72 |
| S3 | 229.94 | 373.42 | 395.53 | 271.49 | 667.02 | 501.43 | 0.73 | 70 |
| S2 | 213.81 | 374.51 | 393.66 | 244.55 | 638.21 | 458.36 | 0.90 | 95 |
| S1 | 243.64 | 358.08 | 368.59 | 259.95 | 628.54 | 503.59 | 2.77 | 275 |
| Mean | 283.74 | 345.45 | 370.23 | 275.19 | 645.42 | 558.93 | 0.94 | 90 |
| Stdev | ± 88.31 | ± 28.87 | ± 22.57 | ± 20.95 | ± 29.10 | ± 95.33 | ± 0.71 | ± 71 |
| (c) Jiao River (J) | ||||||||
| Locs | Concentration of P fraction (mg/kg) | OC (%) | OC/OP molar ratio | |||||
| NaOH-P | HCl-P | IP | OP | TP | BAP | |||
| J10 | 4.48 | 24.12 | 66.50 | 9.87 | 76.37 | 14.35 | 0.62 | 1629 |
| J9 | 8.11 | 23.07 | 45.83 | 6.68 | 52.51 | 14.79 | 0.65 | 2507 |
| J8 | 8.11 | 43.48 | 49.54 | 12.25 | 61.79 | 20.36 | 0.67 | 1406 |
| J7 | 8.06 | 39.97 | 50.42 | 28.06 | 78.48 | 36.12 | 0.63 | 579 |
| J6 | 35.22 ± 10.85 | 34.43 ± 5.74 | 43.56 ± 6.54 | 40.87 ± 5.06 | 84.43 | 76.09 | 0.65 | 411 |
| J4 | 9.05 | 38.56 | 39.09 | 41.37 | 80.46 | 50.42 | 0.68 | 422 |
| J3 | 17.81 | 38.50 | 50.73 | 55.81 | 106.54 | 73.62 | 0.58 | 268 |
| J2 | 13.79 | 42.85 | 48.59 | 45.83 | 94.42 | 59.62 | 0.64 | 360 |
| J1 | 10.62 | 34.38 | 66.35 | 23.98 | 90.33 | 34.6 | 0.62 | 672 |
| Mean | 12.81 | 35.48 | 51.18 | 29.41 | 80.59 | 42.22 | 0.64 | 917 |
| stdev | ± 9.24 | ± 7.44 | ± 9.41 | ± 17.55 | ± 16.35 | ± 23.99 | ± 0.03 | ± 765 |
| (d) Ximen Island | ||||||||
| Locs | Concentration of P fraction (mg/kg) | OC (%) | OC/OP molar ratio | |||||
| NaOH-P | HCl-P | IP | OP | TP | BAP | |||
| X2 | 4.40 | 13.34 | 7.07 | 31.04 | 38.11 | 35.44 | 0.55 | 453 |
| X1 | 10.03 | 15.77 | 9.78 | 30.13 | 39.91 | 40.16 | 0.48 | 412 |
| X3 | 3.12 | 17.41 | 6.85 | 28.76 | 35.61 | 31.88 | 0.75 | 651 |
| X6 | 2.29 | 10.40 | 5.26 | 20.94 | 26.2 | 23.23 | 0.81 | 997 |
| X4 | 3.76 | 13.48 | 8.84 | 30.65 | 39.49 | 34.41 | 0.64 | 537 |
| X5 | 4.49 ± 0.45 | 15.69 ± 0.59 | 11.32 ± 0.41 | 20.43 ± 1.13 | 31.75 | 24.92 | 0.77 | 969 |
| X7 | 2.43 | 15.18 | 18.47 | 12.20 | 30.67 | 14.63 | 0.63 | 1337 |
| X8 | 9.75 | 13.78 | 12.65 | 15.57 | 28.22 | 25.32 | 0.29 | 475 |
| Mean | 5.03 | 14.38 | 10.03 | 23.72 | 33.75 | 28.75 | 0.62 | 729 |
| stdev | ± 3.11 | ± 2.12 | ± 4.19 | ± 7.42 | ± 5.27 | ± 8.22 | ± 0.17 | ± 335 |
| (e) Feiyun River (F) | ||||||||
| Locs | Concentration of P fraction (mg/kg) | OC (%) | OC/OP molar ratios | |||||
| NaOH-P | HCl-P | IP | OP | TP | BAP | |||
| F9 | 12.01 | 34.40 | 48.43 | 35.81 | 84.24 | 47.82 | 0.60 | 430 |
| F8 | 5.57 | 21.51 | 60.38 | 17.52 | 77.9 | 23.09 | 0.64 | 943 |
| F7 | 13.20 ± 0.25 | 24.09 ± 0.67 | 51.47 ± 0.47 | 23.80 ± 2.82 | 75.27 | 37 | 0.65 | 707 |
| F6 | 6.05 | 21.83 | 49.89 | 24.59 | 74.48 | 30.64 | 0.68 | 716 |
| F5 | 4.16 | 27.49 | 58.80 | 23.61 | 82.41 | 27.77 | 0.80 | 870 |
| F10 | 8.75 | 28.22 | 34.47 | 47.43 | 81.9 | 56.18 | 0.67 | 365 |
| F4 | 6.41 | 28.01 | 45.28 | 36.19 | 81.47 | 42.6 | 0.67 | 475 |
| F2 | 11.89 | 34.30 | 62.95 | 30.00 | 92.95 | 41.89 | 0.71 | 607 |
| F1 | 9.84 | 32.86 | 49.52 | 21.44 | 70.96 | 31.28 | 0.76 | 914 |
| F11 | 9.72 | 27.97 | 27.66 | 50.40 | 78.06 | 60.12 | 0.55 | 284 |
| F12 | 4.34 | 26.11 | 43.13 | 25.90 | 69.03 | 30.24 | 0.68 | 679 |
| Mean | 8.36 | 27.89 | 48.36 | 30.61 | 78.97 | 38.97 | 0.67 | 635 |
| Stdev | ± 3.23 | ± 4.51 | ± 10.67 | ± 10.69 | ± 6.70 | ± 11.96 | ± 0.07 | ± 225 |
| (f) Ao River (A) | ||||||||
| Locs | Concentration of P fraction (mg/kg) | OC (%) | OC/OP molar ratio | |||||
| NaOH-P | HCl-P | IP | OP | TP | BAP | |||
| A6 | 14.60 | 40.79 | 54.79 | 52.08 | 106.87 | 66.68 | 0.68 | 338 |
| A7 | 10.62 | 38.74 | 49.27 | 35.64 | 84.91 | 46.26 | 0.60 | 435 |
| A5 | 48.77 | 49.05 | 61.31 | 62.68 | 123.99 | 111.45 | 0.68 | 279 |
| A4 | 18.73 | 50.68 | 48.38 | 57.13 | 105.51 | 75.86 | 1.03 | 465 |
| A3 | 7.87 ± 0.84 | 51.42 ± 1.83 | 54.91 ± 6.17 | 40.99 ± 2.62 | 95.9 | 48.86 | 1.35 | 851 |
| A2 | 5.95 | 52.87 | 49.51 | 79.79 | 129.3 | 85.74 | 0.98 | 317 |
| A1 | 18.64 | 26.55 | 52.12 | 168.97 | 221.09 | 187.61 | 0.64 | 97 |
| Mean | 17.88 | 44.30 | 52.90 | 71.04 | 123.94 | 88.92 | 0.85 | 397 |
| stdev | ± 14.50 | ± 9.54 | ± 4.55 | ± 45.54 | ± 45.47 | ± 48.90 | ± 0.28 | ± 233 |
| HCl-P | IP | OP | TP | BAP | OC | TOC/OP | |
| NaOH-P | 0.919 | 0.923 | 0.925 | 0.932 | 0.983 | −0.0964 | −0.208 |
| 1.232E-022 | 2.977E-023 | 1.895E-023 | 1.270E-024 | 3.586E-040 | 0.492 | 0.135 | |
| 54 | 54 | 54 | 54 | 54 | 53 | 53 | |
| HCl-P | 0.992 | 0.963 | 0.989 | 0.958 | −0.122 | −0.258 | |
| 1.765E-048 | 2.291E-031 | 1.522E-044 | 8.198E-030 | 0.385 | 0.0618 | ||
| 54 | 54 | 54 | 54 | 53 | 53 | ||
| IP | 0.963 | 0.993 | 0.960 | −0.133 | −0.266 | ||
| 2.722E-031 | 3.153E-050 | 1.951E-030 | 0.342 | 0.0543 | |||
| 54 | 54 | 54 | 53 | 53 | |||
| OP | 0.988 | 0.978 | −0.160 | −0.293 | |||
| 9.743E-044 | 2.619E-037 | 0.254 | 0.0335 | ||||
| 54 | 54 | 53 | 53 | ||||
| TP | 0.977 | −0.146 | −0.280 | ||||
| 1.698E-036 | 0.298 | 0.0424 | |||||
| 54 | 53 | 53 | |||||
| BAP | −0.128 | −0.252 | |||||
| 0.360 | 0.0683 | ||||||
| 53 | 53 | ||||||
| OC | 0.945 | ||||||
| 2.270E-026 | |||||||
| 53 | |||||||
| LIGNIN | TN | TOC/TN | (Ad/Al)v | (Ad/Al)s | |||
| NaOH-P | −0.0422 | −0.0665 | −0.127 | −0.0376 | −0.0152 | ||
| 0.764 | 0.636 | 0.366 | 0.787 | 0.913 | |||
| 53 | 53 | 53 | 54 | 54 | |||
| HCl-P | −0.0435 | −0.105 | −0.0565 | −0.00136 | −0.00302 | ||
| 0.757 | 0.455 | 0.688 | 0.992 | 0.983 | |||
| 53 | 53 | 53 | 54 | 54 | |||
| IP | −0.0691 | −0.117 | −0.0172 | −0.00292 | −0.0157 | ||
| 0.623 | 0.405 | 0.903 | 0.983 | 0.910 | |||
| 53 | 53 | 53 | 54 | 54 | |||
| OP | 0.00593 | −0.135 | −0.0818 | −0.0404 | −0.0384 | ||
| 0.966 | 0.336 | 0.560 | 0.772 | 0.783 | |||
| 53 | 53 | 53 | 54 | 54 | |||
| TP | −0.0373 | −0.126 | −0.0453 | −0.0192 | −0.0257 | ||
| 0.791 | 0.370 | 0.747 | 0.891 | 0.854 | |||
| 53 | 53 | 53 | 54 | 54 | |||
| BAP | −0.0201 | −0.100 | −0.108 | −0.0397 | −0.0266 | ||
| 0.887 | 0.475 | 0.443 | 0.776 | 0.849 | |||
| 53 | 53 | 53 | 54 | 54 | |||
| OC | −0.473 | 0.977 | −0.204 | 0.0123 | −0.0990 | ||
| 0.000352 | 1.103E-035 | 0.142 | 0.930 | 0.481 | |||
| 53 | 53 | 53 | 53 | 53 | |||
| TOC/OP | −0.421 | 0.950 | −0.268 | 0.0472 | −0.0729 | ||
| 0.00170 | 1.752E-027 | 0.0528 | 0.737 | 0.604 | |||
| 53 | 53 | 53 | 53 | 53 | |||
| LIGNIN | −0.450 | 0.0934 | 0.126 | −0.207 | |||
| 0.000717 | 0.506 | 0.367 | 0.138 | ||||
| 53 | 53 | 53 | 53 | ||||
| TN | −0.345 | 0.0338 | −0.0762 | ||||
| 0.0114 | 0.810 | 0.587 | |||||
| 53 | 53 | 53 | |||||
| TOC/TN | 0.0185 | −0.142 | |||||
| 0.895 | 0.310 | ||||||
| 53 | 53 | ||||||
| (Ad/Al)v | 0.198 | ||||||
| 0.151 | |||||||
| 54 | |||||||
| (Ad/Al)s |
References
- Wohl, E. A World of Rivers. Environmental Change on Ten of the World’s Great Rivers; University of Chicago Press: Chicago, IL, USA, 2013; p. 359. [Google Scholar]
- Kandasamy, S.; Nagender Nath, B. Perspective on the terrestrial organic matter transport and burial along the land-deep sea continuum: Caveats in our understanding of biogeochemical processes and future needs. Front. Mar. Sci. 2016, 3, 259. [Google Scholar] [CrossRef]
- Blaas, H.; Krosze, C. Excessive nitrogen and phosphorus in European rivers: 2000–2050. Ecol. Indic. 2016, 67, 328–337. [Google Scholar] [CrossRef]
- Mandaric, L.; Diamantini, E.; Stella, E.; Cano-Paoli, K.; Valle-Sistac, J.; Molins-Delgado, D.; Bellin, A.; Chiogna, G.; Majone, B.; Diaz-Cruz, M.S.; et al. Contamination sources and distribution patterns of pharmaceuticals and personal care products in Alpine rivers strongly affected by tourism. Sci. Total Environ. 2017, 590, 484–494. [Google Scholar] [CrossRef]
- Peng, F.J.; Pan, C.G.; Zhang, M.; Zhang, N.S.; Windfield, R.; Salvito, D.; Selck, H.; Van den Brink, P.J.; Ying, G.G. Occurrence and ecological risk assessment of emerging organic chemicals in urban rivers: Guangzhou as a case study in China. Sci. Total Environ. 2017, 589, 46–55. [Google Scholar] [CrossRef] [PubMed]
- Syvitski, J.P.M.; Vörösmarty, C.J.; Kettner, A.J.; Green, P. Impact of humans on the flux of terrestrial sediment to the global coastal ocean. Science 2015, 308, 376–380. [Google Scholar] [CrossRef] [PubMed]
- Aufdenkampe, A.K.; Mayorga, E.; Hedges, J.I.; Llerena, C.; Quay, P.D.; Gudeman, J.; Krusche, A.V.; Richey, J.E. Organic matter in the Peruvian headwaters of the Amazon: Compositional evolution from the Andes to the lowland Amazon mainstem. Org. Geochem. 2007, 38, 337–364. [Google Scholar] [CrossRef]
- Alin, S.R.; Aalto, R.; Goñi, M.A.; Richey, J.E.; Dietrich, W.E. Biogeochemical characterization of carbon sources in the Strickland and Fly rivers, Papua New Guinea. J. Geophys. Res. 2007, 113, F01S05. [Google Scholar] [CrossRef]
- Loh, P.S.; Chen, C.T.A.; Anshari, G.Z.; Wang, J.T.; Lou, J.Y.; Wang, S.L. A comprehensive survey of lignin geochemistry in the sedimentary organic matter along the Kapuas River (West Kalimantan, Indonesia). J. Asian Earth Sci. 2012, 43, 118–129. [Google Scholar] [CrossRef]
- Li, Z.; Peterse, F.; Wu, Y.; Bao, H.; Eglinton, T.I.; Zhang, J. Sources of organic matter in Changjiang (Yangtze River) bed sediments: Preliminary insights from organic geochemical proxies. Org. Geochem. 2015, 85, 11–21. [Google Scholar] [CrossRef]
- Ishiwatari, R.; Fujino, N.; Brincat, D.; Yamamoro, S.; Takahara, H.; Shichi, K.; Krivonogov, S.K. A 35 kyr record of organic matter composition and δ13C of n-alkanes in bog sediments close to Lake Baikal: Implications for paleoenvironmental studies. Org. Geochem. 2009, 40, 51–60. [Google Scholar] [CrossRef]
- Tareq, S.M.; Kitagawa, H.; Ohta, K. Lignin biomarker and isotopic records of paleovegetation and climate changes from Lake Erhai, southwest China, since 18.5 ka BP. Quarter. Inter. 2011, 229, 47–56. [Google Scholar] [CrossRef]
- Wu, Y.; Dittmar, T.; Ludwichowski, K.U.; Kattner, G.; Zhang, J.; Zhu, Z.Y.; Koch, B.P. Tracing suspended organic nitrogen from the Yangtze River catchment into the East China Sea. Mar. Chem. 2007, 107, 367–377. [Google Scholar] [CrossRef]
- Goñi, M.A.; Aceves, H.; Benitez-Nelson, B.; Tappa, E.; Thunnell, R.; Black, D.E.; Muller-Karger, F.; Astor, Y.; Varela, R. Oceanographic and climatologic controls on the compositions and fluxes of biogenic materials in the water column and sediments of the Cariaco Basin over the Late Holocene. Deep-Sea Res. I 2009, 56, 614–640. [Google Scholar] [CrossRef]
- Yao, P.; Yu, G.; Bianchi, T.S.; Guo, Z.; Zhao, M.; Knappy, C.S.; Keely, B.J.; Zhao, B.; Zhang, T.; Pan, H.; et al. A multiproxy analysis of sedimentary organic carbon in the Changjiang Estuary and adjacent shelf. J. Geophys. Res. Biogeo. 2015, 120, 1407–1429. [Google Scholar] [CrossRef]
- Kendall, C.; Silva, S.R.; Kelly, V.J. Carbon and nitrogen isotopic compositions of particulate organic matter in four large river systems across the United States. Hydrol. Proces. 2001, 15, 1301–1346. [Google Scholar] [CrossRef]
- Longworth, B.E.; Petsch, S.T.; Raymond, R.A.; Bauer, J.E. Linking lithology and land use to sources of dissolved and particulate organic matter in headwaters of a temperate, passive-margin river system. Geochim. Cosmochim. Acta 2007, 71, 4233–4250. [Google Scholar] [CrossRef]
- Kao, S.J.; Liu, K.K. Stable carbon and nitrogen isotope systematic in a human-disturbed watershed (Lanyang-Hsi) in Taiwan and the estimation of biogenic particulate organic carbon and nitrogen fluxes. Global Biogeochem. Cycles 2000, 14, 189–198. [Google Scholar] [CrossRef]
- Farella, N.; Lucotte, M.; Louchouarn, P.; Roulet, M. Deforestation modifying terrestrial organic transport in the Rio Tapajόs, Brazilian Amazon. Org. Geochem. 2001, 32, 1443–1458. [Google Scholar] [CrossRef]
- Tian, J.R.; Zhou, P.J. Phosphorus fractions of floodplain sediments and phosphorus exchange on the sediment-water interface in the lower reaches of the Han River in China. Ecol. Eng. 2007, 30, 264–270. [Google Scholar] [CrossRef]
- Sun, S.J.; Huang, S.L.; Sun, X.M.; Wen, W. Phosphorus fractions and its release in the sediments of Haihe River, China. J. Environ. Sci. 2009, 21, 291–295. [Google Scholar] [CrossRef]
- Nürnberg, G.K. Prediction of phosphorus release rates from total and reductant-soluble phosphorus in anoxic lake sediments. Can. J. Fish. Aqua. Sci. 1988, 45, 453–462. [Google Scholar] [CrossRef]
- Loh, P.S.; Molot, L.A.; Nürnberg, G.K.; Watson, S.B.; Ginn, B. Evaluating relationships between sediment chemistry and anoxic phosphorus and iron release across three different water bodies. Inland Waters 2013, 3, 105–118. [Google Scholar] [CrossRef]
- Shan, B.; Li, J.; Zhang, W.; Di, Z.; Jin, X. Characteristics of phosphorus components in the sediments of main rivers into the Bohai Sea. Ecol. Eng. 2016, 97, 426–433. [Google Scholar] [CrossRef]
- Adhikari, P.L.; White, J.R.; Maiti, K.; Nguyen, N. Phosphorus speciation and sedimentary phosphorus release from the Gulf of Mexico sediments: Implication for hypoxia. Estuar. Coast. Shelf Sci. 2015, 164, 77–85. [Google Scholar] [CrossRef]
- Ertel, J.R.; Hedges, J.I. The lignin component of humic substances: Distribution among soil and sedimentary humic, fulvic, and base-insoluble fractions. Geochim. Cosmochim. Acta 1984, 48, 2065–2074. [Google Scholar] [CrossRef]
- Meyers, P.A. Preservation of elemental and isotopic source identification of sedimentary organic matter. Chem. Geol. 1994, 114, 289–302. [Google Scholar] [CrossRef]
- Kopáček, J.; Borovec, J.; Hejzlar, J.; Ulrich, K.-U.; Norton, S.A.; Amirbahman, A. Aluminum control of phosphorus sorption by lake sediments. Environ. Sci. Technol. 2005, 39, 8784–8789. [Google Scholar] [CrossRef] [PubMed]
- Hiriart-Baer, V.P.; Milne, J.E.; Marvin, C.H. Temporal trends in phosphorus and lacustrine productivity in Lake Simcoe inferred from lake sediment. J. Great Lakes Res. 2011, 37, 764–771. [Google Scholar] [CrossRef]
- Ruban, V.; Lópezsánchez, J.F.; Pardo, P.; Rauret, G.; Muntau, H.; Quevauviller, P. Selection and evaluation of sequential extraction procedures for the determination of phosphorus forms in lake sediment. J. Environ. Monit. 1999, 1, 51–56. [Google Scholar] [CrossRef]
- Ruban, V.; Lópezsánchez, J.F.; Pardo, P.; Rauret, G.; Muntau, H.; Quevauviller, P. Development of a harmonised phosphorus extraction procedure and certification of a sediment reference material. J. Environ. Monit. 2001, 3, 121–125. [Google Scholar] [CrossRef]
- Galhardo, C.X.; Masini, J.C. Spectrophotometric determination of phosphate and silicate by sequential injection using molybdenum blue chemistry. Anal. Chim. Acta 2000, 417, 191–200. [Google Scholar] [CrossRef]
- Ni, J.; Lin, P.; Zhen, Y.; Yao, X.; Guo, L. Distribution, source and chemical speciation of phosphorus in surface sediments of the central Pacific Ocean. Deep. Sea Res. Part I: Oceanogr. Res. Pap. 2015, 105, 74–82. [Google Scholar] [CrossRef]
- Goñi, M.A.; Yunker, M.B.; Macdonald, R.W.; Eglinton, T.I. Distribution and Sources of Organic Biomarkers in Arctic Sediments from the Mackenzie River and Beaufort Shelf. Mar. Chem. 2000, 71, 23–51. [Google Scholar] [CrossRef]
- Miltner, A.; Emeis, K.-C. Origin and transport of terrestrial organic matter from the Oder lagoon to the Arkona Basin, Southern Baltic Sea. Org. Geochem. 2000, 31, 57–66. [Google Scholar] [CrossRef]
- Yuan, H.W.; Chen, J.F.; Ye, Y.; Lou, Z.H.; Jin, A.M.; Chen, X.G.; Jiang, Z.P.; Lin, Y.S.; Chen, C.T.A.; Loh, P.S. Sources and distribution of sedimentary organic matter along the Andong salt marsh, Hangzhou Bay. J. Mar. Syst. 2017, 174, 78–88. [Google Scholar] [CrossRef]
- Selvaraj, K.; Lee, T.Y.; Yang, J.Y.T.; Canuel, E.A.; Huang, J.C.; Dai, M.; Liu, J.T.; Kao, S.J. Stable isotopic and biomarker evidence of terrigeneous organic matter export to the deep sea during tropical storm. Mar. Geol. 2015, 364, 32–42. [Google Scholar] [CrossRef]
- Kang, X.M.; Song, J.M.; Yuan, H.M.; Shi, X.; Wang, W.F.; Li, X.G.; Li, N.; Duan, L.Q. Phosphorus speciation and its bioavailability in sediments of the Jiaozhou Bay. Estuar. Coast. Shelf Sci. 2017, 188, 127–136. [Google Scholar] [CrossRef]
- Zhang, W.L.; Zeng, C.S.; Tong, C.; Zhai, S.J.; Lin, X. Spatial distribution of phosphorus speciation in marsh sediments along a hydrologic gradient in a subtropical estuarine wetland, China. Estuar. Coast. Shelf Sci. 2015, 154, 30–38. [Google Scholar] [CrossRef]
- Cui, Y.; Xiao, R.; Xie, Y.; Zhang, M. Phosphorus fraction and phosphate sorption-release characteristics of the wetland sediments in the Yangtze River Delta. Phys. Chem. Earth 2018, 103, 19–27. [Google Scholar] [CrossRef]
- Yang, Y.; Gao, B.; Hao, H.; Zhou, H.; Lu, J. Nitrogen and phosphorus in sediments in China: A national-scale assessment and review. Sci. Total Environ. 2017, 576, 840–849. [Google Scholar] [CrossRef]
- Yang, B.; Liu, S.-M.; Wu, Y.; Zhang, J. Phosphorus speciation and availability in sediments off the eastern coast of Hainan Island, South China Sea. Conti. Shelf Res. 2016, 118, 111–127. [Google Scholar] [CrossRef]
- Mayorga, E.; Aufdenkampe, A.K.; Masiello, C.A.; Kruscge, A.V.; Hedges, J.I.; Quay, P.D.; Richey, J.E.; Brown, T.A. Young organic matter as a source of carbon dioxide outgassing from Amazonian rivers. Nature 2005, 436, 538–541. [Google Scholar] [CrossRef] [PubMed]
- Chen, C.T.A.; Zhai, W.; Dai, M. Riverine input and air-sea CO2 exchanges near the Changjiang (Yangtze River) Estuary: Status quo and implication on possible future changes in metabolic status. Conti. Shelf Res. 2008, 28, 1476–1482. [Google Scholar] [CrossRef]
- Li, Y.; Pan, D.Z.; Chanson, H.; Pan, C.H. Real-time characteristics of tidal bore propagation in the Qiantang River Estuary, China, recorded by marine radar. Conti. Shelf Res. 2019, 180, 48–58. [Google Scholar] [CrossRef]
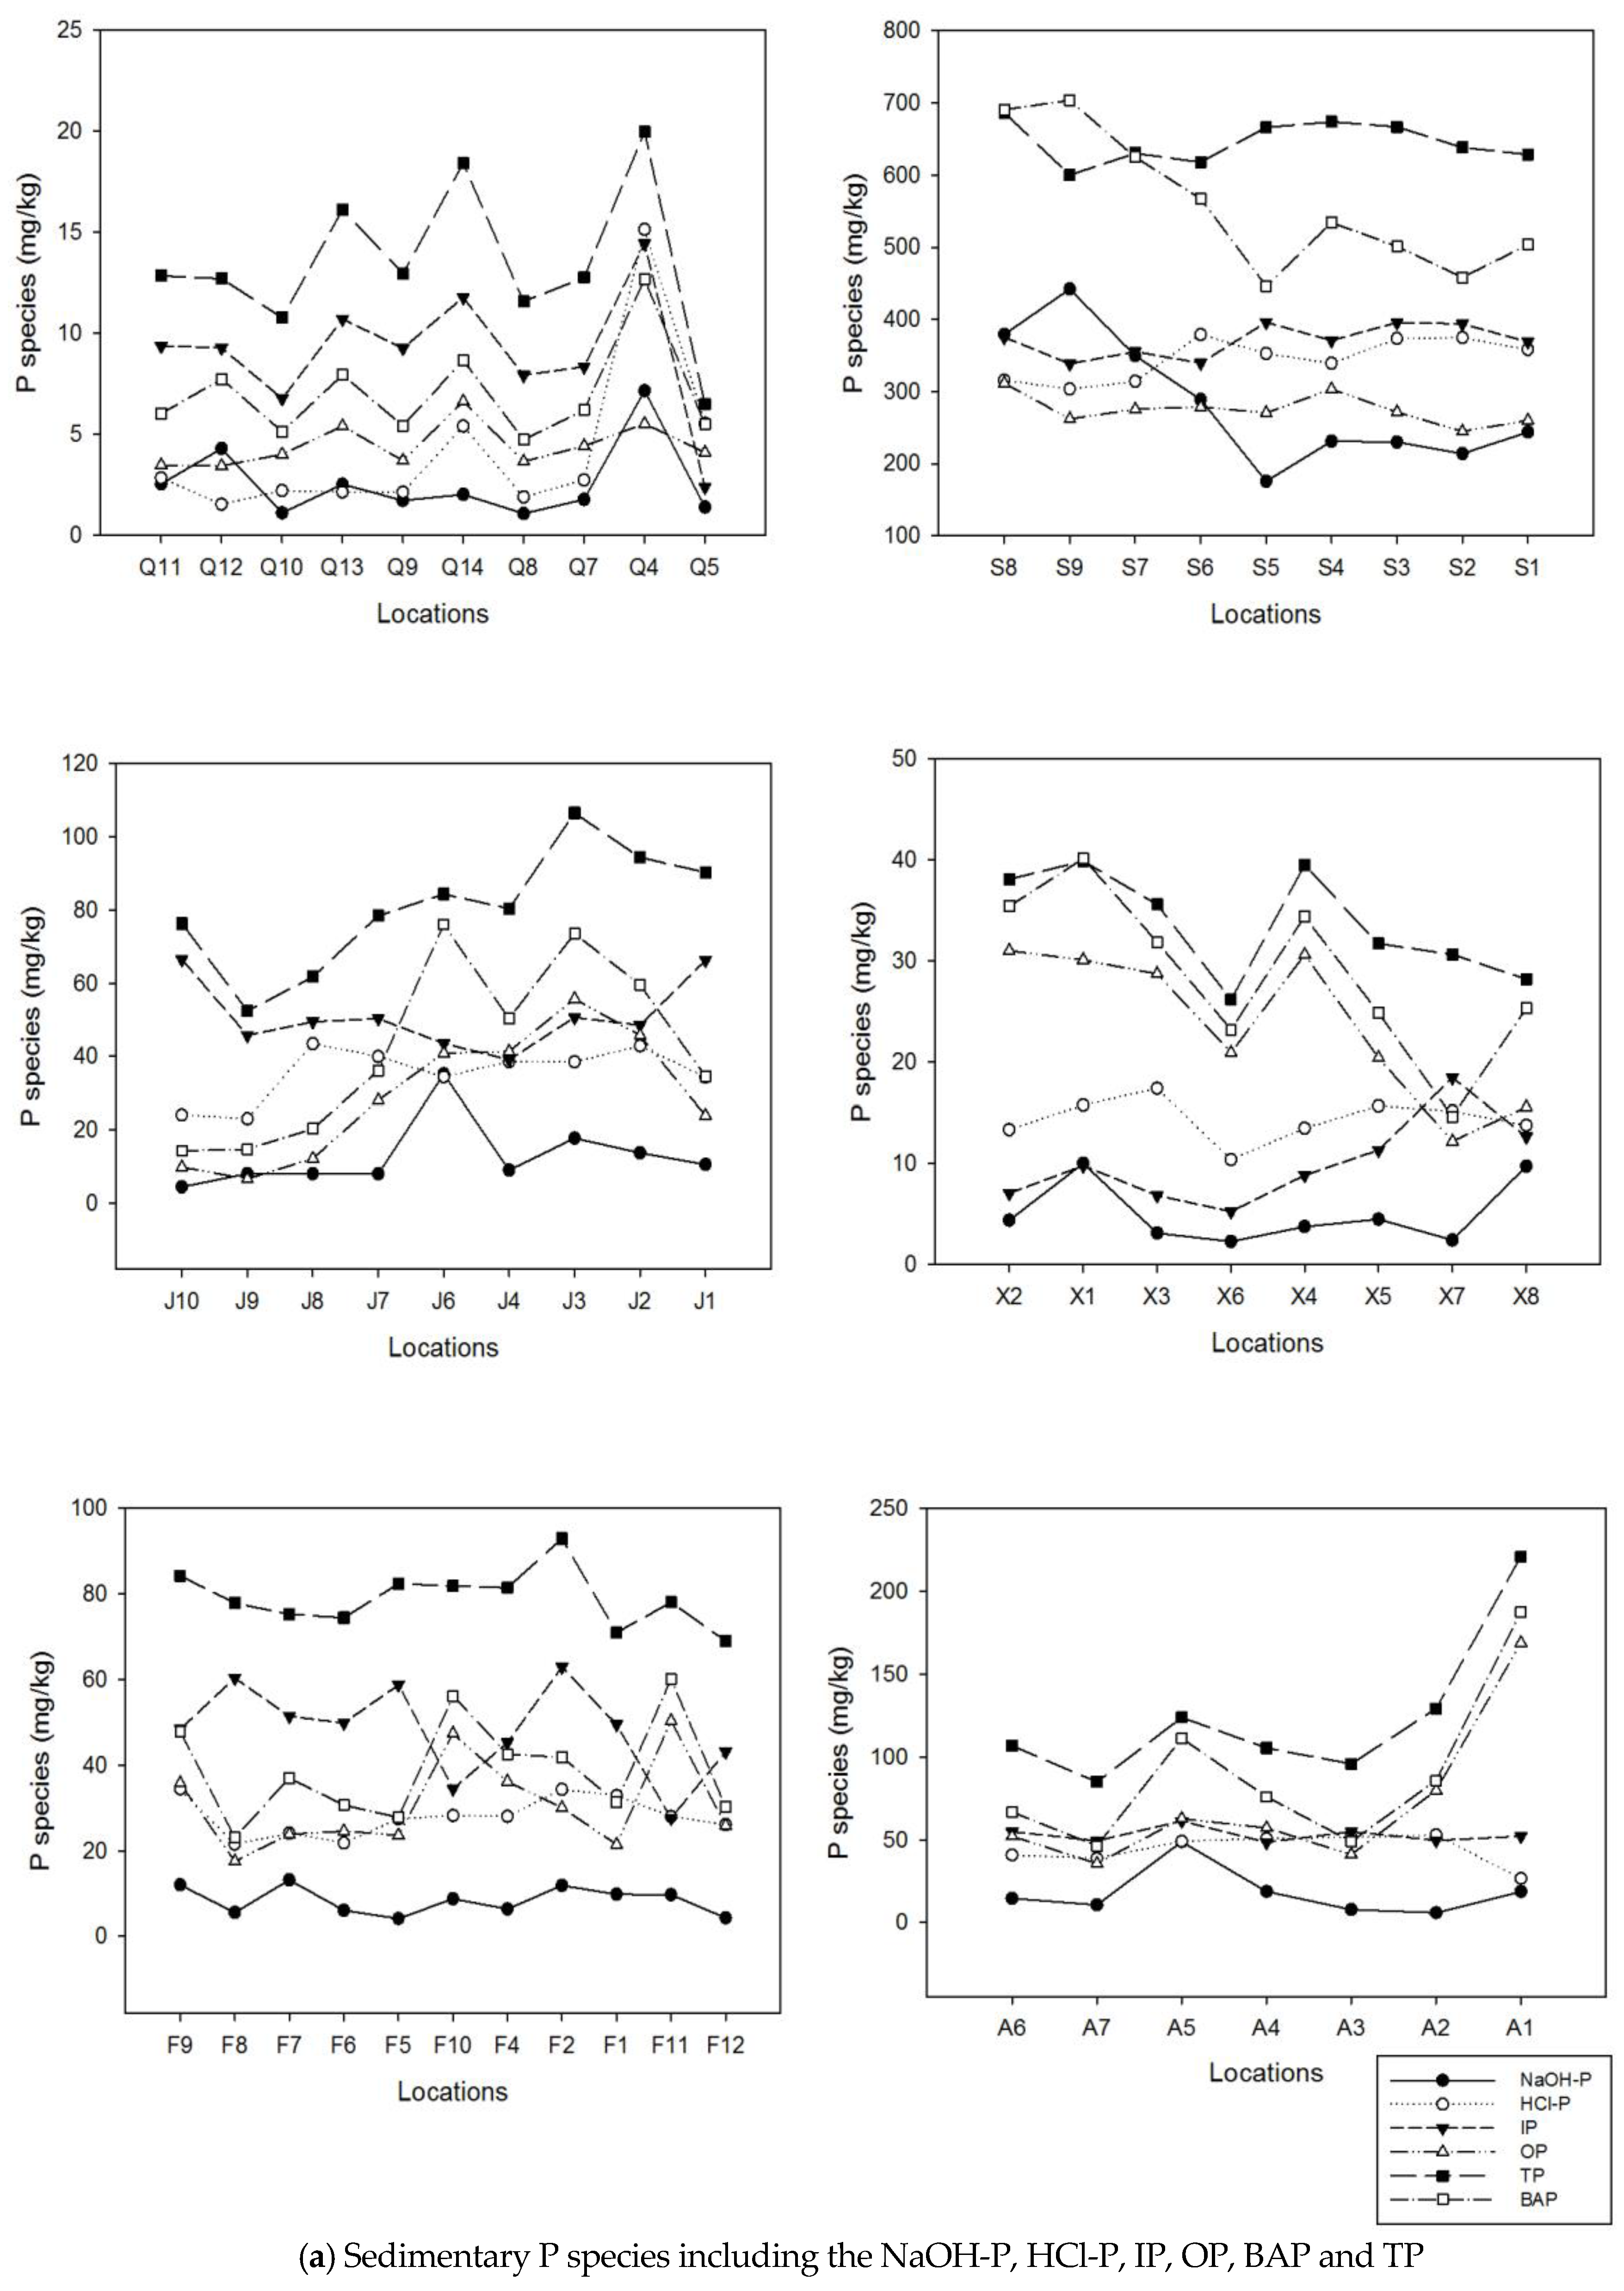
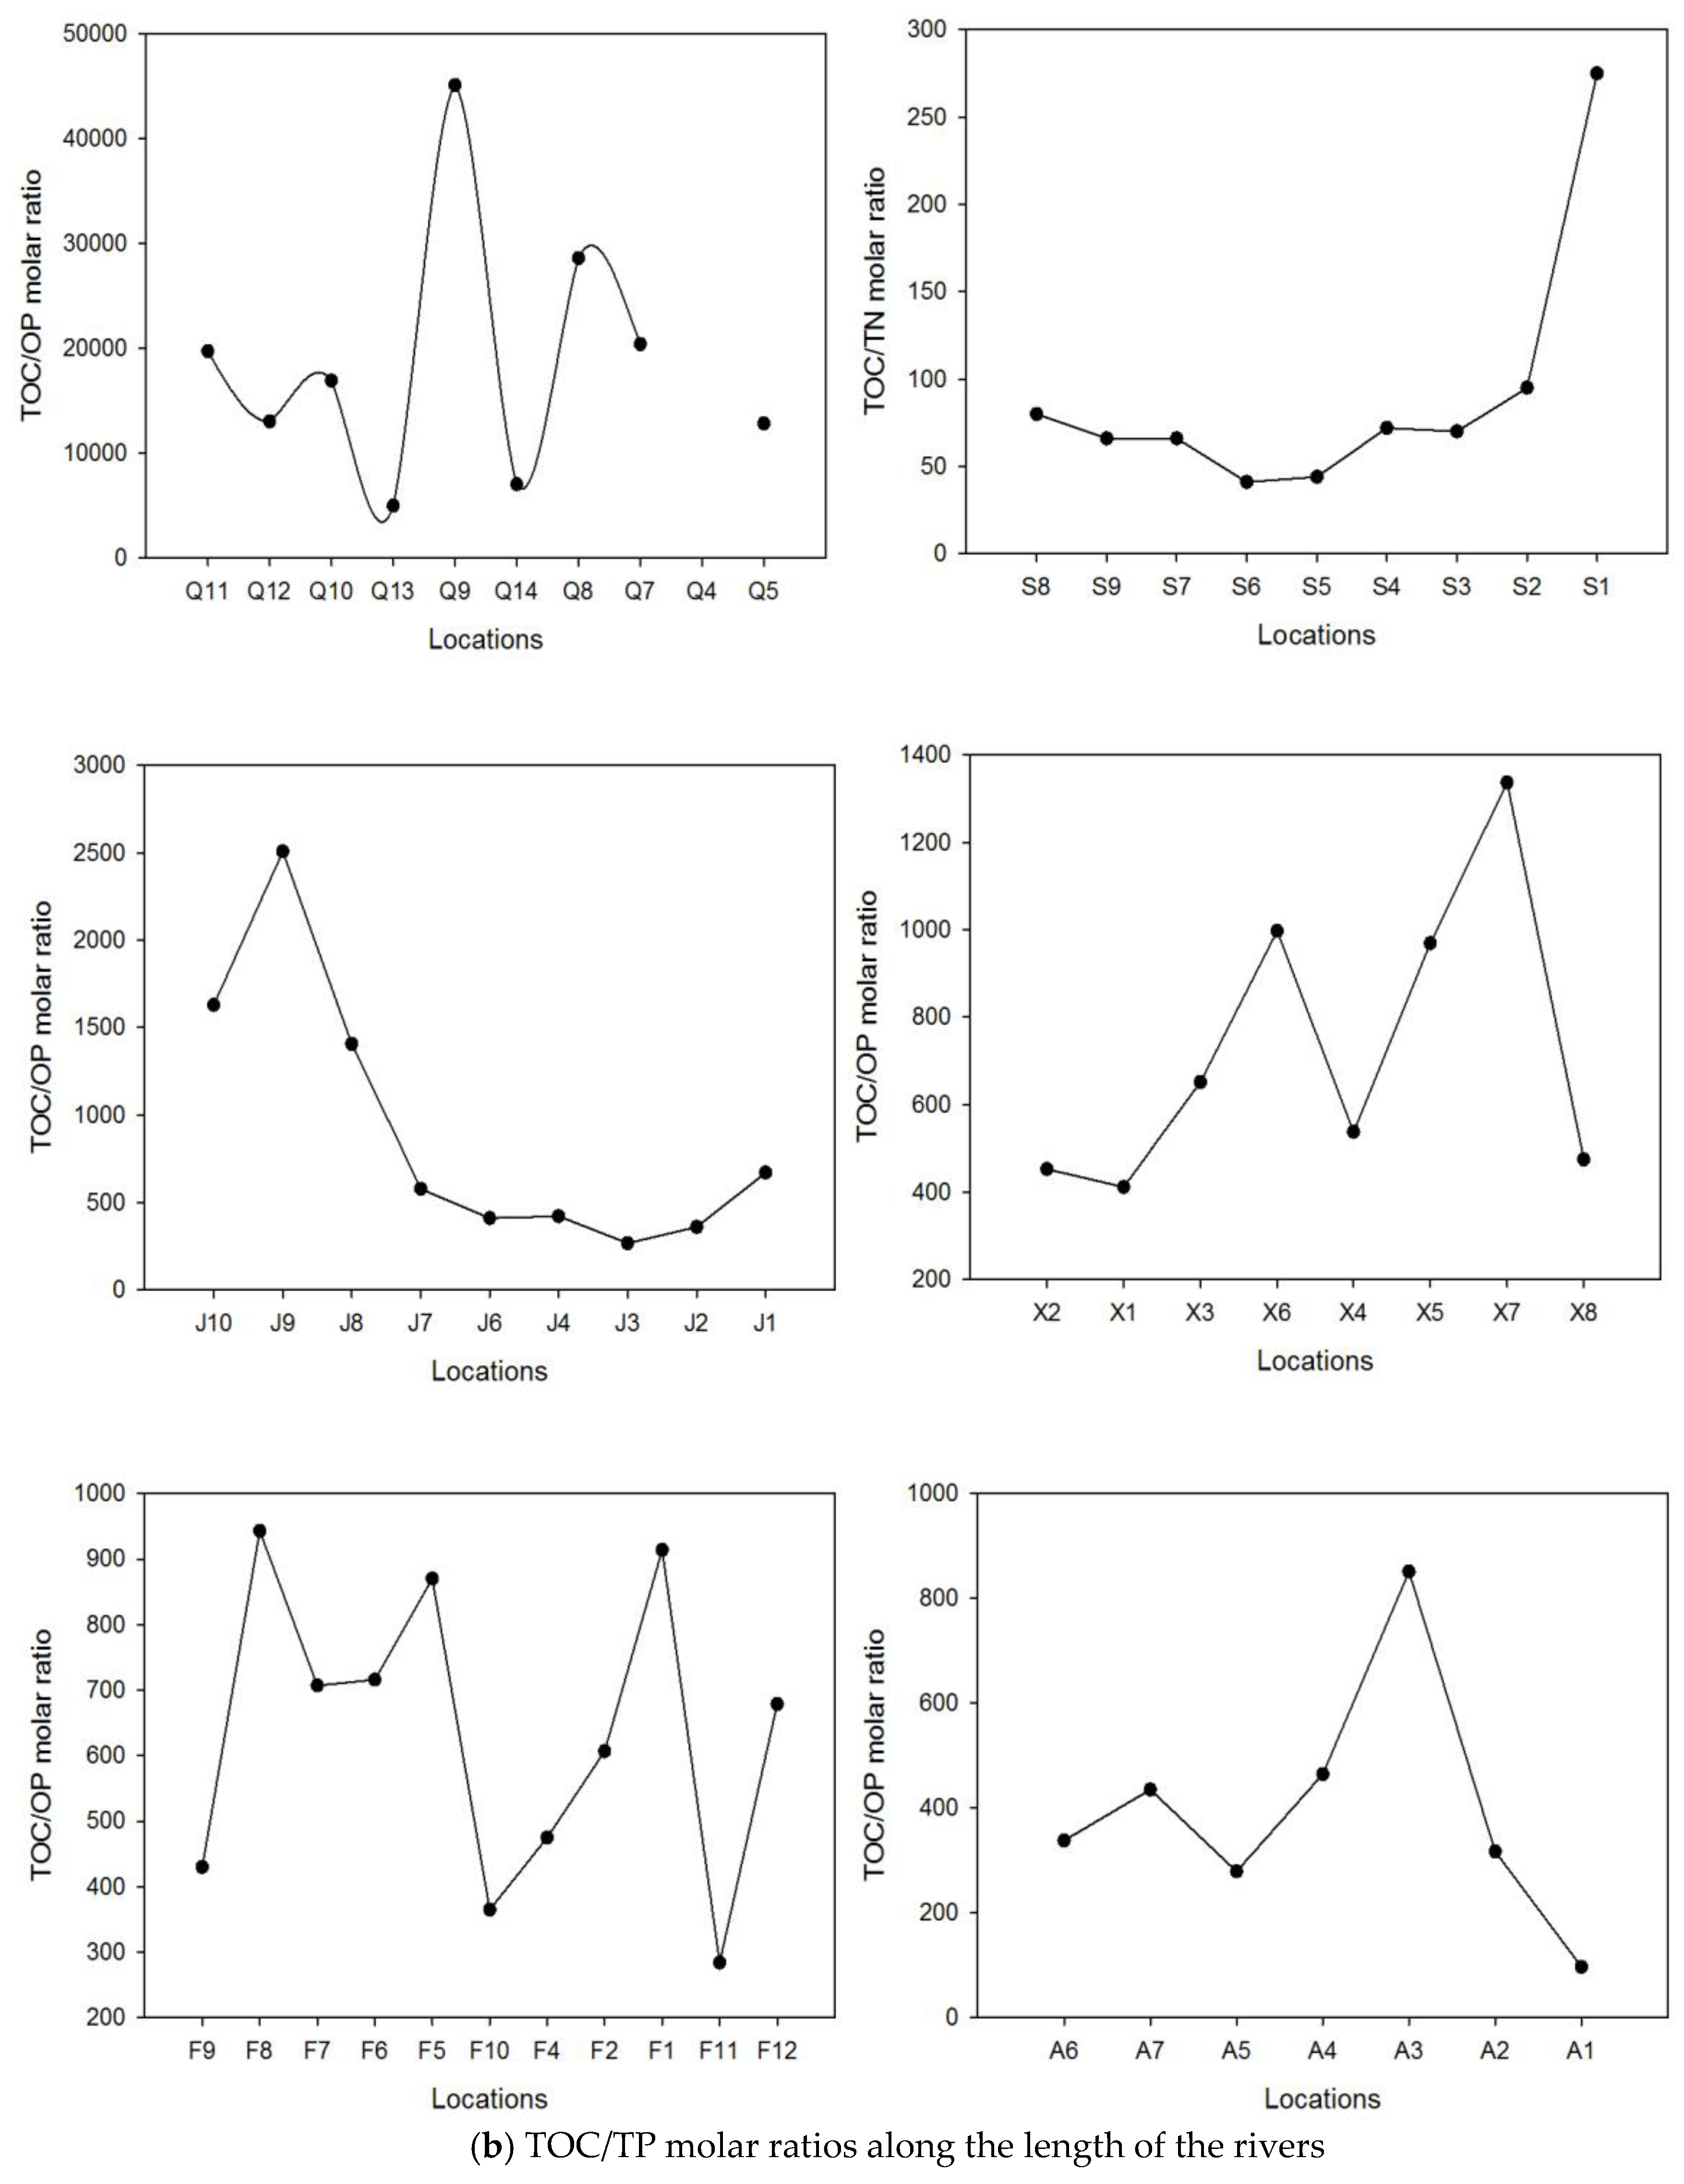
| Locs | Concentration Ranges and Mean (in Brackets) (mg P/kg) | Percentages to TP (%) | |||||||||
|---|---|---|---|---|---|---|---|---|---|---|---|
| NaOH-P | AP | IP | OP | TP | BAP | NaOH-P | AP | IP | OP | BAP | |
| Q | 1.08–7.16 | 1.54–15.15 | 2.39–14.45 | 3.44–6.63 | 6.49–19.98 | 4.74–12.69 | |||||
| (2.57) | (4.16) | (9.03) | (4.44) | (13.47) | (7.01) | 19.08 | 30.88 | 67.04 | 32.96 | 52.04 | |
| S | 175.60–442.12 | 303.34–378.91 | 338.37–395.93 | 244.55–311.60 | 600.23–686.60 | 445.81–703.97 | |||||
| (283.74) | (345.45) | (370.23) | (275.19) | (645.42) | (558.93) | 43.96 | 53.52 | 57.36 | 42.64 | 86.60 | |
| J | 4.48–35.23 | 23.07–43.48 | 39.09–66.50 | 6.68–55.81 | 52.51–106.54 | 14.35–76.10 | |||||
| (12.81) | (35.48) | (51.18) | (29.41) | (80.59) | (42.22) | 15.90 | 44.03 | 63.51 | 36.49 | 52.39 | |
| X | 2.29–10.03 | 10.40–17.41 | 5.26–18.47 | 12.20–31.04 | 26.20–39.91 | 14.63–40.16 | |||||
| (5.03) | (14.38) | (10.03) | (23.72) | (33.75) | (28.75) | 14.90 | 42.61 | 29.72 | 70.28 | 85.19 | |
| F | 4.16–13.20 | 21.51–34.40 | 27.66–62.95 | 17.52–50.40 | 70.96–92.95 | 23.09–60.12 | |||||
| (8.36) | (27.89) | (48.36) | (30.61) | (78.97) | (38.97) | 10.59 | 35.32 | 61.24 | 38.76 | 49.35 | |
| A | 5.95–48.77 | 26.55–52.87 | 48.38–61.31 | 35.64–168.97 | 84.91–221.09 | 46.26–187.61 | |||||
| (17.88) | (44.30) | (52.90) | (71.04) | (123.94) | (88.92) | 14.43 | 35.74 | 42.68 | 57.32 | 71.74 | |
© 2020 by the authors. Licensee MDPI, Basel, Switzerland. This article is an open access article distributed under the terms and conditions of the Creative Commons Attribution (CC BY) license (http://creativecommons.org/licenses/by/4.0/).
Share and Cite
Loh, P.S.; Cheng, L.-X.; Lin, S.-Y.; Kandasamy, S. Characteristics of Sedimentary Organic Matter and Phosphorus in Minor Rivers Discharging into Zhejiang Coast, China. Geosciences 2020, 10, 357. https://doi.org/10.3390/geosciences10090357
Loh PS, Cheng L-X, Lin S-Y, Kandasamy S. Characteristics of Sedimentary Organic Matter and Phosphorus in Minor Rivers Discharging into Zhejiang Coast, China. Geosciences. 2020; 10(9):357. https://doi.org/10.3390/geosciences10090357
Chicago/Turabian StyleLoh, Pei Sun, Long-Xiu Cheng, Shi-Yuan Lin, and Selvaraj Kandasamy. 2020. "Characteristics of Sedimentary Organic Matter and Phosphorus in Minor Rivers Discharging into Zhejiang Coast, China" Geosciences 10, no. 9: 357. https://doi.org/10.3390/geosciences10090357
APA StyleLoh, P. S., Cheng, L.-X., Lin, S.-Y., & Kandasamy, S. (2020). Characteristics of Sedimentary Organic Matter and Phosphorus in Minor Rivers Discharging into Zhejiang Coast, China. Geosciences, 10(9), 357. https://doi.org/10.3390/geosciences10090357


