Abstract
Soil properties determining the thermal transmissivity, the heat duration and temperatures reached during soil heating are key factors driving the fire-induced changes in soil microbial communities. The aim of the present study is to analyze, under laboratory conditions, the impact of the thermal shock (infrared lamps reaching temperatures of 100 °C, 200 °C and 400 °C) and moisture level (0%, 25% and 50% per soil volume) on the microbial properties of three soil mixtures from different sites. The results demonstrated that the initial water content was a determinant factor in the response of the microbial communities to soil heating treatments. Measures of fire impact included intensity and severity (temperature, duration), using the degree-hours method. Heating temperatures produced varying thermal shock and impacts on biomass, bacterial activity and microbial community structure.
1. Introduction
Wildfire hazards are common worldwide. Within the environmental impacts, problems like increased erosion, reduced water quality, habitat degradation [1] and alteration of vegetation dynamics [2] stand out. The wildfires also have effects on human life like infrastructures damages or threats to water supplies due to post-fire water pollution, water stress or floods [3]. The historical fire regimes have been replaced by larger fires known as well as “megafires” [4], with recent examples in Portugal, Greece, the USA and Australia that have large impacts on human lives and require an integrated fire management approach to address this problem [5]. These fires are the result of more extreme conditions like, high fuel availability, low humidity, high temperatures and high wind speed [6] and can have devastating effects on water-plant-soil systems.
It is widely accepted that the effects of the fire on the soil depend basically on the intensity and severity of the fire and the ecosystem resilience [7], as well as several environmental factors such as amount, nature and moisture of vegetation, soil moisture, air temperature and humidity, wind speed and topography of the site [8]. Fire can affect the soil directly by heating, modifying the physical, chemical and biological soil properties [8,9,10,11] or indirectly by the vegetation destruction. The temperature reached in the soil is one of the main indicators of the fire intensity, which is an integral part of the fire severity. Surface soil temperatures can reach temperatures as low as 50 °C or as high as 1500 °C and the spatial patterns of soil temperatures during the fire might affect soil properties in different ways according to the fire severity [12].
The severity of wildfires has been increasing, partially due to the drier conditions associated with climate change [13,14]. The soil thermal conductivity depends on the soil composition, bulk density and especially on the water content [15]. Thus, moisture content might have an insulating effect, decreasing the temperatures reached on the soil after a heating event [16] or might conduct heat pulses more efficiently, resulting in deeper penetration and, perhaps, higher temperature down the soil profile. Therefore, the impact of a fire on the physical, chemical and biological soil properties depends, among other factors, on the soil moisture [17], which can affect both the direct impact of thermal shock and the further survival of soil microorganisms [18]. The association of the wildfires with heat and dry conditions, is in itself a stressful factor for the microorganisms, since they might be already in a state of dormancy before the fire event [19].
The soil microbes are sensitive to temperature increments in the soil ecosystems, varying from small increases, as the one expected from climate change, that can slightly affect the soil microbial community structure [20], to extreme cases where the soil becomes partially sterilized [19] after a high severity fire. The recovery of the soil microbial community after high severity wildfires can take years [9,21,22,23,24,25,26] but can recover to pre-fire conditions faster than vegetation does [27]. Fire severity and intensity is correlated with the plant biomass and can be used to predict plant survival [28].
The response of the microbial community to the fire might differ due to the complexity and site-specific characteristics of the soil ecosystem [29], which hinders the comparison among different studies. Additionally, different parameters of the soil microorganisms like the biomass, composition or the activity may respond differently to fire. Microbial biomass generally decreases after a fire [30], modifying the composition, while the activity can remain stable due to functional redundancy in key microbial driven soil processes [31]. Soil properties determining the thermal transmissivity (moisture, texture, organic matter, etc.) and the duration and temperatures reached (fire severity) during soil heating are key factors driving the fire-induced changes in soil microbial communities. However, despite its interest, the studies about this topic need further development. Experimental heating, under controlled conditions, allows isolating the effect of the different environmental factors and focuses on the impact of the heating temperature on various properties [32,33].
The aim of the present work is to study the importance of the initial soil moisture during a heating event and the impact on three soil microbial communities. We tested the effect of three heat treatments and three soil moisture treatments on microbial properties (composition, biomass and bacterial activity) of three soil microbial mixtures. Our hypothesis is that the soil microbial community response to the heat shock will change depending on the initial soil moisture. Nowadays, it is recognized that fire intensity is related to temperature reached in the soil while fire severity is related to both temperature and residence time. Fire severity, measured for example by the degree-hours method, rather than the intensity, is more useful to measure the impact of heating on microbial properties [34,35]. Therefore, the influence of the different heat treatments on soil microbial properties was measured on the basis of both maximum temperature reached (fire intensity) and the degree-hours methodology (fire severity).
2. Materials and Methods
2.1. Fire Intensity Gradient Experiment
We tested 3 × 3 × 2 factorial experiment (3 initial water content × 3 heating temperatures × 2 depths) on three soil microbial mixtures, with 2 replications and at two times (immediately after the heating and after one month of incubation). Each soil microbial mixture was created by pooling soil samples from a separate site. Soil samples were air-dried and then rewetted with milliQ to 25%, and 50% water content per soil volume, obtaining three different initial water content per soil mixture (0%, 25% and 50%). Subsequently, a 4 cm layer of the different soil mixtures with different water content treatments was placed in aluminum trays (40 × 159 × 109 mm) and subjected to heat with infrared lamps (Philips IR375CH, 300W) which were situated 10 cm above the soil. Three heating treatments were applied (one infrared lamp per each replicate) and the soil mixtures were heated until 100 °C, 200 °C and 400 °C. After the heating, the samples from the tray were split into two subsamples, 0–2 cm top and 2–4 cm bottom (2 depths). A subsample of each one of the burnt samples was reinoculated with the corresponding unburnt soil (20% soil volume), rewetted with milliQ water until 75% of water field capacity (25% soil volume) and incubated at 18 °C during one month (water was added when it was necessary to maintain the moisture content constant). Soil mixtures were subjected to the microbial analysis immediately after the heating and one month after the incubation of the reinoculated soils, obtaining a total of 216 soil samples (3 soil mixtures × 3 water content × 3 heating temperature × 2 depth × 2 times × 2 replicates).
The soil temperature was monitored every 5 min with thermocouples placed at 1 and 3 cm depth of the tray. The maximum temperature (Tmax) reached was noted, and degree hours (DH) calculated using the following formula [34]:
where t5 is the average measured temperature every 5 min and t18 is the room temperature (18 °C); average values of the three different soils shown in Table 1.
DH = Σ(t5 − t18/12)

Table 1.
Degree hours (DH) and maximum temperature reached (Tmax) of the soil mixtures with different water content (WC) and heated to 100 °C, 200 °C and 400 °C. a, soil layer (0–2 cm); b, soil layer (2–4 cm). Range of values and average of the three different soil mixtures ± SE.
2.2. Soil Microbial Mixtures
The soils for the study were sampled at three different locations of the municipality of Carnota (A Coruña, NW of Spain), near to the sea and with an average temperature of 14.5 °C and average rainfall of 524 mm. The site 1 and 2 were separated by 56 m from each other and at 11 km distance from the site 3. Sites 2 and 3 had pinewood vegetation (Pinus pinaster), while the site 1 was a grassland with mostly herbaceous vegetation but with some pine trees still on the field. The top 4 cm of the mineral soils was sampled, discarding the organic horizon, in each of the three locations, in several points within 10 m2 (30–40 subsamples). The soil from each sampling site was sieved (<2 mm), homogenized to obtain a composite sample (mixture) of 5–6 kg and finally air-dried. The characteristics of the sampling sites are shown in Table 2.
Table 2.
Characteristics of soil sampling sites.
2.3. Microbial Analysis
The bacterial growth was measured using the leucine incorporation method [36]. Leucine marked with tritium was incubated with soil bacterial suspension, using the incorporated leucine as a bacterial growth indicator.
The soil microbial community structure and biomass were analysed using the phospholipid fatty acid analysis (PLFA) [37]. Briefly, lipids were extracted with CHCl3:MeOH:citrate buffer and separated with prepacked silica columns, subsequently rinsed with chloroform, acetone and methanol to obtain the phospholipids fatty acids, which were finally subjected to methanolysis and quantified by gas chromatography with flame ionization detector. The estimation of total biomass was calculated by adding up the value of all fatty acids, while the specific group biomass calculation (bacteria, fungi, bacteria Gram positive, bacteria Gram negative and actinobacteria) was calculated by adding up specific fatty acids of each microbial group [38,39,40].
2.4. Statistical Analysis
Measurements of all microbial properties analysed were made per duplicate. The microbial community structure was examined using the values corresponding to the concentrations of all the individual PLFAs, expressed in mole percent and logarithmically transformed, subjected to principal component analyses (PCA) and a PERMANOVA analysis. The impact of the heating temperature, initial water content and depth on the soil bacterial growth and total biomass were analysed by means of general linear models (GLM), selecting the model with the lowest AIC. A separated GLM was performed for each mixture, immediately and after one moth of incubation. The correlation between bacterial growth and total biomass and the degree hours and the maximum temperature per mixture was analysed using Pearson correlation coefficients at the p < 0.05 level. The statistical analyses were performed using the R software package (R studio, version 3.6.1, Development Core Team, 2019).
3. Results
3.1. Microbial Community Structure
The principal component analysis (PCA) of the whole dataset showed that the microbial community structure of the soil mixture 2 was completely different from the soil mixtures 1 and 3. The first principle component explained 39.5% of the variance and clearly separated mixture 2 from mixtures 1 and 3 (Figure 1). The second factor of the PCA, which explained 14.1% of the variance, separated, with some overlapping, the samples incubated from the not incubated ones (Figure 1). In order to discard the importance of soil mixture, different PCAs (Figure 2) and PERMANOVA (Table 3) were performed with PLFAs data per soil mixture.
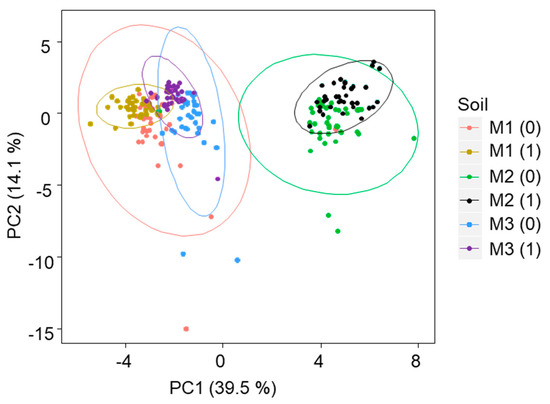
Figure 1.
Principal component analysis of the phospholipid fatty acid analysis (PLFA) data of the different soil mixtures M1 (Soil mixture 1), M2 (Soil mixture 2) and M3 (Soil mixture 3), immediately after heating (0) and one month after the incubation period (1). The ellipses represent data intervals (95%).
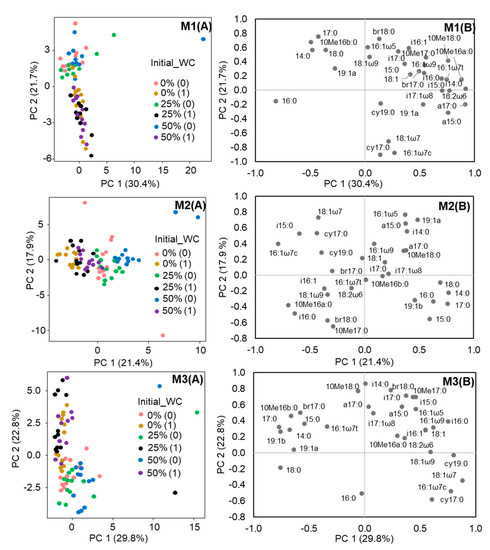
Figure 2.
Score (A) and loading plots (B) from principal component analysis of the PLFA data of the different soil mixtures separately: M1 (Soil mixture 1), M2 (Soil mixture 2), M3 (Soil mixture3). Soils with 0%, 25% and 50% initial water content and analysed immediately after heating (0) and after one month of incubation (1).
Table 3.
PERMANOVA analysis of the PLFA values of the soil mixtures.
The analysis showed different results depending on soil mixture considered. The PCA of the Soil mixture 1 separated the samples immediately (the positive part of the axis) and one month after the heating (the negative part of the axis) along the component 2 (21.7% variance) (Figure 2). The microbial community structure of the soil mixture 1, immediately after the heating, was mainly affected by the water content (15.5% variance explained, p < 0.001) (Table 3) showing a higher proportion of fatty acids indicative of bacteria (17:0, i17:0), actinobacteria (10Me16b:0) and the fatty acids 14:0, i16:1, 16:1ω5, 18:0 and br18:0 (Figure 2). After one month of incubation all the parameters have a similar and significant impact on the microbial community structure of the soil mixture 1, the water content, depth and temperature explained 14.3%, 15.7% and 15.7% of the variance respectively (p < 0.001) (Table 3). The samples were characterized by the abundance of PLFAs indicative of Gram- bacteria (cy17:0, 16:1ω7c, 18:1ω7) (Figure 2).
Regarding the soil mixture 2, the first component of the PCA (21.4% of variance explained), separated the samples immediately (the positive part of the axis) and one month after the heating (the negative part of the axis) (Figure 2). Immediately after the heating, the microbial community structure was mainly affected by the water content and the depth, explaining 18.4% and 12.8% of the variance respectively (p < 0.001) and, in this case, the temperature explained a 7.8% of the variance (p < 0.01) (Table 3). The samples characterized by the predominance of saturated fatty acids indicative of bacteria (15:0, 17:0) or no specific (14:0, 16:0, 18:0) (Figure 2). However, after one month of incubation, the water content explained 31.5% (p < 0.001) of the variance in the soil microbial community of the soil mixture 2, while the depth only explained 6.2% (p < 0.05) and the temperature had no effect (Table 3). The samples were characterized by higher contents of PLFAs indicatives of Gram+ bacteria (i15:0, i16:0), Gram- bacteria (16:1ω7c) and actinobacteria (10Me16a:0) (Figure 2).
Finally, for the soil mixture 3 the PCA separated the samples immediately (the negative part of the axis) and one month after the heating (the positive part of the axis), along the factor 2 (22.8% of variance explained) (Figure 2). The three parameters, water content, depth and temperature, explained a similar % of variance (10%, 10.5% and 9.9% respectively, p < 0.01), immediately after the heating (Table 3). The samples had a higher proportion of PLFA indicative of Gram- bacteria (cy17:0) and PLFA 16:0 (Figure 2). After one month of incubation, the temperature of heating explained the large amount of variance (14.1%, p < 0.001), followed by the depth (8.7%, p < 0.001) and the effect of the water content was not significant (p > 0.05) (Table 3). The samples were associated with PLFAs indicative of bacteria (a15:0, i15:0, a17:0, i17:0), Gram+ bacteria (i14:0, 10Me18:0), actinobacteria (10Me17:0) and the fatty acids br17:0, br18:0 and 16:1ω5 (Figure 2).
3.2. Bacterial Growth
The results of GLM for the bacterial growth immediately (0) and one (1) month after the heating showed marked differences depending on soil mixture as well as time considered (Table 4). The values were low immediately after the heating, but 10 times greater after one month of incubation (Figure 3). Immediately after the heating, the depth had a significant impact on the bacterial growth (Table 4) in the mixture 1, with the highest values in the deeper layer under 25% of water content and heated at 100 and 200 °C (Figure 3). For the soil mixture 2 the model with the lowest AIC include the interactions and the depth and the respective interactions with temperature and water content, had an impact on the bacterial activity (Table 4). Finally, the bacterial growth in the soil mixture 3 was affected by the heating temperature (Table 4), showing smaller values the samples heated at 200 and 400 °C (Figure 3).
Table 4.
Results of general linear models (GLM) performed with the bacterial growth data obtained immediately (0) and one (1) month after the heating in the three different soil mixtures (M1, M2 and M3). Significance codes: *** p < 0.001; ** p < 0.01; * p < 0.05.
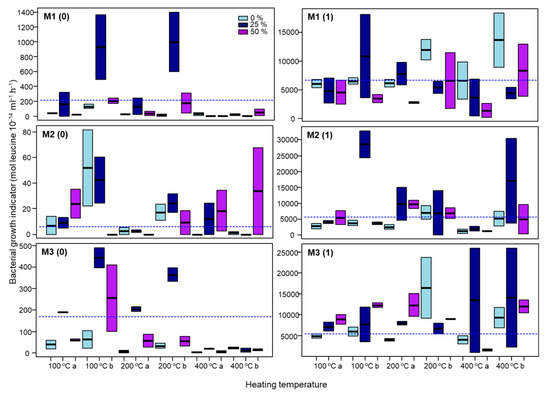
Figure 3.
Bacterial growth immediately (0) and one month after the incubation (1) of the soil mixtures with 0%, 25% and 50% of initial soil water content, before heating at 100 °C, 200 °C and 400 °C. M1, soil mixture 1; M2, soil mixture 2; M3, soil mixture 3; a, soil layer (0–2 cm); b, soil layer (2–4 cm). The boxes represent the interquartile range and the horizontal lines within those boxes are the median. The dash line represents the intercept of the GLM model.
After one month of incubation, the bacterial growth of the soil mixture 1 was affected by the initial water content and the depth (Table 4). In this soil mixture the higher values were for the samples from the 2–4 cm but the impact of the water content was different depending on the heating temperature. Samples with initial water content of 25% had higher values when heated at 100 °C, but at higher temperatures (200 and 400 °C) the samples with 0% of initial water content showed the biggest values (Figure 3). The bacterial growth of the soil mixtures 2 and 3 were not significantly affected for any of the factors (water content, temperature, depth) according the GLM; however, the samples with an initial water content of 25% showed bigger values than the ones with 0 and 50% when heated at 400 °C.
3.3. Microbial Biomass
The results of GLM for the total biomass immediately (0) and one (1) month after the heating differed depending on the time but was similar among the three soil mixtures (Table 5). In general, total biomass values observed immediately after heating were similar or slightly lower than those exhibited one month after the incubation (Figure 4). Immediately after the heating, the total biomass was affected by the temperature and the depth, but not the initial water content, in the three soil mixtures (Table 5). As expected, temperature showed an immediate negative effect on total soil biomass values. This effect was more accentuated at the highest temperatures (400 °C) and, except for samples heated at 100 °C, diminished with depth. Thus, values of 2–4 cm soil samples are bigger than those observed for 0–2 cm soil samples (Figure 4). An effect of water content was also observed since higher total biomass values were observed for soil samples heated at 100 and 200 °C rewetted to 25% of soil water content (Figure 4).
Table 5.
Results of GLM performed with the total biomass data obtained immediately (0) and one (1) month after the heating in the three different soil mixtures (M1, M2 and M3). Significance codes: *** p < 0.001; ** p < 0.01; * p < 0.05.
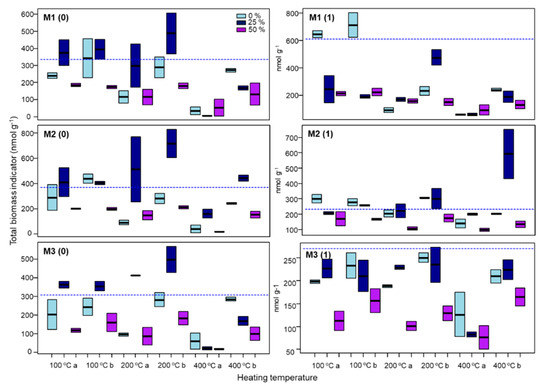
Figure 4.
Total microbial biomass (sum of all PLFA) in nmol g−1, immediately (0) and 1 month (1) after the heating of the heated samples (0%), and samples rewetted to 25 and 50% of soil water content before heating at 100, 200 and 400 °C. M1, soil mixture 1; M2, soil mixture 2; M3, soil mixture 3; a, soil layer (0–2 cm); b, soil layer (2–4 cm). The boxes represent the interquartile range and the horizontal lines within those boxes are the median. The dash line represents the intercept of the GLM model.
After one month of incubation, the total biomass was affected by the initial water content in the three soil mixtures (Table 5). In the soil mixture 1, which was also affected by the heating temperature (Table 5), the samples with 0% initial water content heated at 100 °C showed the higher total biomass values. The soil mixture 2 showed the higher total biomass values in the samples with 25% initial water content and heated at 400 °C. The total biomass of the mixture 3, which was affected by the heating temperature and the depth as well (Table 5), showed smaller values of total biomass in the samples with 50% initial water content (Figure 4).
The biomass of the different specific groups of microorganisms (fungi, bacteria, Gram−, Gram+ and actinobacteria) was estimated (data not showed). A positive correlation was observed between total biomass and the biomass of the different groups both immediately and one month after heating (data not shown). Therefore, the total microbial biomass and the biomass of the different groups have a similar response to the different soil heating treatments. Thus, in the present work only results of total microbial biomass were described in detail.
3.4. Correlations of Microbial Parameters with the Degree-Hours and Maximum Temperatures
The total biomass was highly correlated with the degree-hours (R between −0.64 and −0.94, p < 0.05) and the maximum temperature (R between 0.60 and 0.91, p < 0.05) for all the soil mixtures under different initial water content, except the mixture 3 with 50% WC, immediately after the heating (Table 6). At the same time, the bacterial growth showed significant correlations with the degree-hours only for the soil mixture 3 with 0% WC (R = −0.60, p < 0.05) and 25% WC (R = −0.73, p < 0.01) (Table 6). The correlations between the bacterial growth and the maximum temperature were only significant for the mixture M3 with 0% WC (R = 0.60, p < 0.05), M1 with 25% WC (R = −0.60, p < 0.05) and M3 with 25% WC (R = −0.76, p < 0.05) (Table 6).
Table 6.
Correlation between the degree-hours with the total biomass values for the three different soil mixtures (M1, M2 and M3) with different initial water content (0, 25 and 50%) immediately (0) and one month after the heating (1). Significance codes: *** p < 0.001; ** p < 0.01; * p < 0.05.
After one month of incubation, the correlations between the degree-hours and the maximum temperature with the total biomass were in general significant (R between −0.60 and −0.92, p < 0.05) with the exception of the mixture 2 with 25% WC and mixture 3 with 50% WC. The correlation coefficient was smaller than immediately after the heating. With regard to the bacterial growth, the correlations with the degree-hours and the maximum temperature were significant only in the mixture 2 with 0% WC (R = −0.60 for DH and R = −0.67 for Tmax, p < 0.05).
4. Discussion
The impact of the different soil heating treatments on soil microorganisms may differ notably according the initial pre-fire soil properties. In fact, microbial community structure of samples of soil site 2 was clearly separated from soil sites 1 and 3 (Figure 1 and Figure 2). The present study, performed with heated samples, showed that the microbial community structure of soil samples from soil mixture 1, with an initial lower pH (4.4) and a higher percentage of total C (13%) was completely different from those observed for soil mixtures 2 and 3 (pH, 5.9; 7–8% C). Likely, the pH rather than the total C content was the most determinant factor in the differential response to the heating since a global topsoil survey identified this soil property as one of the main drivers of niche differentiation of fungi and bacteria [41], which can be used as a predictor of the microbial community structure across large spatial scales [42]. The PCA performed with the whole PLFA data set of heated samples also showed that, besides the soil properties (40% of variance explained), other factors that determine differences in soil microbial structure are the incubation of re-inoculated heated soils (11% of variance explained) and, in a lesser extent (< 1% of variance explained) the water content and the soil depth. When the analysis was performed separately for each soil mixture, the results showed clearly that the structure or diversity of soil microbial communities collected immediately after the different soil heating treatments differed notably from those observed for the corresponding re-inoculated samples incubated during one month period. As expected, the variables associated with these microbial changes were the water content, depth and temperature; however, the percentage of variance explained by each factor varied depending on the time passed after heating (0, 1 month incubation) as well as on soil site considered. In general, the importance of these variables followed the order: water content (7–31% of variance explained) > depth (5–16% of variance explained) > temperature (0–15% of variance explained) (Table 3). Similar results were obtained by Lombao et al., [43] who observed that the soil microbial community structure of a soil under Eucalyptus differed notably from that observed in the same soil under Quercus, indicating that soil characteristics (vegetation) were even a more important factor for microbial composition than one of the most important disturbance agents for forest ecosystems, the wildfires. The results are also in agreement with previous studies showing that the sampling time was a more important factor determining microbial community structure than other disturbance agents such as prescribed fire, soil mulching treatments to mitigate post-fire erosion and soil depth [44,45].
The results of the GLM varied depending on the microbial parameter included in the analysis. Our data showed that in order to quantify the impact of initial water content, depth and heating temperature, total biomass measurements rather than the bacterial growth estimates are more adequate. The results also showed that the data interpretation following a fire event is very difficult due partly to the high spatial and temporal data variation, different information derived from these microbial parameters, their different sensitivity to detect changes in soil quality as well as the presence of numerous interactive factors which are affecting, in a direct or indirect way, the microorganisms [8]. This reflects the complexity of analyzing the fire impact on soil microbial communities and hence on soil quality both under laboratory and field conditions.
In general, the soil heating treatments have an initial marked effect on bacterial growth showing very low values, some of them below the detection limit, independently of moisture content. The only exception is the 2–4 cm samples of soil rewetted at 25% moisture content heated at 100 and 200 °C, which can be due to the presence of water which was not evaporated. The inhibition of bacterial growth at relatively low heating temperatures has been previously described on temperatures above 50 °C by several authors, indicating the high sensitivity of this parameter to detect the heating impact [33,43,46]. After one month of incubation, in all soil heating treatments, the bacterial growth values increased, reaching values around 10 times higher than those observed in the corresponding uncontrolled soils. The increases were higher for 2–4 cm soil samples layers and again, especially in soil samples rewetted at 25% moisture content. This fast recovery was mainly attributed to the increase in the C and nutrient availability derived from dead microorganisms which is used by surviving microorganisms for their growth [33,47,48].
The heating has a different impact on the soil bacterial growth than that observed for the total microbial biomass. The negative impact of soil heating treatments on the total microbial biomass determined by the PLFAs increase with temperature but decrease with soil depth; thus, the lower values almost undetectable were exhibited by the surface layers of soils heated at 400 °C independently of soil moisture content. The results showed a rewetting effect on microbial values, but an inconsistent trend was observed, e.g., marked negative effect on soil samples rewetted at 50% while the opposite behavior (positive effect) was detected for samples rewetted at 25%. The higher impact of the microbial biomass at the highest heating temperatures was similar to previous studies at the same temperature ranges [47], which might be related to a decrease in the soil organic matter, detected at 250 °C under experimental heating [48]. The high impact of the heating in the first 2 cm of the soil surface, compared with deeper soil layers, has been also previously described [42,49,50,51,52]. After one month, microbial biomass values recovered slowly and varied depending on soil rewetting. Highly intensive heating might partially sterilize the soil, inducing a late recovery in the microbial biomass [24]. This can partly be due to the fact that, on the one hand, fungi are more sensible to heat impact than bacteria and by the other that post-fire conditions favored the growth of bacteria in detriment of fungi [33,48], which are eukaryote and contributed more to the total microbial biomass than bacteria did.
Both the bacterial growth rate and the total microbial biomass determined by the PLFAs showed a negative relationship with the heating temperature measured both in terms of maximum temperature or degree-hours. There are only slight differences between correlations independently of maximum temperature (intensity) or degree-hours (severity, time and residence time) immediately after the heating and after one month of incubation. This can be explained by the high range of temperature used in our study, which except in the case of 100 °C, depending on soil rewetting and its residence time, sterilized the soils and therefore the relationships between microbial parameters and temperature cannot be properly established (range of values are not adequate to establish the correlations). In contrast, in a recent study carried out with a low range of temperature, which affect the soil microorganisms (not higher to provoked total soil sterilization), the data clearly showed that biochemical parameters were more closely related to the degree-hours data (fire severity, temperature and residence time) than with maximum temperature (fire intensity) [35,46]. Our data indicated that an immediate inhibitory effect around 100 °C was observed for bacterial growth, while for total microbial biomass it is necessary to reach temperatures ≥ 200 °C to detect the same effect [33].
The water content of the soil was a determinant factor in the response of the soil microbial community to the heating impact. A consistent trend was observed with higher values of the microbial property in the mixture samples with 25% of water content, while the soil with 50% of water content showed smaller values for all temperatures. The heat transfer on soils depends on heat capacity, the amount of heat needed to increase the temperature, and the heat conductivity, the ability of the soil to conduct heat; and the increase of soil water content causes an increase in both properties [53]. The limited impact on the soil with 25% of water content might be due to the fact that this water content causes a retardation in the conduction of heat [54], due to an increase in the heat capacity [54,55]. In this sense, decreases in the heat transfer when the soil water content is higher than 20% has been described [56]. Similarly, low intensity prescribed fires performed on shrublands with a 24% of soil water content did not cause detectable effects on the soil chemical properties [57]; and soils at water holding capacity have been proved to delay the soil heating and cooling faster, compared to dry soils, under experimental heating [55]. This slowdown of the heat transfer related to soil moisture has been recently included in 3D models as well [58]. However, the lower values of the samples with 50% water content, might imply a more efficient heat penetration at 100 and 200 °C [59,60], when the water content is too high due to the increase in the soil heat conductivity [53].
Drought events are expected to increase in frequency and severity worldwide due to climate change and, in Europe, the predictions reveal more severe conditions for the southernmost countries [61]. The fire danger in this region has been increasing since the 1970s, consistent with the pattern of climate change [62]. Drought events, besides increase the risk of fire, can stress the soil carbon sink, increasing C emissions and reducing soil C sequestration [63] and affect ecosystem functioning by modifying the relationship between plants, microbes and soil chemistry, with consequent impacts on plant growth, microbial community structure, microbial activity and nutrient cycling. The water availability regulates the microbial growth and activity, with diminution in the substrate accessibility for the microorganisms. The impact of the fire on the soil microbial community is higher in dry soil versus wet soil, since the microorganisms are already affected by the water limitation since the drought conditions have a legacy effect on the recovery of burned soils [64].
The results clearly showed the importance of soil moisture level in the transmission of heat through the soil, and hence in the further direct impact of high temperatures on soil microorganisms. The values of microbial parameters analysed were low, particularly immediately after soil heating at higher temperatures, being that bacterial activity measurements (leucine incorporation technique) are more sensitive to detecting the thermal shock than total biomass measurements (PLFA). Time elapsed after the heating was found to be decisive when examining the relationships between the microbial properties and the soil heating parameters (DH, Tmax). It should be noted that even though temperatures above 400 °C have been detected in some cases [65] in high severity wildfires, the temperatures reached in the mineral soil are generally lower than those used in the present study. Therefore, further laboratory experiments which allow us to extrapolate the data on the field conditions are necessary. These studies should be performed with soil samples under a different moisture content heated at temperature affecting soil microorganisms (wide range of temperatures ≤ 200) and using a more precise heating source (e.g., an oven instead of infrared lamps) in order to improve our acknowledgment on this topic. The results can be of great interest for land managers when they use the prescribed fires as a tool to control wildfires.
Author Contributions
Conceptualization, A.B., J.C.-G. and M.D.-R.; methodology, A.B., A.L. and A.M.; software, A.B. and A.L.; formal analysis, A.B. and J.C.-G.; investigation, T.C. and M.D.-R.; data curation, A.M.; writing—original draft preparation, A.B.; writing—review and editing, A.B, T.C., and M.D.-R.; supervision, M.D.-R. All authors have read and agreed to the published version of the manuscript.
Funding
This research was funded by Spanish Ministry of Economy and Competitiveness (AGL2012-39686-C02-01) and for the for the MAPFRE foundation. A. Barreiro and A. Lombao are recipients of FPU grant from Spanish Ministry of Education. The authors thank S.J. González-Prieto for his valuable help with the statistical analyses.
Conflicts of Interest
The authors declare no conflict of interest. The funders had no role in the design of the study; in the collection, analyses, or interpretation of data; in the writing of the manuscript, or in the decision to publish the results.
References
- Martin, D.; Tomida, M.; Meacham, B. Environmental impact of fire. Fire Sci. Rev. 2016, 5, 5. [Google Scholar] [CrossRef]
- Thonicke, K.; Venevsky, S.; Sitch, S.; Cramer, W. The role of fire disturbance for global vegetation dynamics: Coupling fire into a Dynamic Global Vegetation Model. Glob. Ecol. Biogeogr. 2001, 10, 661–677. [Google Scholar] [CrossRef]
- Hallema, D.W.; Robinne, F.N.; Bladon, K.D. Reframing the challenge of global wildfire threats to water supplies. Earth Future 2018, 6, 772–776. [Google Scholar] [CrossRef]
- Jones, G.M.; Gutiérrez, R.J.; Tempel, D.J.; Whitmore, S.A.; Berigan, W.J.; Peery, M.Z. Megafires: An emerging threat to old-forest species. Front. Ecol. Environ. 2016, 14, 300–306. [Google Scholar] [CrossRef]
- Moore, P.F. Global wildland fire management research needs. Curr. For. Rep. 2019, 5, 210–225. [Google Scholar] [CrossRef]
- Ferreira-Leite, F.; Bento-Goncalves, A.; Vieira, A.; da Vinha, L. Mega-fires around the world: A literature review. In Wildland Fires: A Worldwide Reality; Bento-Goncalves, A., Vieira, A., Eds.; Nova Science Publishers: Hauppauge, NY, USA, 2015; pp. 15–33. [Google Scholar]
- Keeley, J.E. Fire intensity, fire severity and burn severity: A brief review and suggested usage. Int. J. Wildland Fire 2009, 18, 116–126. [Google Scholar] [CrossRef]
- Certini, G. Effects of fire on properties of forest soils: A review. Oecologia 2005, 143, 1–10. [Google Scholar] [CrossRef]
- Carballas, T.; Martín, A.; Díaz-Raviña, M. Efecto de los incendios forestales sobre los suelos de Galicia. In Efectos de los Incendios Forestales Sobre los Suelos de España: El Estado de la Cuestión Visto Por los Científios Españoles; Cerdá, A., Mataix-Solera, J., Eds.; Cátedra de Divulgación de la Ciencia; Universidad de Valencia: Valencia, Spain, 2009; pp. 269–301. [Google Scholar]
- Mataix-Solera, J.; Cerdà, A.; Arcenegui, V.; Jordán, A.; Zavala, L.M. Fire effects on soil aggregation: A review. Earth-Sci. Rev. 2011, 109, 44–60. [Google Scholar] [CrossRef]
- Almendros, G.; González-Vila, F.J. Wildfires, soil carbon balance and resilient organic matter in mediterranean ecosystems. A review. Span. J. Soil Sci. 2012, 2, 8–33. [Google Scholar]
- Gimeno-García, E.; Andreu, V.; Rubio, J.L. Spatial patterns of soil temperatures during experimental fires. Geoderma 2004, 118, 17–38. [Google Scholar] [CrossRef]
- Flannigan, M.D.; Krawchuk, M.A.; de Groot, W.J.; Wotton, B.M.; Gowman, L.M. Implications of changing climate for global wildland fire. Int. J. Wildland Fire 2009, 18, 483–507. [Google Scholar] [CrossRef]
- Jolly, W.M.; Cochrane, M.A.; Freeborn, P.H.; Holden, Z.A.; Brown, T.J.; Williamson, G.J.; Bowman, D.M.J.S. Climate-induced variations in global wildfire danger from 1979 to 2013. Nat. Commun. 2015, 6, 7537. [Google Scholar] [CrossRef] [PubMed]
- Shiozawa, S.; Campbell, G.S. Soil thermal conductivity. Remote Sens. Rev. 1990, 5, 301–310. [Google Scholar] [CrossRef]
- Valette, J.C.; Gomendy, V.; Marechal, J.; Houssard, C.; Gillon, D. Heat-transfer in the soil during very low-intensity experimental fires—The role of duff and soil-moisture content. Int. J. Wildland Fire 1994, 4, 225–237. [Google Scholar] [CrossRef]
- Verma, S.; Jayakumar, S. Impact of forest fire on physical, chemical and biological properties of soil: A review. Proc. Int. Acad. Ecol. Environ. Sci. 2012, 2, 168. [Google Scholar]
- Dunn, P.H.; Barro, S.C.; Poth, M. Soil moisture affects survival of microorganisms in heated chaparral soil. Soil Biol. Biochem. 1985, 17, 143–148. [Google Scholar] [CrossRef]
- Mataix-Solera, J.; Guerrero, C.; García-Orenes, F.; Bárcenas, G.M.; Torres, M.P.; Barcenas, M. Forest fire effects on soil microbiology. Fire Eff. Soils Restor. Strateg. 2009, 5, 133–175. [Google Scholar]
- Zhang, W.; Parker, K.M.; Luo, Y.; Wan, S.; Wallace, L.L.; Hu, S. Soil microbial responses to experimental warming and clipping in a tallgrass prairie. Glob. Chang. Biol. 2005, 11, 266–277. [Google Scholar] [CrossRef]
- Hamman, S.T.; Burke, I.C.; Stromberger, M.E. Relationships between microbial community structure and soil environmental conditions in a recently burned soil. Soil Biol. Biochem. 2007, 39, 1703–1711. [Google Scholar] [CrossRef]
- Campbell, C.D.; Cameron, C.M.; Bastias, B.A.; Chen, C.; Cairney, J.W.G. Long-term repeated burning in a wet sclerophyll forest reduces fungal and bacterial biomass and responses to carbon substrates. Soil Biol. Biochem. 2008, 40, 2246–2252. [Google Scholar] [CrossRef]
- Dangi, S.R.; Stahl, P.D.; Pendall, E.; Cleary, M.B.; Buyer, J.S. Recovery of soil microbial community structure after fire in a sagebrush-grassland ecosystem. Land Degrad. Dev. 2010, 21, 423–432. [Google Scholar] [CrossRef]
- Bárcenas-Moreno, G.; García-Orenes, F.; Mataix-Solera, J.; Mataix-Beneyto, J.; Bååth, E. Soil microbial recolonization after a fire in Mediterranean Forest. Biol. Fertil. Soils 2011, 47, 261–272. [Google Scholar] [CrossRef]
- Goberna, M.; García, C.; Insam, H.; Hernández, M.T. Burning fire-prone mediterranean shublands: Immediate changes in soil microbial community structure and ecosystem functions. Microb. Ecol. 2012, 64, 242–255. [Google Scholar] [CrossRef]
- Weber, C.F.; Lockhart, J.S.; Charaska, E.; Aho, K.; Lohse, K.A. Bacterial composition of soils in ponderosa pine and mixed conifer forests exposed to different wildfire burn severity. Soil Biol. Biochem. 2014, 69, 242–250. [Google Scholar] [CrossRef]
- Xiang, X.; Shi, Y.; Yang, J.; Kong, J.; Lin, X.; Zhang, H.; Zeng, J.; Chu, H. Rapid recovery of soil bacterial communities after wildfire in a Chinese boreal forest. Sci. Rep. 2014, 4, 3829. [Google Scholar] [CrossRef] [PubMed]
- Haile, K.F. Fuel Load and Heat Effects on Northern Mixed Prairie and Four Prominent Rangeland Graminoids. Ph.D. Thesis, College of Agriculture, Montana State University-Bozeman, Bozeman, MT, USA, 2011. [Google Scholar]
- Bünemann, E.K.; Bongiorno, G.; Bai, Z.; Creamer, R.E.; De Deyn, G.; de Goede, R.; Fleskens, L.; Geissen, V.; Kuyper, T.W.; Mäder, P.; et al. Soil quality—A critical review. Soil Biol. Biochem. 2018, 120, 105–125. [Google Scholar] [CrossRef]
- Dooley, S.R.; Treseder, K.K. The effect of fire on microbial biomass: A meta-analysis of field studies. Biogeochemistry 2012, 109, 49–61. [Google Scholar] [CrossRef]
- Wellington, E.M.H.; Berry, A.; Krsek, M. Resolving functional diversity in relation to microbial community structure in soil: Exploiting genomics and stable isotope probing. Curr. Opin. Microbiol. 2003, 6, 295–301. [Google Scholar] [CrossRef]
- Guerrero, C.; Mataix-Solera, J.; Gómez, I.; García-Orenes, F.; Jordán, M.M. Microbial recolonization and chemical changes in a soil heated at different temperatures. Int. J. Wildland Fire 2005, 14, 385–400. [Google Scholar] [CrossRef]
- Bárcenas-Moreno, G.; Bååth, E. Bacterial and fungal growth in soil heated at different temperatures to simulate a range of fire intensities. Soil Biol. Biochem. 2009, 41, 2517–2526. [Google Scholar] [CrossRef]
- Cancelo-González, J.; Rial-Rivas, M.E.; Barros, N.; Díaz-Fierros, F. Assessment of the impact of soil heating on soil cations using the degree-hour method. Span. J. Soil Sci. 2012, 2, 32–44. [Google Scholar]
- Lombao, A.; Barreiro, A.; Fontúrbel, M.T.; Martín, A.; Carballas, T.; Díaz-Raviña, M. Key factors controlling microbial community responses after a fire: Importance of severity and recurrence. Sci. Total Environ. 2020, 741, 140363. [Google Scholar] [CrossRef] [PubMed]
- Bååth, E.; Pettersson, M.; Söderberg, K.H. Adaptation of a rapid and economical microcentrifugation method to measure thymidine and leucine incorporation by soil bacteria. Soil Biol. Biochem. 2001, 33, 1571–1574. [Google Scholar] [CrossRef]
- Frostegård, A.; Tunlid, A.; Bååth, E. Phospholipid fatty acid composition, biomass, and activity of microbial communities from two soil types experimentally exposed to different heavy metals. Appl. Environ. Microbiol. 1993, 59, 3605–3617. [Google Scholar] [CrossRef] [PubMed]
- Frostegård, Å.; Bååth, E. The use of phospholipid fatty acid analysis to estimate bacterial and fungal biomass in soil. Biol. Fertil. Soils 1996, 22, 59–65. [Google Scholar] [CrossRef]
- Frostegård, Å.; Tunlid, A.; Bååth, E. Use and misuse of PLFA measurements in soils. Soil Biol. Biochem. 2011, 43, 1621–1625. [Google Scholar] [CrossRef]
- Zelles, L. Fatty acid patterns of phospholipids and lipopolysaccharides in the characterisation of microbial communities in soil: A review. Biol. Fertil. Soils 1999, 29, 111–129. [Google Scholar] [CrossRef]
- Bahram, M.; Hildebrand, F.; Forslund, S.K.; Anderson, J.L.; Soudzilovskaia, N.A.; Bodegom, P.M.; Bengtsson-Palme, J.; Anslan, S.; Coelho, L.P.; Harend, H.; et al. Structure and function of the global topsoil microbiome. Nature 2018, 560, 233–237. [Google Scholar] [CrossRef]
- Lauber, C.L.; Hamady, M.; Knight, R.; Fierer, N. Pyrosequencing-Based Assessment of Soil pH as a Predictor of Soil Bacterial Community Structure at the Continental Scale. Appl. Environ. Microbiol. 2009, 75, 5111. [Google Scholar] [CrossRef]
- Lombao, A.; Barreiro, A.; Carballas, T.; Fontúrbel, M.T.; Martín, Á.; Vega, J.A.; Fernández, C.; Díaz-Raviña, M. Changes in soil properties after a wildfire in Fragas do Eume Natural Park (Galicia, NW Spain). Catena 2015, 135, 409–418. [Google Scholar] [CrossRef]
- Barreiro, A.; Fontúrbel, M.T.; Lombao, A.; Martín, A.; Vega, J.A.; Fernández, C.; Carballas, T.; Díaz-Raviña, M. Using phospholipid fatty acid and community level physiological profiling techniques to characterize soil microbial communities following an experimental fire and different stabilization treatments. Catena 2015, 135, 419–429. [Google Scholar] [CrossRef]
- Raviña, M.D.; Vázquez, A.L.; Buján, A.I.B.; Jiménez, A.M.; Fernández, T.C. Medium-term impact of post-fire emergency rehabilitation techniques on a shrubland ecosystem in Galicia (NWSpain). Span. J. Soil Sci. 2018, 8, 322–346. [Google Scholar]
- Lombao, A.; Barreiro, A.; Cancelo-González, J.; Martín, Á.; Díaz-Raviña, M. Impact of thermal shock on forest soils affected by fires of different severity and recurrence. Span. J. Soil Sci. 2015, 5, 165–179. [Google Scholar]
- Díaz-Raviña, M.; Prieto, A.; Bååth, E. Bacterial activity in a forest soil after soil heating and organic amendments measured by the thymidine incorporation technique. Soil Biol. Biochem. 1996, 28, 419–426. [Google Scholar] [CrossRef]
- Barreiro, A.; Bååth, E.; Díaz-Raviña, M. Bacterial and fungal growth in burnt acid soils amended with different high C/N mulch materials. Soil Biol. Biochem. 2016, 97, 102–111. [Google Scholar] [CrossRef]
- Badía-Villas, D.; González-Pérez, J.A.; Aznar, J.M.; Arjona-Gracia, B.; Martí-Dalmau, C. Changes in water repellency, aggregation and organic matter of a mollic horizon burned in laboratory: Soil depth affected by fire. Geoderma 2014, 213, 400–407. [Google Scholar] [CrossRef]
- Vega, J.A.; Fernández, C.; Fonturbel, T.; González-Prieto, S.; Jiménez, E. Testing the effects of straw mulching and herb seeding on soil erosion after fire in a gorse shrubland. Geoderma 2014, 223, 79–87. [Google Scholar] [CrossRef]
- Aznar, J.M.; González-Pérez, J.A.; Badía, D.; Martí, C. At what depth are the properties of a gypseous forest topsoil affected by burning? Land Degrad. Dev. 2016, 27, 1344–1353. [Google Scholar] [CrossRef]
- DeBano, L.F.; Neary, D.G.; Ffolliott, P.F. Fire Effects on Ecosystems; John Wiley & Sons: Hoboken, NJ, USA, 1998. [Google Scholar]
- Beadle, N.C.W. Soil temperatures during forest fires and their effect on the survival of vegetation. J. Ecol. 1940, 28, 180–192. [Google Scholar] [CrossRef]
- Abu-Hamdeh, N.H. Thermal properties of soils as affected by density and water content. Biosyst. Eng. 2003, 86, 1537–5110. [Google Scholar] [CrossRef]
- Badía, D.; López-García, S.; Martí, C.; Ortíz-Perpiñá, O.; Girona-García, A.; Casanova-Gascón, J. Burn effects on soil properties associated to heat transfer under contrasting moisture content. Sci. Total Environ. 2017, 601–602, 1119–1128. [Google Scholar]
- Busse, M.D.; Shestak, C.J.; Hubbert, K.R.; Knapp, E.E. Soil physical properties regulate lethal heating during burning of woody residues. Soil Sci. Soc. Am. J. 2010, 74, 947–955. [Google Scholar] [CrossRef]
- González-Pelayo, O.; Gimeno-García, E.; Ferreira, C.S.S.; Ferreira, A.J.D.; Keizer, J.J.; Andreu, V.; Rubio, J.L. Water repellency of air-dried and sieved samples from limestone soils in central Portugal collected before and after prescribed fire. Plant Soil 2015, 394, 199–214. [Google Scholar] [CrossRef]
- Bao, T.; Liu, S.; Qin, Y.; Liu, L.Z. 3D modeling of coupled soil heat and moisture transport beneath a surface fire. Int. J. Heat Mass Transf. 2020, 149, 119163. [Google Scholar] [CrossRef]
- Campbell, G.S.; Jungbauer, J.D.; Bidlake, W.R.; Hungerford, R.D. Predicting the effect of temperature on soil thermal conductivity. Soil Sci. 1994, 158, 307–313. [Google Scholar] [CrossRef]
- Guo, J.; Chen, G.; Xie, J.; Yang, Z.; Yang, Y. Effect of heat-disturbance on microbial biomass carbon and microbial respiration in Chinese fir (Cunninghamia lanceolata) forest soils. J. For. Res. 2015, 26, 933–939. [Google Scholar] [CrossRef]
- Roudier, P.; Andersson, J.C.M.; Donnelly, C.; Feyen, L.; Greuell, W.; Ludwig, F. Projections of future floods and hydrological droughts in Europe under a +2°C global warming. Clim. Chang. 2016, 135, 341–355. [Google Scholar] [CrossRef]
- Venäläinen, A.; Korhonen, N.; Hyvärinen, O.; Koutsias, N.; Xystrakis, F.; Urbieta, I.R.; Moreno, J.M. Temporal variations and change in forest fire danger in Europe for 1960-2012. Nat. Hazards Earth Syst. Sci. 2014, 14, 1477. [Google Scholar] [CrossRef]
- Piao, S.; Zhang, X.; Chen, A.; Liu, Q.; Lian, X.; Wang, X.; Peng, S.; Wu, X. The impacts of climate extremes on the terrestrial carbon cycle: A review. Sci. China Earth Sci. 2019, 62, 1551–1563. [Google Scholar] [CrossRef]
- Hinojosa, M.B.; Laudicina, V.A.; Parra, A.; Albert-Belda, E.; Moreno, J.M. Drought and its legacy modulate the post-fire recovery of soil functionality and microbial community structure in a Mediterranean shrubland. Glob. Chang. Biol. 2019, 25, 1409–1427. [Google Scholar] [CrossRef]
- Smith, J.E.; Cowan, A.D.; Fitzgerald, S.A. Soil heating during the complete combustion of mega-logs and broadcast burning in central Oregon USA pumice soils. Int. J. Wildland Fire 2016, 25, 1202–1207. [Google Scholar] [CrossRef]
© 2020 by the authors. Licensee MDPI, Basel, Switzerland. This article is an open access article distributed under the terms and conditions of the Creative Commons Attribution (CC BY) license (http://creativecommons.org/licenses/by/4.0/).