Article

Stress–Dilatancy Relationship of Erksak Sand under Drained Triaxial Compression

by
Katarzyna Dołżyk-Szypcio
Department of Geotechnics and Structural Mechanics, Faculty of Civil Engineering and Environmental Sciences, Bialystok University of Technology, 15-351 Bialystok, Poland
Geosciences 2020, 10(9), 353; https://doi.org/10.3390/geosciences10090353
Submission received: 31 July 2020 / Revised: 26 August 2020 / Accepted: 2 September 2020 / Published: 5 September 2020

Abstract

:
Analyzing the results of triaxial compression tests under drained conditions for Erksak sand published in the literature, the stress–dilatancy relationships were described using the frictional state concept. At all phases of shearing, the linear stress ratio–plastic dilatancy relationship can be expressed by the critical frictional state angle and two parameters of the frictional state concept. At failure, dense sand exhibits purely frictional behavior (α = 0, β = 1) and the stress ratio–dilatancy relationship may be correctly described by the Rowe, Bolton, and frictional state concept relationships. Very loose Erksak sand sheared under drained triaxial compression at the ultimate state reaches a stable condition, but the reached stress ratio is significantly smaller than the one at a critical state.

1. Introduction

The phenomenon of sand (soil) behavior is that shear can induce volume changes. In a direct shear test, the energy considerations of Taylor [1] showed that shear strength is a sum of frictional and dilatancy components. Taylor’s stress–dilatancy relationship was implemented for triaxial compression of remolded clay by Roscoe et al. [2,3]. The Cam–clay (C-C) [4] and modified Cam–clay [5] models were developed on the basis of the critical state concept. Linear and nonlinear stress ratio–plastic dilatancy relationships ( η D p ) were obtained from C-C and M-C-C models, respectively. These stress ratio–plastic dilatancy relationships are not correct for dilative sands. The modernized stress ratio–plastic dilatancy relationship was proposed by Jefferies [6], and the simple Nor-Sand model was formulated. The well-known Rowe stress–dilatancy relationships for granular soils were obtained from special energetic considerations for triaxial compression, triaxial extension, and plane strain conditions [7,8]. Szypcio [9] formulated the frictional state concept as a modification of the critical state concept. The stress ratio–plastic dilatancy ( η D p ) relationships are linear for various shear phases of soil defined by the stress ratio at the critical frictional state and two new parameters α and β. At failure, the stress ratio–dilatancy relationship for drained triaxial compression has been well confirmed experimentally [10]. The widely known Bolton [11] and Rowe [7,8] stress ratio–dilatancy relationships may be treated as approximations of the relationship obtained from the frictional state concept [10]. For sands, the critical frictional state angle and the critical state angle are equal ( ϕ ° = ϕ c υ ) [9,10,12]. The influence of grain crushing on the stress ratio–plastic dilatancy relationship for soils with weak grains is shown in previous studies [13,14] and for railway ballast in a previous report [15]. The linear stress ratio–plastic dilatancy relationships for various shear phases of Toyoura sand under undrained triaxial compression conditions were also obtained [16]. The most well-known stress–dilatancy relationships were collected by Rahimi [17]. The micro mechanics approach also gives linear stress–dilatancy relationships for granular materials [18,19].
The complex stress–plastic dilatancy relationship can be obtained by differentiating the plastic potential function proposed in classical elastoplastic models [17]. Recently the stress–dilatancy relationship was obtained by use of fractional order derivatives of plastic potential or yielding function with respect to loading path [20,21,22,23].
In this paper, drained triaxial compression test results for loose and very loose Erksak sand conducted by Been and Jefferies [24] were analyzed with the use of frictional state concept. It is shown that for dilative behavior of sand at failure and post-failure states, the purely frictional state (α = 0, β = 1.0) is reached, and the stress–dilatancy relationship obtained from the frictional state concept is correct. For pre-failure states, the change of sand structure (grain rearrangement) significantly influences the stress–plastic dilatancy relationships, and sand behavior is not purely frictional (α > 0 and β > 1.0). For very loose Erksak sand under the ultimate state ( ε a 18 % ), constant stress and zero volume increments were reached. Therefore, under the ultimate state, the conditions necessary for the critical state are fulfilled. Unfortunately, the obtained stress ratio is significantly smaller than the critical state ratio. This means that critical state for very loose sand is not reached. The frictional state concept can describe the real behavior of the various initial densities of Erksak sand at various phases of shear.

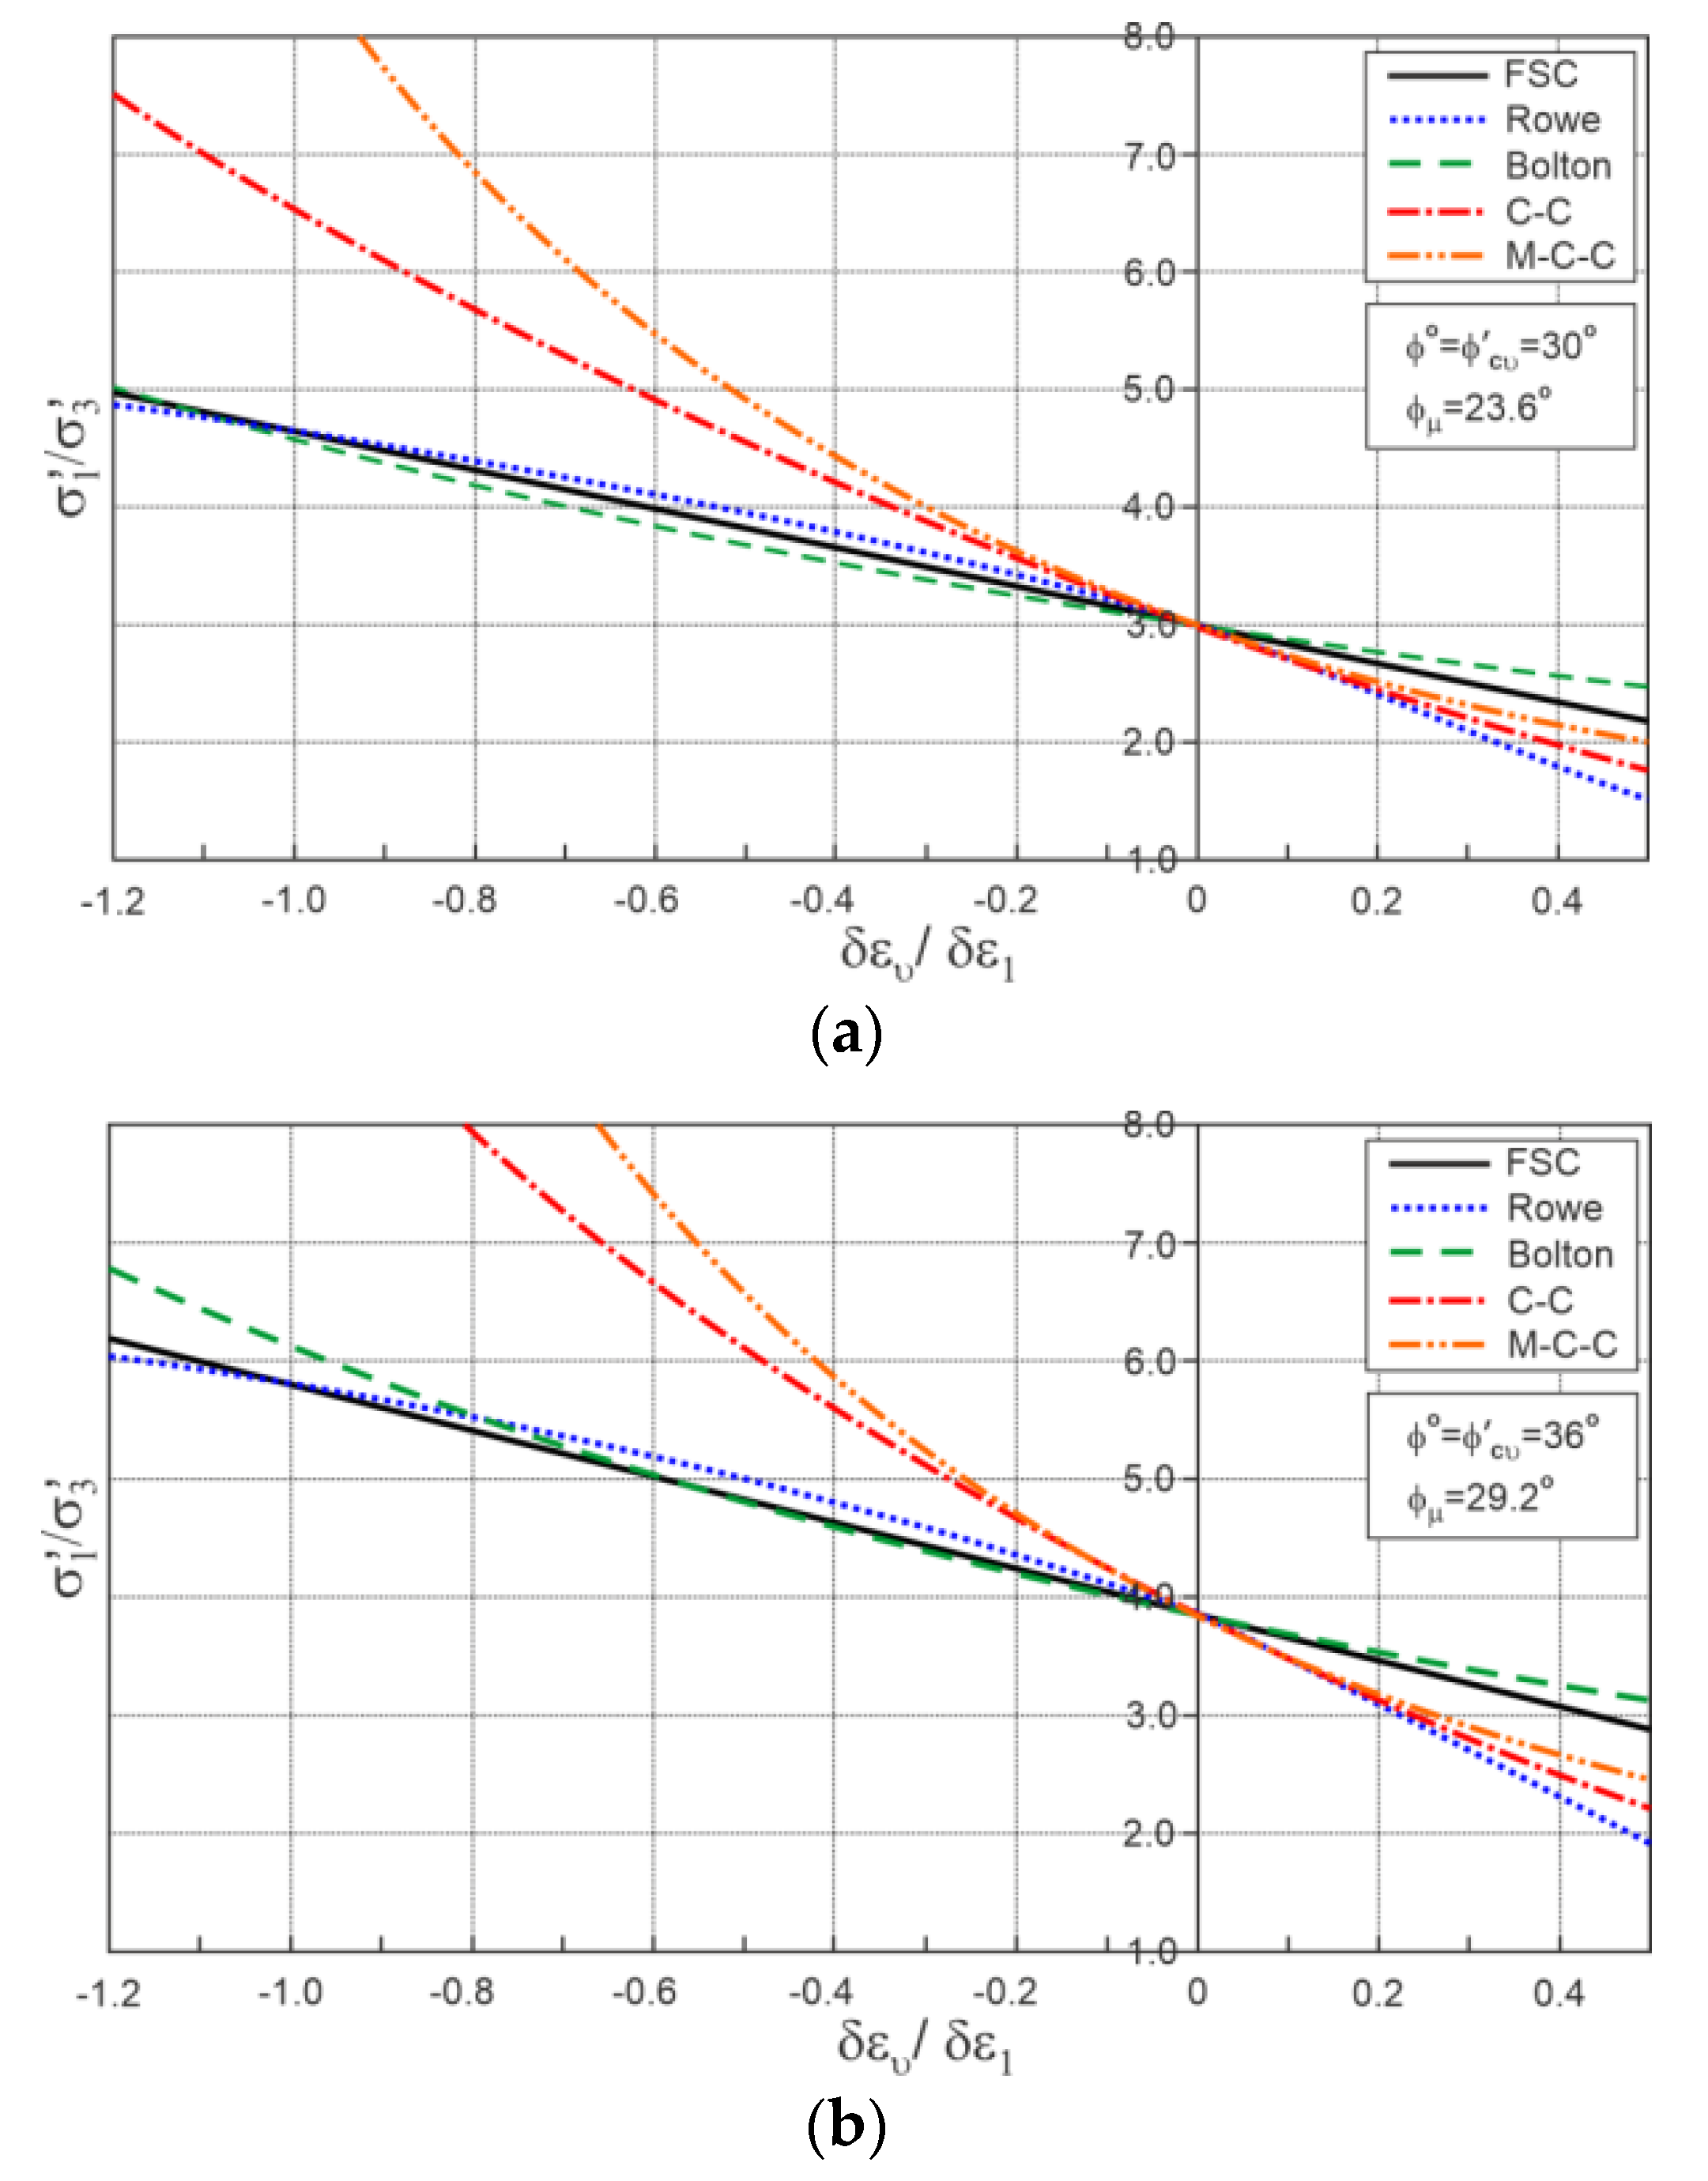
2. Stress–Dilatancy Relationship for Sand

The most widely known stress–dilatancy relationship is Rowe’s relationship [7,8]. For triaxial compression,
σ 1 / σ 3 = K   D ,
where K = t a n 2 ( π 4 + ϕ f 2 ) and D = 1 ( δ ε υ / δ ε 1 ) .
ϕ f is the semi-empirical friction angle whose value ranges from ϕ μ to ϕ c υ ( ϕ μ ϕ f ϕ c υ ).
It is shown [11] that for triaxial compression:
ϕ f = ϕ c υ ( ϕ μ ϕ c υ ) ( δ ε υ / δ ε 1 )               f o r             δ ε υ / δ ε 1 0 ,
ϕ f = ϕ c υ                   f o r                   δ ε υ / δ ε 1 > 0 .
Bolton [11] analyzed the stress ratios and friction angles of 17 silica sands proposed for triaxial compression relationships in the form:
ϕ ϕ c υ = 3 I R ,
δ ε υ / δ ε 1 = 0.3 I R ,
where I R = I D ( 10 ln p ) 1 is the relative dilatancy index.
Comparing Equations (3) and (4), we can write:
ϕ ϕ c υ =   10 ( δ ε υ / δ ε 1 )
or
ϕ = ϕ c υ 10 ( δ ε υ / δ ε 1 ) ,
and
σ 1 / σ 3 = t a n 2 ( π 4 + ϕ 2 ) .
Relationships are correct for 0 ≤ IR ≤ 4 (−1.2 ≤ δ ε υ / δ ε 1 ≤ 0).
In the Cam–clay model (C-C) [3], the stress–dilatancy relationship has the form:
η = M c ( δ ε υ / δ ε q ) ,
where:
M c = 6 s i n ϕ c υ 3 s i n ϕ c υ ,
and for triaxial compression:
σ 1 σ 3 = 3 + 2 η 3 η ,
δ ε υ δ ε q = 3 ( δ ε υ / δ ε 1 ) 3 ( δ ε υ / δ ε 1 ) .
The elastic increment of strains is neglected.
The modified Cam–clay (M-C-C) model [5] stress–dilatancy relationship is:
δ ε υ δ ε q = M c 2 η 2 2 η
or:
η = M c 2 + ( δ ε υ / δ ε q ) 2 ( δ ε υ / δ ε q ) .
Using the frictional state concept, the stress ratio–plastic dilatancy for triaxial compression may be expressed by Equation (11) where:
η = q p = Q A D p ,
and Q = M o α A o , A = β A o , M o = 6 s i n ϕ o / ( 3 s i n ϕ o ) , A o = 1 M o / 3 , D p = δ ε υ p / δ ε q p , and ϕ o is a critical frictional state angle, and α and β are new parameters of soil. For sands, it may be assumed that ϕ o = ϕ c υ [9,10] and for failure and post-failure behavior, α = 0 and β = 1 [10]. Therefore, for failure and post-failure behavior, we can write:
σ 1 σ 3 = 1 + s i n ϕ ° 1 3 ( 3 s i n ϕ ° ) ( δ ε υ / δ ε 1 ) 1 s i n ϕ ° .
Figure 1 shows the stress ratio–strain ratio at failure obtained with the use of the presented relationships for −1.2 ≤ ( δ ε υ / δ ε 1 ) ≤ 0.5. We can see that, for dense sand (dilative behavior), the major stress ratio obtained from the Rowe’s, Bolton’s, and frictional state concept are very similar. The major stress ratios obtained with the use of the C-C and M-C-C models are much higher; hence, this model cannot be used for dense sand.
For loose sand (contractive behavior), the major stress ratio obtained with the use of Rowe’s theory, the C-C and M-C-C models’ relationships are similar. Slightly higher major stress ratio values are obtained with the use of the Bolton and frictional state concept relationships. These relationships are consistent with those reported in the literature, e.g., [11].

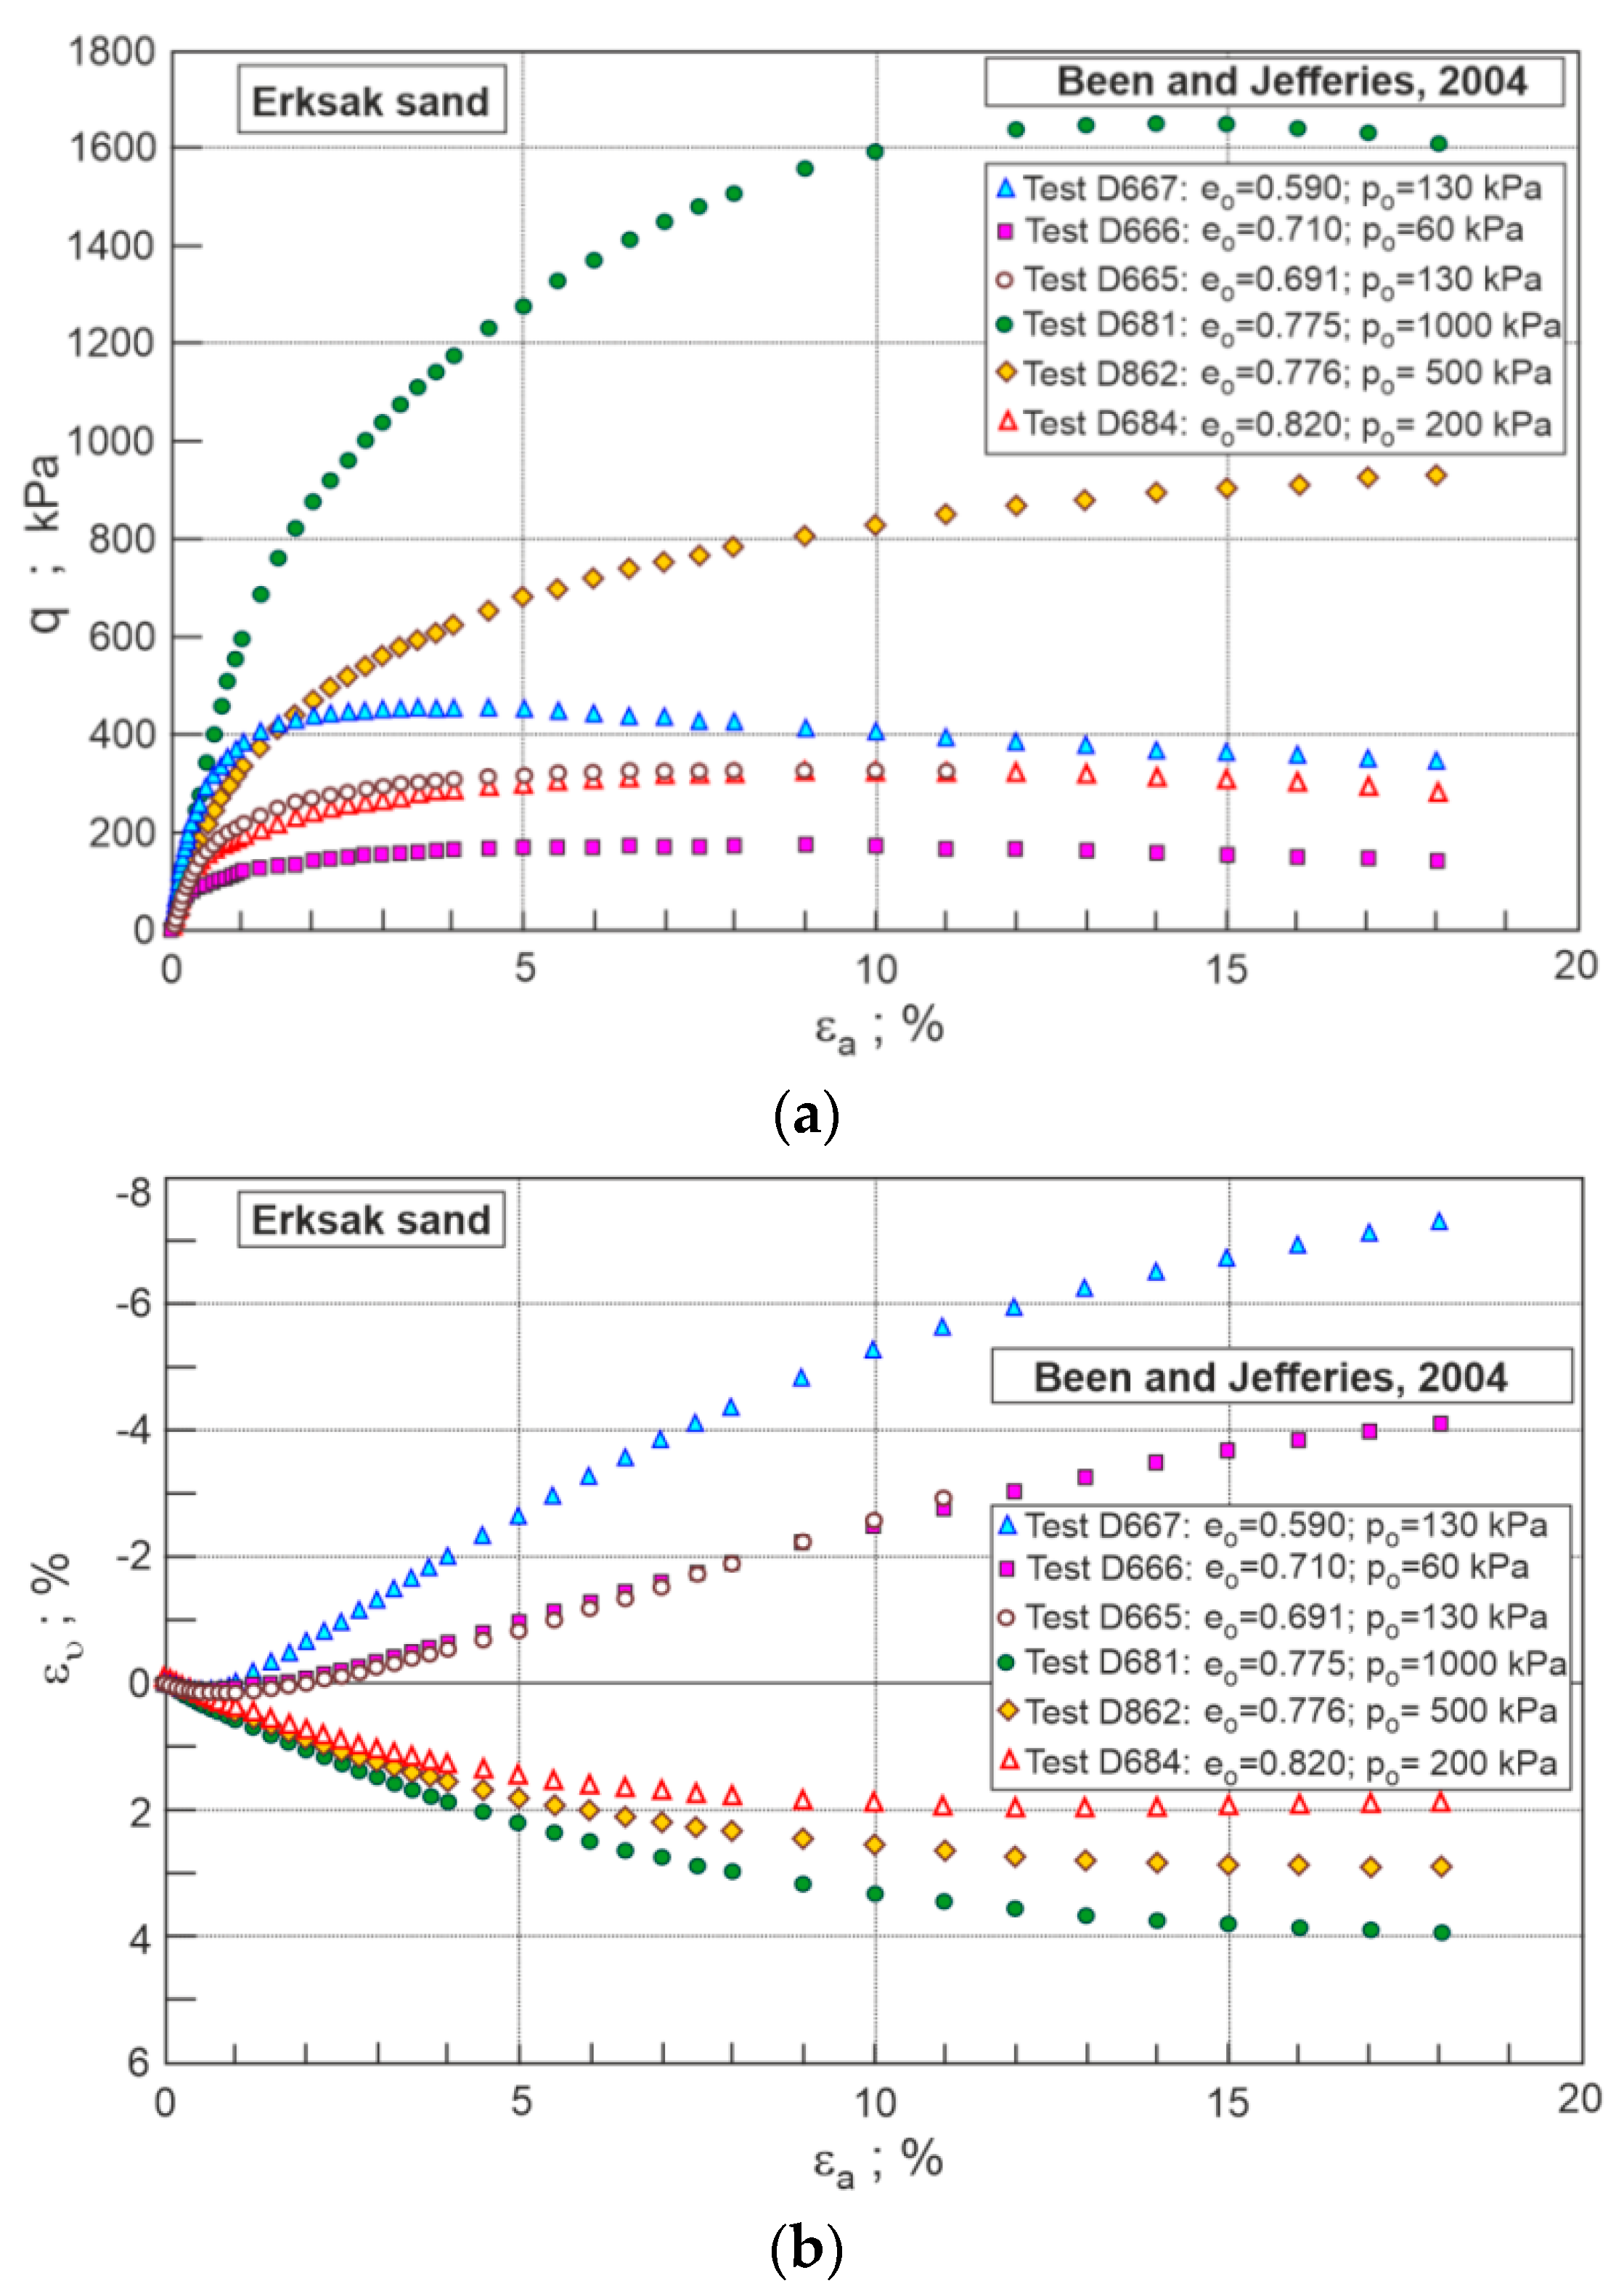
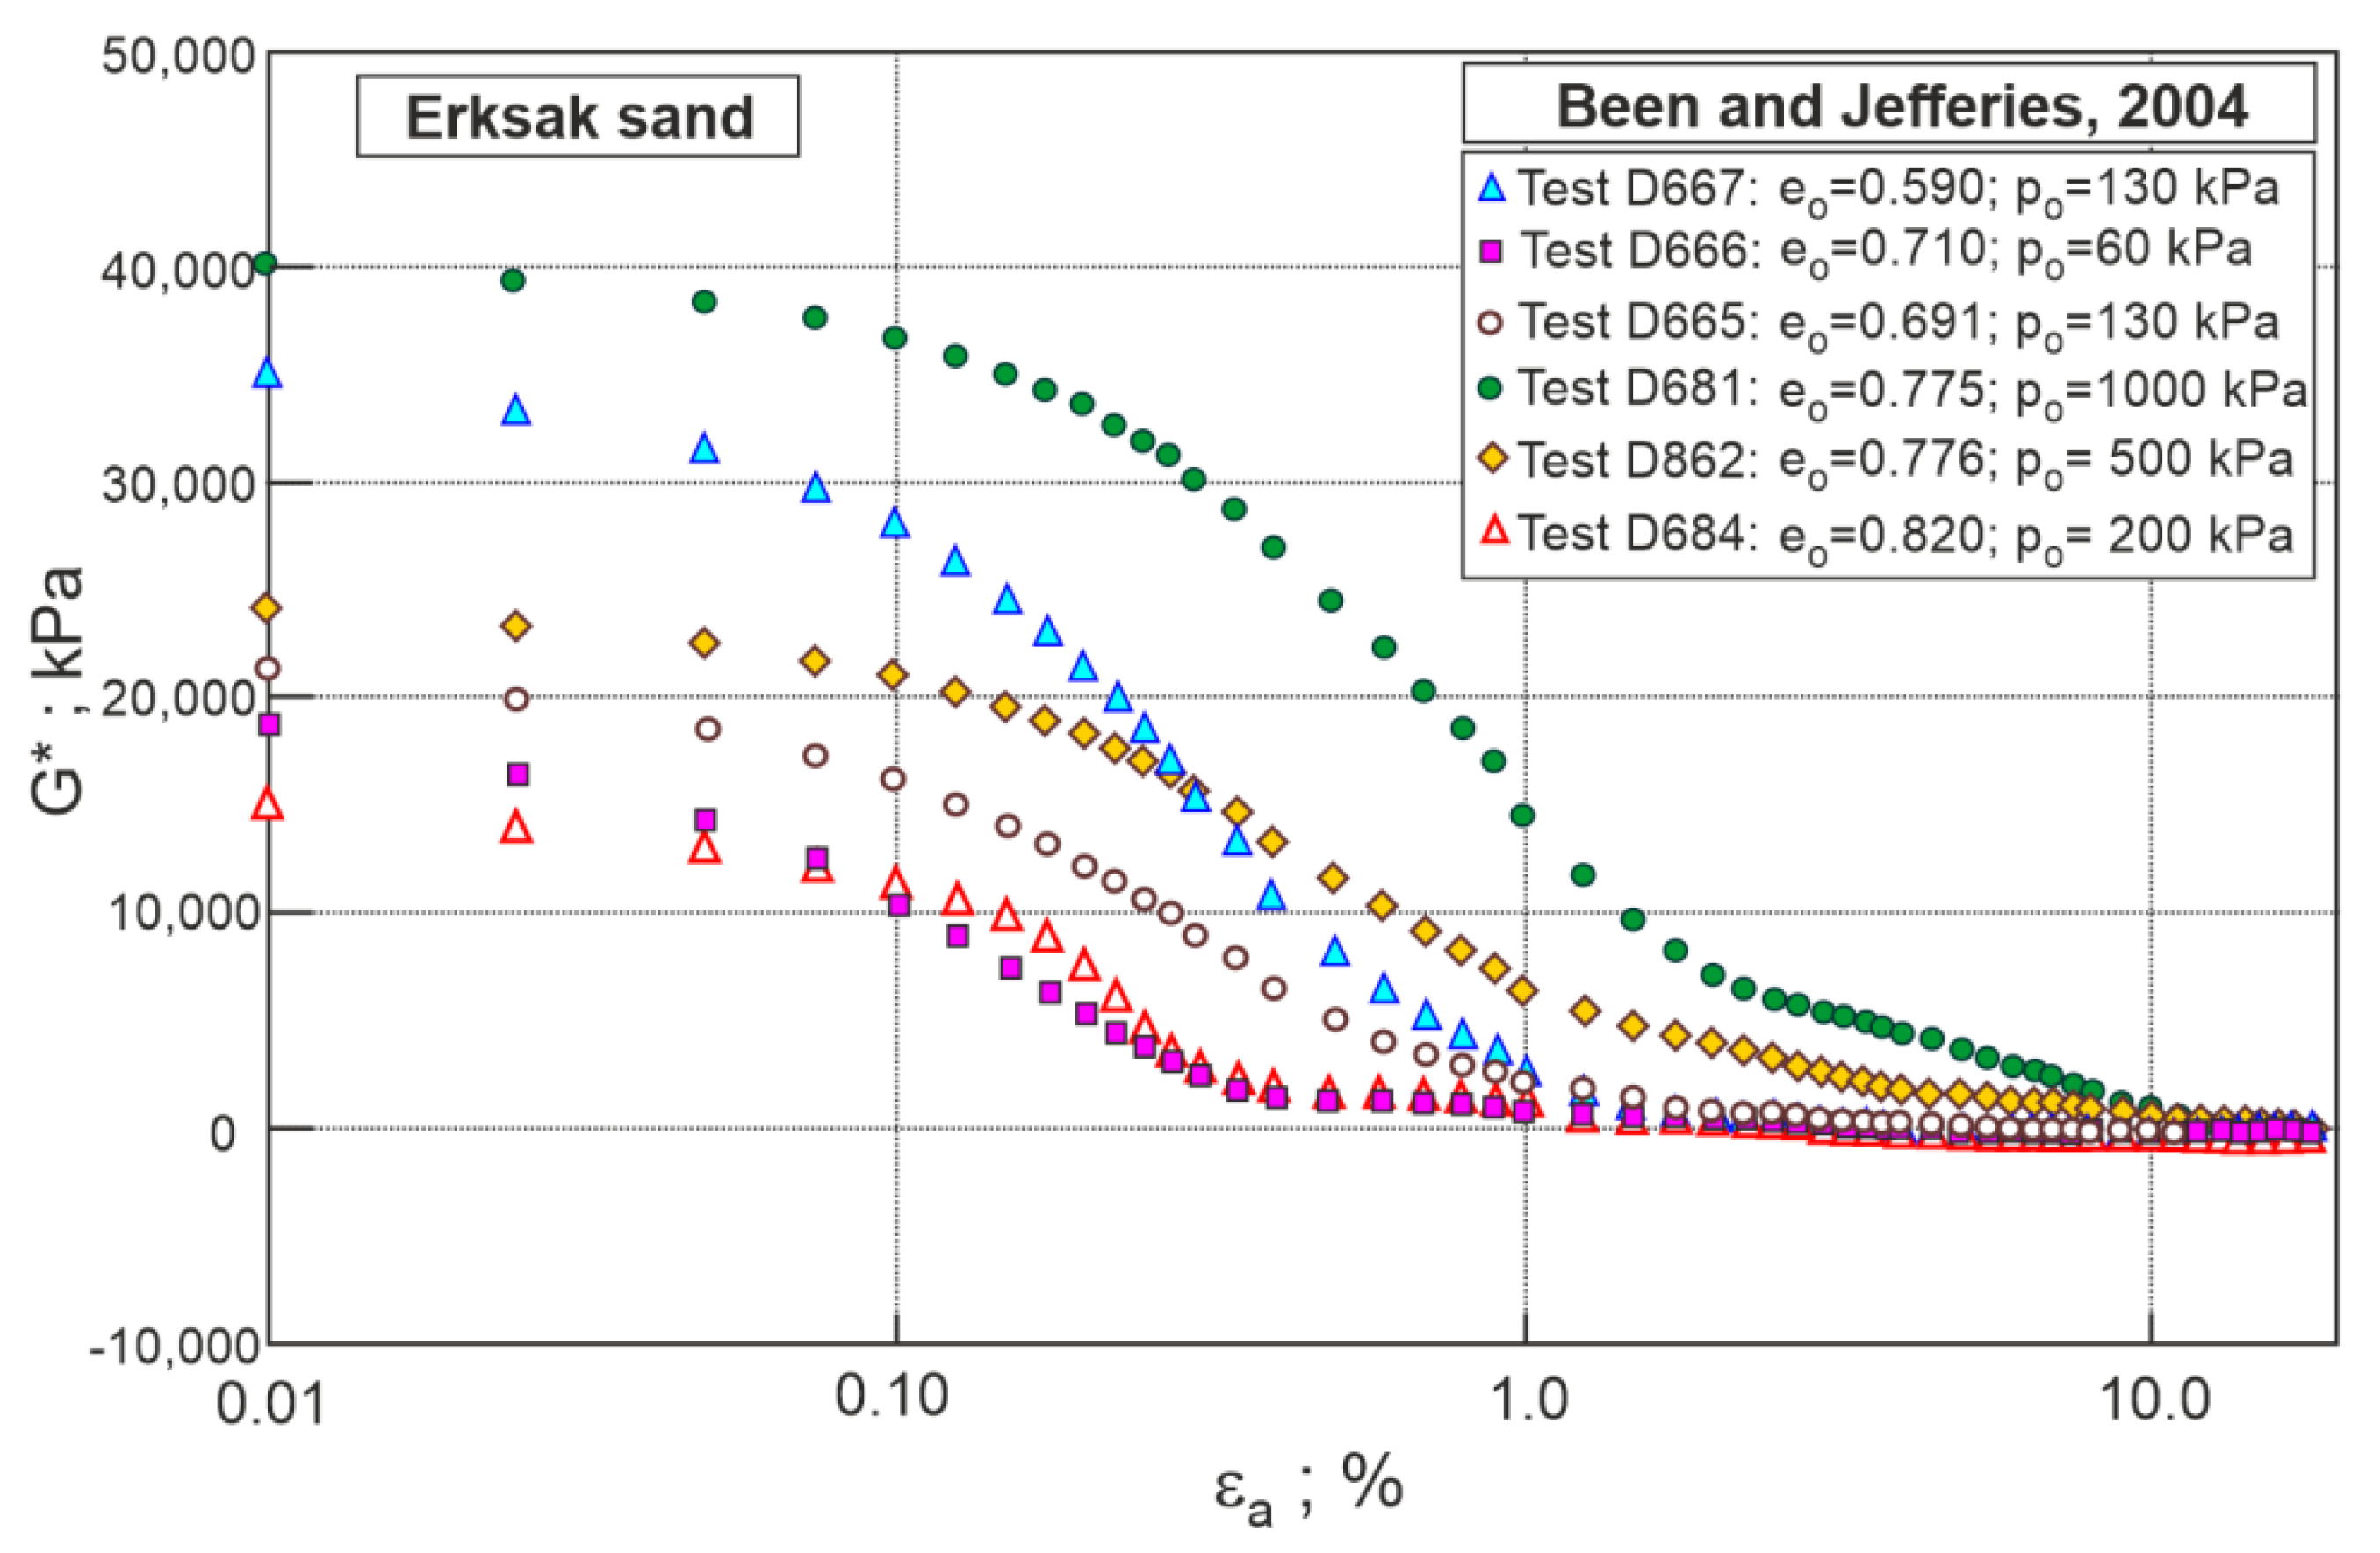
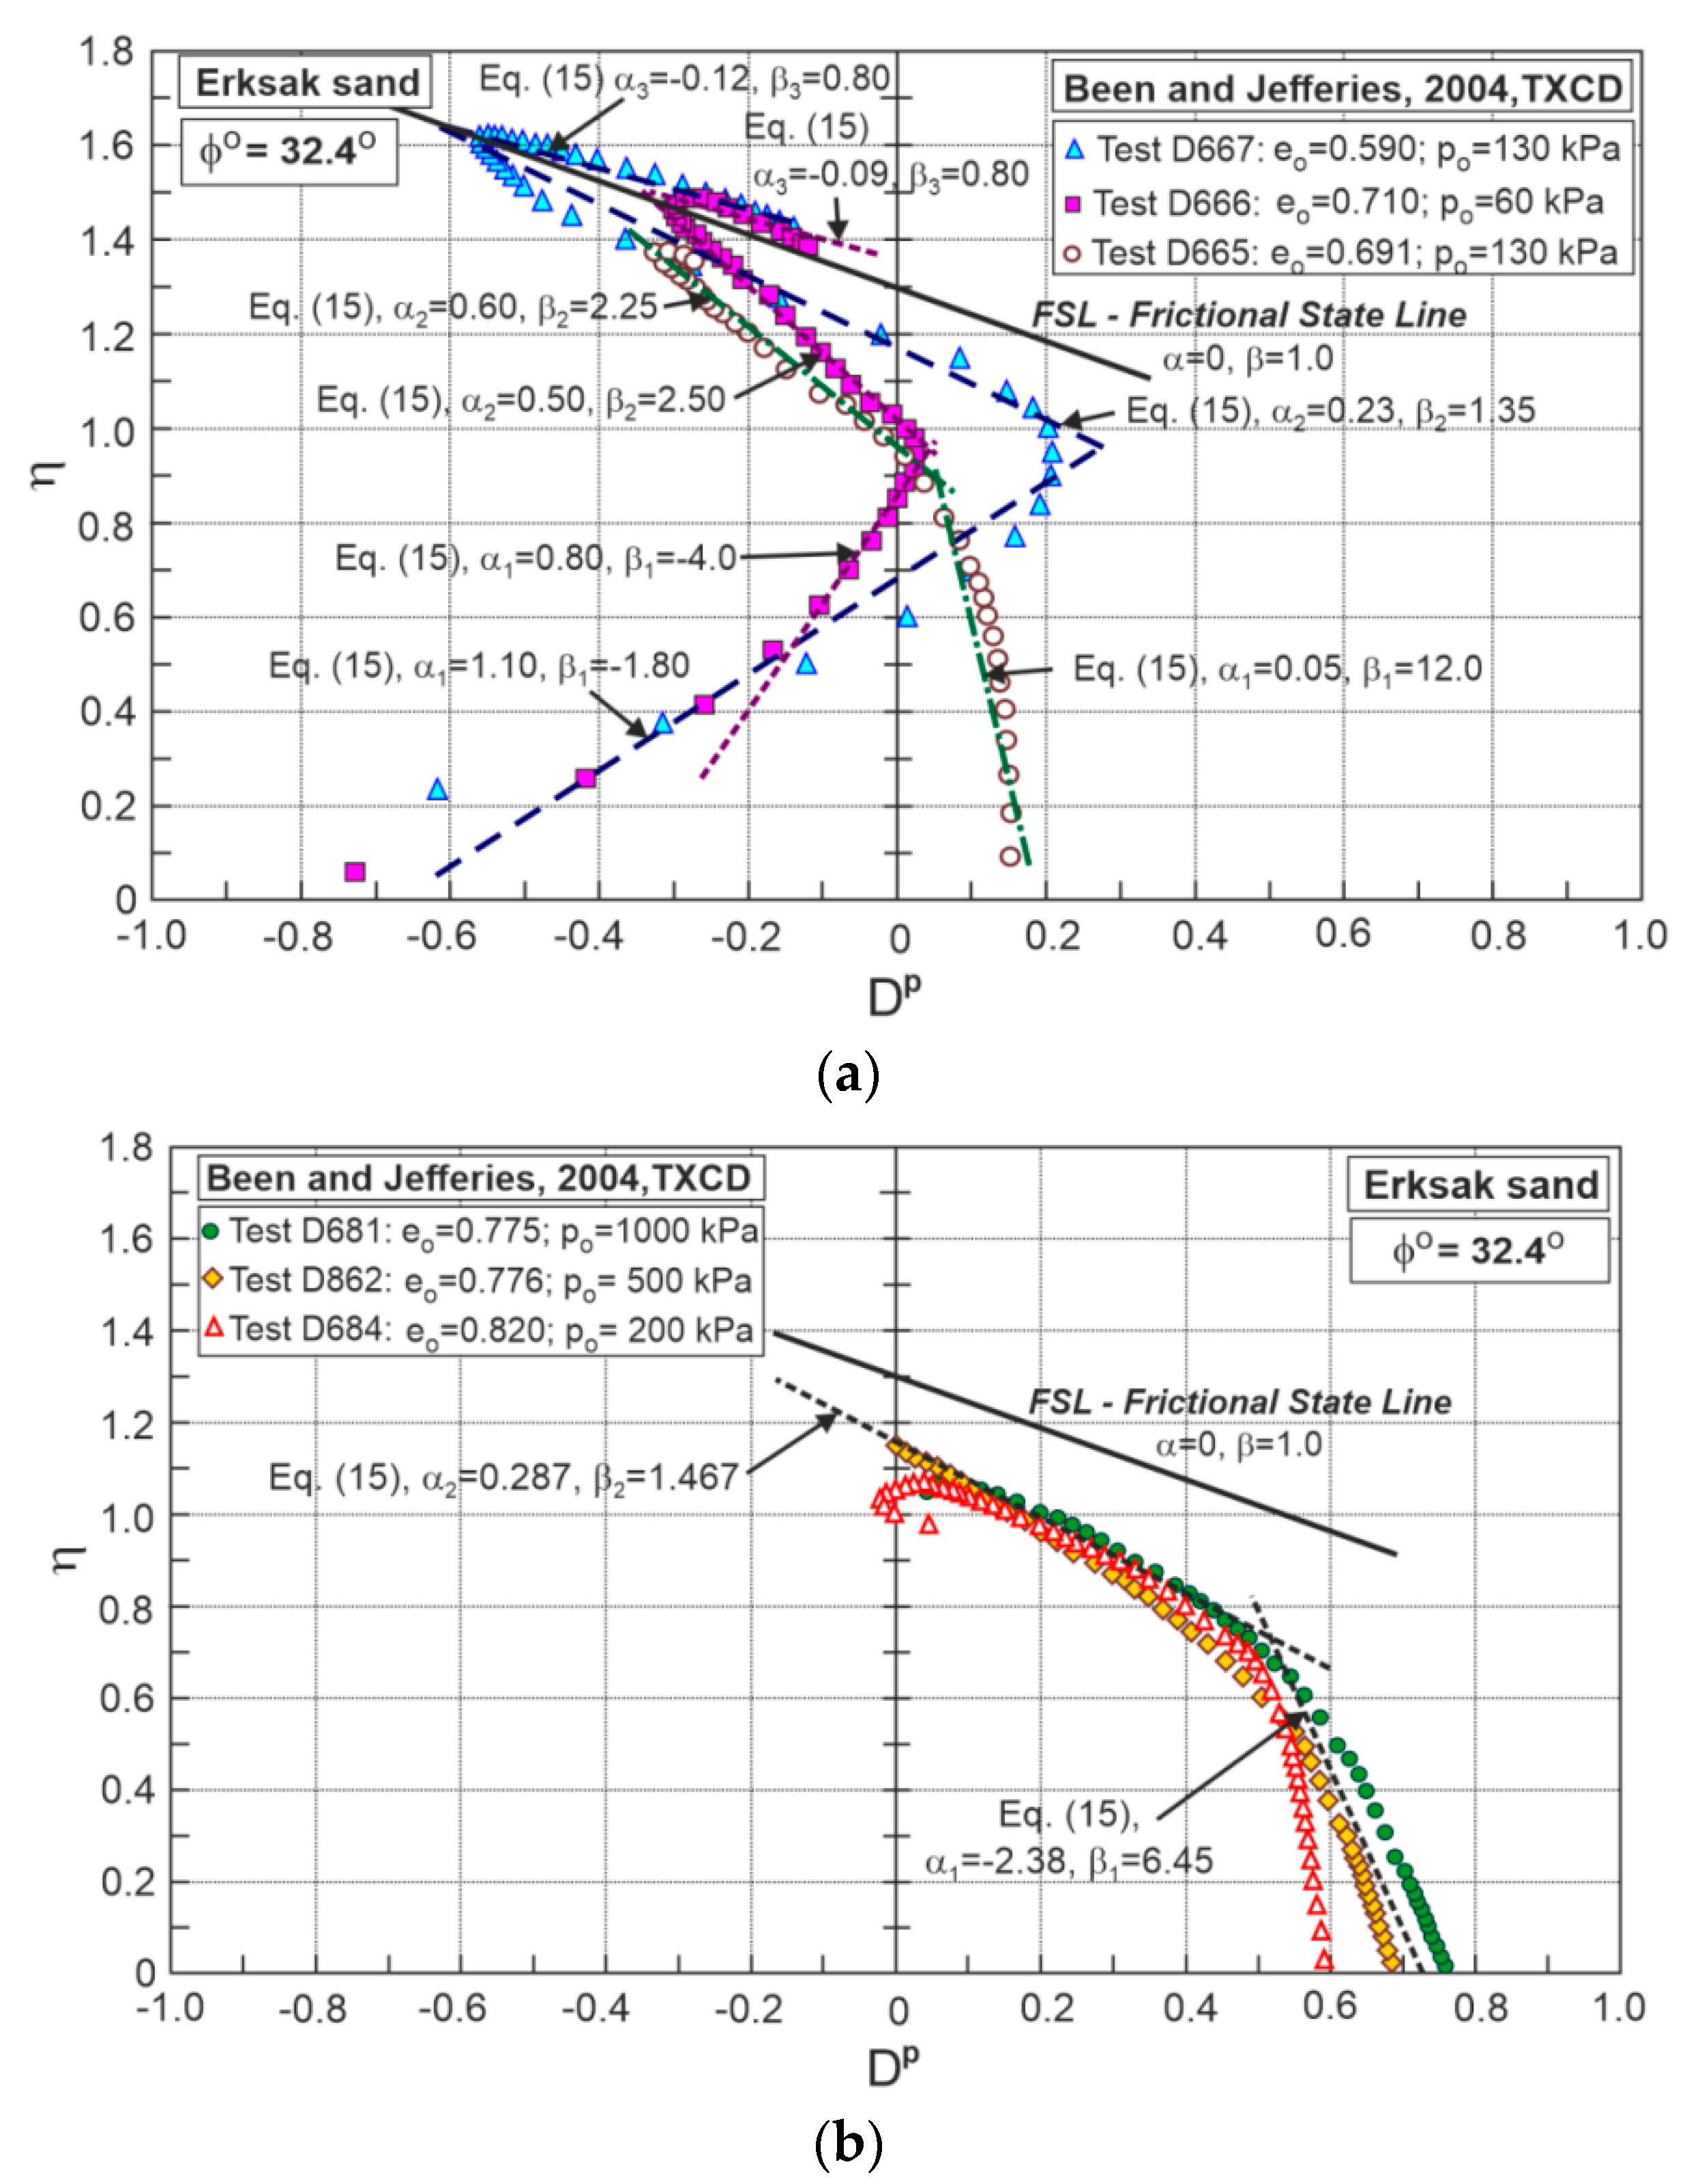
3. Stress–Dilatancy of Erksak Sand

The strength and dilatancy characteristics of Erksak sand were experimentally tested [24,25,26]. Erksak sand is uniform, medium, primarily quartz sand with sub-angular particles. The results of conventional drained triaxial compression tests of Erksak sand in loose and dense states are shown in Figure 2.
To find good quality stress–plastic dilatancy relationships, the experimental curves q ε a and ε υ ε a were sectionally approximated by a high degree of polynomials.
The tangent stiffness shear modulus (G*) was calculated with the use of the following equation:
G * = δ q 3 δ ε q ,
where:
δ ε q = δ ε a 1 3 δ ε υ .  
The change in G* during shear for the analyzed tests is shown in Figure 3.
The values of G* are almost constant for εa < 0.1%. Analyzing the initial stages of shearing and assuming that, for quartz sands, the shear modulus (G) is a function of stress level (p’) and void ratio (e).
G = G o ( 2.97 e ) 2 1 + e ( p p a ) 0.5 .
In this paper, the elastic parameters of Erksak sand Go = 120 kPa and ν = 0.25 are assumed as the values that give the best linear approximations of stress ratio–plastic dilatancy relationships for all stages of shearing.
The bulk modulus (K) can be calculated from the following equation:
K = 2 3   1 + ν 1 2 ν G .
The plastic components of volumetric and shear strain increments are:
δ ε υ p = δ ε υ δ ε υ e ,
δ ε q p = δ ε q δ ε q e ,
where:
δ ε υ e = δ p K ,
δ ε q e = δ q 3 G .
The characteristic stress ratio–plastic dilatancy relationship is shown in Figure 4.
At the initial state (OY1) of shearing sand, the behavior is elastic. Y1 represents the onset of yielding—stage I of shearing. The high volume of plastic dilatancy suddenly appears. Y2 represents the final part of this stage of deformation. At this stage of shearing, the tangent shear modulus (G*) drops quickly, reaching a very small (almost zero) value at Y2. The η D p relationship may be approximated by a straight line defined by ϕ °, α1, and β1. At the next stage of shearing, stage II, the plastic parts of volumetric and shear strain increments are small relative to global ones. The η D p relationship may also be approximated by a straight line defined by ϕ °, α2, and β2. F represents the failure state. At the next stage of shearing, stage III, unstable behavior is observed for dilative sand. If the sample is deformed homogeneously, the η D p relationship represents the frictional state (α3 = 0, β3 = 1.0) and under large deformations εa > 25%, the critical frictional state reaches ( η = M c o ). For various sands, stress levels, and stress paths, the η D p relationship also varies [13,16].
With the use of the frictional state concept, the relationships of stress ratio–plastic dilatancy for various stages of shearing were calculated. At failure, for Erksak sand, the frictional state (α = 0, β = 1) was obtained for ϕ ° = 32.4°. The critical state angles for Erksak sand based on Bishop’s method are 31.6° [24] and 31.7° [27]. Hence, for Erksak sand, ϕ ° is about 0.7° higher than ϕ c υ . For the analyzed tests, the initial states and parameters of α and β are shown in Table 1.
In the first stage of shearing, stress increases quickly, elastic parts of strain increments significantly influence the stress–dilatancy relationship. Therefore, parameters α1 and β1 may be calculated with mistakes. In the second phase of shearing, the parameters α2 and β2 can be defined with greater precision. At the third post-failure phase for most tests, homogeneous deformations are observed with an α parameter that is slightly higher than 0, and a β parameter that is slightly lower than 1.
In Figure 5, the stress ratio–plastic dilatancy relationships for dilative and contractive behavior are shown. The points representing shear failure lie on the frictional state line (FSL, α = 0, β = 1.0).
For contractive behavior, the stress ratio–plastic dilatancy obtained from the frictional state concept is shown for clarity with mean values of α and β.
At the ultimate state, for very loose sand, a constant stress ratio and no volume changes were observed (Figure 2). Therefore, the necessary conditions for the critical state were achieved. However, the obtained stress ratios were significantly smaller than critical stress ratio. In the author’s opinion, very loose sand grains in the assemblage are under unstable conditions, and during shear, they induce additional contraction and reduction of the stress ratio. For the Rowe, Bolton, and C-C and M-C-C models, the relationships are not correct. The frictional state concept can be used to describe these phenomena.
In Figure 6, the stress ratio–plastic dilatancy relationships obtained by Been and Jefferies [24] are shown. The stress ratio–plastic dilatancy relationships obtained with the use of the frictional state concept describe real behavior very well.
Figure 7 shows the relationships between the stress ratio and dilatancy at failure (ηmaxDmin) for Erksak sand obtained using various theories and experiments carried out by Vaid and Sasitharan [26] and Been et al. [28]. All theories approximate the experimental data well.
The maximum stress ratio (ηmax) obtained from the frictional state is very close to Bolton’s [11] and a little lower than Rowe’s [7,8] values.

4. Conclusions

The stress ratio–plastic dilatancy is linear at all phases of shearing and can be described by the critical frictional state angle ϕ ° and parameters α and β of the critical state concept. For dense sand that exhibits the dilative behavior during shearing at failure, the stress ratio–dilatancy is well described by Rowe, Bolton, and frictional state concept relationships. At failure, for dense sand, the purely frictional state (α = 0, β = 1) is reached. The little deviation from the frictional state at post-failure shearing is caused by non-homogeneous deformation of the sand sample. For very loose sand, at the ultimate state, stable conditions are reached, but stress-ratios are significantly smaller than at the critical state. Hence, the critical state parameters cannot be correctly specified from drained triaxial compression tests for Erksak sand. The critical frictional state concept gives new possibilities to describe stress–plastic dilatancy relationships for sands.

Funding

This research received no external funding.

Acknowledgments

This work, conducted at Bialystok University of Technology, Poland, was supported by the Polish Financial Resources on Science (Project No. WZ/WB-IIL/7/2019).

Conflicts of Interest

The author declares no conflict interest.

References

  1. Taylor, D.W. Fundamentals of Soil Mechanics; John Willey and Sons: New York, NY, USA, 1948. [Google Scholar]
  2. Roscoe, K.H.; Schofield, A.N.; Wroth, C.P. On the Yielding of Soil. Gèotechnique 1958, 8, 22–53. [Google Scholar] [CrossRef]
  3. Roscoe, K.H.; Schofield, A.N.; Thurairajah, A. Yielding of Clays in States Wetter Than Critical. Gèotechnique 1963, 13, 211–240. [Google Scholar] [CrossRef]
  4. Schofield, A.N.; Wroth, C.P. Critical State Soil Mechanics; McGraw-Hill: London, UK, 1968. [Google Scholar]
  5. Roscoe, K.H.; Burland, J.B. On the Generalized Stress-Strain Behavior of ‘Wet’ Clay, Engineering Plasticity; Heyman, J., Leckie, F., Eds.; Cambridge University Press: Cambridge, UK, 1968; pp. 535–609. [Google Scholar]
  6. Jefferies, M.G. Nor-Sand: A simple critical state model for sand. Gèotechnique 1993, 43, 91–103. [Google Scholar] [CrossRef]
  7. Rowe, P.W. The stress–dilatancy relation for static equilibrium of an assembly of particles in contact. Proc. R. Soc. Lond. Ser. A Math. Phys. Sci. 1962, 269, 500–527. [Google Scholar]
  8. Rowe, P.W. Theoretical meaning and observed values of deformation parameters for soil. In Proceedings of the Stress-Strain Behaviour of Soils, Roscoe Memorial Symposium, Cambridge, UK, 29–31 March 1971; Parry, R.H.G., Ed.; The Whitefriars Press Ltd.: London, UK, 1972; pp. 143–194. [Google Scholar]
  9. Szypcio, Z. Stress–Dilatancy for soils. Part, I. The frictional state theory. Stud. Geotech. Mech. 2016, 38, 51–57. [Google Scholar] [CrossRef] [Green Version]
  10. Szypcio, Z. Stress–dilatancy for soils. Part II. Experimental validation for triaxial tests. Stud. Geotech. Mech. 2016, 38, 59–65. [Google Scholar] [CrossRef] [Green Version]
  11. Bolton, M.D. The strength and dilatancy of sands. Gèotechnique 1986, 36, 65–78. [Google Scholar] [CrossRef] [Green Version]
  12. Szypcio, Z. Relation between the Friction Angle of Sand at Triaxial Compression and Triaxial Extension and Plane Strain Conditions. Geosciences 2020, 10, 29. [Google Scholar] [CrossRef] [Green Version]
  13. Szypcio, Z. The influence of particle breakage on stress-dilatancy relationship for granular soils. In Proceedings of the 7th International Symposium on Deformation Characteristics of Geomaterials (IS-Glasgow 2019), Glasgow, UK, 26–28 June 2019; Volume 92, pp. 1–5. [Google Scholar] [CrossRef] [Green Version]
  14. Szypcio, Z. Stress–dilatancy of gravel for triaxial compression tests. Ann. Wars. Univ. Life Sci. SGGW Land Reclam. 2018, 50, 119–128. [Google Scholar] [CrossRef]
  15. Dołżyk-Szypcio, K. Stress–dilatancy relationship for railway ballast. Stud. Geotech. Mech. 2018, 40, 79–85. [Google Scholar] [CrossRef] [Green Version]
  16. Dołżyk-Szypcio, K. Stress–strain behavior of Toyoura sand in undrained triaxial compression. In Proceedings of the 7th International Symposium on Deformation Characteristics of Geomaterials (IS-Glasgow 2019), Glasgow, UK, 26–28 June 2019; Volume 92, pp. 1–4. [Google Scholar] [CrossRef] [Green Version]
  17. Rahimi, M. Review of Proposed Stress-dilatancy Relationships and Plastic Potential Functions for Uncemented and Cemented Sands. J. Geol. Res. 2019, 2, 19–34. [Google Scholar] [CrossRef]
  18. De Bono, J.P.; McDowell, G.R. Micromechanics of drained and undrained shearing of compacted and overconsolidated crushable sand. Gèotechnique 2016, 68, 575–589. [Google Scholar] [CrossRef] [Green Version]
  19. Yin, Z.; Chang, G.S. Stress—Dilatancy behavior for sand under loading and unloading conditions. Int. J. Numer. Anal. Meth. Geomech. 2013, 37, 855–870. [Google Scholar] [CrossRef] [Green Version]
  20. Sun, Y.; Xiao, Y. Frictional order plasticity model for granular soils subjected to monotonic triaxial compression. Int. J. Solids Struct. 2017, 118–119, 224–232. [Google Scholar] [CrossRef]
  21. Sun, Y.; Sumelka, W. State dependent frictional plasticity model for the true triaxial behaviour of granular soils. Arch. Mech. 2019, 71, 23–47. [Google Scholar] [CrossRef]
  22. Li, Y.; Sun, Y.; Ju, W. Cyclic fractional Plastic Model for Granular Soils. Front. Built Environ. 2019, 5, 1–9. [Google Scholar] [CrossRef] [Green Version]
  23. Sun, Y.; Gao, Y.; Shen, Y. Mathematical aspect of the state-dependent stress-dilatancy of granular soil under triaxial loading. Gèotechnique 2019, 69, 158–165. [Google Scholar] [CrossRef]
  24. Been, K.; Jefferies, M. Stress-dilatancy in very loose sand. Can. Geotech. J. 2004, 41, 972–989. [Google Scholar] [CrossRef]
  25. Sasitharan, S. Stress Path Dependency of Dilatancy and Stress-Strain Response of Sand. Master’s Thesis, The University of British Columbia, Vancouver, BC, Canada, 1989. [Google Scholar]
  26. Vaid, Y.P.; Sasitharan, S. The strength and dilatancy of sand. Can. Geotech. J. 1992, 29, 522–526. [Google Scholar] [CrossRef]
  27. Ghafghazi, M.; Shuttle, D. Accurate determination of the critical state friction angle from triaxial tests. In Proceedings of the 59th Canadian Geotechnical Conference, Vancouver, BC, Canada, 1–4 October 2006; pp. 278–284. [Google Scholar]
  28. Been, K.; Jefferies, M.G.; Hachey, J.E. The critical state of sand. Gèotechnique 1991, 41, 365–381. [Google Scholar] [CrossRef]
Figure 1. The relationships between the stress ratio and strain ratio for sand at failure: (a) ϕ ° = ϕ c υ = 30 ° ; (b) ϕ ° = ϕ c υ = 36 ° .
Geosciences 10 00353 g001
Figure 2. Triaxial compression test results for Erksak sand: (a) deviator stress–axial strain relationship; (b) volume strain–axial strain relationship.
Geosciences 10 00353 g002
Figure 3. Change of G* during shear.
Geosciences 10 00353 g003
Figure 4. Characteristic relationship between the stress ratio and plastic dilatancy.
Geosciences 10 00353 g004
Figure 5. The relationships between the stress ratio and plastic dilatancy for Erksak sand: (a) dilative behavior; (b) contractive behavior.
Geosciences 10 00353 g005
Figure 6. The relationships between the stress ratio and plastic dilatancy obtained by Been and Jefferies: (a) for dilative behavior; (b) for contractive behavior (adapted from [24]).
Geosciences 10 00353 g006
Figure 7. The relationships between the stress ratio and dilatancy at failure for Erksak sand (adapted from [24]).
Geosciences 10 00353 g007
Table 1. Initial state and frictional state parameters for tests of Erksak sand.
eopoα1β1α2β2α3β3
-kPa------
Dilative behavior
0.5901301.10−1.800.231.35−0.120.80
0.6911300.05 *12.00 *0.602.25--
0.710600.80−4.000.502.50−0.090.80
Mean values0.95−2.900.4432.03−0.1050.80
Contractive behavior
0.7751000−2.155.850.251.40--
0.776500−2.607.050.261.70--
0.820200−7.20 *16.00 *0.351.30--
Mean values−2.386.450.2871.467--
* these values are not included in the calculations of the mean values.

