Abstract
The goal of this research was to characterize the impact of invasive riparian vegetation on burn severity patterns and fluvial topographic change in an urban Mediterranean riverine system (Med-sys) after fire in San Diego, California. We assessed standard post-fire metrics under urban conditions with non-native vegetation and utilized field observations to quantify vegetation and fluvial geomorphic processes. Field observations noted both high vegetation loss in the riparian area and rapidly resprouting invasive grass species such as Arundo donax (Giant Reed) after fire. Satellite-based metrics that represent vegetation biomass underestimated the initial green canopy loss, as did volumetric data derived from three-dimensional terrestrial laser scanning data. Field measurements were limited to a small sample size but demonstrated that the absolute maximum topographic changes were highest in stands of Arundo donax (0.18 to 0.67 m). This work is the first quantification of geomorphic alterations promoted by non-native vegetation after fire and highlights potential grass–fire feedbacks that can contribute to geomorphic disruption. Our results support the need for ground-truthing or higher resolution when using standard satellite-based indices to assess post-fire conditions in urban open spaces, especially when productive invasive vegetation are present, and they also emphasize restoring urban waterways to native vegetation conditions.
1. Introduction
Across the world, wildfires are increasing in frequency and magnitude under a changing climate and increased human interaction, which in turn impacts natural resources, infrastructure, and millions of people [1]. Continuous and extreme landscape conversion due to the expansion of the human population and establishments in southern California (United States) has fragmented chaparral ecosystems and proliferated the Wildland–Urban Interface (WUI). This has increased the potential for ignition and damages to human communities and surrounding ecosystems [2,3]. The magnitude of fire effects on Mediterranean riverine systems is often related to fire frequency, severity, and timing, which are driven by climate conditions, vegetation type, fuel loads, and landscape conditions [4]. The variable hydrologic, geomorphic, and ecosystem responses induced by fire introduce a high degree of uncertainty in modeling and predictions for management.
In Mediterranean systems, it is well documented that wildfire initiates sedimentation and flooding due to the loss of vegetation [5,6], reduced infiltration [7], soil cohesion [8], and soil water repellency [9]. These processes expedite surface runoff and flooding potential [6,10] as well as suspended sediment discharge and sedimentation [11], which often induce significant geomorphic responses such as aggradation, incision, bank widening, channel narrowing, and braiding [12,13]. At excessive levels, sediment and turbidity become pollutants, in comparison to undisturbed watersheds that are adapted to naturally occurring levels [14]. Soil and sediment are composed of a variety of components including organic matter, phosphorus, nitrogen, metals, and other compounds, both natural and anthropogenic, which can travel with soil as it erodes and discharges to surface waters. Heightened sedimentation, total suspended soils, and contaminants within urban waterways can degrade water quality and impair drinking water and recreational water bodies utilized by urban municipalities [14]. Typically, the cyclical nature of sediment supply and storage is dependent on the vegetation density and type, which act as dams that store sediment prior to fire and retain sediment away from water bodies [15]. Thus, the natural mitigation of post-fire sedimentation processes is often the reestablishment of native vegetation cover [16].
Preceding studies have observed that the impact of fire can vary starkly between and within upland and riparian regions even within a single burn area [16,17]. The riparian zone is the vegetated area immediately adjacent to stream channels and serves as corridors for flora and fauna habitat throughout urban systems [18]. The riparian environment is often associated with high relative humidity and low temperatures and is known to naturally act as a fuel break during a wildfire [16]. After fire, native riparian species often exhibit rapid recovery in biomass in comparison to upland chaparral and generally reinstate the geomorphic stability of the channel area [16]. However, climate and anthropogenic alterations such as drought, human ignition sources, vegetation type conversion, and fuel accumulation have transformed many WUI riparian areas, especially in urban rivers, into corridors for fire movement [17,19]. Urbanization contributes to larger dry weather baseflow due to impermeable land cover (“urban drool”), which alters native riparian vegetation density and community structure [20]. Additionally, higher nutrient loads and more frequent flash floods encourage infestations and the rapid settlement of opportunistic and alien vegetation species [21,22,23,24]. The high-density growth created by invasive plant infestations can profoundly alter riverine hydrology and geomorphology [25] and fire behavior and frequency [20,22,26]. For example, the number of fires under 5 km2 in the urban riparian environment has been increasing in southern California since 2002 [27].
The universal infestation of invasive vegetation throughout the stream and river systems of coastal California has arguably instigated a new invasive grass–fire feedback regime within the urban environment [19,26,28]. Yet, further research is needed to describe the impact of invasive species on the distribution of fire and ecosystem recovery throughout the urban landscape to inform management techniques. One invasive vegetation species of particular concern is Arundo donax, which is a large grass species commonly known as a giant reed. Originally introduced to California for erosion control and building material or industrial cellulose [19,29,30], it is ubiquitous in all major coastal watersheds in southern California [26]. Arundo donax thrives in urban channels and waterways, growing in monotypic stands that are highly prone to fire [19,26,27], and it also facilitates lateral bank erosion and sedimentation through undercutting and collapse processes [26,29].
There is a paucity of information on the interactions between upland and riparian vegetation recovery and geomorphology in an urban Mediterranean riverine system (Med-sys) after fire [31], which is necessary for improving predictions of erosional hazards and landscape recovery. This is critical in urban riparian corridors that extend the WUI into human-occupied areas, where less is known about hydrologic and geomorphic processes and the iterative consequences on fire frequency. This is the first study to our knowledge to quantify topographic change in areas with invasive vegetation, which has implications for sediment delivery to urban waterways. We hypothesize that the large accumulation of vegetation biomass or the presence of non-native vegetation will impact vegetation recovery and succession, which will not be adequately represented by standard post-fire tools. Thus, the objectives of this study are to (1) evaluate standard post-fire satellite-based burn severity and vegetation metrics; (2) quantify topographic change and vegetation; and (3) couple vegetation class and with topographic alterations in an urban Med-sys. We document erosion and volumetric vegetation density following fire in the riparian and upland zones through a combination of satellite imagery, topographic surveys, and three-dimensional terrestrial laser scanning (TLS). This research presents new information that can be utilized by water resource managers and engineers to guide decisions to manage urban riverine environments prone to Arundo donax-initiated riparian fires.
2. Materials and Methods
2.1. Study Area and Vegetation Classification
Southern California has a semi-arid, Mediterranean climate, where a prolonged dry season from late spring to late fall is interrupted by a relatively short wet period from December to March [32]. The southern California Mediterranean-type ecosystem is characterized by chaparral shrub and scrub-dominated hillslopes that feed into downslope temperate riparian corridors. Riparian zones starkly differ from the upland vegetation in species composition, functional type, canopy cover, and moisture content [17,31,33]. In our study area, the Del Cerro Fire (June 3–4, 2018) burned a substantial portion of the riparian zone in Alvarado Creek, which is a perennial and channelized tributary of the San Diego River in California. This human-ignited brush fire burned 38 acres in an open space area between a highway and a residential development, and it was fueled primarily by the presence of non-native and highly invasive Arundo donax and Washingtonia spp. (Mexican Fan Palms) (Figure 1). Pre-fire vegetation surveys were not conducted in the area; however, pre-fire observations and burnt remains of Salix spp. (Willows) and Populous spp. (Cottonwoods) were observed sparsely scattered within the study area, suggesting the existence of some native riparian cover prior to the fire.

Figure 1.
Photograph of the study area within the Del Cerro Fire. The image orientation faces northeast from the transect area on the hillslope down toward Alvarado Creek. Both Washingtonia spp. (tall burned trunks in background) and Arundo donax (grass-like vegetation in the left foreground) are visible.
Alvarado Creek follows a step-pool morphology with an average slope of 0.076% along the study area channel reach. The surrounding upland slopes within the study area vary from about 10% to 30%. The site generally contains hard and compacted soil mixed with large cobbles on the upland slopes and sandy riverwash and earth fill material toward the channel area. Alvarado Creek often responds quickly during precipitation events with large streamflows that materialize and recede rapidly. Alvarado Creek enters the study area after flowing 762 m through a natural area from a concrete culvert that routes the creek under the Insterstate-8 Highway. Approximately 122 m from the downstream boundary of the study area, Alvarado Creek is routed into a 9-m wide concrete channel in which it is conveyed to the San Diego River.
The California Department of Forestry and Fire Protection (CalFire) Fire and Resource Assessment Program (FRAP) in cooperation with the California Department of Fish and Wildlife VegCamp program and USDA Forest Service Region 5 Remote Sensing Laboratory (RSL) compiled land cover data available for California into a single statewide dataset. These data span from approximately 1990 to 2014. During this period, the most current, detailed, and consistent data were synthesized into a common classification scheme, the California Wildlife Habitat Relationships (CWHR) system. This vegetation dataset, fveg [34], in coordination with the National Hydrology Dataset [35], was used to classify land types relevant to this study including: (1) riparian, (2) upland, (3) urban, and (4) water. Vegetation-based land cover such as cropland, riparian, and upland area were not predefined by fveg. Thus, vegetated areas categorized in the fveg database by the specific Wildlife Habitat Relationship Name (WHRname) were used to combine the following “riparian” land covers: Valley Foothill Riparian, Fresh Emergent Wetland, Saline Emergent Wetland, Wet Meadow, Desert Wash, Desert Riparian, Marsh, Estuarine, and Riverine. From 2008 to 2010, Cal-IPC mapped Arundo donax and other invasive plant species at high resolution in all coastal watersheds in California from Monterey to San Diego. These data were dissolved, resampled at 30 m resolution, and appended to the fveg classifications. The final land classifications included (1) riparian, (2) upland, (3) urban, (4) water, and (5) invasive plants (Figure 2B). Within the Del Cerro burn scar, the percent invasive, riparian, and upland covers were 8.02%, 37.04%, and 53.09%, respectively. The urban classification comprised of the remaining 1.85% of land cover. Urban and water classifications were omitted from all calculations to reduce noise from non-vegetation features and land classes that were not present.

Figure 2.
Distribution of burn severity (A) and land classifications (B) for the 2018 Del Cerro Fire. Google Earth imagery over the burned areas on (C) December 7, 2017, (D) August 13, 2018, and (E) April 6, 2019. (F) Del Cerro study area transect; the upland and riparian land zones are highlighted in orange and green, respectively. The white dashed line symbolizes the extent of the 62 m transect that was repeatedly surveyed, which covers both upland and riparian area. The monument location is marked by ‘X’. The box highlighted in gray symbolizes the terrestrial laser scanning (TLS) area, which encompasses both the southern upland hillslope and riparian area.
2.2. Precipitation
Precipitation data (15-min intensity; I15) were collected from the Lake Murray site 3892 (approximately 2.9 km from the study site), which is a part of the San Diego County Flood Control District ALERT Flood Warning System, from May 1, 2018 to May 1, 2019. The maximum 15-min intensity for each storm during the study period was associated with NOAA ATLAS 14-point precipitation frequency estimates. Six significant storm events occurred during the 2018–2019 wet season (October–March) following the Del Cerro Fire (Table 1).

Table 1.
Summary of the significant 2018–2019 wet season precipitation events and characteristics (maximum 15-min intensity (I15), recurrence interval, and total).
2.3. Burn Severity and Canopy Metrics
To address the first goal of this study, standard methods were used to characterize the burn severity and canopy of the study area. Collection 1 level 1 data from Landsat 8 Operational Land Imager (OLI) and Thermal Infrared Sensor (TIRS) image data were collected and processed prior to calculating burn severity and vegetation metrics. The Landsat digital number (DN) was converted into a top of atmosphere (TOA) reflectance or the amount of light reflected to the satellite [36], which corrects for atmospheric conditions and the position of the sun, mitigates the effects of light scattering in the atmosphere, and reduces haze wavelength distortion [36]. Atmospheric correction was not required, as the images selected for this study did not contain clouds or any other disturbances. Five Landsat images were acquired and have a spatial resolution of 30 m and temporal resolution or frequency of 32 days (Table 2).
Table 2.
Landsat imagery dates used to derive Normalized Burn Ratio and Normalized Difference Vegetation Index.
The Normalized Burn Ratio (NBR) is an effective measure of burn severity in a variety of landscapes ranging from forest to chaparral [36,37]. This index can be related to the severity of a wildfire on the ecosystem by quantifying the transition from vegetated terrain to dry, ashy soil that is interspersed with blackened vegetation [38]. The NBR is calculated by using the relative difference in reflectance between the Near Infrared (NIR) and Short-Wave Infrared (SWIR) (Equation (1)). Equation (1) is based on the physical properties of vegetation, where green plant growth reflects NIR well, while dry, burned soil reflects highly in the SWIR [38]. NBR is the ratio of the difference in percent reflectance between the two spectra and ranges between –1 and 1. The differenced Normalized Burn Ratio (dNBR) immediately following fire (0-year) was calculated by differencing Landsat Images 1 and 2 (Equation (2); Table 2).
Burn severity is approximated by dNBR through established thresholds that relate the change in reflectance from pre-fire to post-fire conditions, to the surveyed ecological and socio-economic impact of the fire [38,39,40]. We utilized standard burn severity levels established by [38,39] to represent enhanced regrowth (−500 to −101), unburned (−100 to 99), low severity (100 to 269), moderate severity (270 to 659), and high severity (660 to 1300), where the dNBR range was scaled by 103. High dNBR values indicate high severity burn damage, and negative to low values indicate low burn severity to increasing vegetation productivity.
Red and NIR spectrums from Landsat 8 OLI/TIRS were used to estimate plant biomass through the relationship of chlorophyll light absorption for photosynthesis in the red (Red) wavelength and high reflectance in the NIR [41]. The Normalized Difference Vegetation Index (NDVI) is a proxy for the presence of “greenness” or green canopy cover (Equation (3)). NDVI was estimated for each vegetation class for the following five time-points (Table 2): May 16, 2018 (pre-fire), June 21, 2018 (immediately post-fire), July 23, 2018 (one-month post-fire), November 12, 2018 (five-months post-fire), and June 19, 2019 (one-year post-fire). The lower NDVI represents bare soil to sparse vegetation (0.025–0.09) and higher NDVI represents green vegetation (0.25–0.5). The Differenced NDVI (dNDVI) was calculated between time-points to demonstrate spatial and ecological shifts in vegetation distribution and estimate vegetation health through “greenness” (Equation (4)) [42,43]. In forested environments, dNDVI has a weaker relationship with field-based measurements of burn severity than dNBR [38]. However, in [44], it was an effective measure of burn severity in riparian environments and thus included in this study.
To monitor both the immediate and longer-term (1-year) post-fire vegetation trends, the dNDVI for each fire was calculated using pixel-to-pixel analysis between a preceding and subsequent time-point using five Landsat imagery dates (Table 2). Based on dNDVI and in-field observations of vegetation loss observed in [45], we categorized levels of canopy loss (approximated by dNDVI) as unburned (<0.005); low (0.005 to 0.049); moderate (0.05 to 0.199); and high (>0.2).
2.4. Topography and Vegetation Cover Observations
2.4.1. Topographic Surveys
To quantify changes in the fluvial morphology across the upland and riparian zones (objective two), cross-sectional topographic profiles were collected using standard surveying techniques with an auto-level scope and stadia rod. A 62-m transect perpendicular to Alvarado Creek was established on June 29, 2018, within the burned area (Figure 2F). Precipitation events are the main drivers of geomorphic change; thus, we assumed that the landscape immediately following fire, before any precipitation, was representative of pre-fire conditions. The transect ran south to north from a prominent floodplain bench on the upland hillslope, across the riparian zone to another smaller floodplain bench, abutting the fences of a residential area (Figure 2F; white dashed line represents the transect extent). Elevation was recorded every 0.5 m, and all elevations were normalized to a benchmark established by a monument located on the upland bench near the cross-section transect based on the methods described by [46,47]. Four cross-sectional surveys were conducted successively on the same transect before and after major storm events during the period of June 30, 2018 to March 15, 2019 (Table 3).
Table 3.
Cross-section (CS) and vegetation survey dates after the Del Cerro Fire and the associated 2018–2019 precipitation events.
2.4.2. Growth-Form Vegetation Surveys
Field data collection began immediately post-fire on June 29, 2018. The vegetation survey methods followed the Growth Habit Codes and Definitions for the identification of plant growth forms [48]. Vegetation was identified as “present” or “absent” systematically along the transect at 0.5 m intervals. Specifically, Arundo donax presence or absence was also recorded. In the absence of plants, the substrate was categorized by grain size clastic classes, as described in [49]. These data, in conjunction with volumetric measurements of canopy derived from TLS data, were used to quantify and track the vegetative recovery as well as relate vegetation cover to measurements of topographic change described in Section 2.4.3.
2.4.3. Topographic Analysis by Vegetation Cover
Cross-sectional topographic change following storm events after the fire was related to patterns of ground cover by position on the transect. All the channel surveys were normalized to the height of the local benchmarked monument as the datum (0,0). Coupling the topographic relief to vegetation growth form type is especially important for documenting geomorphic change and channel routing within the riparian region and the extent of change in invasive and infested urban areas. The event-based topographic change in height (∆HEvent) between each successional cross-section was calculated by differencing the elevation (meters) at each survey point by the following:
The maximum seasonal change in topography (∆HMaximum) was calculated by differencing the maximum elevation (Hmaximum elevation) by the minimum elevation (Hminimum elevation) at each survey point on the transect for the study period between June 2018 to March 2019:
All ∆HMaximum and ∆HEvent topographic height data were separated by vegetation growth forms or substrate types. A threshold at the 75th percentile of all topographic change measured within a cover class was used to distinguish measurements of significant elevation change for both event-based and maximum seasonal change per substrate or vegetation growth type. The 75th percentile was also established to account for noise in the topographic data such as the misalignment of the multiple cross-sections due to instrument error, sample size (only one cross-section was observed), human error, or environmental factors (i.e., wind, vegetation growth, etc.). The cross-sectional area for the transect extent (Figure 2F; white dashed line) was calculated and compared across all storm events through the end of the wet season (March 2018). Cross-sectional areas were calculated by linearly interpolating all cross-sectional data to a 0.1 m resolution and using a trapezoidal numerical integration.
2.4.4. Point Cloud Processing and Vegetation Volume
Three-dimensional imaging of the area of interest through terrestrial laser scanning (TLS) was used to document fine-scale vegetation density after the fire and the first storm season. Light Distancing and Ranging (LiDAR) is the emission of laser pulses that interact with a surface or object. The scattering or reflection of the laser signal back to the instrument sensor provides a distance and point location (x,y,z) or point cloud. Terrestrial Laser Scanning utilizes LiDAR to acquire high-resolution, ground-based elevation data points, which can be used to estimate topographic and volumetric changes along a surface or complex terrain through repeated scanning over time [50]. A Trimble GX 3D Scanner was used on June 29, 2018, July 23, 2018, September 28, 2018, and January 19, 2019 and a Riegl VZ-400 was used on May 24, 2019 to scan the same 100 square meter area that encompasses the immediate upland area of Alvarado Creek and the southern portion of the riparian area (Figure 2). Point cloud datasets from the scans were processed in Trimble RealWorks Survey and Cloud Compare to identify regions of volumetric density change in vegetation over time.
All scans, in the form of point clouds, were cleaned using the Statistical Outlier Removal tool in Cloud Compare, which uses the average distance of each point to its neighbors. Outlier points were defined as the points over the average distance between k = 10 nearest neighboring points multiplied by one standard deviation (nSigma) [51,52]. The vegetation was separated from the bare ground using the Cloth Simulation Filter (CSF) in Cloud Compare to extract ground from “not ground” points that represent vegetation points under the topmost boundary of the canopy. The CSF uses an algorithm to create a mesh on the underside of a point cloud surface, which is compared to the deformation on the topside of the scan. We defined the terrain relief parameters as a 0.1 m cloth resolution, with 1000 max iterations, and a 0.1 m height threshold for vegetation classification [53].
Each scan was classified into riparian or upland and vegetation or ground for which vegetation volume density [m3 m−2] was calculated. This relative metric was estimated between each scan for upland and riparian land classes. Using the vegetation and ground surface point clouds for each scan generated from the CSF, the average distance from the ground surface and to the top of the vegetation point cloud in the z-direction was calculated along a 0.01 m resolution grid. The gridded vegetation height surface created was used to estimate volume by Reimann sums. Each volume was divided by the confining area to give a relative measurement of vegetation volume per square meter. The confining area was defined as the number of 0.01 m grid pixels populated by either ground or vegetation. Holes in the point cloud data due to shadows were omitted from the volume and confining area calculations. All reported means are accompanied by standard deviations, which are included in the figures as error bars.
2.5. Statistical Analysis
The numeric values of both vegetation indices, dNBR and dNDVI (burn severity and green canopy loss), were compared between time-point conditions by each land class using average values derived across 30 m pixels. Burn severity and canopy loss within all vegetation classes (invasive, riparian, and upland) were compared using unpaired two-tailed t-tests. Our field observations were also analyzed using a two-tailed student’s t-test. To address objective three of this study, the following hypotheses were tested: (1) the difference between the means of topographic elevation change in the upland versus the riparian area; (2) the difference between the means of topographic elevation change by vegetation cover classes; and (3) the difference between the means of volumetric density in the upland and riparian area. The null hypotheses for all t-tests were that the two-population means were equal and rejected if the resulting p-values were less than 0.05. All significant results are defined by p-values less than 0.05.
3. Results
3.1. Satellite-Based Burn Severity and Canopy
We estimated burn severity and vegetation conditions with standard post-fire satellite-based metrics in the riparian and upland zones. The average immediate burn severity (dNBR) in the riparian area was higher (0.26 ± 0.14) than in the upland (0.17 ± 0.12) and invasive areas (0.22 ± 0.16) (Figure 3A). The immediate burn severity of the invasive vegetation was not statistically different from the upland or riparian areas (Table 4). The smallest immediate loss in the green canopy (dNDVI) occurred in the areas with invasive vegetation (0.17 ± 0.09), and the greatest loss in canopy occurred in the upland (0.27 ± 0.12) (Figure 3B; Table 4). The immediate loss in green canopy in the riparian (0.22 ± 0.11) was not statistically different from the invasive vegetation class (Table 4).
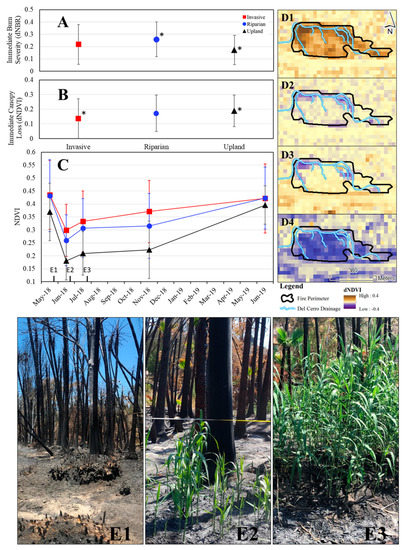
Figure 3.
Temporal and spatial distribution of vegetation indices for the Del Cerro Fire. The 0-year dNBR, a proxy for burn severity (A), 0-year dNDVI, a proxy for canopy loss (B), and the change in canopy over (NDVI) for each vegetation class over one year (C); the * denotes statistically different. The 0-year dNDVI for May 2018 to June 2018 (D1), June 2018 to July 2018 (D2), July 2018 to November 2018 (D3), and November 2018 to June 2019 (D4) distribution of canopy loss between NDVI estimates (C). The Arundo donax regrowth in the riparian area of Alvarado Creek observed on June 8, 2018 (E1), June 29, 2018 (E2), and July 23, 2018 (E3).
Table 4.
p-values and t-statistics for all hypotheses associated with differenced Normalized Difference Vegetation Index (dNDVI) satellite-based data. The shaded p-value denotes rejected null hypotheses (p < 0.05). dNBR: differenced Normalized Burn Ratio.
To track the vegetation canopy over time, NDVI was estimated for five dates after the fire (Figure 3C). The lowest NDVI immediately post-fire (0-year; June 29, 2018) occurred in the upland region (0.18 ± 0.07). Invasive, riparian, and upland classes have distinct differences in canopy for June, July, and November 2018. The NDVI ranged from 0.18 ± 0.07 to 0.44 ± 0.13, where the invasive area had generally larger values than the riparian and upland areas. By June 2019, the NDVI values were statistically similar between all classes (Table 5). The upland class was also the only region with NDVI that reflected bare ground levels at any time-point measured following fire (0.18 ± 0.07). In contrast, the riparian region had the highest immediate burn severity indicated by dNBR (Figure 3A), but the average NDVI values immediately post-fire (0-year; June 21, 2018) did not reduce below the green vegetation threshold of 0.25 (Figure 3C).
Table 5.
p-values and t-statistics for all hypotheses associated with NDVI satellite-based data. The shaded p-value denotes rejected null hypotheses (p < 0.05).
The highest immediate (0-year) dNDVI or loss of green canopy occurred in the upland area (Figure 2B); however, the spatial distribution of canopy loss was highly heterogeneous. The majority of the pixels that detected green canopy loss were located in the upland hillslope directly adjacent to the Alvarado Creek riparian zone (Figure 3D1). There was an abundance of regrowth detected within the riparian and invasive areas along Alvarado Creek from June 2018 to July 2018, before any precipitation occurred (mean dNDVI: −0.04 ± 0.01), in contrast to the minimal change that occurred in the upland region (−0.03 ± −0.01), (Figure 3B,D2,3). From mid-November 2018 to June 2019, five storms occurred and ranged between less than 1- and 1-year return intervals for 15-min intensities (Table 1). Over this time, intensive regrowth was detected in the upland region (−0.17 ± −0.01), which contrasts the relatively low regrowth in the riparian area and minimal growth in the invasive pixels (−0.05 ± −0.01; Figure 3D4).
3.2. Field Observations
Frequent field-based measurements were used to quantify topographic change and volumetric vegetation conditions in the riparian and upland zones. A site visit on June 29, 2018, only 26 days following the Del Cerro Fire, revealed abundant new growth of Arundo donax stalks (Figure 3E1–E3). The field visit was 8 days following the first available Landsat image on June 21, 2018. The field observations recorded significant regrowth in the invasive vegetation that preceded the immediate post-fire image from June 21, 2018.
3.2.1. Coupled Topographic and Vegetation Growth Form Surveys
Four field surveyed cross-sections and vegetation growth form surveys were conducted after the Del Cerro Fire. Cross-section 1 (CS1) was completed on June 30, 2018 (28 days following the fire) and served as the baseline (pre-storm) geomorphic condition (Table 3). The thalweg of Alvarado Creek is visible at approximately 20 m horizontally from the benchmark at the datum (0,0) (Figure 4). Other prominent geomorphic features moving outward in both directions from the main channel of Alvarado Creek were a series of over-banks and secondary channels. The maximum seasonal topographic change (∆HMaximum) is estimated across the transect (Figure 4, in light gray). The 75th percentile change in topographic height or greater is equivalent to 0.403 m (Figure 4, dark gray region). The approximate cross-sectional area measured immediately following fire was the smallest recorded over the entirety of the study period (CS1; 40.5 m2). The area increased after Storm 1 (CS2; 46.2 m2) and expanded even more after Storm 2 to the largest recorded area during CS3 (51.0 m2). The last cross-section (CS4) following Storms 3–9 resulted in a reduction of cross-sectional area similar to the area observed during CS2 (47.6 m2).
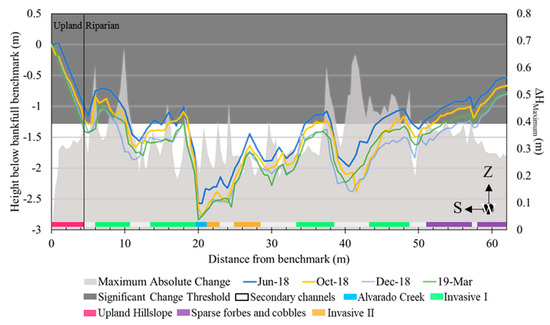
Figure 4.
Four successive cross-sectional surveys looking downstream from June 2018 to March 2019 all normalized to the local benchmark as a datum. The maximum seasonal topographic change (∆HMaximum) at each point on the transect is shown on the secondary axis. The dark gray region represents a 75th percentile change in topographic height or greater. The transition from upland and riparian zones is denoted by the vertical black line, and secondary channels and Alvarado Creek are denoted by white and blue portions of the transect, respectively.
Vegetation and stream channel cross-sectional surveys were conducted simultaneously and revealed six major categories of ground cover present along the transect (Table 6): (1) Upland hillslope, (2) Invasive I (mixture of Arundo donax and Washingtonia spp.), (3) Main channel (defined by wetted perimeter), (4) Forbes and cobbles, (5) Secondary channels, and (6) Invasive II (predominantly Arundo donax). There was no statistically significant change in the presence or absence of vegetation along the transect between surveys except in the upland area. We identified vegetation cover types such as trees (Washingtonia spp.), graminoids (Arundo donax), and forbes (i.e., Erigeron sp., Brassica nigra and Foeniculum sp.). Bare substrates across the transect were identified as sand, cobble, or mixed sand and cobble. Further, all sand substrate was associated with Arundo donax.
Table 6.
Vegetation and substrate cover classes and their descriptions.
The highest mean ∆HMaximum occurred in the secondary channels (no vegetation present; 0.39 ± 0.12 m) and the Invasive II over-banks (0.42 ± 0.09 m), which were not statistically different (Figure 5A; primary axis). The Upland hill slope, Invasive I, and Alvarado Creek cover classes had the lowest mean ∆HMaximum of all the covers throughout the whole wet season. The Gravel and Forbes cover class had a statistically higher mean ∆HMaximum than the aforementioned three cover classes (0.34 ± 0.04 m). Although the secondary channels and Invasive II cover average ∆HMaximum were not statistically different, the Invasive II cover class had 31% higher seasonal maximum topographic changes that were above the 75th percentile threshold than the secondary channels (32%; Figure 5A; secondary axis). All other cover classes experienced some topographic change equal to or above the 75th percentile, except for the Upland hillslope.
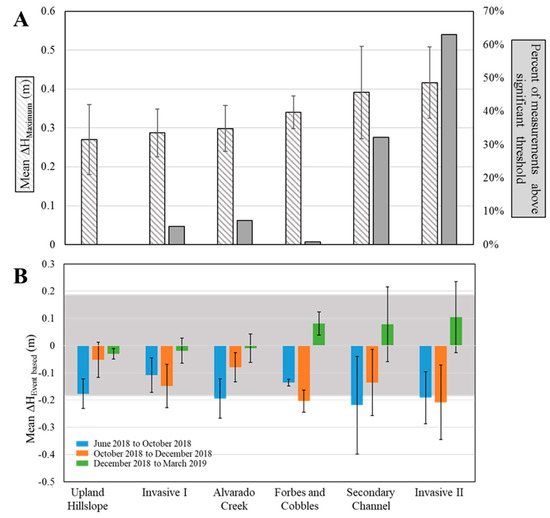
Figure 5.
The average maximum seasonal topographic change is shown by ground cover classification (A). The percent of maximum seasonal topographic change measurements for each ground cover class that was 75th percentile or larger is shown on the secondary axis (dark gray). Event-based topographic change in height (∆HEvent) is shown by ground cover between CS1 and CS2 (June 2018 to October 2018), CS2 and CS3 (October 2018 and December 2018), and CS3 and CS4 (December 2018 to March 2019). Positive mean elevation change represents a gain in elevation, while negative is a loss in elevation from the preceding measurement (B). Gray shading indicates a 75th percentile change.
The highest event-based topographic change (|∆HEvent|) occurred after the first storm (Figure 5B). Positive mean elevation change represents a gain in elevation, while negative is a loss in elevation from the preceding measurement. The highest absolute mean |∆HEvent| across all storms occurred in the secondary channels after Storm 1 (0.22 ± 0.18 m; June 2018 to October 2018; Table 1). The cover classes that also experienced the largest |∆HEvent| after Storm 1 were Alvarado Creek (0.20 ± 0.07 m loss) and the Upland hillslope (0.18 ± 0.05 m loss). The |∆HEvent| for Invasive II after Storm 1 (0.19 ± 0.10 m) and after Storm 2 (October to 2018 to December 2018; 0.21 ± 0.14 m) were not statistically different, and both means were greater than the 75th percentile (Table 7). The cover classes that experienced the greatest |∆HEvent| after Storm 2 were both Forbes and cobbles (0.20 ± 0.04 m) and Invasive I (0.15 ± 0.08 m). The lowest |∆HEvent| means overall were recorded after Storms 3–6 (December 2018 to March 2019). The Upland hillslope, Invasive I, and Alvarado Creek were not significantly different from each other (Table 7), but they all experienced a mean ∆HEvent of −0.02 ± 0.05 m (elevation loss). In contrast, a positive mean ∆HEvent (elevation gain) occurred in three cover classes: Forbes and cobbles, Secondary channels, and Invasive II (0.10 ± 0.11 m).
Table 7.
p-values and t-statistics for all hypotheses associated with topographic analysis data by cover class. The shaded p-value denotes rejected null hypotheses (p < 0.05).
3.2.2. Volumetric Vegetation Density
Volumetric densities were derived from TLS for the following four dates: June 29, 2018, July 23, 2018, January 19, 2019, and May 24, 2019 (Figure 6). The June 2018 and July 2018 TLS were prior to the occurrence of any storms, the January 2019 scan followed Storms 1–6 (data available only in the upland area), and the May 2019 scan followed Storms 7–9. The January 2019 riparian area as well as the upland and riparian area from the September 2018 scan were omitted because of technical failures with the TLS scanner in the field.
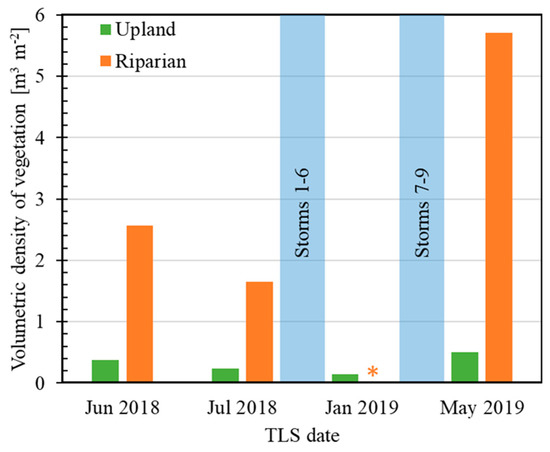
Figure 6.
The volumetric density of vegetation per square meter in both the upland and riparian areas during four scans: June 29, 2018, July 23, 2018, January 19, 2019, and May 24, 2019. The June 2018 and July 2018 scans represent vegetation volumetric density before any storm events. The January 2019 scan represents vegetation after Storms 1–6. The riparian area (*) did not have sufficient scan point density in January 2019. The May 2019 scan represents the vegetation volumetric density approximately one-year post-fire.
The vegetation densities in the riparian areas did not substantially increase immediately following fire. The July 2018 scan revealed a loss of vegetation density in the upland area from 0.38 m3 m−2 (June 2018) to 0.24 m3 m−2. There was also a loss of vegetation density from 2.56 m3 m−2 (June 2018) to 1.66 m3 m−2 (July 2018) in the riparian area. Although the riparian measurement was omitted, the January 2019 upland scan continued to show vegetation density loss in the upland area (0.15 m3 m−2). From January 2019 to May 2019, after Storms 7–9, the upland vegetation more than tripled to 0.51 m3 m−2, and the May 2019 vegetation density in the riparian area was over three times greater than that in July 2018 and twice the vegetation density observed in June 2018.
4. Discussion
4.1. Satellite-Based Metrics after an Urban Fire
As anticipated, rapid vegetation regeneration has significant implications on the accuracy of remote sensing techniques. Contrary to previous literature [24,25,26], traditional satellite-derived metrics did not capture the substantial increase of green canopy in the invasive riparian zone after fire. As hypothesized, the immediate burn severity (dNBR) in the riparian area was statistically higher than the upland area. However, the invasive class was more variable and neither significantly higher nor lower than either the riparian or upland areas. The upland areas experienced the highest canopy loss and expressed the only indications of bare ground. This is expected given the typical sparse distribution of chaparral near urban areas [54,55,56] in comparison to the denser canopy cover of riparian areas [16].
We also observed an unexpected low average immediate canopy loss within the invasive class. There was also an overall disagreement in trends between the two vegetation indices at 0 years due to the rapid regeneration of non-native vegetation within the invasive and riparian regions as well as the theory by which these indices were developed. Burn severity (dNBR) is a measure of the fire impact on the combination of a reduction of mesophyll leaf structure (NIR) and biomass water content (SWIR), while green canopy loss (dNDVI) is a measure of fire impact on the reduction of mesophyll leaf structure (NIR) and greenness as chlorophyll (red) [36]. After the fire, the biomass and water content were low, but the greenness was detectable due to the presence of small and new Arundo donax shoots. As a result, the immediate post-fire measurement of dNDVI underestimated the green canopy loss due to the rapidly resprouting invasive grass species [57]. The deterioration of the relation between dNDVI and dNBR has not been previously reported. Thus, we advocate that the accuracy of remotely sensed immediate canopy loss (dNDVI) in urban Med-sys is reliant on the availability of observations less than a week following the fire. If satellite images are unavailable, metrics derived from satellite data to guide management in post-fire areas should be avoided or should be supplemented with immediate and detailed field surveys to provide a better assessment [58].
In urban riparian areas, the combination of the highly flammable chaparral [33,37,54,59] near extra fuel loads presented by both the woody debris and abundant grasses of riparian-originated fires [59,60] encourage intense and sustained fires that can severely impact vegetation health [36,61,62]. This suggests that the riparian–upland interface is vulnerable during and after urban fires, which is supported by our observations (Section 4.4), where the largest immediate (0-year) dNDVI or loss of green canopy was in the upland area (Figure 3B) adjacent to the riparian zone (Figure 3D1). In general, there was a bias in dNDVI toward new and green regrowth (May 4, 2018 to June 21, 2018), where the canopy loss signal is dampened in the riparian corridor dominated by invasive vegetation. Meanwhile, the relative change in dNDVI by vegetation class from June 21, 2018 to June 19, 2019 revealed a successive order of regrowth in the riparian vegetation before the wet season, followed by regrowth in the upland area after the wet season (Figure 3D1–4). The location in the watershed, time of year, and species type directly impact the water availability within Med-sys for vegetation regrowth patterns in the post-fire environment [62,63]. While metrics based on widely available and cost-effective satellite products such as Landsat are commonly used in post-fire assessment, we advocate caution when applied to urban fires. Higher temporal and spatial resolution monitoring strategies are needed to accurately assess the initial impact of fire as well as the lasting ecological impact in urban fluvial systems vulnerable to invasive vegetation infestation.
4.2. The Role of Vegetation in Upland and Riparian Post-Fire Topographic Change
Immediately after the Del Cerro Fire, burn severity was highest in the riparian area and lowest in the upland areas, which could have implications for geomorphic impacts. Similar to previous works, we observed that vegetation regrowth patterns with respect to burn severity can significantly impact the hydro-geomorphic dynamics in Med-sys [14,16,60,64]. In particular, the impact of Med-sys geomorphology on the spatial distribution of burn severity patterns [60,62] creates a feedback dynamic between geomorphology, vegetation, and fire that is promoted by invasive vegetation infestation. Although only speculated by previous studies [65], we presented the first attempt to quantify post-fire topographic alterations and volumetric vegetation in the urban med-sys with invasive cover in relation to commonly used fire management metrics such as burn severity.
The natural mitigation of fire-driven erosion and the resultant geomorphic change is the reestablishment of native vegetation cover [8]. In Alvarado Creek, very little vegetation recovery occurred on the upland hillslope for most of the observation period (June 2018 to the end March 2019), and the magnitude of seasonal maximum geomorphic change in the upland was 23% lower than in the riparian area. The upland hillslopes were generally steep, 17° to 32°, and they had the potential for erosional hazards after fire [6]. The largest geomorphic response for the upland hillslope was measured following the first post-fire storm event, which was the lowest I15 storm and progressively decreased thereafter. This would be expected, as the geomorphic response to a lower threshold of storm intensity is typically heightened directly following fire [66]; however, the peak I15 during the first storm was much lower (~1.3 mm/h) relative to typical values of saturated hydraulic conductivity for even the finest clast sizes in moderate to low-intensity fires [67]. While the rain gauge utilized during this study was nearby (2.9 km), this distance can introduce uncertainty in the actual rainfall intensity over the study site and consequently the true erosional pressure from the first storm.
Field observations suggested that fine sediments were removed from the hillslope (Figure 7A,B) and rainfall intensity surpassed the saturated hydraulic conductivity of the finest layer of the hillslope. The immediate release of sediment, coupled with an armored hillslope due to deep chaparral root systems [68] and large clast grain structure [69], can result in a smaller sediment discharge, despite intense storms. The removal of the topsoil and ash deposits after the first storm event was documented in the field (Figure 7). The top layer (Figure 7A) was removed after the first storm, leaving only the charred layer that was beneath the initial horizon (Figure 7B) and leaving a coarser grain size distribution. The removal of the smaller grain size clasts without significant rilling likely occurred by erosional mechanisms such as rain splash, overland sheet flow, or thin debris flows [70,71]. These processes can wick away smaller clasts and result in a coarsening of grain sizes in sediments. In our study area, the higher frequency of larger grain sizes may have contributed to the geomorphic stability of the landscape after the first storm event by increasing the resilience to hydraulic shear stress that could initiate particle transport during future precipitation events [72,73]. This phenomenon in conjunction with the low burn severity on the upland hillslopes and intact native chaparral root systems may have fortified the structural integrity of the hillslope from hydraulically initiated erosion events [69].
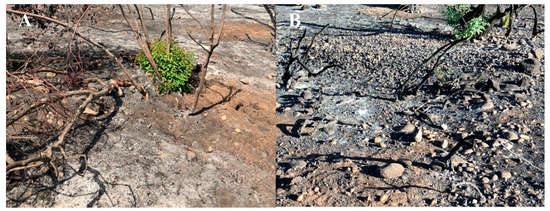
Figure 7.
Topsoil cover on the upland hillslope was photographed on July 23, 2018, before the first storm event (A) and after the first storm on October 31, 2018 (B). The dark appearance is due to the soils being wet from the storm.
We expected the largest topographic change in both the upland and riparian area to occur after the first post-fire storm event. On average, the magnitudes of topographic change between June 2018 to October 2018 and October 2018 to December 2018 for the riparian area were not significantly different, despite the larger average I15 and total rainfall from October 2018 to December 2018. The max I15 of the first storm event in October (1.3 mm h−1) was over 50% less intense than the I15 observed in Storms 2 and 3 (4.1 mm h−1 and 6.3 mm h−1), yet the overall magnitude of topographic change was not significantly different between CS1 and CS2.
Changes in both the riparian and upland areas due to the multiple storms observed from CS1 to CS2 demonstrated a potential “first-flush” (first storm of the season) response. The “first-flush” created the most pronounced erosional and geomorphic changes of the season following the fire despite precipitation intensity. In addition, the overall low intensity of all storms observed through the 2018–2019 wet season suggests that the geomorphic dynamics observed in both the riparian area were driven by pre-existing geomorphology and vegetation regrowth patterns rather than the magnitude of precipitation events [64]. However, the first storm event did not instigate the largest topographic change within the riparian area. In contrast to the upland hillslope, a significant regeneration of vegetation occurred in the riparian area, which was predominantly non-native vegetation species. The elevated topographic variation in the Invasive II cover class over the wet season demonstrated the influence of non-native vegetation on the stability of the fluvial topographic structure in urban riparian environments. This study is limited to topographic changes from one cross-section; however, our approach allowed for more frequent observations of changes with respect to precipitation and highlighted emerging challenges in characterizing and managing urban waterways. We also provided new observations as well as a quantification of topographic changes in post-fire riparian areas with non-native vegetation, which can be used to guide future monitoring and assessment.
4.3. The Impact of Invasive Vegetation on Post-Fire Fluvial Topographic Change in the Urban Riparian Corridor
We expected that the largest topographic change along the transect would coincide with invasive vegetation (including Invasive I). Arundo donax dominated invasive cover (Invasive II) had higher geomorphic variability than a mixed cover of Arundo donax and Washingtonia spp. (Invasive I). Both the greatest event-based topographic elevation loss and gain were recorded in Invasive II. Less is known about the hydrologic and geomorphic processes associated with palm species such as Washingtonia spp. However, the root depth structure and tensile strength of Washingtonia spp. more closely resemble Salix spp. (willows), which is a native Med-sys riparian species that promotes riverine bank stability and topographic recalcitrance [16,31,74]. Although originally introduced to California’s flood plains for erosion control [30], the low tensile strength and shallow root systems of Arundo donax can invoke undercutting, bank collapse, and lateral migration [26,27]. These processes are exacerbated in flashy semi-arid hydrologic systems after fire and can transform riverine hydrology [20,24], and they were observed in Alvarado Creek (Figure 8). The secondary channels parallel to Alvarado Creek were flanked by Arundo donax stands (Invasive II), where the average seasonal maximum topographic change was the highest across all cover classes and statistically indistinguishable (Figure 5B). This suggested that the geomorphic impacts of Arundo donax observed in the riparian area extended beyond the immediate stand of vegetation and into the surrounding upland features [31].
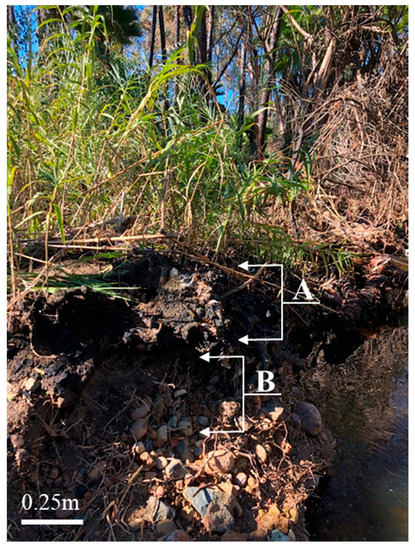
Figure 8.
Undercutting of an Arundo donax stand on the south bank of Alvarado Creek on March 2019. Shallow Arundo donax root structure or rhizome (A) and undercut area with exposed palm roots imbedded in the structure of the streambank wall (B).
Between June 2018 and December 2018, topographic elevation decreased for all cover classes, and the cross-sectional area of Alvarado Creek continually increased from CS1 to CS3. The locations of greatest topographic elevation loss in the riparian environment generally occurred in conduit geomorphic features (such as all secondary channels and the main channel) between CS1 and CS2. This was in addition to the uniform topographic variation of the Forbes and cobbles floodplain area, which was validated by field observations. However, between CS2 and CS3, the greatest topographic elevation loss transitioned to Arundo donax-dominated stands and the outer forb and cobble-dominated floodplain. Whereas, between December 2018 and March 2019 (CS4), the Forbes and cobbles, Secondary channels, and Invasive II cover classes gained topographic elevation. Across the transect, all three cover classes made up the majority of the secondary over-banks and outer floodplain area. This topographic gain in elevation resulted in a reduction in the overall cross-sectional area even after continuous incision from CS1 to CS3. The elevated roughness imposed by Arundo donax infestations decreased hydraulic velocities and flooding, which contributed to sediment deposition and lateral bank movement [75,76]. Consistent with [77], the aggradation of the floodplain, continued channel incision, and obliteration of step-pool morphology observed during this study may also contribute to the sustained topographic change in the riparian area surrounding Alvarado Creek (Figure 9). The elevation disparity between the main channel of Alvarado Creek and the surrounding floodplain may promote the desiccation of the riparian area due to a lowered water table, which reduces the available water supply in the floodplain [78,79]. This is exacerbated by the extreme demand on water resources by Arundo donax stands [80,81] further contributing to the aridification of the riparian environment and promoting the grass–fire feedback [24].
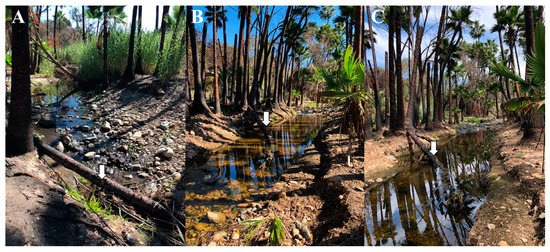
Figure 9.
The incision of Alvarado Creek was documented through photographs for three time-points: (A) October 20, 2018—following Storm 1, (B) January 19, 2019—following Storms 2–6, and (C) March 12, 2019—following Storms 6–9. All three photographs were taken looking upstream, and a fallen palm tree is used as a landmark for comparison between photographs.
4.4. Volumetric Vegetation Density after Fire
Vegetation densities approximated by TLS in the riparian areas did not substantially increase immediately following fire. This was contrary to the observed rapid regrowth of Arundo donax around Alvarado Creek (Figure 3E1–E3) as well as the NDVI (Figure 3C). The volumetric vegetation density derived from the TLS decreased by 35% in the riparian area and 37% in the upland area from June 2018 to July 2018. Instead of capturing the rapid regrowth of Arundo donax shoots, which is proportionally a very small component of the total riparian volume, these data captured secondary burn severity impacts. In addition to tree death, secondary impacts include leaf fall and branch decomposition of fire-damaged trees within the riparian region [82].
A similar relationship was observed in the upland area, where the volumetric density of vegetation decreased from June 2018 to January 2019. These results contradicted the satellite-based NDVI (Figure 3C) as well as photographic evidence of scattered chaparral resprouting as early as July 2018. In this study, seasonal leaf fall and senescence played a minor role in the lower vegetation density. The structural loss of the chaparral through the continued decomposition of vegetation material due to char and fire damage contributed to a net coverage loss by volume throughout the first six months following the fire, despite the vegetative volume added by resprouting chaparral [82,83,84]. The structural information of vegetation provided by TLS data can link vegetation analysis by satellite remote sensing to the geomorphology of Med-sys following fire. However, there are also potential errors in this type of calculation such as the interpolation of the mesh in areas of low point density (e.g., LiDAR shadow) and the bias toward surficial canopy cover. Superficial canopy cover may not provide information about vegetation densities across multi-level canopies such as those present in the riparian area. Future calculations of volumetric densities in the riparian environment should incorporate vertically stratified canopy classes from the basal ground cover to the mid-level canopy of immature trees and shrubs to the upper canopy of mature tree cover [84]. For example, as Arundo donax matures after fire, it begins to dominate the mid to upper canopy, reaching approximately 6 m high at full maturity [30,77].
5. Conclusions
Our results (1) support the need for ground-truthing or higher resolution when using standard satellite-based indices to assess the burn severity of a managed open-space area, especially when highly productive invasive species such as Arundo donax are present and (2) emphasizes the need to restore urban waterways to native vegetation conditions. While the containment-type management strategies for Arundo donax as presented in the Regional Implementation for San Diego County may mitigate the spatial spread of Arundo donax, the extreme fire and geomorphic hazards associated with this invasive vegetation often found in Med-sys WUIs may not be thoroughly addressed [84]. Prioritization of Arundo donax eradication, although challenging, would more effectively mitigate the flooding, fire, and geomorphic hazards that we have observed as being propagated by its presence. The Del Cerro Fire provided a unique opportunity to quantify and evaluate the impact of invasive vegetation regrowth on the recovery and stability of an urban channel. There were limitations inherent in our field methodologies; however, through a combination of satellite imagery, precipitation analysis, topographic surveys, and three-dimensional terrestrial laser scanning (TLS), we quantified coupled the vegetation and geomorphic dynamics present during the recovery of an urban Med-sys throughout the first year after fire. Our results supported previous speculations [17,25,26] and suggested that the pre-fire vegetation structure, burn severity, and regrowth patterns strongly influenced the geomorphic responses observed after fire. We applied TLS to document the morphological dynamics of the land surface terrain and the quantification of volumetric change of vegetation biomass and growth forms. In contrast to the rapid increase of healthy vegetation captured by satellite, the TLS data highlighted a decrease of vegetation cover due to secondary burn severity impacts such as leaf fall, branch decomposition, and tree death in both the upland and riparian areas. Such results provided evidence of the dynamic structural changes that occur in vegetation in both the upland and riparian regions of Med-sys independent of regrowth patterns and suggested that remotely sensed data may be biased by the upper canopy condition. The presence of Arundo donax in the lower canopy significantly increased channel instability in the riparian region and encouraged the deposition of sediments in the floodplain (accretion), which can promote riparian desiccation and fire risk.
The presence of Arundo donax had a significant impact on the magnitude of topographic response to storm events after fire and encouraged a geomorphological regime that may promote riparian desiccation and fire recurrence. Management efforts should focus on the early detection and eradication of exotic plants that can contribute to the destruction of natural med-sys step-pool structures, elevated sedimentation, and increased fire risk. This work builds upon our current knowledge of wildfire and recovery processes by providing an integrated procedure to understand post-fire mechanisms and anthropogenic feedbacks that may occur in urban Mediterranean riverine systems [84]. As this is a novel case study approach, we recommend that future investigations expand monitoring to represent variable landscape conditions and geomorphic processes within the burned area to further elucidate invasive vegetation-driven erosional pathways after fire in urban areas. This research provides new information on spatial variability in burn severity, vegetation regrowth, and fluvial geomorphic hazards that should be considered by resource managers and engineers to inform management decisions in urban riverine environments prone to Arundo donax-initiated riparian fires.
Author Contributions
Conceptualization, L.E.H.M. and A.M.K.; methodology, L.E.H.M. and A.M.K.; formal analysis, L.E.H.M.; resources, A.M.K.; writing—review and editing, L.E.H.M. and A.M.K.; visualization, L.E.H.M.; supervision, A.M.K.; project administration, A.M.K.; funding acquisition, L.E.H.M. and A.M.K. All authors have read and agreed to the published version of the manuscript.
Funding
This material is based upon work supported by the National Science Foundation CAREER Program under Grant No. 1848577 and the California State University (CSU) CSU Council on Ocean Affairs, Science & Technology (COAST) Rapid Response Funding Program Award #COAST-RR-2017-04 and Graduate Student Research Award #CSUCOAST-MATLAU-SDSU-AY1718.
Acknowledgments
The work included in this paper could not have been achieved without the hard-working volunteers and committed students of the Disturbance Hydrology Lab at San Diego State University, including Danielle Hunt, Kelly Flint, Jack Mikesell, Quinn Alkin, and Kyler Stevenson. We also thank four anonymous reviewers and the editors for their review of our work.
Conflicts of Interest
The authors declare no conflict of interest. The funders had no role in the design of the study; in the collection, analyses, or interpretation of data; in the writing of the manuscript, or in the decision to publish the results.
References
- Kinoshita, A.M.; Chin, A.; Simon, G.L.; Briles, C.; Hogue, T.S.; O’Dowd, A.P.; Gerlak, A.K.; Albornoz, A.U. Wildfire, water, and society: Toward integrative research in the “Anthropocene”. Anthropocene 2016, 16, 16–27. [Google Scholar] [CrossRef]
- Syphard, A.D.; Radeloff, V.C.; Keeley, J.E.; Hawbaker, T.J.; Clayton, M.K.; Stewart, S.I.; Hammer, R.B. Human Influence on California Fire Regimes. Ecol. Appl. 2007, 17, 1388–1402. [Google Scholar] [CrossRef] [PubMed]
- Syphard, A.D.; Brennan, T.J.; Keeley, J.E. Chaparral Landscape Conversion in Southern California. In Valuing Chaparral; Underwood, E.C., Safford, H.D., Molinari, N.A., Keeley, J.E., Eds.; Springer Series on Environmental Management; Springer International Publishing: Cham, Switzerland, 2018; pp. 323–346. ISBN 978-3-319-68302-7. [Google Scholar]
- Pyne, S.J.; Andrews, P.L.; Laven, R.D. Introduction to Wildfire, 2nd ed.; John Wiley & Sons: New York, NY, USA, 1996; ISBN 978-0471549130. [Google Scholar]
- Kraebel, C.J. The La Crescenta flood. Am. For. 1934, 40, 286–287. [Google Scholar]
- Moody, J.A.; Martin, D.A.; Haire, S.L.; Kinner, D.A. Linking runoff response to burn severity after a wildfire. Hydrol. Process. 2008, 22, 2063–2074. [Google Scholar] [CrossRef]
- Moody, J.A.; Shakesby, R.A.; Robichaud, P.R.; Cannon, S.H.; Martin, D.A. Current research issues related to post-wildfire runoff and erosion processes. Earth Sci. Rev. 2013, 122, 10–37. [Google Scholar] [CrossRef]
- Robichaud, P.R. Fire effects on infiltration rates after prescribed fire in Northern Rocky Mountain forests, USA. J. Hydrol. 2000, 231–232, 220–229. [Google Scholar] [CrossRef]
- Letey, J. Causes and consequences of fire-induced soil water repellency. Hydrol. Process. 2001, 15, 2867–2875. [Google Scholar] [CrossRef]
- Rulli, M.C.; Rosso, R. Hydrologic response of upland catchments to wildfires. Adv. Water Resour. 2007, 30, 2072–2086. [Google Scholar] [CrossRef]
- DeBano, L.F.; Neary, D.G.; Ffolliott, P.F. Fire Effects on Ecosystems; John Wiley & Sons: New York, NY, USA, 1998; ISBN 978-0-471-16356-5. [Google Scholar]
- Syvitski, J.P.M.; Peckham, S.D.; Hilberman, R.; Mulder, T. Predicting the terrestrial flux of sediment to the global ocean: A planetary perspective. Sediment. Geol. 2003, 162, 5–24. [Google Scholar] [CrossRef]
- Chin, A.; Solverson, A.P.; O’Dowd, A.P.; Florsheim, J.L.; Kinoshita, A.M.; Nourbakhshbeidokhti, S.; Sellers, S.M.; Tyner, L.; Gidley, R. Interacting geomorphic and ecological response of step-pool streams after wildfire. GSA Bull. 2019, 131, 1480–1500. [Google Scholar] [CrossRef]
- U.S. Environmental Protection Agency. Environmental Impact and Benefits Assessment for Final Effluent Guidelines and Standards for the Construction and Development Category; U.S. Environmental Protection Agency: Washington, DC, USA, 2009; p. 374.
- Lamb, M.P.; Scheingross, J.S.; Amidon, W.H.; Swanson, E.; Limaye, A. A model for fire-induced sediment yield by dry ravel in steep landscapes. J. Geophys. Res. Earth Surf. 2011, 116. [Google Scholar] [CrossRef]
- Robichaud, P.R.; Lewis, S.A.; Brown, R.E.; Ashmun, L.E. Emergency Post-Fire Rehabilitation Treatment Effects on Burned Area Ecology and Long-Term Restoration. Fire Ecol. 2009, 5, 115–128. [Google Scholar] [CrossRef]
- Dwire, K.A.; Kauffman, J.B. Fire and riparian ecosystems in landscapes of the western USA. For. Ecol. Manag. 2003, 178, 61–74. [Google Scholar] [CrossRef]
- Pettit, N.E.; Naiman, R.J. Fire in the Riparian Zone: Characteristics and Ecological Consequences. Ecosystems 2007, 10, 673–687. [Google Scholar] [CrossRef]
- National Research Council. Riparian Areas: Functions and Strategies for Management; National Academies Press: Washington, DC, USA, 2002; ISBN 978-0-309-16977-6. [Google Scholar]
- Coffman, G.C.; Ambrose, R.F.; Rundel, P.W. Wildfire promotes dominance of invasive giant reed (Arundo donax) in riparian ecosystems. Biol. Invasions 2010, 12, 2723–2734. [Google Scholar] [CrossRef]
- White, M.D.; Greer, K.A. The effects of watershed urbanization on the stream hydrology and riparian vegetation of Los Peñasquitos Creek, California. Landsc. Urban Plan. 2006, 74, 125–138. [Google Scholar] [CrossRef]
- D’Antonio, C.M. Fire, plant invasions, and global changes. In Invasive Species in a Changing World, 2nd ed.; Island Press: Washington, DC, USA, 2000; pp. 65–93. ISBN 78-1559637824. [Google Scholar]
- Coffman, G.C. Factors Influencing Invasion of Giant Reed (Arundo donax) in Riparian Ecosystems of Mediterranean-type Climate Regions. Ph.D. Thesis, University of California, Los Angeles, CA, USA, 2007. [Google Scholar]
- Godefroid, S.; Koedam, N. Urban plant species patterns are highly driven by density and function of built-up areas. Landsc. Ecol 2007, 22, 1227–1239. [Google Scholar] [CrossRef]
- Aronson, M.F.; Lepczyk, C.A.; Evans, K.L.; Goddard, M.A.; Lerman, S.B.; MacIvor, J.S.; Nilon, C.H.; Vargo, T. Biodiversity in the city: Key challenges for urban green space management. Front. Ecol. Environ. 2017, 15, 189–196. [Google Scholar] [CrossRef]
- Stover, J.E.; Keller, E.A.; Dudley, T.L.; Langendoen, E.J. Fluvial Geomorphology, Root Distribution, and Tensile Strength of the Invasive Giant Reed, Arundo Donax and Its Role on Stream Bank Stability in the Santa Clara River, Southern California. Geosciences 2018, 8, 304. [Google Scholar] [CrossRef]
- Giessow, J.; Casanova, J.; Leclerc, R.; MacArthur, R.; Fleming, G. Arundo donax (Giant Reed): Distribution and Impact Report State Water Resources Control Board California Invasive Plant Council (Cal-IPC). 2011, pp. 1–240. Available online: https://www.cal-ipc.org/solutions/research/arundo-report/ (accessed on 9 August 2020).
- CALFIRE-FRAP. Fire Perimeter Dataset. Available online: https://frap.fire.ca.gov/ (accessed on 1 January 2020).
- Cushman, J.H.; Gaffney, K.A. Community-level consequences of invasion: Impacts of exotic clonal plants on riparian vegetation. Biol. Invasions 2010, 12, 2765–2776. [Google Scholar] [CrossRef]
- Perdue, R.E. Arundo donax—Source of musical reeds and industrial cellulose. Econ Bot 1958, 12, 368–404. [Google Scholar] [CrossRef]
- Verkaik, I.; Rieradevall, M.; Cooper, S.D.; Melack, J.M.; Dudley, T.L.; Prat, N. Fire as a disturbance in mediterranean climate streams. Hydrobiologia 2013, 719, 353–382. [Google Scholar] [CrossRef]
- Swain, D.L.; Langenbrunner, B.; Neelin, J.D.; Hall, A. Increasing precipitation volatility in twenty-first-century California. Nat. Clim. Chang. 2018, 8, 427–433. [Google Scholar] [CrossRef]
- Keeley, J.E.; Fotheringham, C.J. Historic Fire Regime in Southern California Shrublands. Conserv. Biol. 2001, 15, 1536–1548. [Google Scholar] [CrossRef]
- CALFIRE-FRAP. Vegetation (fveg)—CALFIRE FRAP [ds1327]. Available online: http://www.frap.cdf.ca.gov/ (accessed on 1 January 2020).
- US Geological Survey and US Department of Agriculture, Natural Resources Conservation Service. National Hydrography Dataset. Available online: https://www.usgs.gov/core-science-systems/ngp/national-hydrography/nhdplus-high-resolution (accessed on 1 January 2020).
- US Geological Survey. Landsat 8 (L8) Data Users Handbook. Available online: https://prd-wret.s3.us-west-2.amazonaws.com/assets/palladium/production/atoms/files/LSDS-1574_L8_Data_Users_Handbook-v5.0.pdf (accessed on 1 January 2020).
- Lentile, L.B.; Morgan, P.; Hudak, A.T.; Bobbitt, M.J.; Lewis, S.A.; Smith, A.M.S.; Robichaud, P.R. Post-Fire Burn Severity and Vegetation Response Following Eight Large Wildfires Across the Western United States. Fire Ecol. 2007, 3, 91–108. [Google Scholar] [CrossRef]
- Key, C.H.; Benson, N.C. Landscape Assessment (LA). 2006; p. 55. Available online: https://www.fs.usda.gov/treesearch/pubs/24066 (accessed on 9 August 2020).
- Lutes, D.C.; Keane, R.E.; Caratti, J.F.; Key, C.H.; Benson, N.C.; Sutherland, S.; Gangi, L.J. FIREMON: Fire Effects Monitoring and Inventory System; RMRS-GTR-164; U.S. Department of Agriculture, Forest Service, Rocky Mountain Research Station: Fort Collins, CO, USA, 2006.
- Keeley, J.E. Fire intensity, fire severity and burn severity: A brief review and suggested usage. Int. J. Wildland Fire 2009, 18, 116. [Google Scholar] [CrossRef]
- Tucker, C.J. Red and photographic infrared linear combinations for monitoring vegetation. Remote Sens. Environ. 1979, 8, 127–150. [Google Scholar] [CrossRef]
- Gamon, J.A.; Field, C.B.; Goulden, M.L.; Griffin, K.L.; Hartley, A.E.; Joel, G.; Peñuelas, J.; Valentini, R. Relationships Between NDVI, Canopy Structure, and Photosynthesis in Three Californian Vegetation Types. Ecol. Appl. 1995, 5, 28–41. [Google Scholar] [CrossRef]
- Hope, A.; Tague, C.; Clark, R. Characterizing post-fire vegetation recovery of California chaparral using TM/ETM+ time-series data. Int. J. Remote Sens. 2007, 28, 1339–1354. [Google Scholar] [CrossRef]
- Tran, B.N.; Tanase, M.A.; Bennett, L.T.; Aponte, C. Evaluation of Spectral Indices for Assessing Fire Severity in Australian Temperate Forests. Remote Sens. 2018, 10, 1680. [Google Scholar] [CrossRef]
- Sparks, A.M.; Kolden, C.A.; Talhelm, A.F.; Smith, A.M.S.; Apostol, K.G.; Johnson, D.M.; Boschetti, L. Spectral Indices Accurately Quantify Changes in Seedling Physiology Following Fire: Towards Mechanistic Assessments of Post-Fire Carbon Cycling. Remote Sens. 2016, 8, 572. [Google Scholar] [CrossRef]
- Harrelson, C.C. Stream Channel Reference Sites: An Illustrated Guide to Field Technique; U.S. Department of Agriculture, Forest Service, Rocky Mountain Forest and Range Experiment Station: Fort Collins, CO, USA, 1994.
- Buffington, J.M.; Montgomery, D.R. 9.36 Geomorphic Classification of Rivers. In Treatise on Geomorphology; Elsevier: Amsterdam, The Netherlands, 2013; pp. 730–767. ISBN 978-0-08-088522-3. [Google Scholar]
- USDA-NRCS. PLANTS Database. Available online: https://plants.sc.egov.usda.gov/ (accessed on 1 January 2020).
- Wentworth, C.K. A Scale of Grade and Class Terms for Clastic Sediments. J. Geol. 1922, 30, 377–392. [Google Scholar] [CrossRef]
- Goyer, G.G.; Watson, R. The Laser and its Application to Meteorology. Bull. Amer. Meteor. Soc. 1963, 44, 564–570. [Google Scholar] [CrossRef]
- Chen, S.; Truong-Hong, L.C.; O’Keeffe, E.; Laefer, D.F.; Mangina, E. Outlier detection of point clouds generating from low-cost UAVs for bridge inspection. In Proceedings of the Sixth International Symposium on Life-Cycle Civil Engineering, IALCCE 2018, Ghent, Belgium, 28–31 October 2018. [Google Scholar]
- Zhang, W.; Qi, J.; Wan, P.; Wang, H.; Xie, D.; Wang, X.; Yan, G. An Easy-to-Use Airborne LiDAR Data Filtering Method Based on Cloth Simulation. Remote Sens. 2016, 8, 501. [Google Scholar] [CrossRef]
- Barbour, M.G.; Billings, W.D. (Eds.) North American Terrestrial Vegetation; Cambridge University Press: New York, NY, USA, 2000; pp. 202–253. [Google Scholar]
- Keeley, J.E.; Brennan, T.; Pfaff, A.H. Fire severity and ecosytem responses following crown fires in California shrublands. Ecol. Appl. 2008, 18, 1530–1546. [Google Scholar] [CrossRef]
- Syphard, A.D.; Brennan, T.J.; Keeley, J.E. Drivers of chaparral type conversion to herbaceous vegetation in coastal Southern California. Divers. Distrib. 2019, 25, 90–101. [Google Scholar] [CrossRef]
- Morgan, P.; Keane, R.E.; Dillon, G.K.; Jain, T.B.; Hudak, A.T.; Karau, E.C.; Sikkink, P.G.; Holden, Z.A.; Strand, E.K. Challenges of assessing fire and burn severity using field measures, remote sensing and modelling. Int. J. Wildland Fire 2014, 23, 1045. [Google Scholar] [CrossRef]
- Mathews, E.H.L. Vegetation and Fluvial Geomorphology Dynamics after Fire in Urban Mediterranean Riparian Areas. M.S. Thesis, San Diego State University, San Diego, CA, USA, 2020. [Google Scholar]
- Barro, S.C.; Conard, S.G. Fire effects on California chaparral systems: An overview. Environ. Int. 1991, 17, 135–149. [Google Scholar] [CrossRef]
- Kobziar, L.N.; McBride, J.R. Wildfire burn patterns and riparian vegetation response along two northern Sierra Nevada streams. For. Ecol. Manag. 2006, 222, 254–265. [Google Scholar] [CrossRef]
- Park, I.W.; Jenerette, G.D. Causes and feedbacks to widespread grass invasion into chaparral shrub dominated landscapes. Landsc. Ecol 2019, 34, 459–471. [Google Scholar] [CrossRef]
- Coppoletta, M.; Merriam, K.E.; Collins, B.M. Post-fire vegetation and fuel development influences fire severity patterns in reburns. Ecol. Appl. 2016, 26, 686–699. [Google Scholar] [CrossRef] [PubMed]
- Smith, D.M.; Finch, D.M.; Gunning, C.; Jemison, R.; Kelly, J.F. Post-Wildfire Recovery of Riparian Vegetation during a Period of Water Scarcity in the Southwestern USA. Fire Ecol. 2009, 5, 38–55. [Google Scholar] [CrossRef]
- Marston, R.A. Geomorphology and vegetation on hillslopes: Interactions, dependencies, and feedback loops. Geomorphology 2010, 116, 206–217. [Google Scholar] [CrossRef]
- Dwire, K.A.; Meyer, K.E.; Riegel, G.; Burton, T. Riparian Fuel Treatments in the Western USA: Challenges and Considerations; Gen. Tech. Rep. RMRS-GTR-352; US Department of Agriculture, Forest Service, Rocky Mountain Research Station: Fort Collins, CO, USA, 2016; p. 156.
- DiBiase, R.A.; Lamb, M.P. Vegetation and wildfire controls on sediment yield in bedrock landscapes. Geophys. Res. Lett. 2013, 40, 1093–1097. [Google Scholar] [CrossRef]
- Bodí, M.B.; Martin, D.A.; Balfour, V.N.; Santín, C.; Doerr, S.H.; Pereira, P.; Cerdà, A.; Mataix-Solera, J. Wildland fire ash: Production, composition and eco-hydro-geomorphic effects. Earth Sci. Rev. 2014, 130, 103–127. [Google Scholar] [CrossRef]
- Hellmers, H.; Horton, J.S.; Juhren, G.; O’Keefe, J. Root Systems of Some Chaparral Plants in Southern California. Ecology 1955, 36, 667–678. [Google Scholar] [CrossRef]
- Hubbert, K.R.; Wohlgemuth, P.M.; Beyers, J.L.; Narog, M.G.; Gerrard, R. Post-Fire Soil Water Repellency, Hydrologic Response, and Sediment Yield Compared between Grass-Converted and Chaparral Watersheds. Fire Ecol. 2012, 8, 143–162. [Google Scholar] [CrossRef]
- Wohlgemuth, P.M. Surface Sediment Transport: A Review of Current Knowledge and a Field Study of Its Spatial and Temporal Distributions in the San Dimas Experimental Forest, California. Master’s Thesis, California State University, Los Angeles, CA, USA, 1986. [Google Scholar]
- Gabet, E.J. Post-fire thin debris flows: Sediment transport and numerical modelling. Earth Surf. Process. Landf. 2003, 28, 1341–1348. [Google Scholar] [CrossRef]
- Shakesby, R.; Doerr, S. Wildfire as a hydrological and geomorphological agent. Earth Sci. Rev. 2006, 74, 269–307. [Google Scholar] [CrossRef]
- Bridge, J.S. Hydraulic interpretation of grain-size distributions using a physical model for bedload transport. J. Sediment. Res. 1981, 51, 1109–1124. [Google Scholar] [CrossRef]
- Lu, N.; Godt, J.W. Hillslope Hydrology and Stability; Cambridge University Press: Cambridge, UK; New York, NY, USA, 2013; ISBN 978-1-107-02106-8. [Google Scholar]
- Schoelynck, J.; De Groote, T.; Bal, K.; Vandenbruwaene, W.; Meire, P.; Temmerman, S. Self-organised patchiness and scale-dependent bio-geomorphic feedbacks in aquatic river vegetation. Ecography 2012, 35, 760–768. [Google Scholar] [CrossRef]
- Spencer, D.F.; Colby, L.; Norris, G.R. An evaluation of flooding risks associated with giant reed (Arundo donax). J. Freshw. Ecol. 2013, 28, 397–409. [Google Scholar] [CrossRef]
- Dean, D.J.; Schmidt, J.C. The role of feedback mechanisms in historic channel changes of the lower Rio Grande in the Big Bend region. Geomorphology 2011, 126, 333–349. [Google Scholar] [CrossRef]
- Ffolliott, P.F.; DeBano, L.F. Riparian Areas of the Southwestern United States: Hydrology, Ecology, and Management; CRC Press: Boca Raton, FL, USA, 2003; ISBN 978-1-135-46320-5. [Google Scholar]
- Solins, J.P.; Cadenasso, M.L. Testing urban drivers of riparian woody vegetation composition in a precipitation-limited system. J. Ecol. 2020, 108, 470–484. [Google Scholar] [CrossRef]
- Iverson, M.E. The impact of Arundo donax on water resources. In Arundo Donax Workshop Proceedings; Jackson, N.E., Frandsen, P., Douthit, S., Eds.; Team Arundo Riverside: Ontario, CA, USA, 1993; pp. 19–25. [Google Scholar]
- Marañón-Jiménez, S.; Castro, J. Effect of decomposing post-fire coarse woody debris on soil fertility and nutrient availability in a Mediterranean ecosystem. Biogeochemistry 2013, 112, 519–535. [Google Scholar] [CrossRef]
- Parson, A.; Robichaud, P.R.; Lewis, S.A.; Napper, C.; Clark, J.T. Field Guide for Mapping Post-Fire Soil Burn Severity; RMRS-GTR-243; U.S. Department of Agriculture, Forest Service, Rocky Mountain Research Station: Fort Collins, CO, USA, 2010.
- Arumäe, T.; Lang, M. Estimation of canopy cover in dense mixed-species forests using airborne lidar data. Eur. J. Remote Sens. 2018, 51, 132–141. [Google Scholar] [CrossRef]
- Management Priorities for Invasive Non-Native Plants: A Strategy for Regional Implementation; San Diego Association of Governments: San Diego County, CA, USA, 2012; Contract No. 5001322.
- Webb, A.D.; Falk, D.A.; Finch, D.M. Fire Ecology and Management in Lowland Riparian Ecosystems of the Southwestern United States and Northern Mexico; Gen. Tech. Rep. RMRS-GTR-401; U.S. Department of Agriculture, Forest Service, Rocky Mountain Research Station: Fort Collins, CO, USA, 2019; 132p.
© 2020 by the authors. Licensee MDPI, Basel, Switzerland. This article is an open access article distributed under the terms and conditions of the Creative Commons Attribution (CC BY) license (http://creativecommons.org/licenses/by/4.0/).