Article

Composition and Structure of Zircon from Hydrothermal Uranium Occurrences of the Litsa Ore Area (Kola Region, Russia)

1
Geological Institute, Kola Science Centre, Russian Academy of Sciences, Fersman Str. 14, 184209 Apatity, Russia
2
Institute of Volcanology and Seismology, Piip Boulevard 9, 683006 Petropavlovsk-Kamchatsky, Russia
3
Resource Centre “Geomodel”, St. Petersburg State University, Ulyanovskaya Str. 3, 198504 St. Petersburg, Russia
*
Author to whom correspondence should be addressed.
Geosciences 2020, 10(8), 278; https://doi.org/10.3390/geosciences10080278
Submission received: 17 June 2020 / Revised: 14 July 2020 / Accepted: 20 July 2020 / Published: 22 July 2020
(This article belongs to the Special Issue Distribution of REE and Trace Elements for Different Types of Zircons)

Abstract

:
Zircon grains from various metagranitoids (plagio- and monzo-granites, gneisses, metasomatic rocks, and pegmatoid veins) from the Skal’noe and Dikoe sites of the Litsa uranium ore area (Kola Region, Russia) were studied in order to reconstruct the sequence and timing of events in the area and to observe effects of hydrothermal process related to uranium mineralization on structure and composition of zircon. Individual zircon grains were studied by means of laser ablation inductively coupled plasma mass spectrometry (LA–ICPMS), ion microprobe and Raman spectroscopy. Isotopic LA–ICPMS data for the Skal’noye and Dikoe ore occurrences suggest the following age sequence of events in the area: intrusion of plagiogranites—2829 ± 12 Ma, formation of magmatic protolith of gneisses—2781 ± 17 Ma, metamorphism of plagiogranites—2636 ± 34 Ma; intrusion of monzogranites and pegmatoid veins—2549–2526 Ma, hydrothermal event with uranium input—2276 ± 21 Ma, last metamorphism of plagio- and monzo-granites—1892–1696 Ma. Ore-bearing rocks in the area are pegmatoid veins and quartz–feldspar metasomatites which contain uraninite. During a 2.3 Ga hydrothermal process, newly formed zircon rims grew simultaneously with the precipitation of uraninite in the veins and metasomatites. These rims are characterized by high U and rare earth elements (REE) contents (up to 6560 and 8760 ppm, respectively), dark cathodoluminescence, low Th-U ratios (0.1–0.007) and a flat LREE-enriched pattern, in some cases inherited from minerals, dissolved during a hydrothermal event (magmatic plagioclase and probably monazite). Hydrothermal zircon rims grew with partial dissolution of the magmatic zircon, as evidenced by the rounded and curved shapes of zircon cores. The degree of alteration caused by hydrothermal events depends on the uranium content in the pre-existing zircon. The effects of zircon alteration and newly formed zircon composition reflect the redistribution of uranium in rocks.

1. Introduction

Zircon is a widely used geochronometer due to its stability under many geological processes and its ability to retain radiogenic lead (see, e.g., [1,2]). However, natural zircon crystals often show complex secondary internal textures visible in cathodoluminescence and backscattered electron imaging [3], which indicate the presence of recrystallization/alteration processes [4,5,6,7,8]. The zircon solubility increases in the presence of water, CO2- and chloride-rich fluids, alkaline solutions and magmas [9,10,11,12]. The zircon susceptibility to alteration increases in crystals with structure disordered due to metamictization ([13] and references therein), fracturing [14,15], or plastic deformation [16,17]. Zircon grains with high concentrations of U (and Th) are generally more susceptible to alteration, since the radioactive decay of these elements leads to the progressive damage of crystal structure with time ([13] and references therein). Krogh and Davis [14] showed that the main effect of radiation damage is to prepare the crystal for later alteration, which can subsequently be initiated by interaction with fluid even at low temperatures. Zircon recrystallization associated with low-temperature fluid influence was confirmed by experimental zircon data [5] and geological observations [8,18,19,20].
Fluid-altered hydrothermal zircons have specific internal textures and geochemical characteristics which distinguish them from magmatic zircon (e.g., [21,22,23]). Among typical characteristics of zircon of hydrothermal origin could be a “spongy” texture [19,24], extreme enrichment in HFSE and the LREE [19,25], high contents of non-radiogenic lead [26] and extremely low Th-U ratios [23,27].
Zones of hydrothermal alteration and metasomatism in rocks are characterized by significant geochemical heterogeneity, manifested in compositional variations of minerals and accompanied by disturbance of isotopic systems. Mineralogical and geochemical studies of zircon, including the Raman spectroscopic study of zircon microstructure and analysis of the rare earth elements (REE) pattern, allow the conditions of zircon growth and alteration to be determined, which is important for the correct interpretation of U-Pb zircon ages. Structural, isotopic and chemical features of zircon associated with fluid and hydrothermal activity present a good opportunity to better understand the genesis of mineral deposits associated with hydrothermal processes (gold, uranium, etc.) [28,29].
During our work in the Litsa area on the multi-stage hydrothermal uranium mineralization, some data were obtained on zircon alteration. The aim of the present paper was to show the influence of hydrothermal processes on zircon in uranium occurrences and the relationship between zircon alteration and the geochemistry of uranium. Mineralogical and geochemical studies were carried out for individual zircon crystals from granites and gneisses of the two most representative U ore occurrences of the Litsa area: Skal’noe and Dikoe (Figure 1).

2. Geological Setting of the Litsa Area

The Litsa uranium ore area is located in the NW part of the Kola region at the intersection of Titovka–Uraguba and Litsa–Araguba tectonic zones, restricted by N–S and E–W striking faults, which determined a mosaic-block structure of the area (Figure 1a,b). About 40 uranium ore occurrences were discovered in the area [30]. A major part of the Litsa area belongs to the Central Kola Terrane composed of repeatedly metamorphosed 2.9–2.8 Ga gneisses of the Kola Group and 2.8–2.7 Ga tonalite–trondhemite–granodiorite (TTG) and granite–gneiss rocks [31]. Most ore occurrences of the Litsa area are confined to the zones of variable permeability, such as deep faults and shear zones with inherent ductile and brittle deformations of rocks, which provide favorable conditions for hydrothermal and metasomatic processes leading to uranium concentration.
The Skal’noe and Dikoe sites are the largest ore occurrences with the 2.6–2.3 Ga REE-Th-U mineralization [32]. The rocks within the sites are represented by migmatized biotite, garnet–biotite and two-mica gneisses of the Kola Group more strongly deformed in the Dikoe area, and plagiogranites intercalated with amphibole gneisses, amphibolite bodies, and cross-cutting gabbro-dolerite dykes. Most rocks have concordant tectonic boundaries, complicated by zones of cataclasis and schistosity.
Fields of pegmatoid granitoid veins and lenticular bodies of quartz–feldspar metasomatites (up to 250 m length and up to 15 m thick) with a maximum uranium content of 0.2% were revealed in the area [30,33]. Granitoid veins have sharp (intrusive) contacts and are subconcordant with the strongly deformed host gneiss. Quartz–feldspar metasomatites differ from vein pegmatoid granitoids by the structure heterogeneity, more prominent manifestation of recrystallization processes, and indistinct contacts. According to drilling data, the lens-like and nest-like character of the uranium mineralization is preserved to a depth of 500 m [30].
Here we present the most characteristic samples to track zircon alteration under the influence of a hydrothermal fluid: granites, U-bearing pegmatoid veins and metasomatic rocks, and host gneisses (Figure 1b,c).

3. Materials and Methods

3.1. Rock Samples

Samples KT-1 and KT-2 are small- to medium-grained biotite and muscovite-biotite plagiogranites with hypidiomorphic magmatic texture preserved to varying extents, and a massive or gneissoid structure. Both samples are composed of plagioclase (58–60%), quartz (30–35%), biotite (3–7%), microcline (0–5%), muscovite and chlorite (<1%). Accessory minerals are represented by apatite, zircon and iron-oxides. Some biotite crystals have been altered to chlorite. Magmatic plagioclase is altered and epidote is developed after plagioclase in recrystallized domains. Microcline is only encountered in metamorphic paragenesis in the recrystallized areas, sometimes replacing plagioclase.
Sample KT-3 is a coarse-grained monzogranite rock with pronounced hypidiomorphic or poikilitic texture, composed of microcline (35%), plagioclase (30%), quartz (30%), muscovite (5%), apatite, and ore-minerals, with a distinct idiomorphism of plagioclase relative to quartz and to microcline–pertite, the latter hosting poikilitic plagioclase inclusions. The magmatic microcline, plagioclase and quartz are recrystallized to small subpolygonal grains. Muscovite intensively develops in this fine-grained mass. Magmatic plagioclase is partly replaced by a fine-grained aggregate of presumably hydromica–kaolinite–montmorillonite composition. Large zircon grains are enclosed in plagioclase, microcline, and quartz.
Samples KT-5 and RK-473 are muscovite-biotite gneisses of the Kola series with lepidogranoblastic textures; the main minerals are plagioclase (~40%), quartz (~30%), biotite (20–25%), muscovite (5–10%), accessory and ore minerals. Plagioclase and quartz are represented by allotriomorphic grains; biotite forms flakes and elongated plates. Zircon, apatite, and allanite are located in biotite grains or in interstices.
Samples TK-20 is a vein pegmatoid granitoid with massive structure, collected from a 20–70 cm thick vein in biotite gneisses. The sample shows a magmatic hypidiomorphic texture and is composed of plagioclase (50%), quarts (10%), microcline (20%), biotite (10%), muscovite (10%), apatite, monazite, uraninite, zircon and sulfides. Magmatic plagioclase forms large grains with thin polysynthetic twins. Some grains have bent twins and wavy extinction, reflecting deformation processes. Plagioclase is recrystallized to form small grains along cracks and twin bands. Quartz and microcline are presented in the fine-grained mass along with magmatic plagioclase. Biotite occurs among recrystallized plagioclase and quartz grains, and is partly replaced by chlorite. Large flakes of secondary muscovite are observed in a fine-grained mass around large plagioclase grains. Uranium minerals (apatite, monazite, uraninite, zircon) mainly occur in biotite.
Sample TK-473A is a quartz–albite–microcline metasomatic rock, similar to vein pegmatoid granitoid, but with indistinct contacts.

3.2. Analytical Methods

Zircon grains were separated from rock samples, embedded in epoxy mounts, ground down to about half of their thickness and polished. The back-scattered electron (BSE) and cathodoluminescence (CL) images, as well as the qualitative composition of inclusions, were studied using a LEO-1450 scanning electron microscope equipped with an XFlash-5010 Bruker Nano GmbH energy dispersive spectrometer with QUANTAX 200 software at the Geological Institute, Kola Science Center of Russian Academy of Sciences in Apatity, Russia.
Zircon was dated by means of laser ablation inductively coupled plasma mass spectrometry (LA–ICPMS) in the University of Tasmania (Australia). Measurements were conducted on an Agilent 7900 quadrupole mass-spectrometer with Resonetics Resolution laser ablation system equipped with a coherent CompexPro 110 ArF Excimer laser with wavelength of 193 nm (10–9 m). Zircon ablation took place in a flow of helium (0.35 L/min) mixed with argon (~1 L/min). A small amount of nitrogen (~1.5 mL/min) was added to the gas stream after the ablation cell to improve sensitivity. Zircons were sampled from 29–32 µm spots using the laser with 5 Hz frequency and 2 J/cm2 fluence. A detailed analytical method for U-Pb dating of zircon was reported in [34,35]. Individual corrected ratios and ages are reported with 1σ analytical errors (68% confidence), and the uncertainties in the calculated discordia ages are reported with 2σ errors (95% confidence). The Isoplot 3.60 software [36] was used for conventional concordia plots and age calculations.
The chemical composition of zircons including the rare earth elements (REE) was analyzed on a Cameca IMS-4F ion microprobe (France) in the Yaroslavl Branch of the Physical Technological Institute (Yaroslavl, Russia). The primary O2– ion beam spot size was ~20 μm. Each analysis was averaged from 5 measurement cycles. The relative analytical errors were 10–15%, and the average detection limits were 10 ppb. The respective procedure is described in [37].
Raman spectroscopy of zircon was conducted in the St. Petersburg Resource “Geomodel” centre using the Raman spectrometer HORIBA Jobin-Yvon LabRAM HR 800, Ar-laser with a wavelength of 514.5 nm and 488 nm, an exposure time of 3 sec, 5 repetitions, and a laser power of 50 mW.

4. Results

4.1. LA–ICP-MS Data

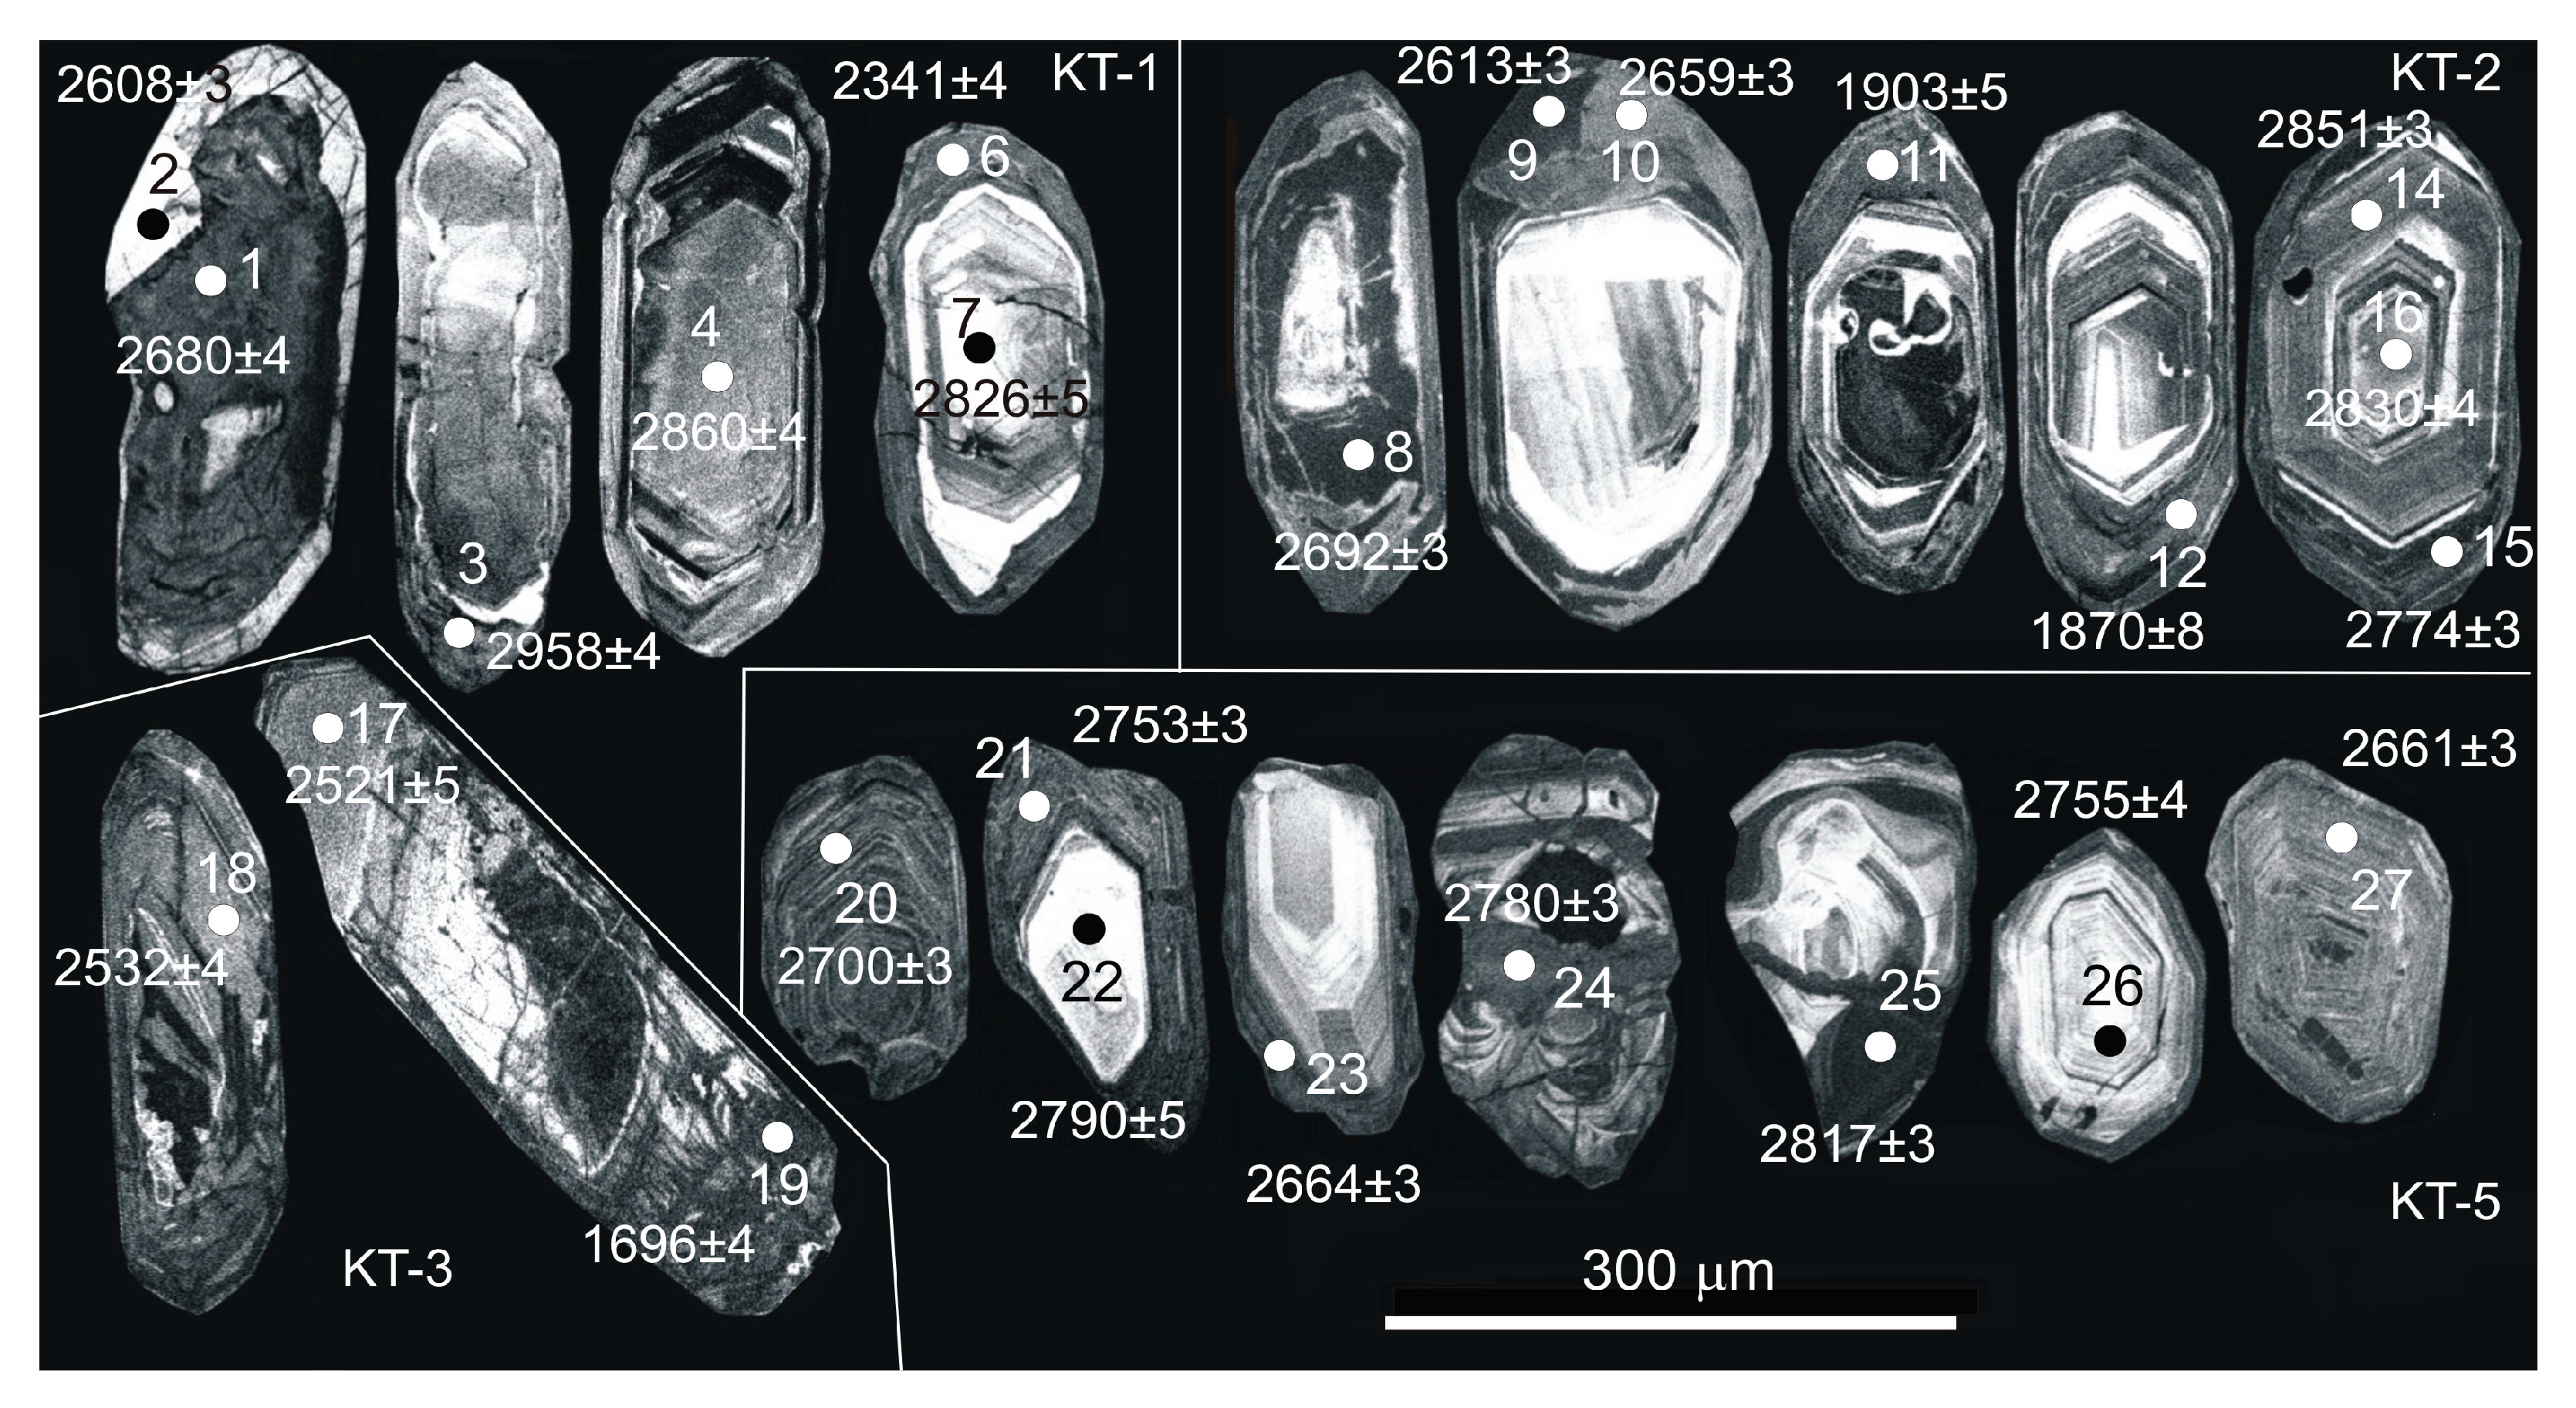
The cathodoluminescence (CL) images show that all zircon grains have a complex internal structure: the cores of various shape and preservation are surrounded by rims, which may be either light or dark in CL (Figure 2).
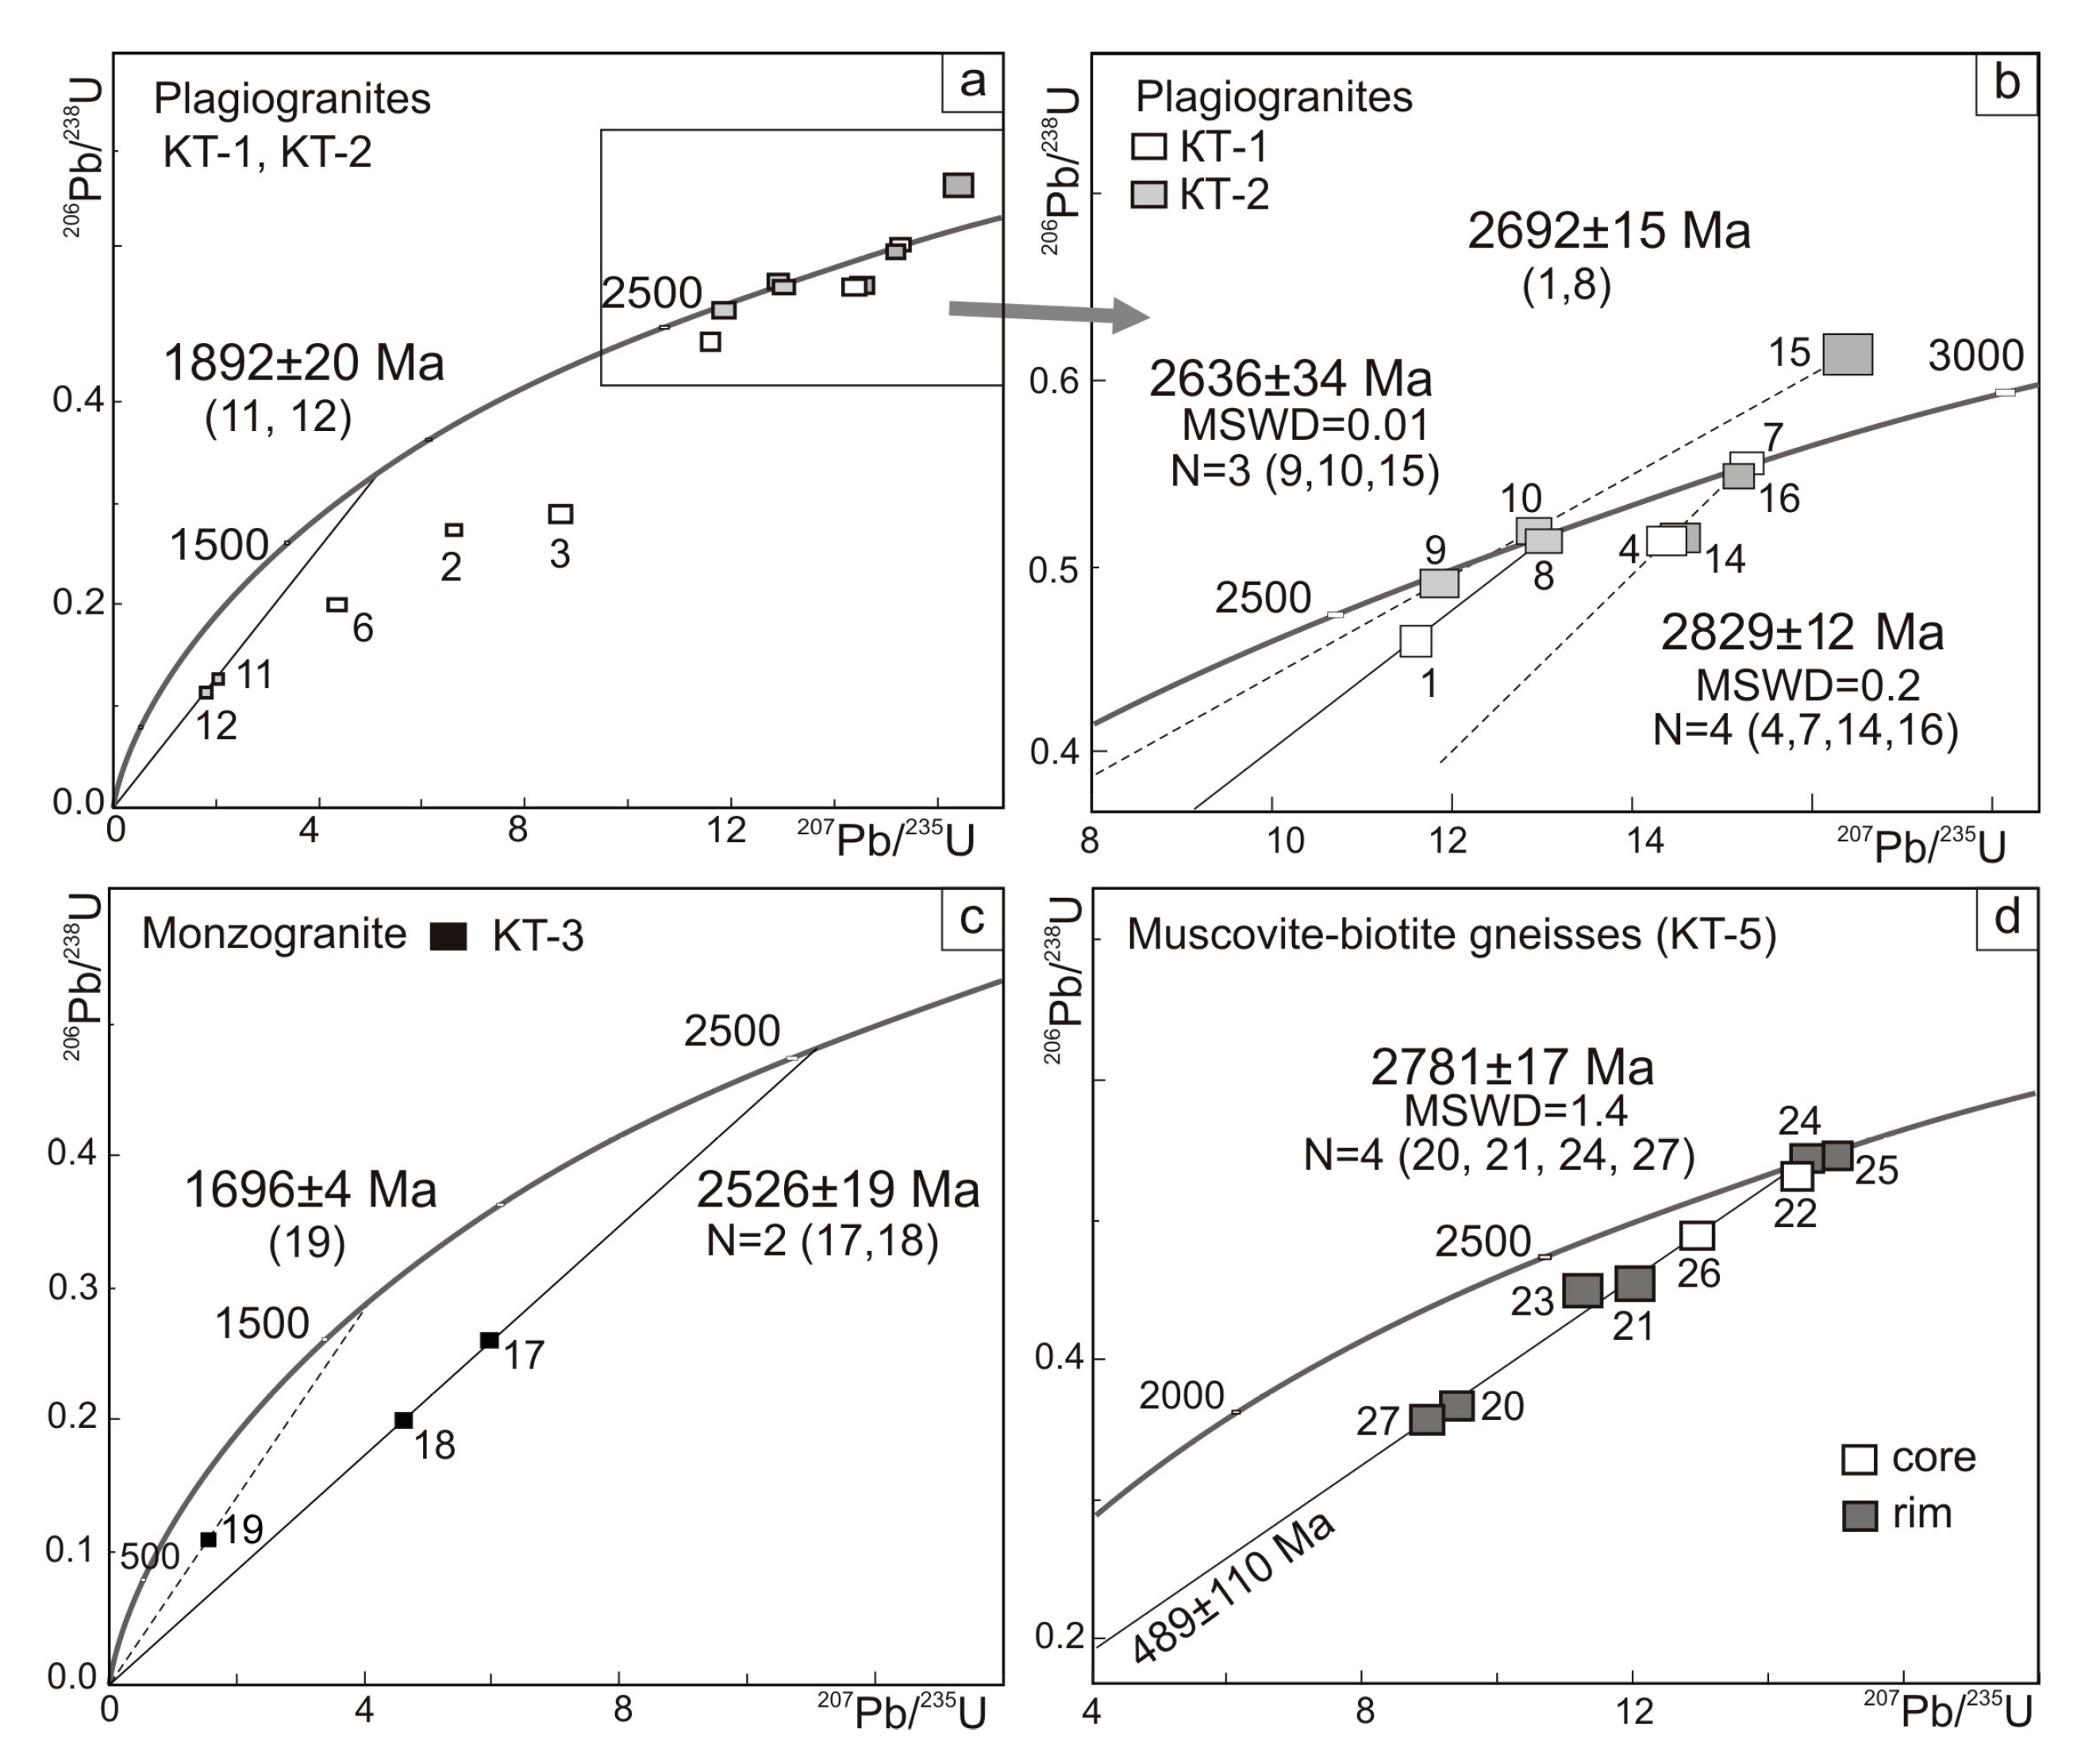
Zircon in the sample of plagiogranite KT-1 is represented by corroded crystals, with the core of irregular shape. The most ancient date (2958 ± 4 Ma) was obtained at the point 3 and not manifested anywhere else in our samples. A similar age (2910 ± 21 Ma) was obtained for the zircon from the gneisses of the Kola series [38]. The sample KT-2 contains best preserved zircon grains. Since both plagiogranite samples were taken at the same outcrop and are similar in mineral and chemical composition, we calculated the age for the two samples (Figure 3a,b).
Cores with thin zoning (points 4, 7 and 14, 16 in the Figure 2) and similar chemical composition—low uranium content (50–245 ppm) and elevated Th-U ratios (0.2–0.6, Table 1) —were calculated together and yielded an upper intercept U-Pb age of 2829 ± 12 Ma. The dark cores (points 1 and 8) with moderate U content (586–602 ppm) have a U-Pb age of 2692 ± 15 Ma. The bright luminescent rim (point 2) with high U content (1372 ppm) has a 207Pb/206Pb age of 2608 ± 3 Ma. Gray in CL rims (points 6, 9, 10, 11, 12, 15) have similar luminescence and zoning but different chemical composition and age. Rims with low Th content of 5–11 ppm and Th-U ratio of 0.01 (points 9, 10, 15) have an upper intercept age of 2636 ± 34 Ma. The rim at point 6 has the same chemical composition, but a younger 207Pb/206Pb age of 2341 ± 4 Ma. Rims with high U content of 1381–1404 ppm (points 11, 12) yielded a very discordant U-Pb date of 1892 ± 20 Ma (Figure 3a).
Zircon in the sample of monzogranite (KT-3) is represented by large brown crystals. Around the irregularly shaped core there are altered areas dark in CL and light gray areas with growth zoning (points 17 and 18) for which a date of 2526 ± 19 Ma was obtained (Figure 3c), though U-Pb data are highly discordant. The age of the altered dark area is 1696 ± 4 Ma. All zircon domains are rich in uranium (1653–2410 ppm) with a low Th-U ratio of 0.01–0.08 (Table 1).
The sample KT-5 of muscovite-biotite gneiss contains short prismatic zircon grains with oscillatory zoning. The bright core (points 22, 26) with low U (62–97 ppm) and high Th-U ratios (0.44–1.1) has 207Pb/206Pb ages of 2760–2790 Ma (Table 1). Oscillatory zoning rims (21, 23) and individual fine-zoned zircon grains (points 20, 27) with moderate to high U content (319–844 ppm) yielded an upper intercept U-Pb age of 2781 ± 17 Ma (Figure 3d). There is a more ancient dark area of zircon with a 207Pb/206Pb age of 2817 ± 3 Ma (point 25).

4.2. REE Composition of Zircon

Cores of zircon from the plagiogranite sample, KT-1, have low U and REE contents (23–156 and 193–704 ppm, respectively)—points 1 and 7 (Table 2, Figure 4a) show a HREE-enriched pattern ((Sm/La)n=10–14, (Lu/Gd)n=24–30) with positive Ce and negative Eu anomalies, which is characteristic of magmatic zircon [39]. According to LA–ICPMS data, these cores have an age of 2829 ± 12 Ma. Cores 2 and 5 contain more U (407–962 ppm) and REE (699–1382 ppm) (Table 2) and are enriched in LREE (102–103× chondrite, (Sm/La)n=2–7). Similar REE patterns were observed in the rims (points 3, 4, 6) with high uranium (1952–4104 ppm) and REE (866–2477 ppm) content.
One of the zircon grains from Mu-Bt gneisses (sample RK-473) is a fragment of zoned crystal with high contents of U (948-1090 ppm) and REE (1475–1802 ppm) (Figure 4b, left image, Table 2). Its REE pattern has higher LREE ((Sm/La)n=1.1–1.0) than typical “magmatic” zircon, despite fine zoning and potassium feldspar–biotite–quartz association of mineral inclusions, typical of granite. The second grain has a zoned core and fractured rim. Both U and REE contents (426–662 ppm and 279–1166 ppm, respectively) are lower than those in the first grain. Distribution of REE reveals a HREE-enriched pattern ((Lu/Gd)n=33–38) both in the core and in the rim.
Zircon from metasomatic rock (TK-473A) has zoned cores, light in BSE and structureless dark rims (Figure 4 c). The first core (left image) has moderate U content (535 ppm), while the core and rim of the second grain have very high U content up to 6760 ppm (Table 2). Content of REE in all points is rather high (1360–3270 ppm). Low U core (point 2) has a LREE-depleted pattern with (Sm/La)n=6 with negative Eu anomaly, while other domains are enriched both in HREE and LREE (~104× and 103× chondrite, respectively) and have a “cup-shaped” REE pattern with positive Eu-anomaly, uncharacteristic for zircon [39].
Zircon from the pegmatoid vein (sample TK-20), being generally similar to zircon from metasomatites, has a more complex structure. Cores, internal fractured rims, and external unstructured rims were distinguished here (Figure 4d). Inclusions in the cores and inner fractured rims are represented by the potassium feldspar–biotite–apatite-quartz association, which suggests the growth of zircon from the melt during crystallization of pegmatite veins. All zircon domains, apart from core 7 with (Lu/Gd)n = 2.5, exhibit a flat REE pattern with (Lu/Gd)n ranging 0.2–0.9. The cores have an increased content of uranium (1180–2588 ppm) and thorium (250–1715 ppm), and the rims have a very high content of uranium (2688–6560 ppm), suggesting simultaneous formation of rims and uranium minerals. The REE content in the rims (3291–8760 ppm) is also the highest of all samples (Table 2).

4.3. Raman Spectroscopy

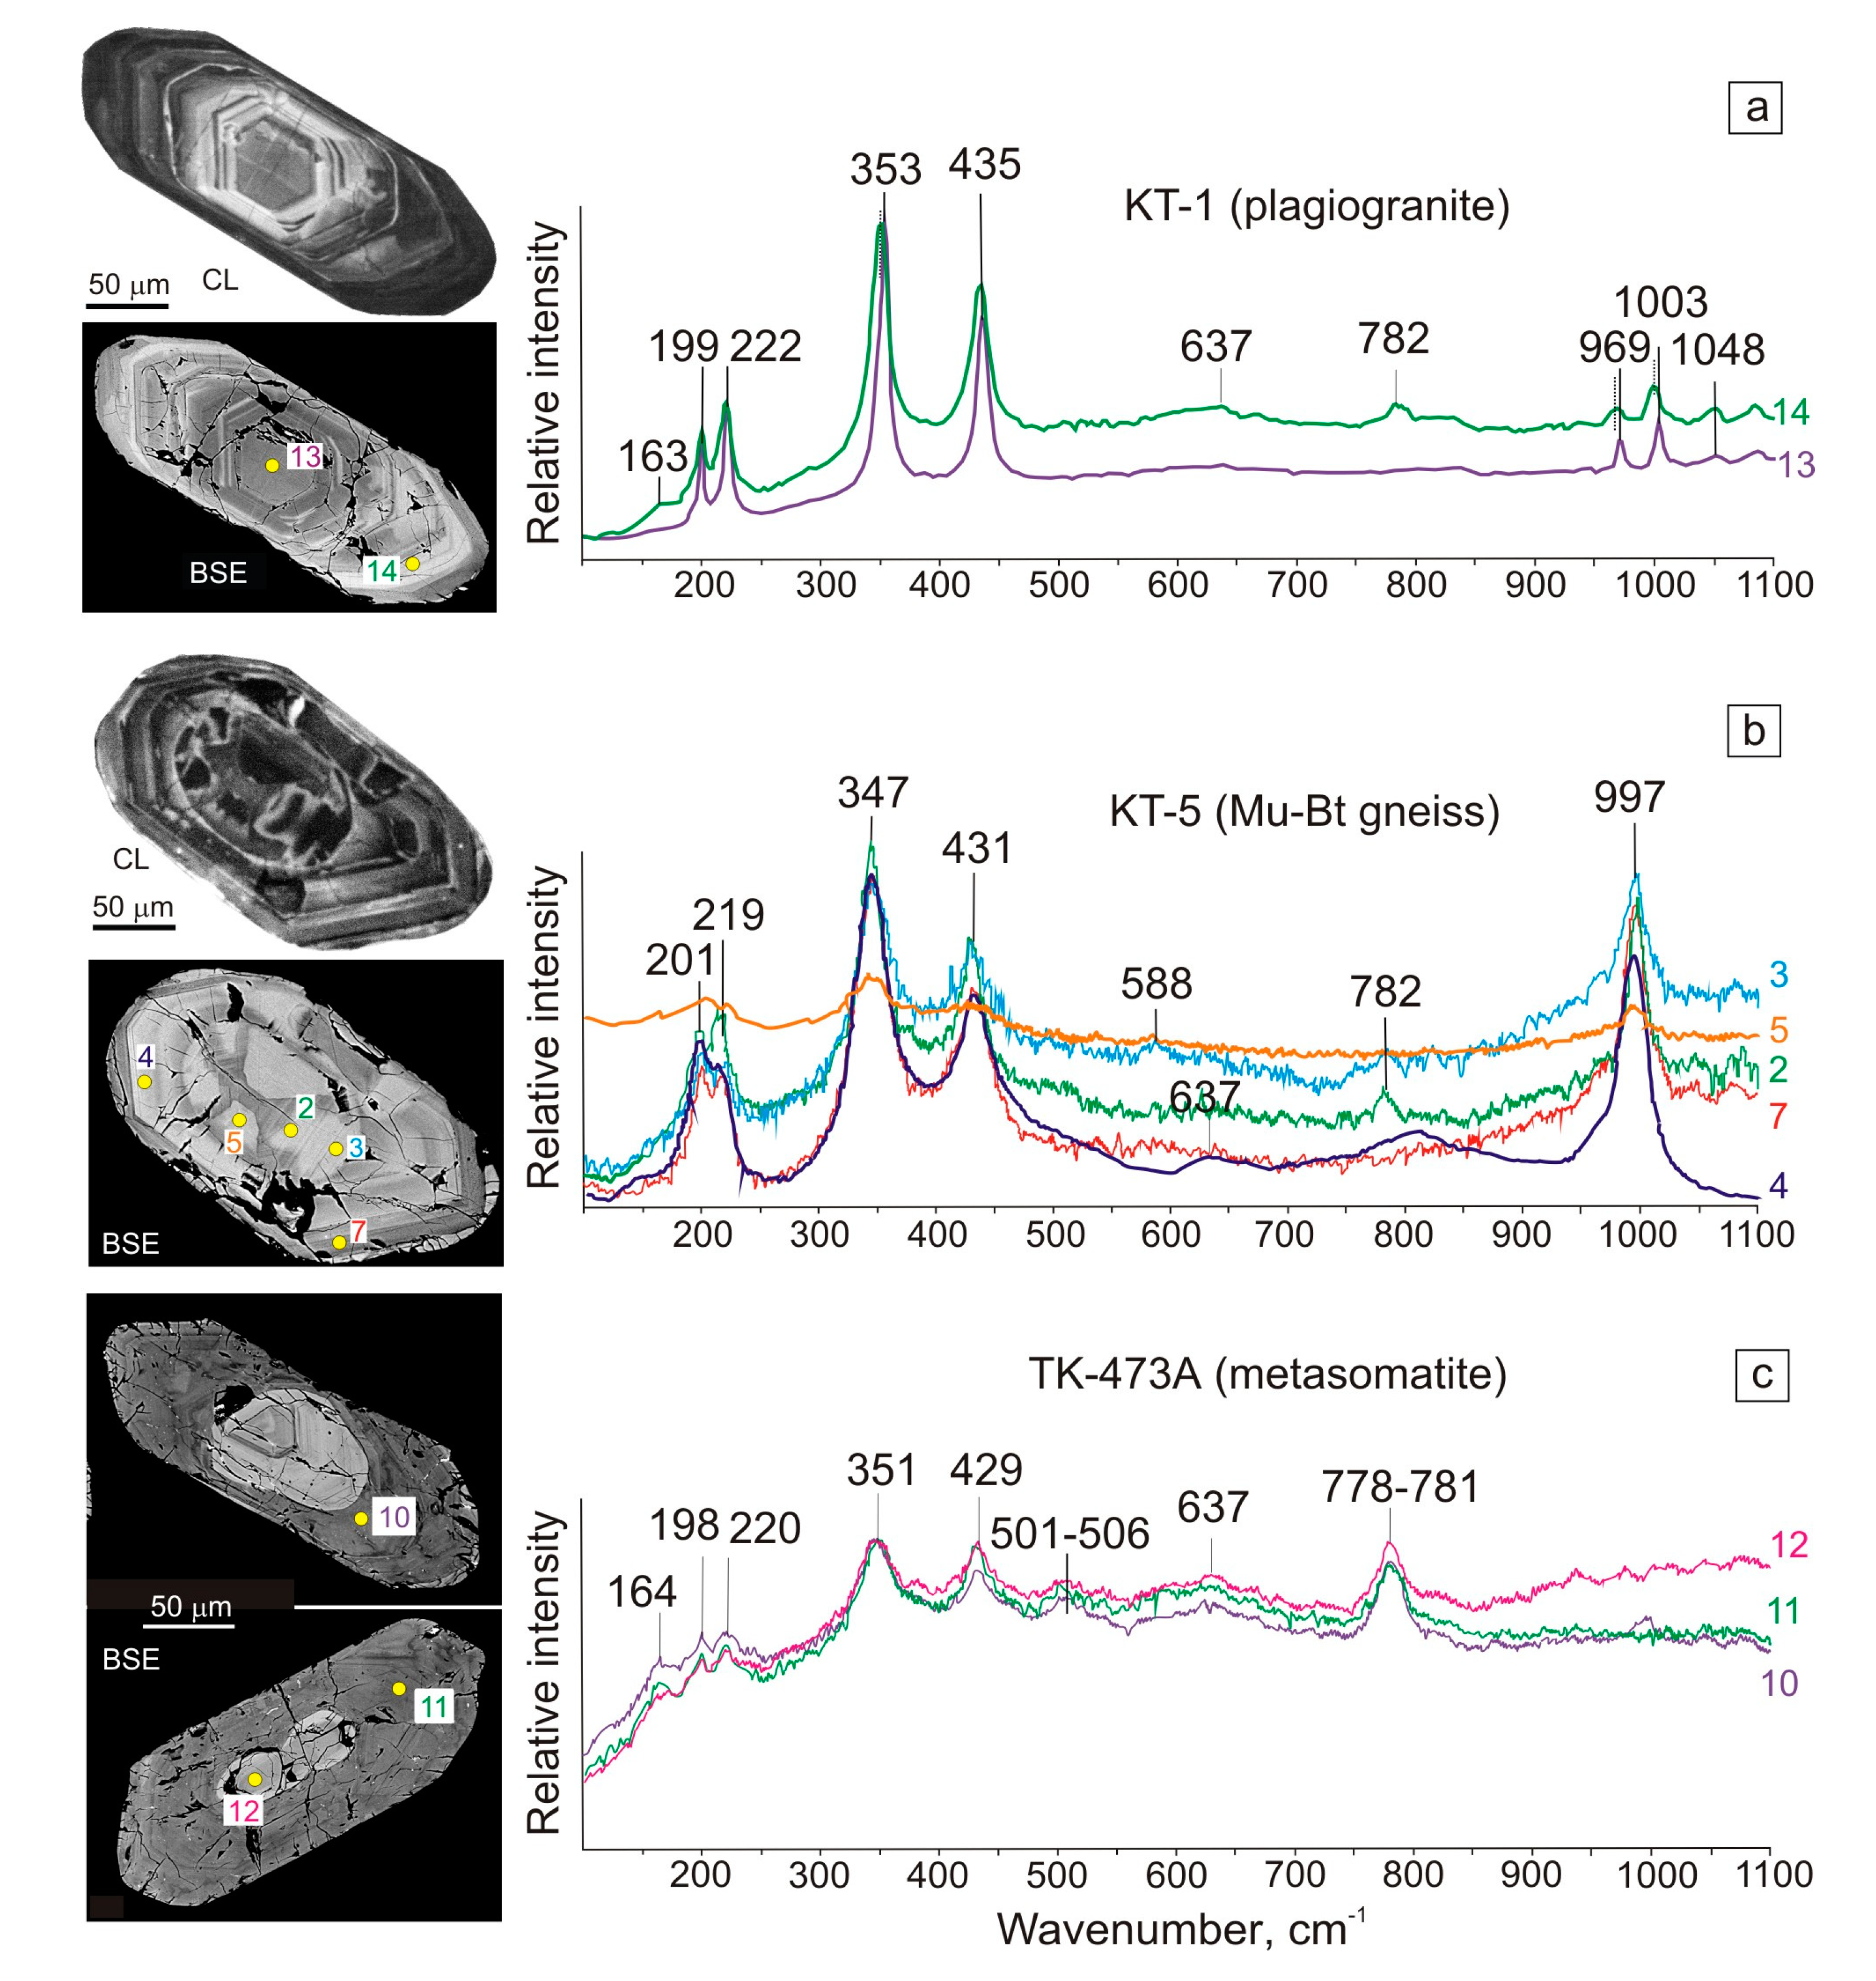
Raman spectroscopy is very instrumental for studying radiation-induced metamictization of zircon at the micro level [41]. Raman spectrum of crystalline zircon consists of several bands: 202, 214, 225, 357, 393, 439, 974 and 1008 cm−1 with the most intense bands at 1008, 439 and 357 cm−1, which correspond to the internal vibration of SiO4 tetrahedrons, while the three bands at 202, 214 and 225 cm−1 are external modes, corresponding to vibrations involving movements of SiO4 tetrahedrons and Zr ions [42,43].
Zircon from plagiogranite (sample KT-1) is represented by grains with growth zoning (Figure 5a). The central domain (point 13) exhibits Raman spectrum with typical zircon Raman modes, though with broader bands, with decreased total Raman intensity and bands shifted towards smaller wavenumbers, corresponding to disturbances of zircon structure [41]. The uranium-rich rim (point 14) displays even more reduced and shifted Raman peaks, which reflects increased damage to the structure. The rim exhibits additional bands at 163, 635, 782 and 1048 cm−1. The occurrence of extra Raman bands near 162, 509, 635 cm–1 is attributed to Zr-rich clusters of ZrO polyhedra or to the presence of a submicrometric non-crystalline Zr–O phase [44]. The extra Raman band at 785 cm–1 appears to be caused by Si-rich phases, formed along with ZrO clusters as a result of the strong distortion of zircon crystal lattice [44].
Zircon from muscovite-biotite gneiss (sample KT-5) shows Raman zircon peaks in areas with growth zoning (point 4, 7, Figure 5b), but with lower intensity of bands. The 1008 cm-1 band shifts to 997 cm−1 and the signal at 975 cm−1 disappears. In recrystallized areas (points 2, 3, 5) the signal from the 1008 cm−1 band also disappears, which indicate the appearance of an amorphous phase [45].
High-U rims and remnant of core in zircon from metasomatite (sample TK-473A) show wide low Raman peaks indicating strong damage of crystal lattice (Figure 5c). The Raman spectra has no 975 and 1008 cm-1 signals, but has peaks at 164, 501–506, and 778–781 cm−1, reflecting amorphous state of the substance with ZrO and Si-rich domains [44,45].

5. Discussion

According to U-Pb dating of magmatic zircon represented by cores with thin growth zoning, the crystallization of plagiogranites in the area occurred 2829 ± 12 Ma ago. Grains with oscillatory zoning from biotite-muscovite gneiss with U-Pb age of 2781 ± 17 Ma appear to the next magmatic event in the area. This zircon has low Th and low to moderate U contents (with low Th-U ratio), reflecting chemical composition of the parental rock [46]. A further zircon growth resulted in the crystallization of low-U rims 2636 ± 34 Ma and high-U rims 1892 ± 20 Ma ago. The results obtained are in a good agreement with the data published for the rocks of the northwestern part of the Kola–Norwegian block [47,48]. The low U and Th (50–245 and 15–129 ppm, respectively) zircon cores from plagiogranites retained crystallographic forms and the magmatic REE pattern.
Crystallization of monzogranites occurred at 2526 ± 19 Ma according to the age of zircon domains with growth zoning and high U concentrations. Coeval pegmatoid veins were crystallized 2549 ± 7 Ma ago (U-Pb monazite age [32]).
The pegmatoid vein (sample TK-20), besides zircon, contains monazite, uraninite, and apatite, which are in close association with each other, but formed at different stages of the rock evolution. Magmatic zircon with elevated U content (1200–2600 ppm) crystallized in veins along with monazite and apatite. Unaltered magmatic zircon core (point 7—Figure 4d) is depleted in LREE, which is consistent with joint growth with monazite [49].
Precipitation of uraninite occurred 2276 ± 21 Ma ago [32]. Dark in CL zircon rims in pegmatoid veins (TK-20) and metasomatic rocks (TK-473) with elevated concentration of U and REE (up to 6560 and 8760 ppm, respectively) probably reflect growth during increased mobility of U. The flat REE pattern, as well as the low Th-U ratio (0.1–0.007), is similar to zircon that has undergone metasomatic or hydrothermal processing [19,21,23,27]. The rims also have high content of “non-formula” elements: Al (0.3–2.4 %), Ca (0.9–1.5%), and Fe (0.4–5%), typical of hydrothermal zircon [5,14,22].
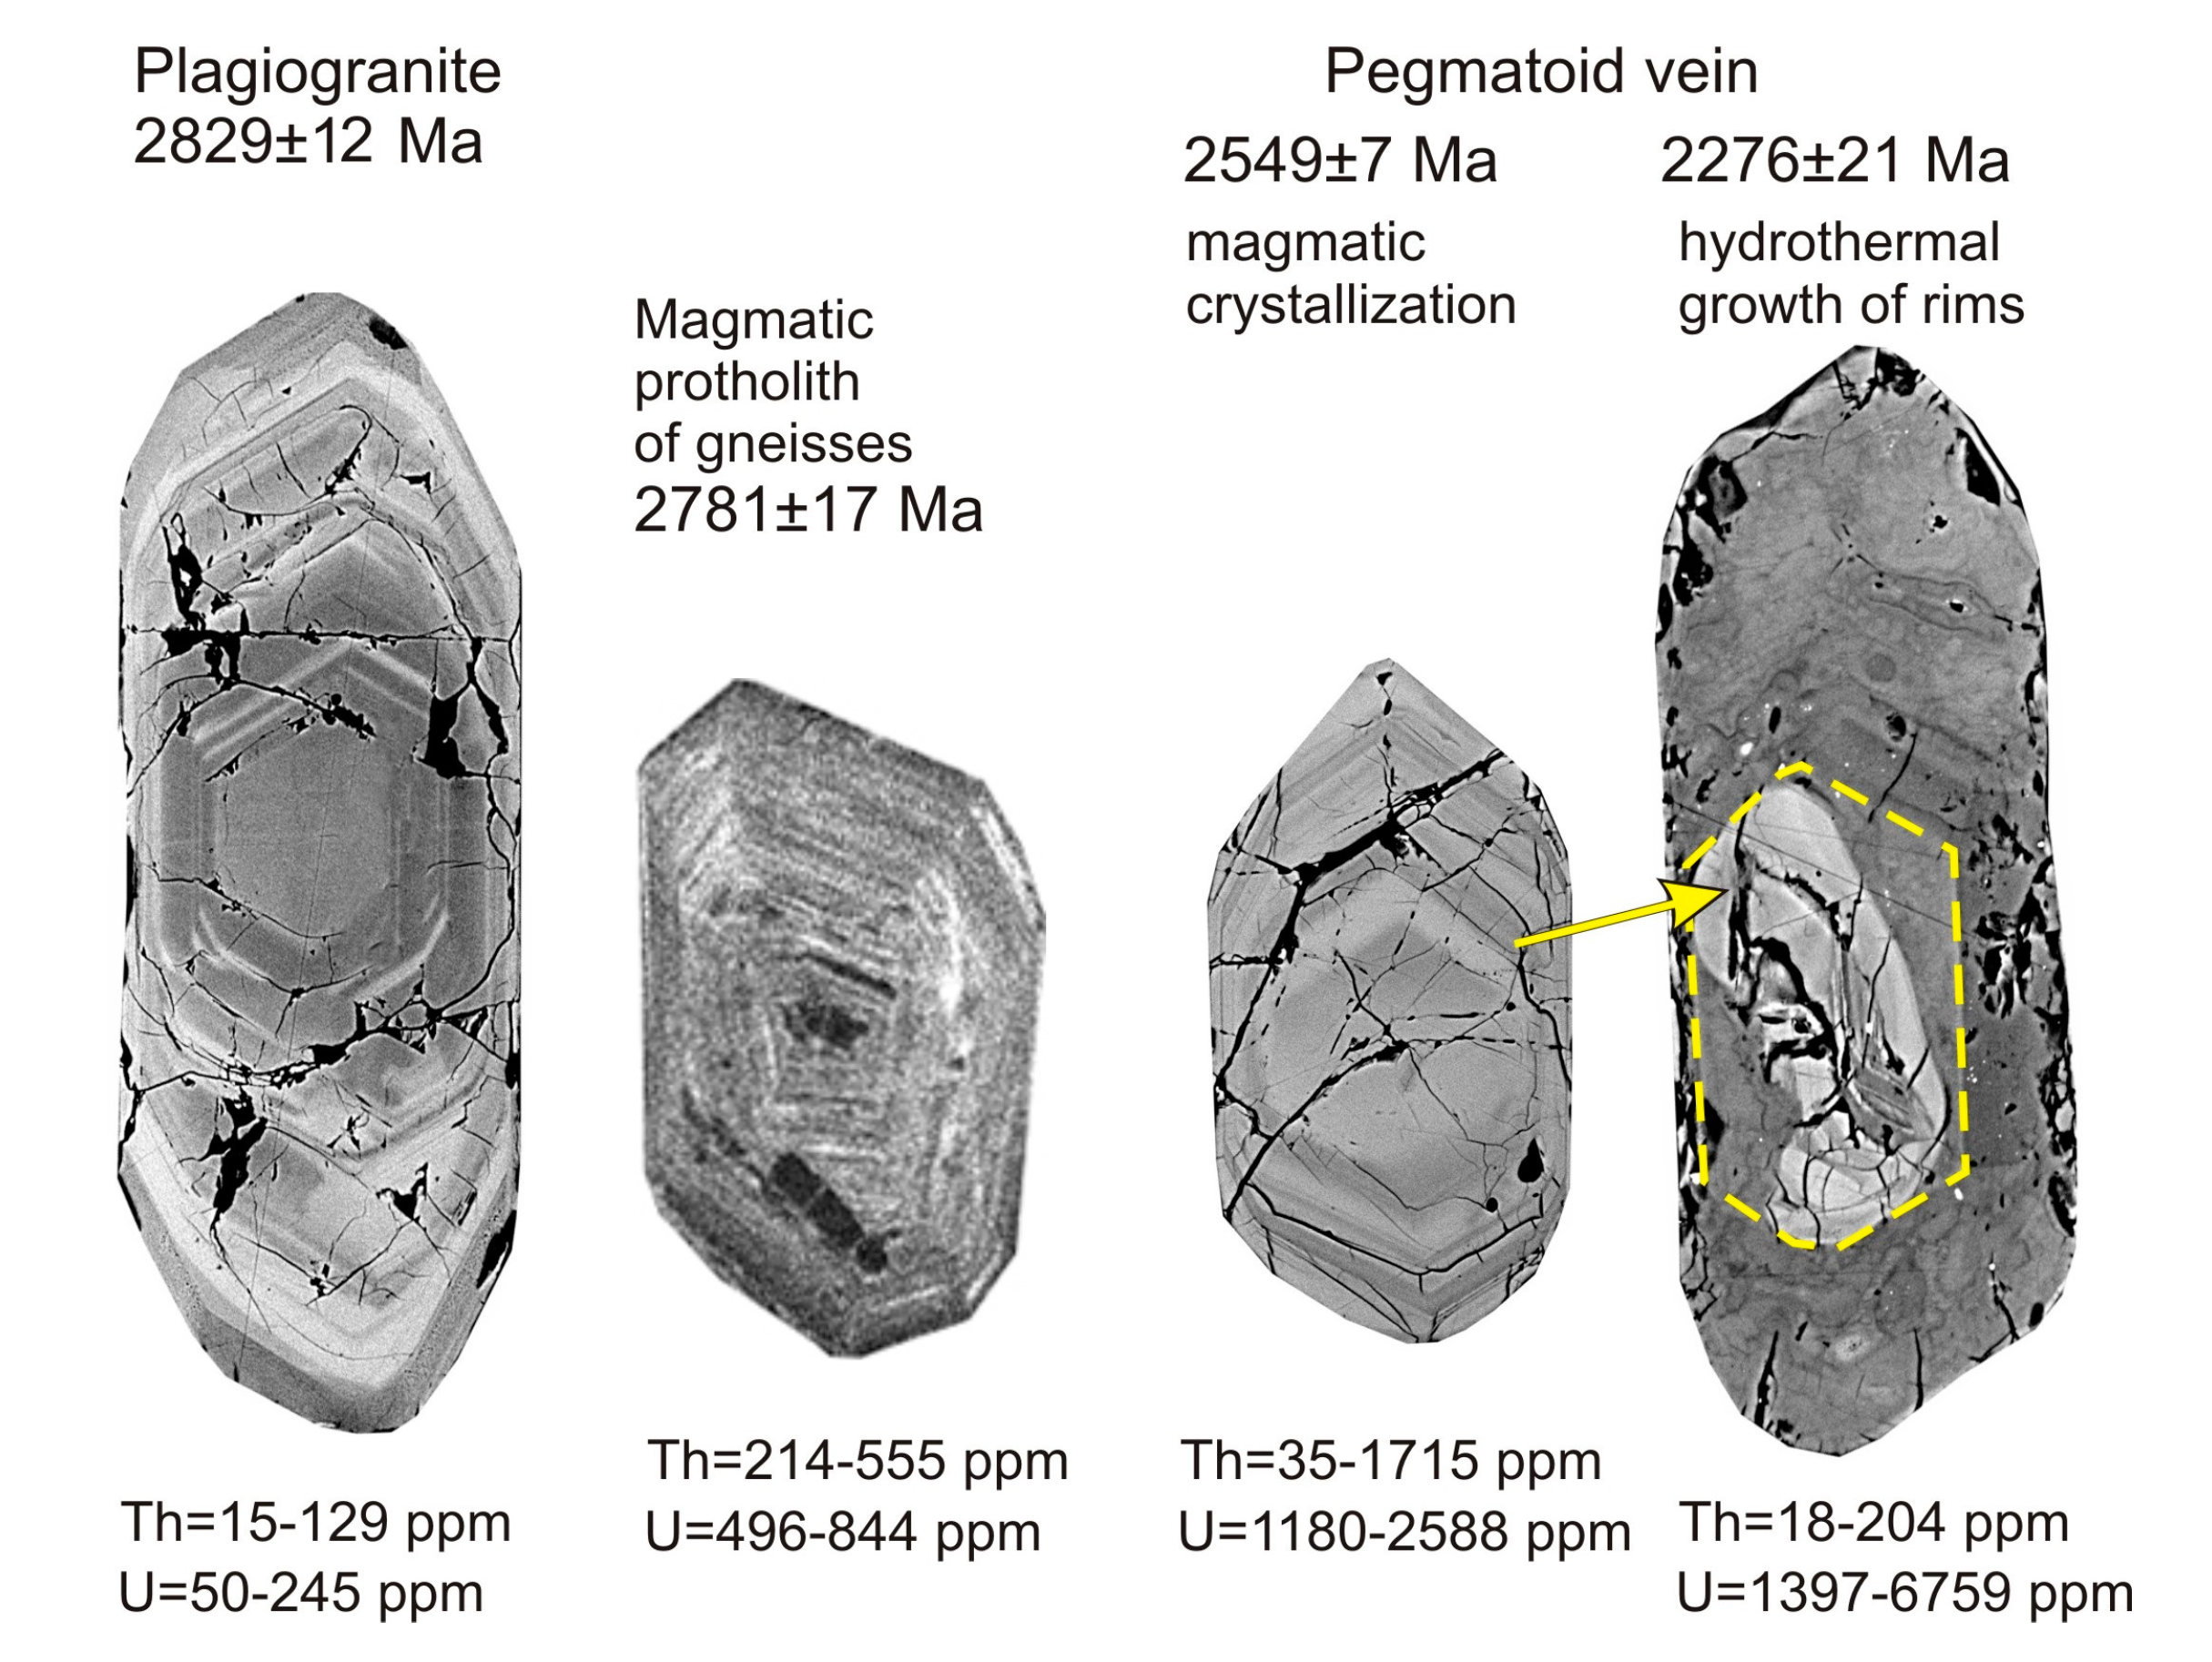
An increase in the uranium content in zircon cores in veins and metasomatites over 1000 ppm resulted in the damaged crystal structure and makes zircon less stable. None of the high-U cores have a crystallographic shape. The small size of the cores when compared to the bulk of the crystal, their rounded shape and curved boundaries, sometimes with the shadow of the former prismatic crystal (Figure 6) testifies to dissolution of primary zircon grains. Such a picture can correspond to the metasomatic replacement of cores during the rim growth according to the “dissolution–reprecipitation” mechanism [4,5,50], with probable redistribution of trace elements in the bulk of a crystal [50].
The cup-shaped REE pattern of zircon domains in metasomatic rocks (TK-473) with positive Eu-anomaly and high LREE could be inherited during hydrothermal alteration of rocks with partial dissolution of monazite and magmatic plagioclase. A similar process was described in [51], where it was shown that during metasomatic reactions, newly formed minerals can inherit the REE pattern from the replaced ones.
Raman spectroscopy confirms that the damage of the crystal lattice increases with the uranium content in zircon, which is reflected by the change of shape and position of individual Raman active modes: a decrease in the total spectrum intensity, band broadening, and peak shifts toward lower wave numbers. After the formation of rims 2.3 Ga ago, the temperature did not rise above 300–350 °C, when radiation damage of the zircon structure was annealed [41].

6. Conclusions

Isotopic LA–ICPMS data for the Skal’noye and Dikoe ore occurrences suggest the following age sequence of events in the area: intrusion of plagiogranites—2829 ± 12 Ma; formation of magmatic protolith of gneisses—2781 ± 17 Ma; metamorphism of plagiogranites—2636 ± 34 Ma; intrusion of monzogranites and pegmatoid veins—2526–2549 Ma; hydrothermal event with uranium input—2276 ± 21 Ma; last metamorphism of plagio- and monzo-granites—1892–1696 Ma.
Magmatic zircon from plagiogranites with low U and Th contents (50–245 and 15–129 ppm, respectively) retains crystallographic forms and the magmatic REE pattern. Magmatic zircon from pegmatoid veins and metasomatites with elevated U content (1200–2600 ppm) is partly dissolved during rim formation, has no crystallographic forms and is preserved as rounded cores. This means that an increase in the uranium content over 1000 ppm leads to a distortion of the crystal structure and makes zircon less stable.
Zircon rims, formed simultaneously with uraninite during the hydrothermal process, are characterized by high U and REE contents (up to 6560 and 8760 ppm, respectively), dark cathodoluminescence, low Th-U rations (0.1–0.007), flat LREE enriched patterns and a high content of “non-formula” elements: Al, Ca, and Fe. The hydrothermal zircon REE pattern can reflect that of the minerals that were replaced during hydrothermal event.
Studies of the composition, REE patterns and Raman spectra of zircon from sites with uranium mineralization have shown that the degree of alteration of zircon from granitoids in areas with hydrothermal activity depends on the uranium content in the zircon. The processes of zircon alteration reflect the redistribution of uranium in the rocks.

Author Contributions

Conceptualization, T.K.; methods, L.L., V.K. and V.B.; investigation, T.K., V.I., and L.L.; writing—original draft preparation, T.K. and M.G. All authors have read and agreed to the published version of the manuscript.

Funding

The work was performed in the framework of the State Contract No. 0226-2019-0052 of GI KSC RAS and conducted using an equipment of the “Geomodel” resource center of the St. Petersburg State University Science Park.

Acknowledgments

The authors are grateful to S. Simakin and E. Potapov for REE analysis of zircon and to the reviewers for all the constructive comments they provided to improve this manuscript.

Conflicts of Interest

The authors declare no conflict of interest.

References

  1. Cherniak, D.J.; Watson, E.B. Pb diffusion in zircon. Chem. Geol. 2001, 172, 5–24. [Google Scholar] [CrossRef]
  2. Harley, S.L.; Kelly, N.M.; Möller, A. Zircon behaviour and the thermal histories of mountain chains. Elements 2007, 3, 25–30. [Google Scholar] [CrossRef]
  3. Corfu, F.; Hanchar, J.M.; Hoskin, P.W.O.; Kinny, P. Atlas of zircon textures. Rev. Mineral. Geochem. 2003, 53, 469–500. [Google Scholar] [CrossRef]
  4. Tomaschek, F.; Kennedy, A.K.; Villa, I.M.; Lagos, M.; Ballhaus, C. Zircons from Syros, Cyclades, Greece—Recrystallization and mobilization of zircon during high-pressure metamorphism. J. Petrol. 2003, 44, 1977–2002. [Google Scholar] [CrossRef] [Green Version]
  5. Geisler, T.; Schaltegger, U.; Tomaschek, F. Re-equilibration of zircon in aqueous fluids and melts. Elements 2007, 3, 43–50. [Google Scholar] [CrossRef]
  6. Hoskin, P.W.O.; Black, L.P. Metamorphic zircon formation by solid-state recrystallization of protolith igneous zircon. J. Metamorph. Geol. 2000, 18, 423–439. [Google Scholar] [CrossRef]
  7. Nasdala, L.; Hanchar, J.M.; Rhede, D.; Kennedy, A.K.; Váczi, T. Retention of uranium in complexly altered zircon: An example from Bancroft, Ontario. Chem. Geol. 2010, 269, 290–300. [Google Scholar] [CrossRef] [Green Version]
  8. Nasdala, L.; Kronz, A.; Wirth, R.; Váczi, T.; Pérez-Soba, C.; Willner, A.; Kennedy, A.K. The phenomenon of deficient electron microprobe totals in radiation-damaged and altered zircon. Geochim. Cosmochim. Acta 2009, 73, 1637–1650. [Google Scholar] [CrossRef] [Green Version]
  9. Watson, E.B.; Harrison, T.M. Zircon saturation revisited: Temperature and composition effects in a variety of crustal magma types. Earth Planet. Sci. Lett. 1983, 64, 295–304. [Google Scholar] [CrossRef]
  10. Watson, E.B. Dissolution, growth and survival of zircons during crustal fusion: Kinetic principles, geological models and implications for isotopic inheritance: Transactions of the Royal Society of Edinburgh. Earth Sci. 1996, 87, 43–56. [Google Scholar]
  11. Rizvanova, N.G.; Levchenkov, O.A.; Belous, A.E. The dynamics of the interaction of zircon with hydrothermal carbonate fluid. Geochem. Int. 1996, 34, 226. [Google Scholar]
  12. Mathieu, R.; Zetterström, L.; Cuney, M.; Gauthier-Lafaye, F.; Hidaka, H. Alteration of monazite and zircon and lead migration as geochemical tracers of fluid paleocirculations around the Oklo–Okélobondo and Bangombé natural nuclear reaction zones (Franceville basin, Gabon). Chem. Geol. 2001, 171, 147–171. [Google Scholar] [CrossRef]
  13. Ewing, R.C.; Medrum, A.; Wang, L.; Weber, W.J.; Corrales, L.R. Radiation effects in zircon. Rev. Mineral. Geochem. 2003, 53, 387–425. [Google Scholar] [CrossRef]
  14. Krogh, T.E.; Davis, G.L. Alteration in zircons and differential dissolution of altered and metamict zircon. Carnegie Inst. Wash. Year B 1975, 74, 619–623. [Google Scholar]
  15. Rimša, A.; Whitehouse, M.J.; Johansson, L.; Piazolo, S. Brittle fracturing and fracture healing of zircon: An integrated cathodoluminescence, EBSD, U-Th-Pb, and REE study. Am. Mineral. 2007, 92, 1213–1224. [Google Scholar] [CrossRef]
  16. Reddy, S.M.; Timms, N.E.; Pantleon, W.; Trimbly, P. Quantitative characterization of plastic deformation of zircon and geological implications. Contrib. Mineral. Petrol. 2007, 153, 625–645. [Google Scholar] [CrossRef] [Green Version]
  17. Timms, N.E.; Kinny, P.D.; Reddy, S.M.; Evans, K.; Clark, C.h.; Heal, D. Relationship among titanium, rare earth elements, U–Pb ages and deformation microstructures in zircon: Implications for Ti-in-zircon thermometry. Chem. Geol. 2011, 280, 33–46. [Google Scholar] [CrossRef]
  18. Pidgeon, R.T.; Nemchin, A.A.; Hitchen, G.J. Internal structures of zircons from Archean granites from the Darling Range batholith: Implications for zircon stability and the interpretation of zircon U-Pb ages. Contrib. Mineral. Petrol. 1998, 132, 288–299. [Google Scholar] [CrossRef]
  19. Hoskin, P.W.O. Trace-element composition of hydrothermal zircon and the alteration of Hadean zircon from the Jack Hills, Australia. Geochim. Cosmochim. Acta 2005, 69, 637–648. [Google Scholar] [CrossRef]
  20. Pidgeon, R.T.; Nemchin, A.A.; Cliff, J. Interaction of weathering solutions with oxygen and U-Pb isotopic systems of radiation-damaged zircon from an Archean granite, Darling Range Batholith, Western Australia. Contrib. Mineral. Petrol. 2013, 166, 511–523. [Google Scholar] [CrossRef]
  21. Bouvier, A.-S.; Ushikubo, T.; Kita, N.T.; Cavosie, A.J.; Kozdon, R.; Valley, J.W. Li isotopes and trace elements as a petrogenetic tracer in zircon: Insights from Archean TTGs and sanukitoids. Contrib. Mineral. Petrol. 2012, 163, 745–768. [Google Scholar] [CrossRef]
  22. Rayner, N.; Stern, R.A.; Carr, S.D. Grain-scale variations in trace element composition 753 of fluid-altered zircon, Acasta Gneiss Complex, northwestern Canada. Contrib. Mineral. Petrol. 2005, 148, 721–734. [Google Scholar] [CrossRef]
  23. Fu, B.; Mernagh, T.P.; Kita, N.T.; Kemp, A.I.; Valley, J.W. Distinguishing magmatic zircon from hydrothermal zircon: A case study from the Gidginbung high-sulphidation Au-Ag-(Cu) deposit, SE Australia. Chem. Geol. 2009, 259, 131–142. [Google Scholar] [CrossRef]
  24. Wayne, D.M.; Sinha, A.K. Physical and chemical response of zircons to deformation. Contrib. Mineral. Petrol. 1988, 98, 109–121. [Google Scholar]
  25. Rubin, N.J.; Henry Ch, D.; Price, J.G. The mobility of zirconium and other “immobile” elements during hydrothermal alteration. Chem. Geol. 1993, 110, 29–47. [Google Scholar] [CrossRef]
  26. Watson, E.B.; Cherniak, D.J.; Hanchar, J.M.; Harrison, T.M.; Wark, D.A. The incorporation of Pb into zircon. Chem. Geol. 1997, 141, 19–31. [Google Scholar] [CrossRef]
  27. Pettke, T.; Audétat, A.; Schaltegger, U.; Heinrich, C.A. Magmatic-to-hydrothermal crystallization in the W–Sn mineralized Mole Granite (NSW, Australia): Part II: Evolving zircon and thorite trace element chemistry. Chem. Geol. 2005, 220, 191–213. [Google Scholar] [CrossRef]
  28. Wei, H.; Xu, J.; Zhang, G.; Cheng, X.; Chu, H.; Bian, C.; Zhang, Z. Hydrothermal Metasomatism and Gold Mineralization of Porphyritic Granite in the Dongping Deposit, North Hebei, China: Evidence from Zircon Dating. Minerals 2018, 8, 363. [Google Scholar] [CrossRef] [Green Version]
  29. Courtney-Davies, L.; Ciobanu, C.L.; Verdugo-Ihl, M.R.; Slattery, A.; Cook, N.J.; Dmitrijeva, M.; Keyser, W.; Wade, B.P.; Domnick, U.I.; Ehrig, K.; et al. Zircon at the Nanoscale Records Metasomatic Processes Leading to Large Magmatic–Hydrotherma Ore Systems. Minerals 2019, 9, 364. [Google Scholar] [CrossRef] [Green Version]
  30. Savitsky, A.V.; Gromov Yu, A.; Mel’nikov, E.V.; Sharikov, P.I. Uranium mineralization in the Litsa district of the Kola Peninsula (Russia). Geol. Ore Depos. 1995, 5, 403–416. (In Russian) [Google Scholar]
  31. Glebovitsky, V.A. Early Precambrian of the Baltic Shield; Nauka: St. Petersburg, Russia, 2005; p. 711. (In Russian) [Google Scholar]
  32. Kaulina, T.V.; Kalinin, A.A.; Il’chenko, V.L.; Gannibal, M.A.; Avedisyan, A.A.; Elizarov, D.V.; Nerovich, L.I.; Nitkina, E.A. Age and formation conditions of U mineralization in the Litsa area and the Salla-Kuolajarvi zone (Kola region, Russia). Minerals 2018, 8, 563. [Google Scholar] [CrossRef] [Green Version]
  33. Serov, L. Métallogenèse de L’uranium dans la Région de Litsa (Péninsule de Kola, Russie). Ph.D. Thesis, Nancy Université Henry Poincaré (en Géosciences), Nancy, France, 24 June 2011. [Google Scholar]
  34. Thompson, J.; Meffre, S.; Maas, R.; Kamenetsky, V.; Kamenetsky, M.; Goemann, K.; Ehrig, K.; Danyushevsky, L. Matrix effects in Pb/U measurements during LA-ICP-MS analysis of the mineral apatite. J. Anal. At. Spectrom. 2016, 31, 1206–1215. [Google Scholar] [CrossRef]
  35. Huang, Q.; Kamenetsky, V.S.; McPhie, J.; Ehrig, K.; Meffre, S.; Maas, R.; Thompson, J.; Kamenetsky, M.; Chambefort, I.; Apukhtina, O.; et al. Neoproterozoic (ca. 820–830 Ma) mafic dykes at Olympic Dam, SouthAustralia: Links with the Gairdner Large Igneous Province. Precambrian Res. 2015, 271, 160–172. [Google Scholar] [CrossRef]
  36. Ludwig, K.R. Isoplot/Ex version 3.60: A Geochronological Toolkit for Microsoft Excel; Berkeley Geochronology Center: Berkeley, CA, USA, 2008; p. 4. [Google Scholar]
  37. Fedotova, A.A.; Bibikova, E.V.; Simakin, S.G. Ion-microprobe zircon geochemistry as an indicator of mineral genesis during geochronological studies. Geochem. Int. 2008, 46, 912–927. [Google Scholar] [CrossRef]
  38. Myskova, T.A.; Berezhnaya, N.G.; Glebovitsky, V.A.; Mil’kevich, R.I.; Lepekhina, E.N.; Matukov, D.I.; Antonov, A.V.; Sergeev, S.A.; Shuleshko, I.K. Findings of the Oldest (3600 Ma) Zircons in Gneisses of the Kola Group, Central Kola Block, Baltic Shield: Evidence from U–Pb (SHRIMP-II) Data. Dokl. Earth Sci. 2005, 402, 547–550. [Google Scholar]
  39. Hoskin, P.W.O.; Schaltegger, U. The Composition of zircon and igneous and metamorphic petrogenesis. Rev. Mineral. Geochem. 2003, 53, 27–62. [Google Scholar] [CrossRef]
  40. McDonough, W.F.; Sun, S.-S. The composition of the Earth. Chem. Geol. 1995, 120, 223–253. [Google Scholar] [CrossRef]
  41. Nasdala, L.; Irmer, G.; Wolf, D. The degree of metamictization in zircon: A Raman spectroscopic study. Eur. J. Miner. 1995, 7, 471–478. [Google Scholar] [CrossRef] [Green Version]
  42. Dawson, P.; Hargreave, M.M.; Wilkinson, G.R. The vibrational spectrum of zircon (ZrSiO4). Phys. C Solid St. Phys. 1971, 4, 240–256. [Google Scholar] [CrossRef]
  43. Kolesov, B.A.; Geiger, C.A.; Armbruster, T. The dynamic properties of zircon studied by single-crystal X-ray diffraction and Raman spectroscopy. Eur. J. Miner. 2001, 13, 939–948. [Google Scholar] [CrossRef] [Green Version]
  44. Titorenkova, R.; Mihailova, B.; Konstantinov, L. Raman spectroscopic study of variably recrystallized metamict zircon from amphibolite-facies metagranites, Serbo-Macedonian massif, Bulgaria. Can. Mineral. 2006, 44, 1357–1366. [Google Scholar] [CrossRef] [Green Version]
  45. Zhang, M.; Salje, E.K.H.; Farnan, I.; Graeme-Barber, A.; Daniel, P.; Ewing, R.C.; Clark, A.M.; Leroux, H. Metamictization of zircon: Raman spectroscopic study. J. Phys. 2000, 12, 1915–1925. [Google Scholar] [CrossRef]
  46. Belousova, E.A.; Griffin, W.L.; O’Reilly, S.Y.; Fisher, N.I. Igneous zircon: Trace element composition as an indicator of source rock type. Contrib. Miner. Petrol. 2002, 143, 602–622. [Google Scholar] [CrossRef]
  47. Levchenkov, O.A.; Levsky, L.K.; Nordgulen, Ø.; Dobrzhinetskaya, L.F.; Vetrin, V.R.; Cobbing, J.; Nilsson, L.P.; Sturt, B.A. U-Pb zircon ages from Sörvaranger, Norway and the western part of the Kola Peninsula, Russia. Nor. Geol. Unders. Spec. Publ. 1995, 7, 29–47. [Google Scholar]
  48. Kozlov, N.E.; Sorokhtin, N.O.; Glaznev, V.N.; Kozlova, N.E.; Ivanov, A.A.; Kudryashov, N.M.; Martynov, E.V.; Tyuremnov, V.A.; Matyushkin, A.V.; Osipenko, L.G. Geology of the Archean of the Baltic Shield; SPb Science: St.Petersburg, Russia, 2006; p. 345. (In Russian) [Google Scholar]
  49. Rubatto, D. Zircon—the metamorphic mineral. Rev. Mineral. Geochem. 2017, 83., 261–295. [Google Scholar] [CrossRef]
  50. Kaulina, T.V.; Sinai, M.Y.; Savchenko, E.E. Crystallogenetic models for metasomatic replacement in zircons: Implications for U-Pb geochronology of Precambrian rocks. Int. Geol. Rev. 2015, 57, 1526–1542. [Google Scholar] [CrossRef]
  51. Skublov, S.G. Geochemistry of Rare-Earth Elements in Rock-Forming Metamorphic Minerals; Nauka: St. Petersburg, Russia, 2005; p. 147. (In Russian) [Google Scholar]
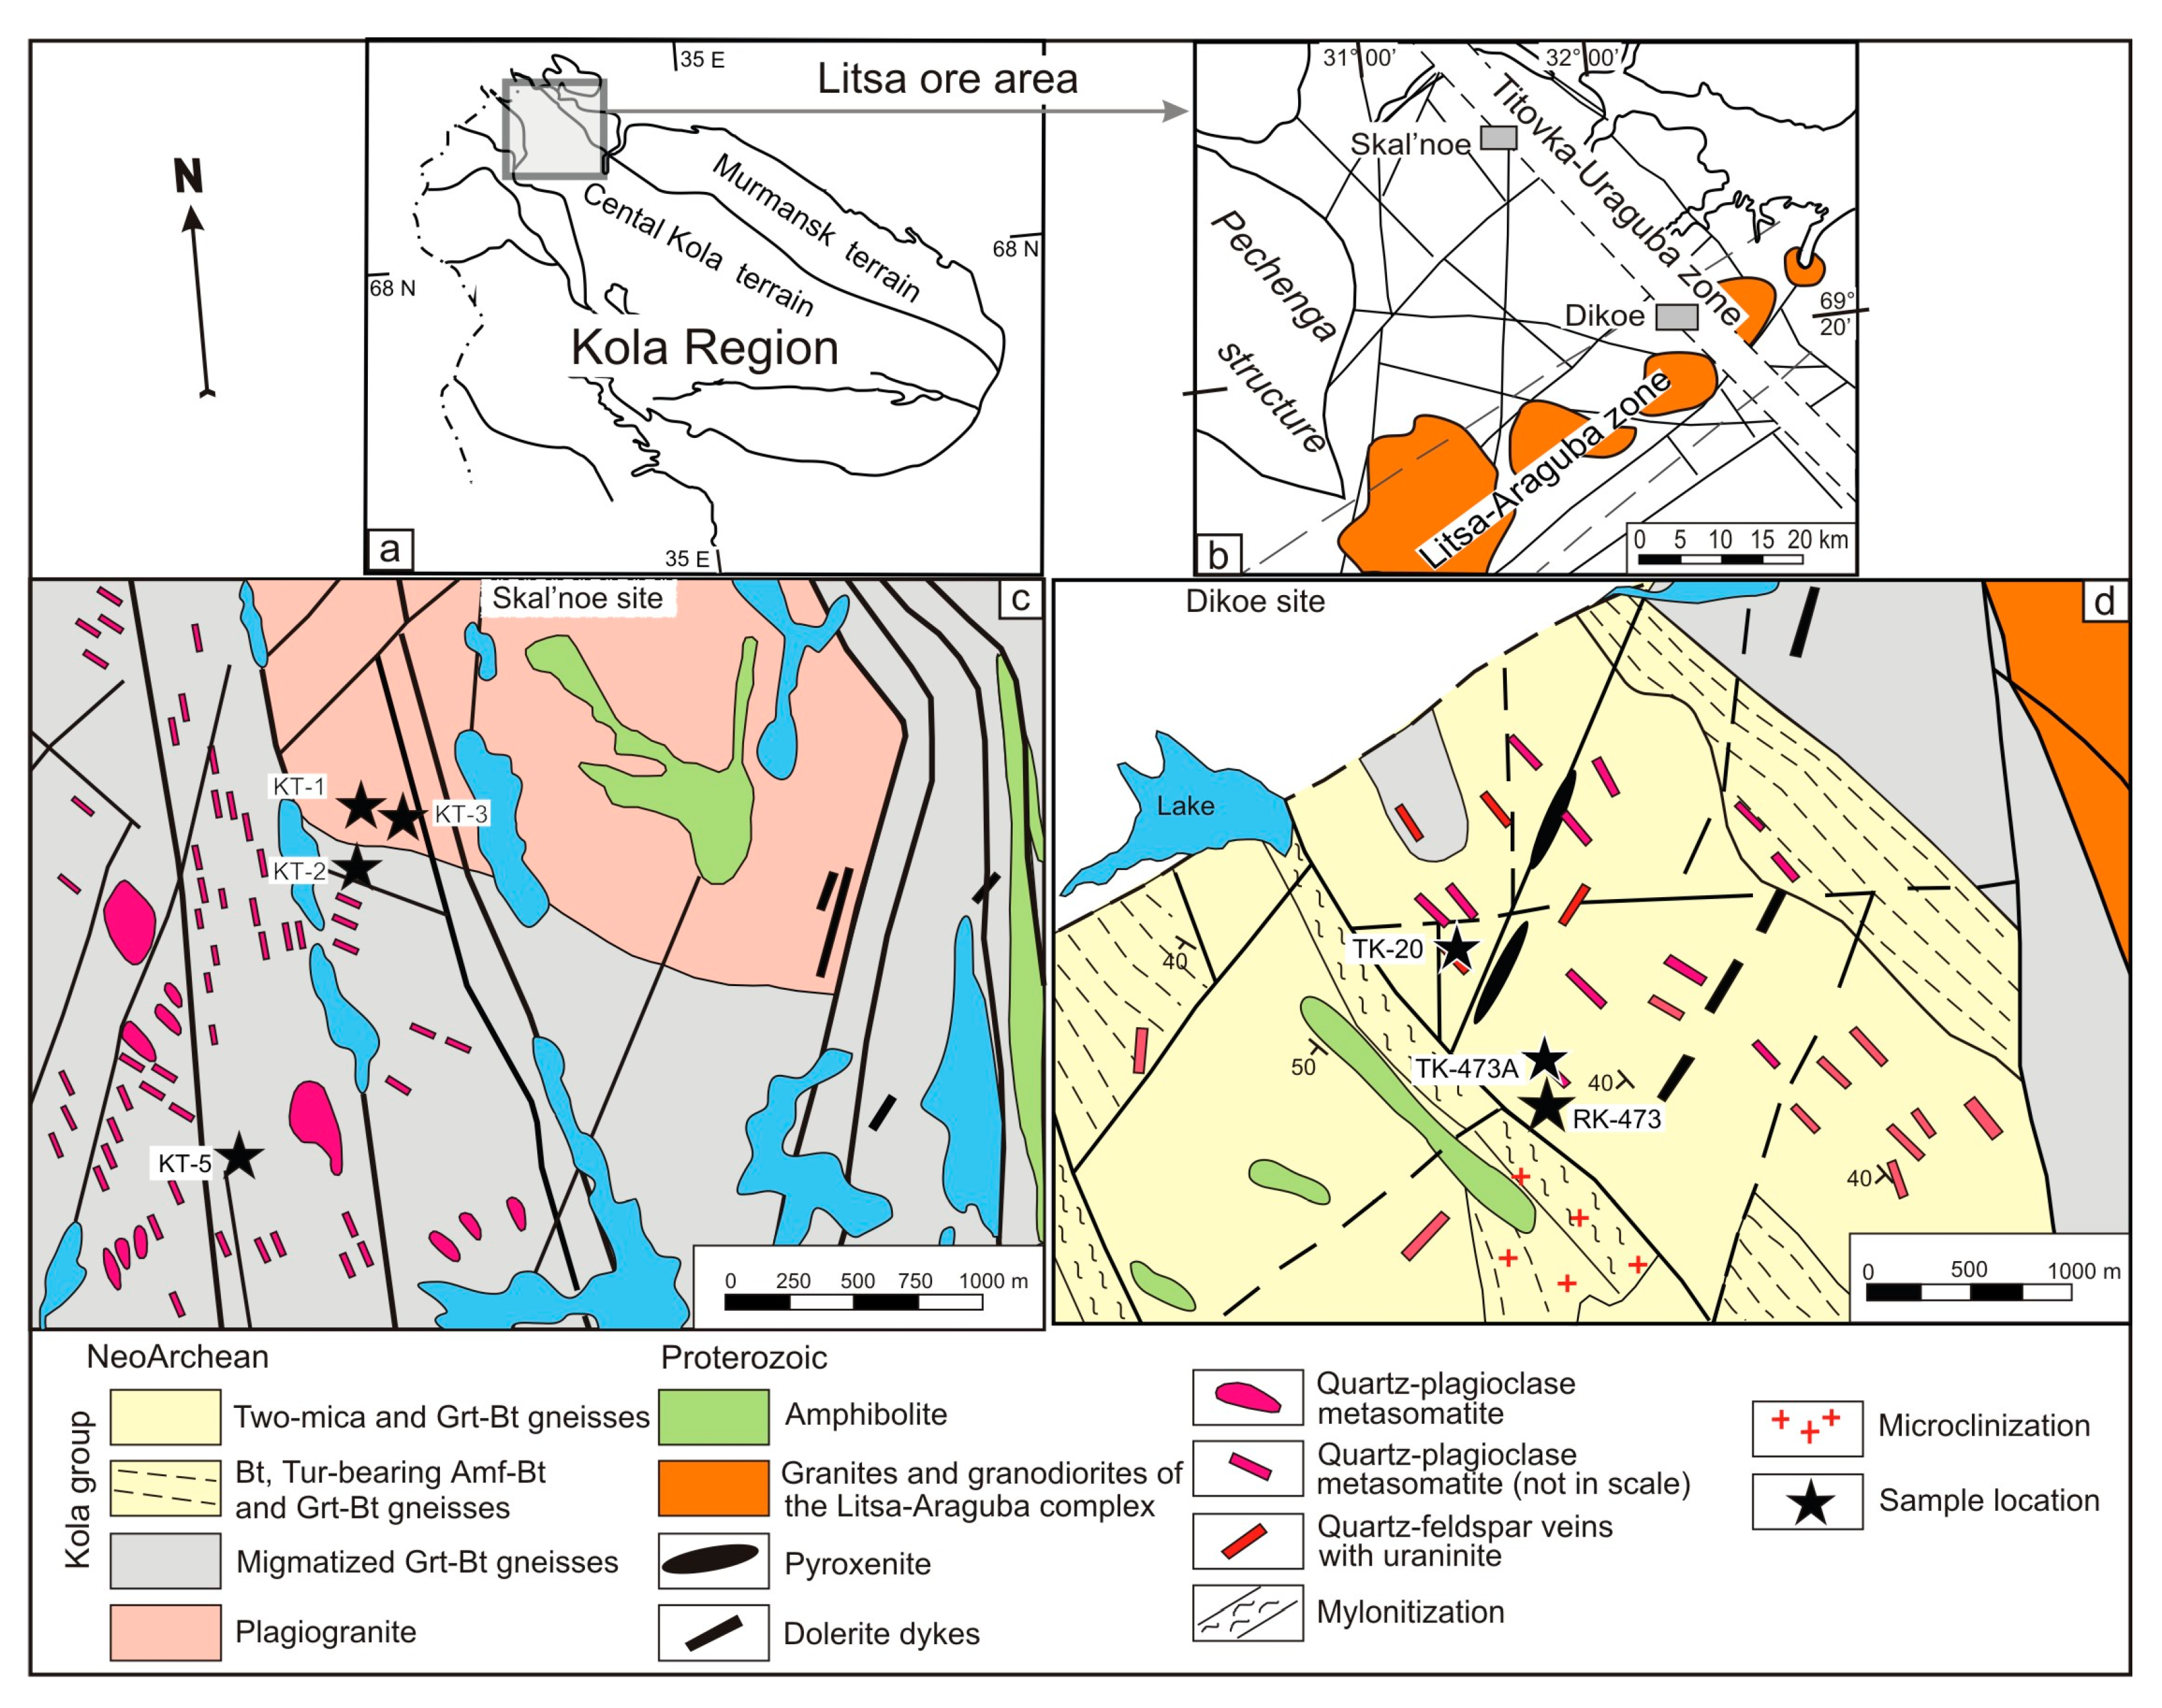
Figure 1. (a)—Geological position of the Litsa area within the Kola region and location of Skal’noe and Dikoe ore occurrences within the Litsa area—(b), (c,d)—fragments of geological maps of the Skal’noe and Dikoe sites (after [33]), illustrating rock varieties composed the area, location of quarts–feldspar metasomatic bodies and veins, and sampling points. Bt—biotite, Tur—tourmaline, Amf—amphibole, Grt—garnet.
Geosciences 10 00278 g001
Figure 2. Cathodoluminescent images of zircon crystals from granites of the Dikoe site with points of LA–ICPMS analyzes and 207Pb/206Pb ages obtained for the studied domains. See text for explanation.
Geosciences 10 00278 g002
Figure 3. Isotope U-Pb data for zircon from granitoids of the Ska’noe site of the Litsa area: (a,b)—for plagiogranites, (c)—for monzogranites, (d)—for muscovite-biotite gneisses. Data-points error boxes are 1 σ.
Geosciences 10 00278 g003
Figure 4. Back-scattered electron (BSE) images and rare earth elements (REE) pattern for zircon from rocks of the Skal’noe and Dikoe sites of the Litsa area: (a)—plagiogranite, (b)—gneiss, (c)—metasomatite, (d)—pegmatoid vein. REE data normalized to the C1 chondrite [40].
Geosciences 10 00278 g004
Figure 5. Raman spectrum for zircon grains from rocks of the Skal’noe site: (a)—plagiogranite, (b)—muscovite-biotite gneiss, (c)—metasomatite. The number of spectra corresponds to analytical points on cathodoluminescence (CL) and BSE images of zircon grains.
Geosciences 10 00278 g005
Figure 6. Main stages of zircon growth in the area.
Geosciences 10 00278 g006
Table 1. Laser ablation inductively coupled plasma mass spectrometry (LA–ICPMS) analysis of zircon from granitoids of the Skal’noe site of the Litsa area.
Spot NoIsotope Composition, ppmIsotope RatiosAge, Ma
Pb totPb com232Th238U232Th
/238U
207Pb/
235U
±1σ %206Pb/
238U
±1σ %207Pb/
206Pb
206Pb/
238U
KT-1—plagiogranite
13531.1156020.0211.601.00.45981.02680 ± 42368 ± 25
24530.951013720.016.640.90.27490.92608 ± 31428 ± 13
32880.97717400.108.711.50.29121.52958 ± 41434 ± 21
41071.1341760.2014.521.00.51551.02860 ± 42609 ± 29
62000.93118490.014.311.30.20891.32341 ± 41127 ± 15
7361.118500.3615.270.90.55390.92826 ± 52841 ± 32
KT-2—gneissic plagiogranite
83551.1165860.0313.080.80.51460.82692 ± 32670 ± 24
91951.153430.0111.921.00.49171.02613 ± 32567 ± 29
103191.185270.0112.931.10.51911.12659 ± 32696 ± 33
111970.892914040.022.041.10.12681.11903 ± 5723 ± 8
121760.892813810.021.821.50.11571.51870 ± 8663 ± 9
141701.11232450.5014.421.10.51491.12851 ± 32610 ± 32
152231.11062750.3916.431.10.61511.12774 ± 33090 ± 48
161581.11292140.6015.220.90.55070.92830 ± 42827 ± 30
KT-3—monzogranite
177400.954523390.025.991.30.26121.32521 ± 31373 ± 17
186460.9219124090.084.651.30.20141.32532 ± 41064 ± 14
192080.881116530.011.581.30.11001.31696 ± 4639 ± 8
KT-5—muscovite-biotite gneiss
204201.05558440.669.411.20.36851.22700 ± 31884 ± 22
213011.12144960.4312.031.20.45611.22753 ± 32325 ± 29
22431.127620.4414.350.90.53180.92790 ± 52732 ± 29
231761.0723190.2311.251.40.45051.42664 ± 32323 ± 33
241611.1662350.2814.580.80.54390.82780 ± 32800 ± 28
252981.1954340.2215.070.80.54950.82817 ± 32823 ± 27
26701.1105971.0912.970.90.49100.92755 ± 42514 ± 25
274071.03658310.448.931.20.35811.22661 ± 31841 ± 21
Table 2. REE composition of zircons from granitoids of the Skal’noe and Dikoe sites of the Litsa area.
SpotREE Content (ppm)
LaCePrNdSmEuGdDyErYbLu∑REEThU
KT-1 plagiogranite
10.172.20.040.491.10.436.1234696181935.523
2181501810222123751761753469411962
367323352136229103128213506831760834104
44918221116341750497423142866232017
51110913945421106176271449771382110407
6995568554916262206136172382682477191952
70.41100.222.83.71.419701643646870466156
Sample RK-473 muscovite-biotite gneiss.
12811311532075218841579112318023341090
219535.228124.034127304759131147595948
30.27240.192.44.21.0251172955931031166239662
42.0160.714.01.60.515.6245913926279104426
TK-473A metasomatite
11203083012440157724947391014324881426624
29.1848.554383.483186295517881364331535
34435124419248919124448896715232731046759
46144547280122511952432173977421322021397
TK-20 vein pegmatoid granite
16331027137682413422434161810020456301182
2182717104585221207310206233450763291182688
318191811584257026710357339071569244738117152588
415295613391261319112691516115915852758760446561
5296146422812714563455514054438381416437263876
65730647273121621481532817731382359351645
71.6160.543.44.91.22494200362607682491315