Abstract
Despite the difficulties in obtaining the ultimate capacity of the large diameter bored piles (LDBP) using the in situ loading test, this method is the most recommended by several codes and design standards. However, several settlement-based approaches, alongside the conventional capacity-based design approach for LDBP, are proposed in the event of the impossibility of performing a pile-loading test during the design phase. With that in mind, natural clays usually involve some degree of over consolidation; there is considerable debate among the various approaches on how to represent the behavior of the overconsolidated (OC)stiff clay and its design parameters, whether drained or undrained, in the pile-load test problems. In this paper, field measurements of axial loaded to failure LDBP load test installed in OC stiff clay (Alzey Bridge Case Study, Germany) have been used to assess the quality of two numerical models established to simulate the pile behavior in both drained and undrained conditions. After calibration, the load transfer mechanism of the LDBP in both drained and undrained conditions has been explored. Results of the numerical analyses showed the main differences between the soil pile interaction in both drained and undrained conditions. Also, field measurements have been used to assess the ultimate pile capacity estimated using different methods.
1. Introduction
The in situ full-scale loading test is the most recommended methodology by several international design standards to determine the ultimate capacity of the large diameter bored piles (LDBP). However, loading of this class of piles till reaching apparent failure is practically seldom. The pile load-settlement performance at failure state is a challenge, especially for the large diameter bored piles, as failure is difficult to be achieved through the full-scale loading tests [1,2,3]. Nevertheless, many would agree that the ultimate pile bearing capacity can be defined as the load at which a considerable increase in the pile settlement occurs under sustained or slight increase of the applied load [1], i.e., the pile plunges.
Numerical analysis has recently become a powerful method and reliable tool widely used for solving many geotechnical problems. Many authors have discussed numerical studies related to soil-structure interaction and the axially loaded single pile [2,3,4,5,6,7]. Despite that rarity of the available loading tests on LDBP that achieved apparent failure was the main reason that the measurements of the well-documented Alzey bridge case history have been utilized in many numerical studies performed by several researchers, e.g., [3]; and [7].
Unfortunately, given the conclusions drawn in those studies, the findings of these numerical analyses did not indicate an agreement with field measurements at the state of failure. For instance, a back-analysis study [7] has been performed for the mentioned LDBP load test (Alzey bridge case study), and it was concluded that it is necessary to perform more back analyses of pile load tests to achieve better agreement with field measurements and give general recommendations. In another numerical study [3] conducted to simulate the same field case study, it was concluded that the finite element models performed were able to predict the deformation under the working load accurately but were not capable of simulating the load-deformation behavior adequately beyond the working load.
Such a disagreement between the calculated and the measured values may exist because of many numerical factors. A highly sensitive numerical model is often required to simulate the behavior of the LDBP at the failure state. The most expected responsible factors for the disagreement between the field measurements and the numerical results at higher loads may be due to one or all of the following factors; mesh size and dependency, model sensitivity to geometry dimensions, nonlinear analysis methodologies (convergence criterion), constitutive soil model and the adopted properties, and finally the construction effect represented in both interface element and drainage condition.
Natural clays usually involve some degree of over consolidation (OC) because of the process of mechanical unloading such as erosion, excavations, and changes in groundwater pressures. Uniform undrained cycles of loading on the overconsolidated clays lead to an accumulation of shear, induced pore pressures and can cause failure even when the magnitude of the shear stress is a fraction of the monotonic undrained shear strength of the clay [8]. Thus, the coupling of shear and volumetric behavior is required for accurate modeling of overconsolidated clays under cyclic loading [9] even at small or medium stress (or strain) levels. In general, the soil is a multiphase material; its stress, strain, and strength are represented by pressure dependency with coupling between shear and volumetric behavior [10]. For example, during drained shearing, dense sands and highly over-consolidated clays tend to dilate, whereas, loose sands and normally consolidated clays tend to contract.
The tendency of soil to either dilate or contract in shear often defines if the key design parameters will be either the drained shear strength (c′ and φ′) or the undrained shear strength (su) [11]. Porous materials like soils have different design properties under drained and undrained conditions. The existence of either a drained or an undrained condition in a soil depends on: soil type, geological formation (i.e., fissures, etc.), and rate of loading.
The literature review shows that there is a considerable debate on how to model or consider the behavior of the OC stiff clay and its design parameters in the pile axial loading problems. Several numerical studies have utilized the drained condition to define the behavior of the overconsolidated stiff clay [3,7]. This was explained by the micro-fissures associated with the OC stiff clay that may provide avenues for local drainage, soil along fissures has softened (increased water content) and is softer than intact material. However, on the other side, some field and experimental studies (i.e., [12,13,14]) mainly investigated the behavior of piles installed in overconsolidated stiff clay using the undrained design parameters.
This paper discusses the response of the large-diameter bored piles installed in predominately OC stiff clay. Two numerical models are established to simulate both drained and undrained behavior of an axial loaded to failure large diameter bored pile load test (Alzey Bridge Case Study). Whereas the in situ test achieved the failure, the sensitivity of those numerical models is an issue. The results of the numerical models are assessed by comparing the settlement and ultimate pile capacity obtained with the field measurements. This evaluation also highlights the main differences of LDBP behavior in both drainage conditions. The results of these numerical results are used to evaluate the estimated pile ultimate capacity using different international codes and design methods.
2. In Situ Pile-Loading Test
A full-scale, and well-instrumented pile-loading test has been performed by Sommer [12] for a single large diameter bored pile (LDBP) with length and diameter of 9.50 m and 1.30 m, respectively. This pile was constructed in a homogeneous over-consolidated stiff clay soil layer. The consistency limits were determined as 0.80 and 0.20 for liquid limit and plastic limit, respectively. Also, soil water content was obtained as 22%. The groundwater table was 3.5 m below the ground surface. Average unconfined compressive strength (Qu) along borehole length was obtained as 300 kN/m2, as given in Figure 1.
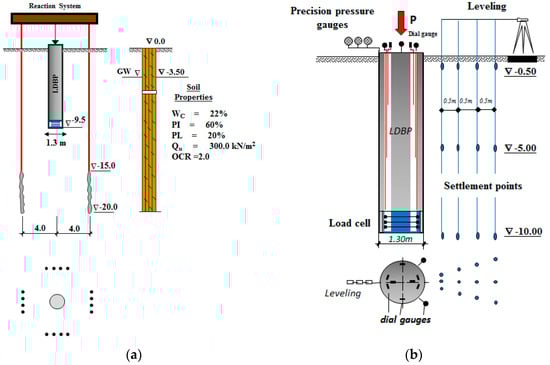
Figure 1.
Large diameter bored pile load test [12]. (a) Test arrangement and typical soil profile with mechanical properties (Modified from [12]). (b) Measuring devices and instrumentations (Modified from [12]).
Components of the reaction system used in the large-diameter pile-loading test are given in Figure 1a. The system consisted of steel girders held by 20.0 m length of burden anchors. In order to ascertain that anchors’ positions would not affect the pile-bearing and skin friction results, the compression anchors were allocated at a horizontal distance equals three times of pile diameter (4.0 m), from the pile central loading axis (Figure 1a). Also, the anchors were vertically extended to 15 to 20 m depth below the ground surface. Figure 1b presents the instrumentations and measuring devices that have been used in the loading test. Pile was equipped with an end bearing prefabricated concrete base containing a load cell to measure the transferred stresses at the pile base level. The load cell was placed immediately under the pile base. The difference between the load cell measurement and the applied load gave the transferred load by friction. In addition, ground settlement points with steel rods of 25 mm diameter have been used to measure the settlement of the soil near the pile. These settlement points were protected by plastic pipes and installed at a horizontal distance of 0.5 m, 1.0 m, 1.5 m, and 2.0 m from the pile’s shaft. Three different levels were assigned for the settlement points. These levels were −0.50 m below ground surface, at the middle of the pile length at the level of −5.00 m, and under the pile base at the level of −10.00 m (Figure 1b). Furthermore, pile settlement was measured using dial gauges at the head level and also monitored using a concreted precision leveling device.
Figure 2 shows the in situ measurements of the loading test. Pile settlement values measured using the dial gauges under each applied loading increment; also, the respective values of bearing stress, unit skin friction, and the total applied pressure are given in the same figure.
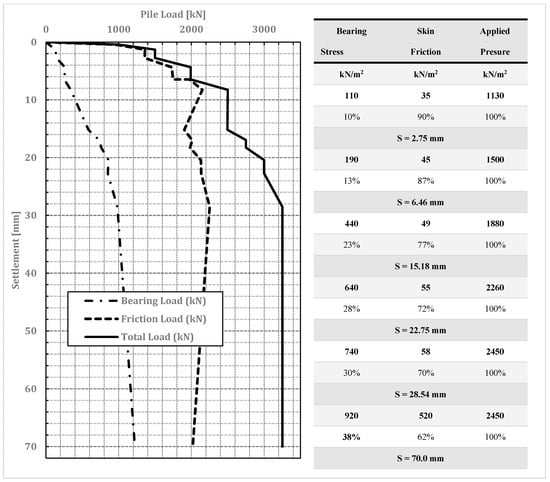
Figure 2.
In situ measurements of the well-instrumented large diameter bored pile (Modified from [12]).
3. Numerical Modelling
The established models should simulate the behavior of the loaded to failure, large diameter bored pile, of the Alzey bridge case study, so that the sensitivity of the established model is very important to achieve good agreement between the numerical and field results at the failure state. In this regard, several sensitivity analyses are conducted to adopt the optimum mesh size and geometry dimensions that can accurately represent the simulated case study.
3.1. Methodology
Two-dimensional axisymmetric models are used in this study. For the established models, the external boundaries are supported to avoid the numerical instability (singularity) of the finite element model. The left and right sides are taken as fixed in the lateral-direction, and free to settle in the vertical direction. Fixed supports are employed at the bottom boundary in both the horizontal and vertical directions. Conversely, the top boundary is considered free.
The analysis is divided into three stages; the first stage represents the initial stresses of the soil before pile implementation. The second stage starts with changing the pile volume to concrete material as a replacement of soil material. At this stage, rigid interface elements are used to connect pile and soil mesh elements to avoid any numerical instability (singularity) [15], and pile self-weight is considered at this stage. The calculated deformations of the first and second stages of analysis are discarded, in order to start accounting for pile settlement due to the applied loads only. Interface elements are activated in the third stage of analysis, and the rigid interface elements are deactivated. The load is applied to the pile head in the third stage using incremental loading steps to simulate the pile-loading sequence with the same field loading test steps (see Figure 2).
The load transfer mechanism of the LDBP is investigated, using the numerical models, by determining the pile bearing load at each loading increment utilizing the obtained bearing stress at the pile base level. Pile friction resistance is calculated by deducting the bearing load from the total applied amount. Thus, the relation between pile settlement and ultimate bearing, friction, and total capacities can be constructed.
Fundamental to note that in this evaluation, the finite element analysis criteria mainly aspires to achieve the failure load by applying load with a value greater than the ultimate load measured in the field study [12], to allow the finite element solver to achieve the failure according to the employed convergence criteria. The maximum load where convergence can be obtained in the numerical model is considered as the failure load. Furthermore, failure is also indicated by the apparent large settlement that is expected to be induced at the ultimate load, similar to the field-loading test results.
3.2. Mesh Dependency
Three axisymmetric 2D finite element models with different levels of mesh refinement are established with quadratic 8-noded high order elements, using Midas GTS NX package, to investigate the dependency of the mesh size and its effect on the analysis results. As shown in Figure 3a the first model is established with a coarse mesh of size ranging from 0.325 m (around the pile) to 1.0 m (at the boundaries). Medium to fine mesh with size varying from 0.21 m to 0.40 m is adopted in the second model (Figure 3b). The third model is generated with a very fine mesh of size of 0.10 m near the pile and gradually increasing to 0.20 m at boundaries location (Figure 3c).
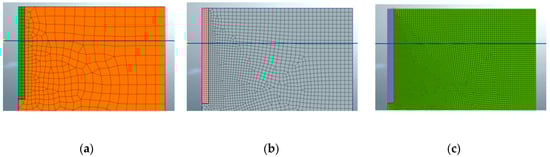
Figure 3.
Finite element meshes with different sizes. (a) Coarse mesh, (b) medium mesh, (c) fine mesh.
Noteworthy to address that the three finite element models are established in equal geometry dimensions (15 m width and 16 m depth). Also, the same constitutive model and soil parameters are adopted according to a previous study [3], which means that the mesh size was the only variable in this step of evaluation. During the analysis, it was observed that analysis time is significantly increased with decreasing mesh size. Results of pile settlement and ultimate total, bearing and friction resistances of the three models are obtained as given in Figure 4, based on the methodology explained in the previous Section 3.1.
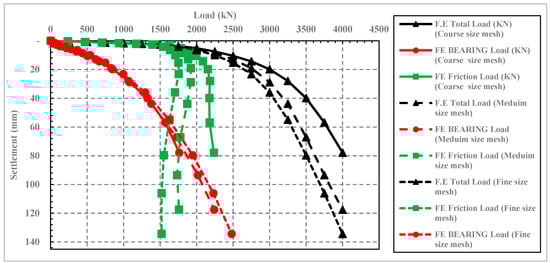
Figure 4.
Comparison between pile settlement, total, bearing, and friction resistances results of the three finite element models with different levels of mesh refinement.
Figure 4 highlights the significant effect of mesh size on pile load settlement results. As shown, the pile settlement increases with decreasing mesh size, and the model with fine mesh achieved the highest settlement values. This comparison also shows that up to working load (1500 kN) minor effect of the mesh size was observed on the results of the pile load settlement. The same observation is also exhibited in the results of the total, bearing, and friction resistance. As shown in Figure 4, at the applied load of 1500 kN, almost equal values are obtained using the three numerical models with different mesh sizes, for both bearing and friction resistances.
At higher loads, the results of the three models showed that full friction mobilization is occurred at almost equal settlement value near about 1.5% of the pile diameter (see Figure 4). In addition, the number of the mesh elements created at the pile base level affected bearing resistance results of the three models. In the coarse mesh model, there are only two elements at the pile base, while, five elements are created at the pile base of the fine mesh model. The highest bearing resistance is obtained from the model with a fine mesh (see Figure 4). This was explained by Wehnert [7], as at each mesh element, stresses are calculated at the Gauss points; accordingly, reducing the element size increases the number of these points, whereas stresses are calculated, allowing for much precise stress distribution. Besides, Wehnert [7] recommended that at least two or three elements at the pile base are required to get rid of the mesh dependency effect on pile bearing resistance results.
The mesh size also has a significant effect on the pile failure mechanism, as demonstrated in Figure 5. The formed plastic points under the last load increment are more dense and smooth in the fine mesh model results (Figure 5c) compared to the results of the coarse mesh model (Figure 5a).
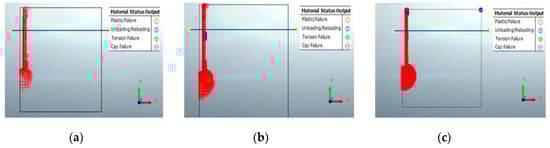
Figure 5.
The shape of the formed plastic points at the last load increment of the three finite element models with varying sizes of mesh. (a) Coarse mesh, (b) medium mesh, (c) fine mesh.
In conclusion, to justify the economic computational feasibility of the numerical model, mesh with medium to fine size (0.21 m) is to be adopted in the upcoming investigations, as it allows to have three elements at the pile base level. Also, minor differences in pile settlement and ultimate capacities results are observed between numerical results of the model with a medium to fine size mesh compared to the other with very fine size mesh.
3.3. Geometry of the Numerical Model
Ten analysis attempts are carried out with different geometry dimensions (widths and depths) to investigate the effect of boundaries position on the analysis result. The first five finite element models (Figure 6) are established with equal depths of 16 m, and different widths of 10 m (~8D), 15 m (~12D), 20 m (~16D), 25 m (~20D), and 30 m (~24D), to assess the geometry width effect on the resulted pile settlement. Simultaneously, optimum depth of geometry is explored using five numerical models (Figure 7) with equal widths of 15 m, and different depths of 16 m (~1.5L), 25 m (~2.5L), 30 m (~3L), 40 m (~4L), and 45 m (~4.5L).
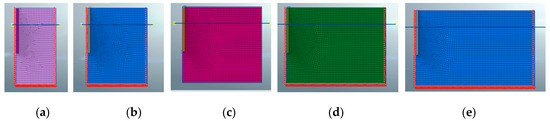
Figure 6.
Five finite element models with different widths. (a) 10 m × 16 m, (b) 15 m × 16 m, (c) 20 m × 16 m, (d) 25 m × 16 m, (e) 30 m × 16 m.
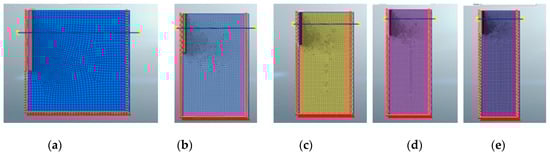
Figure 7.
Five finite element models of with different depths. (a) 15 m × 16 m, (b) 15 m × 25 m, (c) 15 m × 30 m, (d) 15 m × 40 m, (e) 15 m × 45 m.
Figure 8a,b presents the relation between the obtained pile settlement and the geometry width and depth, respectively. It can be seen that the obtained pile settlement almost becomes with constant value when model geometry width and depth are considered as 20 m (~16D) and 40 m (~4L), respectively. Therefore, these dimensions will be adopted in the upcoming analyses.
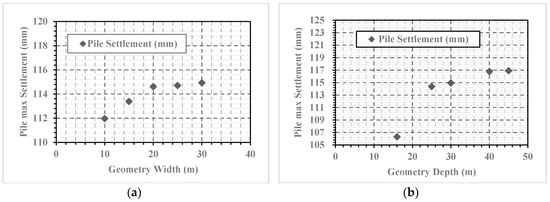
Figure 8.
Relations between maximum obtained pile settlement and model geometry. (a) Model geometry width. (b) Model geometry depth.
Based on the sensitivity analyses performed, it can be concluded that to achieve the maximum expected settlement, the numerical model should be established with high order medium to fine mesh and geometry dimensions of 20 m × 40 m to ensure that boundaries positions will not affect the results at the analysis zone. In addition, the pile should be represented by a fine mesh with a size of 0.216 m, and at least three mesh elements have to be adopted at its base.
In this evaluation, the finite element analysis criteria mainly aspire to achieve the failure load. As explained before, the maximum load where convergence can be obtained in the numerical model is considered as the failure load. For that purpose, and based on several analyses attempts performed, it is highly recommended to utilize the secant stiffness nonlinear convergence method. Moreover, it provides much stable analysis because of its ability to find convergence when the stability of analysis is an issue, as in case of approaching failure loads, or when large strains are expected [16]. Also, the maximum number of iterations per increment, and the maximum number for bisection level, are essential parameters when large strains are expected, and its recommended to be taken with high value. This may increase the computational usage, although the analysis solver would be able to complete the analysis and find a convergence, even at the last loading increment (ultimate load).
4. Drained Condition
Based on the sensitivity analyses performed, the numerical model shown in Figure 9 has been established. To satisfy both the accuracy of the results and the analysis time requirements, a compromise solution has been adopted as follows. A fine mesh with a size of 0.216 m was considered around and below the pile element (10 m width and 19.5 m depth), and gradually, soil mesh size is increased to be 0.65 m at the boundary locations.
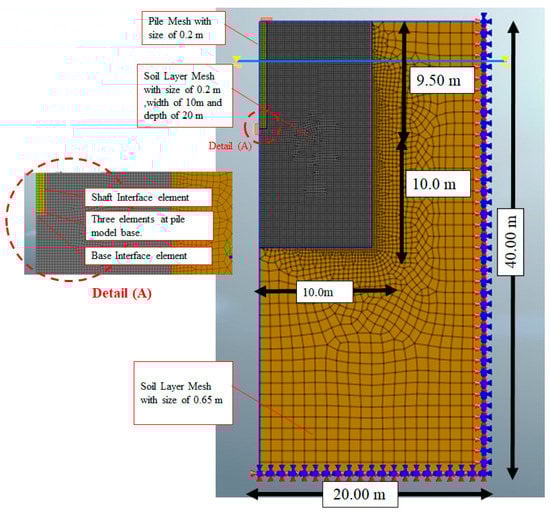
Figure 9.
(2D) axisymmetric finite element model established based on the results of the sensitivity analysis performed (After [10]).
The established model has been utilized in a drained numerical analysis, using the soil and pile parameters given in Table 1 and Table 2, respectively. Results of this study showed that an excellent agreement was obtained between the in situ measurements and finite element results in both the pile load settlement and load transfer relationships when Modified Mohr-Coulomb (MMC) constitutive model is used to simulate the overconsolidated stiff clay soil behavior. Also, the large induced pile settlement at the failure state has been accurately determined. Figure 10 shows a comparison between field measurements and the obtained results of pile bearing, friction, the total load using the calibrated FE model (drained condition). More details of the drained analysis are given in [10].

Table 1.
Over-consolidated stiff clay soil (drained parameters) (After [10]).
Table 2.
Large diameter pile structural parameters (After [10]).
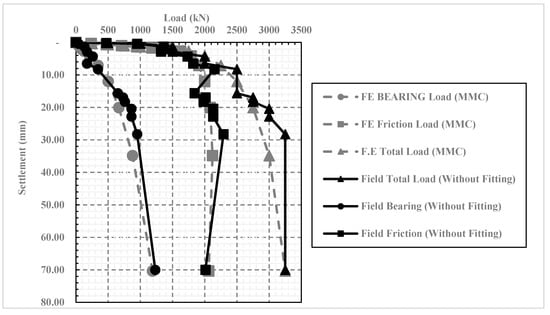
Figure 10.
Comparison between field measurements and the obtained results of pile bearing, friction, the total load using the calibrated FE model [10].
5. Undrained Condition
Based on the results presented in the drained analysis study [10], the Modified Mohr Columb constitutive model is used to simulate the overconsolidated soil in the undrained condition, as well. The influences of the other parameters, such as mesh size and model geometry, etc., are filtered out and taken with same values adopted in the calibrated drained analysis. The soil drainage condition and the corresponding changes in the soil and interface parameters are the only variables in this investigation.
Referring to the field study [12], soil undrained shear strength of 300 kN/m2 was determined using the unconfined compression test for cylindrical samples taken from the tested pile location. Therefore, the undrained cohesion is taken as 150 kN/m2 in this analysis.
The undrained soil modulus of elasticity of the overconsolidated stiff clay soil is calculated using Duncan and Buchignani method [17] utilizing the plasticity index, over consolidation ratio, and undrained soil cohesion (60%, 2.0, and 150 kN/m2). Besides, similar to the drained analysis attempt, tangential Young’s modulus E50 and unloading modulus Eur are taken as equal, and two times of Eeod respectively.
Soil undrained Passion’s ratio is exercised with 0.495 instead of 0.50 to avoid any numerical errors. Modified Mohr-Coulomb constitutive model is also used to simulate the undrained soil condition, and the drainage option is adopted with the third class [Undrained c] (Undrained stiffness\Undrained strength). Soil tensile strength is taken equal zero, to prevent any expected tensile stresses along the pile shaft, and to ensure that failure will occur because of shear. The lateral earth pressure coefficient is calculated as 1.00, according to Equation (1). Table 3 summarizes the soil parameters adopted in the undrained analysis. Pile material is defined with the same properties mentioned in the drained analysis (Table 2).
where, υ: Soil Poisson’s ratio (undrained)
K0 = υ/(1 − υ)
Table 3.
Over consolidated stiff clay undrained soil parameters.
The soil unit skin friction was measured in the field [12] through two different pile-loading tests, for two piles with different lengths of 9.50 m, and 13 m. It was stated that the average measured skin friction (α*cu) is 53 kN/m2, which represented almost about 36% of the undrained shear strength (150 kN/m2) of the clay soil around the pile shaft [12].
Two interface elements are used to simulate the reduction in soil shear strength along the pile shaft. First is the shaft interface that used to simulate the interaction between the soil and pile shaft. The second is the base interface, which represents the pile base interaction with the beneath soil.
A reduction factor (R) of 36% is considered to define the undrained adhesion of the shaft interface. Also, a reduction factor equals 1.0 is taken for the base interface, as given in Table 4. Normal (Kn) and shear (Kt) stiffness moduli are automatically calculated based on the adopted soil module of elasticity [15]. Fundamental to state that values of normal and shear stiffness modulus differ from those taken in the drained analysis [10], which is attributed to the differences in Poisson’s ratio and soil modulus of elasticity values in the undrained condition. Furthermore, interface tensile strength is taken as zero, to ensure that failure will occur because of shear not because of tension. Also, the tension cut option is considered in analysis options to avoid any tension results.
Table 4.
Interface elements parameters.
Analysis is performed with the same sequence that was presented before in Section 3.1. During the analysis, it was noted that the solver failed to find convergence at a load of 3300 kN and warned with failure.
Figure 11a compares between field measurements and the obtained pile settlement results using both drained and un-drained analyses. Perfect agreement can be seen from this figure between the results of the undrained numerical model and the field measurements. Also, failure is represented by the large apparent settlement result obtained at the last load increment. However, failure occurred at a load of 3300 kN instead of 3250 kN (failure load according to field measurements and drained analysis). It was also observed that a slightly greater settlement result is obtained at the last loading increment of the undrained analysis (77 mm). On the other side, the relation between total load, pile friction, and bearing resistances with settlement obtained using finite element undrained analysis are compared with field measurements in Figure 11b.
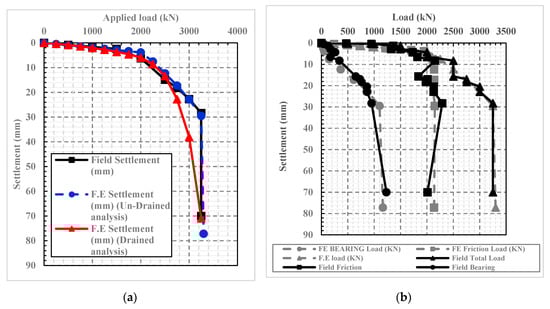
Figure 11.
Comparison between field measurements and results of the undrained numerical analysis (a) pile settlement results. (b) Pile load transfer results.
It can be seen from Figure 11b that good agreement is obtained between the undrained numerical results and the field measurements. Similar to the drained analysis results, the load is predominantly transferred by friction at the initial loads, and up to the working load of 1500 kN. Full mobilization of the friction resistance is achieved at an applied load of 2100 kN. After this load, the friction resistance becomes a constant value. In contrast, at higher loads, pile bearing resistance is obviously increased to achieve its maximum value at the load of 3250 kN. At a load of 3300 kN, a sudden substantial increase in pile settlement results, also a slight increase in the bearing resistance results is noted.
Figure 12 shows a comparison between field measurements, drained, and undrained analysis results of the total, friction, and bearing resistances. Good agreement is obtained between field measurements and both drained and undrained analyses result at the ultimate state, when a reduction factor of 0.36 and 1.0 are adopted in undrained and drained analyses, respectively. However, the obtained ultimate capacity from undrained analysis (3300 kN) is slightly higher than that obtained from the drained analysis (3250 kN).
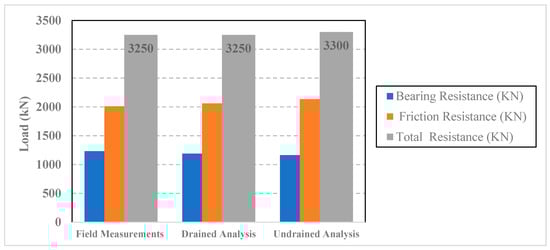
Figure 12.
Comparison between field measurements and drained\un-drained analyses results.
6. Load Transfer Mechanism of Large Diameter Bored Pile (Drained\Un-Drained)
Figure 13a,b present the axial load distribution along pile shaft length for both drained and undrained analyses, respectively. Pile axial load distribution is calculated at each loading increment by multiplying the normal vertical stress in the shaft times the pile cross-sectional area. Worthwhile noting that pile load values at the base level are calculated by the integration of bearing stresses at the pile base.
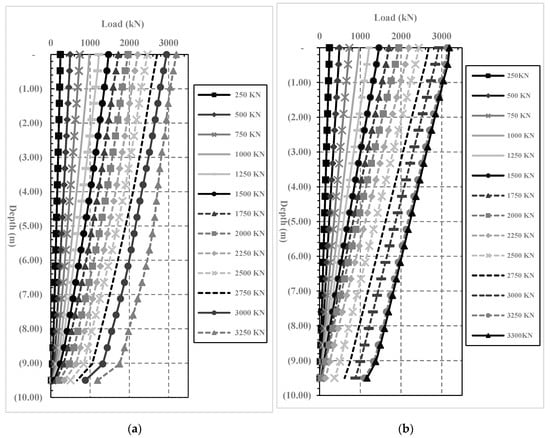
Figure 13.
Results of the pile axial load distribution. (a) Drained analysis. (b) Un-drained analysis.
It can be seen from Figure 13a,b that the obtained pile axial load equals the applied load at the head level and decreases with depth to achieve its smallest value at the base level. This behavior is obvious in both drained and undrained analyses results. However, the rate of axial load decrease with depth is different, in both types of analysis. This is ascribed to the variance in the friction resistance of the soil in the two different conditions (drained/undrained). According to the Mohr-coulomb criterion, in the drained state the amount of load transferred by friction is increasing with depth because of the increase of the overburden pressure (. In contrast, for the undrained condition, the amount of load transferred by friction is constant with depth (.
Tangential stresses of the interface elements in the vertical direction (Y-Axis) are obtained from the calibrated numerical models at each load increment along the interface length. The relations between interface tangential stresses and pile length are presented in Figure 14a,b for both drained and undrained analyses, respectively. These tangential stresses represent the distribution of the soil unit skin friction along the pile shaft length at each load increment. In general, skin friction results are consistent with the result of pile load distribution (Figure 13), and indeed the obtained skin friction values are increased with the depth in the drained condition, and also they are constant with the depth in the undrained condition.
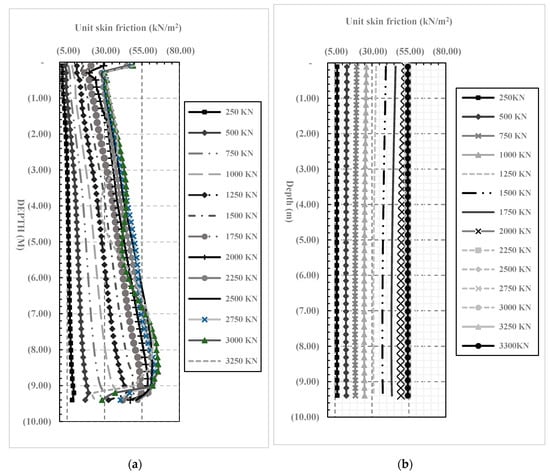
Figure 14.
Results of the average values of unit skin friction obtained using numerical analysis. (a) Drained analysis [10]. (b) Un-drained analysis.
The pile load transfer behavior presented before in Figure 10 and Figure 11b showed that the full friction mobilization occurred after load increment of 2000 kN in both drained and undrained cases. These results are also consistent with the skin friction results shown in Figure 14a,b. As the obtained shear stress values after this load almost become equal to the soil shear strength (according to MC criterion), which confirmed that full friction mobilization occurred after this load in both drained and undrained conditions.
For the drained condition (Figure 14a), the value of the unit skin friction at the ground surface equals the value of the adopted effective cohesion (c’), and gradually increased with the depth with slope equals (tan Ø’). It was also noticed that at the last three loading increments, a significant increase in skin friction occurs at the ground surface level. The same observation was also reported in [18] and [19], as a substantial increase was observed in the lateral earth pressure coefficient at the ground surface in several performed axial pile-loading static tests. This was attributed to the dilation effects near the ground surface, where the confining pressure is low compared to deeper depths. Figure 14a also shows that unit skin friction values tend to decrease after the load increment of 2000 kN at the last three applied load increments (2500, 3000, and 3250 kN). This decrease is attributed to the arching action [10,20,21]. On the other side, unit skin friction is obtained in undrained conditions, with value, equals the undrained adhesion. This value is increasing with applied load increases to reach its max value of the adopted undrained adhesion and remains with the same value until the end of the loading test.
The disadvantage of the undrained total stress analysis (Undrained Model C) is that no distinction is made between effective stresses and pore pressures. Hence, all output referring to effective stresses should now be interpreted as total stresses, and all pore pressures are equal to zero [15]. Therefore, no change in vertical and horizontal stress results are noted in this model, and consequently, no arching action is observed in the results of the undrained analysis.
Regarding the bearing resistance of the LDBP, Sommer [12], calculated the bearing capacity factor (Nc) in the undrained condition by dividing the value of the ultimate bearing stress measured at the failure load by the undrained cohesion value for the bearing soil (150 kN/m2). Hence, the Nc bearing capacity factor was determined as 6.0.
Sommer also compared this result with Whitaker and Cooke [13] and Breth [14], loading test results that were performed in similar frankfurter and Londoner stiff clay soil. Nc factor was obtained with a value of (6.90) by Whitaker and Cooke [13], using a pile-loading test of a large diameter bored pile (0.94 m diameter). Also, a higher value of (9.50) was obtained by Breth [14] using the pile-loading test of a small diameter bored pile (0.42 m diameter). On the other side, with the same calculation procedure, the Nc bearing capacity factor is obtained as 6.0, using finite element undrained analysis results of the bearing stress at the ultimate pile load, which agrees with calculations presented in the field study [12].
Fundamental observation should be highlighted in this regard; the value of bearing stress at the pile base level is affected by the pile’s diameter. Consequently, the bearing capacity factor (Nc) will also be influenced by the pile diameter. These findings are also in contradiction with several codes and design standards, such as DIN 4014 [22] and ECP202/4 [23]. As, they estimate only an absolute value of bearing stress under large diameter bored piles bases only based on the predicted settlement value at failure (Specific settlement-based criteria [5%D]), without considering any effect for the pile diameter on the bearing stress values.
7. Comparative Analysis
In case of impossibility to perform pile-loading test at the design phase, codes and design standards proposed several settlement-based design approaches for the large diameter bored piles (LDBP) alongside the conventional capacity-based design approaches. German standards (DIN) [22] and Egyptian code (ECP) [23] approaches are examples of those settlement-based methods. On the other side, Meyerhof [24] method is one of the commonly used capacity-based design approaches.
In this section, field measurements of the Alzey bridge case study will be used to assess the calculated ultimate capacity of the LDBP using two different methods of both capacity-based and settlement- based design approaches. According to the available data in the field study [12], Meyerhof [24] capacity-based method and ECP [23] settlement-based design approaches have been chosen. Other methods, such as AASHTO (LRFD) [25], require soil testing results such as SPT or CPT test results, which were not provided in the field study.
In both DIN [22] and ECP [23] methods, full friction mobilization is estimated to be achieved at a settlement of 1% of pile diameter. Also, at a settlement value of 5% of pile diameter bearing mobilization is expected. For cohesive soil, ECP provides estimated values for both soil unit skin friction and bearing resistance corresponding to the predicted settlement values. Also, it recommends ignoring soil friction resistance at the first two meters below the ground surface and at a distance equals pile diameter (D) above the pile base level as well. Using this effective length and the pile perimeter (O), pile friction capacity can be determined. Furthermore, the pile bearing load is calculated by multiplying the estimated value of bearing stress by pile cross-sectional area.
Fundamental to note that the ECP method did not consider any effect for the cohesive soil type, class, or degree of consolidation on the suggested undrained bearing stresses values. Besides, these suggested values are recommended for any large diameter bored pile, whatever its diameter. Subsequently, the relations between pile settlement, friction load, bearing load, and total ultimate load are plotted and compared with the field measurements in Figure 15.
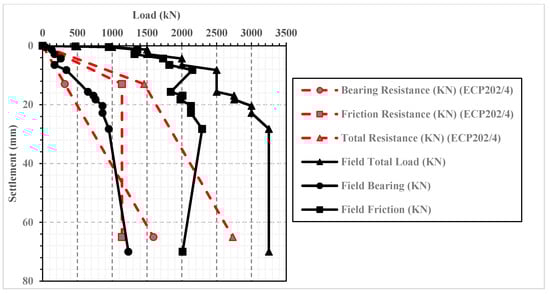
Figure 15.
Comparison between field measurements of Alzey case history, and calculated values of pile settlement, friction, bearing, and total ultimate load using a settlement-based method [23].
Significant differences are evident between the calculated capacities using the settlement based method [23] and field measured values, as shown in Figure 15. At a settlement of 1% of pile diameter (13 mm), the calculated pile friction capacity (1139 kN) represents about 60% of that measured in the field loading test (2000 kN). Conversely, the calculated pile bearing ultimate capacity at pile settlement percentage of 5% the pile diameter (65 mm), is greater than the measured pile ultimate bearing resistance with a difference of about 27%. This means that this settlement-based method estimates a higher value for ultimate bearing stress (1200 kN/m2) than the field measured one (920 kN/m2). Despite that, the acquired pile ultimate capacity using the settlement-based method (2731 kN) is lower than the field measured value (3250 kN) with a difference of about 15%.
On the other hand, Meyerhof [24] conventional capacity-based design approach (Equation (2)) is used to calculate the ultimate pile capacity for the same large diameter bored pile in both drained and undrained conditions. Meyerhof stated that immediately after pile casting, the shaft adhesion is closely given by the undrained shear strength of clay. However, at later stages and particularly at the end of the foundation construction, the shaft resistance of piles will be governed by the effective drained shear strength parameters (c and φ) of remolded clay failing close to the shaft. The corresponding effective unit skin friction in the homogeneous clay may then be taken, as shown in Equation (2). Besides, in saturated homogeneous clay under undrained conditions, Meyerhof highlighted that the value of Nc below the critical depth varies with the sensitivity and deformation characteristics of the clay from about (5) for very sensitive brittle normally consolidated clay to about (10) for insensitive stiff overconsolidated clay, and value of (9) is frequently used for bearing capacity estimates of bored piles.
Using the soil and pile parameters presented before in Table 1 and Table 2 (Drained parameters), bearing, friction, and total ultimate capabilities are calculated as 1980 kN, 1820 kN, and 3800 kN, respectively. Also, using the undrained soil and interface parameters (Table 3 and Table 4), the undrained bearing, friction, and total ultimate capabilities are determined as 1791 kN, 2095 kN, and 3886 kN, respectively, using Equation (3) [24].
where,
Pult = As (ca) + Ab (c Nc)
- ca: soil adhesion per unit area;
- δ: friction angle of the soil on the shaft.
- Ks: the at-rest earth pressure coefficient on the shaft.
- γ: soil unit weight
- Nc, Nq, and Nγ: factors of bearing capacity, depend on ϕ and the embedment depth ratio L/B.
Figure 16 compares between field measurements, numerical results, and the calculated ultimate resistances using both the settlement-based [23] and the capacity-based [24] methods.
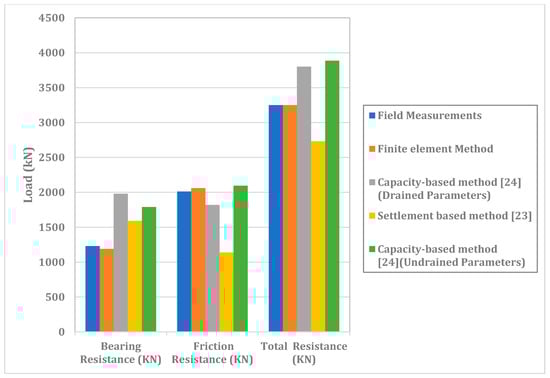
Figure 16.
Comparison between field measurements and the calculated friction, bearing, and total ultimate resistance using both the settlement-based [23] and the capacity-based [24] methods.
The ultimate drained capacity determined using the capacity-based method [24] is higher than field measurement, with a percentage of about 17%. This difference is attributed to the high obtained value of pile-bearing resistance (1980 kN) compared to field measured bearing resistance (1230 kN). The acquired bearing resistance from the Meyerhof equation represents 60% greater than field measurements. Nevertheless, the calculated pile friction resistance using the Meyerhof formula is lower than field measurement (12%). In addition, the ultimate undrained capacity obtained using Meyerhof undrained formula (Equation (3)) is near equal the drained capacity determined using Equation (2) (2.2% difference), which is consistent with the results obtained using the numerical analyses (Figure 12). Moreover, the implemented settlement-based [23] method underestimates the large diameter pile capacity compared to field measurement (15% difference), and utilized capacity-based method [24] overestimates the ultimate capacity of the pile (difference of about 17%). However, the finite element model using Modified Mohr-Coulomb constitutive model success to simulate the behavior of large-diameter bored pile and good agreement is obtained between the obtained ultimate capacity and field measurements.
8. Conclusions
Based on the numerical study conducted, the following conclusions have been drawn:
- Numerical analysis is capable of predicting not only the working capacity but also the ultimate capacity of the large diameter bored piles (LDBP). Also, the large induced pile settlement at the failure state can be determined using the finite element method, when the appropriate soil constitutive model is carefully selected. Also, sufficient sensitivity analyses should be carried out to assess the quality of the generated mesh and to justify the economic computational feasibility of the established model.
- Very good agreements were obtained between field measurements of Alzey bridge case study and both undrained and drained analyses results, even, at the failure state, when reduction factor of 0.36, and 1.0 of interface strength were adopted in analyses, respectively.
- Both drained and undrained numerical results revealed that about 90% of the total applied load was predominantly transferred by friction at the initial loading increments (working loads), and only about 10% of the total applied load was carried by pile bearing resistance. However, at the ultimate load, friction resistance is 62%, and bearing resistance increased to 38% of the total applied load.
- For both drained and undrained analyses, full friction mobilization occurred at a value of settlement near equals 1.0% of the pile diameter; also, full bearing mobilization occurred at a value of settlement near equals 5.5% of the pile diameter.
- The suggested Nc value of (9.0) may be only valid for the small diameter bored piles (less than 60 cm). However, for large diameter bored piles, they are dependent on pile diameter.
- The ultimate bearing stress below the large diameter pile base is affected by the pile diameter. However, several codes and design standards proposed constant bearing stress to be used at a particular settlement value (i.e., 5% D) to estimate the ultimate capacity of the LDBP, irrespective of pile geometry and without any discrimination for any class of the cohesive soils.
- Meyerhof capacity-based method overestimated the ultimate pile capacity of the Alzey case LDBP, while the ECP settlement-based method underestimates the ultimate pile capacity of the Alzey bridge case study.
Author Contributions
Conceptualization and methodology, M.E.A.-A. and A.H.; software, M.E.A.-A.; validation, M.E.A.-A., A.H. and T.S.; data curation, writing—original draft preparation, M.E.A.-A., Y.Z. and T.S.; writing—review and editing, M.E.A.-A., and A.H.; visualization, M.E.A.-A.; supervision, A.H. All authors have read and agreed to the published version of the manuscript.
Funding
This research received no external funding.
Acknowledgments
The research is partially supported by the Structures and Materials (S&M) Research Lab of Prince Sultan University, Saudi Arabia. Besides, the authors would like to express their sincere gratitude to F.A.-K., for his vigorous efforts, constructive suggestions, and continuous encouragement to perform this research.
Conflicts of Interest
The authors declare no conflict of interest.
References
- Fellenius, B.H. What Capacity to Choose from the Results of a Static Loading Test; Deep Foundation Institute, Fulcrum: Hawthorne, NJ, USA, 2001; pp. 19–22. [Google Scholar]
- Lee, J.H.; Salgado, R. Determination of Pile Base Resistance in Sands. J. Geotech. Geoenviron. Eng. ASCE 1999, 125, 673–683. [Google Scholar] [CrossRef]
- El-Mossallamy, Y. Load-settlement behaviour of large diameter bored piles in over-consolidated clay. Numerical models in geomechanics. In Proceedings of the 7th International Symposium on Numerical Models in Geomechanics, NUMOG VII, Graz, Austria, 1–3 September 1999; pp. 443–450. [Google Scholar]
- Davis, R.O.; Change, K.C.; Mullenger, G. Modeling of axially loaded piles: Comparisons with pile test load. In Computer and Physical Modeling in Geotechnical Engineering; PASCAL database: Rotterdam, The Netherlands, 1989. [Google Scholar]
- Baars, S.V.; Niekerk, W.V. Numerical modelling of tension piles. In Beyond 2000 in Computational Geotechnics; Taylor & Francis: Boca Raton, FL, USA, 1999; pp. 237–246. [Google Scholar]
- Meissner, H.; Shen, Y.L.; Van Impe, W.; Vogt, C. Punching Effects for Bored Piles; Deep Foundation Institute, and Auger Piles: Hawthorne, NJ, USA, 1993. [Google Scholar]
- Wehnert, M.; Vermeer, P.A. Numerical Analyses of Load Tests on Bored Piles. Numerical models in geomechanics. In Proceedings of the 9th Numerical Models in Geomechanics, NUMOG IX, Ottawa, ON, Canada, 25–27 August 2004. [Google Scholar]
- Malek, A.M.; Azzouz, A.S.; Baligh, M.M.; Germaine, J.T. Behavior of Foundation Clays Supporting Compliant Offshore Structures. J. Geotech. Geoenviron. Eng. ASCE 1989, 115, 615–636. [Google Scholar] [CrossRef]
- Gu, C.; Wang, J.; Cai, Y.; Sun, L.; Wang, P.; Dong, Q. Deformation characteristics of overconsolidated clay sheared under constant and variable confining pressure. Soils Found. 2016, 56, 427–439. [Google Scholar] [CrossRef]
- Ezzat, M.; Zaghloul, Y.; Sorour, T.; Hefny, A.; Eid, M. Numerical Simulation of Axially Loaded to Failure Large Diameter Bored Pile. Int. J. Geotech. Geol. Eng. World Acad. Sci. Eng. Technol. 2019, 13, 289–303. [Google Scholar]
- Coutinho, R.Q.; Mayne, P.W. Geotechnical and Geophysical Site Characterization 4, 1st ed.; CRC Press, Taylor & Francis: Boca Raton, FL, USA, 2012; p. 5. [Google Scholar]
- Sommer, H.; Hammbach, P. Großpfahlversuche im Ton für die Gründung der Talbrücke Alzey. Der Bauingenieur 1974, 49, 310–317. [Google Scholar]
- Whitaker, T.; Cooke, R.W. An investigation of the shaft and base resistance of large bored piles in London Clay. In Large Bored Piles; Institution of Civil Engineers, ICE Virtual Library: London, UK, 1966; pp. 7–49. [Google Scholar]
- Breth, H. Das Tragverhalten des Frankfurter Tons bei im Tiefbau auftretenden Beanspruchungen. In Mitteilungen der Versuchsanstalt für Bodenmechanik und Grundbau der TH Darmstadt; für Bodenmechanik und Grundbau: Versuchsanst, Germany, 1970. [Google Scholar]
- MIDAS. GTS NX User Manual, Analysis Reference Chapter 4 Materials; Section [2]; Plastic Material Properties; MIDAS Teotech: Gyeonggi-do, Korea, 2009. [Google Scholar]
- Midas GTS User Supplied Subroutine; MIDAS Information Technology Co. Ltd.: Seongnam, Korea, 2009; Chapter 3; p. 62.
- Duncan, J.M.; Buchignani, A.L. An Engineering Manual for Settlement Studies; Berkeley, Department of Civil Engineering, University of California: Oakland, CA, USA, 1987. [Google Scholar]
- O’Neill, M.W.; Reese, L.C. Drilled Shaft: Construction Procedures and Design Methods; Federal Highway Administration: Washington, DC, USA, 1999.
- Rollins, K.M.; Clayton, R.J.; Mikesell, R.C.; Blaise, B.C. Drilled Shaft Side Friction in Gravelly Soils. J. Geotech. Geoenviron. Eng. ASCE 2005, 131, 987–1003. [Google Scholar] [CrossRef]
- Franke, E. Großbohrpfähle. In Vorträge der Baugrundtagung 1970 in Düsseldorf; 5.167 Essen; Deutsche Gesellschaft für Erd-und Grundbau e.V.: Essen, Germany, 1970. [Google Scholar]
- Touma, F.T.; Reese, L.C. Behavior of bored piles in sand. J. Geotech. Eng. Div. ASCE 1974, 100, 749–761. [Google Scholar]
- DIN 4014, German Association for Earthworks and Foundation Engineering; Deutsches Institute fur Normung: Berlin, Germany, 1990.
- ECP 202/4. Egyptian Code for Soil Mechanics—Design and Construction of Foundations; Part 4, Deep foundations; The Housing and Building Research Center (HBRC): Cairo, Egypt, 2005. [Google Scholar]
- Meyerhof, G.G. Bearing Capacity and Settlement of Pile Foundations. J. Geotech. Eng. Div. Am. Soc. Civ. Eng. 1976, 102, 197–228. [Google Scholar]
- AASHTO, LRFD Bridge Design Specification, 2nd ed.; American Association of State Highway and Transportation Officials: Washington, DC, USA, 1998.
© 2020 by the authors. Licensee MDPI, Basel, Switzerland. This article is an open access article distributed under the terms and conditions of the Creative Commons Attribution (CC BY) license (http://creativecommons.org/licenses/by/4.0/).