Article

Modelling with Volna-OP2—Towards Tsunami Threat Reduction for the Irish Coastline

1
School of Mathematics and Statistics, University College Dublin, Dublin D04 V1W8, Ireland
2
Geological Survey Ireland, Dublin D04 K7X4, Ireland
3
Earth Institute, University College Dublin, Dublin D04 V1W8, Ireland
*
Author to whom correspondence should be addressed.
Geosciences 2020, 10(6), 226; https://doi.org/10.3390/geosciences10060226
Submission received: 8 April 2020 / Revised: 1 June 2020 / Accepted: 3 June 2020 / Published: 10 June 2020
(This article belongs to the Special Issue Advances in tsunami science towards tsunami threat reduction)

Abstract

:
Tsunamis are infrequent events that have the potential to be extremely destructive. The last major tsunami to effect the Irish coastline was the Lisbon 1755 event. That event acts as a candidate worst case scenario for hazard assessment and the impacts on the Irish Coastline are presented here. As there is no general consensus on the 1755 earthquake source, multiple sources highlighted in the literature are investigated. These sources are used to generate the initial conditions and the resultant tsunami waves are simulated with the massively parallelised Volna-OP2 finite volume tsunami code. The hazard associated with the event is captured on three gradated levels. A reduced faster than real time tsunami ensemble is produced for the North-East Atlantic on a regional level in 93 s using two Nvidia V100 GPUs. By identifying the most vulnerable sections of the Irish coastline from this regional forecast, some locally refined simulations are further carried out in a faster than real time setting. As arrival times on the coastline can be on the O (mins), these faster than real time reduced ensembles are of great benefit for tsunami warning. Volna-OP2’s capabilities in this respect are clearly demonstrated here. Finally, high resolution inundation simulations, which build upon the ensemble results, are carried out. To date this study provides the best estimate of assessing the hazard associated with a Lisbon-type tsunami event for the Irish coastline. The results of the inundation mapping highlight that along the vulnerable sections of coastline, inundation is constrained to low-lying areas with maximum run-up heights of 3.4 m being found.

1. Introduction

After the devastating 2004 Indian Ocean tsunami, there was a concerted effort by the scientific community to mitigate the damages posed by these natural hazards on coastal communities. After the event Bernard et al. [1] wrote that the greatest contribution that science can make to society is to serve it purposefully. Prior to the 2004 tsunami, which touched virtually all the global coastlines [2], there existed a earthquake-centric tsunami warning network in the Pacific Ocean [3]. However, the global threat posed by these natural hazards was brought into sharp focus by the 2004 event. Warning centres were set up across all the major ocean basins, with numerous international collaborations being formed. The scientific community’s efforts were focused on the continued development of tsunami early warning centres, carrying out prior hazard assessments, deploying tsunami wave gauges and increasing public awareness [4]. Despite the global average of one tsunami occurring per year [1], on a regional level tsunamis are inherently rare events. The tsunami community thus relies on high-fidelity computational/mathematical models to carry out simulations of numerous potential tsunami sources in order to quantify the associated hazards.
The last major tsunami to effect the Atlantic basin is the Lisbon 1755 event. This tsunami was generated by a 8 . 5 Mw earthquake which occurred on the morning of the 1 November 1755 roughly 100 km off the coast of Lisbon. The earthquake and subsequent tsunami caused a large number of fatalities and severe damage along the coasts of Portugal, Spain and Morocco [5]. The effects of the tsunami were felt across the Atlantic basin, with historical reports of the tsunami waves arriving in the Caribbean, United Kingdom and Ireland [6]. There is still no general consensus on the exact earthquake parameters for the event. There exists a substantial catalogue of work which focuses on the earthquake source for this event [7,8,9] and numerous studies on the effects of the resultant tsunami waves in the near and far field areas [5,10,11].
Focusing on the Irish coastline there exists a handful of historical accounts on the effects of this event. One notable account is given by the harbour master in Kinsale (South Coast of Ireland) [6]. There is however a severe lack of studies quantifying the level of hazard associated from the event on a high resolution level. The Defra study [12] utilised a minimum mesh element size of 1 km along the southern Irish coastline and did not capture inundation as a cut off bathymetry depth was used. However, one of the relevant findings from this study was that tsunami amplification occurred along the South East coastline of Ireland. Further, some studies from the French tsunami warning centre (CENALT) found that the west coast was vulnerable to a Lisbon-type event, with the tsunami waves refracted by the Porcupine bank into Galway Bay and amplified. Therefore the efforts presented here in quantifying the hazard for the Irish coastline on a high resolution level are the first of its kind. The high resolution simulation results will aid in the disaster management planning for the identified vulnerable areas.
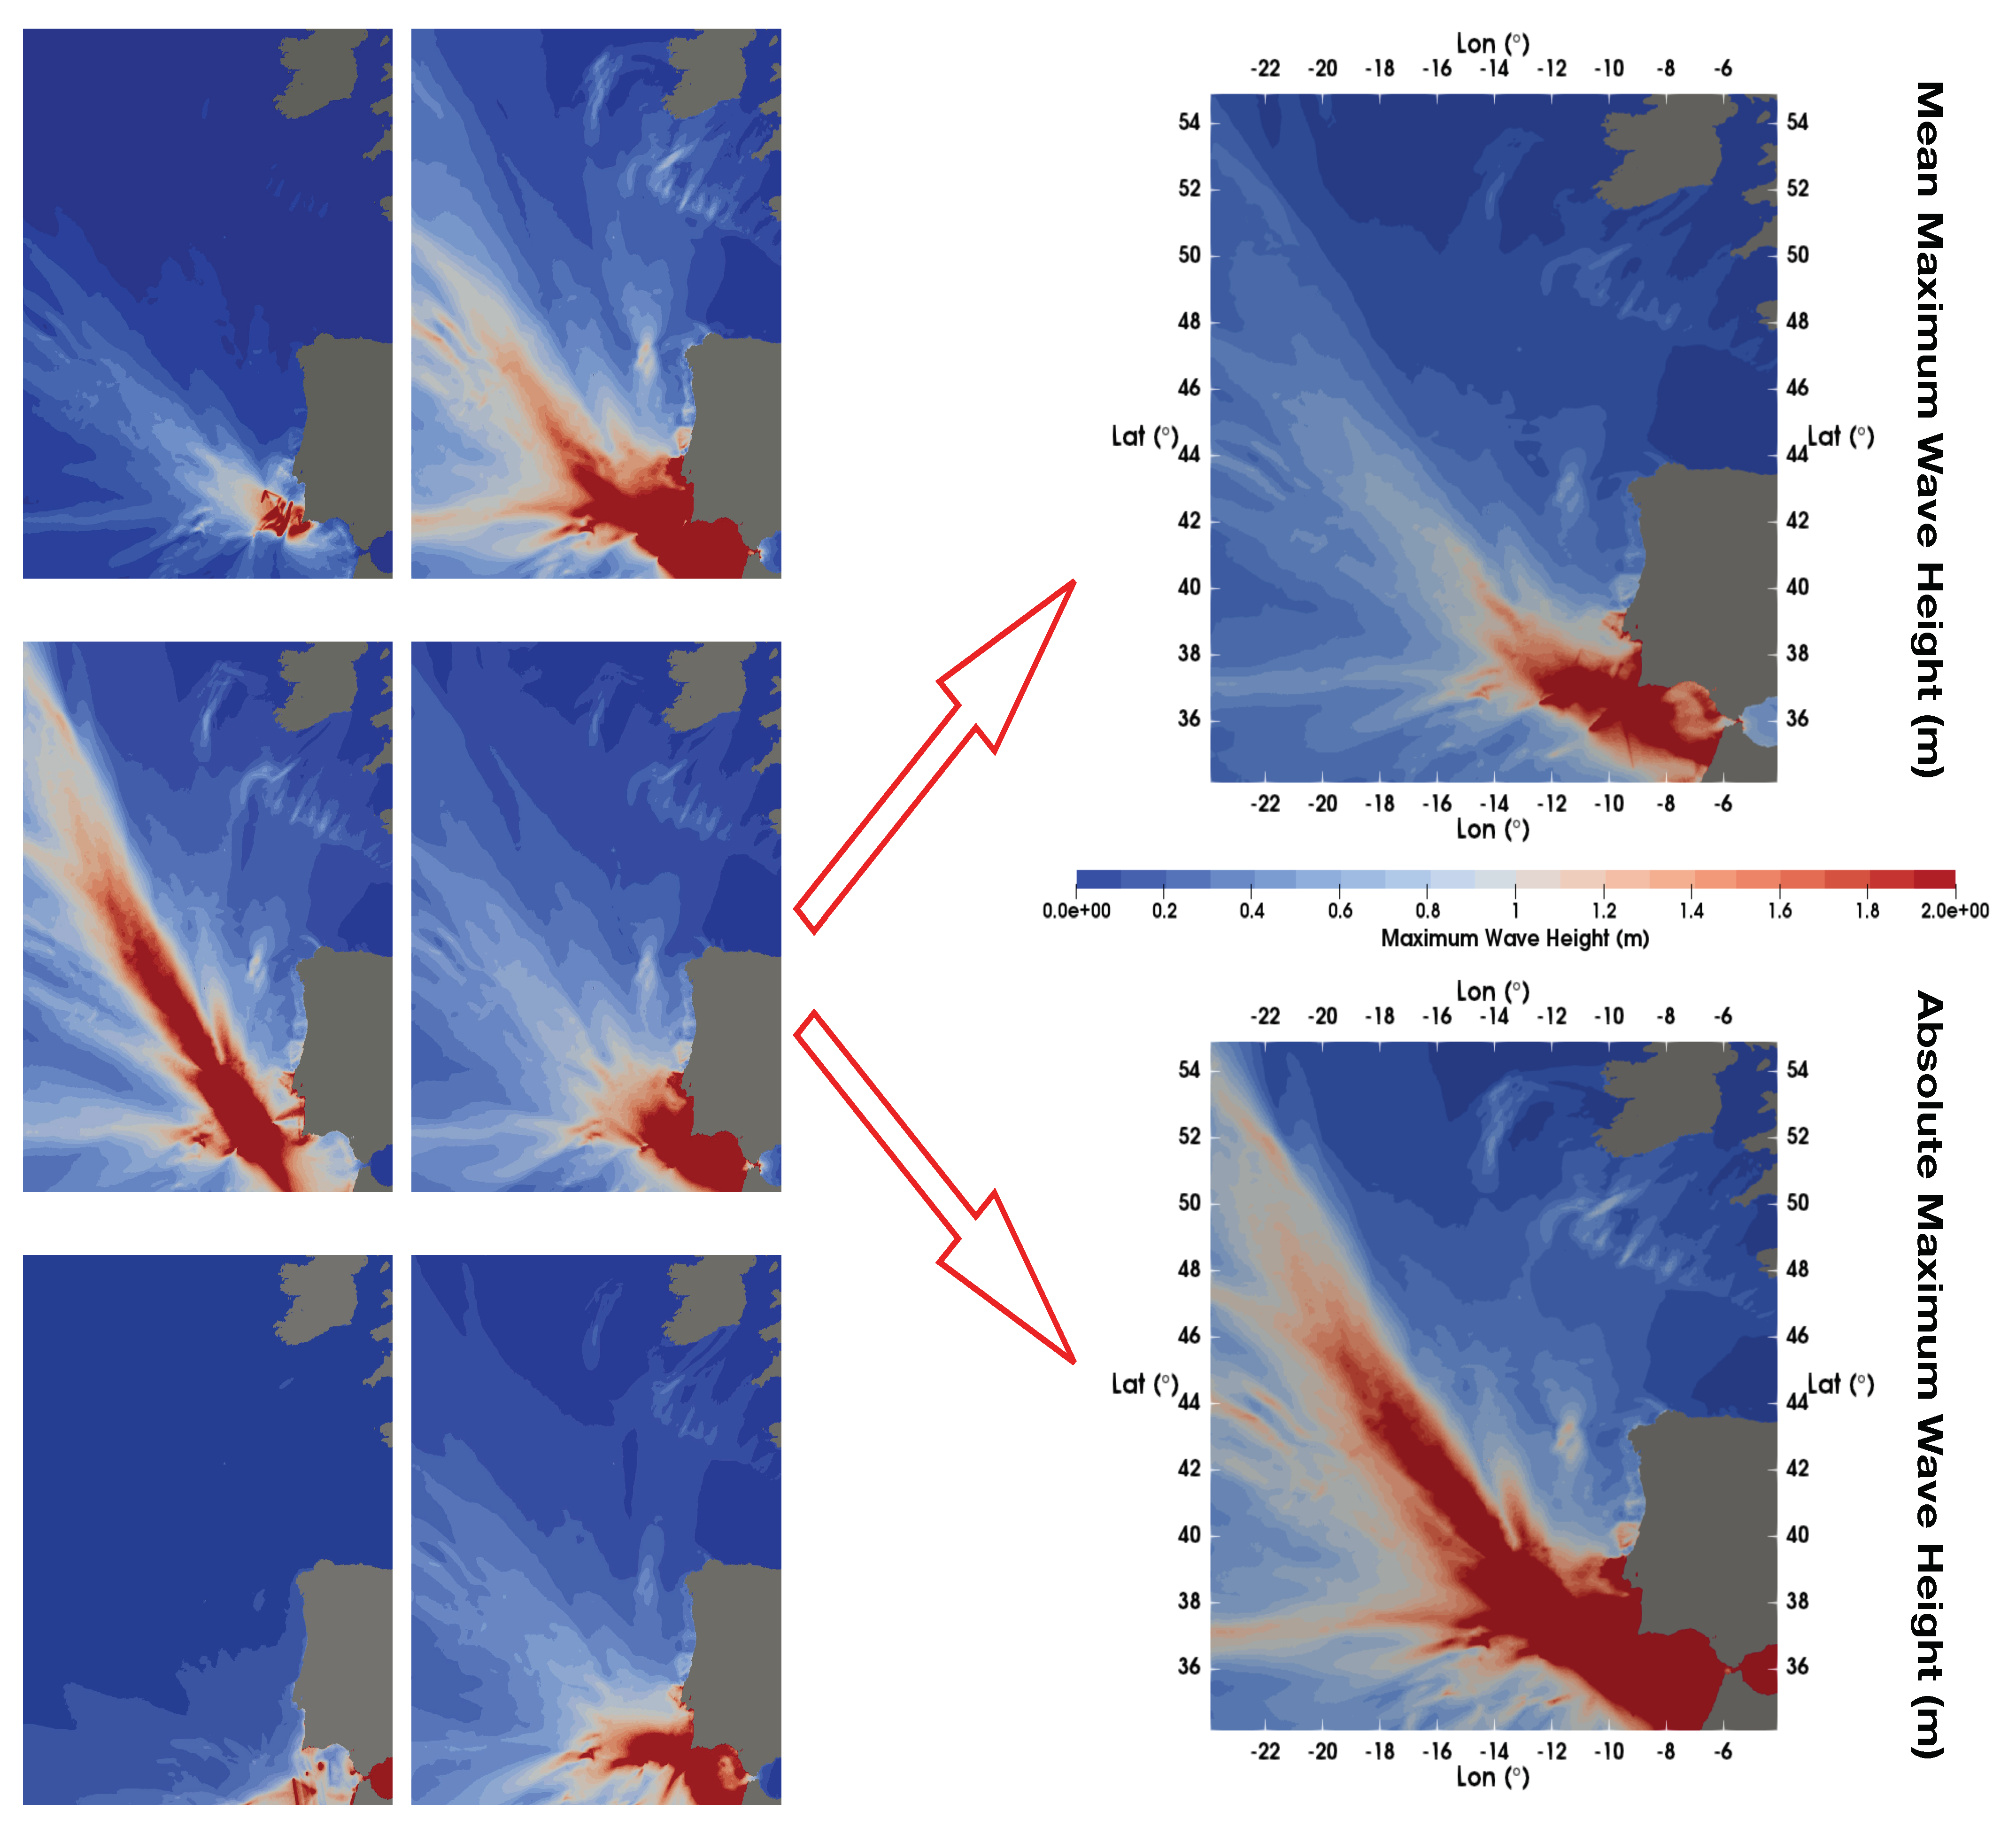
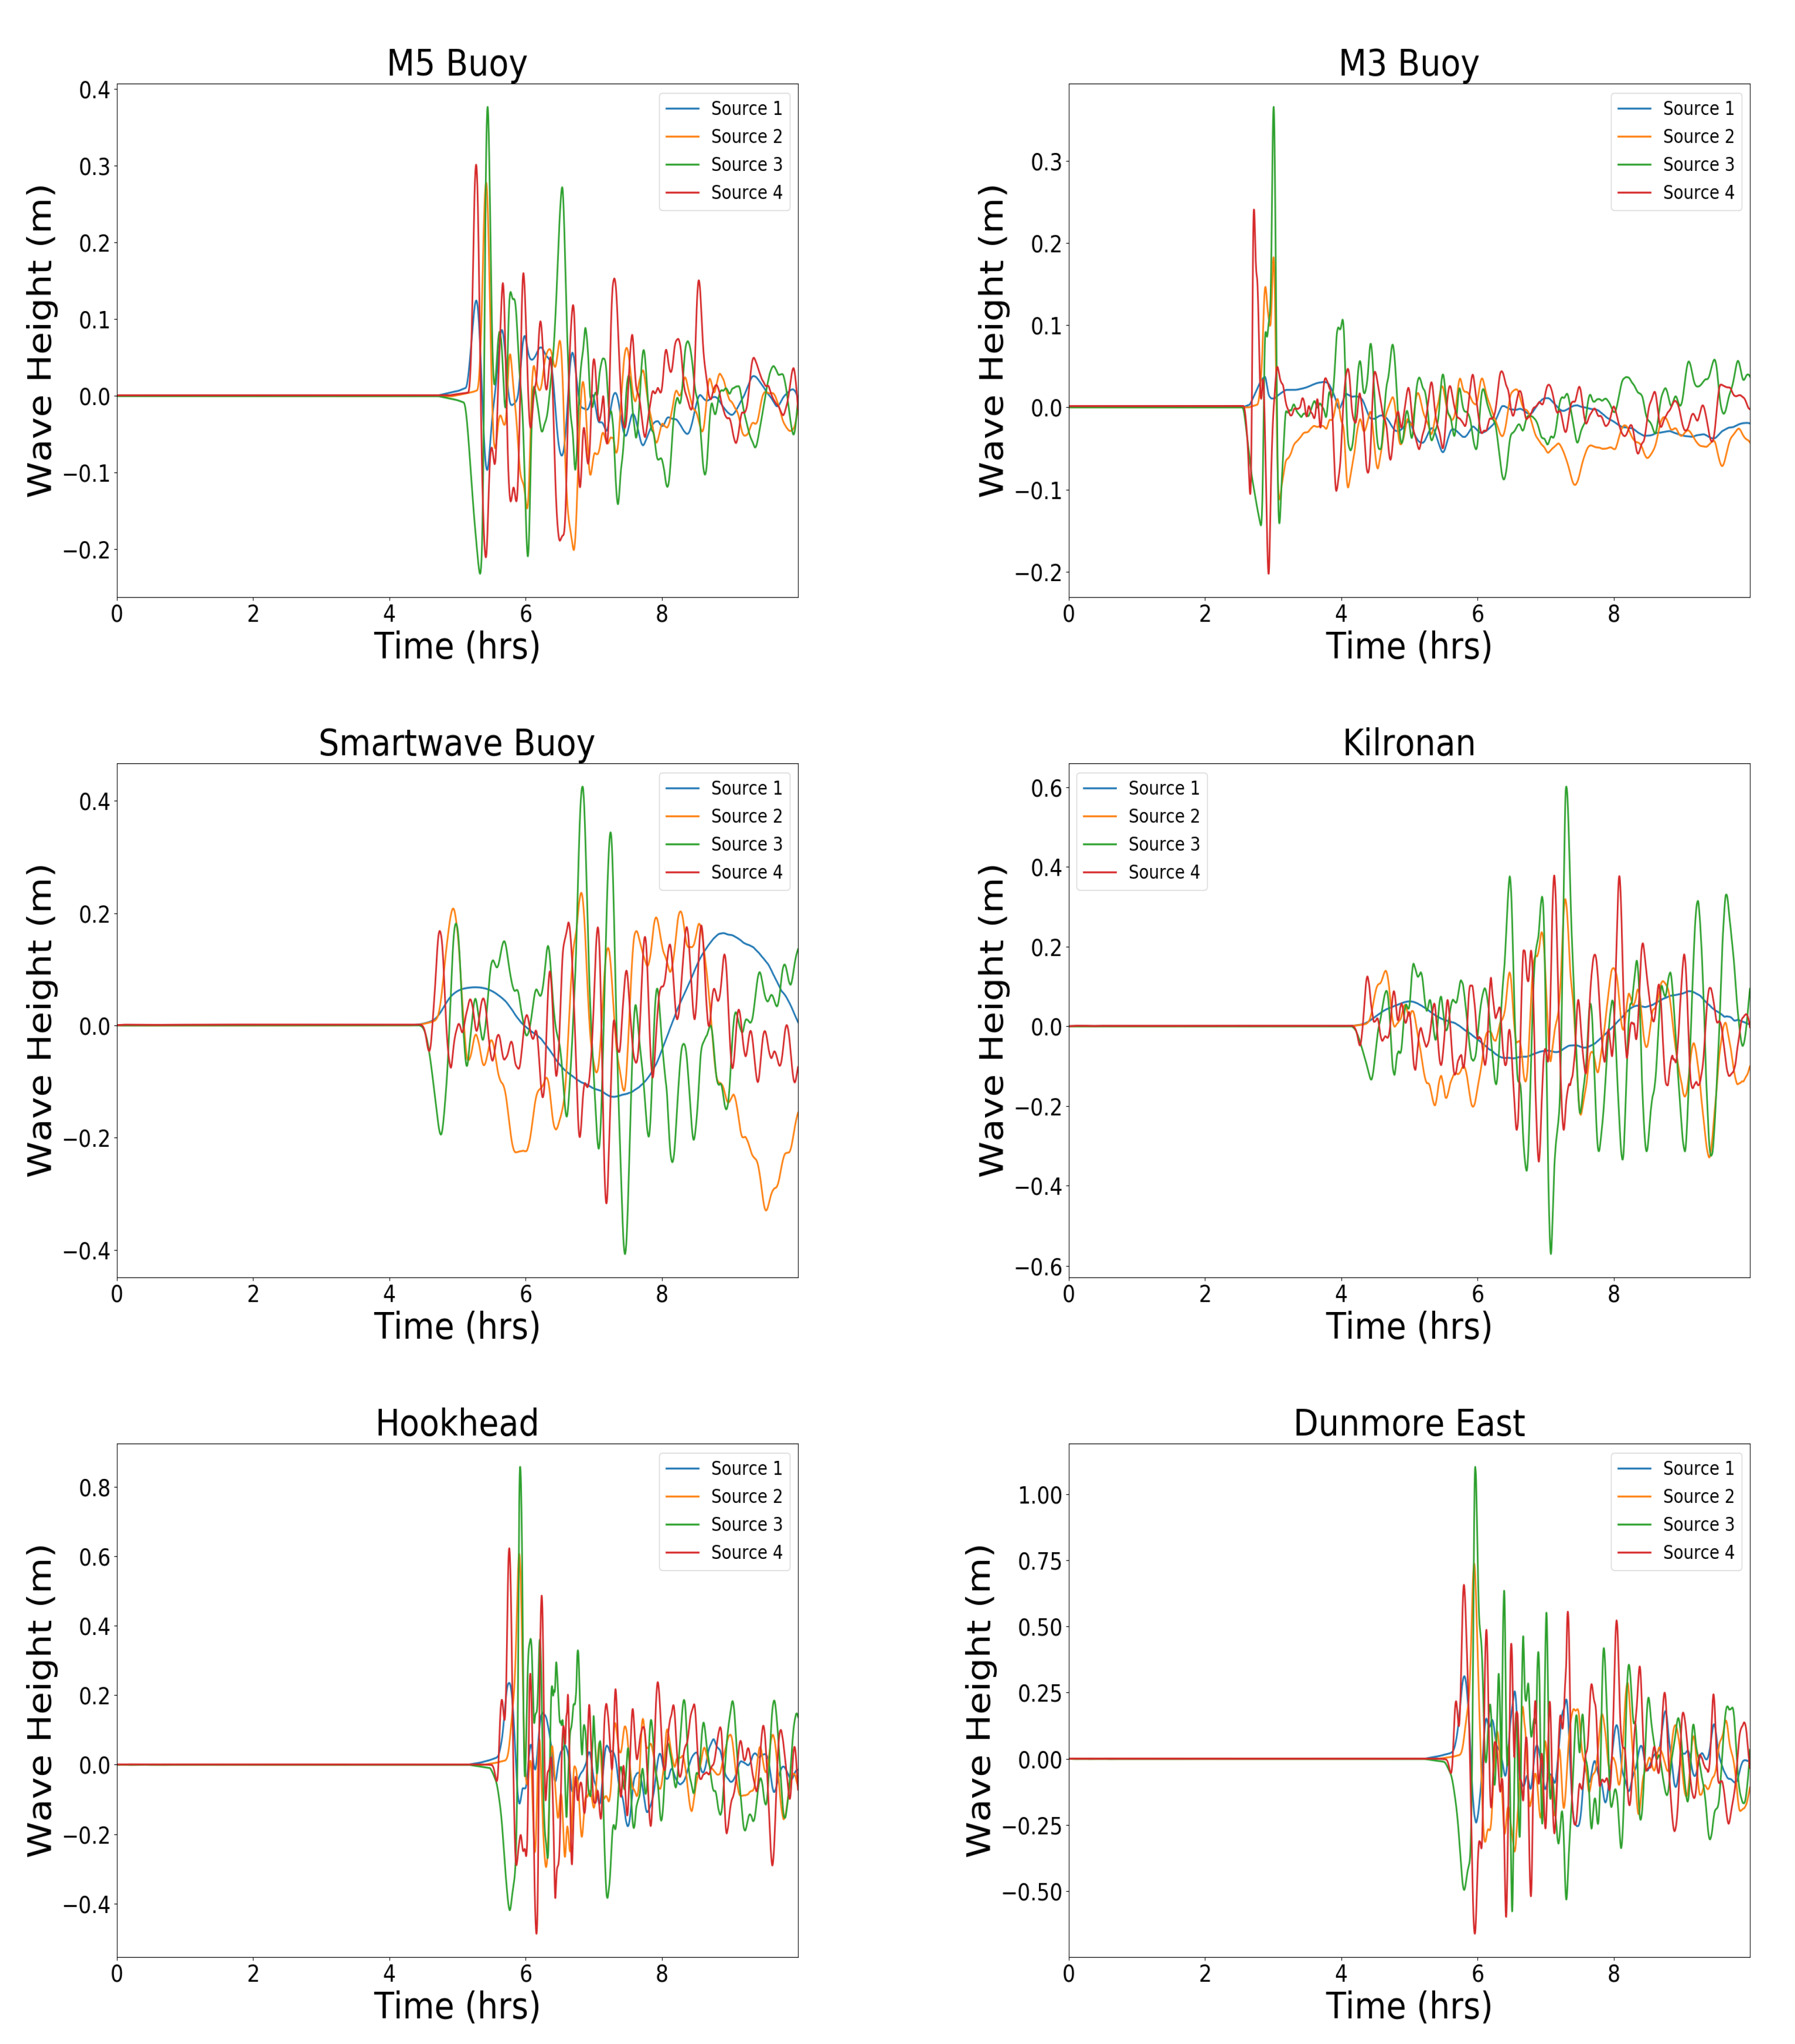
However, in the immediate aftermath of a tsunami occurrence, it is a tsunami early warning centre’s (TWC) responsibility to deduce the level of hazard posed by the event. TWCs’ tasks include detecting the tsunami source, deducing the level of threat posed, deciding on the areas most at risk and then notifying the relevant authorities. As tsunamis can travel at extremely high speeds in deep water arrival times at the coastline are often on the O (mins). TWCs are therefore under severe time constraints when carrying out their duties. To aid in this decision process, they currently deploy a variety of tools which produce regional levels of warnings. These tools are primarily based on extensive pre-computed databases and pre-calculated scaling laws [13]. However, as the computational efficiencies of tsunami codes increase, faster than real time techniques are now being developed. These promise to be extremely beneficial as multiple tsunami simulations constrained by the tsunami source can be simulated in an ensemble. This ensemble would capture in a faster than real time setting the uncertainty on the resultant tsunami waves. A reduced ensemble for the North-East Atlantic is presented in Section 3.
The local bathymetry can have a substantial effect on the local levels of maximum wave heights, inundation and induced currents, something which is missed by the regional warnings. So in order to gain an understanding of how the local bathymetry affects an incoming tsunami, prior high resolution risk/hazard assessments are often carried out, such as the results presented in Section 4. These studies can require extensive computational resources and are time consuming. Epistemic uncertainty involved in the modelling and source parameters has led to the development of probabilistic tsunami hazard assessments (PTHA) [14,15]. One of the key limiting factors for both real time tsunami forecasts and risk assessment studies are the runtimes required to run the modelling software. Extremely efficient tsunami codes, which utilise modern computational techniques, have been developed to reduce the run times involved.
The software package Volna-OP2 is a tsunami code which has been optimised to run on various high performance architectures, CPUs, Xeon-Phis and GPUs. To date, Volna-OP2 has been used by various research groups around the world. In particular its efficiency has been leveraged in conjunction with statistical studies to carry out computationally expensive tasks like sensitivity studies and building statistical surrogates [16,17,18]. The code solves the depth-averaged nonlinear shallow water equations, utilising modern reconstruction and shock capturing techniques. The original code was introduced in 2011 [19] and has since undergone extensive parallelisation [20]. Both the original and newly updated version have been verified against the traditional tsunami mitigation benchmark problems [20] and an extensive error analysis of the newly parallelised version has been carried out [21]. Volna-OP2 is presented here as a candidate code which could be implemented into a TWC workflow. It is shown here to be capable of rapidly simulating tsunamis on a regional scale which can then be incorporated into ’on the fly’ ensemble warnings.
This paper is split into three parts; in Section 2 an outline of the numerical scheme and parallelisations used in Volna-OP2 are described. In Section 3, two faster than real time reduced ensembles are presented for the North East Atlantic Ocean, with the difference in ensembles being the level of resolution focused along the Irish coastline. Building upon these faster than real time simulations, in Section 4 a high resolution inundation mapping study for vulnerable sections of the Irish coastline is shown.

2. Numerical Scheme and Parallelisation

In the deep ocean tsunamis exhibit long wavelengths when compared to the depth. Thus, the simplest approach in modelling tsunami waves is to invoke the shallow water limit and to model the tsunami dynamics using the linear shallow water equations. These linear equations can be simply dealt with using computational techniques and have been shown to work well for modelling tsunamis across a deep ocean basin. However, once the ratio between the depth and wave height becomes comparable, nonlinear dynamics play an important role and the nonlinear shallow water equations are needed to represent the tsunami dynamics. Continuing on this trend, if one is to include dispersion or non-hydrostatic pressures one gets the Boussinesq equations. There are plenty of numerical solvers that exist which tackle these higher order Boussinesq equations. Undoubtedly, physical dispersion can play an important role but in most cases the nonlinear shallow water equations are sufficient.
Volna-OP2 is a finite-volume solver which solves the depth-average nonlinear shallow water equations,
H t + ( H u ) = 0 , ( H u ) t + ( H u u + g 2 H 2 I ) = g H h ,
where H = ( b + η ) is the total water depth, b ( x , y , t ) is the time-dependent bathymetry, η ( x , y , t ) is the free surface deformation, u ( u , v ) is the depth averaged fluid velocity in the x and y horizontal directions, I is the identity matrix and g is the acceleration due to gravity.
Volna-OP2 utilises unstructured triangular meshes with dependent variables assigned to the triangle’s barycenters. In order to achieve 2nd order accuracy in space, which is essential in modern methods, a MUSCL reconstruction scheme is implemented. For the temporal discretisation an option of using either a 2nd or 3rd order strong stability preserving Runge-Kutta scheme is present. Extensive details on the numerical scheme used in Volna-OP2 can be found in previous works [19,21].
When Volna was first developed in 2011 [19] it was naturally a serial code. However, the code underwent a series of parallelisations culminating in the present Volna-OP2 version. The main parallelisation of the serial code occurred when it was built on the OP2 domain-specific language (DSL) for unstructured mesh computations [22]. This DSL enables unstructured mesh calculations to be expressed at a high level, with a suite of automated tools to translate the scientific code into a wide range of targeted high performance implementations. OP2 makes use of various parallelisation approaches—MPI, OpenMP and CUDA. It allows for the Volna numerical algorithms to be written once, which in turn are then automatically parallelised to use multiple CPUs and GPUs. This parallelisation of Volna resulted in a huge improvement in the codes scalability and performance [20,21]. It has enabled the code to be used for various extremely computationally expensive tasks like building statistical emulators [17,18,23,24], carrying out sensitivity analysis and stochastic inversions [25]. Extensive details on the parallelisation approaches used in OP2 can be found in References [22,26] and details on the integration of Volna into OP2 are given in Reference [20].

3. Faster than Real Time Ensemble

As stated, TWCs are tasked with deciding the level of threat posed by a tsunamigenic event and the areas at risk. Warning centres utilise various different tools to aid in this decision process. Leveraging modern high performance computing resources and improvements in the accuracy of earthquake detection has allowed one to simulate tsunamis across an ocean basin with run times which are faster than real time [27]. The results of these faster than real time simulations are supplemental to the traditional decision matrix and precomputed database techniques that are currently utilised [13]. However, when an earthquake is detected, there is initially uncertainty with respect to various physical parameters of the event. Thus, to capture this uncertainty, the main goal is to produce faster than real time ensemble techniques. With arrival times on the order of minutes it is imperative that these ensemble results are completed in a timely fashion. Workflows are currently being developed on the implementation of these highly efficient codes into an automatically triggered response to seismic activity [27].

3.1. North East Atlantic Tsunami - Lisbon 1755

A ’reduced’ faster than real time ensemble for the Lisbon 1755 tsunami is presented here. This is considered a ’reduced’ ensemble as only six different earthquake sources were selected from the literature [8,9,11] and only a section of the north east Atlantic was chosen. The initial sea surface was generated using the Okada model [28]. The element size of the unstructured uniform mesh is set to ≈ 3.3 km and the mesh contains ≈ 610,000 cells. Each individual simulation is run for 8 h and then the maximum wave height at each grid point is outputted. The complete run time for the six different tsunami simulations is 93 s on two Nvidia V100 GPUs. By way of comparison these same six tsunami simulations were run on 6 separate CPUs (2.4Ghz Intel Xeon Gold 6148 (Skylake) processors) with the serial version of Volna. The total runtime is 7 h and 14 min, which is faster than the 8 h simulated time but by no means applicable/useful for a warning scenario.
The plots of the maximum wave heights (Figure 1) all highlight the impact on the coastlines of Portugal, Spain and Morocco. They however also show a substantial variation in the directionality of the wave energy outside the gulf of Cadiz, with some sources showing the wave energy propagating towards the Irish Coastline. The absolute and mean maximum wave heights provide a rough estimate at a worst case and most likely scenario respectively. They are considered a rough estimate as the ensemble contains so few members. To investigate the effect of this event on the Irish coastline the sources introduced in the figure (Figure 1) will be investigated further.

3.2. Higher Resolution Faster than Real Time Simulation

With the arrival time on the Irish coastline of the first tsunami waves at ≈ 3.5 h, a TWC could launch more refined simulations of the worst cases identified above. This is carried out here by utilising non-uniform unstructured meshes refined around the areas most vulnerable. Based on the results above and drawing on previous studies these vulnerable sections of the Irish coastline have been identified to be the west (Galway Bay) and south east (Dunmore East) coastlines (areas highlighted in Figure 2). The south-east area was chosen based on a previous study [12] which highlighted that this area was prone to tsunami amplification. The west coast was selected based on tsunami simulations carried out by the French tsunami warning centre (CENALT). The CENALT simulations showed that the tsunami wave is directed into Galway Bay and amplified because of refraction from the Porcupine Bank. The reduced ensemble results (Figure 1) corroborate these findings, with the main tsunami energy impacting the west and south east coastline of Ireland. Therefore, to build on the reduced ensemble results, the four sources which exhibited higher impact (maximum wave height) on the Irish coastline were chosen (Table 1). These sources were then re-run on a non-uniform mesh which is refined around the areas of interest (Figure 3), the minimum mesh element size is set to 100 m and the mesh contains 4,001,884 cells.

Description of Source Parameters

  • Source 1: A composite source which was first proposed by Baptista et al. [9]. It involves the simultaneous rupture of the Guadalquivir Bank Fault (GB) and Marquês de Pombal Thrust Fault (MPTF).
  • Source 2: The second source involves the rupture of the Horseshoe Fault (HF) and has been purposed by Baptista et al. [11] for a tsunami inundation study of the Lisbon downtown area. The source was scaled in order to obtain rupture parameters comparable to those outlined by Solares and Arroyo [7].
  • Source 3: The third source has been described by BRGM (Bureau de recherches géologiques et minières) in a pilot study for the TANDEM project (http://www-tandem.cea.fr) and also involves the HF.
  • Source 4: A source purposed by Reference [8] that involves the rupture of the Gorringe Banks (GorB).
These four identified sources were used to generate the initial conditions using the Okada model. They were simulated for 10 h on the non-uniform mesh (Figure 3). The run time for these four separate 10 h simulations was 20 min 58 s using 2 Nvidia V100 GPUs, with each simulation utilising a single GPU and taking ≈ 10 min. For comparison purposes one of these 10 h simulations was simulated using the MPI and OpenMP version of the Volna code on 40 CPUs (2.4Ghz Intel Xeon Gold 6148 (Skylake) processors). The run time in this case was ≈ 3 h.
It can be seen from the maximum wave heights (Figure 4) that the overall wave energy directionality of the tsunami is consistent across Sources 2–4. Source 1 fails to produce signs of refraction of the wave by the Porcupine Bank at the wave height scale used (Figure 4). It is interesting to note the presence of wave amplification as it propagates onto the continental shelf. This phenomenon has been observed elsewhere and has been reproduced in experimental set ups [29]. Based on the selected wave gauge plots (Figure 5) and the maximum wave heights (Figure 4), Source 3, which has been proposed by BRGM, appears to be the most impactful. It can be seen from the wave gauge plots (Figure 5) that this source produces the maximum wave heights along the Irish coastline, with the maximum wave height of ≈ 1 m produced at Dunmore East. With the minimum mesh element size set at 100 m, these results provide adequate accuracy for assessing the regional areas most at risk and/or considering wave gauge outputs. It is acknowledged that the run times will need to be decreased further for these results to become applicable for a warning centre. However, with increased computational resources this is feasible and it would thus allow for more spatially accurate warnings.

4. High Resolution Inundation Mapping

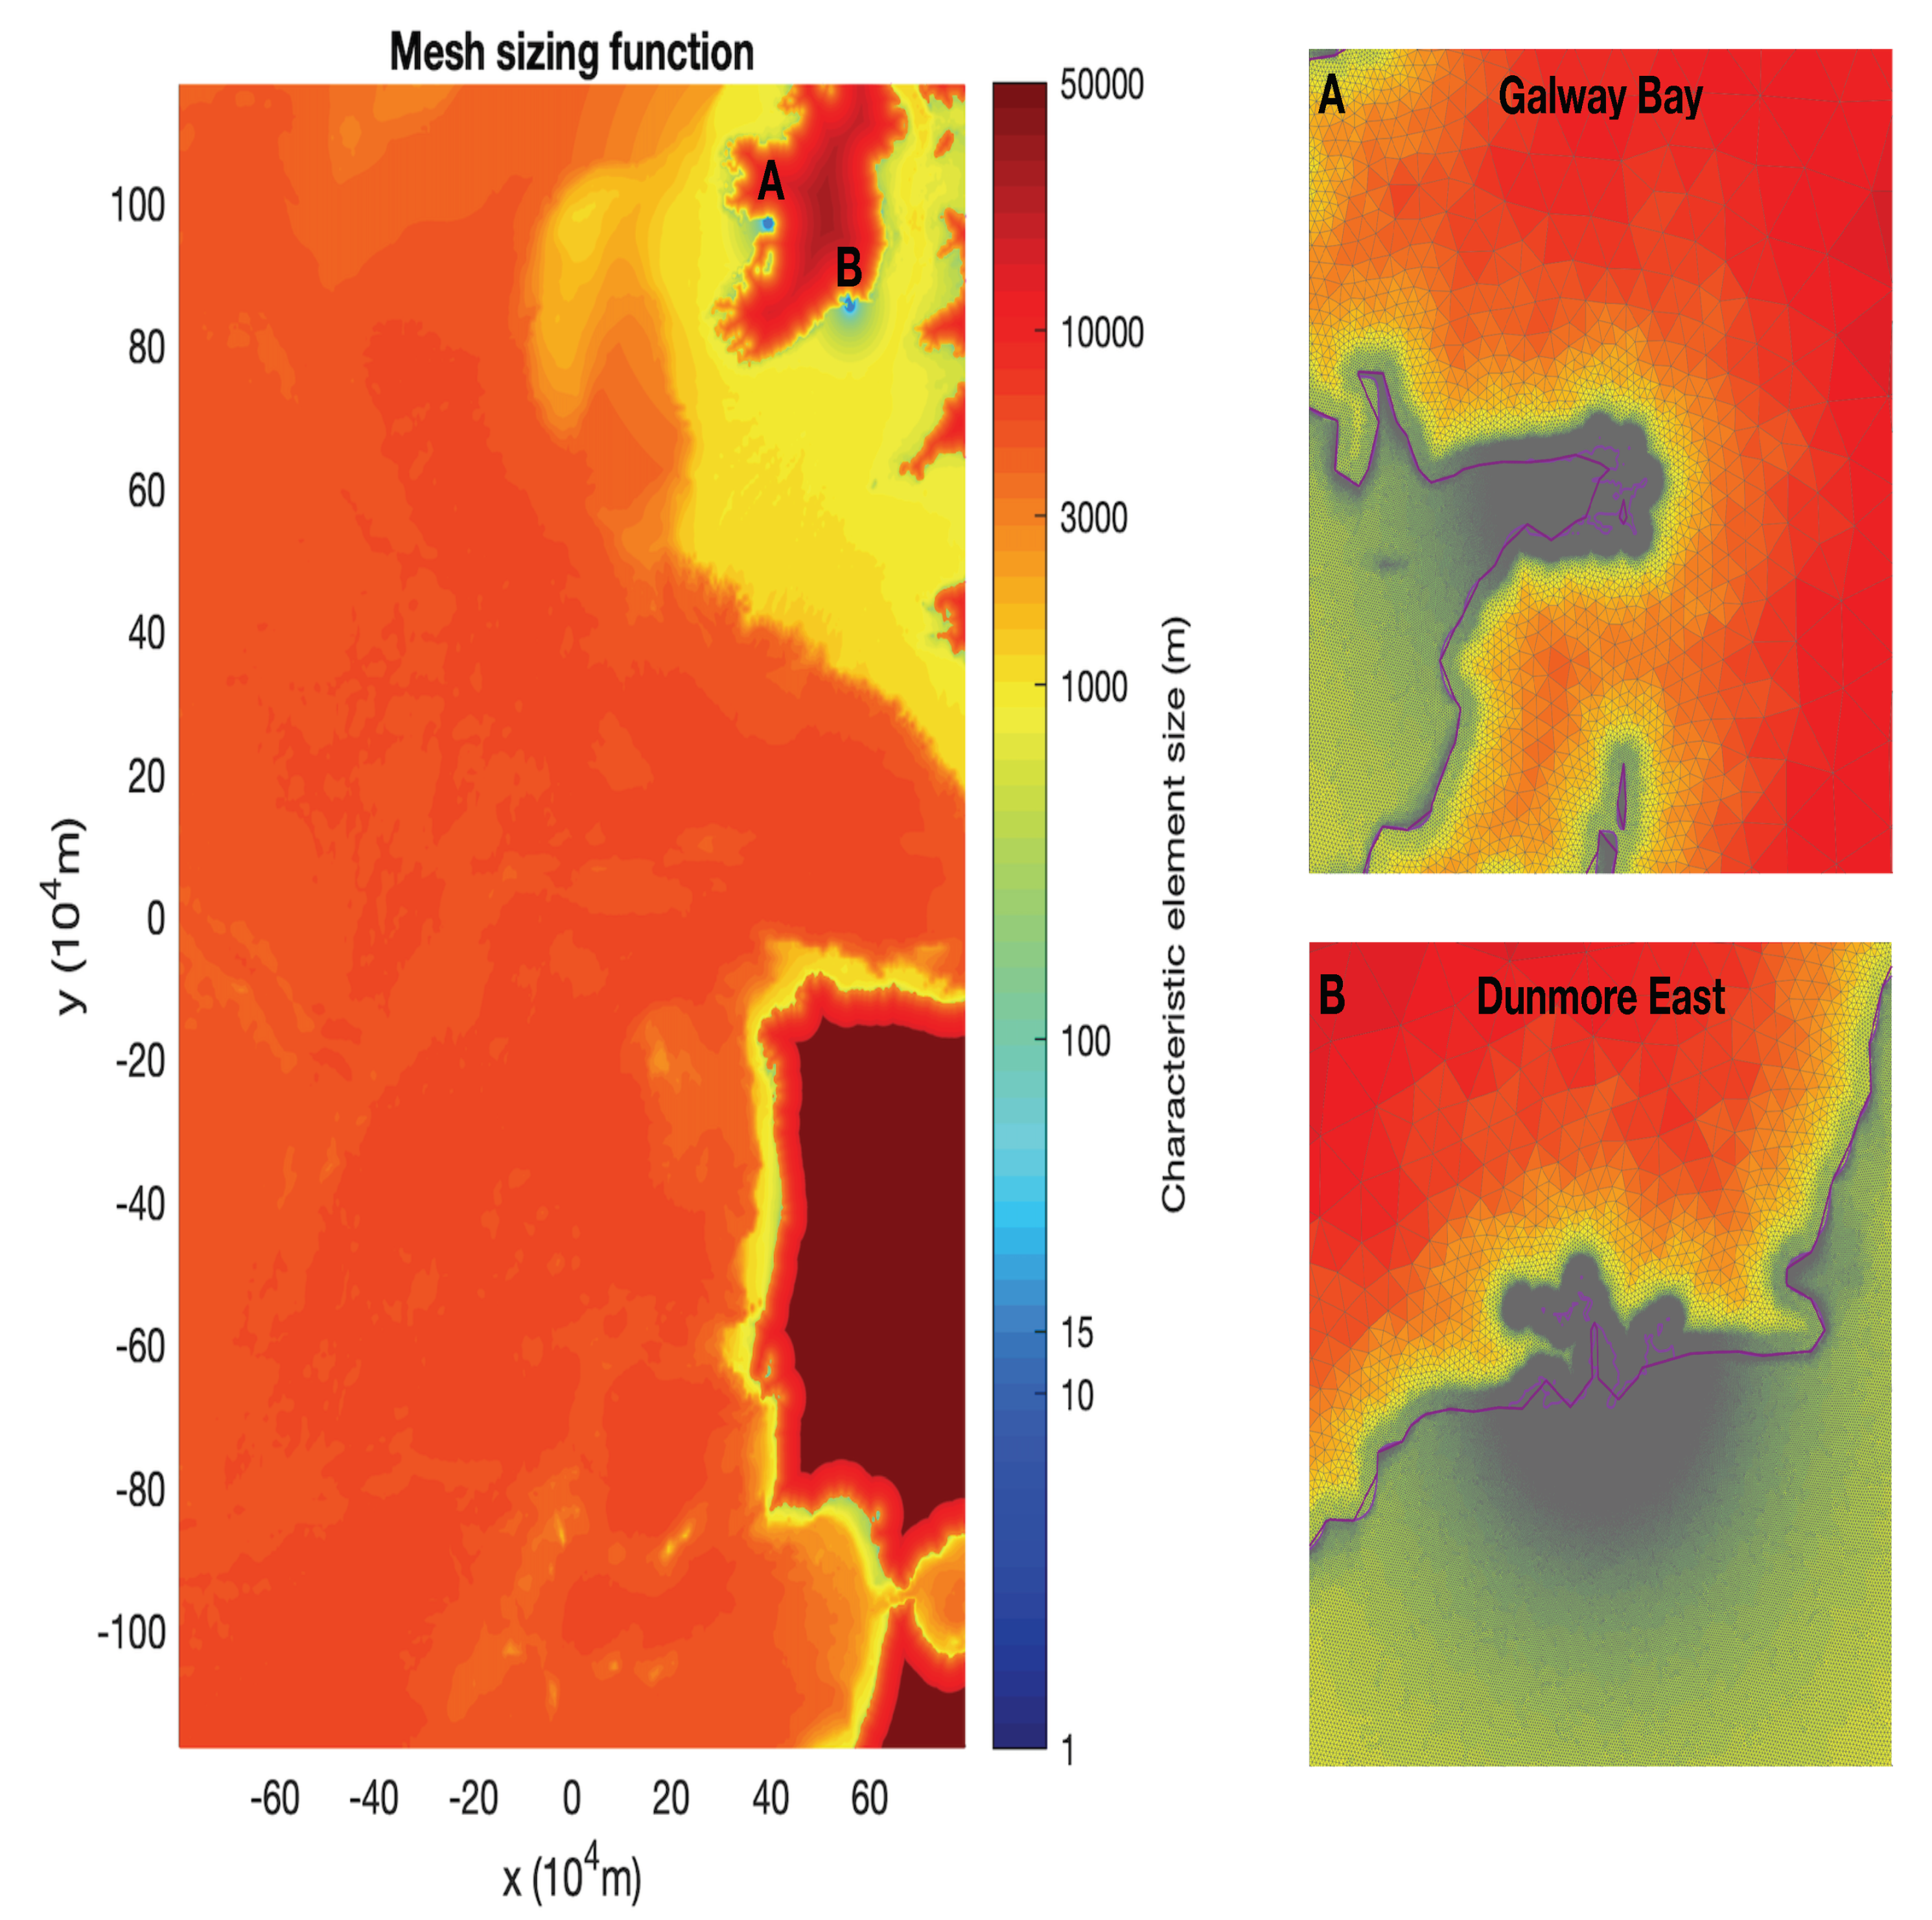
In order to provide accurate information on the inundation extent of such an event on the Irish coastline, higher resolution meshes must be generated and used. At present it is unfeasible to carry out these high resolution simulations with Volna-OP2 with run times which would be beneficial to a warning centre. The explicit temporal scheme is the main constraint on this for Volna-OP2, as the time step is governed by the minimum mesh element size.
In order to generate the high resolution meshes one must first obtain bathymetry/topography data (≈ 10 m) for areas of interest (Galway Bay and Dunmore East). The topography for the grids was obtained from raw LiDAR data. In order to ensure that the high resolution data was continuous with the regional data, all the LiDAR/near shore data was spatially (latitude/longitude) referenced to WGS84 (a global coordinate system). The raw LiDAR and near shore bathymetry data were vertically referenced to OD Malin (vertical datumn used in Ireland), thus an assimilation step was required to remove the discontinuity with the regionally defined data. Further, due to the difficulty in obtaining bathymetry data in shallow regions, gaps between the near shore and the onshore LiDAR data were present. Some smoothing filters were applied to remove these gaps and to produce continuous bathymetry/topography grids (Figure 6 and Figure 7). The resultant grids were used in the generation of the high resolution mesh (Figure 8).
It should be noted that the relevant tidal levels, which could have a substantial effect on the extent of inundation, are not captured in this study. The authors acknowledge that to provide a fully comprehensive hazard assessment, these tidal effects along with other factors discussed in Section 5 need to be investigated.
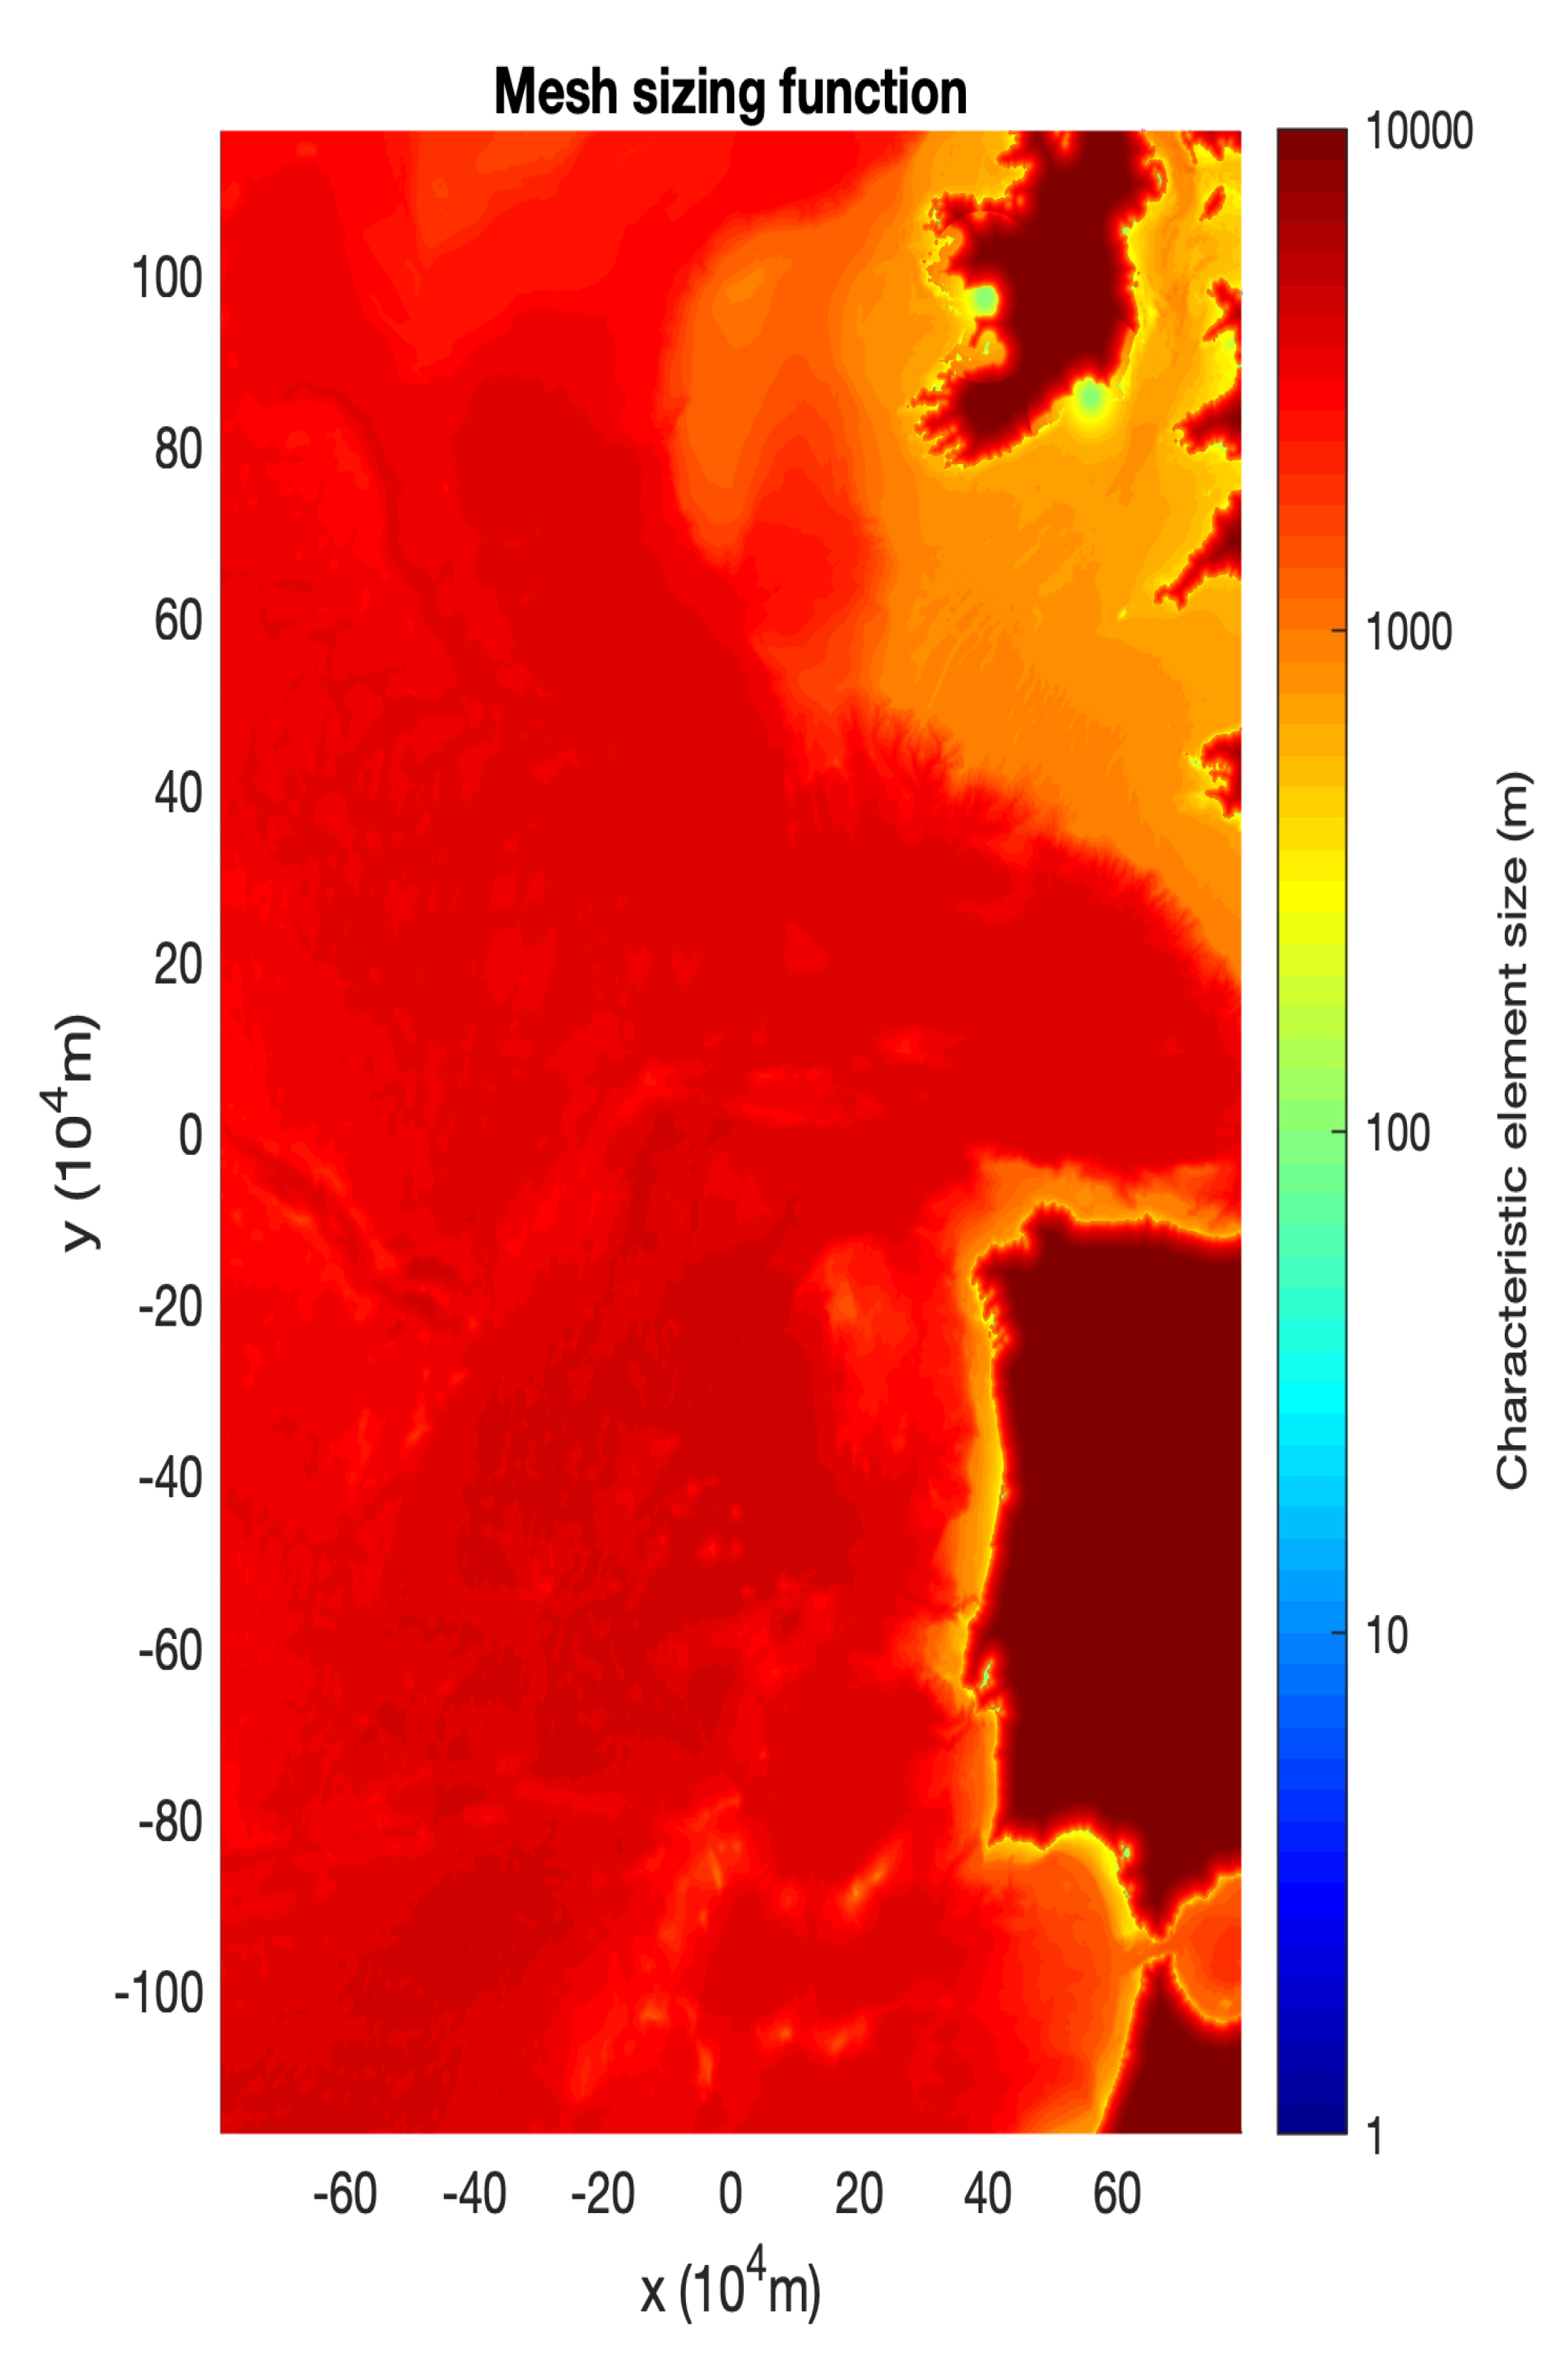
The nonuniform unstructured meshes (Figure 3 and Figure 8) were generated using a customised mesh sizing function and the GMSH software [30]. The mesh sizing function splits the domain into three separate regions—offshore, onshore and port region (area of interest). In the offshore region the mesh size is calculated based on the bathymetry value b ( x , y ) . Onshore cell sizes are dependent on the distance to the coastline while in the area of interest a fixed cell size is used. Full details on the mesh sizing function are given in Reference [18].
In the interest of minimising the runtime a ’hotstart’ technique was employed. From the simulations in Section 3.2, the dependent variables ( H , H u , H v ) were outputted after 4 h of simulated time. These variables were interpolated onto the fine mesh (Figure 8) and therefore acted as the initial conditions. The simulations on the fine mesh were then carried out for a further 6 h, with the runtime for all four fine mesh simulations taking a total of 1 h 59 min, using 2 Nvidia V100 GPUs.

4.1. Inundation Maps

The following inundation maps highlight land areas which were inundated during the high resolution simulations (10 m resolution). The maximum run-up height was calculated to be ≈ 3.4 m for both the Dunmore East and Galway Bay areas. It should be noted that the simulations with these highly non-uniform meshes were extremely dependent on the Courant-Friedrich-Levant (CFL) parameter used. Too high of a CFL condition and the numerical simulation became unstable, while too low of a value and the tsunami signal became diffused and dispersed. Thus, multiple preliminary runs were needed to optimise this parameter.

4.1.1. Galway Bay

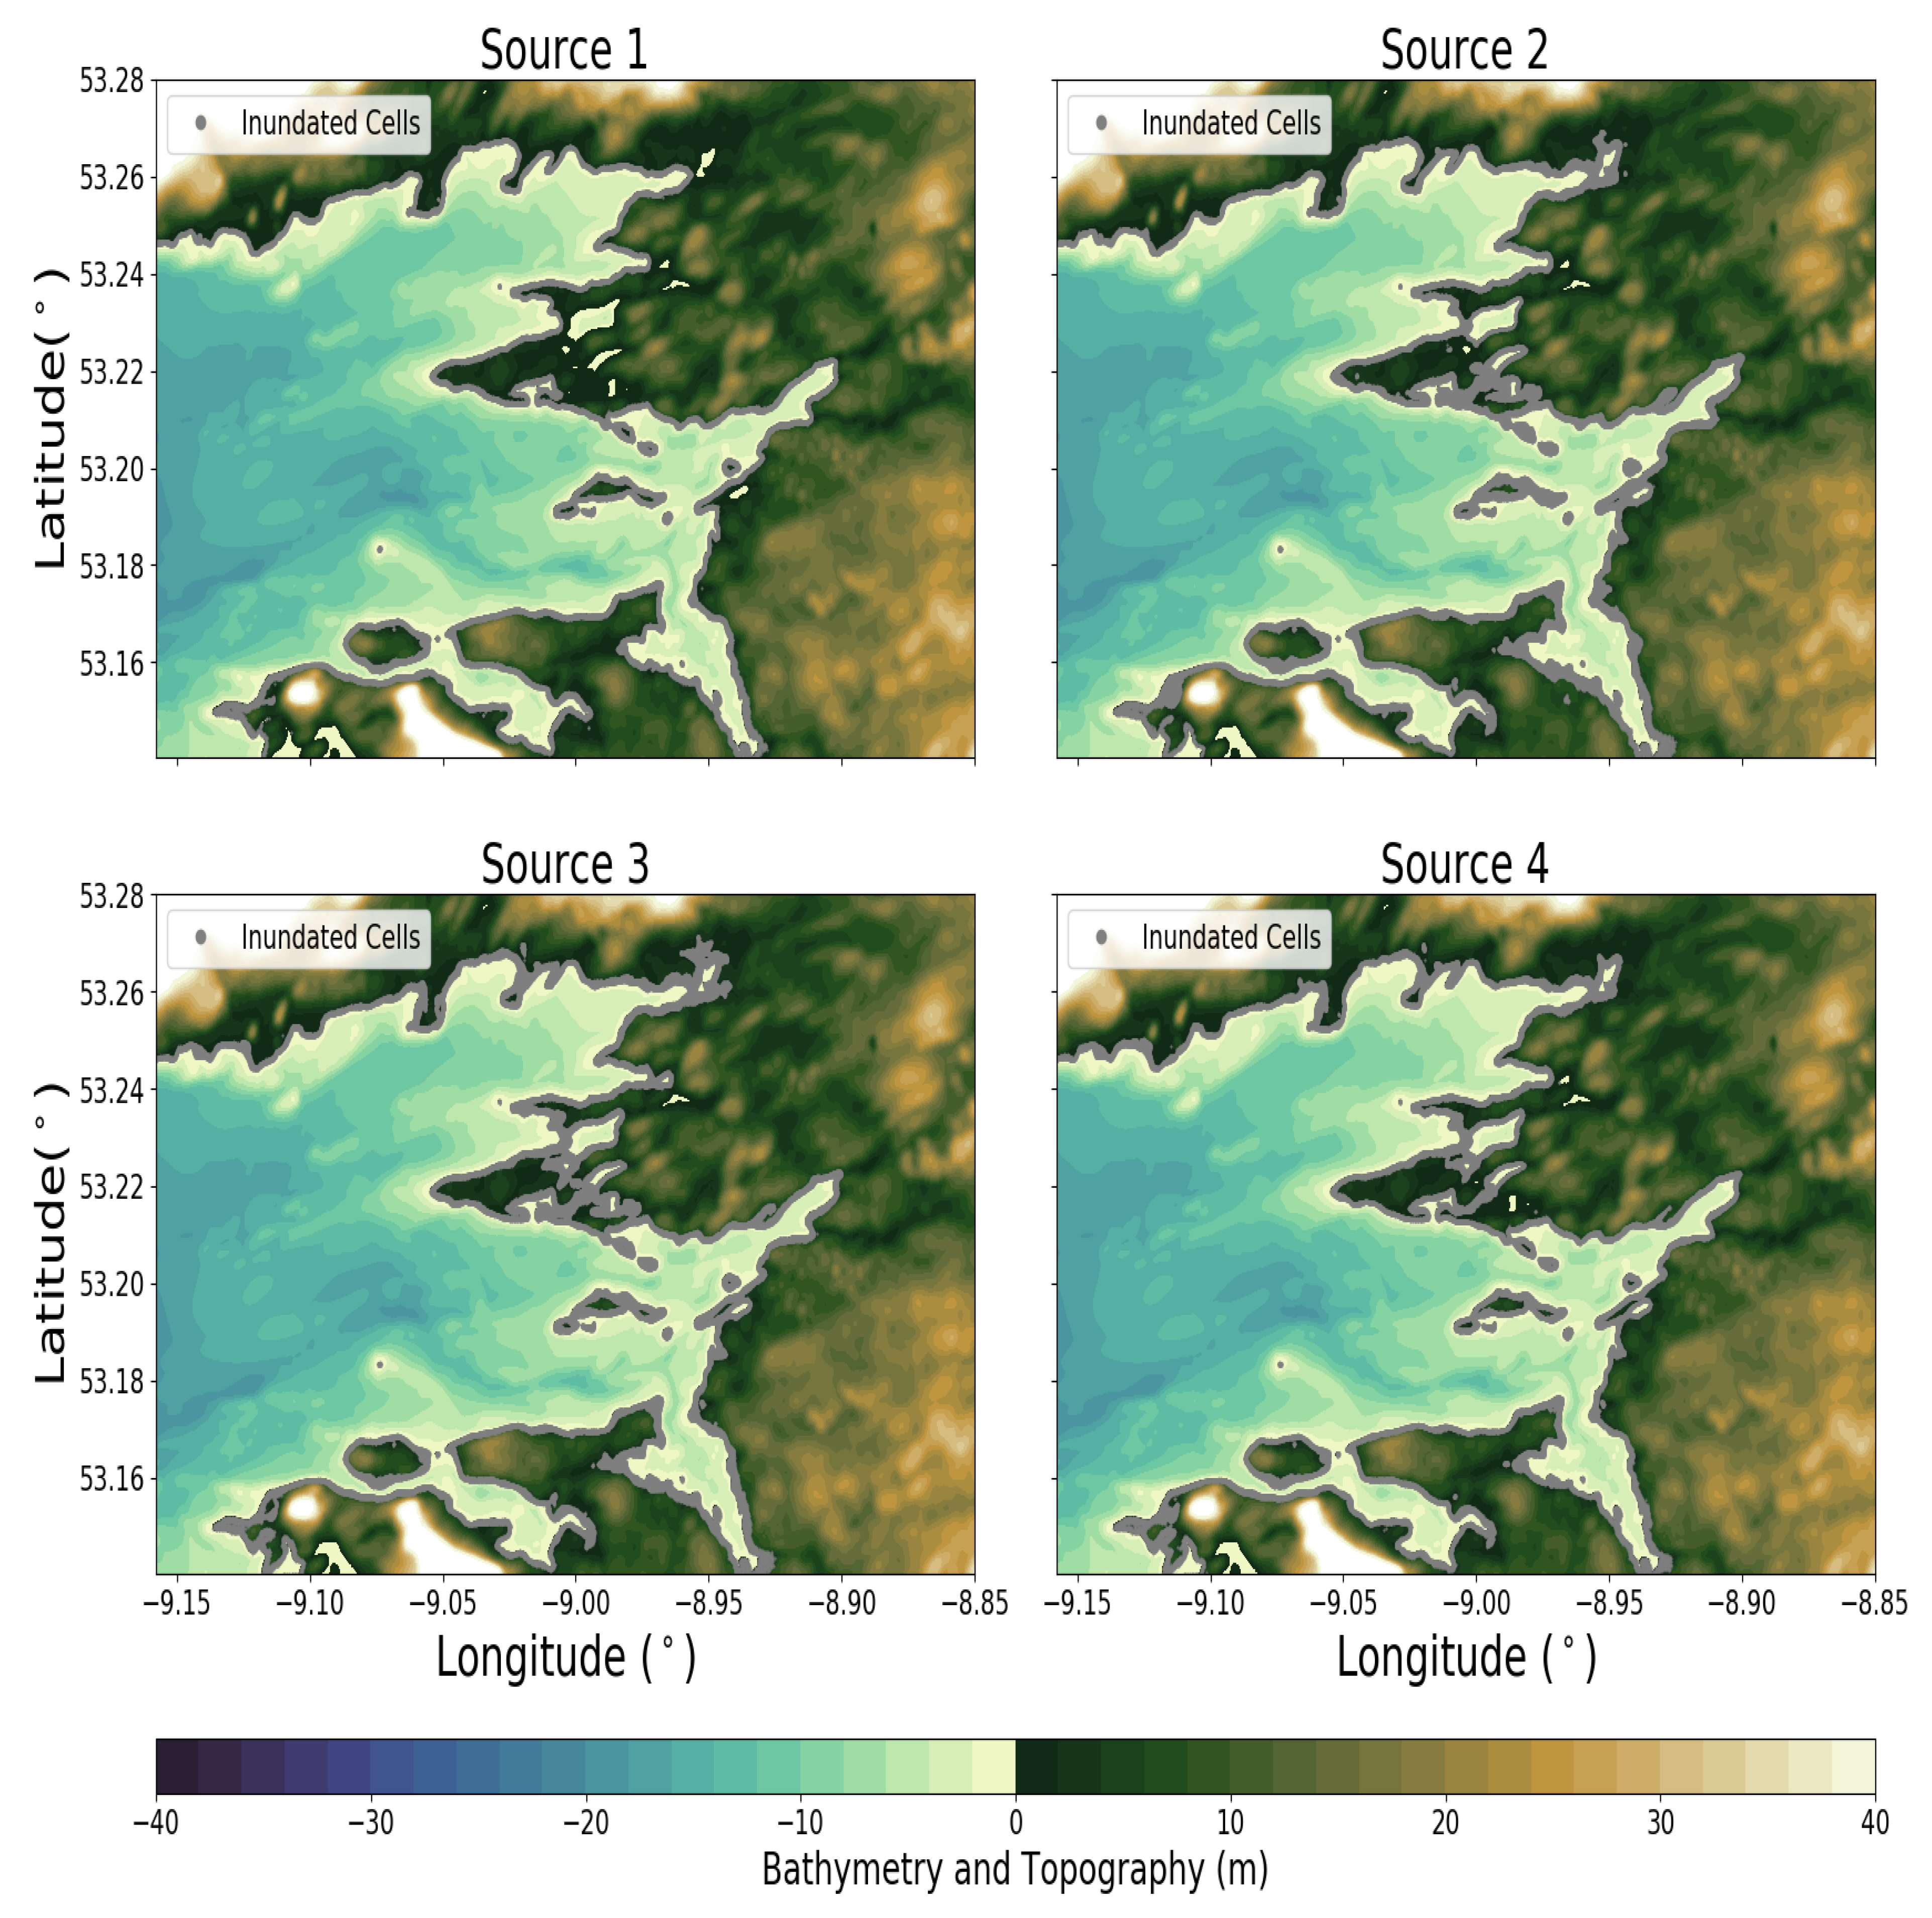
Figure 9 highlights the areas of inundation for the Galway Bay region from each of the four sources simulated. The grey points in 
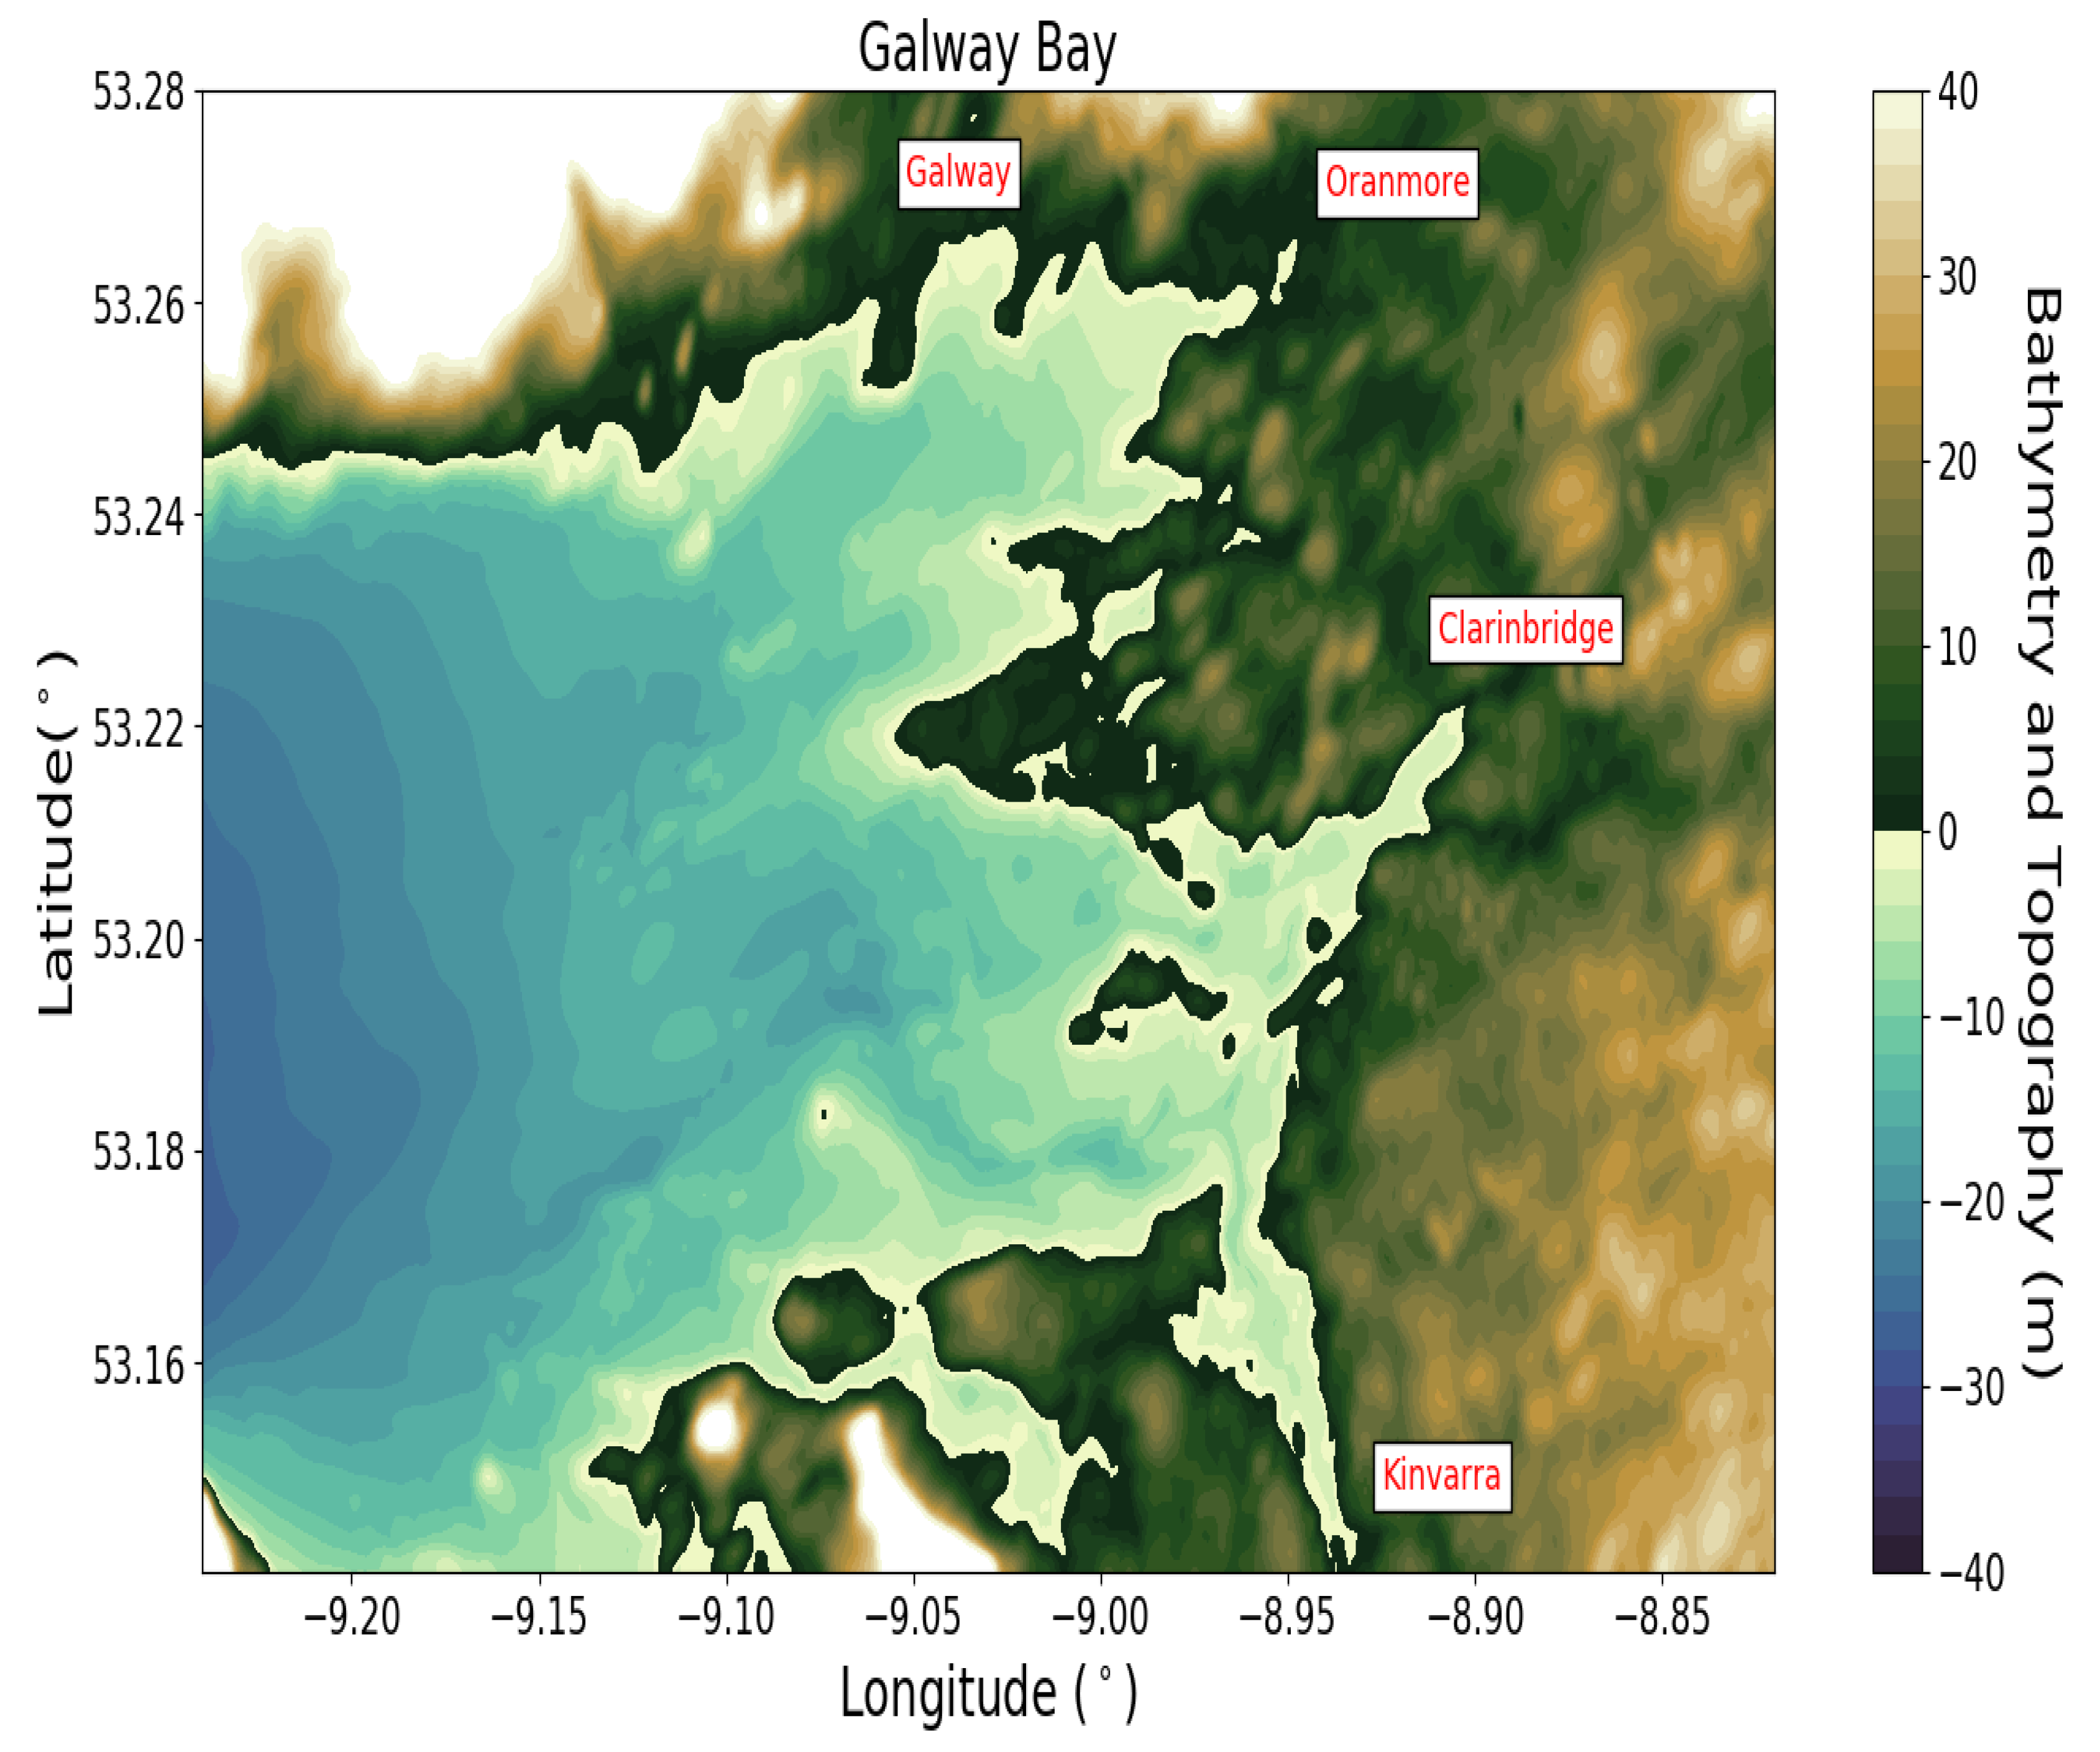
Figure 9 indicate cells which were inundated during the various simulations. It can be seen that the model predicts inundation at Kinvarra, Clarinbridge and Oranmore (marked on map) (Figure 10). Further, it predicts little inundation at Galway itself. The lack of high resolution bathymetry/topography in the Galway city area (Mutton Island) could be responsible for this. Source 1 causes the least amount of inundation while there is a consistency in the areas and extent of inundation for Sources 2–4.

4.1.2. Dunmore East

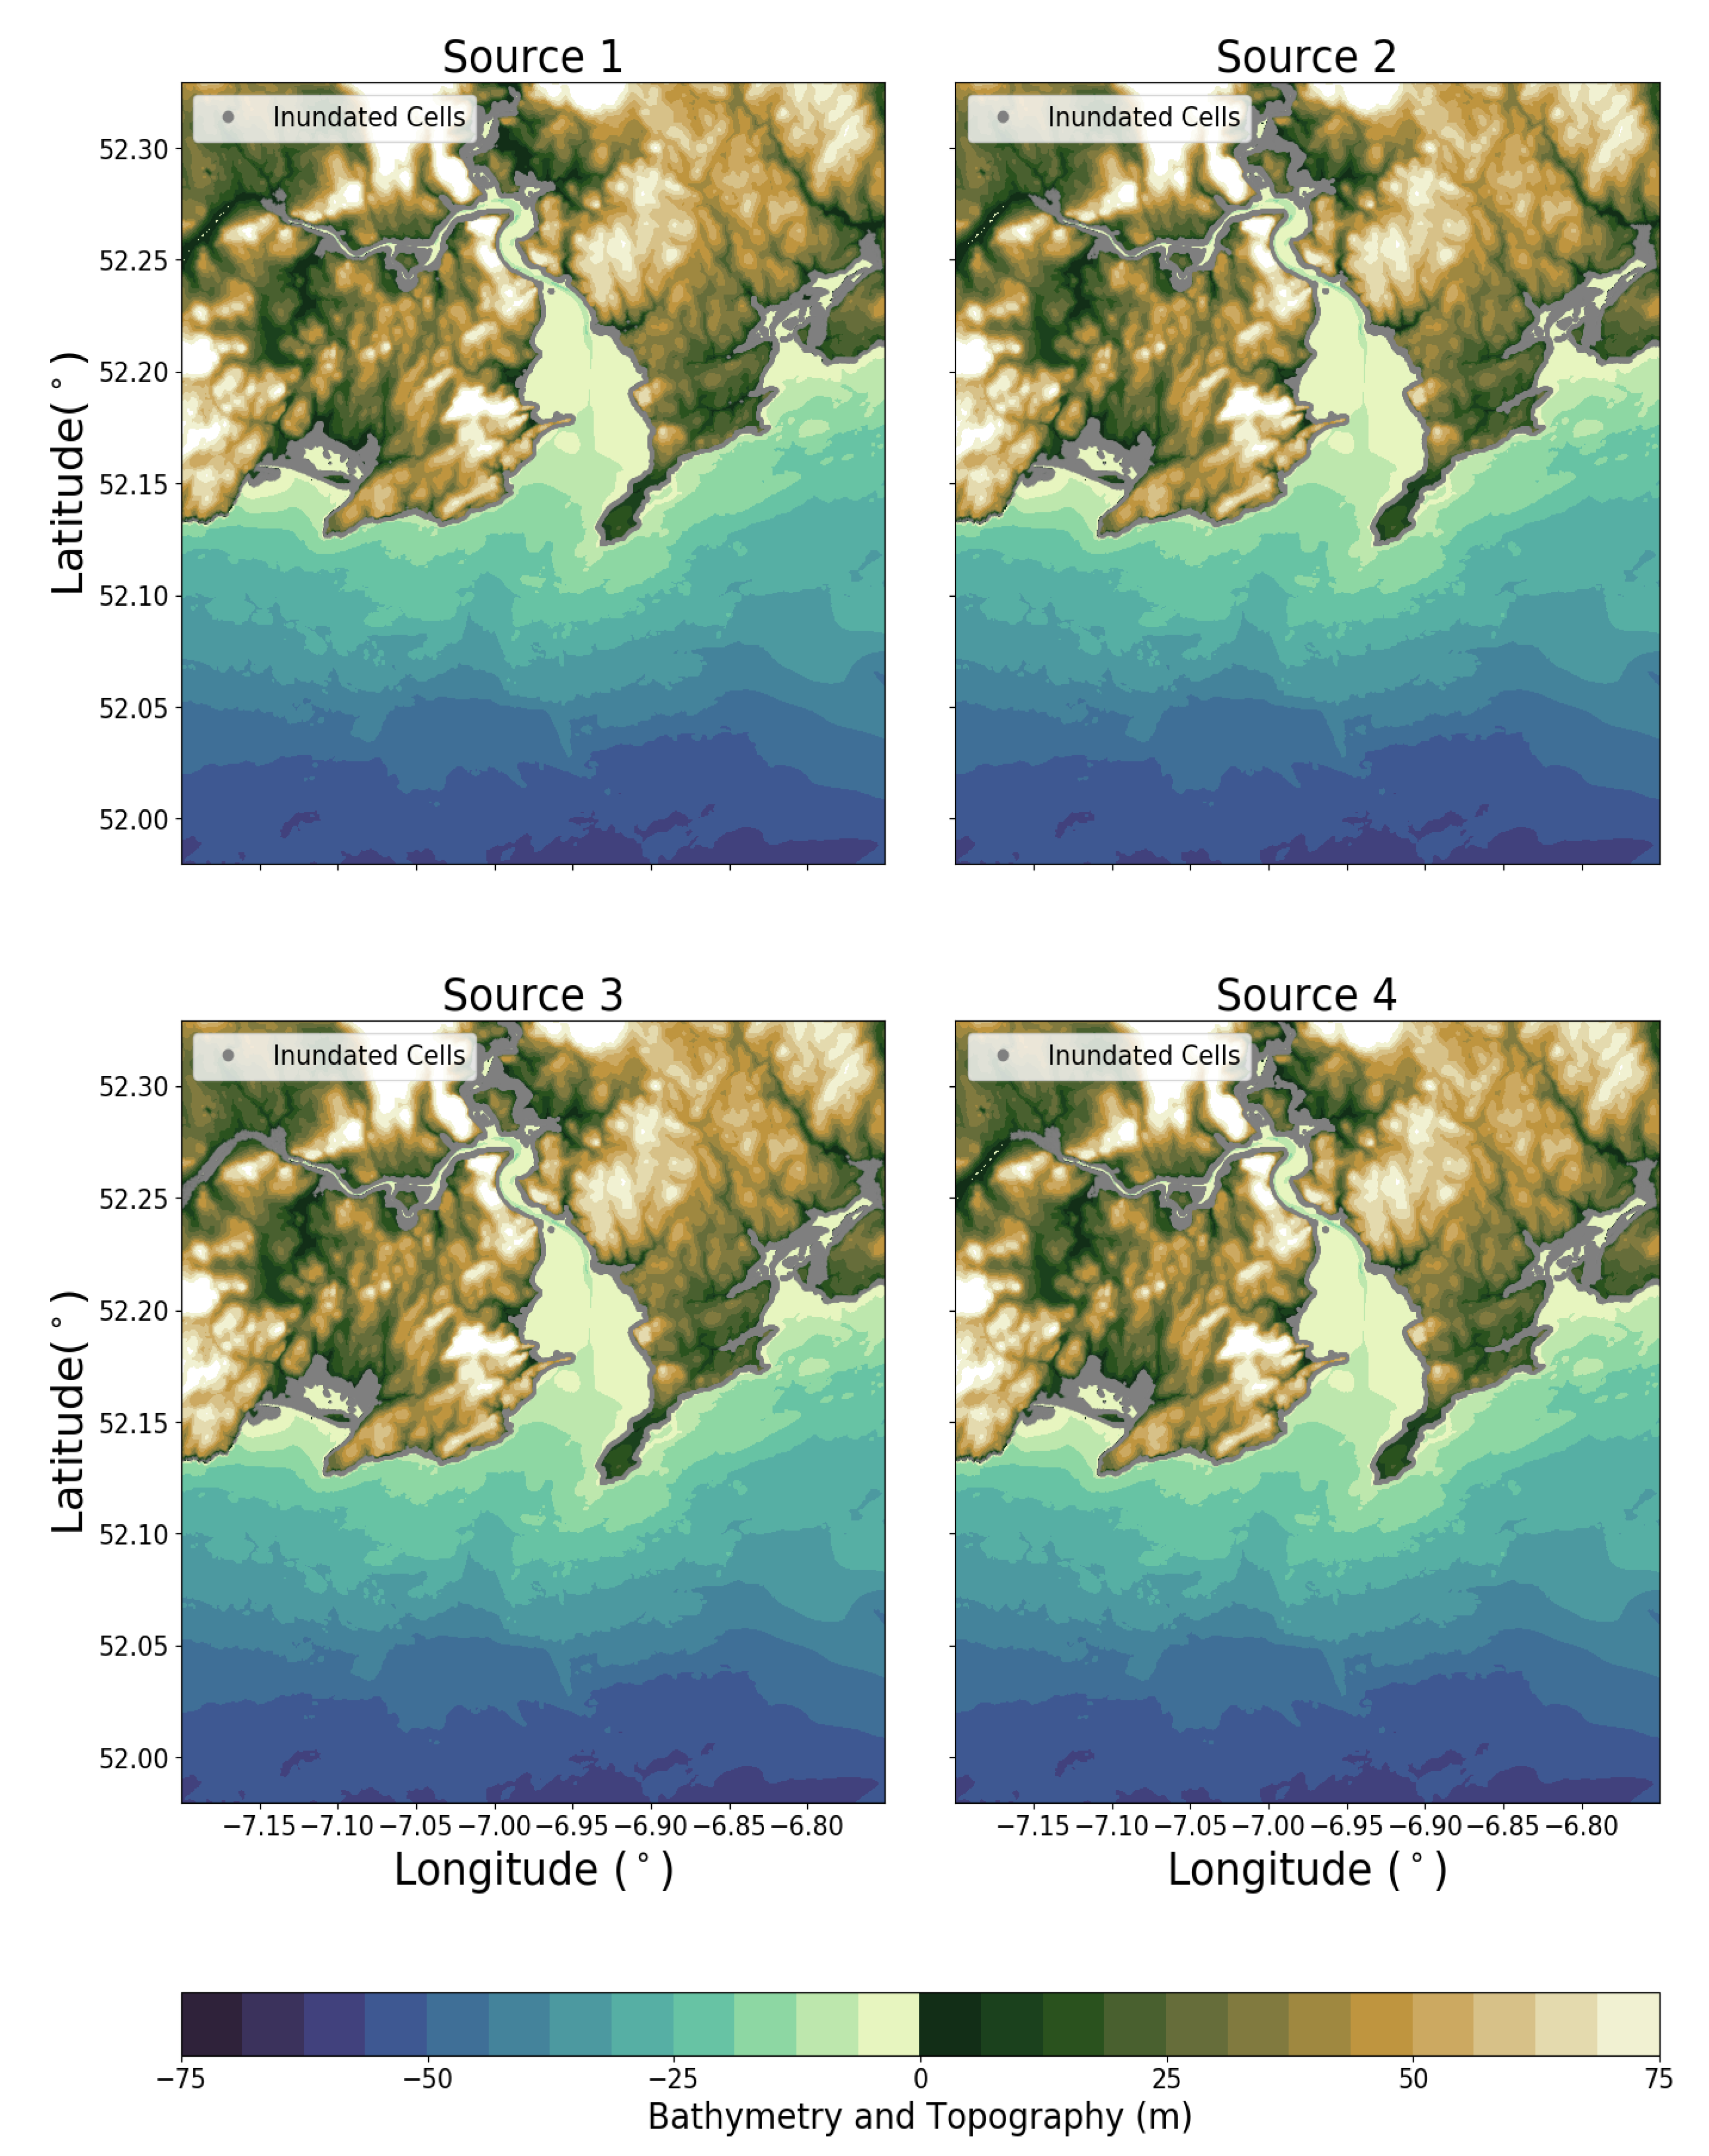
Figure 11 highlights the areas of inundation for the Dunmore East region from each of the four sources simulated. The grey points in 
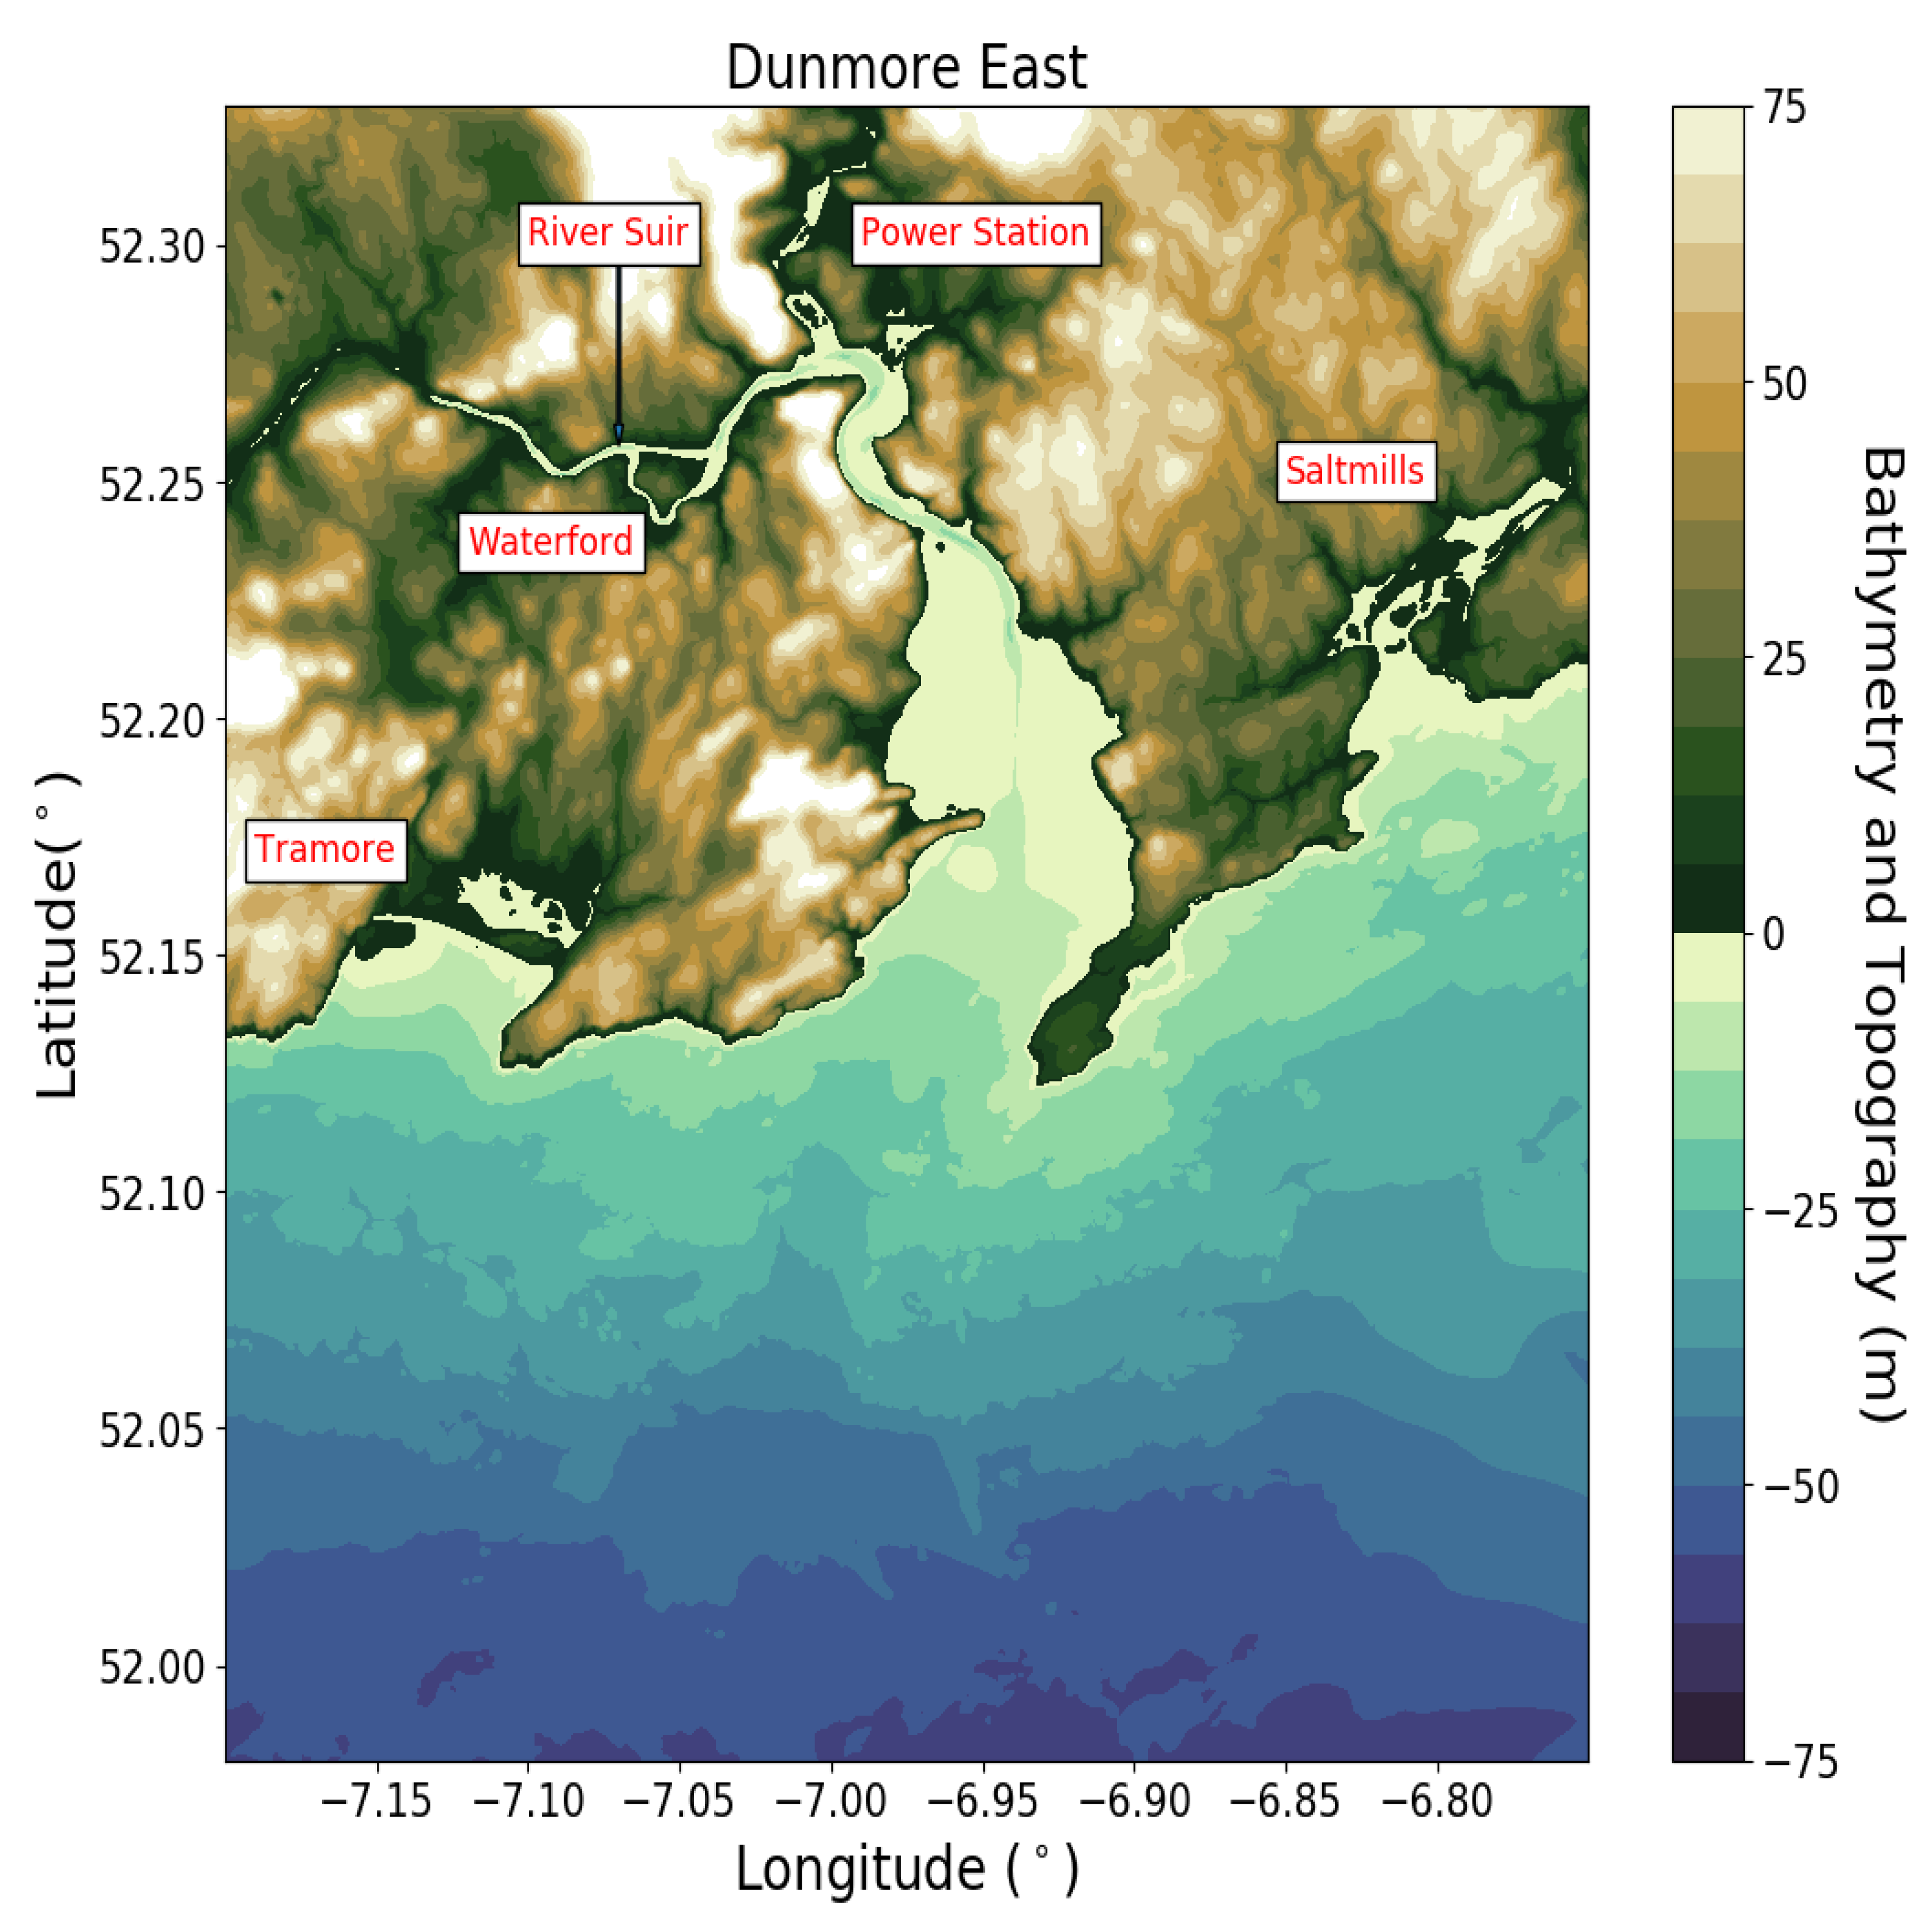
Figure 11 indicate cells which were inundated during the various simulations. The areas of inundation include Tramore, Saltmills and near the Great Island Power Station (marked on map) (Figure 12). It should be noted that the flow in the River Suir was not modelled in these simulations. This river flow could lead to the formation of a bore and thus allow the tsunami wave to propagate further up the river. The maximum water height at the Waterford coastline is predicted to be ≈ 1.2 m. The maximum run-up height was calculated to be ≈ 3.4 m. Similar to the Galway bay results presented above, Source 1 causes the least amount of inundation while there is a consistency in the areas and extent of inundation for Sources 2–4.

5. Discussion and Concluding Remarks

In line with the goals and directives set out by the tsunami community after the devastating tsunami events of the 2004 Indian Ocean and 2011 Tohuku tsunamis, this paper presents new attempts to quantify the tsunami hazard associated for sections of the Irish Coastline. As the 1755 Lisbon tsunami was the last major tsunami to affect the Irish coastline, it serves here as a worst case scenario. Multiple earthquake scenarios presented in the literature are simulated, with the inundation levels at vulnerable sections of the Irish coastline investigated for the four most impactful sources. Faster than real time tsunami simulations are achieved with the massively parallelised Volna-OP2 tsunami code. These faster than real time simulations will greatly improve the warning capabilities of tsunami early warning centres, with the Volna-OP2 code presented as a candidate code which could be implemented into a tsunami warning centre’s workflow.
In the immediate aftermath of a tsunamigenic source being detected there is always some uncertainty on the physical parameters of the source. Thus, multiple tsunami realisations are needed to capture the spread of potential tsunami wave distributions. Any potential sources can become an input into an ’on the fly’ ensemble with Volna-OP2 being the tsunami code kernel. The resultant absolute maximum and mean wave height plots can augment the results from the tsunami warning centres’ pre-computed database. It is shown here with a uniform mesh resolution of ≈ 3.3 km that 6 separate tsunami simulations can be simulated using 2 Nvidia V100 GPUs in 93 s. However in order to refine these regional forecasts a non-uniform mesh with a minimum element size of 100 m is used. The four most impactful sources identified in the initial ensemble are simulated again for 10 h with a runtime of ≈ 21 min (using 2 Nvidia V100 GPUs). Although this runtime is outside the scope of being beneficial for a tsunami warning centre, more computing resources would contribute to reducing these times. The refined regional forecasts would allow a warning centre to issue more accurate warnings. These regional results corroborate previous studies on what sections of Irish coastline (the west and south east) are particularly vulnerable to a repeated Lisbon-type event. The authors acknowledge that the ’on the fly’ ensembles presented here are preliminary and major effort in developing efficient workflows around the code is needed. However, it is clear that Volna-OP2 has promising potential when it comes to this respect.
There exists a severe lack of studies in the literature on the hazard assessment associated with a Lisbon-type tsunami on the Irish coastline. Therefore, the high resolution tsunami hazard assessment presented here is considered a pilot study on the extent of inundation for the most vulnerable sections of the Irish coastline from a Lisbon-type event. High resolution simulations of the areas of interest were achieved by utilising a non-uniform unstructured mesh and simulating the tsunamis with Volna-OP2. It was found that these high resolution inundation simulations were extremely dependent on the CFL condition, and thus required multiple preliminary runs to optimise for. The assessment found that there was a consistency in the areas and levels of inundation across the four sources simulated, with only source 1 producing a notably less amount of inundation. The inundation extent was constrained to low-lying areas in the Dunmore East and Galway Bay regions, with a maximum run-up of 3 . 4 m for both regions. The depth of water above the underlying topography (inundation depth) reached 2 m in parts. This level of inundation could pose a risk to various infrastructures (Great Island Power Station) and members of the public located near the shoreline. To date, the above pilot study provides the best estimate of assessing the hazard associated with a Lisbon type tsunami event on the Irish coastline. However, to provide a full hazard assessment of the Irish coastline, some further sites (south coast) and factors should be included, such as tidal forcing, ’street level’ inundation and the effect of wave dispersion. Thus, the inundation plots produced should only be used as a guidance on the potential tsunami hazard of an area.

Author Contributions

D.G. coordinated the scientific effort together with F.D., B.M. suggested the topic of the study. D.G. performed all numerical simulations. The overall supervision was provided by F.D. All authors participated in the interpretation of results and the writing of the manuscript. All authors have read and agreed to the published version of the manuscript.

Funding

Daniel Giles acknowledges the support of the Government of Ireland Postgraduate Scholarship GOIPG/2017/68 from the Irish Research Council. The authors acknowledge funding from Geological Survey Ireland.

Acknowledgments

The authors wish to acknowledge the DJEI/DES/SFI/HEA Irish Centre for High-End Computing (ICHEC) for the provision of computational resources. The authors acknowledge marine bathymetry and coastal LiDAR data from Geological Survey Ireland and coastal LiDAR data from Office of Public Works. Audrey Gailler (CENALT) is acknowledged for her guidance on the choice of earthquake sources.

Conflicts of Interest

The authors declare no conflict of interest.

References

  1. Bernard, E.N.; Mofjeld, H.O.; Titov, V.; Synolakis, C.E.; González, F.I. Tsunami: Scientific frontiers, mitigation, forecasting and policy implications. Phil. Trans. R. Soc. A. 2006, 346, 1989–2007. [Google Scholar] [CrossRef]
  2. Titov, V.V.; Rabinovich, A.B.; Mofjeld, H.O.; Thomson, R.E.; González, F.I. The global reach of the 26 December 2004 Sumatra tsunami. Science 2005, 309, 2045–2048. [Google Scholar] [CrossRef] [PubMed] [Green Version]
  3. Bernard, E.N.; Titov, V. Evolution of tsunami warning systems and products. Phil. Trans. R. Soc. A. 2015, 373, 20140371. [Google Scholar] [CrossRef] [PubMed]
  4. Synolakis, C.E.; Bernard, E.N. Tsunami science before and beyond Boxing Day 2004. Phil. Trans. R. Soc. A. 2006, 364, 2231–2265. [Google Scholar] [CrossRef]
  5. Barkan, R.; Uri, S.; Lin, J. Far field tsunami simulations of the 1755 Lisbon earthquake: Implications for tsunami hazard to the U.S. East Coast and the Caribbean. Mar. Geol. 2009, 40, 109–122. [Google Scholar] [CrossRef]
  6. O’Brien, L.; Dudley, J.M.; Dias, F. Extreme wave events in Ireland: 14 680 BP—2012. Nat. Hazards Earth Syst. Sci. 2013, 13, 625–648. [Google Scholar] [CrossRef] [Green Version]
  7. Martínez Solares, J.; López Arroyo, A. The great historical 1755 earthquake. Effects and damage in Spain. J. Seismol. 2004, 8, 275–294. [Google Scholar] [CrossRef]
  8. Grandin, R.; Borges, J.F.; Bezzeghoud, M.; Caldeira, B.; Carrilho, F. Simulations of strong ground motion in SW Iberia for the 1969 February 28 (Ms = 8.0) and the 1755 November 1 (M∼ 8.5) earthquakes—II. Strong ground motion simulations. Geophys. J. Int. 2007, 171, 807–822. [Google Scholar] [CrossRef] [Green Version]
  9. Baptista, M.A.; Miranda, J.; Chierici, F.; Zitellini, N. New study of the 1755 earthquake source based on multi-channel seismic survey data and tsunami modeling. Nat. Hazards Earth Syst. Sci. 2003, 3, 333–340. [Google Scholar] [CrossRef] [Green Version]
  10. Baptista, M.A.; Miranda, P.M.; Miranda, J.M.; Mendes Victor, L. Constrains on the source of the 1755 Lisbon tsunami inferred from numerical modelling of historical data on the source of the 1755 Lisbon tsunami. J. Geodyn. 1998, 25, 159–174. [Google Scholar] [CrossRef]
  11. Baptista, M.A.; Miranda, J.; Omira, R.; Antunes, C. Potential inundation of Lisbon downtown by a 1755-like tsunami. Nat. Hazards Earth Syst. Sci. 2011, 11, 3319–3326. [Google Scholar] [CrossRef] [Green Version]
  12. HR Wallingford; British Geological Survey; Proudman Oceanographic Laboratory. Tsunamis—Assessing the Hazard for the UK and Irish Coasts; Technical Report; DEFRA (Department for Environment, Food and Rural Affairs), Flood Management Division: London, UK, 2006. [Google Scholar]
  13. Gailler, A.; Hébert, H.; Loevenbruck, A.; Hernandez, B. Simulation systems for tsunami wave propagation forecasting within the French tsunami warning center. Nat. Hazards Earth Syst. Sci. 2013, 13, 2465. [Google Scholar] [CrossRef] [Green Version]
  14. Geist, E.L.; Parsons, T. Probabilistic Analysis of Tsunami Hazards. Nat. Hazards 2006, 37, 277–314. [Google Scholar] [CrossRef]
  15. Grezio, A.; Babeyko, A.; Baptista, M.A.; Behrens, J.; Costa, A.; Davies, G.; Geist, E.L.; Glimsdal, S.; González, F.I.; Griffin, J.; et al. Probabilistic Tsunami Hazard Analysis: Multiple Sources and Global Applications. Rev. Geophys. 2017, 55, 1158–1198. [Google Scholar] [CrossRef]
  16. Salmanidou, D.M.; Guillas, S.; Georgiopoulou, A.; Dias, F. Statistical emulation of landslide-induced tsunamis at the Rockall Bank, NE Atlantic. Proc. R. Soc. Math. Phys. Eng. Sci. 2017, 473. [Google Scholar] [CrossRef] [PubMed] [Green Version]
  17. Guillas, S.; Sarri, A.; Day, S.J.; Liu, X.; Dias, F. Functional emulation of high resolution tsunami modelling over Cascadia. Ann. Appl. Stat. 2018, 12, 2023–2053. [Google Scholar] [CrossRef]
  18. Gopinathan, D.; Heidarzadeh, M.; Guillas, S. Probabilistic Quantification of Tsunami Currents in Karachi Port, Makran Subduction Zone, using Statistical Emulation. Earth Space Sci. Open Arch. 2020. [Google Scholar] [CrossRef]
  19. Dutykh, D.; Poncet, R.; Dias, F. The VOLNA code for the numerical modeling of tsunami waves: Generation, propagation and inundation. Eur. J. Mech. B/Fluids 2011, 30, 598–615. [Google Scholar] [CrossRef] [Green Version]
  20. Reguly, I.; Giles, D.; Gopinathan, D.; Quivy, L.; Beck, J.H.; Giles, M.B.; Guillas, S.; Dias, F. The VOLNA-OP2 tsunami code (version 1.5). Geosci. Model Dev. 2018, 11, 4621–4635. [Google Scholar] [CrossRef] [Green Version]
  21. Giles, D.; Kashdan, E.; Salmanidou, D.; Guillas, S.; Dias, F. Performance analysis of Volna-OP2—Massively parallel code for tsunami modelling. arXiv 2020, arXiv:2002.04889. [Google Scholar]
  22. Mudalige, G.; Giles, M.; Reguly, I.; Bertolli, C.; Kelly, P. OP2: An active library framework for solving unstructured mesh-based applications on multi-core and many-core architectures. In Innovative Parallel Computing (InPar); IEEE: Piscataway, NJ, USA, 2012; pp. 1–12. [Google Scholar]
  23. Beck, J.; Guillas, S. Sequential Design with Mutual Information for Computer Experiments (MICE): Emulation of a Tsunami Model. SIAM/ASA J. Uncertain. Quantif. 2016, 4, 739–766. [Google Scholar] [CrossRef] [Green Version]
  24. Liu, X.; Guillas, S. Dimension Reduction for Gaussian Process Emulation: An Application to the Influence of Bathymetry on Tsunami Heights. SIAM/ASA J. Uncertain. Quantif. 2017, 5, 787–812. [Google Scholar] [CrossRef]
  25. Gopinathan, D.; Venugopal, M.; Roy, D.; Rajendran, K.; Guillas, S.; Dias, F. Uncertainties in the 2004 Sumatra–Andaman source through nonlinear stochastic inversion of tsunami waves. Proc. R. Soc. Lond. Math. Phys. Eng. Sci. 2017, 473. [Google Scholar] [CrossRef] [PubMed] [Green Version]
  26. Giles, M.B.; Mudalige, G.R.; Sharif, Z.; Markall, G.; Kelly, P.H. Performance analysis and optimization of the OP2 framework on many-core architectures. Comput. J. 2011, 55, 168–180. [Google Scholar] [CrossRef]
  27. Løvholt, F.; Lorito, S.; MacÍas, J.; Volpe, M.; Selva, J.; Gibbons, S. Urgent tsunami computing. In Proceedings of the Urgent HPC 2019: 1st International Workshop on HPC for Urgent Decision Making—Held in conjunction with SC 2019: The International Conference for High Performance Computing, Networking, Storage and Analysis, Denver, CO, USA, 17–22 November 2019; pp. 45–50. [Google Scholar] [CrossRef] [Green Version]
  28. Okada, B. Surface deformation due to shear and tensile faults in a half-space. Bull. Seismol. Soc. Am. 1985, 75, 1135. [Google Scholar]
  29. Knowles, J.; Yeh, H. On shoaling of solitary waves. J. Fluid Mech. 2018, 848, 1073–1097. [Google Scholar] [CrossRef]
  30. Geuzaine, C.; Remacle, J.F. Gmsh: A 3-D finite element mesh generator with built-in pre- and post-processing facilities. Int. J. Numer. Methods Eng. 2009, 79, 1309–1331. [Google Scholar] [CrossRef]
Figure 1. (Left Figure): Maximum wave heights from each of the six independent simulations. (Right Figures): The combined mean maximum wave heights and absolute maximum wave heights.Medwarning
Geosciences 10 00226 g001
Figure 2. Zoom in on the bathymetry around the coast of Ireland, with the areas of interest: Galway Bay and Dunmore East highlighted by the red squares. The location of various wave gauges are highlighted by the coloured dots.
Geosciences 10 00226 g002
Figure 3. Non-uniform unstructured mesh which is refined near the coastlines and the areas of interest: Galway Bay and Dunmore East. The minimum mesh element size is set to 100 m and the mesh contains 4,001,884 cells.
Geosciences 10 00226 g003
Figure 4. Zoom in on the maximum wave heights simulated for the four sources around the coast of Ireland. The areas of interest are highlighted in each plot.
Geosciences 10 00226 g004
Figure 5. Wave gauge plots from selected locations around the coastline in Ireland. (Top row): Wave surface elevations from the four different sources at wave buoys located off the coast of Ireland. (Middle row): Water surface elevations from the four different sources at gauges located in Galway Bay. (Bottom row): Water surface elevations from the four different sources at gauges located in the Dunmore East area.
Geosciences 10 00226 g005
Figure 6. The high resolution bathymetry and topography grid generated for Dunmore East. The grid has been scaled in the vertical direction to give a 3D perspective.
Geosciences 10 00226 g006
Figure 7. The high resolution bathymetry and topography grid generated for Galway Bay. The grid has been scaled in the vertical direction to give a 3D perspective.
Geosciences 10 00226 g007
Figure 8. Left: Size of mesh triangles in the nonuniform unstructured mesh. The triangles with the minimum size (10 m) are concentrated around Galway Bay and Dunmore East. These areas are marked (A) and (B) respectively. Right: Zoom in on the high resolution mesh with the mesh triangles shown for, top: Galway Bay and bottom: Dunmore East.
Geosciences 10 00226 g008
Figure 9. Inundation maps for Galway Bay for the various tsunami sources. The grey areas on the map are land values which were inundated during the simulation.
Geosciences 10 00226 g009
Figure 10. High resolution bathymetry and topography of Galway Bay, with key places highlighted.
Geosciences 10 00226 g010
Figure 11. Inundation maps for Dunmore East for the various tsunami sources. The grey areas on the map are land values which were inundated during the simulation.
Geosciences 10 00226 g011
Figure 12. High resolution bathymetry and topography of Dunmore East, with key places highlighted.
Geosciences 10 00226 g012
Table 1. Earthquake source parameters used in this study to model the Lisbon 1755 event.
SourceLength (km)Width (km)Dip (°)Strike (°)Slip (m)Rake (°)M w
1 (MPTF)105552421.72090
1 (GB)9655457020908.7
2 (HF)165703542.115908.4
3 (HF)270457044.222.5908.6
4 (GorB)20080405013.1908.7

