Article

The Historic Avalanche that Destroyed the Village of Àrreu in 1803, Catalan Pyrenees

1
GeoNeu Risk, Barcelona, 08024 Catalonia, Spain
2
Department of Natural Hazards, Austrian Research Centre for Forests (BFW), 6020 Innsbruck, Austria
3
Freelance Dendrochronology Consultant, Barcelona, 08458 Catalonia, Spain
*
Author to whom correspondence should be addressed.
Geosciences 2020, 10(5), 169; https://doi.org/10.3390/geosciences10050169
Submission received: 31 March 2020 / Revised: 27 April 2020 / Accepted: 5 May 2020 / Published: 7 May 2020
(This article belongs to the Special Issue Snow Avalanche Dynamics)

Abstract

:
The purpose of the present study was to reconstruct the avalanche which destroyed the village of Àrreu in 1803 to solve the unknowns about this historic event, and in a broader context, to improve the knowledge about these low-frequency avalanches in the Pyrenees. To this end, a multidisciplinary approach was carried out by searching in historical sources and databases, reviewing aerial imagery, surveying the site for terrain and vegetation inspection, using dendrogeomorphological analysis, and interviewing local people, to finally apply SAMOS-AT computational simulations and the statistical α-β model. In the Monars avalanche path, 5 major avalanche events were identified, including the one in 1803. Most of these events were dense flow avalanches, but evidence of powder-fraction effects was deduced from the vegetation survey. Frequency analyses assigned a return period of more than 100 years to the 1803 event. Historical information suggests that a succession of avalanches is necessary for an event to reach the hamlet. Simulations indicate that a single avalanche of destructive size 5 would be sufficient to cause the catastrophe, and, at the same time, it would travel 1 km further down along the Àrreu river to the main valley (Noguera Pallaresa).

1. Introduction

In 1803 a snow avalanche destroyed the village of Àrreu, knocking down houses and killing its people. Since then, no similar event has happened in that avalanche path. Very little information has been known before this research was set in motion in 2015, and some details still remain a mystery.
Àrreu belongs to the Valls d’Àneu mountain territory in the Catalan Pyrenees. The economy of this territory was based on herding and mountain agriculture in the past. Its population lives in small villages, scattered in a big area and exposed to different sorts of mountain hazards. These kinds of tragedies remain in the collective memory of the people, but time washes off all superfluous details, and the circumstances of these occurrences have been forgotten. However, these details should be clear for us to always remain aware.
The first information concerning the snow avalanche disaster came from historical documents. A prayer devoted to the Mare de Déu de la Neu (Virgin of the Snow) revealed the provenance of the avalanche [1].
  • “L’Àrreu a Vós consagrava
  • amb vot ses vides i llars
  • quan el poble enderrocava
  • el riu de neu del Mont-ars;
  • dissort pels avis sentida
  • no colpira son hereu:
  • Defenseu la nostra vida,
  • Mare de Déu de la Neu.”
An interpretation of this prayer is: The people of Àrreu ask for protection of their lives and homes to the Virgin of the Snow after the destruction caused by the river of snow coming from Mont-ars gully. The misfortune perceived/explained by their elders will not affect the succeeding people now that the Virgin protects them. And the prayer ends: Defend our lives, Virgin of the Snow.
The year of occurrence and the number of people killed was disclosed from an old document written in 1846–50 [2]:
“Este pueblo antes de 1803 se hallaba construido ¼ de hora mas hacia el N; pero habiéndose desprendido en dicho año una gran masa de nieve. la cual arruinó las 10 casas de que entonces constaba, matando a 17 personas, se edificó en el punto que actualmente ocupa por conceptuarlo a cubierto de semejantes catástrofes.”
According to this document, the avalanche occurred in 1803. Seventeen people were killed and ten houses were destroyed (which was the whole village as specified by a pre-event description in 1790 [3]). It also tells that before this catastrophe, the village was located in a nearby siting to the north.
An attempt to reconstruct the historic event was done in [4], but some unknowns persisted, and the results did not completely explain the disaster. On this occasion, with new findings, we aim to complete the scenario of this catastrophic event. First, with all the gathered information, we characterized the avalanche path and pieced together its avalanche history to eventually apply different modeling approaches to estimate the avalanche runout, and reconstruct the avalanche which destroyed the old village of Àrreu in 1803.

2. Monars Catchment Area

Àrreu is an abandoned village of the Pallars-Sobirà district in the Pyrenees, placed in a south-eastern slope (1260 m above sea level (a.s.l.)) (Figure 1). Before 1803, the position of this village was 450 m to the west of the present location, now called Bordes d’Àrreu (1325 m a.s.l.). The river flowing past both sites is the Àrreu river. Barranc de Monars is a lateral stream coming from the west side. This mountain stream has a broad watershed, and a narrow gorge between 1650–1400 m a.s.l., just before it discharges into the Àrreu river, which in turn flows into the Noguera Pallaresa river in the main valley. The highest elevation in the crest of the Monars watershed is la Plana peak (2493 m a.s.l.).
Because of its location at the southern valleys of the Pyrenean range, but close to the main axis, this area has a transition climate between the humid oceanic climate to the north, and the drier climate with continental traits to the south, which provides a relative high frequency of major avalanche episodes or cycles (MAE) [5].
In the Monars catchment, the Cartographic and Geologic Institut of Catalonia (ICGC) has mapped a single avalanche path, identified as ARR010 (Avalanche Database of Catalonia, BDAC-ICGC [6]) (Figure 1). The highest elevation of this avalanche path is 2450 m a.s.l., and old Àrreu is located at 1325 m a.s.l., making up 1125 m of vertical drop. The starting zone, mainly oriented to the east and south-east, can be divided in two (Figure 2): The main one (A, 31 ha) in the north, more regular, wider and uniform; and a smaller one (B, 5.7 ha) in the south, more irregular, but steeper. There is a rocky ridge in between. The slopes of these starting zones end at the Monars creek, with a gorge at 1650 m, which reaches the Àrreu river almost perpendicularly at 1400 m a.s.l.
In Figure 3, the slope of the avalanche path is represented, considering starting zone A along the centerline of the avalanche path. This is a homogeneous large slope with a mean inclination of 30°. At Monars stream, the slope decreases to 20°, increasing again in the gorge (37°), and decreasing after before reaching the Àrreu river. From the intersection with the Àrreu river until the Noguera Pallaresa river confluence, the slope is very constant, increasing from 9° to 12°at the end.

3. Materials and Methods

The catastrophic event of Àrreu remained in the collective memory of the people living in the Valls d’Àneu area, but details about the circumstances were unclear. The only information was that the village had been destroyed by a snow avalanche, and that the surviving inhabitants had been forced to move to a safer location.
To gather information about the Monars avalanche path and reconstruct the event that occurred in 1803, customary procedures for avalanche hazard analysis were used [7,8]. These involve complementary methods and sources of information such as identification of vegetation clues, compilation of historical and eyewitness information, dendrogeomorphological analysis, and the analysis of aerial imagery, as well as digital terrain models (DTM) and derived maps. Calculation models are particularly useful complementary tools, and include numerical or statistical models, or a combination of both [9].
Data and sample collection, as well as interviews with locals, were carried out in the autumn of 2015 and summer of 2019.

3.1. Historical Approach

3.1.1. Compilation of Historical Documentation

The local cultural council (Consell Cultural de les Valls d’Àneu) searched the three above-mentioned documents of the historic event and consulted the historical archive of the Urgell Bishopric.

3.1.2. Search in the Avalanche Data Base of Catalonia (ICGC)

This source contains the avalanche data from the Catalan Pyrenees. Regarding the Monars catchment, the description of one event that occurred in the ARR010 avalanche path that reached the Àrreu river in 1996 was retrieved.

3.1.3. Site Survey

The ruins of the old and new villages of Àrreu and its surroundings were visited and some clues of the village evolution were discovered.

3.1.4. Interviews to Local Inhabitants

Several visits to nearby villages were made to interview local people. Only the oldest (of about 70 to 90 years old) recalled some passed on information from preceding generations about the catastrophic event.

3.2. Morphological Approach

In this stage we used the DTM 5 × 5 and derived maps (e.g., slope map, hillshade map), and the topographic map 1:5000 (ICGC). Part of the work was performed on the desktop and part in the field.
The precision of the represented data was variable and depended on the source of information and the mapping accuracy (e.g., evidence of vegetation damage surveyed in the field with a GPS or on an orthoimage on the desktop; or runouts mapped from an oral description or from a written document), and, therefore, is variable in space (from one meter to some dozens of meters), and in time (from the exact date to the winter season or less accuracy).

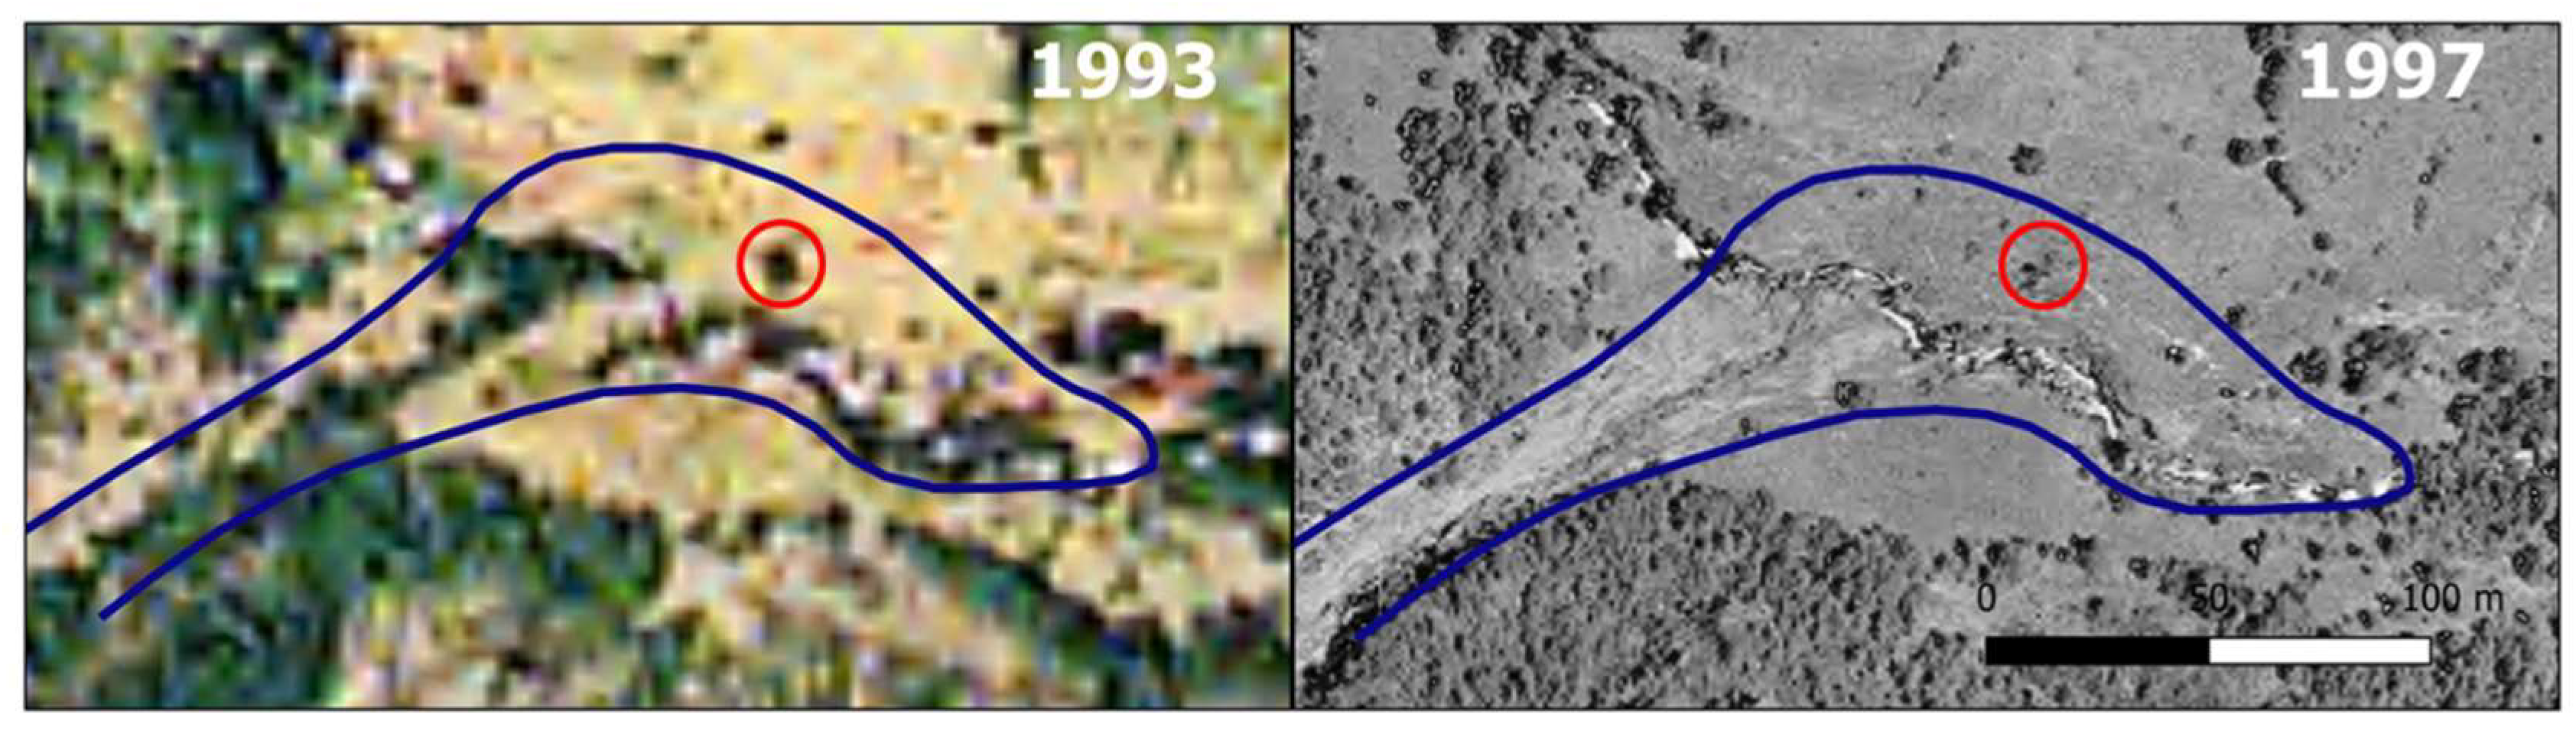
3.2.1. Checking of Aerial Imagery

The aerial photos and ortho-images taken in different years revealed changes in the landscape consistent with the descent of snow-avalanche events around Àrreu from 1946 to the present. The available aerial images of the ICGC catalogue that cover the study area correspond to the years: 1946, 1956, 1991, 1993, 1997, 2003, 2005, 2007, 2008, 2009, 2011, 2012, 2013, 2014, 2015, 2017, and 2018.

3.2.2. Terrain and Vegetation Inspection

The avalanche path was explored in search of traces of the avalanche in 1803, and of more recent avalanches. Evidence of snow avalanches on vegetation was recorded and geographically positioned, as well as the morphological characteristics of the catchment.

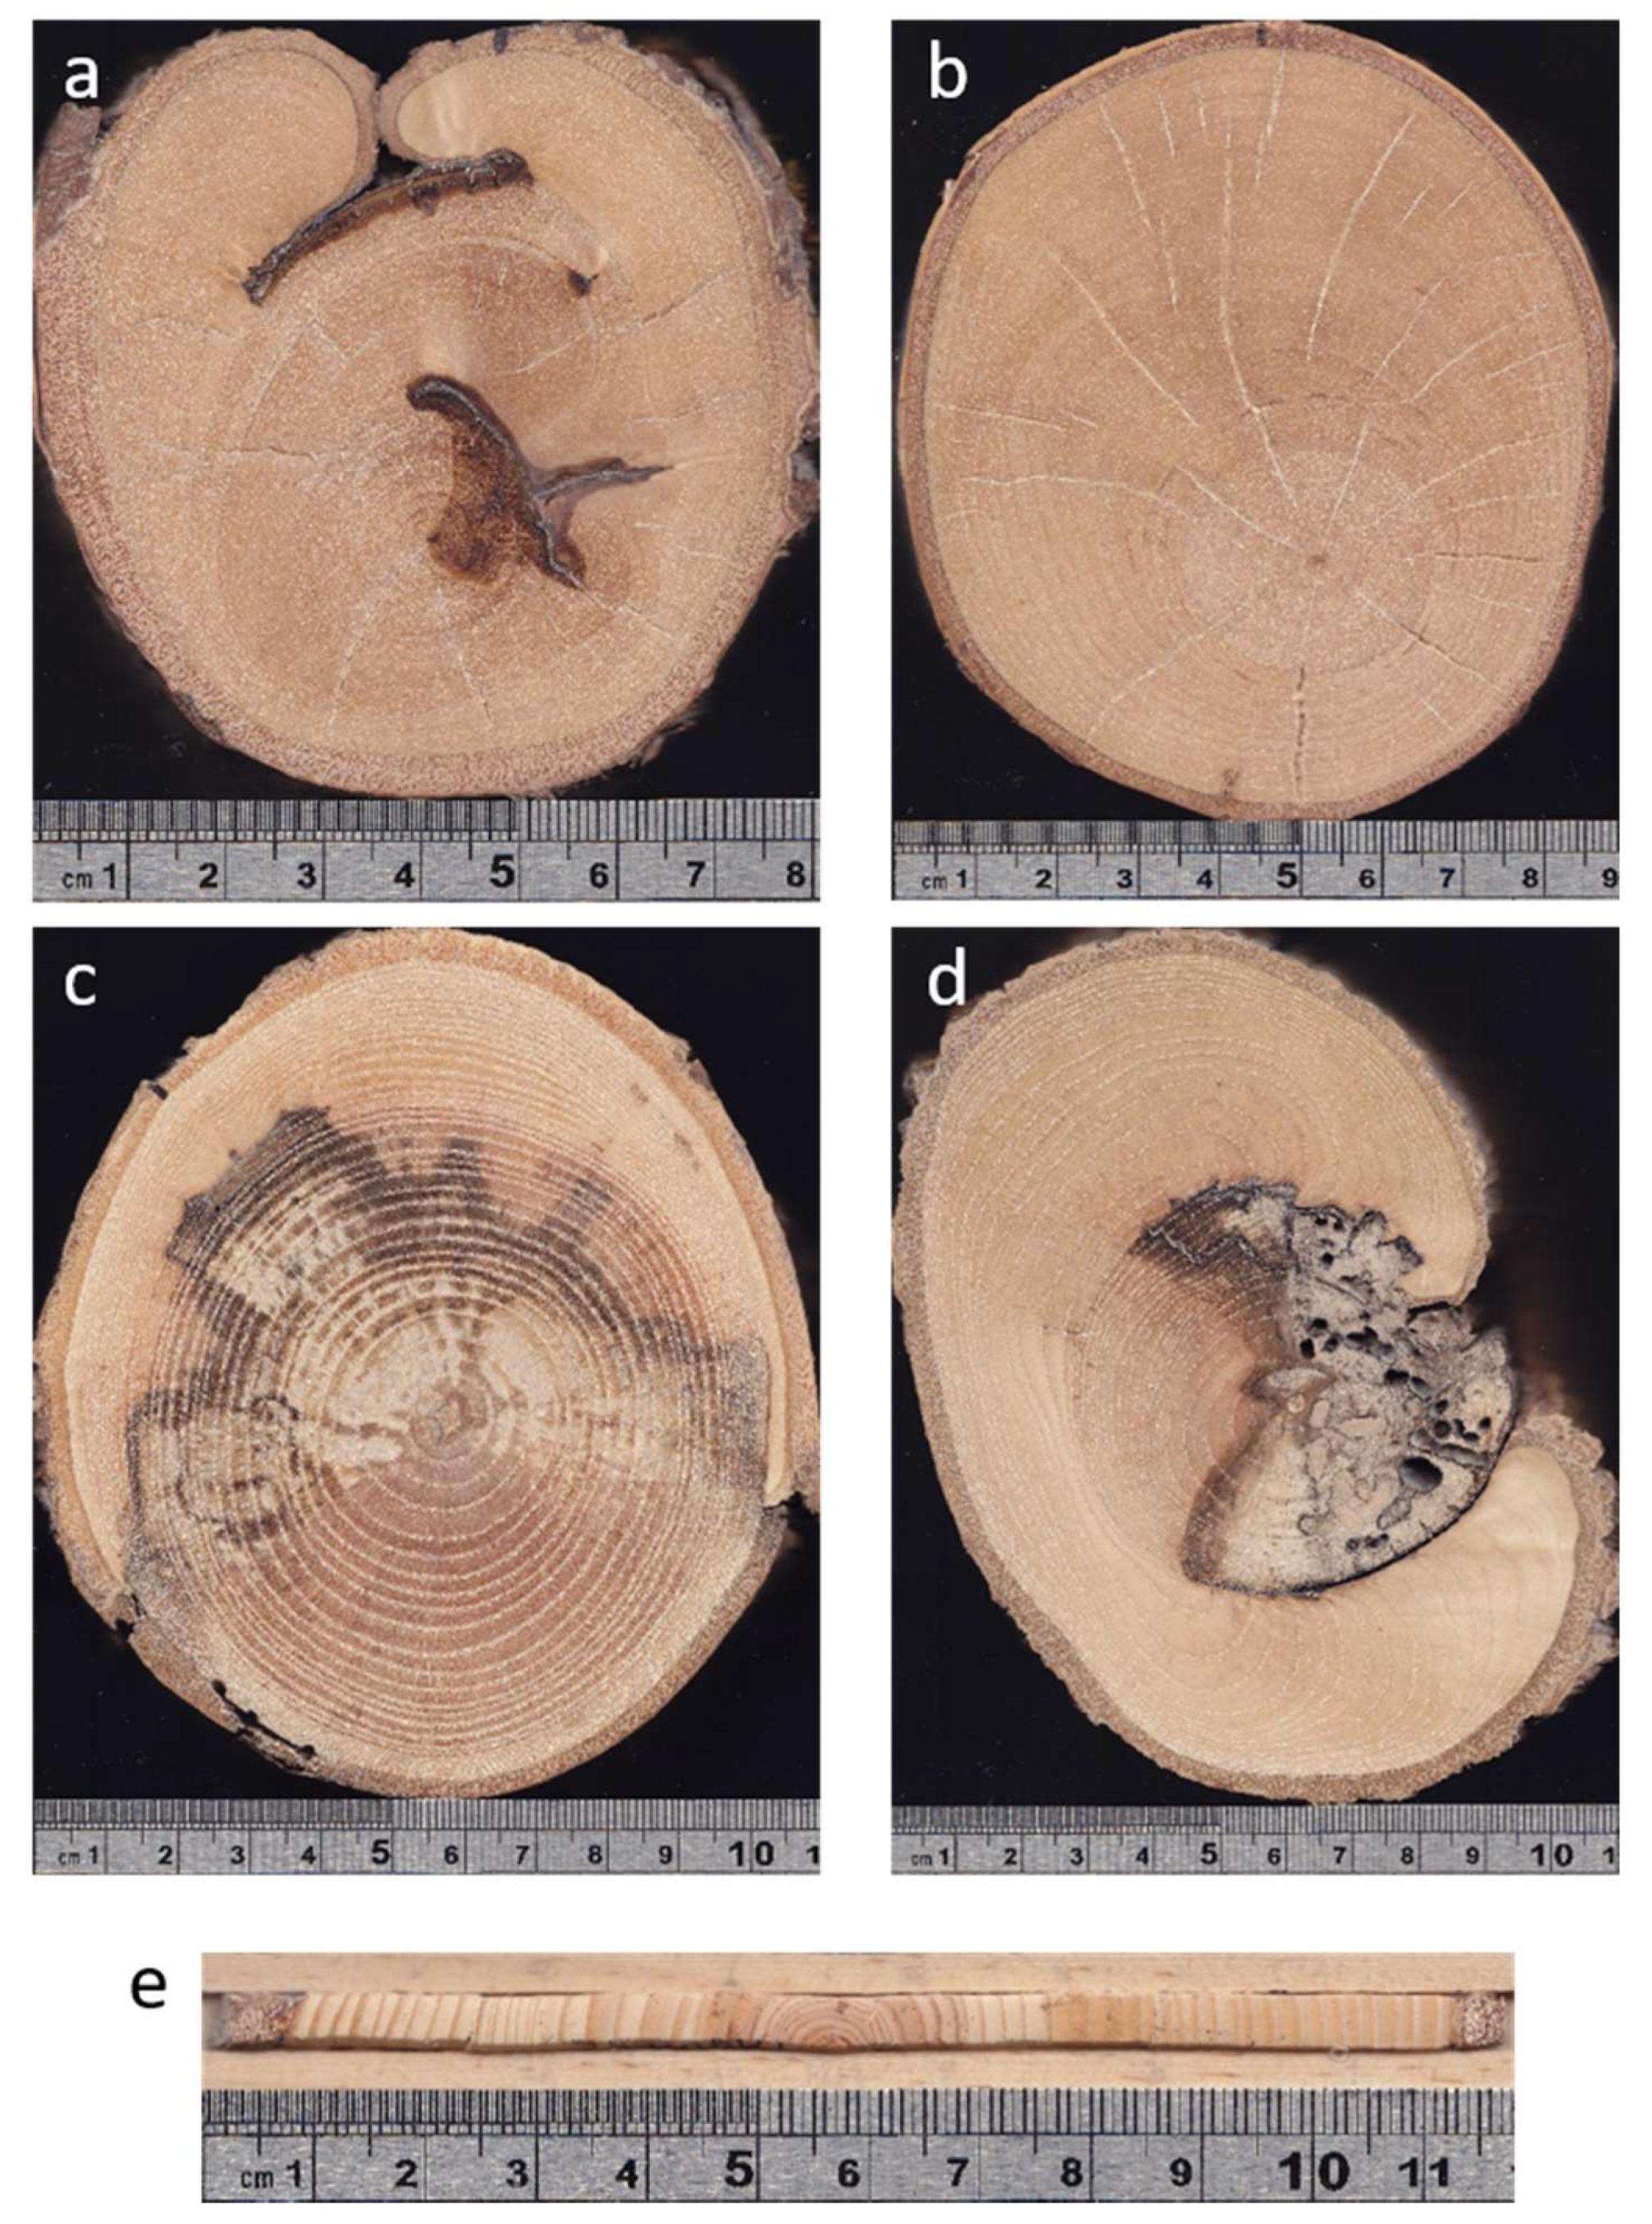
3.2.3. Dendrogeomorphological Analysis

Trees growing in avalanche paths are usually affected by avalanche events and these growth disturbances (GDs) are recorded in their tree rings. As a result, they develop typical shapes [10] on a cause-effect-reaction basis. However, there is a limited variety of tree-ring signals to GD, regardless of the origin of the disturbance. For that reason, the way to decide the cause of the GD is based on: Site inspection to discard other processes (biological, geological, etc.); the proportion of GD trees in one specific year; and the spatial distribution consistent with an avalanche event trajectory. The final decision is supported by these judgements.
In the Monars avalanche path we selected: i. Trees with tilted or leaning stems; ii. trees with curved stems; and iii. trees with scars (Figure 4), because these GDs produce some of the most reliable responses [11]. Stem inclinations range from slight tilting to horizontal leaning. Over time, tilted trees tend to develop curved stems or grow vertical branches to substitute the original stem. The impact of avalanches can also produce wounds on the surface of stems which destroy the cambium locally on the injured area and compel the subsequent rings to grow from the margins of the wound to close the injured space generating a scar.
These GDs can be dated to the year of occurrence [12]. In the case of snow avalanches, reactions to GD appear during the following spring as soon as the tree ring starts to develop, and this evinces that the disturbance occurred during winter. The correspondence between treering signals and GD has been established [13], and an example of the calibration of this methodology can be read in [14]. Tree-ring signals related to the GD found in trees sampled for this study were these (Figure 5):
  • Growth suppression—a significant decrease in the growing pace visible on the subsequent tree rings which get temporarily or permanently narrower;
  • eccentricity—tree-ring widths of rings on opposite sides of the stem in the leaning direction (upslope and downslope sides) undergo an opposed reaction. In angiosperms (birch, ash, and aspen in the present case), rings on the upslope side of the stem become wider, and on the downslope, narrower. In gimnosperms (pine trees in this case), it is the opposite: Rings become wider on the downslope side, and narrower on the upslope side;
  • reaction wood—this kind of wood is produced after the inclination of the stem to help the tree regain the vertical position; which is tension wood in angiosperms and compression wood in gimnosperms;
  • scars—the destruction of cambium causes tree rings to be locally absent on this part of the stem. The next tree rings develop from the cambium on the margins of the injury to gradually overgrow and cover the damaged tissue.
Samples from the selected trees (cores or sections from the stem) were obtained and dated using the ordinary dendrochronological method [15], and were subsequently analysed following dendrogeomorphological procedures [12].

3.3. Avalanche Modeling

To reconstruct the 1803 event, we applied different modeling approaches. The spatio-temporal evolution of the avalanche flow was computed with a process-based, dynamic modeling approach. The resulting runout was then compared to a data-based, topographic–statistical modeling approach.
For the dynamic modeling we used the simulation software SAMOS-AT. Several simulations were performed in order to reproduce the scenarios defined in previous phases. Dense flow avalanche (DFA) and powder snow avalanche (PSA) simulations were performed. The resulting runouts were cross-checked with the statistical α-β model [16] by applying the equations obtained in the Pyrennees by [17].

3.3.1. Dynamic Modeling

Dynamic modeling approaches generally require a numerical solution and provide information on velocity, flow height, impact pressure, and, subsequently, the resulting runout distances. Different input parameters, such as slab thickness and extent in the starting zone, and the friction at the base of the moving snow, must be estimated. These models are very sensitive to input parameters and therefore runout estimates should be used cautiously [9]. In this study we used the SAMOS-AT friction model (version 2017_07_05), developed by the Austrian Service for Torrent and Avalanche Control (WLV). It has been used since 2007 in WLV as the successor to Samos99, and in Iceland, South Tirol, and Russia [8]. This is an improved version of the SAMOS simulation software for dry-snow avalanches, used since 1999 [18,19]. It describes both types of avalanche layers: the dense flow avalanche (DFA) and the powder snow avalanche (PSA) layers, as well as the interaction between them. The employed friction model includes a Coulomb friction and a velocity dependent friction term, and can therefore be conceptually compared to the classical Voellmy model [20,21].
For the simulations, the standard friction parameters (standard 03_2017, [19]) for hazard mapping were used [20,22]. In direct comparison to the well-known Voellmy model, friction relation corresponds to a Coulomb friction coefficient μ = 0.155 and a flow depth velocity-dependent friction coefficient ξ = 1700 ms−2 at a flow depth of 5 m. We chose only to vary the initial conditions (in terms of release depth) while friction parameters remained constant. Entrainment was not explicitly considered, as it is also usually done in the hazard mapping approach. This is attributed to the fact that the guideline parameters implicitly include the effects of entrainment on the total avalanche reach, being optimized to back calculate extreme events [21].

3.3.2. Statistical Modeling

Statistical models determine the runout distance from the topographic profile of the avalanche path. We applied the α-β regression model. Despite its simplicity, the model is relatively successful for the prediction of extreme runout distances [23]. In the α-β regression model, α represents the angle of the line that joins the highest elevation of the starting zone of an avalanche path with the maximum reach of the avalanche (the α point) and β is the angle of the line that joins the highest elevation of the avalanche path with the point where the slope of the topographic profile reaches 10° (the β point). The model was developed by Lied and Bakkehøi (1980) [16]. Furdada and Vilaplana (1989) [17] obtained different equations from the regression analysis of 216 avalanches in Western Catalan Pyrenees with an estimated return period of more than 30 years. We applied the general equation: α = 0.97, β = 1.2°; R2 = 0.87; SD = 1.74°, N = 216 (R2, Pearson determination coefficient; SD, standard deviation; N, number of avalanches used for the analysis).

4. Results

4.1. The Old Village of Àrreu

Today the old village of Àrreu is a group of ruined walls. The remains of some 9 houses can still be counted (Figure 6a). A close examination of the ruins shows that, in the beginning, these were houses (the look of the facades, an arch in a doorway, etc.) (Figure 6b). After 1803, these buildings were repaired and used as barns and shelters to keep the livestock, and thereafter renamed as Bordes d’Àrreu, while the people built a new village 450 m to the east (Figure 7). To the south of Bordes d’Àrreu, after crossing the Àrreu river, the Mare de Déu de les Neus Chapel (12th Century) stands with the Monars catchment panorama at the back. The above-mentioned prayer was written to be sung in this chapel, to beg for protection to the Virgin against snow avalanches. On the other side, new Àrreu, which was abandoned in the 1970s, was built next to the St. Serni Church (9–10th Century). A carved stone in a wall near this church says 1803, the year of the avalanche occurrence.
Recently, an avalanche took place in the winter of 1995–96 on this avalanche path. This was found out when reviewing the 1997 summer orthoimages to map the 1995–96 avalanches (which was a major avalanche season in the Pyrenees [5]) for the Aludex project [14]. Damage to forests allowed us to map the runout of one avalanche that reached the Àrreu river (Figure 8). This avalanche, a dense flow, followed the Àrreu river 160 m down from the confluence with the Monars stream. According to the affected-forest area, the avalanche would most likely have come from the central part of starting zone A, and from starting zone B.
Our enquiries to local people in 2015 were fruitless, but in the summer of 2019 we had the opportunity to meet some elderly people connected to Àrreu, and this added crucial information to understand the 1803 event. We talked with three eye-witnesses of avalanches fallen in the Monars avalanche path, people from the neighboring village of Borén, and a woman born in the proper village of Àrreu (new Àrreu) in 1932, owner of the meadows from “casa Nadal” which are located in Prats des Bordes (Figure 1) at the runup of the avalanche. From the conversations with these witnesses, we could gather information on avalanches in the 1930s, 1950s, and in 1972 (Figure 1). In all these cases, avalanches crossed the Àrreu river and ran up the meadows which, as a consequence, were covered with transported wood and sediment, and there was a lot of work for the owner family to remove it. The people of the village believed that the dangerous situation occurred when a first avalanche fell and filled in the Àrreu river with snow, and then a next one had suitable conditions to reach old Àrreu. Although none of them had observed this scenario, it was clear that this knowledge had been passed on by preceding generations. In relation to the flow regime, none of the interviewees had witnessed the actual descent of the avalanche, so there was no information about its characteristics. They had only seen the snow deposit and debris transported by the avalanche some days after its occurrence (in fact, as students, they had skipped their classes to go and see the avalanche deposit). Another interesting piece of information was that two of the interviewed people explained that avalanches used to be triggered from the southern slopes of the Pic de la Plana northern ridge (central part of starting zone A; Figure 1 and Figure 2).

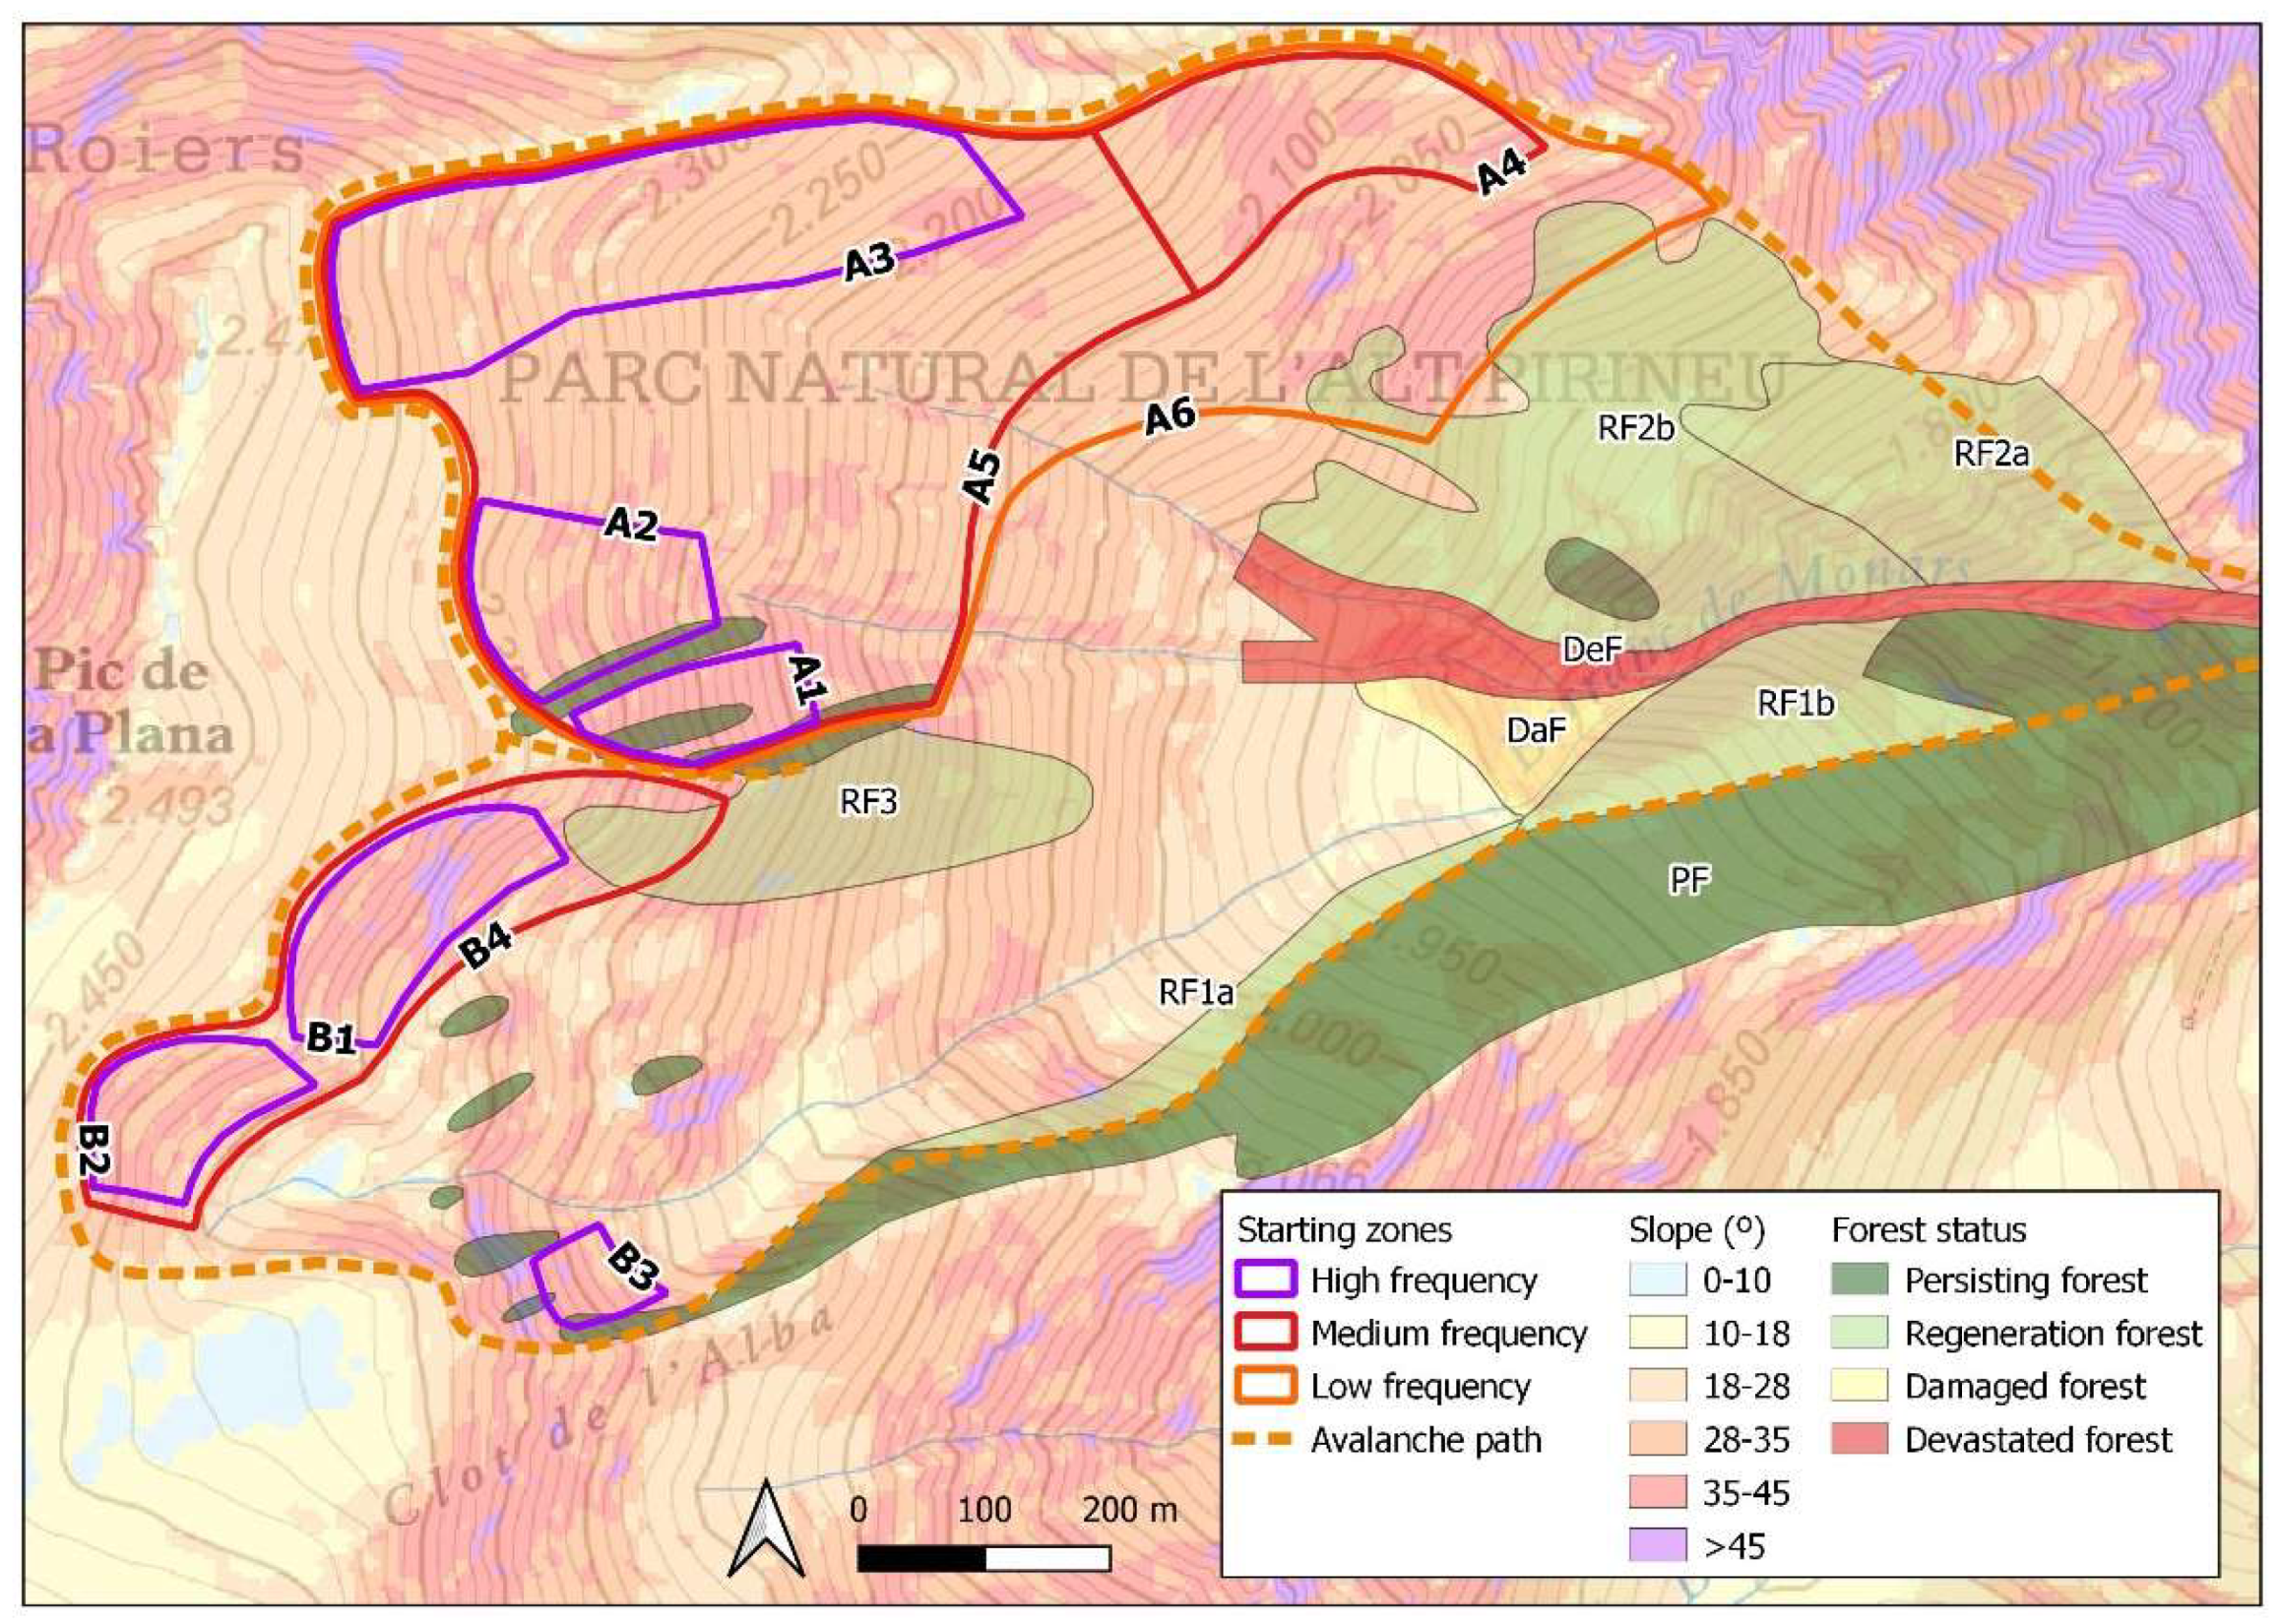
4.2. Monars Avalanche Path Characteristics

The first information coming from the avalanche path vegetation inspection was that no trees would be old enough to have registered the event in 1803. The Monars catchment is nowadays quite forested (Figure 9), but trees are relatively young, most of them less than 60 years old. Birch (Betula pendula Roth) is abundant on the avalanche slopes, mountain pines (Pinus uncinata Ramond ex DC. in Lam. et DC.) grow in some patches, the oldest ones on the catchment margins, and ashes (Fraxinus excelsior L.) are scattered close to pastures and meadows at the lower parts. Other woody species are present (oaks, willows, rowans, etc.), but these were not used for dendrochronological purposes. From the disturbed vegetation along the avalanche path, evidence of frequent avalanche activity could be assessed going from the upper Monars stream, following the thalweg line, and reaching just above the gorge at 1600 m a.s.l. The width of these frequent avalanches is between 10 and 20 m along the stream, as could be checked from a recent event in 2013–14 (dendrochronologically dated). Below the gorge, avalanche evidence on vegetation was not so abundant, and it looked older. Further down, after the intersection of the Monars creek and Àrreu river, evidence could still be detected on a few trees along the river banks (Figure 4c).
Dendrogeomorphological analyses were carried out with samples from 37 trees (11 pines, 12 birches, 13 ashes, 1 aspen (Populus tremula L.)). Samples were gathered from trees showing GD most likely produced by avalanche events a few meters apart from the Monars thalweg (from 1850 to 1400 m a.s.l.), along the sides of the Àrreu river (1400 to 1350 m a.s.l.), and on the meadows above Bordes d’Àrreu (1400 m a.s.l.).
Results from the dendrogeomorphological analysis are shown in Figure 10 (from the total 37 trees, 5 undisturbed trees were used as a reference to accurately date the trees with GD; 3 could not be dated, so the analysis was done with 29 individuals). According to the number of trees with GD and to the spatial distribution of these trees, we considered that avalanches had occurred in winters in 1971–72, 1977–78, 1995–96, 2002–03 and 2013–14 in the Monars path. Winters 1971–72 and 1995–96 registered the highest percentages of trees with GDs, while winters in 1977–78, 2002–03 and 2013–14 had lower values, but enough to be contemplated (19%, 14%, 14%, respectively) as explained in [24]. Evidence from the two most recent events in 2002–03 and 2013–14 was clearly connected to the avalanche process, but 1977–78 is still being evaluated.
Butler and Sawyer [25] studied the possibility of establishing an index number to assess the occurrence of high-magnitude snow avalanches. They discussed that in the cases in which sample size is high, a value of 20% of the trees with GD can be sufficient to confirm the occurrence of an avalanche, but in the cases with a low number of sampled trees, they advocate for a higher index, such as 40%. In Àrreu the sample size was small, but 1971–72 and 1995–96 were close to the 40% threshold and therefore were regarded as major avalanches. Note that the immediate years after 1972 and 1996 also register a significant number of trees with GD. Some of these could be a delayed signal of the tree response to the disturbance [26].
An estimation of the avalanche frequency at various altitudinal sections along the avalanche track was performed in [4]. This was done by counting the number of GDs most likely caused by avalanche impacts on trees growing at different elevations. In Figure 11, some examples of the different ranges of avalanches along this path are depicted. The highest frequency, with a periodicity of one event every 5 to 6 years, was estimated between 1800 and 1650 m a.s.l., meaning that most avalanches stop just above the Monars gorge. Two examples of these snow avalanches occurred in 2002–03 and in 2013–14. The runout of the 1996 event, identified by comparing photos (Figure 8) and by dendrogeomorphology, and the runouts of 1930s and 1950s avalanches, identified by eye-witnesses, were estimated to have a return period of 25 to 30 years; and for the 1972 avalanche event, dated by dendrogeomorphology and confirmed by eye-witnesses, was estimated in 100 years. Therefore, the runout of the 1803 avalanche was estimated to have a return period higher than 100 years (Table 1). After the 1803 avalanche, there is no information about any other similar event, until the events recorded in the 20th century of smaller size (during the 1930s and 1950s, and in 1972 and 1996). We can assume that there has not been such a large event since 1803.
The bearing of trees tilted by avalanche impact is a fine indicator of snow-flow direction. Leaning directions of 43 trees with GD most likely caused by avalanches were measured in the lower section of the Monars stream, the confluence with the Àrreu river, and the meadows above the old village (Figure 12). Tilted trees observed relatively far from the main track of the avalanche path reveal an expansion of the flow close to Monars gorge (between 1500–1400 m a.s.l.), characteristic of the powder component of the avalanche.
Along the Àrreu river, the course of the inclined trees could be followed down until 1350 m a.s.l. (trees 6 and 7), but not further down. Here, both avalanches in 1971–72 and 1995–96 could be dated. On the meadows (Prats des Bordes), after a thorough inspection, only two trees evinced the 1971–72 avalanche event (trees 26 and 27) (dated trees are numbered in Figure 11). Also from this 1971–72 event, tree 37 at the hydrological left of the Monars torrent attests to the amplitude of the flow (65 m from the Monars torrent thalweg), just when it reached the Àrreu river and invaded the above-village meadows. Although this could have been wider because there are tilted trees 150 m apart from the stream in this place. In accordance with the known trajectory of 1995–96, channeled along the river, only disturbed trees growing close to the Àrreu river were dated to that season.
In relation to the definition of the starting zones, no pictures of the release areas after avalanche events were found. We defined more and less active release areas inferred from the damage observed on vegetation in the avalanche path, dendrogeomorphology data, witness observations, and terrain characteristics (Figure 13).
Vegetation inspection was performed by comparing aerial imagery (1946 to present) and field work. Figure 13 shows the synthesis of this work. Forest cover changes were mapped and classified as follows: persisting forest (PF), areas where forest cover has not changed during this period; regeneration forest (RF), areas where forest has regrown after some disturbance; damaged forest (DaF), areas where a great proportion of trees exhibit avalanche-caused shapes (tilted stems, scars, broken branches, etc.), but are not destroyed; and devastated forest (DeF), areas where trees have been swept away or are leaning horizontally (alive). The main differences in trim lines are found in images taken after events 1971–72 (1991 image), 1995–96 (1997 image), and 2013–14 (2014 image). Comparing the 1991 image to 1945 and 1956 images, in RF1a (Figure 13) the forest is regrowing and in RF1b the forest has been cleared. In RF2a the forest has disappeared and in RF2b there is no forest. These effects are probably due to the 1971–72 event, the largest known during the 20th century. Trimlines in RF1 may have been caused by avalanches falling from the B1 release area. Forest destruction in RF2a would have been produced by an avalanche coming from A4–A5 or A6 release areas. In the 1997 image, the effect of the 1995–96 avalanche can be observed in the DeF area. Attending to all this evidence, the avalanche would have been released from A1, A2, and A3 release areas, and there are no clear signs from A4 nor B release areas. In the 2014 image, the damage caused by the 2013–14 avalanche is clearly identifiable along the DeF area. Evidence indicates that the avalanche came from starting zones A1–A2 and A3. Since the event that caused the destruction of the forest in RF1 and RF2 (probably in 1971–72), forest extent has increased to the size shown in Figure 13. In RF3 there are some scattered trees in 1946 and 1956 images, and trees increase progressively until 2018, although there is no densification.
Dendrogeomorphological analysis revealed GD caused by 1995–96, 2002–03, and 2013–14 avalanches in the DaF area, and by 1971–72, 1995–96, 2002–03, and 2013–14 avalanches in the DeF area. In RF1, evidence of the 1971–72 avalanche was identified (Figure 11).
From this examination, the release areas shown in Figure 13 were defined, and their main characteristics are shown in Table 2. In A, starting zone A1 is the steepest release area and probably the most active, but avalanches released from this area would be a small size. This area is relatively frequent, attending to the forest damage observed in DeF and to its steepness. Area A2 is steep, and larger than A1, and probably could be released at the same time as A1. It is most likely less frequent, but there is evidence of activity for T30 avalanches. A less steep area of A starting zone is A3, and it should therefore be less active than the others, but at the same time, it shows the best configuration for wind loading. Witnesses declare that avalanches that reach the Àrreu river come from this area, and evidence of 1995–96 and 2013–14 avalanches in DeF confirm its activity. Therefore, we considered A3 active for T30 avalanches. It could be released together with A1 and A2. The least active release area would be A4, despite it being steep, because of its lower elevation, and its vegetation condition does not indicate avalanche activity since 1997. It was probably active during the 1971–72 avalanche (as shown by the disappearance of RF2a area in the 1991 image). It could release together with the other A starting zones. From B, sector B1 is steep and the largest starting zone, and it has areas below that could be released once the avalanche started. It could have been the release area of the avalanche that caused the damage in RF1a and RF1b observed in 1991 image, most likely in the 1971–72 avalanche event. Therefore, B1 could be considered for large avalanches (T100 or >T100). Starting zone B2 is also steep, but it has a stepped relief below, with low-slope stretches and other release areas. Therefore, B2 is probably active, but avalanches can only reach DaF area when they are large and fast. It could also be released at the same time as B1 (B4). Area B3 is a small and steep slope, probably active frequently. There is no evidence of its activity. It could be released by B2.

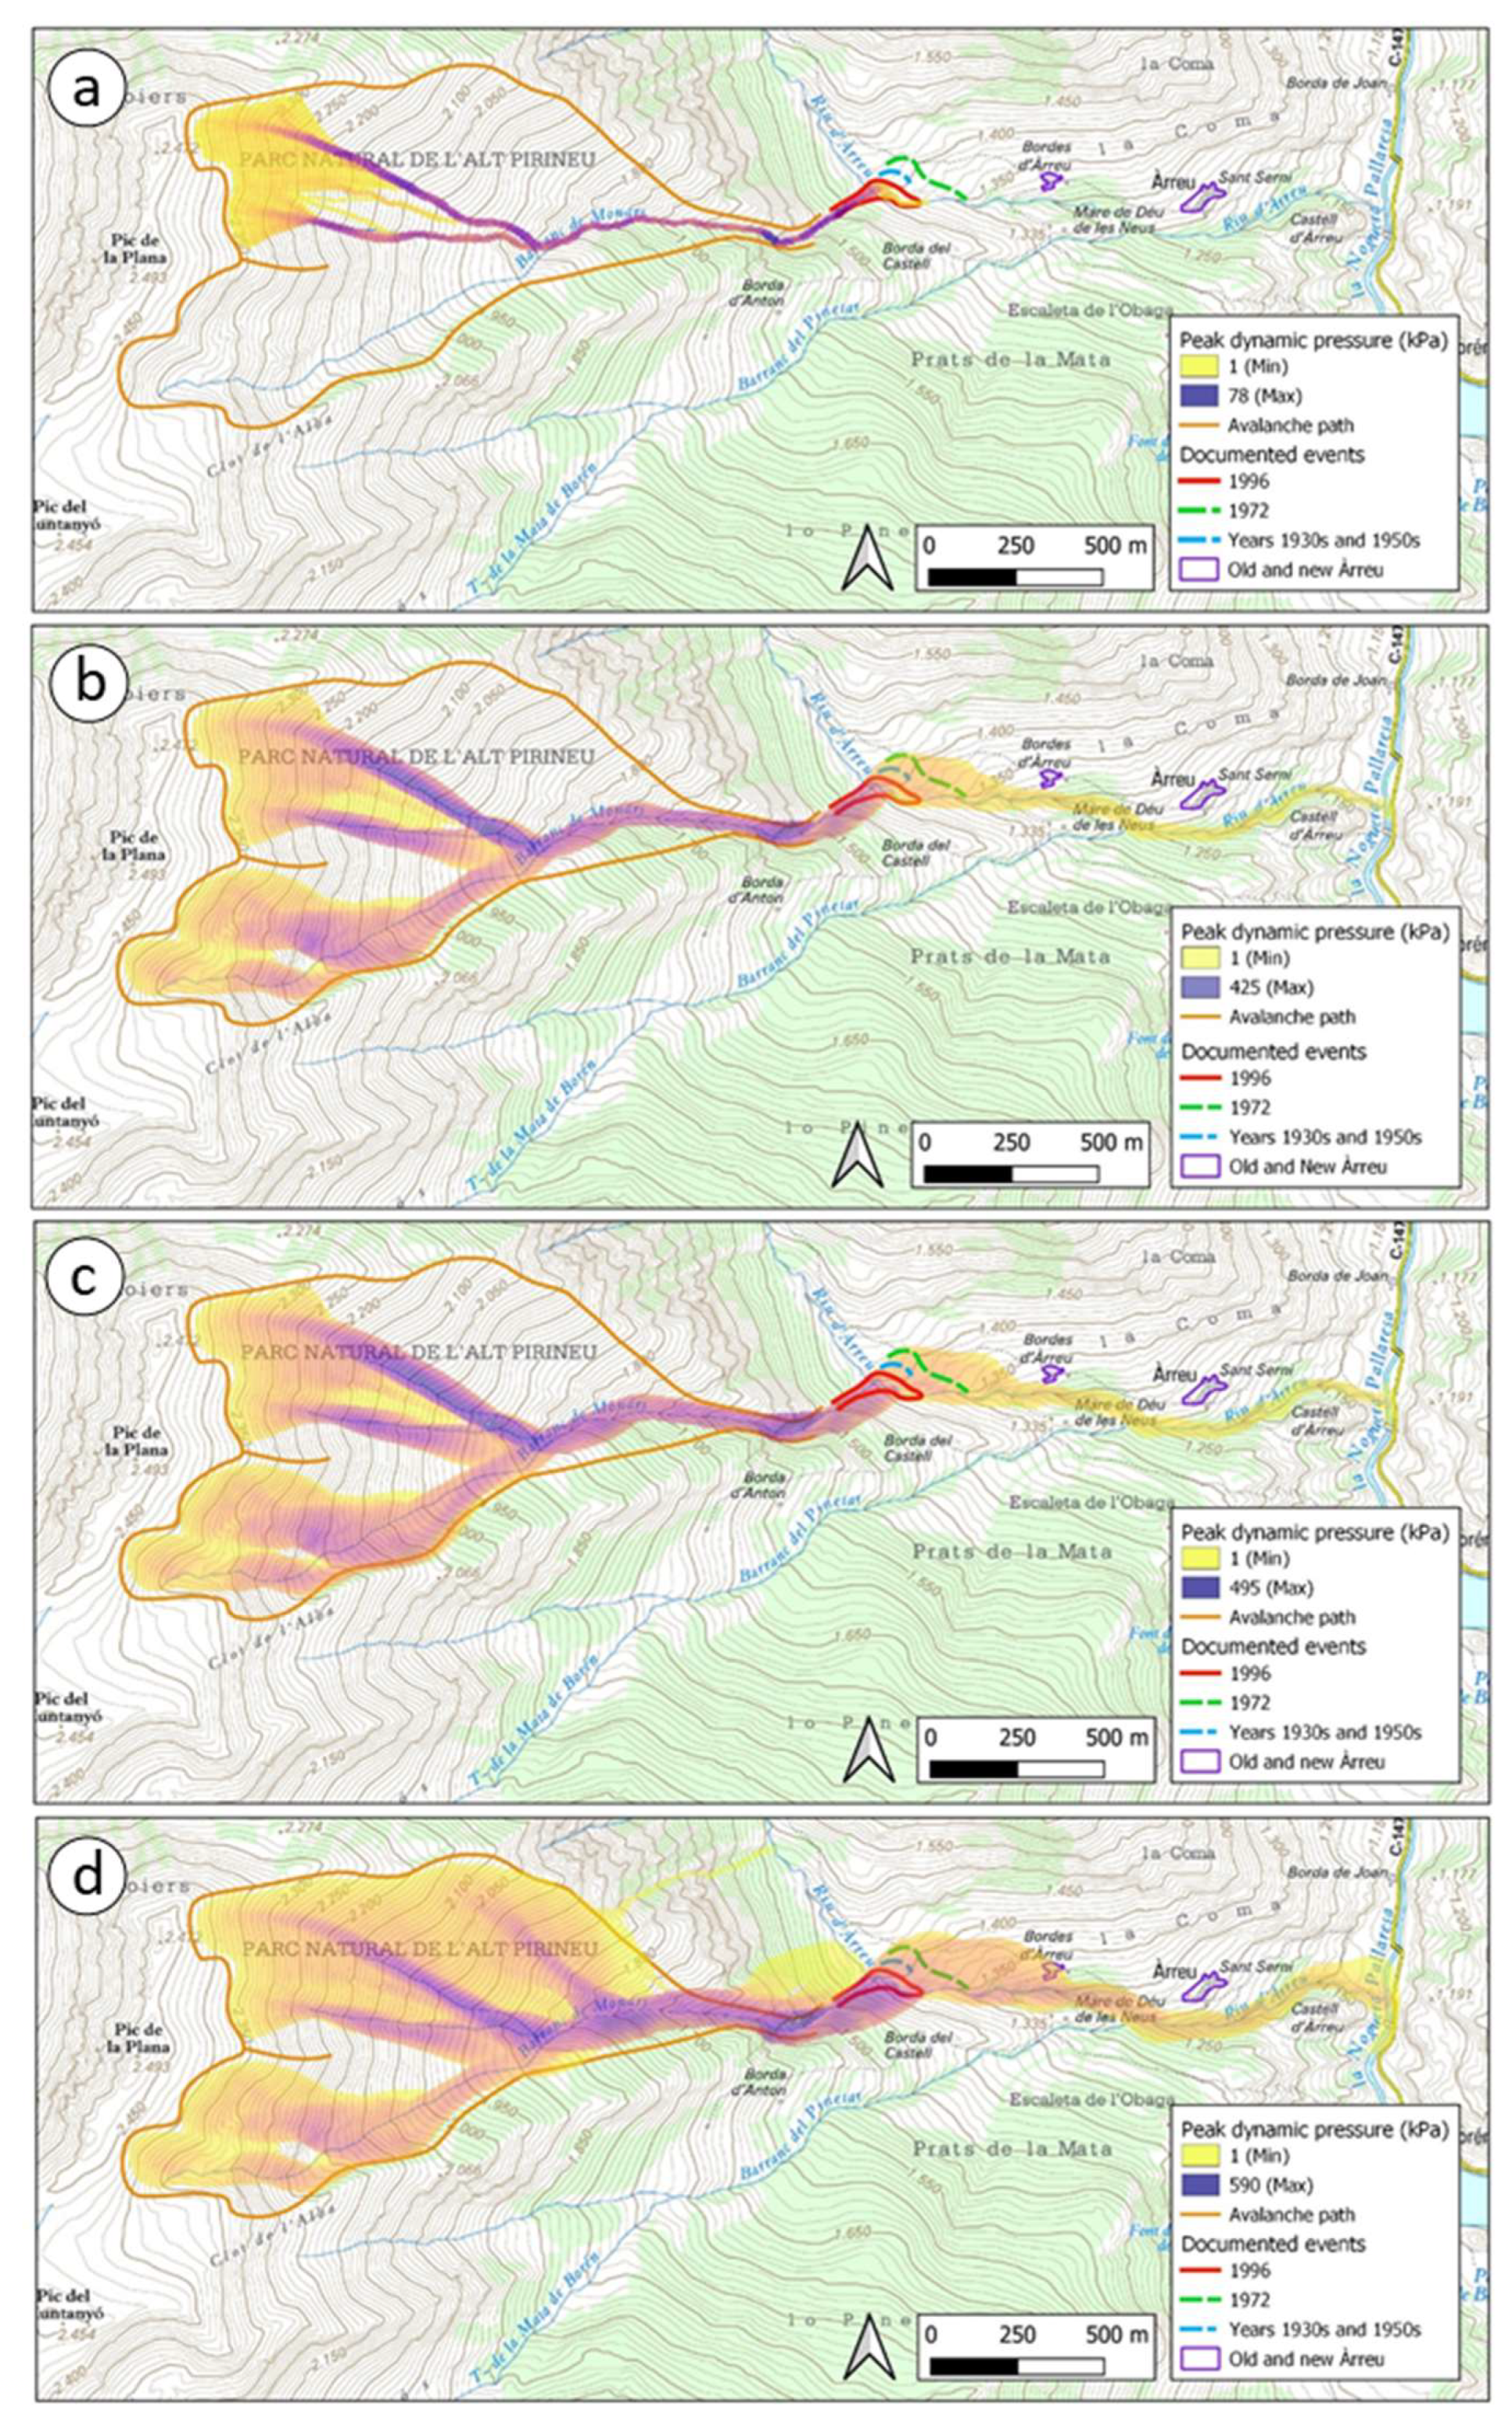
4.3. 1803 Avalanche Modeling

4.3.1. Simulation with SAMOS-AT

Our first scenario to reconstruct the 1803 catastrophic event by simulation with SAMOS-AT was based on the hypothesis that two successive avalanches would be required to reach old Àrreu, as was believed by the interviewed local people.
As the initial conditions, we considered different release area sizes and varying release depth. For high-frequency avalanches (around T30), the high-frequency release areas in Figure 13 (A1, A2, A3, B1, B2) were considered. For medium-frequency avalanches, medium-frequency release areas were considered (A4, A5, B4). For lower-frequency avalanches the whole extent of starting zone A (A6) and B4 were considered.
We implemented the release depth calculation approach developed by [27], which has been applied for hazard mapping in Switzerland and is therefore well established [28]. The estimation of release depth was based on the maximum snow depth increase within 3 days (ΔHS(3)), measured at automatic or manual weather stations. Release snow depth data for simulations was deduced from the close-by nivometeorological station, Bonaigua, belonging to the Meteorological Service of Catalonia (SMC) network (XEMA). A snow depth increase in 3 days was considered for the reference return periods (T30: 113; T100: 132; T300: 149 cm), as well as the elevation and wind accumulation corrections [27].
It is relevant to note that the release snow volume is a combination of release extent and release snow depth parameters, which are related to the return period of the meteorological conditions. Simulations have been performed from a combination of both initial conditions and the return period of the release snow depth, which do not necessarily correspond to the same return period of the avalanche events.
To reproduce the two-successive-avalanches scenario, a first avalanche, similar to the event of 1996, was simulated by subsequently reducing the high-frequency release areas (A1, A2, and A3, Table 2) and release depths keeping all other simulation parameters constant (Figure 14a, release volume 7.1 × 10³ m3). The simulation filled in the bed of the Àrreu river around 150 m long, smoothing the river thalweg, as in the 1996 event.
The second event was simulated with a variety of scenarios by combining release depths and different extends of release areas, investigating the sensitivity of the simulation results. We started simulating a medium-frequency scenario, considering the extent of the mid-frequency areas of the starting zones, and iterating with release snow depth from T30 to T300. The results showed that the avalanche did not reach old Àrreu after the runup with the minimum snow depth (T30, 192 × 103 m3) (Figure 14b), nor with the maximum (T300, 260 × 103 m3) (Figure 14c). This effect could be due to the velocity-dependent part of the friction, limiting the spatial extent of the avalanche at particularly high velocities. However, the avalanche flowed channeled along the Àrreu river to the Noguera Pallaresa river in the main valley. This phenomenon has never been described, and if it occurred in 1803 event, it has probably not occurred since then; otherwise, it would most likely have been retained by the people in the valley.
Therefore, the combination of two avalanches of a lower return period (the 1996 plus an event corresponding to a T30 or T100, larger than the ones observed during the 20th century) was not enough to reach old Àrreu.
To delve deeper into this scenario, the effect of the powder component of the avalanche was simulated with the PSA module of SAMOS-AT (Figure 15). With a release volume of 192 × 103 m3 (mid-frequency release areas with release snow depth corresponding to T30), the results show how old Àrreu may have been attained (Figure 15a), but with rather low impact pressures (<7 kPa) strong enough to break windows, but hardly enough to break walls or roofs [29]. Again in this simulation, the avalanche ended in the main valley. It is also interesting to observe that the spread of the flow below 1750 m a.s.l. was in accordance with the flow direction observed on the surveyed trees (Figure 12), and explains why there are tilted trees so far from the thalweg of the creek, probably due to the effect of the powder component of the snow avalanche.
The second avalanche reached old Àrreu when the volume was increased up to 603 × 103 m3 (Figure 14d, Table 3). This required considering the whole extent of both starting zones, A and B (release areas A6 and B4), and a snow depth corresponding to a return period of 30 years. With this size, the avalanche would reach old Àrreu after climbing the opposite slope of the Àrreu river, turning to the east, and flowing towards the small village. At this spot, the dynamic pressure would be around 150 kPa, enough to cause the damage documented in the literature. The avalanche would not only reach the village, but would continue along the Àrreu river to the Noguera Pallaresa river at 1115 m a.s.l., after flowing about 1 km to the east. In accordance with these simulation results, a substantial flow depth would have generated a considerable deposit at the Noguera Pallaresa river, and, perchance, blocked it. Still, no observational information has backed this phenomenon.
It is worth pointing out that the effect of the previous avalanche on the total reach is negligible, particularly considering the large volume of the second avalanche. Therefore, the filling of the Àrreu river and changing of its topography by a prior avalanche does not have a big influence on allowing subsequent avalanches to cover more distance. The simulations indicate that a very large avalanche, with or without a previous smaller one, could reach old Àrreu likewise. Further, results show that a previous avalanche filling the Àrreu river allows a second avalanche to go 30 m farther in the most favorable situations, which consequently can affect a larger area, but is not decisive in whether or not the avalanche reaches old Àrreu (Figure 16). Therefore, a larger volume would be more effective to provide a longer runout. This highlights how sensitive the simulation results are with respect to the initial conditions, particularly for the location of old Àrreu.
A PSA simulation was also performed with the same size conditions as the DFA simulation that reaches old Àrreu (603 × 103 m3) (Figure 15b). In this case, the peak pressure values at the western side of old Àrreu would be 17 kPa. In this scenario, the avalanche could cause the damage reported in the hamlet due, most probably, to the fluidized layer of the PSA, which has a higher capacity to climb slopes and could attain such pressure values [30]. The powder cloud (suspension layer) of the avalanche would affect a wide area next to the Àrreu river, and even the emplacement of new Àrreu, reaching the Noguera Pallaresa river, but with low pressure values (<3 kPa).
In Table 3, DFA and PSA results from low-frequency scenarios with T300 release snow depth are shown. As already displayed for the case of the mid-frequency release area, there was a difference between the T30 and T300 simulations, but compared to the differences induced by the release area size it appeared negligible. The same was true for the influence of the previous avalanche, particularly on the PSA.

4.3.2. Statistical Approach

In the Monars avalanche path we applied the general equation obtained by [17] for the Catalan Pyrenees. Results are shown in Figure 17. To find the α point position by applying the regression equation, it was necessary to locate the β point and the release point before, thus obtaining the β angle. It was more important, in this case, to evaluate the sensitivity towards the β point than the release, as was done for the dynamical modeling. The runout zone of the Monars avalanche path, from the confluence of the Monars stream–Àrreu river to the Noguera Pallaresa river has a mean slope angle around 10°, increasing at the end. Therefore, finding the place to position the β point had to be done carefully.
To evaluate the variability of the model results, we investigated the location of the β point by testing two possible positions: β-point 1 and 2 (Figure 17). β-point 1 was located where the slope first decreases below 10°, 255 m downstream of the Monars creek–Àrreu river confluence, and the corresponding α angle would be located between old and new Àrreu. The point α-1SD is located between new Àrreu and the Noguera Pallaresa river; while α-2SD is located downstream of the Noguera Pallaresa river. Below β-point 1, the slope decreases under 10° for 84 m, before increasing again. This distance corresponds to a 3.5% of the projected length of the avalanche path. In avalanche paths where the slope oscillates around 10°, benches shorter than 3% of the projected length should be ignored during the selection of the β point because, according to [31], they are considered negligible compared to the length of the path. In the case of the Monars avalanche path, the bench length is very close to 3%. If β-point 1 was moved to the next β point (β-point 2 in Figure 17), the bench would be much longer than 3%, and it would be located downstream, between old Àrreu and new Àrreu, at 1310 m a.s.l. In this case, α-1SD would just reach the Noguera Pallaresa river, being the probability of reaching this point higher than with β-point 1.
According to [32], the mean α angle corresponds to a probability P = 0.5 (non-exceedance probability of 50%), assuming that residuals are normally distributed. By subtracting 1 standard deviation, the probability is 0.84, meaning that 84% of the avalanches do not exceed α-1SD. The point α-2SD corresponds to a non-exceedance probability of P = 0.98. Differences in one or two standard deviations in documented cases are described in [30] when applying the α-β equation obtained for Norway, and this is explained by the longer runout of the fluidized component of the avalanche. Therefore, the α-β method indicates that with a low probability, the avalanche could reach the bottom of the main valley.

5. Discussion

The oral history says that with two successive events, the first one filling in the Àrreu river, the avalanche coming from the Monars creek could have reached old Àrreu. This avalanche scenario was reproduced with SAMOS-AT simulations, but only when we considered very large avalanche release volumes did the avalanche reach the old village, and, in this case, the same could have happened potentially without the concurrence of a previous smaller avalanche. Therefore, the most plausible scenario according to the simulations would have been that of a very large avalanche (with or without a previous smaller one), in which the entire starting zone would have been activated, with a snow volume above 0.6 × 10⁶ m3. This is a huge avalanche. With this size, the avalanche would have reached old Àrreu with a dynamic pressure of 150 kPa, enough to cause the destruction of the whole village. Both starting zones, A and B together, have an extent of around 37 ha and such a volume would correspond to an avalanche of destructive size 5 [33]. Avalanches of this order of magnitude are very rare in the Pyrenees. We believe that this avalanche could be similar to the one that occurred in Arinsal, Andorra, in February 1996. In the Arinsal catastrophic event, post-avalanche measurements estimated a volume larger than 0.8 × 10⁶ m3 [34] to 1.5 × 10⁶ [35]. In that case, the size of the starting zone was around 50 ha.
Such a large avalanche would be accompanied by a considerably large powder component, like in the Arinsal event. If it was a pure PSA, the powder component would expand along the track and runout zones (Figure 15b). Evidence on trees surveyed beside the track near the Monars gorge indicate this behavior for the smaller avalanches in recent times. Our previous hypothesis was that the powder component of a smaller avalanche would have caused the catastrophe, but simulations indicate that such an event would not have enough energy to cause the reported damage (Figure 15a). A release volume equivalent to the one of the DFA (0.6 × 10⁶ m3) is required for a PSA to reach old Àrreu and cause the reported damage.
As specified by [29], a dynamic pressure higher than 10 kPa causes considerable damage on masonry walls, which was the destruction related by [2] in the village of Àrreu. The pressures given by the DFA simulation at old Àrreu, 150 kPa (Figure 14d), would completely destroy the village. The pressures obtained by the PSA simulation for the equivalent size (17 kPa, Figure 15b) would seriously damage the houses and destroy some of them, but not the whole village. The doorway arch at the eastern side could attest to this (Figure 6b). The houses were rebuilt after the catastrophe, very likely because they were not absolutely destroyed. Therefore, a PSA would be the most plausible type of flow that could have affected the village, or a DFA that would have struck only part of it, like the low-frequency size avalanche without the occurrence of a previous avalanche shown in Figure 16.
Another hypothesis that could support the scenario of a smaller event was the possibility that old Àrreu was located some meters towards the west before the disaster, and that the part destroyed by the avalanche would have been abandoned, having disappeared in present times. This hypothesis was ruled out because, at present, the remnants of 9 buildings still exist in Bordes d’Àrreu (in 1790, 10 houses were described in [3], all of which had been destroyed by the avalanche according to the report written in 1846–50 [2]), and these preserve architectonic characteristics of houses. In order to optimize resources, it is likely that the remains of the houses would have been reused to build barns and shelters for livestock in the same place. For this reason, we believe that Bordes d’Àrreu is placed at the same siting as old Àrreu in 1803.
Simulations show how the occurrence of successive avalanches has less influence on the results than the definition of the release area. Therefore, the most important choice for the simulations is the definition of the release areas. The release snow volume is a combination of release extent and release snow depth parameters, which are related to the return period of the meteorological conditions. Simulations have been performed from a combination of both initial conditions and the return period of the release snow depth, which do not necessarily correspond to the same return period of the avalanche events. The reference return period of the avalanches in the avalanche path is the one derived from the avalanche event history of the avalanche path, showing that for return periods smaller than 100 years corresponding runout altitudes can be assigned, while lower frequency events are difficult to allocate in the Monars avalanche path (Table 1).
One shortcoming in our approach was that friction parameters were assumed to be constant, applying those used for hazard mapping scenarios, only introducing variations with respect to different avalanche types and release depth/area combinations. Although the combination of T30 and T300 release depth, both lead to avalanches of approximate size D5, we concluded that future tools for proper scenario definitions of different return periods in relation to potential avalanche size would be beneficial. Overall, for the Àrreu case study, we observed that the definition of release areas appeared to be the most important part (in regards to how sensitive the results were). From the least to most sensitive, we observed: (1) The sequence of avalanches, meaning there was a first deposition that smoothed the topography for the subsequent event/s; (2) the release depth and type of avalanche flow; and (3) how the release area controlled the release volume. However, particularly the large variations in potential release area size were a characteristic of the specific case study.
It is worth mentioning that from the distribution of historic runouts in the runout zone, we were able to infer return periods in this avalanche path. We deduced that, apart from 1803 avalanche, the largest event known took place in 1972. We assigned an estimated return period of 30–100 years to this event. Consequently, we assigned a return period higher than 100 years to 1803 avalanche. What we would like to emphasize is that, according to simulations, this exceptional avalanche, being a DFA or a PSA, would get as far as the Noguera Pallaresa river, more than 1 km farther than the one of 1972. This is certainly a rare case, and there are no witnesses, historical documents, or evidence to verify this. We observed this behavior when we tried to simulate the avalanche to reach old Àrreu, but it happens for smaller avalanches too (Figure 14b,c). Trials with other simulation tools such as RAMMS [36] led to similar results [4]. The outcome from the α-β model also confirmed this. Even though the probability is very low, according to the results of the dynamical and statistical modeling approach, we consider this is plausible. The simulations further reinforced the hypothesis of the powder snow avalanche component being responsible for the large runout of the 1803 avalanche, which is usually associated with the fluidized flow of the avalanche [30]. However, particularly considering the observed damages, it is worth looking beyond the dense flow–powder dichotomy [37]. This is an interesting case for avalanche hazard mapping that substantiates the use of numerical simulations for such purposes.
These results also serve to show the limitations of the Avalanche-Paths-Maps mapping procedure [6] (based on the French CLPA [38]), which is supported by terrain analysis and witness information. From which, the determination of the runout zone boundaries of the avalanche path depends on available information and expert criteria. Quite often the runout of an avalanche path is determined from information of avalanche activity of the last 30–100 years, and this criterion is not homogeneous for all avalanche paths and could be overcome by the use of avalanche release models (e.g., [28]). This is also experienced in the US and Canada [39]. For the Monars avalanche path (ARR010), registered in the Avalanche Database of Catalonia (BDAC-ICGC), the mapped runout zone reaches and stops in Bordes d’Àrreu (old Àrreu), but simulations showed that a low-frequency avalanche could travel a long stretch further down (in fact, it doubled the distance). Therefore, the reliability of these maps for low-frequency avalanches has to be taken carefully.
Finally, some historical facts suggest some speculation on the uniqueness of the 1803 event. According to [40], the old village of Àrreu is older than 1000 years, while the nearby chapel devoted to the Virgin of the Snow (Ermita de la Mare de Déu de les Neus) (Figure 1) is dated to the 12th century [41]. This chapel was built on a naturally sheltered situation. Actually, when observing the avalanche simulations (Figure 15), it is placed in the most protected spot regarding snow avalanche trajectories, and the flow does not invade this patch of land in any case. This suggests that this chapel may have been erected for divine protection after a very old avalanche. In this case, we think that the event would not have completely destroyed the old village, otherwise they would almost certainly have moved the village to a safer emplacement before. This would mean that the 1803 avalanche could have a return period of more than 300 years. In hazard mapping, the areas affected by avalanches with a return period higher than 100 or 300 years are a matter of controversy and are discussed at length [42], for although they are considered as avalanche exceptionnelle in France [43] or residual hazard events in Switzerland [44], when they eventually take place, the level of damage and destruction is massive.

6. Conclusions

An intensive survey to reconstruct the avalanche history of the Monars avalanche path was performed. Results indicate that during the 20th century, at least 4 avalanche events reached Àrreu river, but none reached old Àrreu (Bordes d’Àrreu), located around 500 m further down from the confluence of the Monars stream and the Àrreu river. Therefore, the 1803 avalanche that destroyed the small village is the largest avalanche occurrring in the last two centuries, and probably the largest in several centuries.
The dynamical and statistical 1803-avalanche modeling revealed that there is no need for a first avalanche to smooth the terrain to facilitate a second avalanche to reach the hamlet, as has been passed on by oral history, since an exceptionally large release snow volume is required to do so, and this would reach old Àrreu with or without a previous smaller avalanche. An avalanche of such dimensions would have been similar to the one that occurred in Arinsal, Andorra, in February 1996. The results showed an exceptionally large avalanche that descended to the main valley (Noguera Pallaresa). The statistical model confirmed this. This finding suggested that, apart from destroying the old village of Àrreu and killing its people, the 1803 avalanche could have obstructed the way through the main valley, in particular if it was a dense flow avalanche (DFA). We found no reference to this in the literature, and nobody talks about this circumstance, but perhaps time has pushed this to oblivion in front of the misfortune that fell upon the people of Àrreu. A dense flow avalanche (DFA) would absolutely destroy the village, and a powder snow avalanche (PSA) would cause serious damage, though not totally destroy the village. We consider this second scenario more plausible, according to the reported damage. A PSA would have expanded much more widely than a DFA, but the deposit in the main valley would have been significantly smaller.
This work highlights the importance of using different disciplines to attain an exhaustive knowledge of the avalanche history of an avalanche path, as a methodology to find out and reconstruct these extraordinary-return-period avalanches, which otherwise can remain unnoticed. Sometimes this methodology, currently established in avalanche hazard analysis, is oversimplified in the practice.

7. Epilogue

During the period of this research (2015–20), old Àrreu (Bordes d’Àrreu on the map) has visibly deteriorated and the last walls will soon fall down, but in the meantime, a road has been built that reaches new Àrreu from the main valley road, and some houses are being restored. The whole place receives the visits of more and more tourists and hikers every day, so it could be said that Àrreu is having a 21st century revival.

Author Contributions

Conceptualization, P.O. and E.M.; methodology, all authors; software, J.-T.F.; validation, formal analysis, and investigation, all authors; data curation, P.O. and E.M.; writing—original draft preparation, and writing—review and editing, all authors. All authors have read and agreed to the published version of the manuscript.

Funding

This research received no external funding.

Acknowledgments

The authors are particularly grateful to Ferran Rella of Consell Cultural de les Valls d’Àneu for his assistance in the field and in documentary and oral information retrieval and interpretation. The authors are also grateful to Jordi Cirés for his help in dendrochronological fieldwork. This research was carried out with permission of Parc Natural de l’Alt Pirineu. Special thanks are due to Dieter Issler for suggesting the publication of our research and for his sincere help. Thanks also to the two anonymous reviewers whose suggestions significantly improved the manuscript. The authors would like to express special thanks for the kind help and collaboration of the families from casa Carrera and casa Foro from Esterri d’Àneu, casa Carrera from Borén, and casa Nadal from Àrreu.

Conflicts of Interest

The authors declare no conflicts of interest.

References

  1. Goigs de la Mare de Déu de la Neu d’Àrreu. Urgell Diocese 19th Century? Available online: https://algunsgoigs.blogspot.com/2014/03/goigs-la-mare-de-deu-de-la-neu-arreu.html (accessed on 7 May 2020).
  2. Madoz, P. Diccionario Geográfico, Estadístico E histórico de España y sus Posesiones de Ultramar 1845–1850. Available online: http://www.bibliotecavirtualdeandalucia.es/catalogo/es/consulta/registro.cmd?id=6353 (accessed on 7 May 2020).
  3. De Zamora, F. Respostes de la Vall d’Àneu als Qüestionaris de Francisco de Zamora (1709); Padilla, J.I., Ed.; Garsineu Edicions: Tremp, Spain, 1997. [Google Scholar]
  4. Muntán, E.; Oller, P. Historic snow avalanches in the Pyrenees: The destruction of the small village of Àrreu (Pallars Sobirà). Z. Wildbach Lawinen Eros. Steinschlagschutz 2019, 183, 152–161. [Google Scholar]
  5. Oller, P.; Muntán, E.; García-Sellés, C.; Furdada, G.; Baeza, C.; Angulo, C. Characterizing major avalanche episodes in space and time in the twentieth and early twenty-first centuries in the Catalan Pyrenees. Cold Reg. Sci. Technol. 2015, 110, 129–148. [Google Scholar] [CrossRef] [Green Version]
  6. Oller, P.; Marturià, J.; González, J.C.; Escriu, J.; Martínez, P. El servidor de datos de aludes de Cataluña, una herramienta de ayuda a la planificación territorial. In Proceedings of the VI Simposio Nacional sobre Taludes y Laderas Inestables, Valencia, Spain, 21–24 June 2005; pp. 905–916. [Google Scholar]
  7. McClung, D.M.; Schaerer, P. The Avalanche Handbook, 3rd ed.; The Mountaineers Books: Seattle, WA, USA, 2006; 342p. [Google Scholar]
  8. Sauermoser, S.; Granig, M.; Kleemayr, K.; Margreth, S. Avalanche dynamics models and impact. In The Technical Avalanche Protection Handbook; Rudolf-Miklau, K., Sauermosser, S., Mears, A.I., Eds.; Wilhelm Ernst & Sohn: Berlin, Germany, 2015; pp. 55–90. [Google Scholar]
  9. Canadian Avalanche Association. Land Managers Guide to Snow Avalanche Hazards in Canada; Jamieson, J.B., Stethem, C.J., Schaerer, P.A., McClung, D.M., Eds.; CAA: Revelstoke, BC, Canada, 2002. [Google Scholar]
  10. Schweingruber, F.H. Tree Rings and Environment. Dendroecology; Swiss Federal Institute for Forest, Snow and Landscape Research, Paul Haupt Verlag: Berne, Switzerland, 1996; pp. 183–196. [Google Scholar]
  11. Germain, D.; Hétu, B.; Filion, L. Tree-ring based reconstruction of past snow-avalanche events and risk assessment in northern Gaspé Peninsula (Québec, Canada). In Tree Rings and Natural Hazards A State of the Art Advances in Global Change Research, 1st ed.; Stoffel, M., Bollschweiler, M., Butler, D.R., Luckman, B.H., Eds.; Springer: Dordrecht, The Netherlands, 2010; Volume 41, pp. 51–73. [Google Scholar]
  12. Stoffel, M.; Bollschweiler, M. Tree-ring analysis in natural hazards research—An overview. Nat. Hazards Earth Syst. Sci. 2008, 8, 187–202. [Google Scholar] [CrossRef] [Green Version]
  13. Shroder, J.F. Dendrogeomorphological analysis of mass movement on Table Cliffs Plateau, Utah. Quat. Res. 1978, 9, 168–185. [Google Scholar] [CrossRef]
  14. Muntán, E.; Andreu, L.; Oller, P.; Gutiérrez, E.; Martínez, P. Dendrochronological study of the Canal del Roc Roig avalanche path: First results of the Aludex project in the Pyrenees. Ann. Glaciol. 2004, 38, 173–179. [Google Scholar] [CrossRef] [Green Version]
  15. Stokes, M.A.; Smiley, T.L. An Introduction to Tree-Ring Dating; University of Chicago Press: Chicago, IL, USA, 1968; 73p. [Google Scholar]
  16. Lied, K.; Bakkehøi, S. Empirical calculations of snow-avalanche run-out distance based on topographic parameters. J. Glaciol. 1980, 26, 165–178. [Google Scholar] [CrossRef] [Green Version]
  17. Furdada, G.; Vilaplana, J.M. Statistical prediction of maximum avalanche run-out distances from topographic data in the western Catalan Pyrenees (northeast Spain). Ann. Glaciol. 1998, 26, 285–288. [Google Scholar] [CrossRef] [Green Version]
  18. Zwinger, T.; Kluwick, A.; Sampl, P. Simulation of Dry-Snow Avalanche Flow over Natural Terrain. In Dynamic Response of Granular and Porous Materials under Large and Catastrophic Deformations; Lecture Notes in Applied and Computational Mechanics; Hutter, K., Kirchner, N., Eds.; Springer: Heidelberg, Germany, 2003; Volume 11, pp. 161–194. [Google Scholar]
  19. Sampl, P.; Zwinger, T. Avalanche simulation with SAMOS. Ann. Glaciol. 2004, 38, 393–398. [Google Scholar] [CrossRef] [Green Version]
  20. Fischer, J.-T. A novel approach to evaluate and compare computational snow avalanche simulation. Nat. Hazards Earth Syst. Sci. 2013, 13, 1655–1667. [Google Scholar] [CrossRef] [Green Version]
  21. Fischer, J.T.; Fromm, R.; Gauer, P.; Sovilla, B. Evaluation of probabilistic snow avalanche simulation ensembles with Doppler radar observations. Cold Reg. Sci. Technol. 2014, 97, 151–158. [Google Scholar] [CrossRef]
  22. Fischer, J.T.; Kofler, A.; Fellin, W.; Granig, M.; Kleemayr, K. Multivariate parameter optimization for computational snow avalanche simulation. J. Glaciol. 2015, 61, 875–888. [Google Scholar] [CrossRef] [Green Version]
  23. Gauer, P.; Kronholm, K.; Lied, K.; Kristensen, K.; Bakkehoi, S. Can we learn more form the data underlying the statistical—Model with respect to the dynamical behaviour of avalanches? Cold Reg. Sci. Technol. 2010, 62, 42–54. [Google Scholar] [CrossRef]
  24. Muntán, E.; García, C.; Oller, P.; Martí, G.; García, A.; Gutiérrez, E. Reconstructing snow avalanches in the Southeastern Pyrenees. Nat. Hazards Earth Syst. Sci. 2009, 9, 1599–1612. [Google Scholar] [CrossRef] [Green Version]
  25. Butler, D.R.; Sawyer, C.F. Dendrogeomorphology and high-magnitude snow avalanches: A review and case study. Nat. Hazards Earth Syst. Sci. 2008, 8, 303–309. [Google Scholar] [CrossRef] [Green Version]
  26. Johnson, E.A. The relative importance of snow avalanche disturbance and thinning on canopy plant populations. Ecology 1987, 68, 43–53. [Google Scholar] [CrossRef]
  27. Salm, B.; Burkard, A.; Gubler, H. Berechnung von Fliesslawinen, eine Anleitung für Praktiker mit Beispielen; Eigdenössichen Institut für Schnee- und Lawinenforschung SLF: Davos, Switzerland, 1990. [Google Scholar]
  28. Bühler, Y.; von Rickenbach, D.; Stoffel, A.; Margreth, S.; Stoffel, L.; Christen, M. Automated snow avalanche release area delineation—Validation of existing algorithms and proposition of a new object-based approach for large-scale hazard indication mapping. Nat. Hazards Earth Syst. Sci. 2018, 18, 3235–3251. [Google Scholar] [CrossRef] [Green Version]
  29. Rapin, F. A new scale for avalanche intensity. In Proceedings of the International Snow Science Workshop, Pencticton, BC, Canada, 29 September–4 October 2002; pp. 90–96. [Google Scholar]
  30. Issler, D.; Gauer, P.; Schaer, M.; Keller, S. Inferences on Mixed Snow Avalanches from Field Observations. Geosciences 2020, 10, 2. [Google Scholar] [CrossRef] [Green Version]
  31. Sinickas, A.; Jamieson, B. Comparing methods for estimating β points for use in statistical snow avalanche runout models. Cold Reg. Sci. Technol. 2014, 104–105, 23–32. [Google Scholar] [CrossRef] [Green Version]
  32. Jamieson, B.; Jones, A.; Sinickas, A. Statistical runout estimation. In Planning Methods for Assessing and Mitigating Snow Avalanche Risk; Jamieson, B., Ed.; Canadian Avalanche Association: Revelstoke, BC, Canada, 2018; pp. 79–96. [Google Scholar]
  33. Canadian Avalanche Association. Observation Guidelines and Recording Standards for Weather Snowpack and Avalanches; Canadian Avalanche Association: Revelstoke, BC, Canada, 2016. [Google Scholar]
  34. Meffre, J.F. 8 fébrier 1996, au fond d’une petite vallée d’Andorre engoncée sous un mètre de neige. In Les Risques Naturels en Montagne; Naaim-Bouvet, F., Richard, D.C., Eds.; Éditions Quae: Versalles Cedex, France, 2015; pp. 124–125. [Google Scholar]
  35. Furdada, G.; Margalef, A.; Trapero, L.; Pons, M.; Areny, F.; Baró, M.; Reyes, A.; Guinau, M. The Avalanche of Les Fonts d’Arinsal (Andorra): An example of a Pure Powder, Dry Snow Avalanche. Geosciences 2020, 10, 126. [Google Scholar] [CrossRef] [Green Version]
  36. Christen, M.; Kowalski, J.; Bartelt, P. RAMMS: Numerical simulation of dense snow avalanches in three-dimensional terrain. Cold Reg. Sci. Technol. 2010, 63, 1–14. [Google Scholar] [CrossRef] [Green Version]
  37. Faug, T.; Turnbull, B.; Gauer, P. Looking beyond the powder/dense flow avalanche dichotomy. J. Geophys. Res. Earth Surf. 2018, 123, 1183–1186. [Google Scholar] [CrossRef]
  38. Bonnefoy, M.; Barral, L.; Cabos, S.; Escande, S.; Gaucher, R.; Pasquier, X.; Richard, D. The localization map of avalanche phenomena (CLPA): Stakes and prospects. In Proceedings of the ISSW 2010, Lake Tahoe, CA, USA, 17–22 October 2010; pp. 699–705. [Google Scholar]
  39. Jamieson, B.; Campbell, C. Avalanche Mapping. In Planning Methods for Assessing and Mitigating Snow Avalanche Risk; Jamieson, B., Ed.; Canadian Avalanche Association: Revelstoke, BC, Canada, 2018; pp. 189–212. [Google Scholar]
  40. Bolós, J.; Hurtado, V. Atles dels Comtats de Pallars i Ribagorça (v. 806–v.998); Rafael Dalmau Editor: Barcelona, Spain, 2012; 165p. [Google Scholar]
  41. Rella, F. Les Valls d’Àneu; Edicions El Mèdol: Tarragona, Spain, 1993; 391p. [Google Scholar]
  42. Ancey, C.; Rapin, F.; Martin, E.; Coleou, C.; Naaim, M.; Brugnot, G. L’avalanche de Péclerey du 9 février 1999. La Houille Blanche 2000, 5, 45–53. [Google Scholar] [CrossRef] [Green Version]
  43. MEDDE. Plan de Prevention des Risques Naturels. Avalanches; Ministère de l’Écologie, du Développement durable et de l’Énergie: Paris, France, 2015; 101p. [Google Scholar]
  44. OFDT-OFEG-OFEFP. Aménagement du Territoire et Dangers Naturels; Office Fédéral du Développement Territorial, Office Fédéral des Eaux et de la géologie, Office Fédéral de L’environnement, des Forêts et du Paysage: Berne, Switzerland, 2005; 48p. [Google Scholar]
Figure 1. Location of the study site: The hamlets of Bordes d’Àrreu (old Àrreu) and Àrreu (new Àrreu); Barranc de Monars (Monars stream), Àrreu and Noguera Pallaresa rivers, and la Plana and Muntanyó peaks. The Monars avalanche path is drawn in orange (ARR010, modified from BDAC-ICGC), and main starting zones (A and B) and major avalanche events are identified.
Geosciences 10 00169 g001
Figure 2. Starting zone of Monars avalanche path. A: Main starting zone. Its central part is the most active, being loaded with drifted snow with dominant winds coming from north and north-west (blue arrows); B: Secondary starting zone, steeper and also active, but smaller. Photo: Sara Orgué (taken after Gloria storm on 27 January 2020).
Geosciences 10 00169 g002
Figure 3. Topographical profile of the main centerline of the avalanche path, represented in Figure 1.
Geosciences 10 00169 g003
Figure 4. Tree shapes selected for dendrogeomorphological analysis: (a) Birches affected by a recent event in 2013–14 with leaning straight stems (upper section of photograph), and by an older event in 1995–1996 with curved stems (lower section of photograph); (b) pine tree with curved stem (tree 21); (c) ash tree with horizontal stems and post-event grown vertical stems (tree 17); (d) birch with scarred, leaning stem (tree 13). See tree numbering in Figure 11.
Geosciences 10 00169 g004
Figure 5. Stem cross-sections and core of: (a) Tilted birch showing scars of two injuries in winters 1971–72 (close to the center) and 1995–96 (more external) (tree 8); (b) leaning birch showing eccentrical growth after winter 1995–96. First tree rings in the center are round (upright period of the stem) and become elliptical after this winter. At the same time, tension wood is produced on the upper side of the stem (slightly darker color of the wood on this species) (tree 9); (c) horizontal ash tree, knocked down in winter 1995–96. During the first 20 years the tree was growing upright (concentric rings from 1978 to 1995). In the next 20 years, from 1996 to 2015, tree rings develop eccentrically and growth rate is slowed down (growth suppression) (tree 17); (d) ash tree bearing a lateral scar from an injury in winter 1995–96. Thereafter, there is a gradual overgrowth to close the gap year after year. The wood is decaying (dark wood) as a consequence of the injury (tree 19); (e) transversal increment core of the curved stem of a mountain pine showing GD occurred in winters 1977–78 and 1995–96. Due to the flexibility of the young stem, it recovered the vertical position after 1978. It was tilted again in 1996 and a permanent curvature started. At the same time, compression-wood rings (brown) develop on the downslope side (right) and narrow rings on the upslope side (tree 22).
Geosciences 10 00169 g005
Figure 6. (a) Ruins of old Àrreu, known today as Bordes d’Àrreu; (b) some architectural features such as this door arch reveal that the old Àrreu ruins had been houses before being used as barns.
Geosciences 10 00169 g006
Figure 7. New Àrreu, at present day abandoned (named Àrreu in the official map in Figure 1).
Geosciences 10 00169 g007
Figure 8. Comparison of prior-to-the-event (1993) and post-event (1997) orthoimages of the avalanche that occurred in the winter of 1995–96. Forest loss and surficial effects on terrain are clearly visible in 1997 image. The red circle indicates the position of tree 17 in Figure 11 (picture in Figure 4c).
Geosciences 10 00169 g008
Figure 9. Vegetation in Monars catchment (autumnal view). Yellow colors from birches, brown from oaks, blackish green from mountain pine.
Geosciences 10 00169 g009
Figure 10. Results from the dendrogeomorphological analysis. The number of trees with GD per year is represented in bars. The lines symbolize the total number of sampled trees (gray line), 20% and 40% of the total trees (green dashed lines). Winters considered avalanche years are indicated (modified from [4]). (In this study, GD trees were equally weighed in the calculation despite the number of tree-ring signals in one year or the intensity of the signals.)
Geosciences 10 00169 g010
Figure 11. Extent of different avalanches identified by dendrogeomorphological analysis. Above: High-frequency events in 2002–03 and 2013–14 (every 5–6 years) which stopped above Monars gorge at 1650 m a.s.l.; below: Lower-frequency events in 1995–96 and 1971–72 which had larger but slightly different runouts. (All sampled trees are numbered and symbolized by shapes depending on tree species: Birches, in squares; pine trees, in triangles; ash trees, in circles. In gray, sampled trees showing no GD in that year. Shapes in two colors symbolize trees with GD from two different events.)
Geosciences 10 00169 g011
Figure 12. Leaning directions of trees with growth-disturbance evidence most likely caused by avalanches in the lower section of the Monars torrent, the confluence with the Àrreu river, and the meadows above the old village (dark arrows).
Geosciences 10 00169 g012
Figure 13. Starting zones of Monars avalanche path, deduced from changes on forest cover, damage observed on vegetation, dendrogeomorphological analyses, witness observations, and terrain characteristics. Polygons define probable release areas, which does not mean that all the areas would release at the same time.
Geosciences 10 00169 g013
Figure 14. Dense flow avalanche (DFA) dynamic simulations with SAMOS-AT: (a) Simulation of the 1996 avalanche, considering the release areas A1, A2, and A3, as was observed on that occasion. A dense flow with a volume of 7.1 × 10³ m3 was considered; (b) simulation of an event released from the medium-frequency areas A5 and B4, with a release snow depth corresponding to a return period of 30 years (192 × 103 m3), and considering the occurrence of a previous avalanche similar to the one in 1996. The avalanche does not reach old Àrreu, but flows along Àrreu river to the main valley; (c) simulation of an event including the medium-frequency release areas A5 and B4, with a release snow depth corresponding to a return period of 300 years (260 × 103 m3), and considering the occurrence of a previous avalanche like the one of 1996. The avalanche does not reach old Àrreu, but again flows along Àrreu river to the main valley; (d) simulation of an event including the full extent of starting zone A and B and a snow depth corresponding to a T30 return period (603 × 103 m3) and considering the occurrence of a previous avalanche like the one in 1996. The second avalanche reaches old Àrreu with peak pressure values of 150 kPa at the western boundary of the hamlet.
Geosciences 10 00169 g014
Figure 15. Dynamic simulation with the powder snow avalanche (PSA) module of SAMOS-AT: (a) Scenario of the medium-frequency release areas A5 and B4 and a release snow depth corresponding to a return period of 30 years (192 × 103 m3). The peak pressure values at the western boundary of the hamlet were 7 kPa; (b) scenario of the full extent of the starting zones (A6 and B4) and a release snow depth corresponding to a return period of 30 years (603 × 103 m3). The peak pressure values at the western boundary of the hamlet were 17 kPa.
Geosciences 10 00169 g015
Figure 16. Detail of the DFA simulations near old Àrreu, comparing simulation runs with (lower panels) and without (upper panels) topographical changes due to the deposition of a previous avalanche event. Simulation considering a mid-frequency release area and a release snow depth corresponding to T30 (192 × 103 m3, left panels) and simulation considering a low-frequency release area and a release snow depth corresponding to T30 (603 × 103 m3, right panels).
Geosciences 10 00169 g016
Figure 17. Detail of the topographic profile of the track and runout zones of Monars avalanche path, from Monars gorge to Noguera Pallaresa river, showing the α and β points positions.
Geosciences 10 00169 g017
Table 1. Estimated return period of the registered avalanches.
Reference RunoutElevation (m a.s.l.)Estimated Return Period (T, years)
2002–03, 2013–1416505–6
1996, 1930s, 1950s137025–30
1971–72135030–100
1803<1300>100
Table 2. Main characteristics of the identified release areas, and synthesis of their activity inferred from the damage observed on vegetation. Pb: Probable; Ps: Possible; Ul: Unlikely; Uk: Unknown.
Starting ZoneMean Slope Angle (°)AspectArea (ha)Estimated Activity
1971–721995–962002–032013–14
A138E1.12PbPbUkPb
A233E2.16PbPbUkPb
A331E, SE6.27PbPbUkPb
A436SE3.37PbPsUlUl
B139SE2.14PbPsPsPs
B235SE1.42PsPsUkPs
B339NE0.47PsPsUkPs
Table 3. Summary of simulations.
Release AreaType of DynamicsRelease Snow Depth Return Period (Years)Volume Range (m3)Peak Pressure in Old Àrreu (kPa)
with Previous Eventwithout Previous Event
Mid-FrequencyDFA 130192 × 10300
PSA 230192 × 103*<7
DFA300260 × 10300
PSA300260 × 103*<8
Low-FrequencyDFA30603 × 103<150<110
PSA30603 × 103*<17
DFA300816 × 103<191<182
PSA300816 × 103*<25
1 Dense flow avalanche; 2 powder snow avalanche; * Not simulated (no significant differences expected).

