Abstract
The analysis of the geoecological state of basin geosystems was carried out by evaluation of the anthropogenic pressure on the basin. As indicators that directly or indirectly reflect the anthropogenic impact, the following were used: population density in the basin, density of the road network, and agricultural development of the basin territory. The spatial and statistical distributions of indicators were analyzed after the indicators were brought to a unified scale (transformation, normalization). The integral indicator of anthropogenic pressure, calculated as a linear combination of individual variables, was ranked to six categories of anthropogenic pressure: “absent”, “very low”, “low”, “moderate”, “high”, and “very high”. Using the developed methodology and prepared geodata, for the first time at scale of 1:200,000, the territory of the Volga Federal District was zoned according to the anthropogenic pressure on each river basin. Basins with a high and very high pressure are concentrated around large cities. Most of the basins belonging to the categories of low and moderate anthropogenic pressure are located in the forest-steppe and steppe zones with maximal agricultural development. Basins with zero and very low pressure lie in the north of the study area, in the forest zone, and in the southern Ural.
1. Introduction
The choice of operational-territorial units is very important when assessing the anthropogenic pressure. The main approaches are discussed in detail in an article by Stenis et al. [1], devoted to the analysis of modern methods of anthropogenic load normalization. There are three main approaches: landscape approach; river basin approach; and combined approach, i.e., combination of both approaches.
In the landscape approach, depending on the scale of the study, different taxonomic ranks act as spatial units: landscape, type of terrain, facies, etc. The advantage of the landscape approach is the ability to take into account the sustainability of the selected units to negative effects [2,3,4]. A significant lack in the approach is some subjectivity in the delineation of landscapes boundaries and their subordinate units [5].
The basin approach is widely used in environmental mapping [6]. The advisability of using this approach is since basin geosystems are natural territorial complexes, various paragenetic parts of which (watershed, slope complexes, floodplain) have a different level of resistance to anthropogenic pressure. Thus, the data obtained for the basins are most convenient for an objective assessment of the state of the territory [2,4,7]. Additionally, there are several advantages of using the basin approach: most of the watersheds have well-defined boundaries which can be easily delineated on the map; water, sediments, pollutants, etc. are almost closed within the watershed; and the possibility of clear classification of basins, for example, the Strahler–Filosofov classification [1].
It should be mentioned that the approach of the anthropogenic pressure calculation uses a regular cell grid [8].
The existing methods for assessing the anthropogenic load are described in detail in the articles [9,10,11]. One option is to use separate indicators, the analysis of which indirectly allows the state of the whole geosystem to be assessed. The most commonly used characteristics of sensitive components are vegetation and soil cover. Estimates that determine the excess of concentrations over the natural background or standards of particular pollutants and the total pollution of geosystem components are very popular [12,13]. The disturbance indicator may be based on the ratio of areas of the different land use categories [12]. When mapping, individual quantitative indicators of anthropogenic impact are displayed, usually referred to the area of the unit. Integral anthropogenic pressure indices that combine several indicators are also used [14].
Talking about data processing and analysis, a variety of methods are used to obtain quantitative estimates: statistical, methods of information theory, set theory, methods of algebra and geometry, mathematical logic, etc. Most of them allow quantification of the anthropogenic pressure and state of the environment using scores, ordinary, interval or relative scales, etc. [15,16]. The most common approach of quantitative methods is the linear estimates.
The list of indicators used in assessing anthropogenic pressure varies significantly and they are primarily based on the object of the research. For example, the atmospheric pollution index for atmospheric air, the water pollution index and the indicator of river runoff deficit for water objects, the coefficient of absolute and relative anthropogenic pressure and the degree of soil degradation for land resources, etc. [17]. When assessing the pressure on basin geosystems, demographic, industrial, and agricultural indicators are most often used in various forms [18,19,20,21].
Talking about spheres experiencing anthropogenic impact, the earth’s surface experiences the most significant and very dangerous pressure. The main sources of soil pollution are solid and liquid industrial wastes, consumption wastes, and agricultural wastes [22,23].
2. Materials and Methods
2.1. Study Area
The Volga Federal District is located in the East of the Russian Plain in the Volga and Kama River basins and partially covers the Urals (Figure 1). The area of the district is about 1,038,000 km2. The district covers several landscape zones: the taiga zone, the zone of mixed and broad-leaved forests, the forest-steppe zone, the steppe zone, and the mountain landscapes of the Urals.
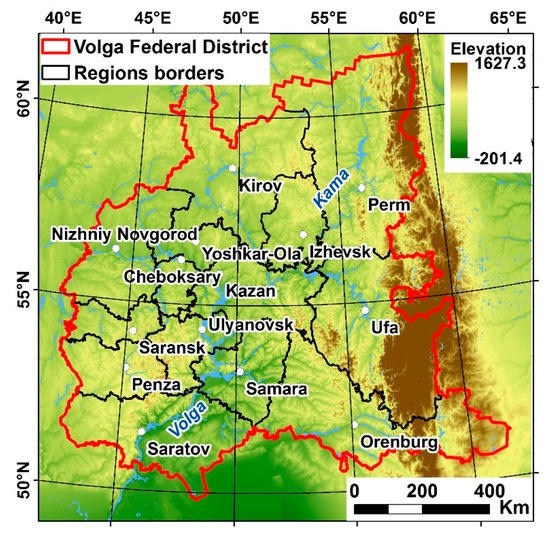
Figure 1.
Study area location.
The population of the Volga Federal District at the beginning of 2009 was approximately 30 million people (about 20% of the population of Russia). The population density (approximately 30 people/km2) is 3.5 times higher than the all-Russian indicator. The level of urbanization (about 70%) is slightly lower than the average for Russia and the district takes sixth place in terms of this indicator.
The favorable transport position of the district at the intersection of one of the main waterways of the country—the Volga River—with railways and roads connecting the eastern and western regions of the country to central Asian and European countries, predetermined the high transport net development for most regions of the Volga Federal District. According to the density of railways and roads, the district ranks third in the country.
The Volga Federal District is the leading agricultural producer in the Russian Federation (about 27% of agricultural production). The Saratov, Samara, Orenburg regions, Tatarstan, and parts of Bashkortostan form one of the leading grain regions of Russia and have the highest plowed territory.
2.2. Input Data and General Approach
The main data for calculating the anthropogenic pressure were: the vector layer of the river basins of the Volga Federal District, including 68,787 basins with an average area about 15 km2 [24]; OpenStreetMap data (OSM) [25]; topographic maps of Russia on a scale of 1:1,000,000 and 1:500,000; and a raster layer of cropland, obtained from the interpretation of time-series of MODIS vegetation indices [26].
As indicators that directly or indirectly reflect the anthropogenic impact, the following were used: population density in the basin, the density of the road network (taking into account the type of road), and agricultural development of the basin as cropland share. These factors are conservative, i.e., have a constant effect on the territory, not subject to significant fluctuations (both in spatial and temporal aspects), and characterize the degree of its economic development as much as possible.
All variables used to calculate the integral indicator of anthropogenic pressure must be converted to a single numerical scale. Studies devoted to the complex assessment of anthropogenic loads use logarithmic transformations of the form log (x + 1) for individual impact indicators to avoid the appearance of extreme values on the integral map. Furthermore, the logarithmic transformation corrects the typically skewed frequency distributions of each indicator [27,28,29]. To ensure comparability of various indicators, they are normalized to a range between 0 (zero or minimum observed value) and 1 (maximum observed value) according to the formula (1) [28]:
(X − Xmin)/(Xmax − Xmin),
2.3. Population Density
The population density was chosen to assess the anthropogenic pressure as an integral characteristic, indirectly reflecting the degree of economic development of the territory. The population density in the basins was estimated from information about the population in the settlements of the Volga Federal District and their spatial location in the basins.
A topographic map of Russia with a scale of 1:1,000,000 was used as the main data source. Two layers of settlements (point and polygonal) were digitized. The table of attributive information included the names of the settlements and the range of the population according to the map legend. Since the number recorded as a range cannot be used in the calculations, the average value for each range was recorded in a separate attribute field (Table 1).

Table 1.
Recalculation of population to estimate density.
For cities and other large settlements (including rural settlements with a population of more than 10 thousand inhabitants), the population was specified and updated according to the 2010 All-Russian Population Census [30]. OpenStreetMap maps updated for 2016 were used as an additional source of information. The need to use these data is due to two reasons. Larger scale and high detail allowed the transfer of population information from a large number of point features from a 1:1,000,000 map to the OSM polygonal settlements. The geometry of polygonal settlements was also updated. This necessity was caused by the different scales of maps. Furthermore, it connected with a real change in borders due to the increase in the area of most settlements since the topographic map was created. So, for example, the modern territory of Kazan has grown significantly, incorporating several nearby villages. In such cases, the total population of all settlements lying within modern borders was summarized (Figure 2).
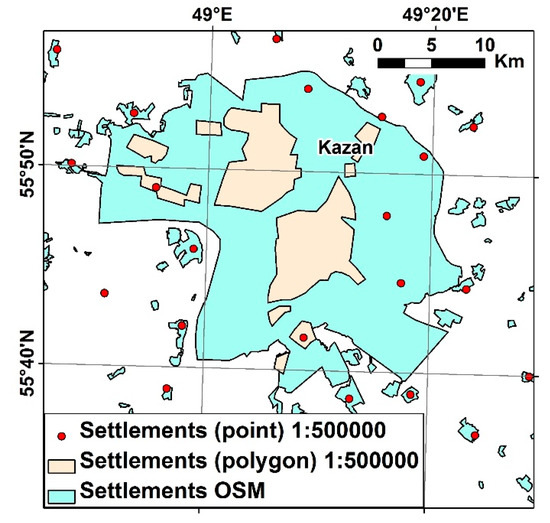
Figure 2.
Updating the boundaries of settlements.
Thus, for the study area, data were obtained for 8440 point and 4618 polygonal settlements (Figure 3).
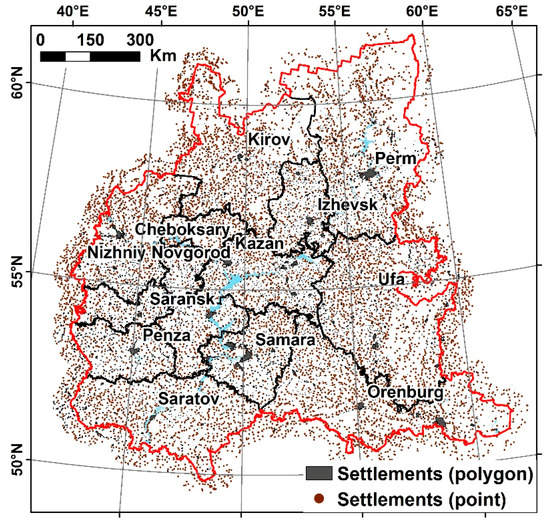
Figure 3.
Vector layers of settlements used to calculate population density.
Since many settlements are located within several river basins at once, polygonal settlements were cut by the basin boundaries. The population for each obtained fragment was calculated in proportion to the fraction of the fragment area compared to the settlement total area (Figure 4).
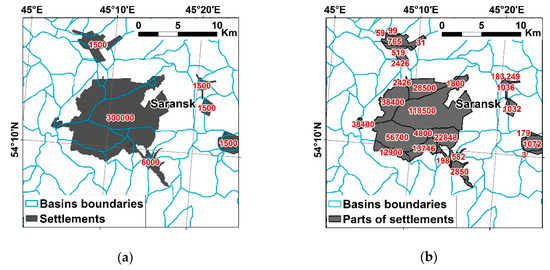
Figure 4.
Calculation of the population in parts of settlements located in the different basins: (a) population in settlements; (b) population in the parts of settlements belonging to the different basins.
The total population in the basin was calculated as the sum of the population of all the point and polygonal settlements lying within it. The population density was calculated as the ratio of population to basin area in km2.
For basins with a population density >0, basic statistics were calculated (Table 2) and a frequency histogram was plotted (Figure 5). The plot shows that the indicator has a skewed distribution.
Table 2.
Main statistics of population density in the basins.
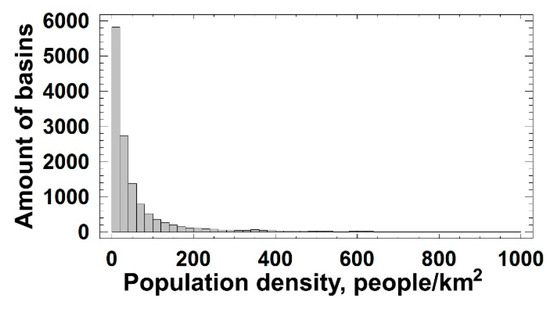
Figure 5.
The distribution of basins in terms of population density.
For further calculation of the anthropogenic pressure, the population density indicator must be converted to a dimensionless form with a range of values from 0 to 1. For this, the basins with a population density ≥1000 people/km2 were assigned the maximum value of 1. For other basins, the indicator was normalized using the formula:
where Pdens is the population density (people/km2).
(log(Pdens + 1))/(log(1001)),
2.4. Road Network Density
Another indicator characterizing the degree of anthropogenic pressure on the territory is the density of the road network. This indicator, being part of the infrastructure, indirectly reflects the degree of industrial development. To calculate the density of the road network in the basins, 2 data sources were used. The first was a layer of roads digitized from topographic maps of Russia on a scale of 1:500,000. The second was OpenStreetMap data. Both road and railway layers were processed. The use of information from the two sources was due to several reasons. On the one hand, the data on topographic maps are outdated: since the moment of their compilation, a large number of new roads have been constructed, and repair or reconstruction of existing ones has been carried out (i.e., the road surface, the width of the road, or the entire category of the road could be changed). Additionally, OSM data are more detailed due to the larger scale (approximately 1:100,000) (Figure 6a). On the other hand, OSM data may be incomplete, because it was created by the open community, and work on the project is not yet complete (Figure 6b).
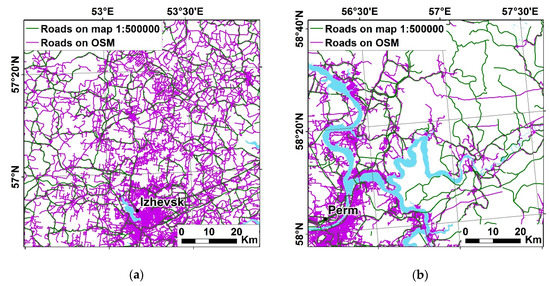
Figure 6.
Differences in the detail of the road network on the topo map of scale 1:500,000 and on the OSM map: (a) high detailed OSM data; (b) gaps in OSM data.
For the different types of roads, scores characterizing the usage pressure (from 1 to 5 as they increased) were assigned. Scores for roads from topographic maps were assigned based on the description given in the “Symbols for Topographic Maps of Scales 1:200,000 and 1:500,000” [31] (Table 3).
Table 3.
Pressure scores assigned to different types of roads and railways from 1:500,000 topo map.
Another classifier was used to assign usage pressure scores to OSM roads (Table 4). The global OSM community had an attempt to reach a consensus that the classification of roads should not be based on physical characteristics but on the relative importance (significance) of the road in the road network. The argument is made that the main quality of the road is not the number of lanes and the quality of asphalt, but from where to where you can get using it. The official classification of roads in Russia [32] is a little outdated and does not fully reflect the importance of roads in the road network. There are roads that de facto gained importance and received good coverage, but did not receive the appropriate status. On the other hand, there are important roads, including federal roads with no coverage at all. The OSM community, as a result of discussion and voting, developed rules for determining the relative importance of roads (Table 4) [33].
Table 4.
Pressure scores assigned to different types of roads from the OSM layer.
Load scores for railways were also assigned based on the attribute field “railway”, which is used to define many types of railways, including light rail, electric trains, metro, monorail, and tram [33] (Table 5).
Table 5.
Pressure scores assigned to different types of railways from the OSM layer.
The OSM road and rail layers were merged into one. Thus, 2 layers of roads were obtained: digitized from topographic maps on a scale of 1:500,000 and a layer of roads according to OSM data. Initially, objects having the same usage pressure score were combined in each layer. Further, the roads were cut using the basins boundaries. For each of the two layers, the total lengths of roads with the same score inside each basin were calculated. As a result, 10 fields were added to the attribute base of the river basins of the Volga Federal District: total road lengths with scores from 1 to 5 for two layers of the road network. The total length of roads of each category was calculated as the maximum value from 2 columns. That is, as the length of roads with a usage pressure score of 1, the maximum value was taken from the corresponding columns calculated using a topo map of a scale of 1:500,000 and OSM data, and so on. This allowed us to minimize errors associated with the quality of the source data, which was mentioned above.
The density of roads of each category in the basin was calculated as the ratio of the length to the basin area (km/km2). The total indicator (Rpress) for assessing the impact of road density was calculated using the following formula:
where R1 is the density of roads with an anthropogenic impact score of 1, R2 is with an impact score of 2, etc.
Rpress = R1 + 2 × R2 + 3 × R3 + 4 × R4 + 5 × R5,
For basins with a density indicator of the road network >0 basic statistics were calculated (Table 6).
Table 6.
Main statistics of the indicator of road density in the basins.
The indicator was normalized taking into account statistics. Since 95% of the basins have a road network density indicator <6, for basins above this value the maximum value 1 was assigned. For the remaining basins, the indicator was normalized by the formula:
(Rpress − 0)/(6 − 0),
2.5. Agricultural Development
A significant indicator of anthropogenic pressure is the agricultural development of the territory. To characterize the agricultural development, the cropland fraction in the basins was used, calculated as the ratio of the cropland to the total basin area. This indicator was based on the results of the automated recognition of croplands using time-series of MODIS 16-day composites of NDVI and EVI [26] (Figure 7).
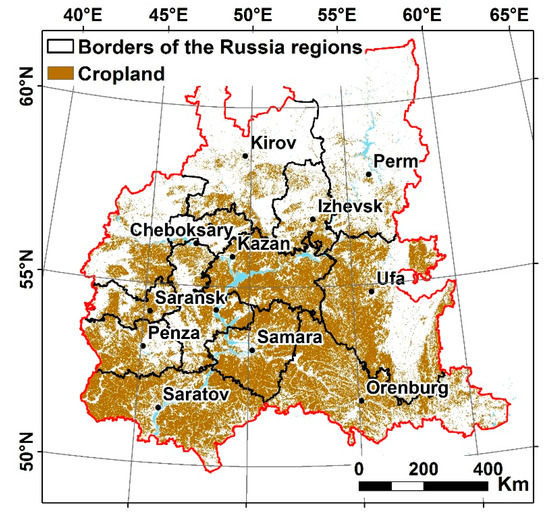
Figure 7.
Volga Federal District croplands based on processing of MODIS vegetation indices time-series.
2.6. Anthropogenic Pressure
To summarize particular indicators, various methods were tested (classification, main components, weighted scores). As a result, the simplest linear estimate was used: the integral indicator of anthropogenic pressure was obtained as the average of the three indicators described above.
3. Results
Three particular and one integral indicators of anthropogenic pressure in the basins were obtained. The resulting integral indicator is ranked to six categories: absent, very low, low, moderate, high, and very high anthropogenic pressure (Table 7). Corresponding maps were prepared (Figure 8).
Table 7.
Categories of anthropogenic pressure.
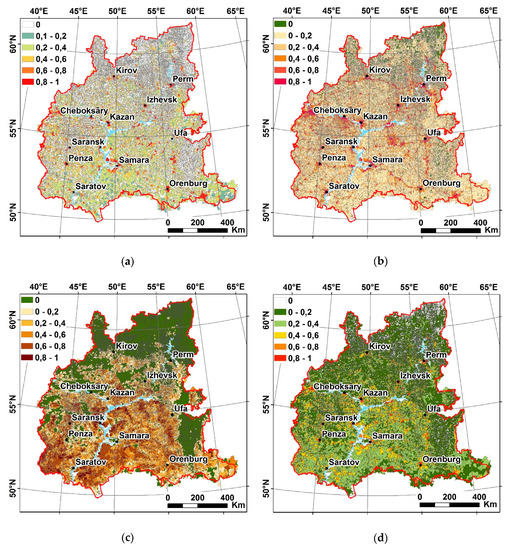
Figure 8.
Maps of particular and integral indicators of anthropogenic pressure in the river basins of the Volga Federal District: (a) the normalized indicator of population density, (b) the normalized indicator of the density of the road network, (c) cropland fraction in the river basins, (d) integral indicator of anthropogenic pressure in the river basins.
Map of normalized indicator of population density demonstrates a quite expected picture: basins with a maximum population density indicator are associated with large settlements, while most uninhabited basins are located in the taiga zone in the north of the Kirov region and Perm Territory, as well as in Ural mountainous areas (Figure 8a).
On the map of the normalized road density indicator (Figure 8b), a logical spatial distribution is observed. The basins with the maximum values of the indicator are allocated near large settlements, as well as along the main routes connecting the capitals of the regions and other large cities. Furthermore, high values of the indicator are observed, for example, in the southeast of the Tatarstan Republic, i.e., in the region of intensive oil production with developed infrastructure. This confirms the assumption that the road density indicator indirectly reflects the degree of industrial development of the territory. As in the case of population density, zero values of the indicator are observed in the north of the study area (in the forest zone) and the southern Urals.
In addition, for the integral indicator of anthropogenic pressure (Figure 8d), the ratio of the number of basins belonging to each category and their area and were estimated (Table 8).
Table 8.
The ratio of basins according to the degree of anthropogenic pressure.
As a result, the first category includes basins where there are no settlements, road networks, and croplands. Basins with very low anthropogenic pressure are characterized by extremely low population density (on average 0.5 people/km2), roads are mainly forest, field and country dirt roads, the density of which is on average 0.24 km/km2, and the density of roads with coverage of 0.01 km/km2, the percentage of cropland on average about 5%. A moderate anthropogenic load was obtained for basins, where the average density of country roads, paved roads, and croplands fraction is higher (0.54 km/km2, 0.17 km/km2, 44%, respectively), and the average population density is 62 people/km2. The basins classified as high usage pressured are characterized by a high percentage of croplands, high density of paved roads and highways, and an average population density of about 300 people/km2. Basins with very high usage pressure are located mainly in urban areas (population density of more than 1000 people/km2), with a high density of highways and broad gauge railways.
Spatially, basins belonging to the categories with a high and very high usage pressure are concentrated around large cities. Their number, as well as the area, total less than 3%. Most basins with low and moderate anthropogenic pressure are located in the forest-steppe and steppe zones with maximum agricultural development. These categories account for just over 30% of the basins, covering 50% of the study area. The basins with zero and very low pressure are located in the north of the study area, in the forest zone, and the southern Ural. However, despite the large number (almost 22%), the basins that are not under pressure occupy less than 6% of the Volga Federal District area.
4. Discussion and Conclusion
In discussing the results, it is necessary to note some important problems. The first problem is the complexity of assessing the reliability of the results for several reasons. Firstly, there are no similar maps of anthropogenic loads on river basins in the study area. The existing maps of anthropogenic loads use other spatial units and mapping methods. So, when evaluating the same indicator on different maps, data from different sources, different scales, resolutions, etc. can be used. Besides, the set of indicators that underlies the integral indicator of anthropogenic pressure is different. In general, a visual comparison of the results with the map of agricultural development, map of pressure from roads and the map of anthropogenic pressure, presented in the national atlas of the Russian Federation [34] did not reveal any contradictions.
Despite this the assessment does not cover the entire list of factors negatively affecting the environment; the results obtained reflect spatial differences in the degree of anthropogenic load. The selected indicators characterize the degree of development of the territory, and the contribution of each of them is traced in the selected categories of anthropogenic pressure. Thus, the obtained data can be useful for solving many problems in the field of ecology and nature management, such as assessing the condition of the territory, planning economic activity, etc.
The question of choosing the optimal approach to assessing anthropogenic impact on the territory remains open. The difficulty lies in the selection of negative impact factors for each environment (atmosphere, hydrosphere, earth surface, pedosphere, ecosystems in general) and in the development of a comprehensive indicator that allows the most objective assessment of the pressure. Further research may be aimed at expanding the list of impact indicators considered. It is necessary to evaluate the importance of indicators and their contribution to the overall effect on the territory.
Results at this level of detail and generalized to basins are obtained for Russia for the first time. This allows us to carry out zoning of territory to create federal schemes of the territorial development of large parts of Russia. Besides, the created spatial database with calculated characteristics, which will be supplemented in the future, is of scientific and practical significance.
Author Contributions
Conceptualization, O.Y.; methodology, S.M., O.Y., and M.I.; validation, M.I.; formal analysis, S.M. and M.I.; investigation, S.M. and M.I.; resources, O.Y., S.M., and M.I.; writing—original draft preparation, M.I.; writing—review and editing, O.Y.; visualization, M.I.; supervision, O.Y.; project administration, O.Y.; funding acquisition, O.Y. All authors have read and agreed to the published version of the manuscript.
Funding
The work was supported by the Russian Science Foundation (research methods, analysis, and results) (project N°19-17-00064).
Acknowledgments
The work performed according to the Russian Government Program of Competitive Growth of Kazan Federal University (translation of text into English and proofreading paper).
Conflicts of Interest
The authors declare no conflict of interest.
References
- Stenis, J.; Romanov, M.; Hogland, W. Analysis and Classification of Modern Methods of Ecological Normalization of Anthropogenic Load: Russia vs. the West. Open Environ. Eng. J. 2011, 411, 181–189. [Google Scholar] [CrossRef]
- Ermolaev, O.P.; Igonin, M.E.; Bubnov, A.U.; Pavlova, S.V. Landscapes of Tatarstan Republic. Regional Landscape and Ecological Analysis; Slovo: Kazan, Russia, 2007; p. 411. (In Russian) [Google Scholar]
- Mozzherin, V.I.; Yermolaev, O.P.; Mozzherin, V.V. Kazanka River and Its Basin; MeDDoK: Kazan, Russia, 2012; p. 280. (In Russian) [Google Scholar]
- Yermolaev, O.P.; Ivanov, M.A. Environmental Assessment of Basin Geosystems Based on the Landscape Approach. Biosci. Biotechnol. Res. Asia 2014, 11, 257–263. [Google Scholar]
- Armand, D.L. Science of the Landscape; Mysl: Moscow, Russia, 1975; p. 287. (In Russian) [Google Scholar]
- Sturman, V.I. Ecological Mapping; Aspekt Press: Moscow, Russia, 2003; p. 251. (In Russian) [Google Scholar]
- Lisetskii, F.N.; Pavlyuk, Y.V.; Kirilenko, Z.A.; Pichura, V.I. Basin organization of nature management for solving hydroecological problems. Russ. Meteorol. Hydrol. 2014, 39, 550–557. [Google Scholar] [CrossRef]
- Yermolaev, O.P. Erosion in Basin Geosystems; UNIPRESS: Kazan, Russia, 2002; p. 265. (In Russian) [Google Scholar]
- Yermolaev, O.P.; Usmanov, B.M. The Basin Approach to the Anthropogenic Impact Assessment in Oil-Producing Region. Ecology and Environmental Protection. In Proceedings of the 2014 14th International Multidisciplinary Scientific Geoconference—SGEM, Albena, Bulgaria, 17–26 June 2014; Volume 2, pp. 681–688. [Google Scholar] [CrossRef]
- Ermolaev, O.P.; Usmanov, B.M.; Chizhikova, N.A. Assessment of Anthropogenic Impact on Basin Geosystems in a Region of Intense Oil Production. Uchenye Zap. Kazan. Univ.-Seriya Estestv. Nauki 2014, 156, 70–90. (In Russian) [Google Scholar]
- Ivanov, M.A.; Yermolaev, O.P.; Usmanov, B.M. Integrated Approach to Environmental Impact Assessment on Geosystems. Int. J. Pharm. Technol. 2016, 8, 24153–24160. [Google Scholar]
- Yermolaev, O.P.; Usmanov, B.M.; Mishanina, O.E.; Khisamutdinova, E.V. Basin Approach to Evaluation of Human Impact on the Environment in Oil Production Regions. Neftyanoe Khozyaistvo—Oil Ind. 2014, 12, 156–160. (In Russian) [Google Scholar]
- Yermolaev, O.P.; Usmanov, B.M.; Muharamova, S.S. The Basin Approach and Mapping to the Anthropogenic Impact Assessment on the East of the Russian Plain. Int. J. Appl. Eng. Res. 2015, 10, 41178–41184. [Google Scholar]
- Kochurov, B.I.; Shishkina, D.Y.; Antipova, A.V.; Kostovsk, S.K. Geoecological Mapping: A Textbook for University Students; Academia: Moscow, Russia, 2009; p. 192. (In Russian) [Google Scholar]
- Simonov, Yu.G. Score Assessment in Applied Geographical Research and Ways to Improve. Vestn. Mosk. Univ. Seria 5 Geogr. 1997, 4, 7–10. (In Russian) [Google Scholar]
- Khomyakov, P.M.; Konishchev, V.N.; Pegov, S.A.; Smolina, S.G.; Khomyakov, D.M. Modeling the Dynamics of Geoecosystems at the Regional Level; Izdatel’stvo Moskovskogo Universiteta: Moscow, Russia, 2000; p. 382. (In Russian) [Google Scholar]
- Mylarschikov, A.M. Systematics of Methods to Assess Human Impacts on the Environment. Available online: https://naukovedenie.ru/sbornik12/12-23.pdf (accessed on 18 February 2020). (In Russian).
- Bolshanyk, P.V. Levels of Anthropogenic Pressure and Ecological-Geographical Zoning of the Territory of the Khanty-Mansi Autonomous Okrug—Ugra. Bullet. Tomsk State Univ. 2008, 317, 253–257. (In Russian) [Google Scholar]
- Rybkina, I.D.; Stoyashcheva, N.V. Assessment of Anthropogenic Pressure on the Catchment Area of the Upper and Middle Ob. World Sci. Cult. Educ. 2010, 6, 295–299. (In Russian) [Google Scholar]
- Stoyashcheva, N.V.; Rybkina, I.D. Assessment of Anthropogenic Pressure on the Catchment Area and Water Bodies of the Irtysh River Transboundary Basin. Polzunovsky Bullet. 2011, 4, 98–102. (In Russian) [Google Scholar]
- Kurganovich, N.A.; Shalikovsky, A.V. Assessment of Anthropogenic Pressure on Catchments of Rivers of the Zabaykalsky Region. Bullet. Zabaykalsk State Univ. 2014, 10, 4–10. (In Russian) [Google Scholar]
- Akimova, T.A.; Haskin, V.V. Ecology. Man—Economics—Biota—Environment: A Textbook for University Students, 3rd ed.; UNITY-DANA: Moscow, Russia, 2012; p. 495. (In Russian) [Google Scholar]
- Goleusov, P.; Lisetskii, F. Soil Development in Anthropogenically Disturbed Forest-Steppe Landscapes. Eurasian Soil Sci. 2008, 41, 1480–1486. [Google Scholar] [CrossRef]
- Ermolaev, O.P.; Mal’tsev, K.A.; Ivanov, M.A. Automated Construction of the Boundaries of Basin Geosystems for the Volga Federal District. Geogr. Nat. Resour. 2014, 35, 222–228. [Google Scholar] [CrossRef]
- Haklay, M.; Weber, P. Openstreetmap: User-generated Street Maps. IEEE Pervasive Comput. 2008, 7, 12–18. [Google Scholar] [CrossRef]
- Mukharamova, S.S.; Ivanov, M.A. Recognition of Cultivated Cropland Using Time-Series of MODIS Vegetation Indices. In Proceedings of the VI International Scientific and Practical Conference “Actual Issues of Geodesy and Geoinformation Systems”, Kazan, Russia, 6–7 September 2017; pp. 103–111. (In Russian). [Google Scholar]
- Halpern, B.S.; Walbridge, S.; Selkoe, K.A.; Kappel, C.V.; Micheli, F.; D’Agrosa, C.; Watson, R. A Global Map of Human Impact on Marine Ecosystems. Science 2008, 319, 948–952. [Google Scholar] [CrossRef] [PubMed]
- Allan, J.D.; McIntyre, P.B.; Smith, S.D.; Halpern, B.S.; Boyer, G.L.; Buchsbaum, A.; Steinman, A.D. Joint Analysis of Stressors and Ecosystem Services to Enhance Restoration Effectiveness. Proc. Natl. Acad. Sci. USA 2013, 110, 372–377. [Google Scholar] [CrossRef] [PubMed]
- Andersen, J.H.; Stock, A.; Mannerla, M.; Heinänen, S.; Vinther, M. Human Uses, Pressures and Impacts in the Eastern North Sea. Tech. Rep. DCE—Danish Centre Environ. Energy 2013, 18, 136. [Google Scholar]
- All-Russian Population Census. 2010. Available online: https://www.gks.ru/free_doc/new_site/perepis2010/croc/perepis_itogi1612.htm (accessed on 20 February 2020). (In Russian).
- Military Topographical Directorate of the General Staff. Symbols for Topographic Maps of Scales 1: 200000 and 1: 500000; Military Topographical Directorate of the General Staff: Moscow, Russia, 1983; p. 56. (In Russian) [Google Scholar]
- State Standart GOST R 52398–2005. Classification of Automobile Roads; General Parameters and Requirements; Standartinform: Moscow, Russia, 2006; p. 7. (In Russian) [Google Scholar]
- OpenStreetMap Wiki. Key:railway. Available online: https://wiki.openstreetmap.org/wiki/Key:railway (accessed on 20 February 2020).
- Nation Atlas of Russia. Available online: https://нaциoнaльныйaтлac.pφ/cd2/territory.html (accessed on 20 February 2020). (In Russian).
© 2020 by the authors. Licensee MDPI, Basel, Switzerland. This article is an open access article distributed under the terms and conditions of the Creative Commons Attribution (CC BY) license (http://creativecommons.org/licenses/by/4.0/).