Timing, Mechanics and Controls of the Evolution of the Southernmost Part of the Oman Mountains: The Salakh Arch


Abstract
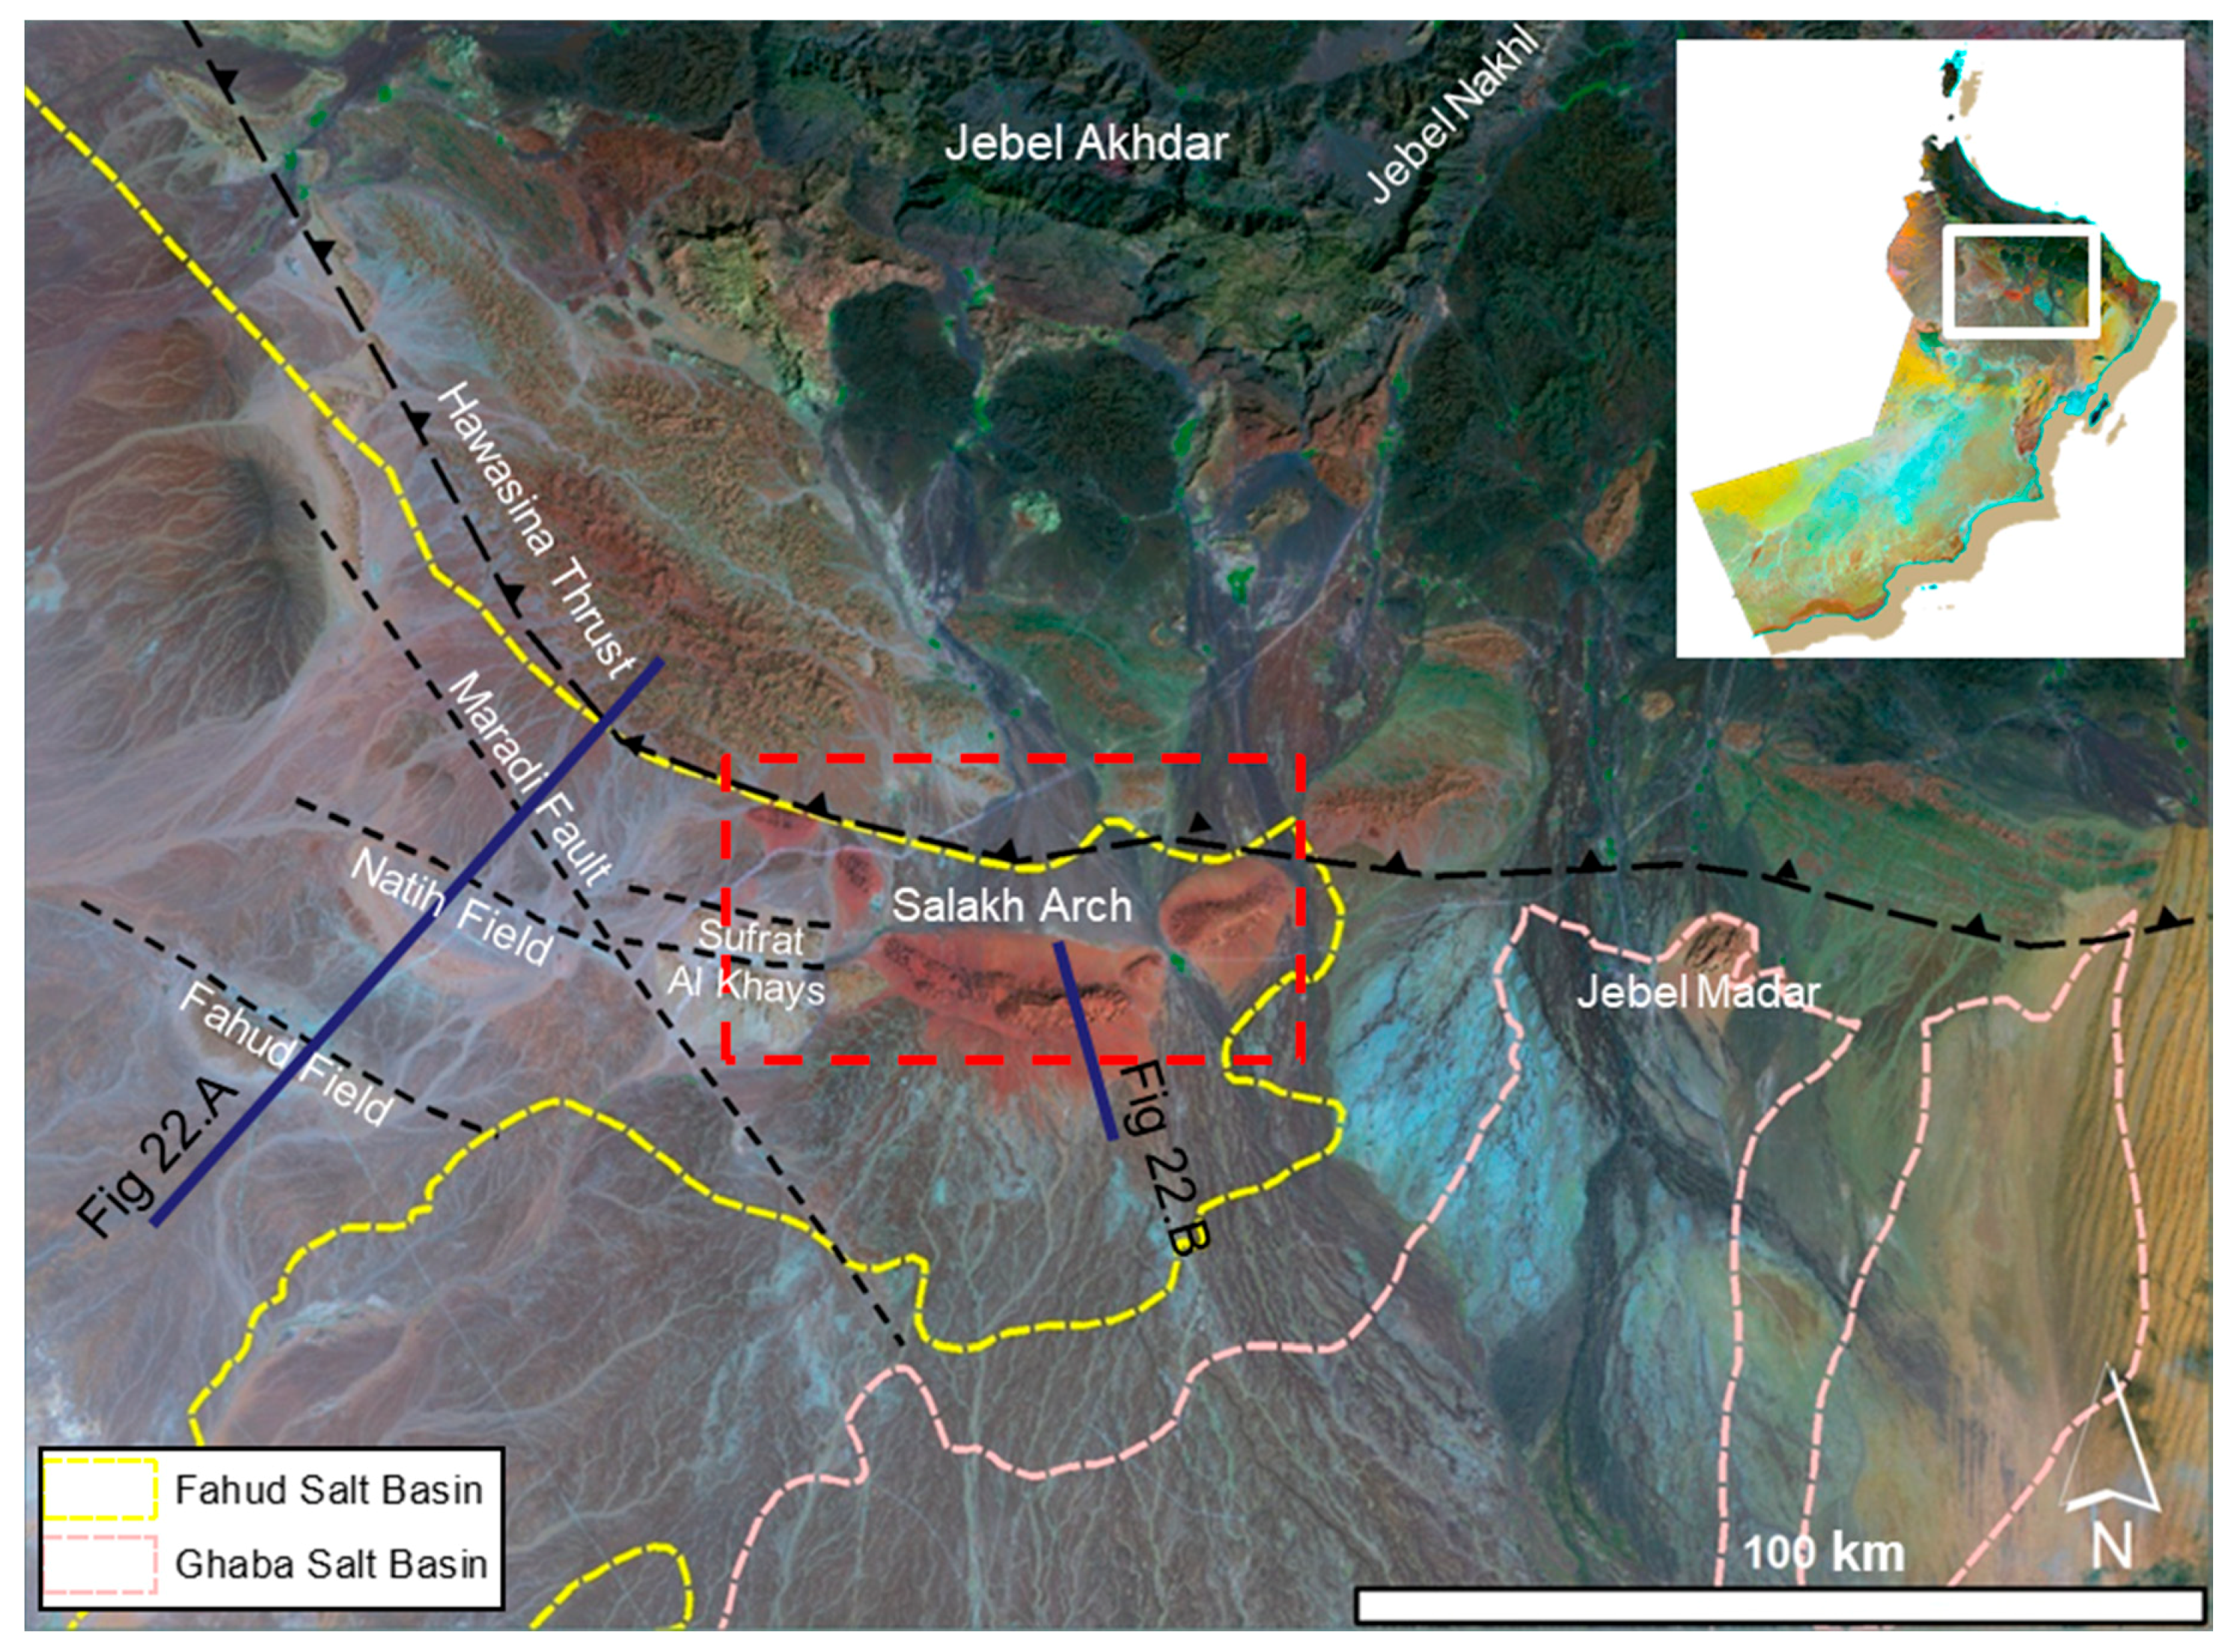
1. Study Area
2. Geological Setting
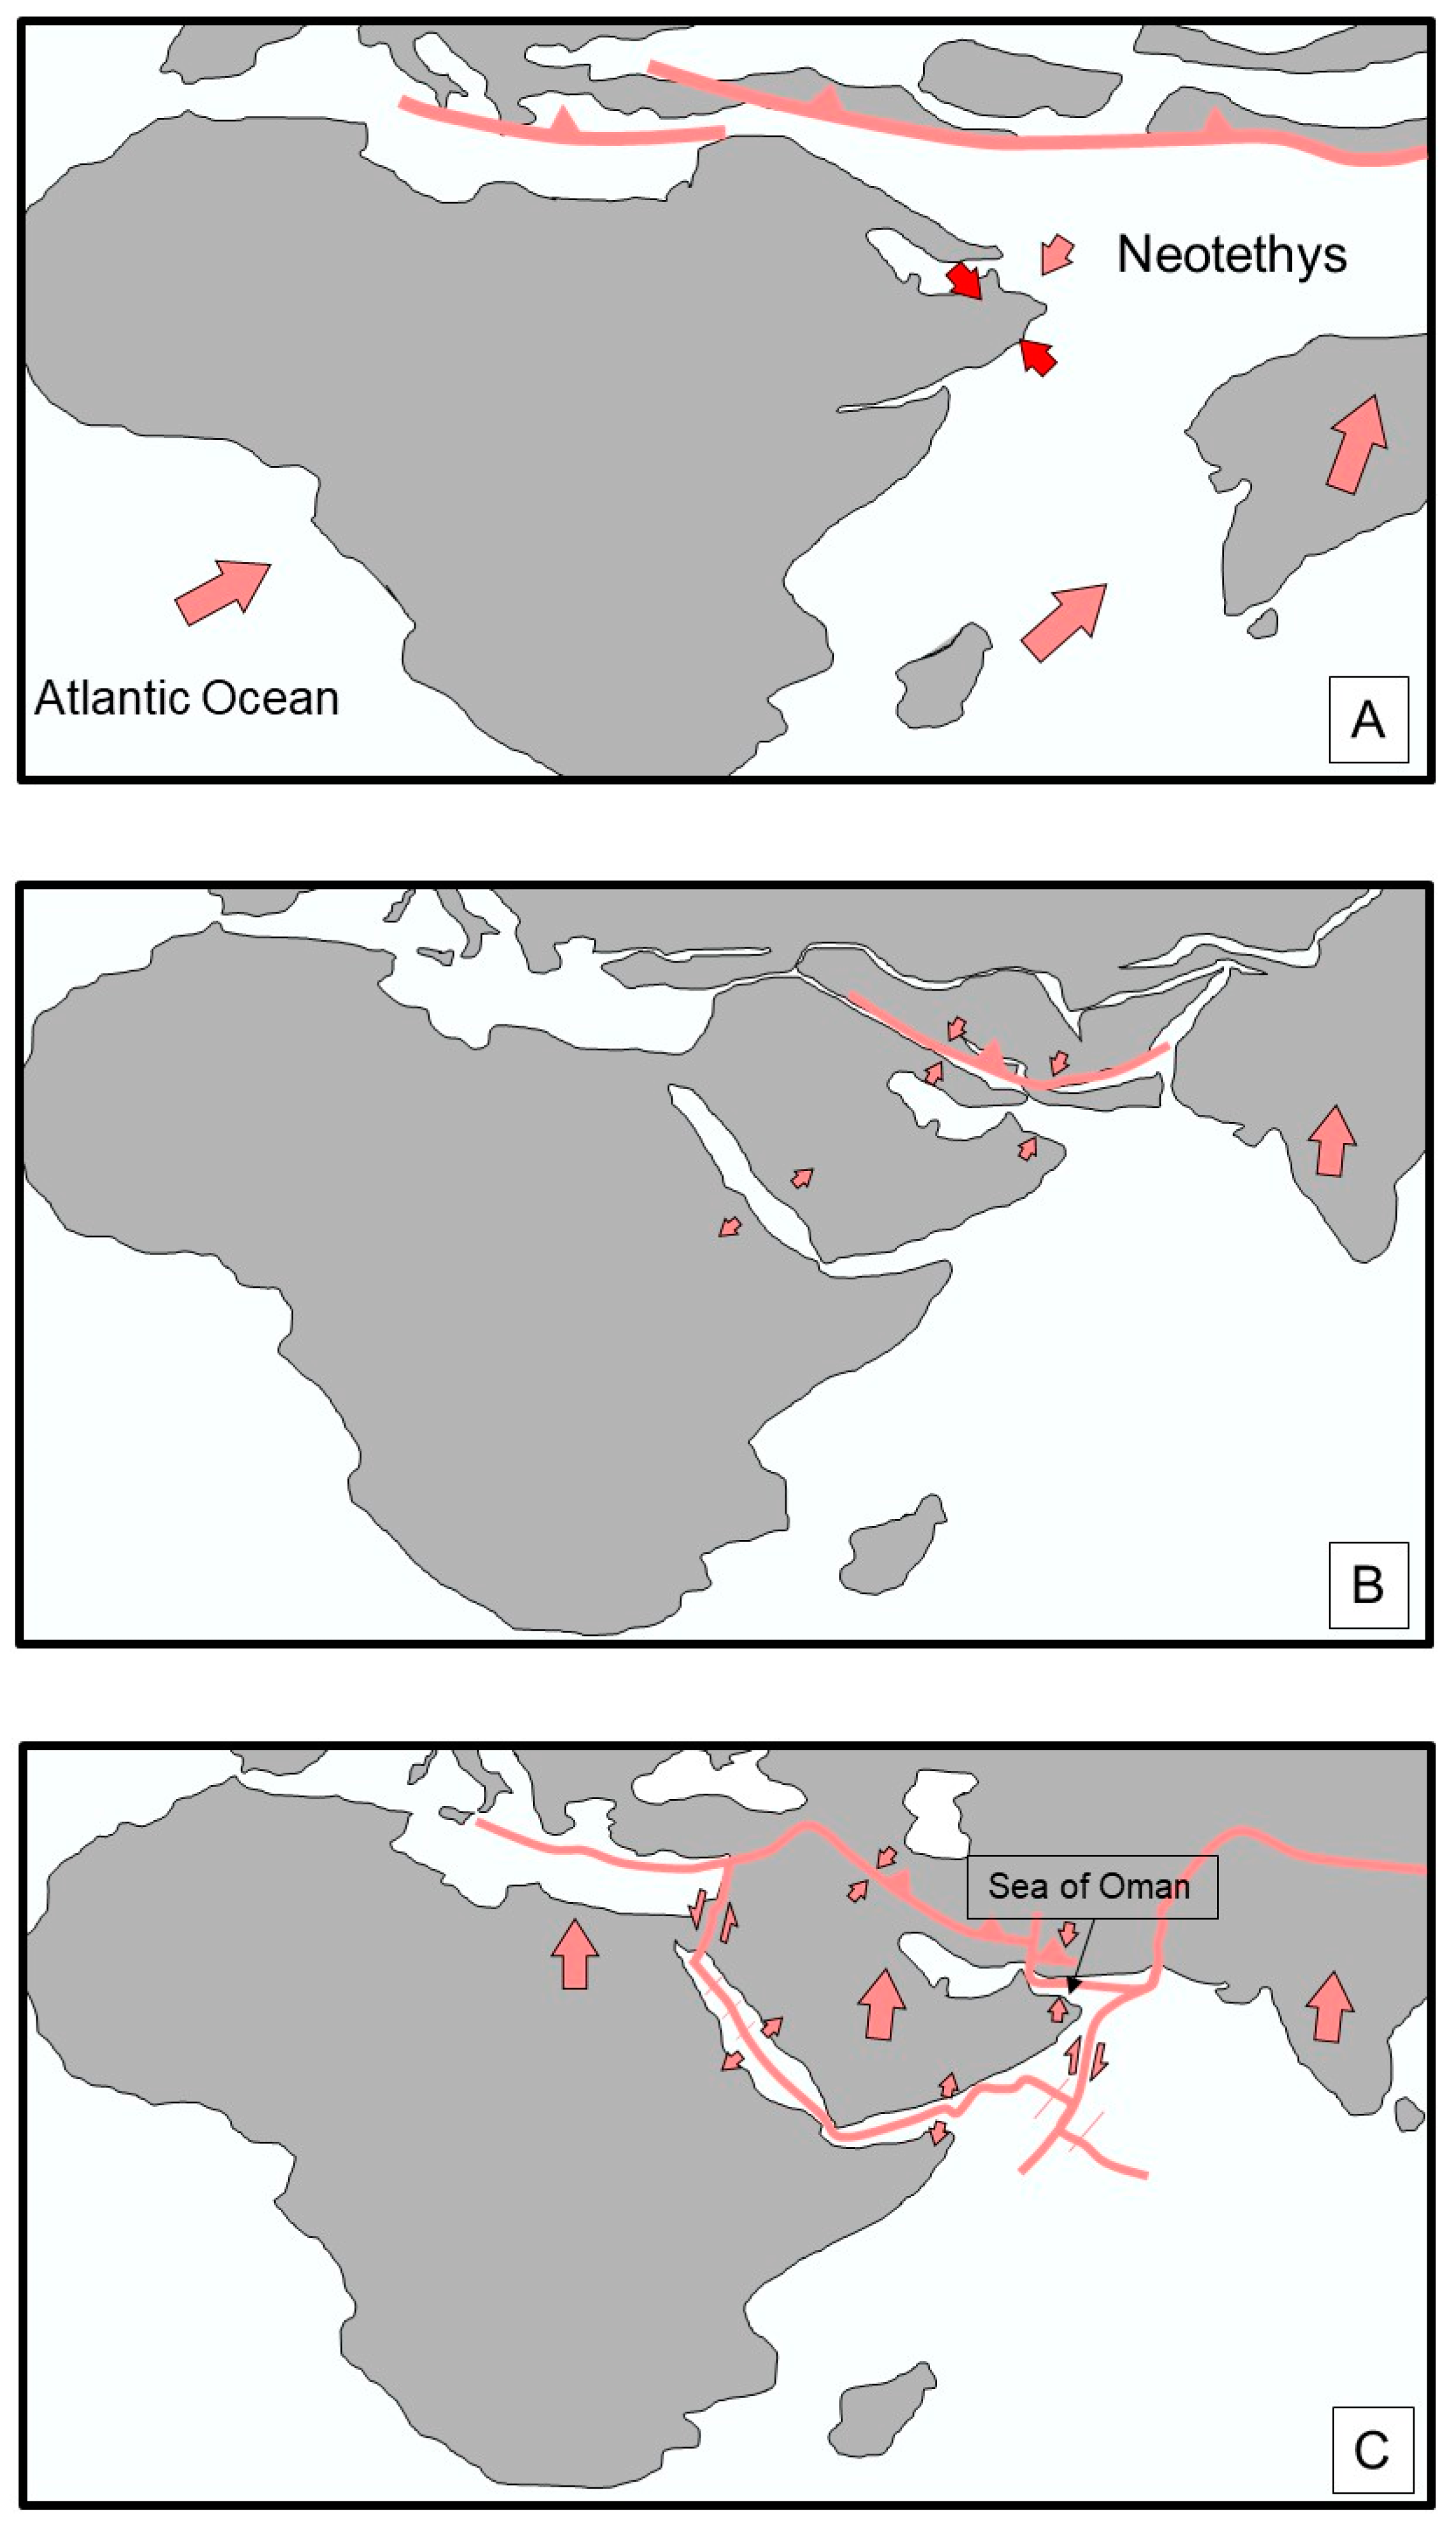
2.1. Tectonics during the Late Cretaceous
2.2. Tectonics during Cenozoic
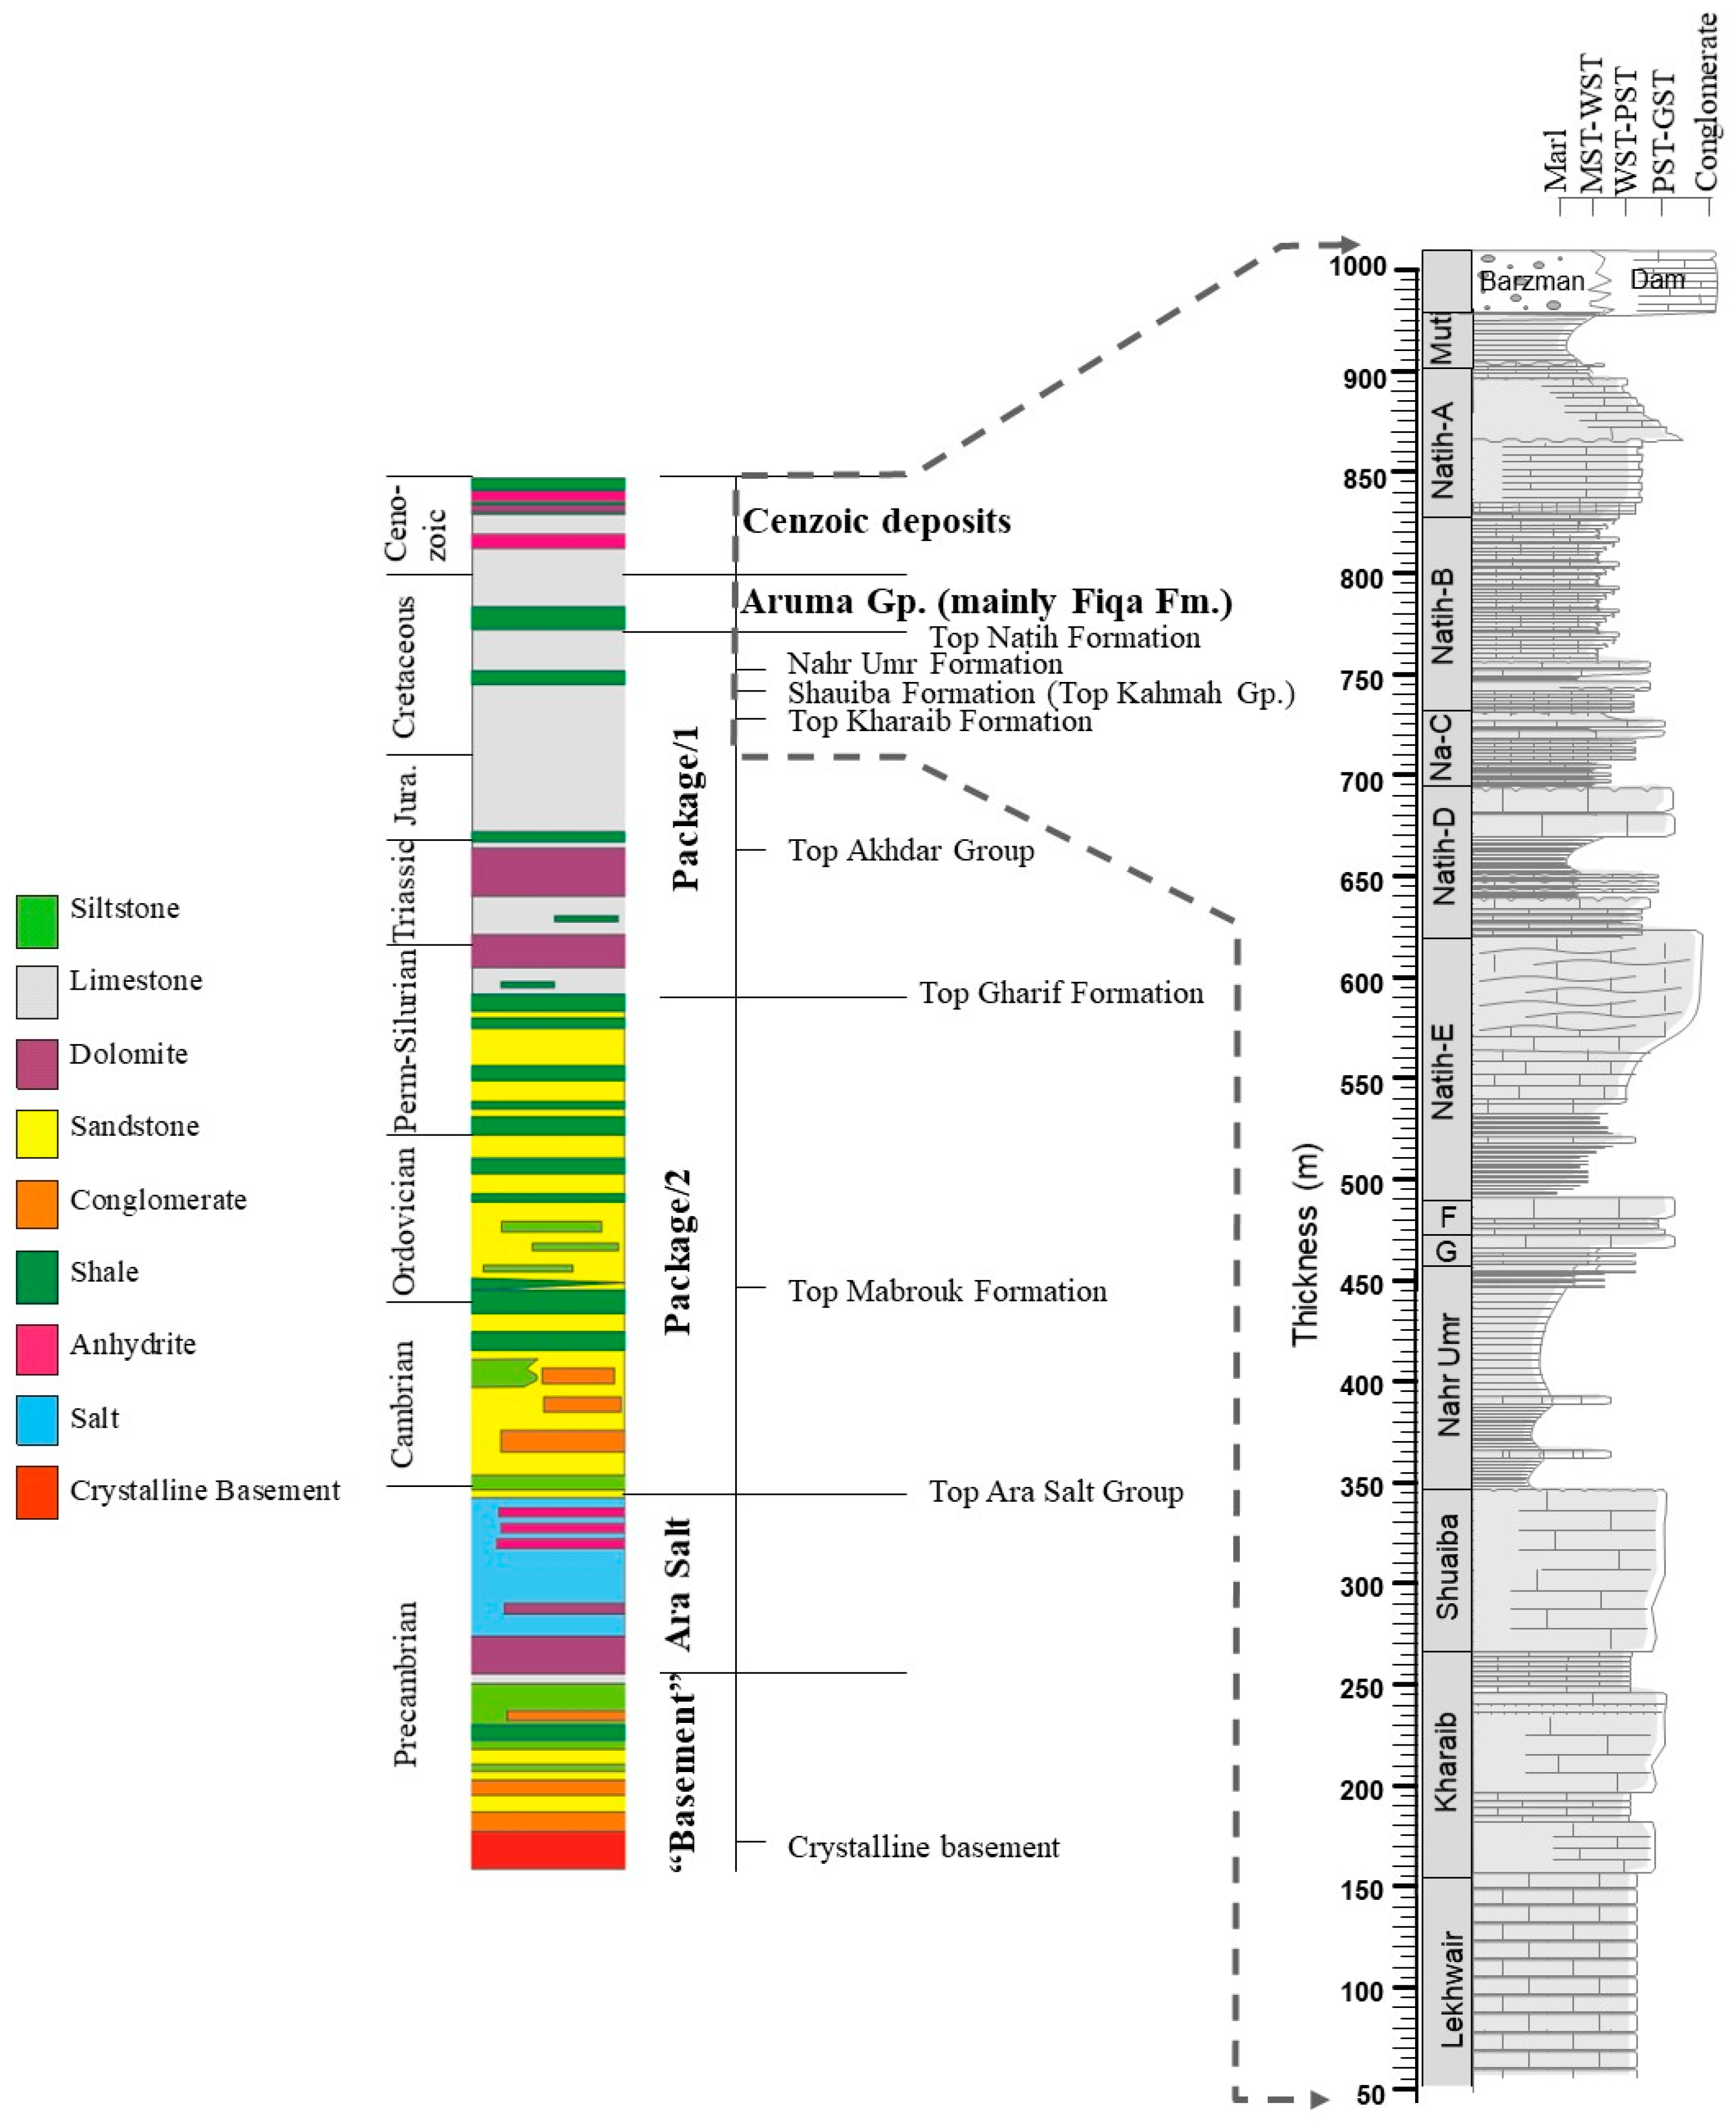
2.3. Stratigraphy of the Study Area
3. Methods
3.1. Surface Data
3.2. Seismic Data
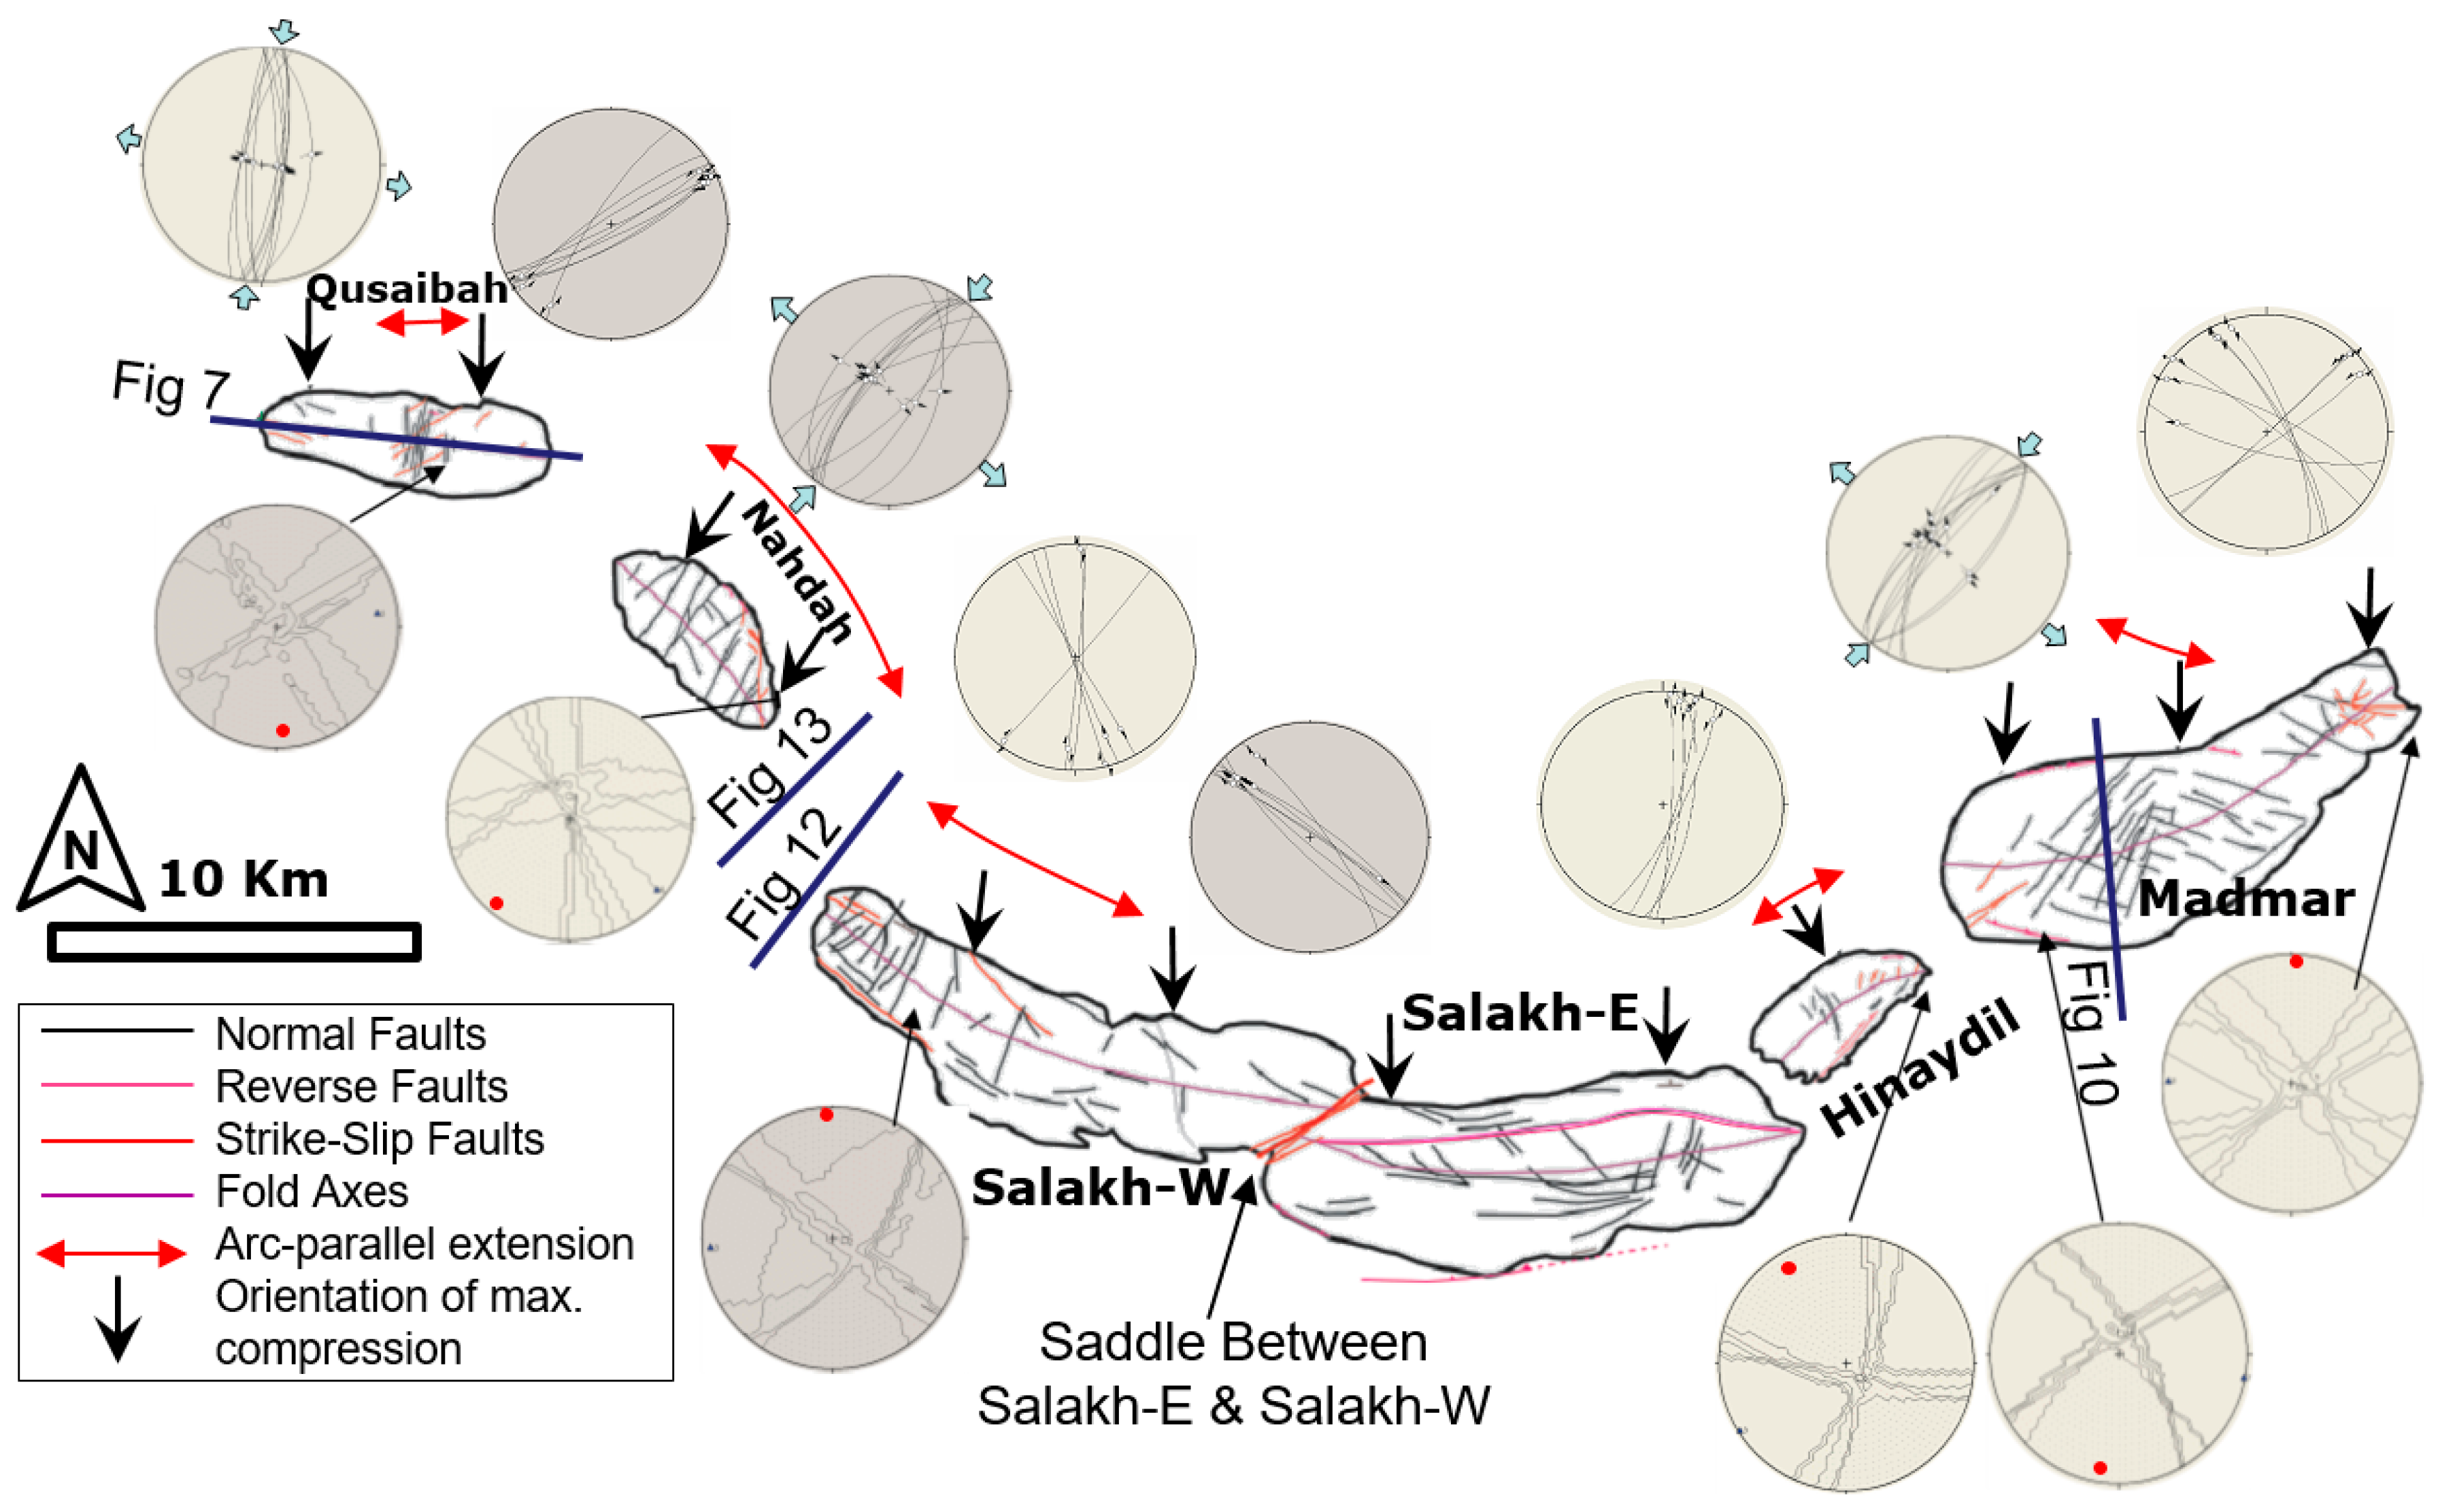
4. Results from Surface Data
4.1. Qusaibah
4.2. Nahdah
4.3. Jebel Salakh W
4.4. The Saddle between Salakh E and Salakh W
4.5. Salakh E
4.6. Hinaydil
4.7. Madmar
5. Results from Subsurface Data
5.1. Seismic Section 1
5.2. Seismic Section 2 (Nahdah/Salakh W gap)
5.3. Seismic Section 3
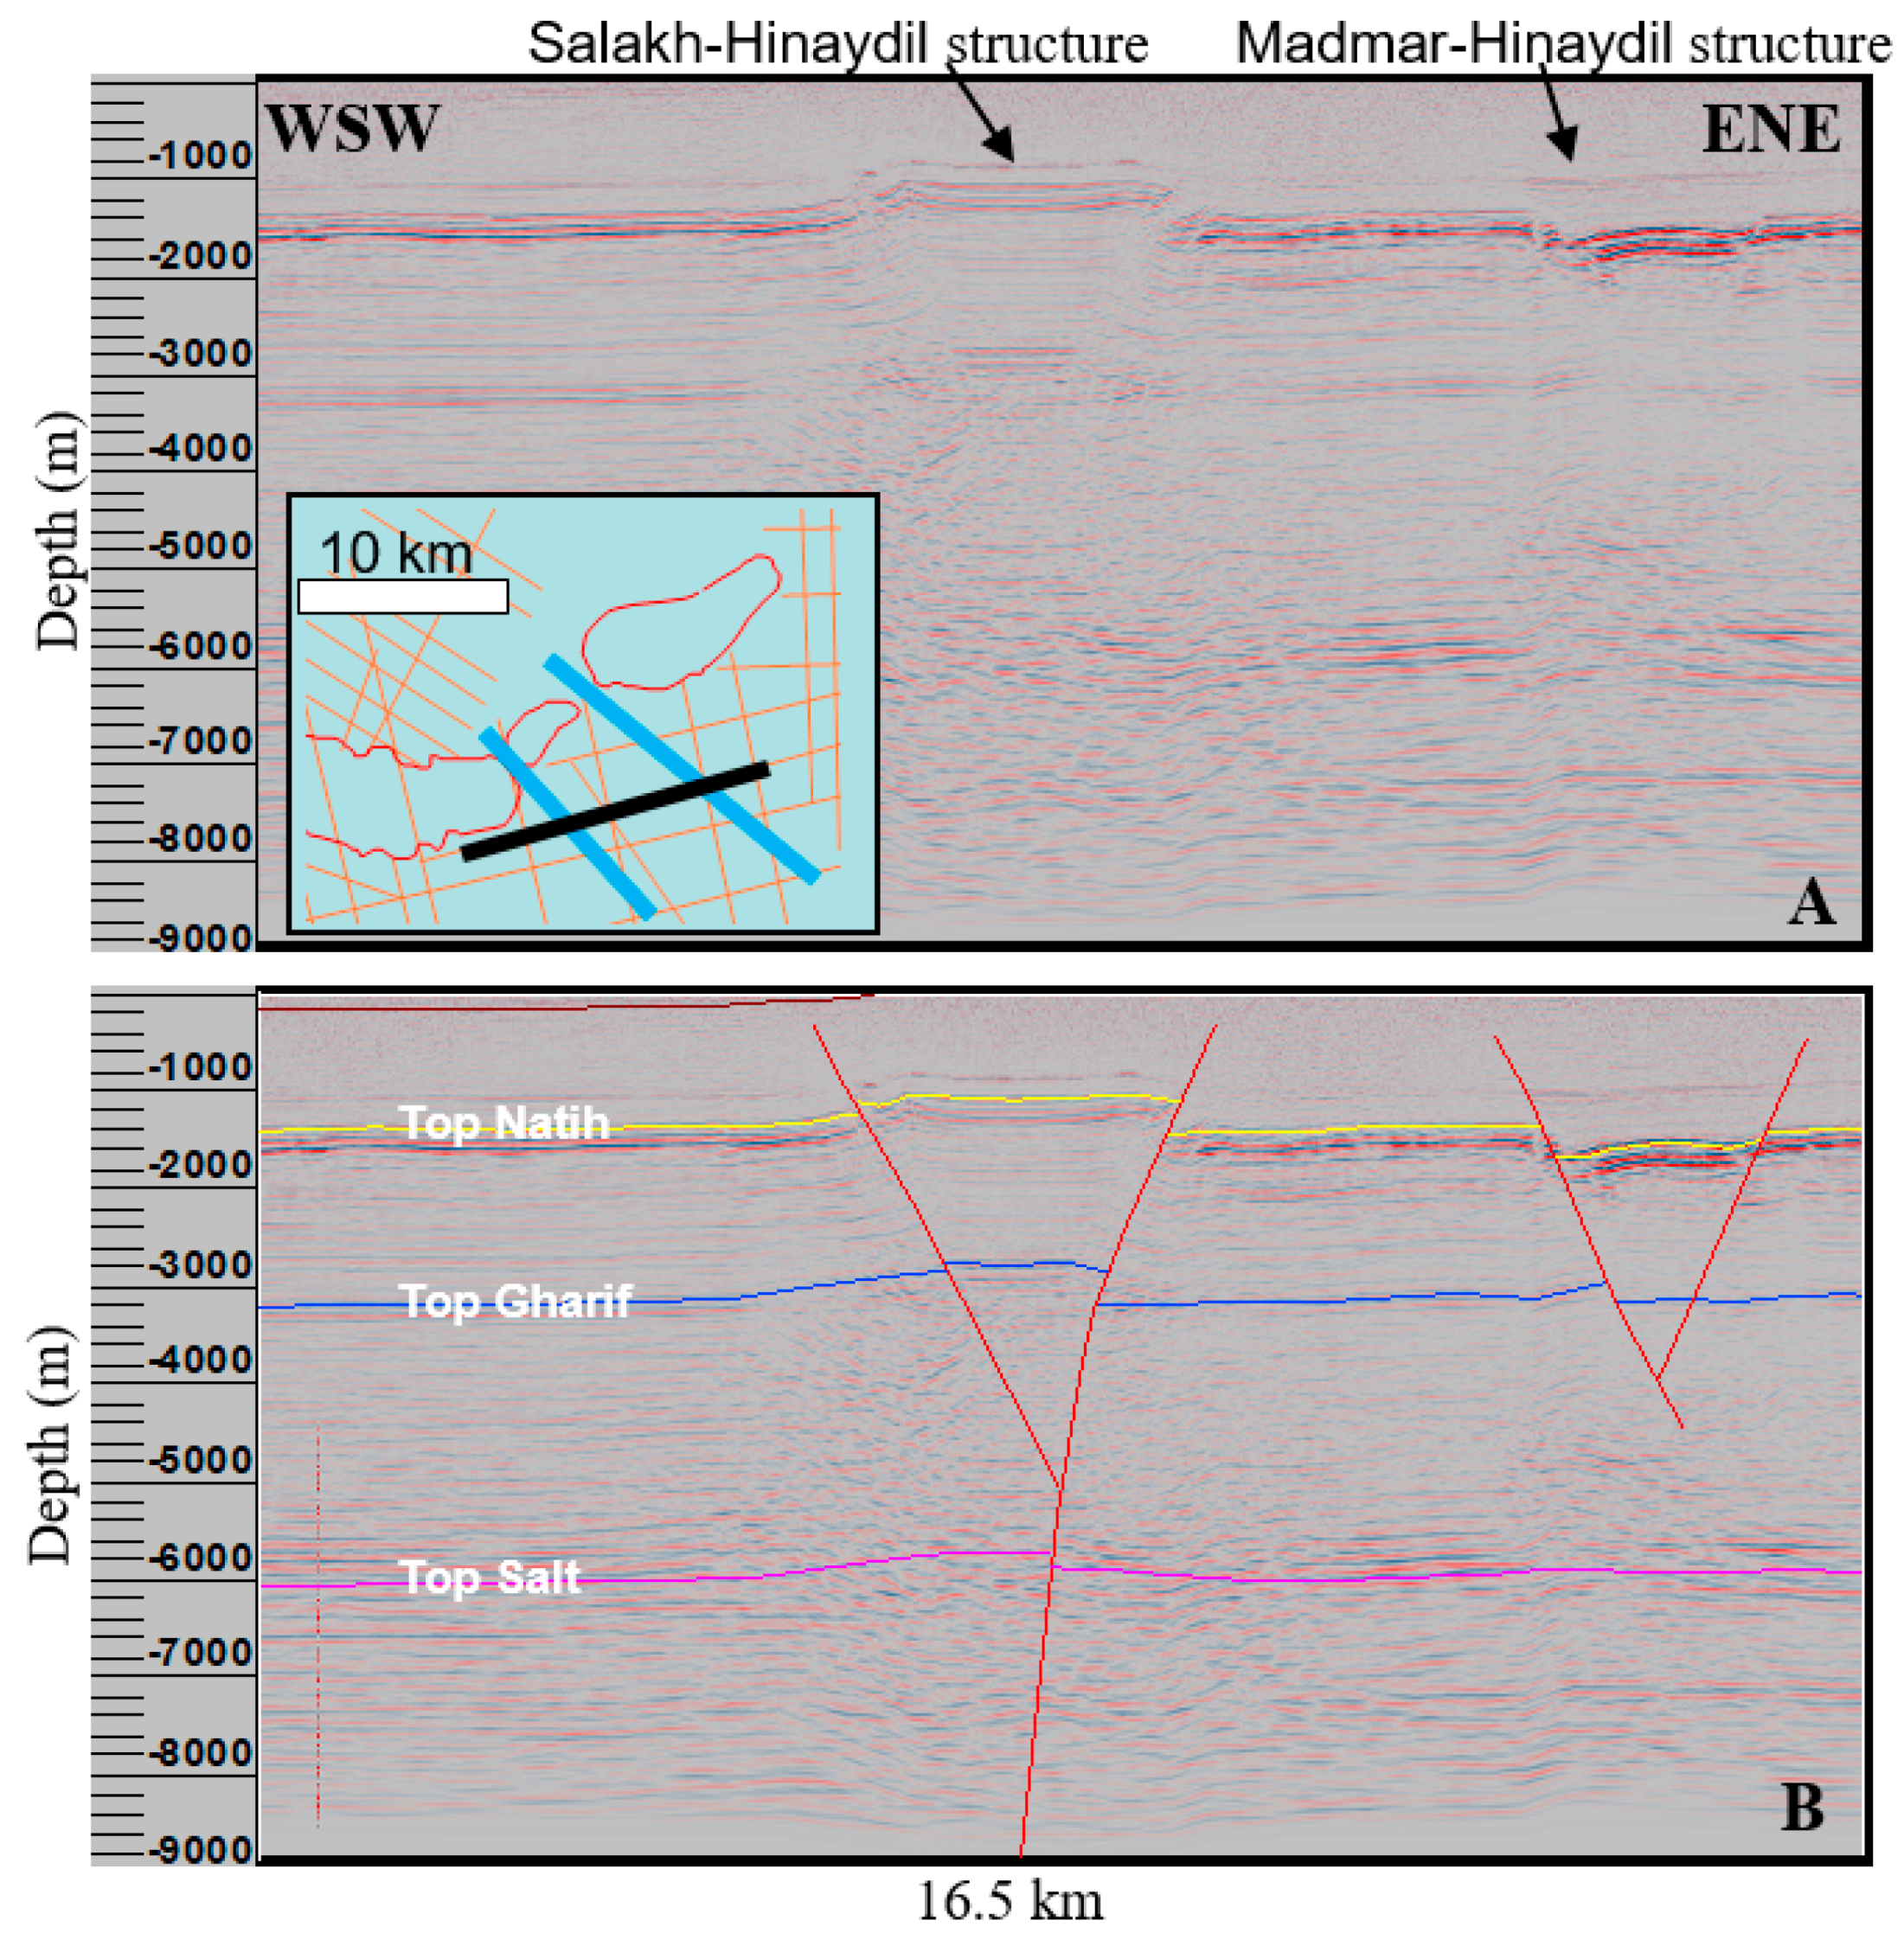
5.4. Seismic Section 4 (Salakh Hinaydil and Madmar-Hinaydil gaps)
6. Interpretation and Discussion
6.1. Interpretation and Discussion Mechanism of Deformation
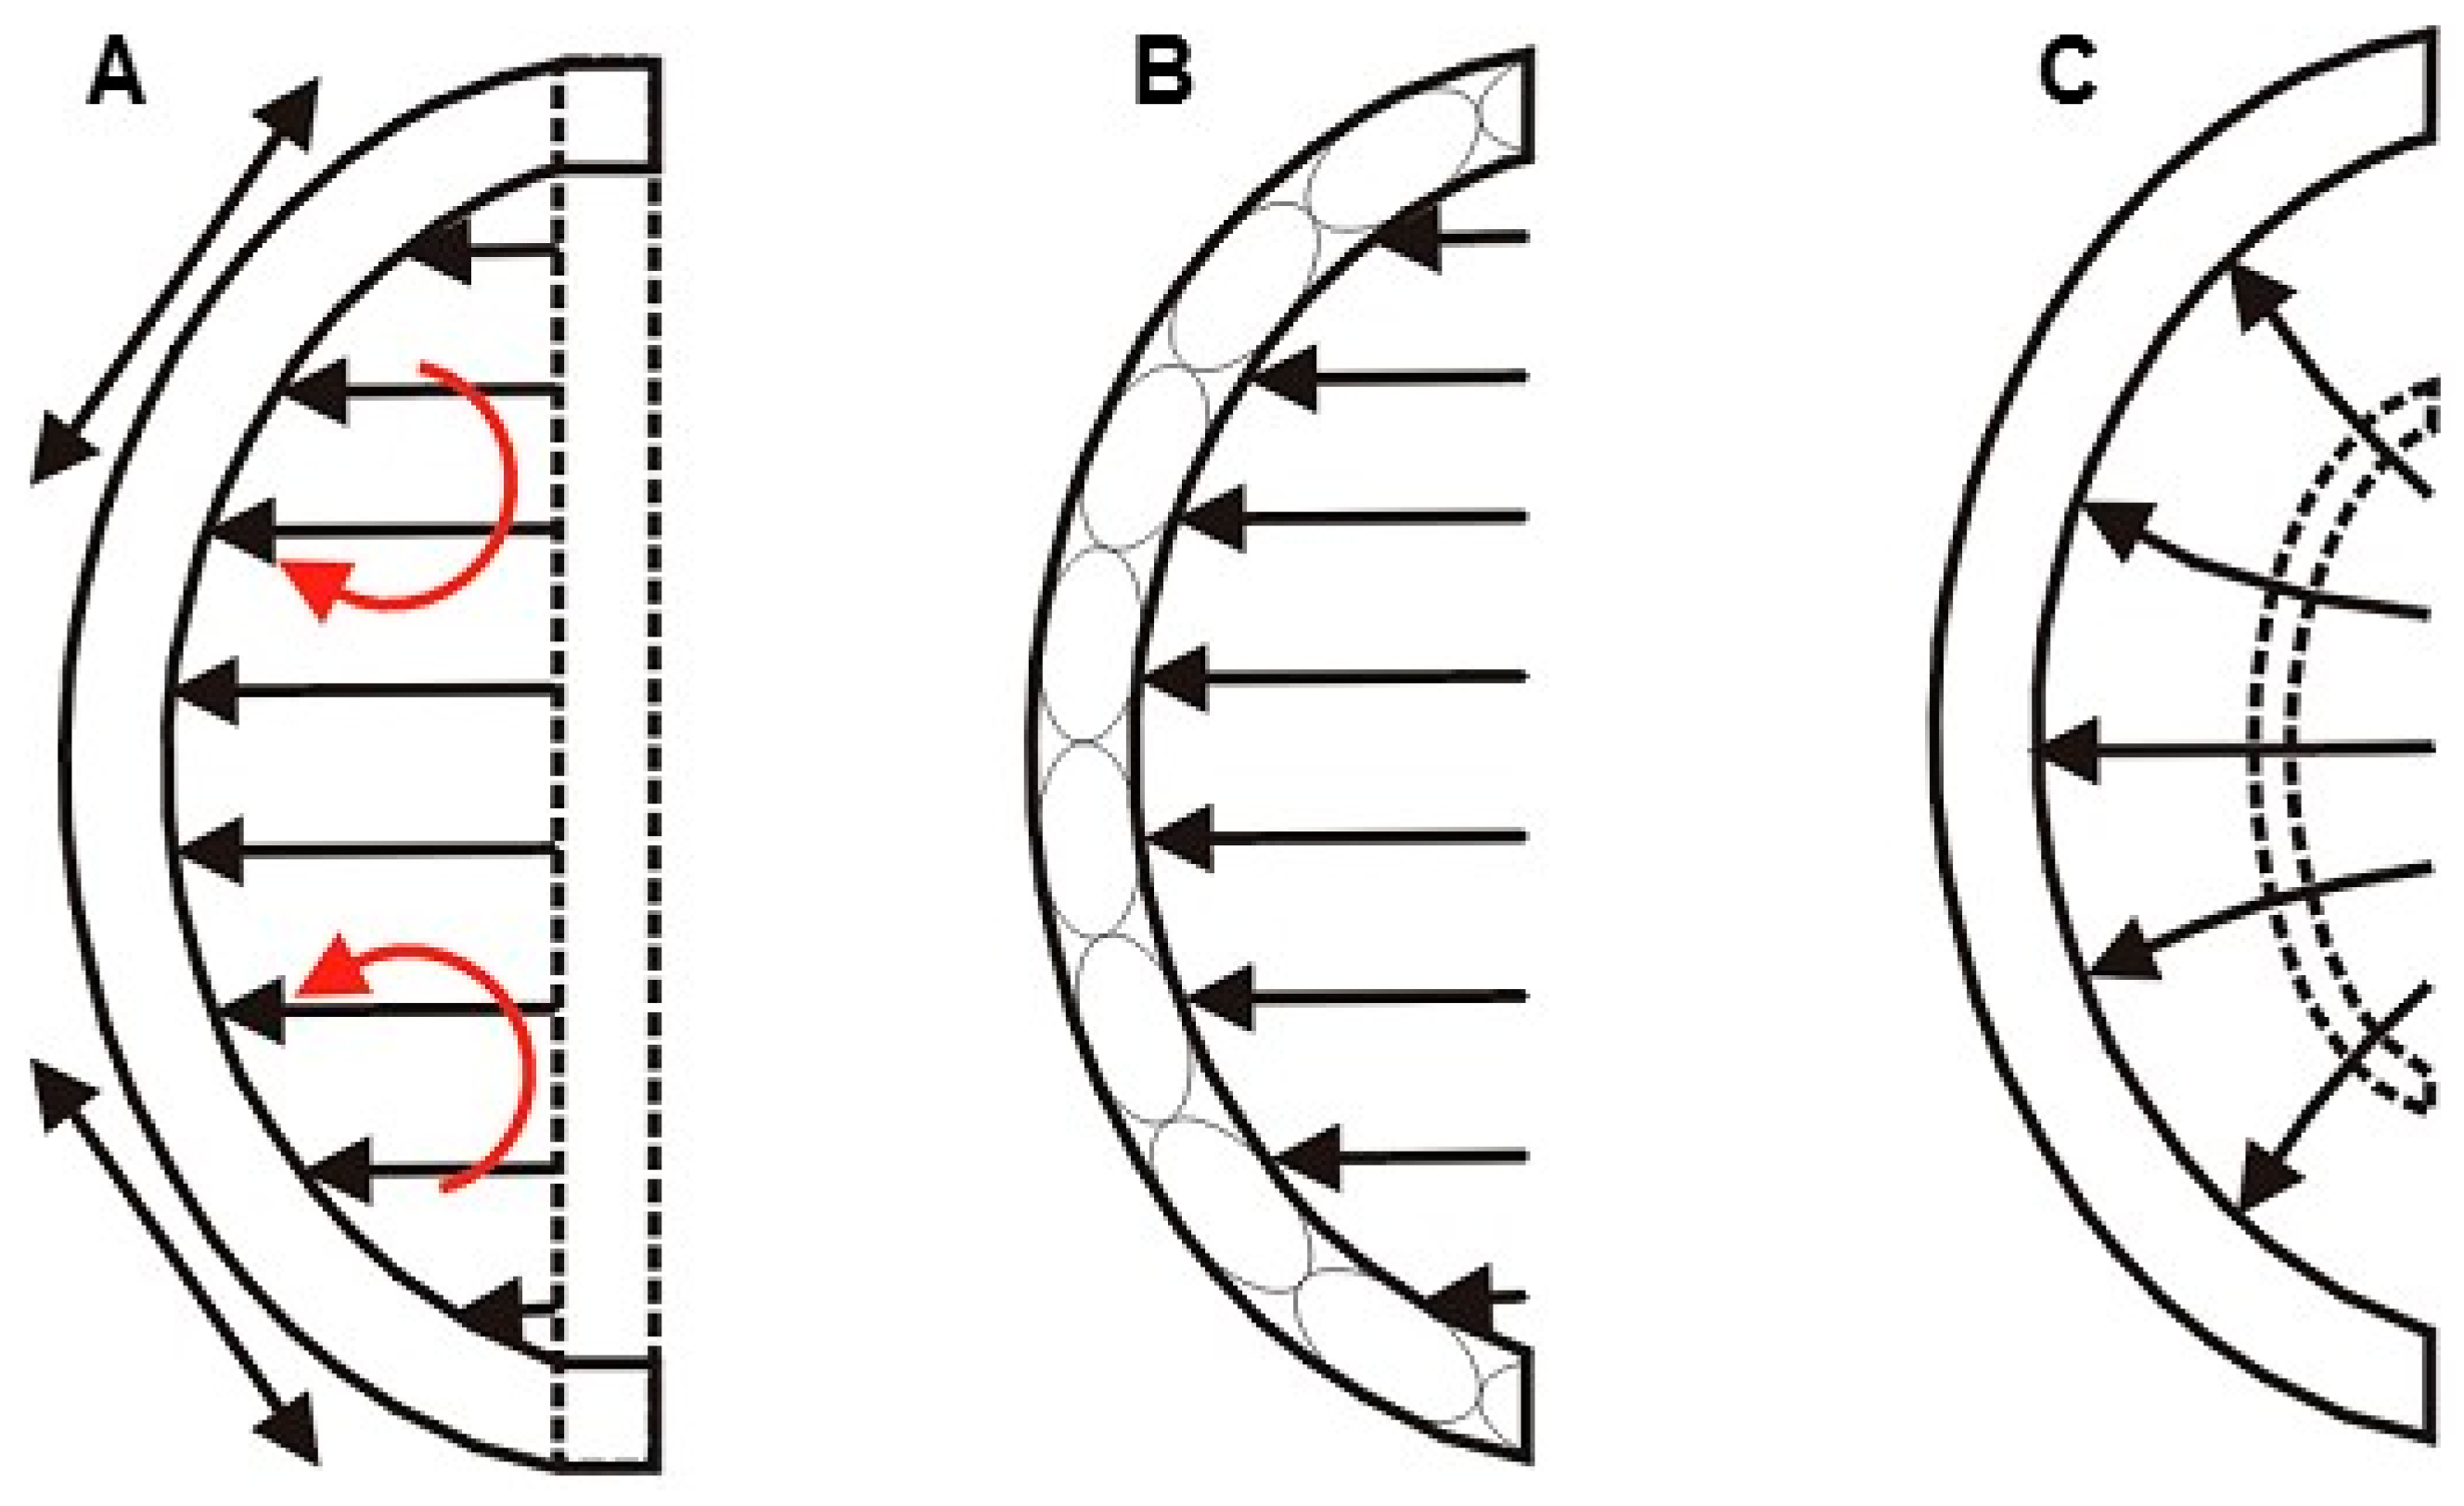
6.1.1. Arcuate Fold and Thrust Belt Models
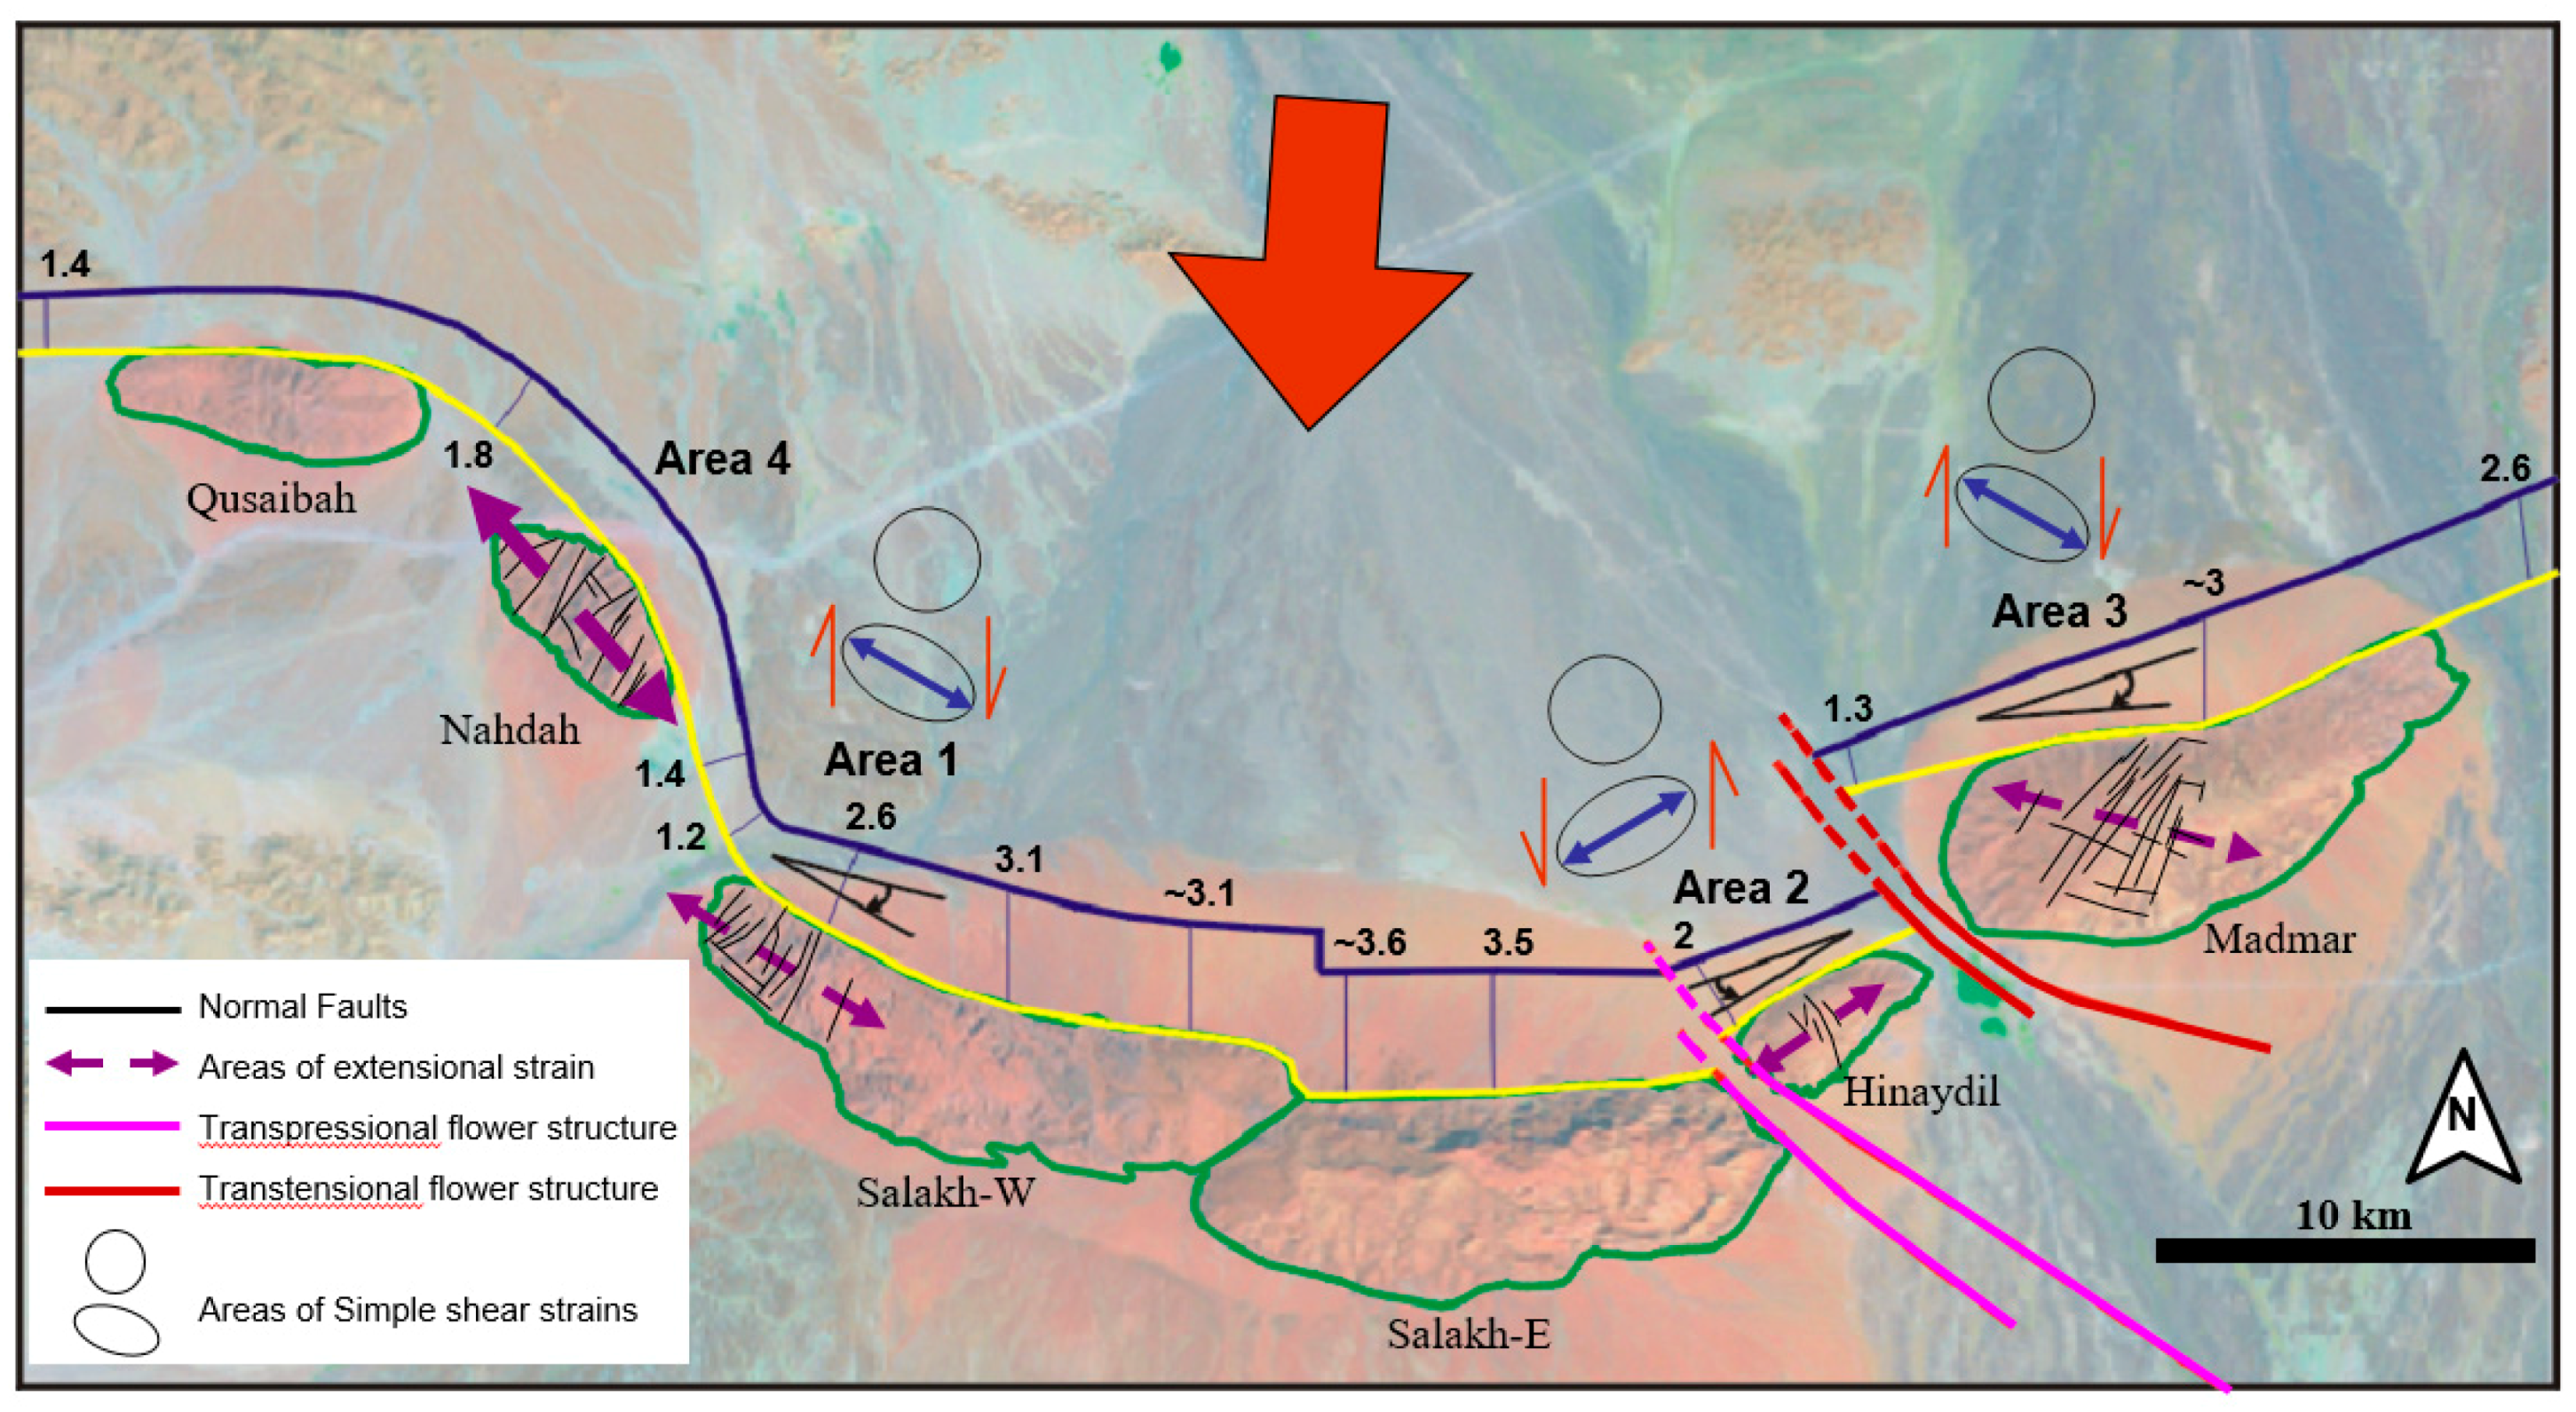
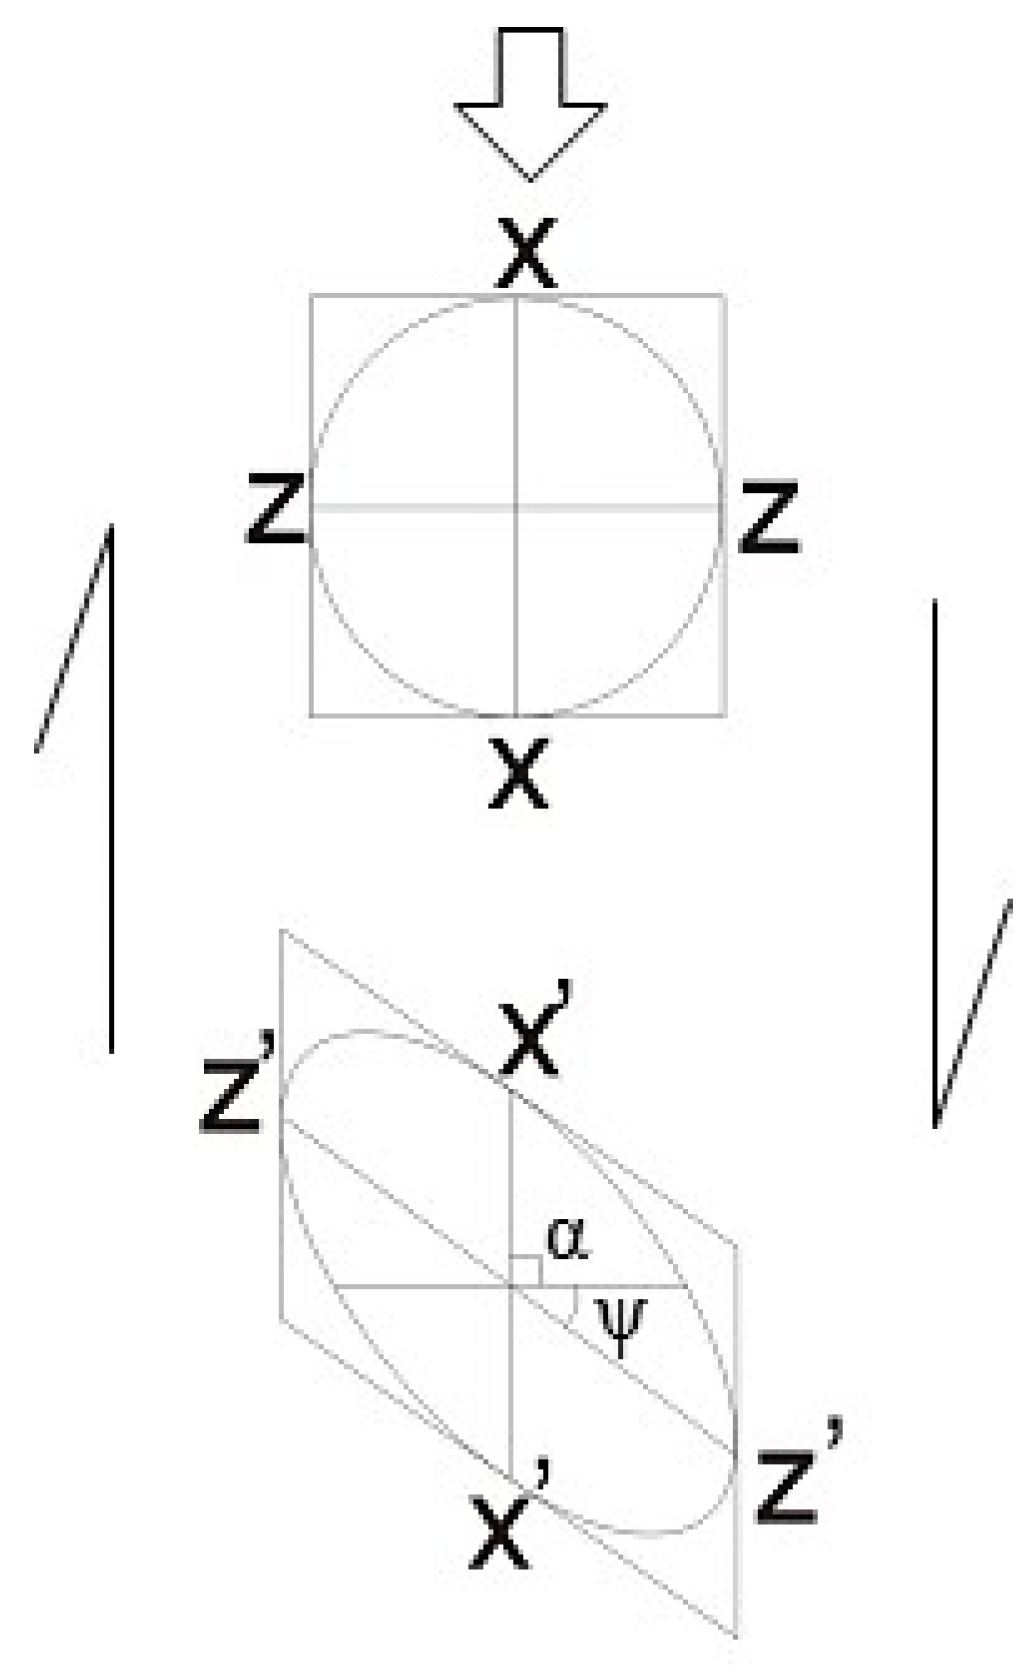
6.1.2. Map View Restoration of the Salakh Arch
6.1.3. Arc-Parallel Extension in Areas 1, 2 and 3
6.1.4. Arc-Parallel Extension in Area 4
6.2. Main Controls on the Position and Geometry of the Salakh Arch
6.2.1. Thickness Variation of Incompetent Formations along the Salakh Arch
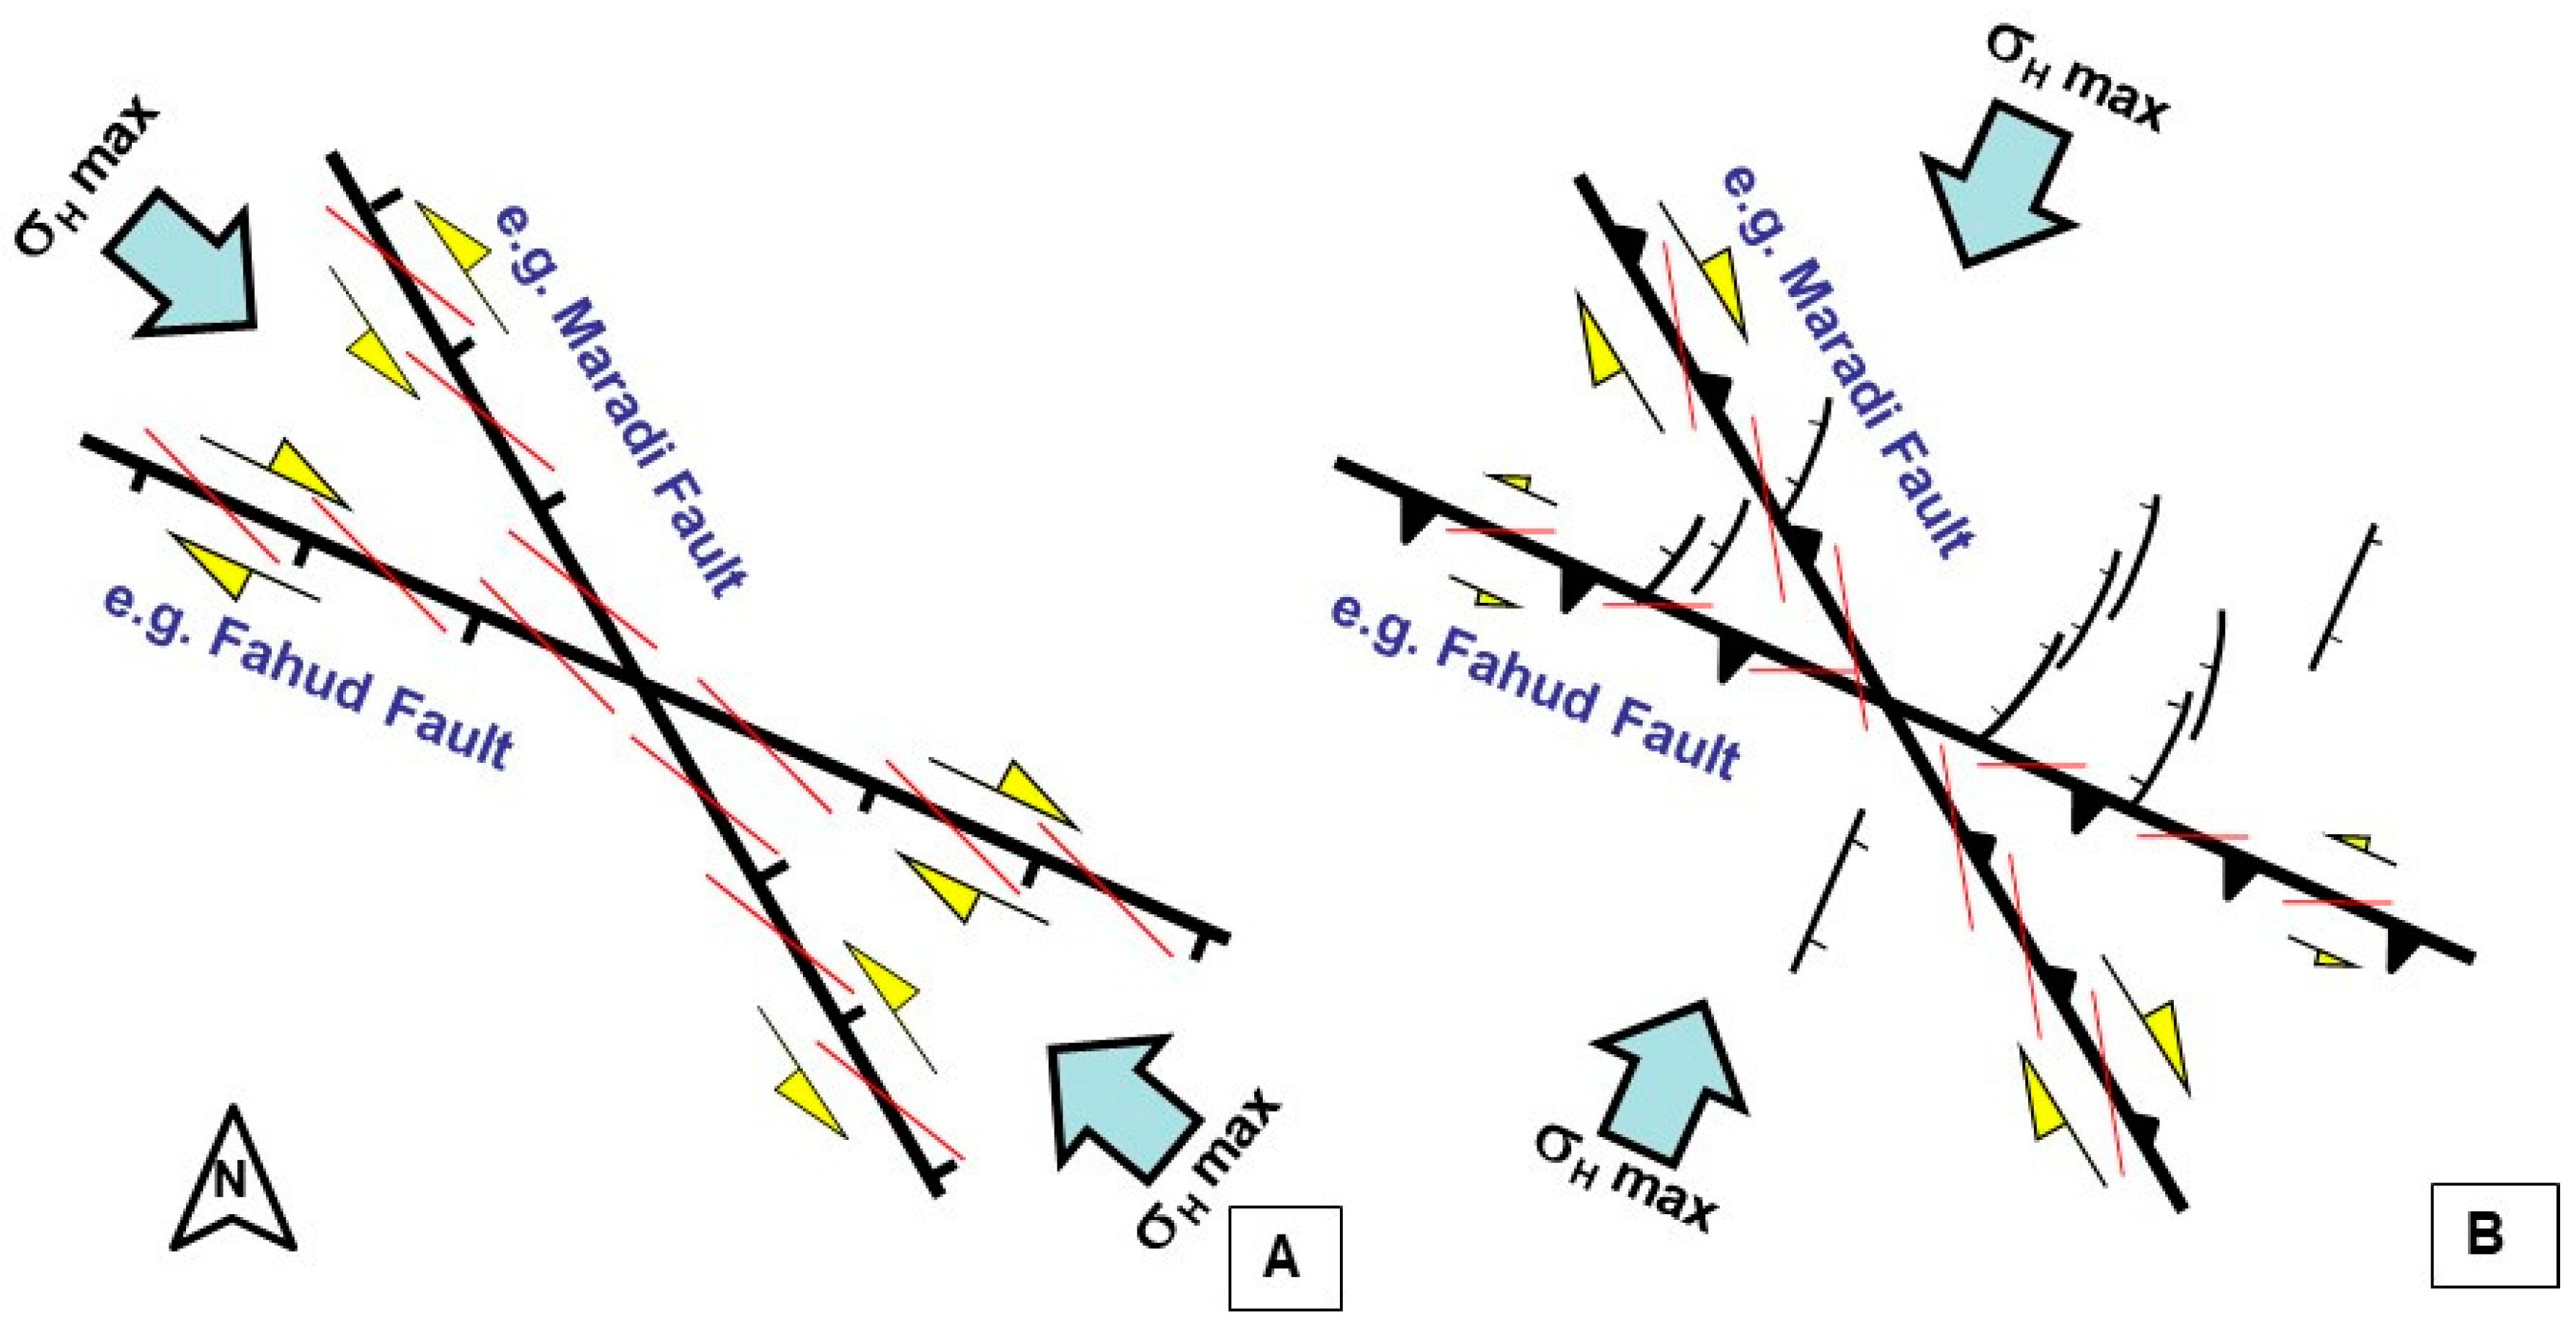
6.2.2. Pre-Existing Faults
6.2.3. Allochthonous Units
6.2.4. Structural Evolution of the Fahud Salt Basin
7. Timing of Deformation
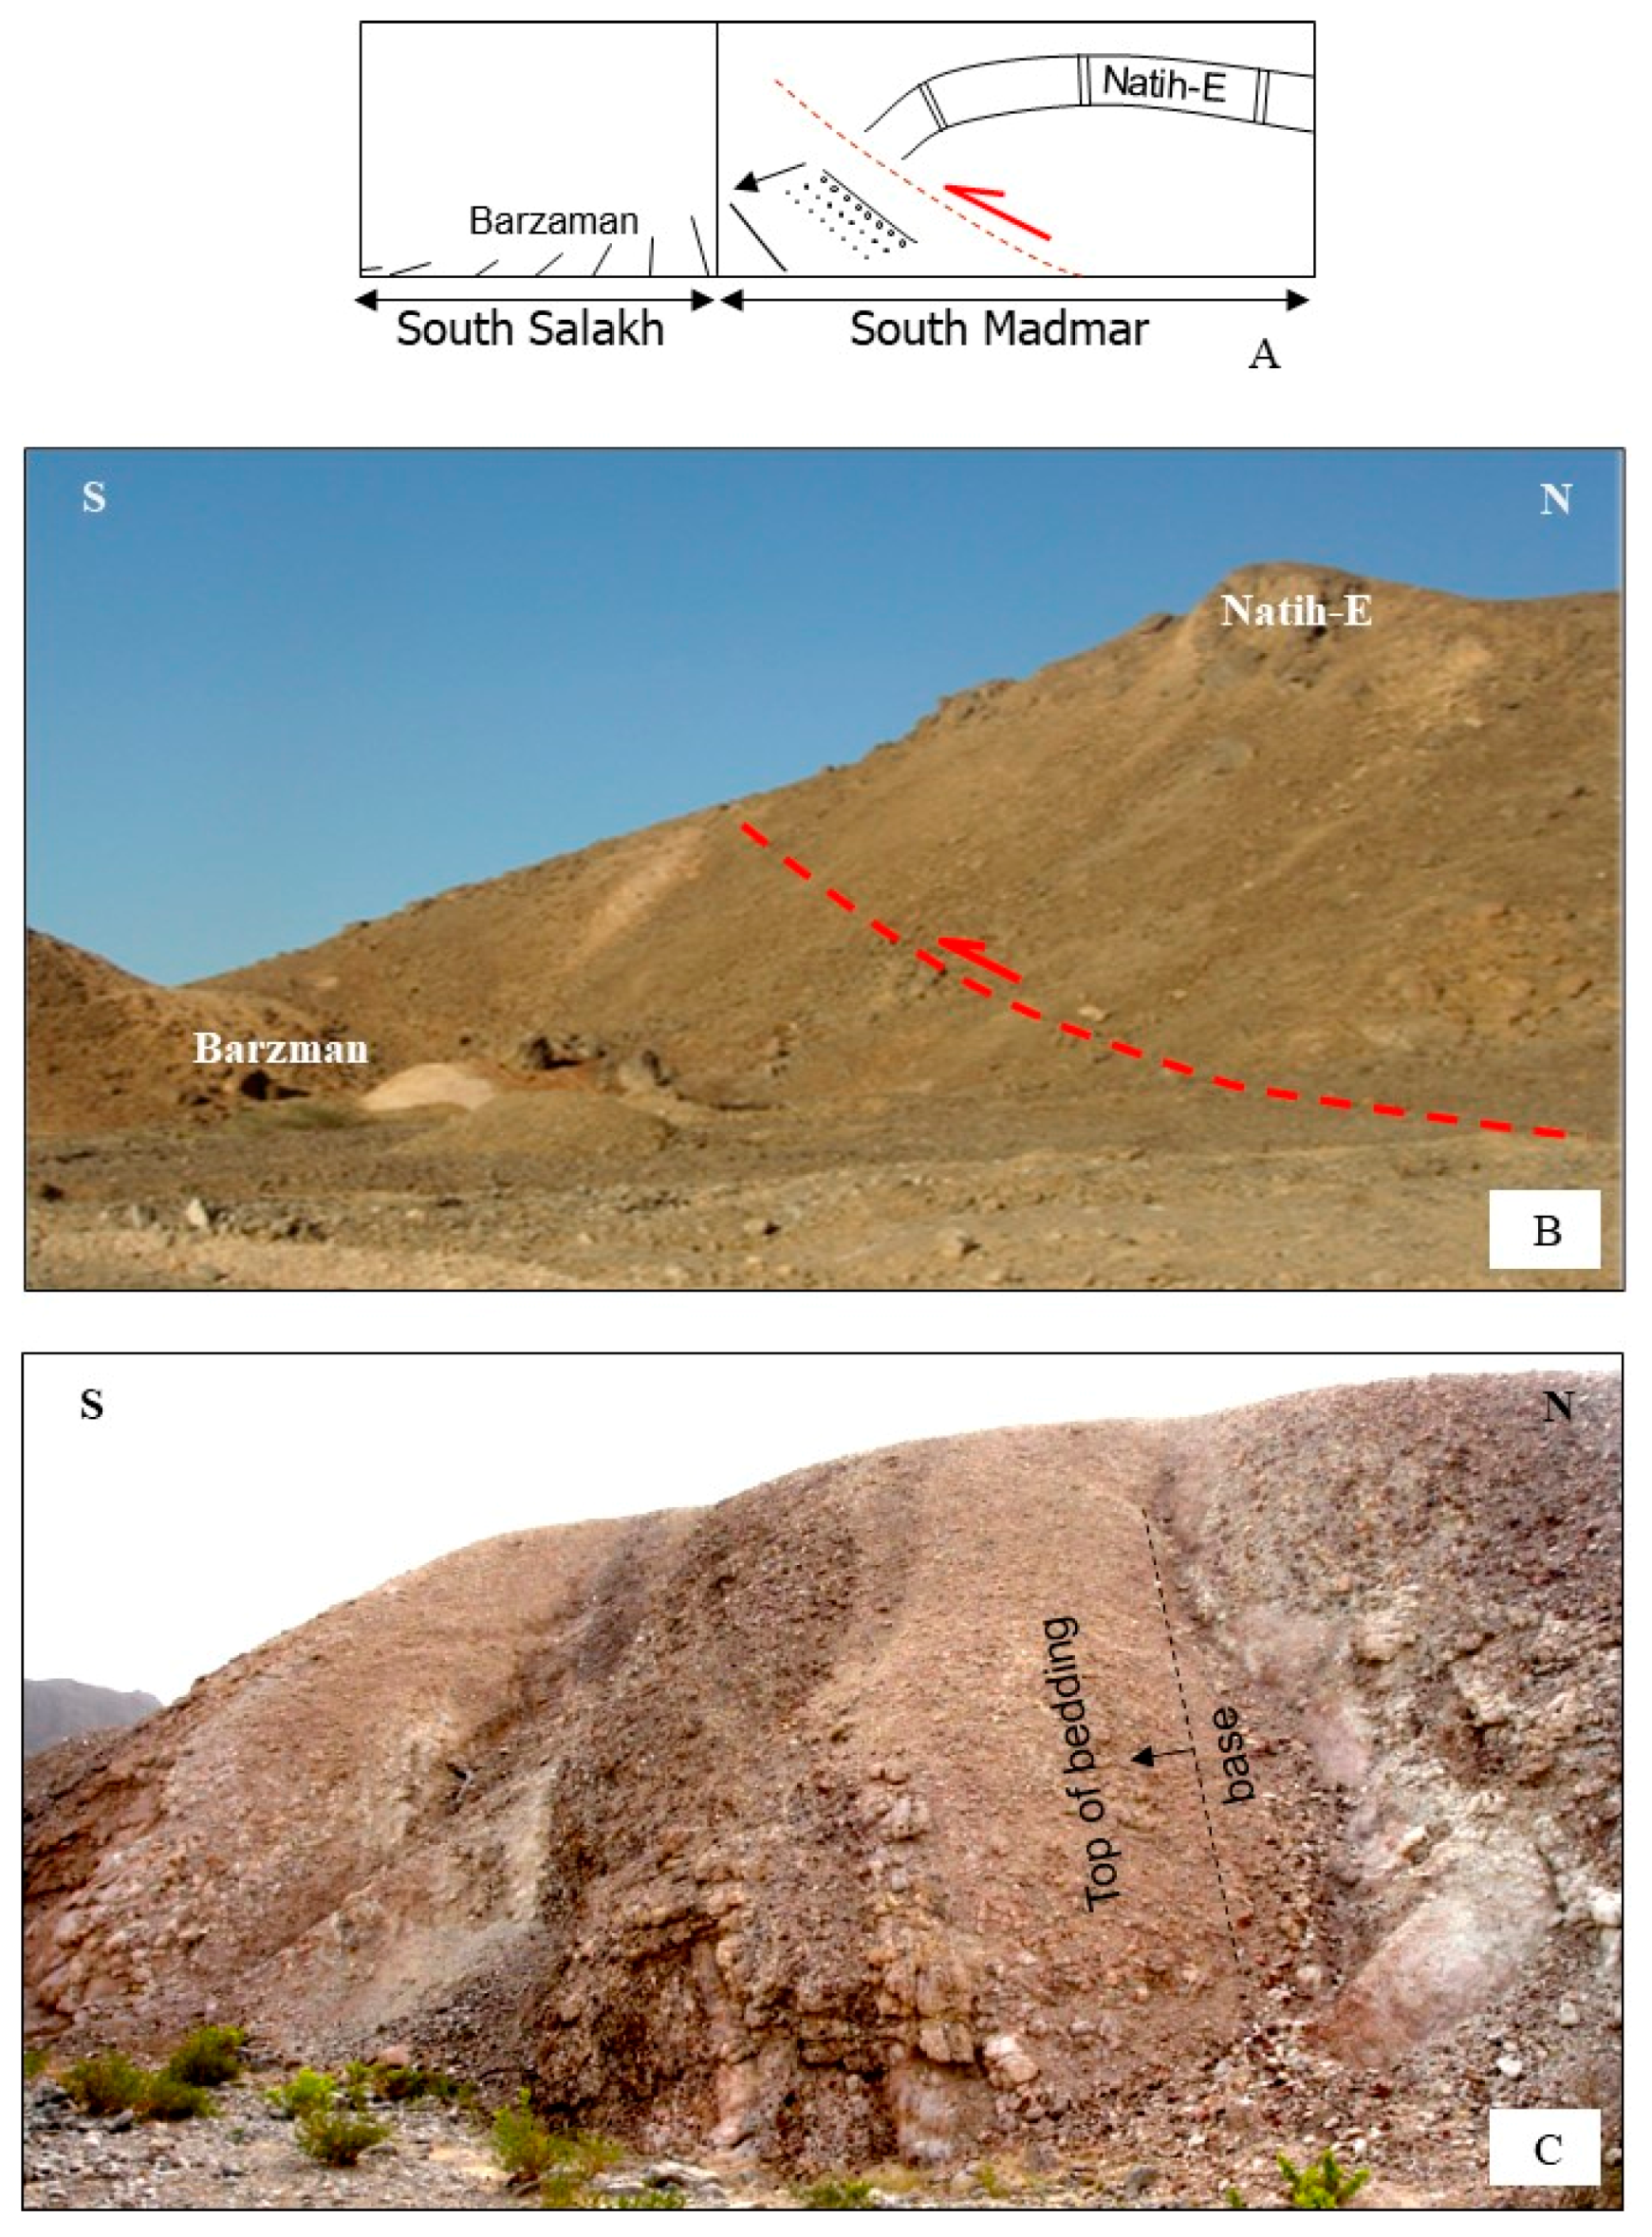
- On the southern limit of Jebel Madmar, Natih Formation was found to overthrust the lower part of Barzaman Formation. The field data south of Jebel Salakh also indicate that the Barzaman Formation is highly deformed and tilted (Figure 23). A similar observation is seen in the Natih and Fahud hydrocarbon fields where folding affected the Barzaman Formation.
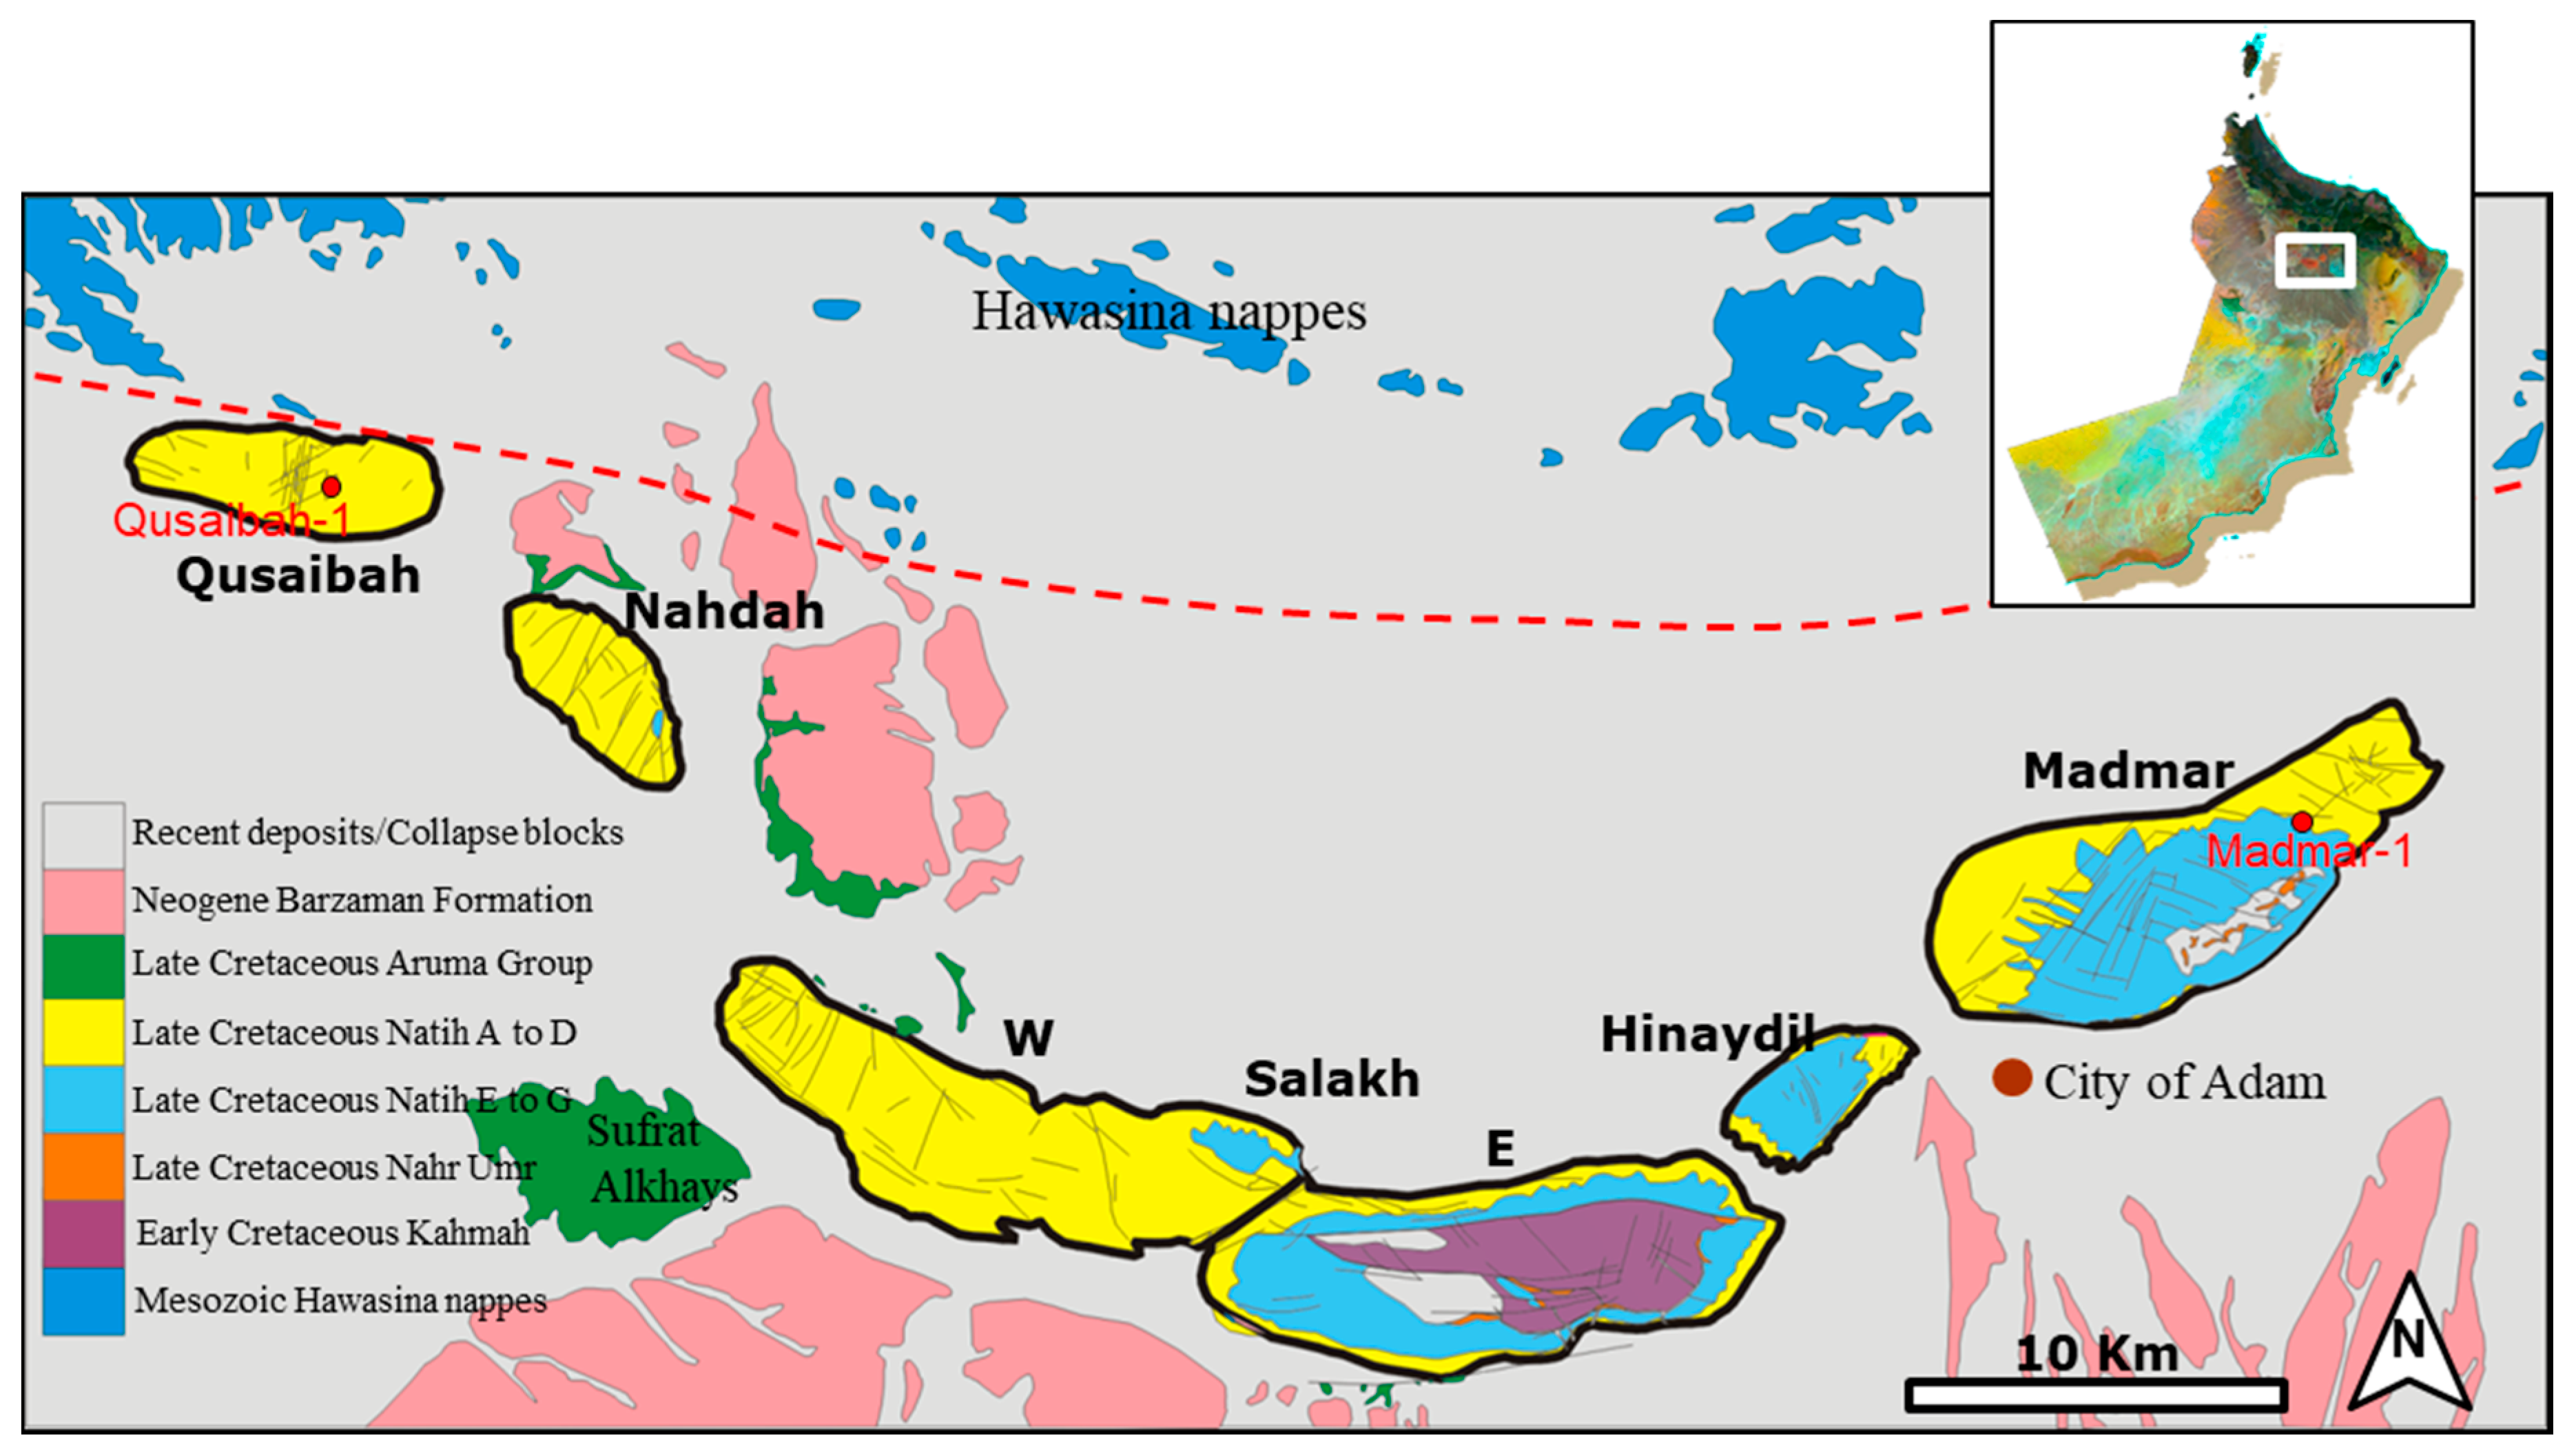
- The existence of Simsima clasts (the upper part of Aruma Formation that was deposited during the end of Late Cretaceous) in Sufrat Alkhays area (see Figure 1 and Figure 2), which derived from the Simsima shelf edge some distance to the South, and the absence of Natih-derived clasts from the Salakh area [43] indicate that the area had not developed into the present positive geomorphological feature during the Late Cretaceous and was covered by Aruma deposits at that time.
8. Conclusions
Funding
Acknowledgments
Conflicts of Interest
References
- Gunzenhauser, B. A Review of the Salakh Arch Structures; Confidential Report PDO Exploration Report NO. 85/1; Petroleum Development Oman: Muscat, Oman, 1985. [Google Scholar]
- Willis, I.A.G. Qusaybah-1 and an appraisal of the Salakh Arch; Confidential report PDO Exploration Report No.66; Petroleum Development Oman: Muscat, Oman, 1970. [Google Scholar]
- Al-Kindi, M.H.; Richard, P.D. The main structural styles of the hydrocarbon reservoirs in Oman. Geol. Soc. Lond. Spec. Publ. 2014, 392, 409–445. [Google Scholar] [CrossRef]
- Dercourt, J.; Zonenshain, L.P.; Ricou, L.E.; Kazmin, V.G.; Le Pichon, X.; Knipper, A.L.; Grandjacquet, C.; Sbortshikov, I.M.; Geyssant, J.; Lepvrier, C.; et al. Geological evolution of the Tethys belt from the Atlantic to the Pamirs since the Lias. Tectonophysics 1986, 123, 241–315. [Google Scholar] [CrossRef]
- Glennie, K.W. The Geology of the Oman Mountains: An Outline of Their Origin; Scientific Press: Beaconsfield, UK, 1995; Volume 314. [Google Scholar]
- Hanna, S.S.; Nolan, S.C. The Maradi fault zone: Evidence of Late Neogene tectonics in the Oman mountains. J. Geol. Soc. 1989, 146, 867–871. [Google Scholar] [CrossRef]
- Glennie, K.W.; Boeuf, M.; Hughes-Clarke, M.S.; Pilaar, W.E.H.; Reinhardt, B. Geology of the Oman Mountains; Verh. Koninklijk Nederlands Geologisch Mijnbouwkundig Genootschap, 1974; Available online: https://pascal-francis.inist.fr/vibad/index.php?action=getRecordDetail&idt=PASCALGEODEBRGM7520053086 (accessed on 26 February 2020).
- Skelton, P.W.; Nolan, S.C.; Scott, R.W. The Maastrichtian transgression onto the northwestern flank of the Proto-Oman Mountains: Sequences of rudist-bearing beach to open shelf facies. Geol. Soc. Lond. Spec. Publ. 1990, 49, 521–547. [Google Scholar] [CrossRef]
- Romine, K.; Stuart-Smith, J.P.; Aitken, R.; Archer, S.; Fryberger, S.; Petrovich, T.; Loutit, J.; Teasdale, C.; Foss, M. North Oman Haima-Huqf Tectonostratigraphy Study; SRK Confidential Report PDO; Petroleum Development Oman: Muscat, Oman, 2004. [Google Scholar]
- Warburton, J.; Burnhill, T.J.; Graham, R.H.; Isaac, K.P. The evolution of the Oman Mountains foreland basin. Geol. Soc. Lond. Spec. Publ. 1990, 49, 419–427. [Google Scholar] [CrossRef]
- Filbrandt, J.B.; Al-Dhahab, S.; Al-Habsy, A.; Harris, K.; Keating, J.; Al-Mahruqi, S.; Ozkaya, S.I.; Richard, P.D.; Robertson, T. Kinematic interpretation and structural evolution of North Oman, Block 6, since the Late Cretaceous and implications for timing of hydrocarbon migration into Cretaceous reservoirs. GeoArabia 2006, 11, 97–140. [Google Scholar]
- Loosveld, R.J.; Bell, A.; Terken, J.J. The tectonic evolution of interior Oman. GeoArabia 1996, 1, 28–51. [Google Scholar]
- Ferrill, D.A.; Groshong, R.H., Jr. Kinematic model for the curvature of the northern Subalpine Chain, France. J. Struct. Geol. 1993, 15, 523–541. [Google Scholar] [CrossRef]
- Searle, M.P.; James, N.P.; Calon, T.J.; Smewing, J.D. Sedimentological and structural evolution of the Arabian continental margin in the Musandam Mountains and Dibba zone, United Arab Emirates. Geol. Soc. Am. Bull. 1983, 94, 1381–1400. [Google Scholar] [CrossRef]
- Fournier, M.; Lepvrier, C.; Razin, P.; Jolivet, L. Post-obduction extension in the Oman Mountains and subsequent compression. GeoArabia 2006, 4, 17–40. [Google Scholar]
- Carbon, D. Tectonique Post-Obduction Des Montagnes d’Oman Dans Le Cadre Del La Convergence Arabie-Iran. Ph.D. Thesis, Universite Montpellier II (Sciences et techniques du Languedoc), Montpellier, French, 1996. [Google Scholar]
- Boote, D.R.D.; Mou, D.; Waite, R.I. Structural evolution of the Suneinah foreland, central Oman Mountains. Geol. Soc. Lond. Spec. Publ. 1990, 49, 397–418. [Google Scholar] [CrossRef]
- Hanna, S.S. The Alpine deformation of the central Oman Mountains. Geol. Soc. Lond. Spec. Publ. 1990, 49, 341–359. [Google Scholar] [CrossRef]
- Mount, V.S.; Crawford, R.I.; Bergman, S.C. Regional structural style of the central and southern Oman Mountains: Jebel Akhdar, Saih Hatat, and the northern Ghaba Basin. GeoArabia 1998, 3, 475–490. [Google Scholar]
- Mann, A.; Hanna, S.S.; Nolan, S.C. The post-Campanian tectonic evolution of the central Oman Mountains: Tertiary extension of the eastern Arabian margin. Geol. Soc. Lond. Spec. Publ. 1990, 49, 549–563. [Google Scholar] [CrossRef]
- Al-Lazki, A.I.; Seber, D.; Sandvol, E.; Barazangi, M. A crustal transect across the Oman Mountains on the eastern margin of Arabia. GeoArabia 2002, 7, 47–78. [Google Scholar]
- Angelier, J.; Mechler, P. Sur une méthode graphique de recherche des contraintes principales également utilisable en tectonique et en séismologie: La méthode des dièdres droits. Bulletin de la Société géologique de France 1977, 7, 1309–1318. [Google Scholar] [CrossRef]
- Breton, J.P.; Béchennec, F.; Le Métour, J.; Moen-Maurel, L.; Razin, P. Eoalpine (Cretaceous) evolution of the Oman Tethyan continental margin: Insights from a structural field study in Jabal Akhdar (Oman Mountains). GeoArabia 2004, 9, 41–58. [Google Scholar]
- Reiter, F.; Acs, P. TectonicsFP (Demo Version). Available online: www.tectonicsfp.com (accessed on 26 June 2019).
- Apotria, T.G. Thrust sheet rotation and out-of-plane strains associated with oblique ramps: An example from the Wyoming salient USA. J. Struct. Geol. 1995, 17, 647–662. [Google Scholar] [CrossRef]
- Chamberlin, R.T. The Appalachian folds of central Pennsylvania. J. Geol. 1910, 18, 228–251. [Google Scholar] [CrossRef]
- Hindle, D.; Burkhard, M. Strain, displacement and rotation associated with the formation of curvature in fold belts; The example of the Jura arc. J. Struct. Geol. 1999, 21, 1089–1101. [Google Scholar] [CrossRef]
- Carey, S.W. The orocline concept in geotectonics-Part, I. In Proceedings of the Royal Society of Tasmania; 1955; Volume 89, pp. 255–288. Available online: https://eprints.utas.edu.au/13965/ (accessed on 26 February 2020).
- Marshak, S. Kinematics of orocline and arc formation in thin-skinned orogens. Tectonics 1988, 7, 73–86. [Google Scholar] [CrossRef]
- Marshak, S.; Wilkerson, M.S.; Hsui, A.T. Generation of curved fold-thrust belts: Insight from simple physical and analytical models. In Thrust Tectonics; Springer: Berlin/Heidelberg, Germany, 1992; pp. 83–92. [Google Scholar]
- Kwon, S.; Mitra, G.; Sussman, A.J.; Weil, A.B. Strain distribution, strain history, and kinematic evolution associated with the formation of arcuate salients in fold-thrust belts: The example of the Provo salient, Sevier orogen, Utah. Orog. Curv. Integr. Paleomagn. Struct. Anal. Geol. Soc. Am. Spec. Pap. 2004, 383, 205–223. [Google Scholar]
- Macedo, J.; Marshak, S. Controls on the geometry of fold-thrust belt salients. Geol. Soc. Am. Bull. 1999, 111, 1808–1822. [Google Scholar] [CrossRef]
- Affolter, T.; Gratier, J.P. Map view retrodeformation of an arcuate fold-and-thrust belt: The Jura case. J. Geophys. Res. Solid Earth 2004, 109 (B3). [Google Scholar] [CrossRef]
- Casas, A.M.; Simon, J.L.; Seron, F.J. Stress deflection in a tectonic compressional field: A model for the Northwestern Iberian Chain, Spain. J. Geophys. Res. Solid Earth 1992, 97, 7183–7192. [Google Scholar] [CrossRef]
- Sussman, A.J.; Butler, R.F.; Dinarès-Turell, J.; Vergés, J. Vertical-axis rotation of a foreland fold and implications for orogenic curvature: An example from the Southern Pyrenees, Spain. Earth Plan. Sci. Lett. 2004, 218, 435–449. [Google Scholar] [CrossRef]
- Ramsay, J.G.; Huber, M.I. The Techniques of Modern Structural Geology; Folds and fractures Academic press: Amsterdam, The Netherlands, 1987; Volume 2. [Google Scholar]
- Apotria, T.G.; Snedden, W.T.; Spang, J.H.; Wiltschko, D.V. Kinematic models of deformation at an oblique ramp. In Thrust Tectonics; Springer: Berlin/Heidelberg, Germany, 1992; pp. 141–154. [Google Scholar]
- Coward, M.P.; Potts, G.J. Complex strain patterns developed at the frontal and lateral tips to shear zones and thrust zones. J. Struct. Geol. 1983, 5, 383–399. [Google Scholar] [CrossRef]
- Butler, R.W. The terminology of structures in thrust belts. J. Struct. Geol. 1982, 4, 239–245. [Google Scholar] [CrossRef]
- Boyer, S.E. Sedimentary basin taper as a factor controlling the geometry and advance of thrust belts. Am. J. Sci. 1995, 295, 1220–1254. [Google Scholar] [CrossRef]
- Lacombe, O.; Mouthereau, F.; Angelier, J.; Chu, H.T.; Lee, J.C. Frontal belt curvature and oblique ramp development at an obliquely collided irregular margin: Geometry and kinematics of the NW Taiwan fold-thrust belt. Tectonics 2003, 22, 1025–1034. [Google Scholar] [CrossRef]
- Paulsen, T.; Marshak, S. Origin of the Uinta recess, Sevier fold–thrust belt, Utah: Influence of basin architecture on fold–thrust belt geometry. Tectonophysics 1999, 312, 203–216. [Google Scholar] [CrossRef]
- Hanna, S.S.; Smewing, J. The stratigraphy and structure of the Madmar-Salakh Qusaybah Range and Natih-Fahud Area in the Oman Mountains. Sci. Technol. 1996, 1, 1–19. [Google Scholar]
- Béchennec, F.; Wyns, R.; Roger, J.; Le Metour, J.; Chevrel, S. Geological Map of Nazwa NF40-07. Scale 1/250,000, Explanatory Notes; Directorate General of Minerals, Ministry of Petroleum and Minerals: Muscate, Oman, 1992.


© 2020 by the author. Licensee MDPI, Basel, Switzerland. This article is an open access article distributed under the terms and conditions of the Creative Commons Attribution (CC BY) license (http://creativecommons.org/licenses/by/4.0/).
Share and Cite
Al-Kindi, M.H.N. Timing, Mechanics and Controls of the Evolution of the Southernmost Part of the Oman Mountains: The Salakh Arch. Geosciences 2020, 10, 95. https://doi.org/10.3390/geosciences10030095
Al-Kindi MHN. Timing, Mechanics and Controls of the Evolution of the Southernmost Part of the Oman Mountains: The Salakh Arch. Geosciences. 2020; 10(3):95. https://doi.org/10.3390/geosciences10030095
Chicago/Turabian StyleAl-Kindi, Mohammed H. N. 2020. "Timing, Mechanics and Controls of the Evolution of the Southernmost Part of the Oman Mountains: The Salakh Arch" Geosciences 10, no. 3: 95. https://doi.org/10.3390/geosciences10030095
APA StyleAl-Kindi, M. H. N. (2020). Timing, Mechanics and Controls of the Evolution of the Southernmost Part of the Oman Mountains: The Salakh Arch. Geosciences, 10(3), 95. https://doi.org/10.3390/geosciences10030095