A Machine Learning-Based Approach for Wildfire Susceptibility Mapping. The Case Study of the Liguria Region in Italy

 , , and
Abstract
1. Introduction
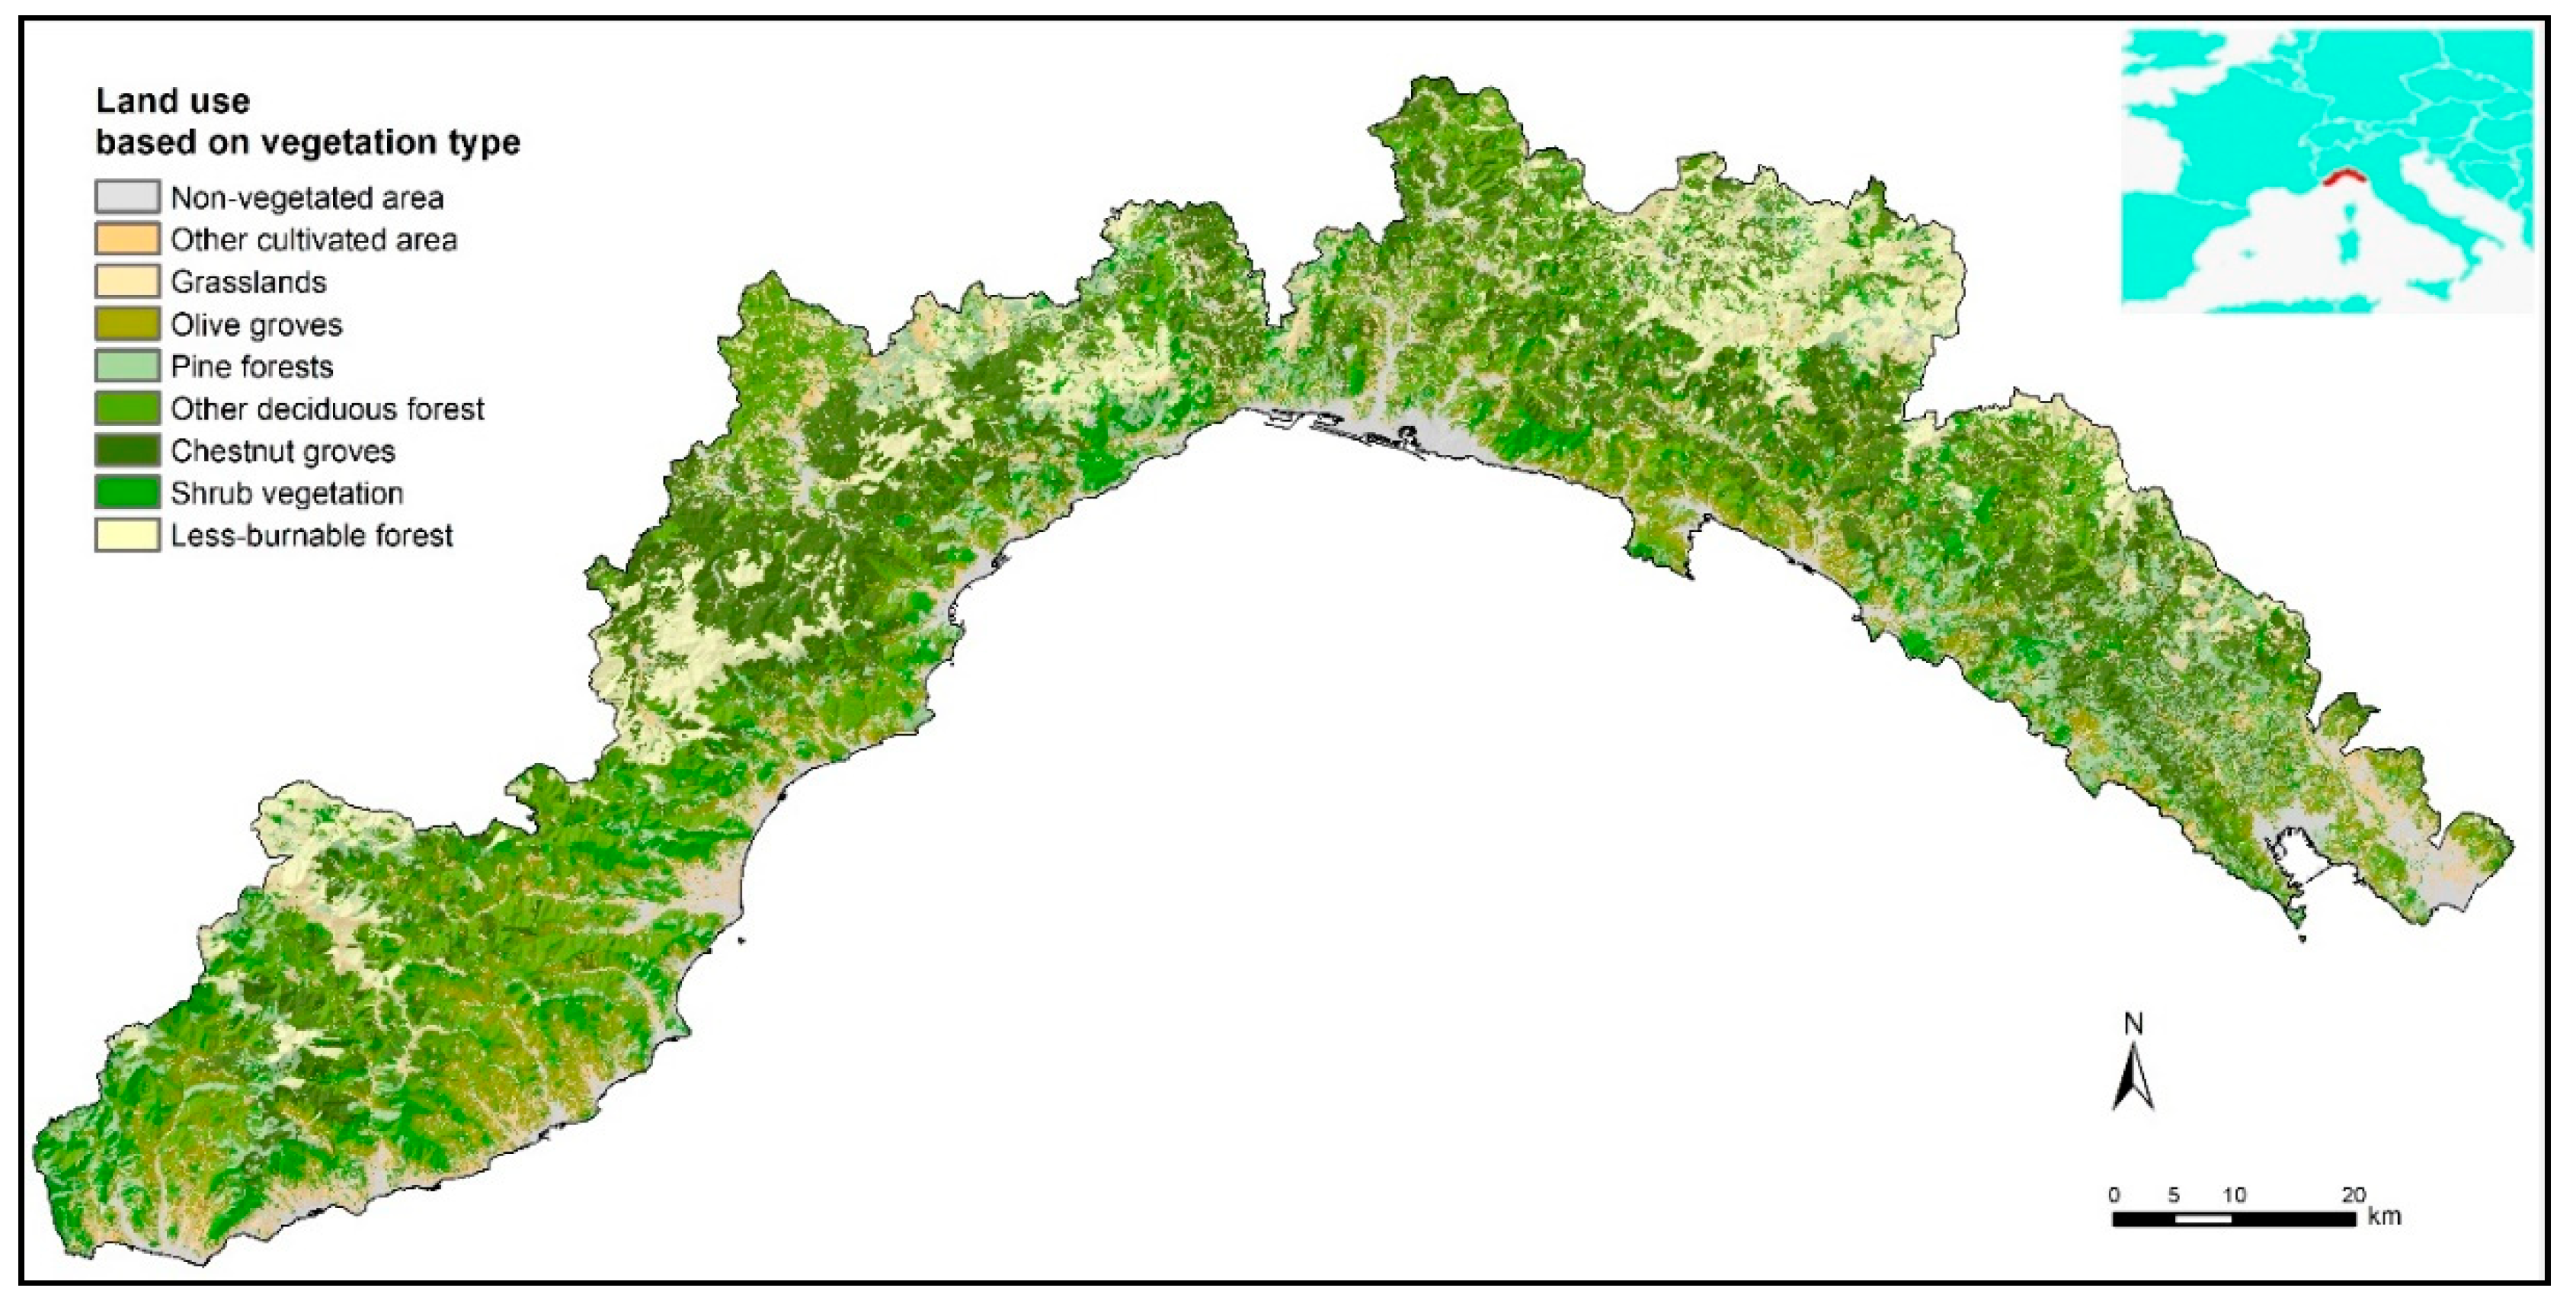
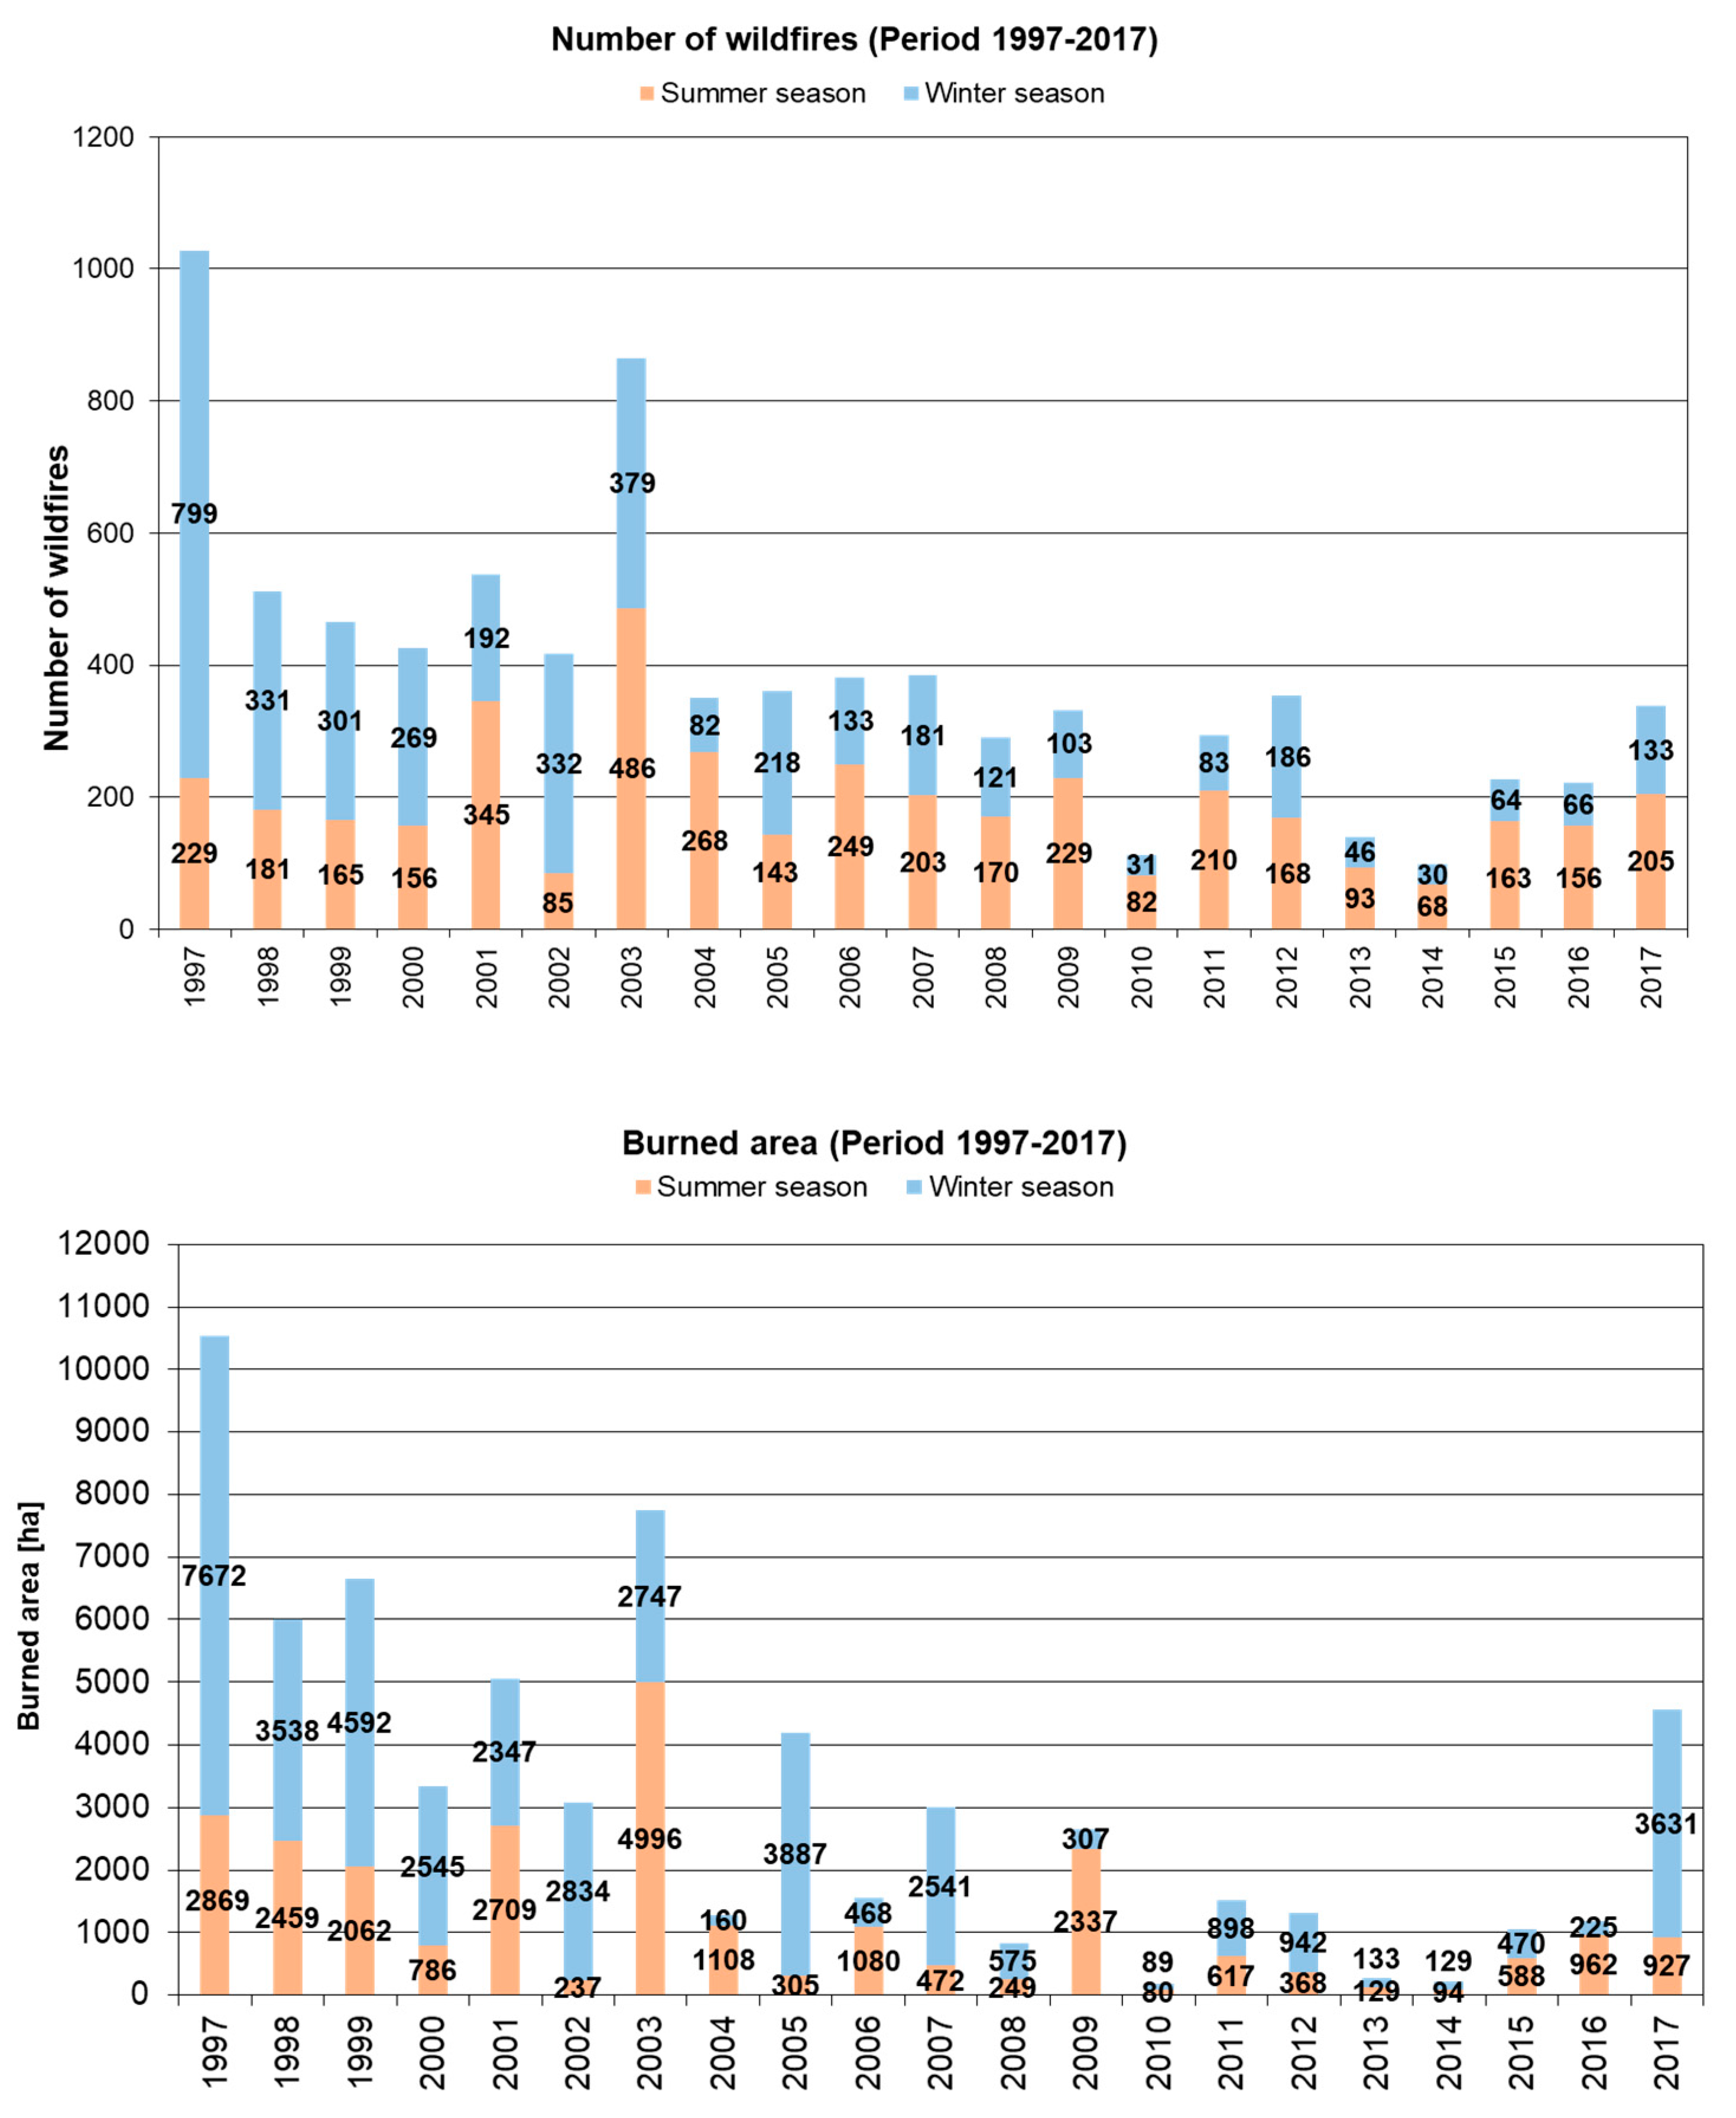
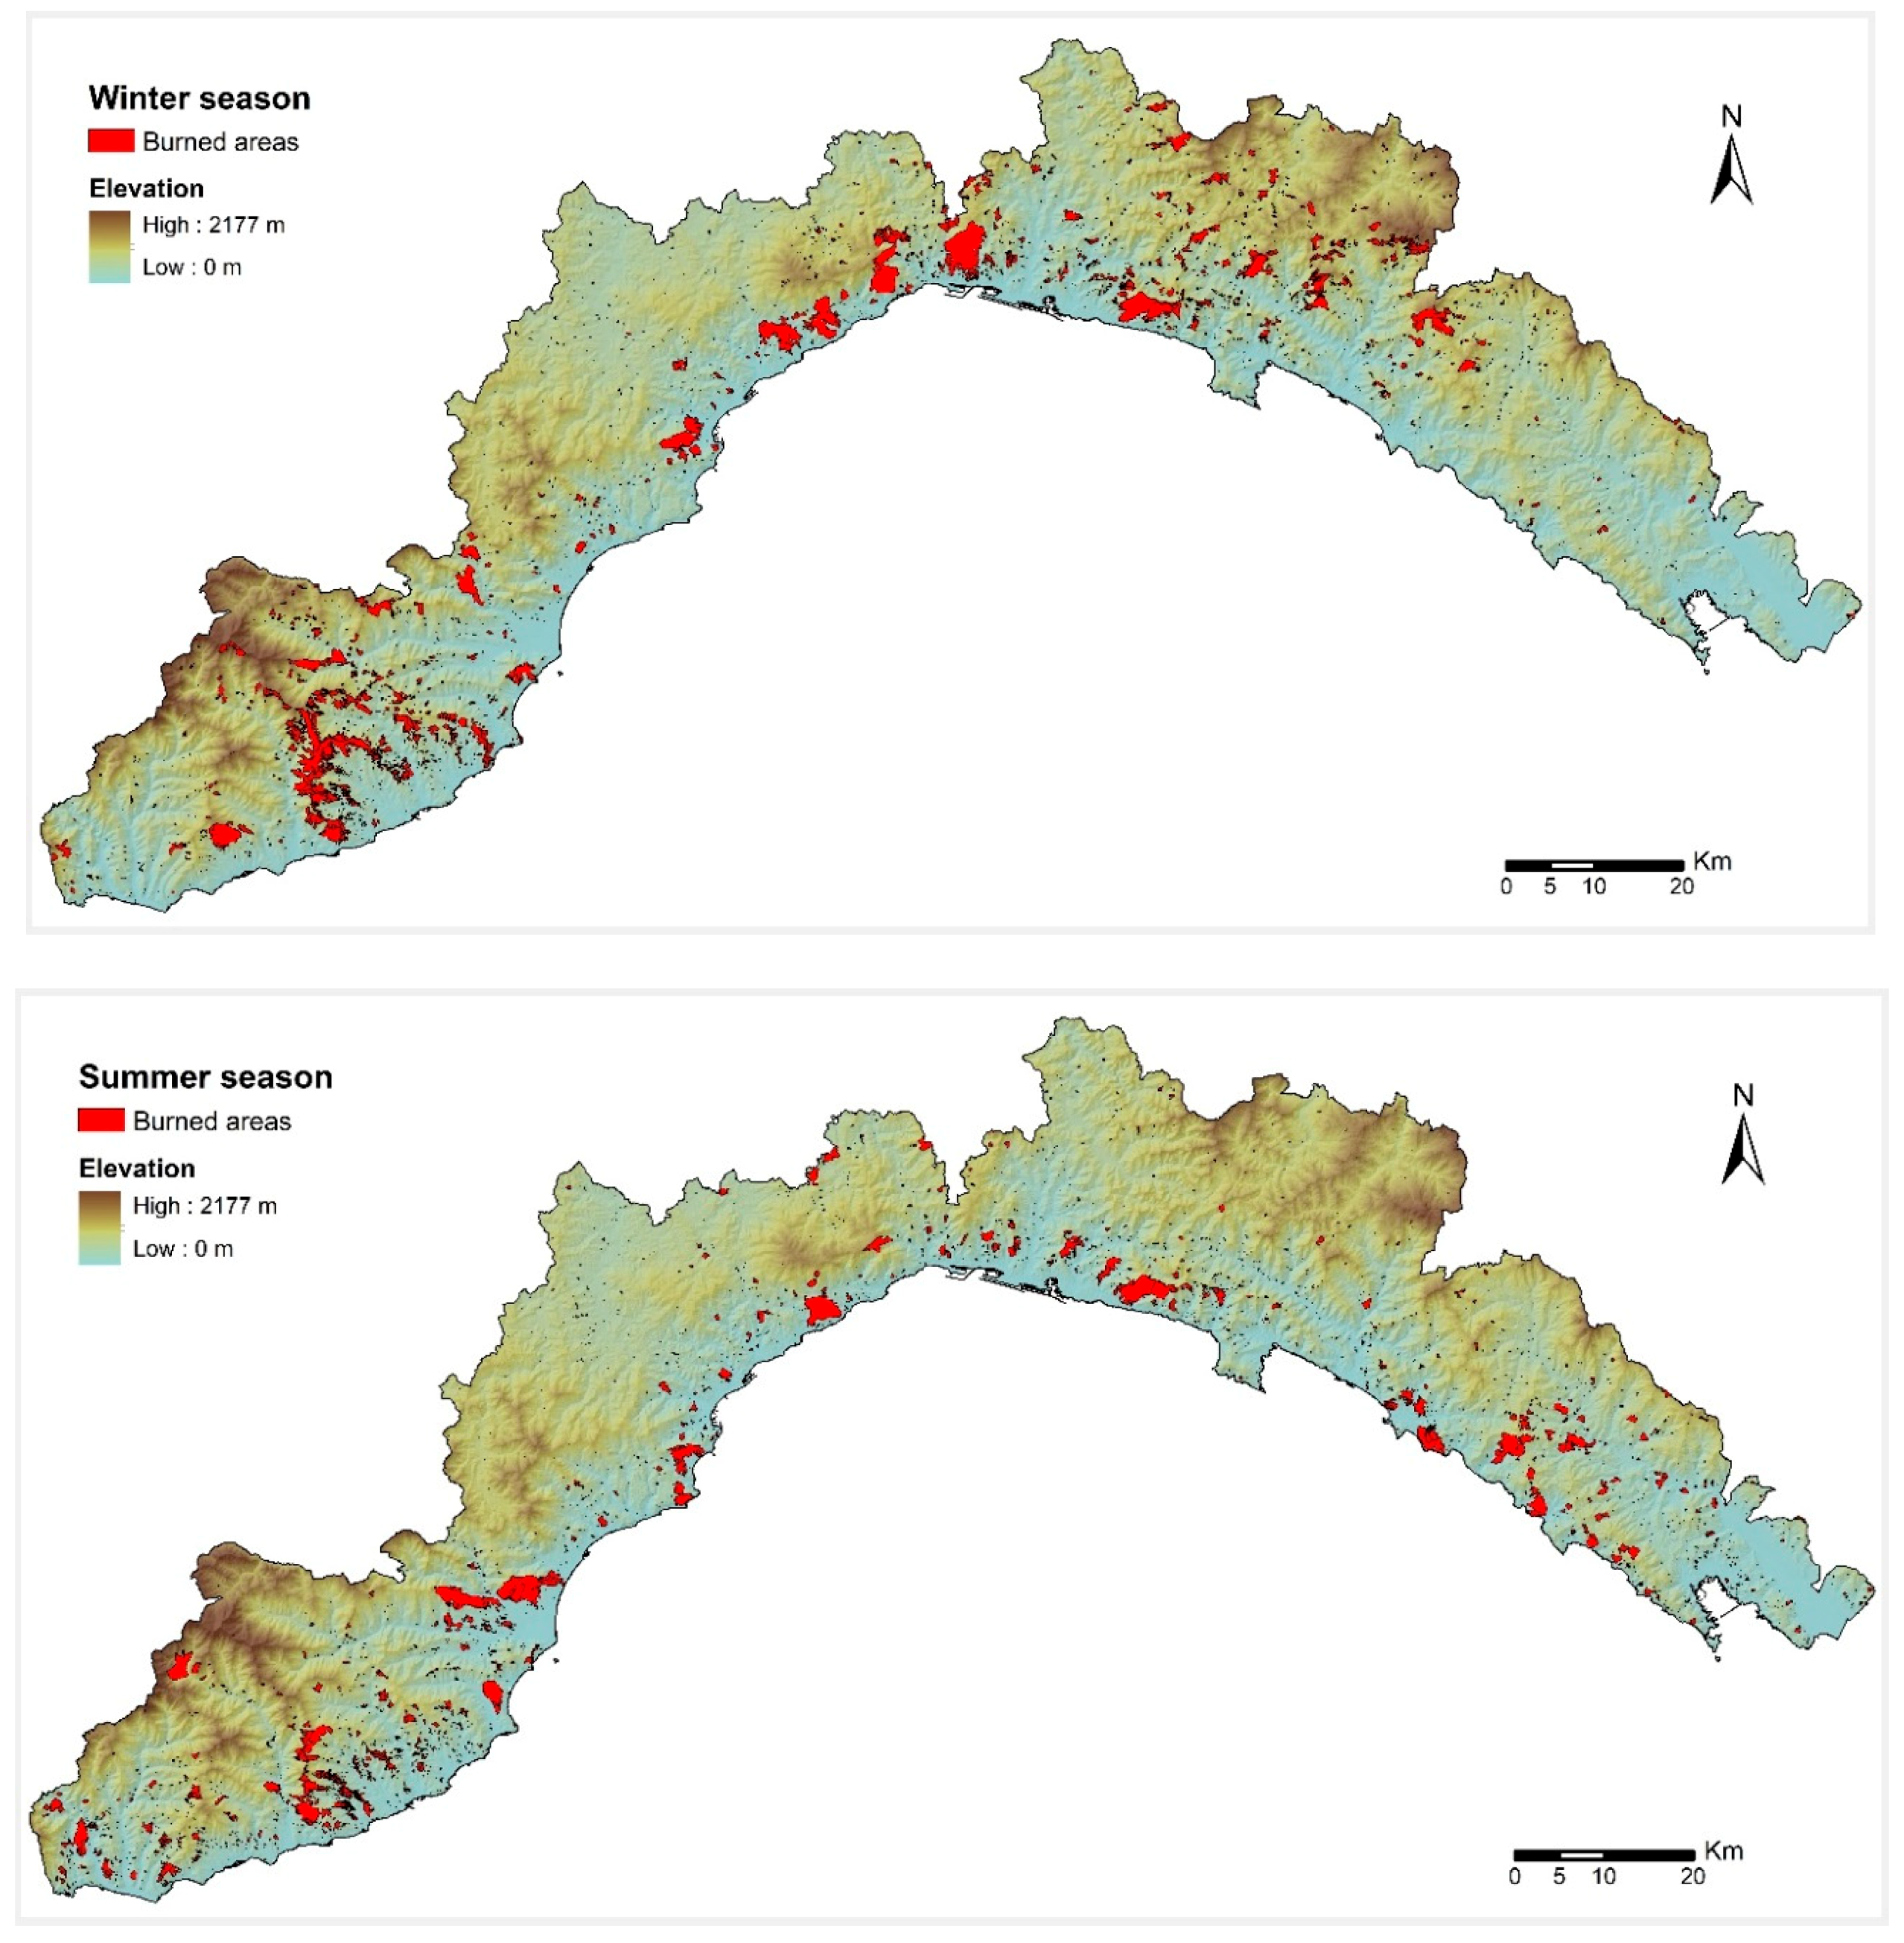
2. Study Area
3. Materials and Methods
3.1. The Dataset: Burned Area and Predisposing Factors
3.2. Modeling Procedure: Machine Learning Approach
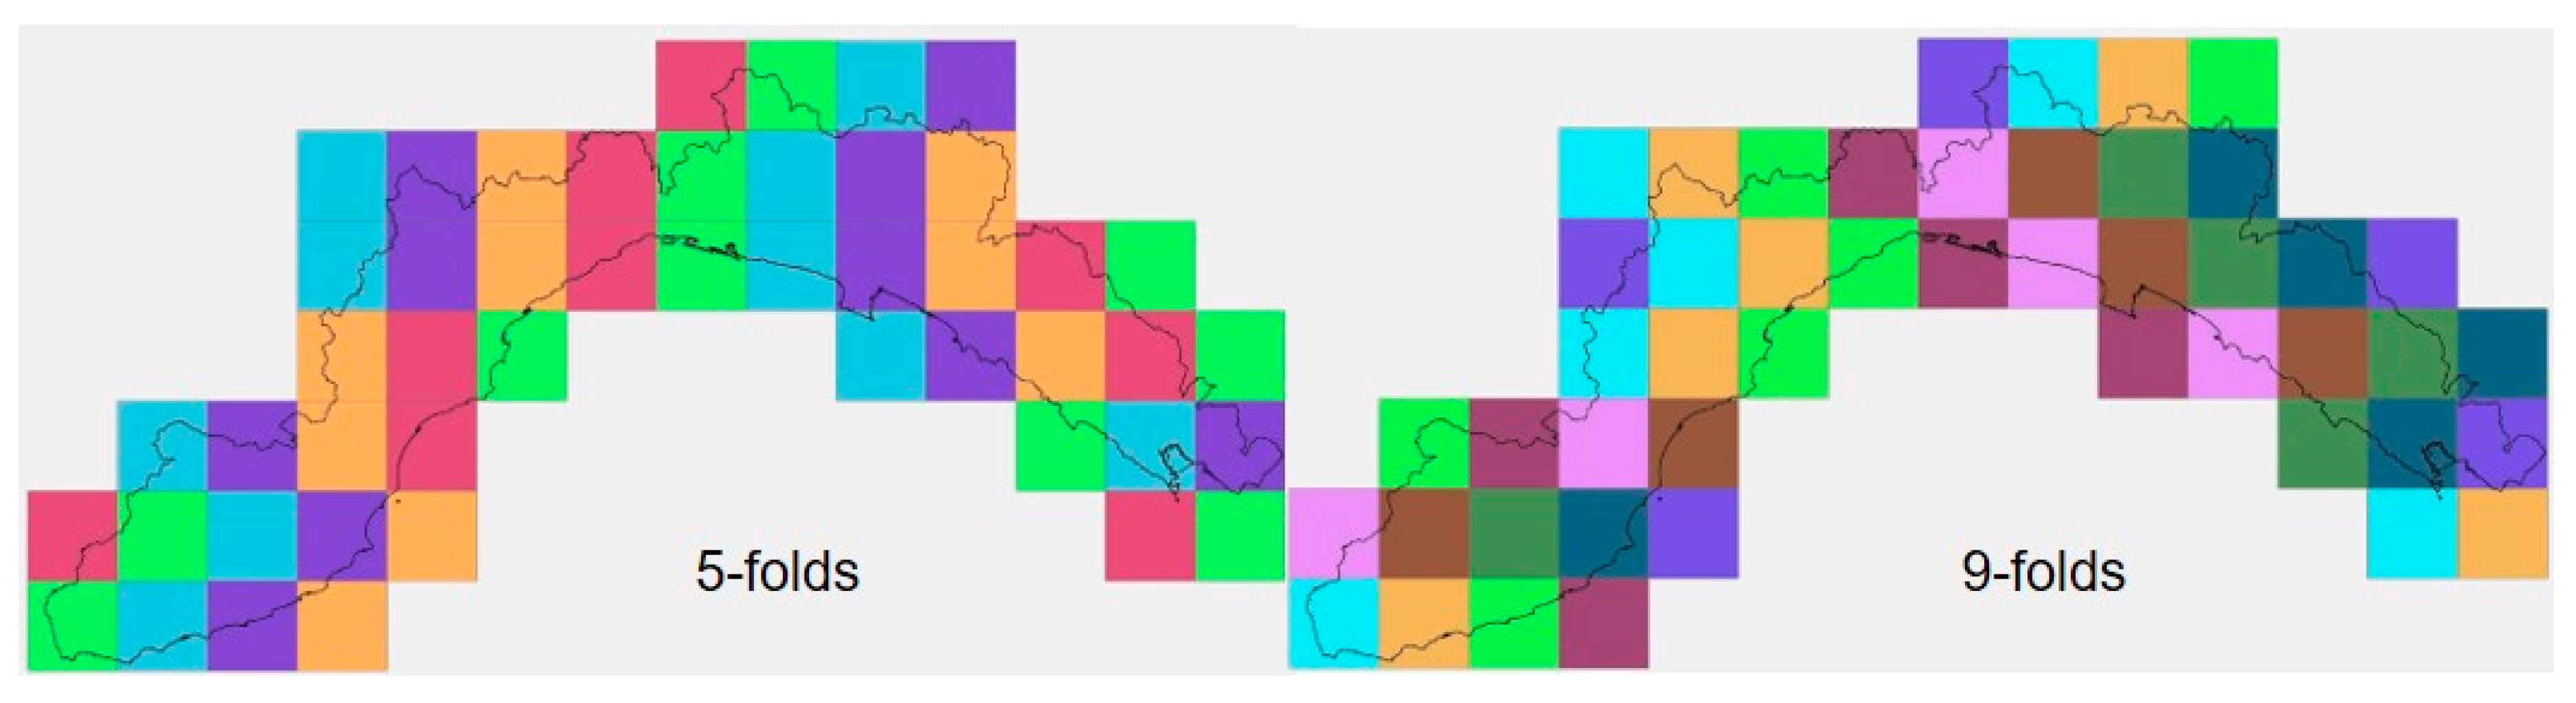
3.3. Model Validation
4. Results
4.1. Models Comparison
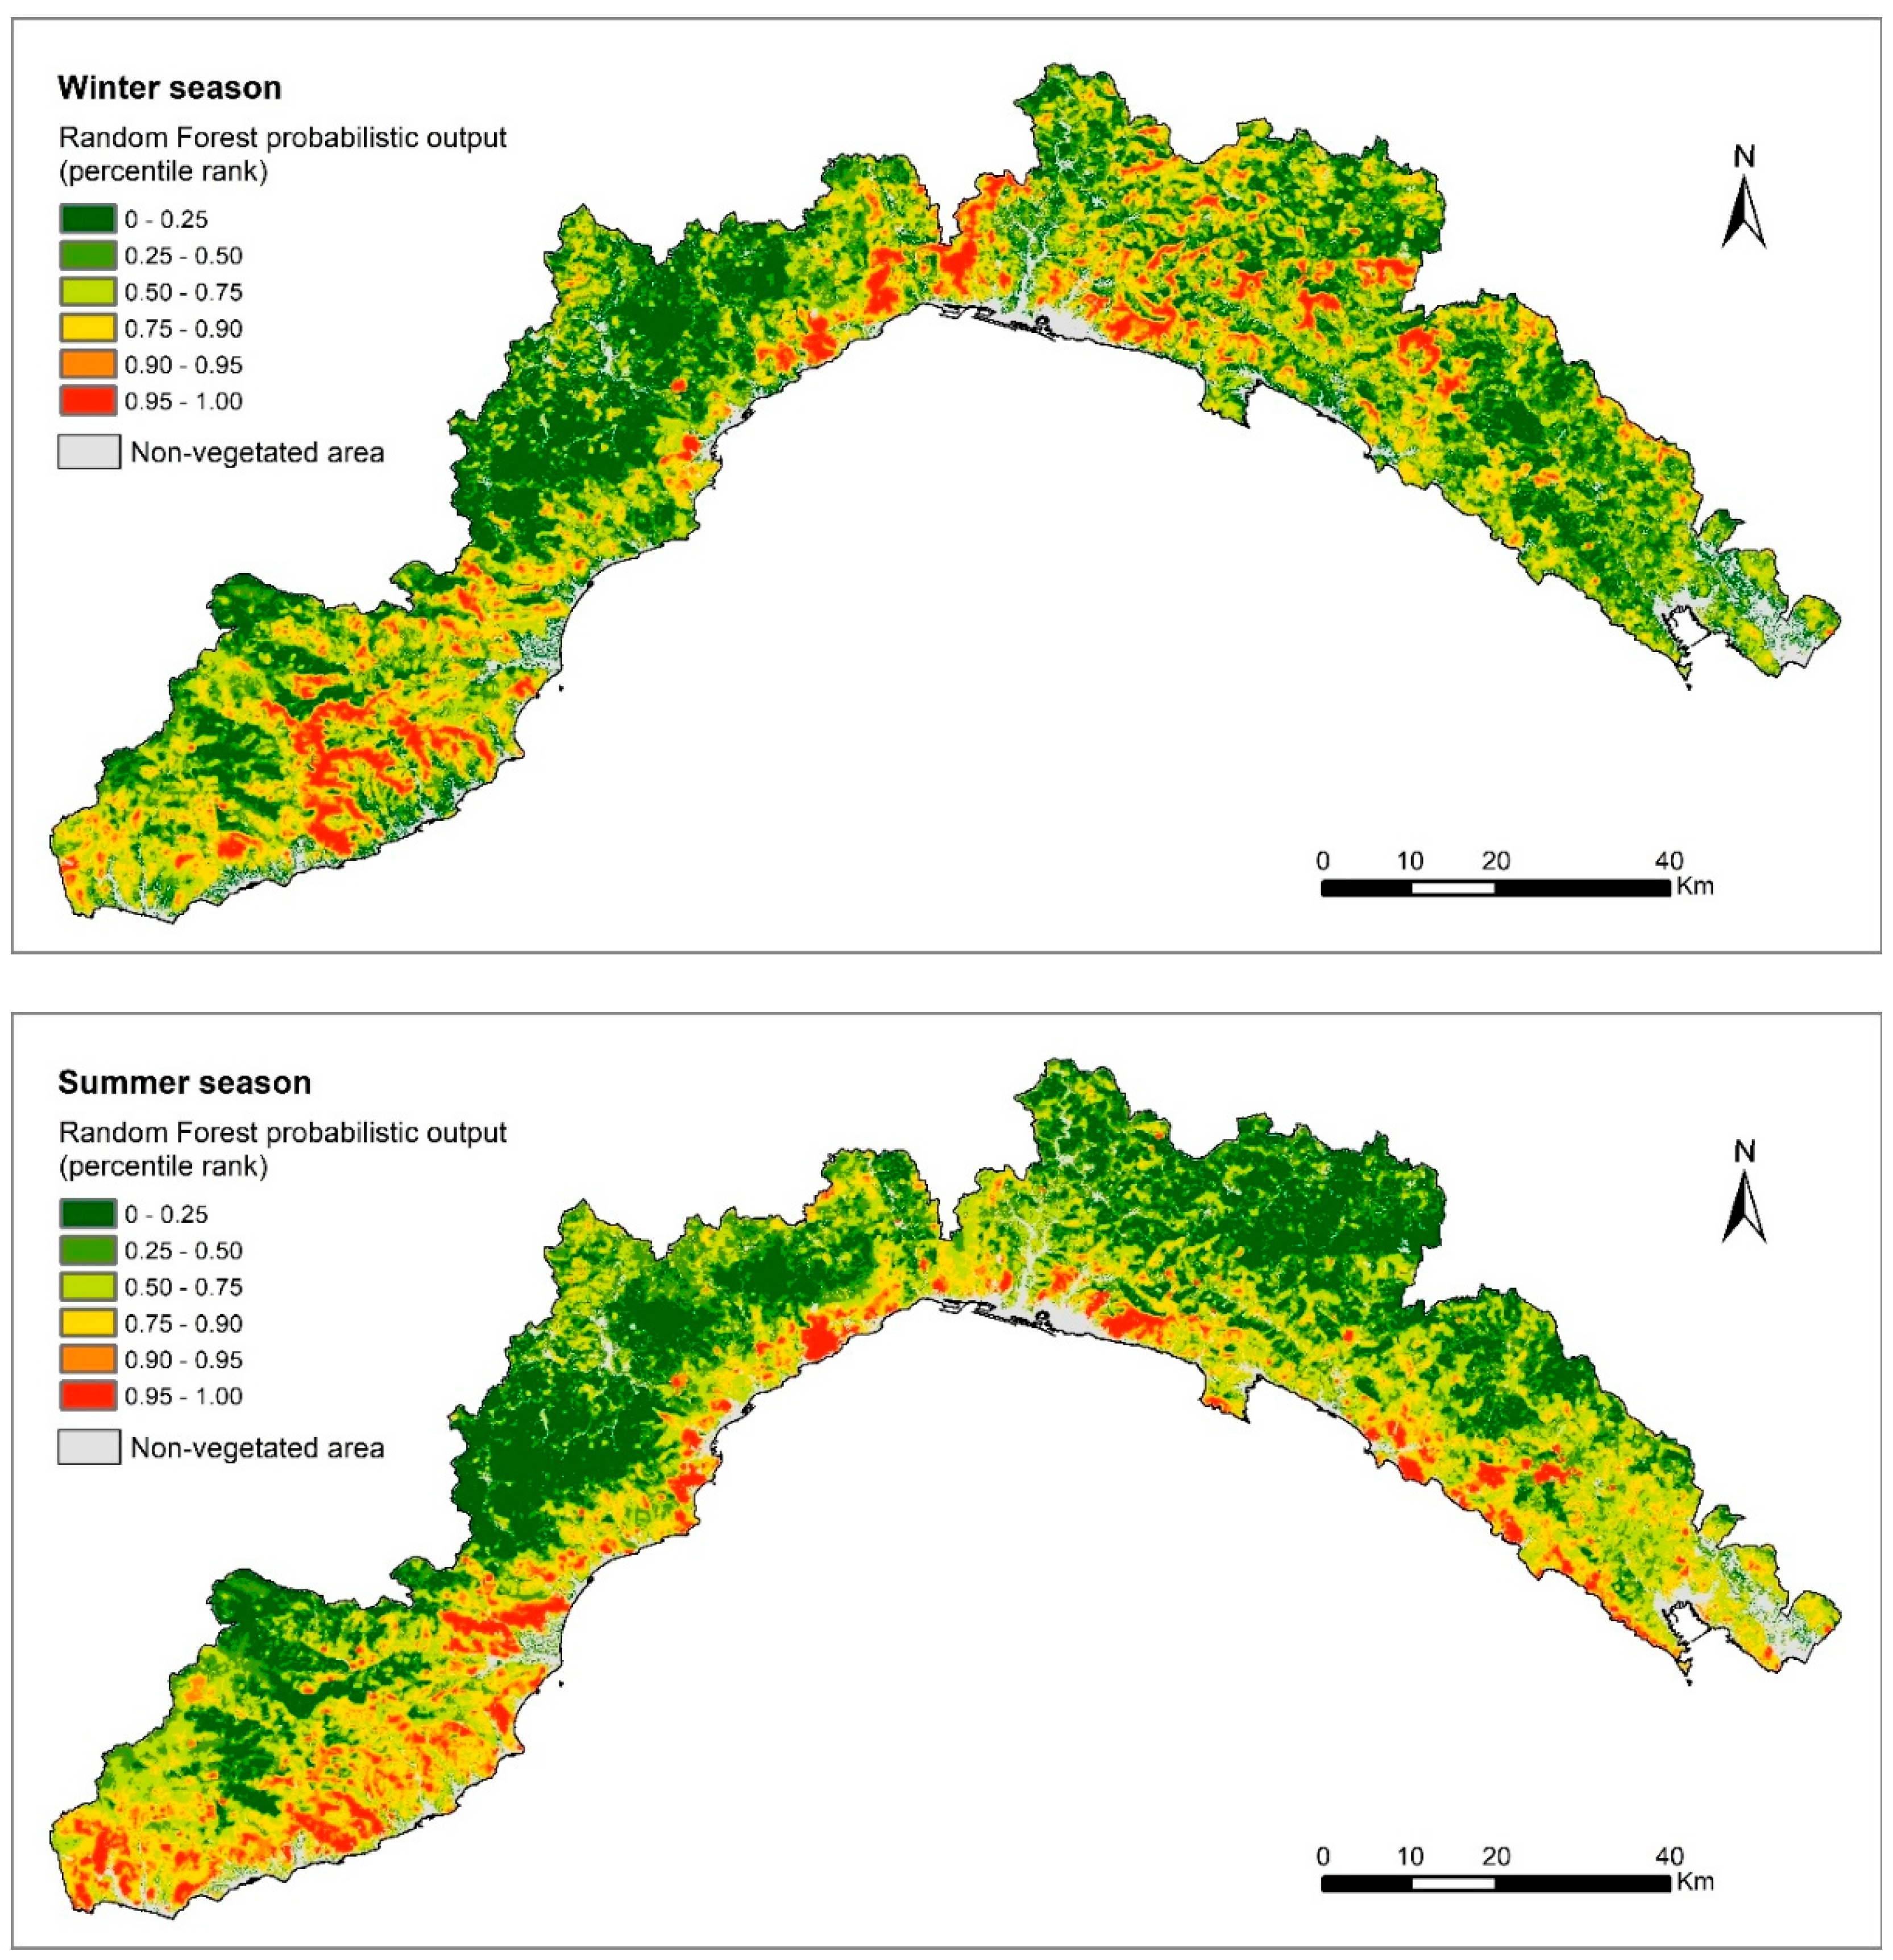
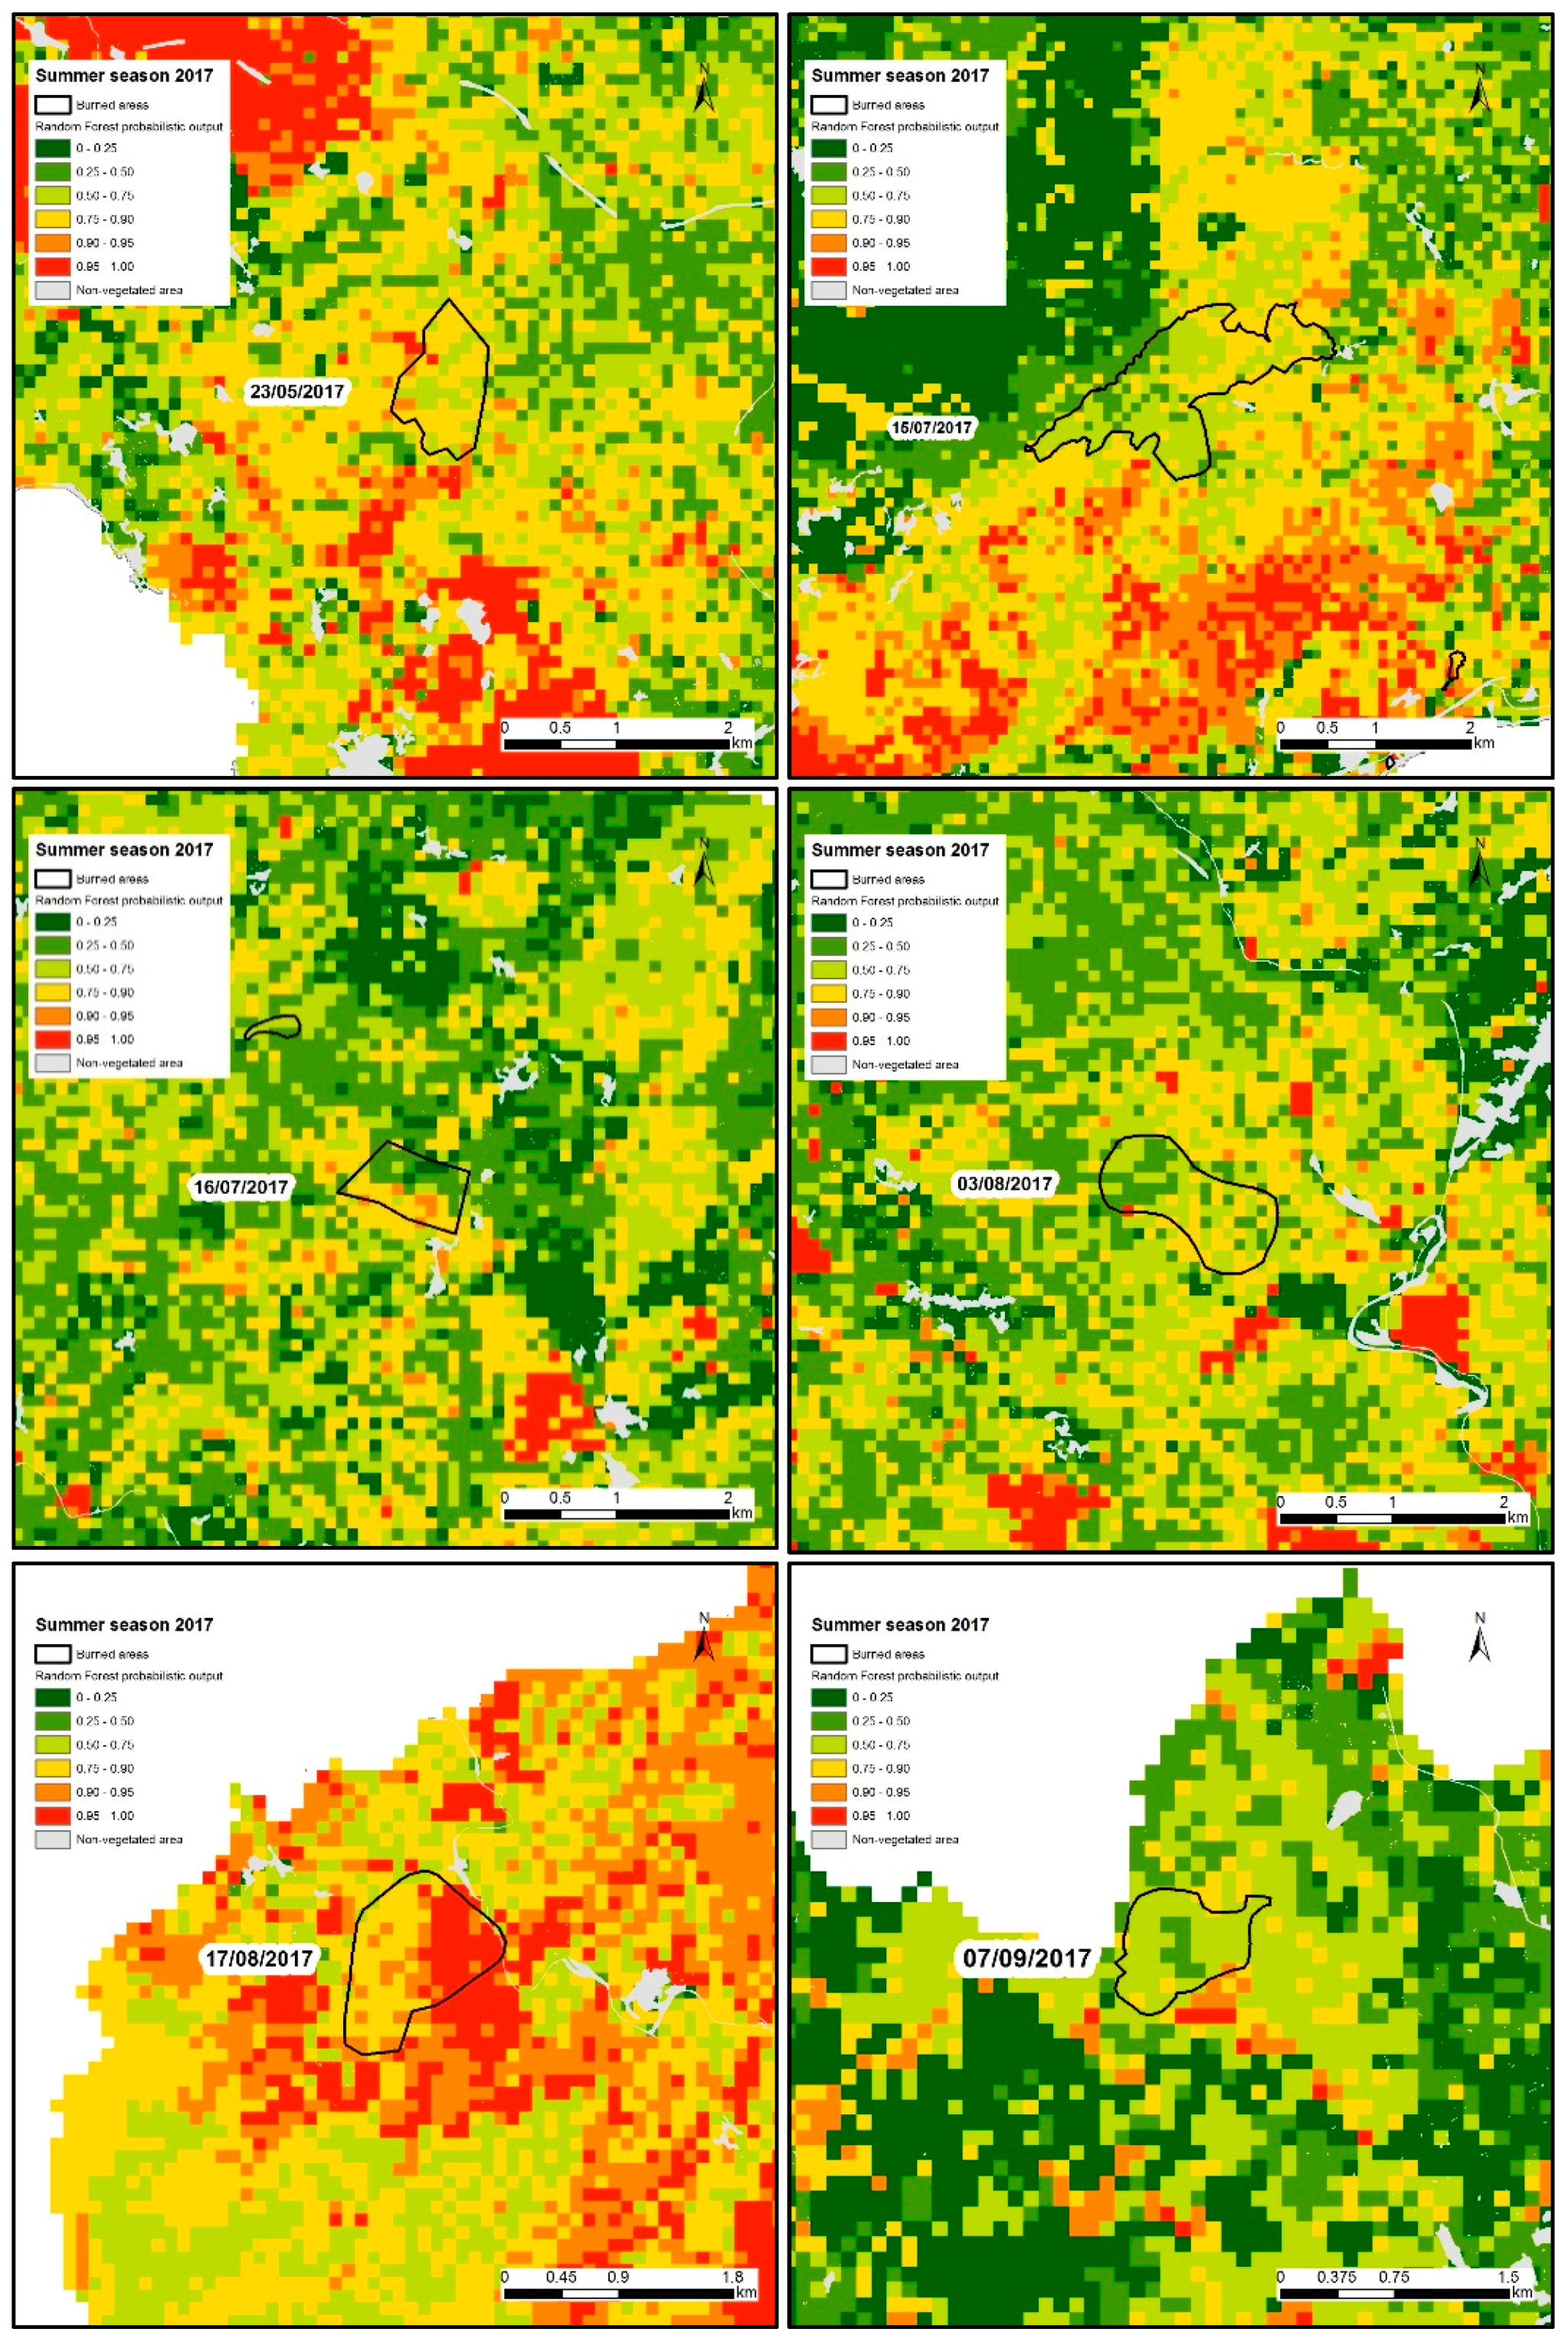
4.2. Susceptibility Mapping
5. Discussion
6. Conclusions
Author Contributions
Funding
Acknowledgments
Conflicts of Interest
References
- San-Miguel-Ayanz, J.; Schulte, E.; Schmuck, G.; Camia, A.; Strobl, P.; Liberta, G.; Giovando, C.; Boca, R.; Sedano, F.; Kempeneers, P.; et al. Comprehensive monitoring of wildfires in Europe: The European Forest Fire Information System (EFFIS). In Approaches to Managing Disaster—Assessing Hazards, Emergencies and Disaster Impacts; Tiefenbacher, J., Ed.; InTech: London, UK, 2012; ISBN 978-953-51-0294-6. [Google Scholar]
- Amraoui, M.; Pereira, M.G.; DaCamara, C.C.; Calado, T.J. Atmospheric conditions associated with extreme fire activity in the Western Mediterranean region. Sci. Total Environ. 2015, 524–525, 32–39. [Google Scholar] [CrossRef]
- San-Miguel-Ayanz, J.; Durrant, T.; Boca, R.; Libertà, G.; Branco, A.; de Rigo, D.; Ferrari, D.; Maianti, P.; Vivancos, T.A.; Schulte, E.; et al. Forest Fires in Europe, Middle East and North Africa 2017. Available online: https://www.driver-project.eu/forest-fires-in-europe-middle-east-and-north-africa-2017-the-new-jrc-report/ (accessed on 17 March 2020).
- Mihalić Arbanas, S. Landslide hazard, risk assessment and prediction: Landslide inventories and susceptibility, hazard mapping methods, damage potential—Part 2. In Advancing Culture of Living with Landslides; Mikos, M., Tiwari, B., Yin, Y., Sassa, K., Eds.; Springer International Publishing: Cham, Switzerland, 2017; pp. 695–698. ISBN 978-3-319-53497-8. [Google Scholar]
- Hervás, J.; Bobrowsky, P. Mapping: Inventories, susceptibility, hazard and risk. In Landslides—Disaster Risk Reduction; Sassa, K., Canuti, P., Eds.; Springer Berlin Heidelberg: Berlin/Heidelberg, Germany, 2009; pp. 321–349. ISBN 978-3-540-69966-8. [Google Scholar]
- Van Den Eeckhaut, M.; Hervás, J. State of the art of national landslide databases in Europe and their potential for assessing landslide susceptibility, hazard and risk. Geomorphology 2012, 139–140, 545–558. [Google Scholar] [CrossRef]
- Fell, R.; Corominas, J.; Bonnard, C.; Cascini, L.; Leroi, E.; Savage, W.Z. Guidelines for landslide susceptibility, hazard and risk zoning for land-use planning. Eng. Geol. 2008, 102, 99–111. [Google Scholar] [CrossRef]
- Finney, M.A. The challenge of quantitative risk analysis for wildland fire. For. Ecol. Manag. 2005, 211, 97–108. [Google Scholar] [CrossRef]
- Hardy, C.C. Wildland fire hazard and risk: Problems, definitions, and context. For. Ecol. Manag. 2005, 211, 73–82. [Google Scholar] [CrossRef]
- Watts, J.M.; Hall, J.R. Introduction to fire risk analysis. In SFPE Handbook of Fire Protection Engineering; Hurley, M.J., Gottuk, D., Hall, J.R., Harada, K., Kuligowski, E., Puchovsky, M., Torero, J., Watts, J.M., Wieczorek, C., Eds.; Springer: New York, NY, USA, 2016; pp. 2817–2826. ISBN 978-1-4939-2564-3. [Google Scholar]
- Meacham, B.J.; Charters, D.; Johnson, P.; Salisbury, M. Building fire risk analysis. In SFPE Handbook of Fire Protection Engineering; Hurley, M.J., Gottuk, D., Hall, J.R., Harada, K., Kuligowski, E., Puchovsky, M., Torero, J., Watts, J.M., Wieczorek, C., Eds.; Springer: New York, NY, USA, 2016; pp. 2941–2991. ISBN 978-1-4939-2564-3. [Google Scholar]
- Brillinger, D.R.; Preisler, H.K.; John, W. Benoit risk assessment: A forest fire example. Lect. Notes-Monogr. Ser. 2003, 40, 177–196. [Google Scholar]
- Catry, F.X.; Rego, F.C.; Bação, F.L.; Moreira, F. Modeling and mapping wildfire ignition risk in Portugal. Int. J. Wildland Fire 2010, 18, 921–931. [Google Scholar] [CrossRef]
- Ager, A.A.; Finney, M.A.; Kerns, B.K.; Maffei, H. Modeling wildfire risk to northern spotted owl (Strix occidentalis caurina) habitat in Central Oregon, USA. For. Ecol. Manag. 2007, 246, 45–56. [Google Scholar] [CrossRef]
- Eugenio, F.C.; dos Santos, A.R.; Fiedler, N.C.; Ribeiro, G.A.; da Silva, A.G.; dos Santos, Á.B.; Paneto, G.G.; Schettino, V.R. Applying GIS to develop a model for forest fire risk: A case study in Espírito Santo, Brazil. J. Environ. Manag. 2016, 173, 65–71. [Google Scholar] [CrossRef] [PubMed]
- Teodoro, A.C.; Duarte, L. Forest fire risk maps: A GIS open source application—A case study in Norwest of Portugal. Int. J. Geogr. Inf. Sci. 2013, 27, 699–720. [Google Scholar] [CrossRef]
- Gai, C.; Weng, W.; Yuan, H. GIS-based forest fire risk assessment and mapping. In Proceedings of the 2011 Fourth International Joint Conference on Computational Sciences and Optimization, Kunming and Lijiang City, China, 15–19 April 2011; pp. 1240–1244. [Google Scholar]
- Pourghasemi, H.R. GIS-based forest fire susceptibility mapping in Iran: A comparison between evidential belief function and binary logistic regression models. Scand. J. For. Res. 2016, 31, 80–98. [Google Scholar] [CrossRef]
- Mohammadi, F.; Bavaghar, M.P.; Shabanian, N. Forest fire risk zone modeling using logistic regression and GIS: An Iranian case study. Small-Scale For. 2014, 13, 117–125. [Google Scholar] [CrossRef]
- Vadrevu, K.P.; Eaturu, A.; Badarinath, K.V.S. Fire risk evaluation using multicriteria analysis—A case study. Environ. Monit. Assess. 2010, 166, 223–239. [Google Scholar] [CrossRef]
- Kant Sharma, L.; Kanga, S.; Singh Nathawat, M.; Sinha, S.; Chandra Pandey, P. Fuzzy AHP for forest fire risk modeling. Disaster Prev. Manag. Int. J. 2012, 21, 160–171. [Google Scholar] [CrossRef]
- Carmel, Y.; Paz, S.; Jahashan, F.; Shoshany, M. Assessing fire risk using Monte Carlo simulations of fire spread. For. Ecol. Manag. 2009, 257, 370–377. [Google Scholar] [CrossRef]
- Chuvieco, E.; Aguado, I.; Yebra, M.; Nieto, H.; Salas, J.; Martín, M.P.; Vilar, L.; Martínez, J.; Martín, S.; Ibarra, P.; et al. Development of a framework for fire risk assessment using remote sensing and geographic information system technologies. Ecol. Model. 2010, 221, 46–58. [Google Scholar] [CrossRef]
- Chuvieco, E.; Salas, J. Mapping the spatial distribution of forest fire danger using GIS. Int. J. Geogr. Inf. Syst. 1996, 10, 333–345. [Google Scholar] [CrossRef]
- Pourtaghi, Z.S.; Pourghasemi, H.R.; Aretano, R.; Semeraro, T. Investigation of general indicators influencing on forest fire and its susceptibility modeling using different data mining techniques. Ecol. Indic. 2016, 64, 72–84. [Google Scholar] [CrossRef]
- Leuenberger, M.; Parente, J.; Tonini, M.; Pereira, M.G.; Kanevski, M. Wildfire susceptibility mapping: Deterministic vs. stochastic approaches. Environ. Model. Softw. 2018, 101, 194–203. [Google Scholar] [CrossRef]
- Arpaci, A.; Malowerschnig, B.; Sass, O.; Vacik, H. Using multi variate data mining techniques for estimating fire susceptibility of Tyrolean forests. Appl. Geogr. 2014, 53, 258–270. [Google Scholar] [CrossRef]
- Oliveira, S.; Oehler, F.; San-Miguel-Ayanz, J.; Camia, A.; Pereira, J.M.C. Modeling spatial patterns of fire occurrence in Mediterranean Europe using Multiple Regression and Random Forest. For. Ecol. Manag. 2012, 275, 117–129. [Google Scholar] [CrossRef]
- Ngoc Thach, N.; Bao-Toan Ngo, D.; Xuan-Canh, P.; Hong-Thi, N.; Hang Thi, B.; Nhat-Duc, H.; Dieu, T.B. Spatial pattern assessment of tropical forest fire danger at Thuan Chau area (Vietnam) using GIS-based advanced machine learning algorithms: A comparative study. Ecol. Inform. 2018, 46, 74–85. [Google Scholar] [CrossRef]
- Satir, O.; Berberoglu, S.; Donmez, C. Mapping regional forest fire probability using artificial neural network model in a Mediterranean forest ecosystem. Geomat. Nat. Hazards Risk 2016, 7, 1645–1658. [Google Scholar] [CrossRef]
- Tehrany, M.S.; Jones, S.; Shabani, F.; Martínez-Álvarez, F.; Tien Bui, D. A novel ensemble modeling approach for the spatial prediction of tropical forest fire susceptibility using LogitBoost machine learning classifier and multi-source geospatial data. Theor. Appl. Climatol. 2019, 137, 637–653. [Google Scholar] [CrossRef]
- Rodrigues, M.; de la Riva, J. An insight into machine-learning algorithms to model human-caused wildfire occurrence. Environ. Model. Softw. 2014, 57, 192–201. [Google Scholar] [CrossRef]
- Ghorbanzadeh, O.; Blaschke, T.; Gholamnia, K.; Aryal, J. Forest fire susceptibility and risk mapping using social/infrastructural vulnerability and environmental variables. Fire 2019, 2, 50. [Google Scholar] [CrossRef]
- Sharma, S.; Ochsner, T.E.; Twidwell, D.; Carlson, J.D.; Krueger, E.S.; Engle, D.M.; Fuhlendorf, S.D. Nondestructive estimation of standing crop and fuel moisture content in Tallgrass Prairie. Rangel. Ecol. Manag. 2018, 71, 356–362. [Google Scholar] [CrossRef]
- Sayad, Y.O.; Mousannif, H.; Al Moatassime, H. Predictive modeling of wildfires: A new dataset and machine learning approach. Fire Saf. J. 2019, 104, 130–146. [Google Scholar] [CrossRef]
- Féret, J.-B.; le Maire, G.; Jay, S.; Berveiller, D.; Bendoula, R.; Hmimina, G.; Cheraiet, A.; Oliveira, J.C.; Ponzoni, F.J.; Solanki, T.; et al. Estimating leaf mass per area and equivalent water thickness based on leaf optical properties: Potential and limitations of physical modeling and machine learning. Remote Sens. Environ. 2019, 231, 110959. [Google Scholar] [CrossRef]
- Ganteaume, A.; Camia, A.; Jappiot, M.; San-Miguel-Ayanz, J.; Long-Fournel, M.; Lampin, C. A review of the main driving factors of forest fire ignition over Europe. Environ. Manag. 2013, 51, 651–662. [Google Scholar] [CrossRef]
- Tonini, M.; Parente, J.; Pereira, M.G. Global assessment of rural–urban interface in Portugal related to land cover changes. Nat. Hazards Earth Syst. Sci. 2018, 18, 1647–1664. [Google Scholar] [CrossRef]
- Conedera, M.; Tonini, M.; Oleggini, L.; Vega Orozco, C.; Leuenberger, M.; Pezzatti, G.B. Geospatial approach for defining the wildland-urban interface in the alpine environment. Comput. Environ. Urban Syst. 2015, 52, 10–20. [Google Scholar] [CrossRef]
- Zumbrunnen, T.; Menéndez, P.; Bugmann, H.; Conedera, M.; Gimmi, U.; Bürgi, M. Human impacts on fire occurrence: A case study of hundred years of forest fires in a dry alpine valley in Switzerland. Reg. Environ. Chang. 2012, 12, 935–949. [Google Scholar] [CrossRef]
- Badia, A.; Serra, P.; Modugno, S. Identifying dynamics of fire ignition probabilities in two representative Mediterranean wildland-urban interface areas. Appl. Geogr. 2011, 31, 930–940. [Google Scholar] [CrossRef]
- Romero-Calcerrada, R.; Barrio-Parra, F.; Millington, J.D.A.; Novillo, C.J. Spatial modelling of socioeconomic data to understand patterns of human-caused wildfire ignition risk in the SW of Madrid (central Spain). Ecol. Model. 2010, 221, 34–45. [Google Scholar] [CrossRef]
- Castillo Soto, M.E. The identification and assessment of areas at risk of forest fire using fuzzy methodology. Appl. Geogr. 2012, 35, 199–207. [Google Scholar] [CrossRef]
- Vilar, L.; Woolford, D.G.; Martell, D.L.; Martín, M.P. A model for predicting human-caused wildfire occurrence in the region of Madrid, Spain. Int. J. Wildland Fire 2010, 19, 325–337. [Google Scholar] [CrossRef]
- Mermoz, M.; Kitzberger, T.; Veblen, T.T. Landscape influences on occurrence and spread of wildfires in Patagonian forests and shrublands. Ecology 2005, 86, 2705–2715. [Google Scholar] [CrossRef]
- Carmo, M.; Moreira, F.; Casimiro, P.; Vaz, P. Land use and topography influences on wildfire occurrence in northern Portugal. Landsc. Urban Plan. 2011, 100, 169–176. [Google Scholar] [CrossRef]
- Harris, L.; Taylor, A.H. Previous burns and topography limit and reinforce fire severity in a large wildfire. Ecosphere 2017, 8, e02019. [Google Scholar] [CrossRef]
- Moreira, F.; Vaz, P.; Catry, F.; Silva, J.S. Regional variations in wildfire susceptibility of land-cover types in Portugal: Implications for landscape management to minimize fire hazard. Int. J. Wildland Fire 2009, 18, 563–574. [Google Scholar] [CrossRef]
- Kanevski, M.; Pozdnoukhov, A.; Timonin, V. Machine Learning for Spatial Environmental Data: Theory, Applications and Software; Collection: environmental engineering; Epfel: Lausanne, Switzerland, 2009; ISBN 978-0-8493-8237-6. [Google Scholar]
- Lee, S.; Jung, H.-S. Machine Learning Techniques Applied to Geoscience Information System and Remote Sensing; MDPI: Basel, Switzerland, 2019; ISBN 978-3-03921-216-3. [Google Scholar]
- Breiman, L. Random forest. Mach. Learn. 2001, 45, 5–32. [Google Scholar] [CrossRef]
- Jain, P.; Coogan, S.C.P.; Subramanian, S.G.; Crowley, M.; Taylor, S.; Flannigan, M.D. A review of machine learning applications in wildfire science and management. arXiv 2020, arXiv:2003.00646. [Google Scholar]
- Martín, Y.; Zúñiga-Antón, M.; Rodrigues Mimbrero, M. Modelling temporal variation of fire-occurrence towards the dynamic prediction of human wildfire ignition danger in northeast Spain. Geomat. Nat. Hazards Risk 2019, 10, 385–411. [Google Scholar] [CrossRef]
- Vacchiano, G.; Foderi, C.; Berretti, R.; Marchi, E.; Motta, R. Modeling anthropogenic and natural fire ignitions in an inner-alpine valley. Nat. Hazards Earth Syst. Sci. 2018, 18, 935–948. [Google Scholar] [CrossRef]


| Independent Variables | Acquisition Scale | Variable Type | Range | # of Variables |
|---|---|---|---|---|
| DEM | 1:5000 | Numerical (meters) | 0–2132 | 1 |
| Slope | - | Numerical (degree) | 0–60 | 1 |
| Northness and Eastness | - | Numerical | [−1–+1] | 2 |
| Distance to anthropogenic features | 1:10,000 | Numerical (meters) | 0–9000 | 4 |
| Protected area | 1:25,000 | Binary | 0 or 1 | 1 |
| Vegetation type | 1:25,000 | Categorical | 37 classes | 1 |
| Non-flammable area | 1:25,000 | Categorical | 1 class | 1 |
| Neighboring vegetation * | - | Numerical (percentage) | [0,100] | 38 |
| Winter Season | 1-Fold Cross Validation | 5-Fold Cross Validation | 9-Fold Cross Validation | ||||||||
| Standard Model | Neighboring Vegetation | Standard Model | Neighboring Vegetation | Neighboring Vegetation | |||||||
| Classes | Total Area (%) | Testing BA (%) | Prob_Value | Testing BA (%) | Prob_Value | Testing BA (%) | Prob_Value | Testing BA (%) | Prob_Value | Testing BA (%) | Prob_Value |
| 25% | 25 | 5.07 | 0.13 | 3.85 | 0.09 | 4.42 | 0.11 | 3.5 | 0.07 | 3.36 | 0.07 |
| 50% | 25 | 4.95 | 0.25 | 3.4 | 0.22 | 3.44 | 0.23 | 3.27 | 0.18 | 3.17 | 0.17 |
| 75% | 25 | 10.52 | 0.48 | 8.8 | 0.47 | 8.9 | 0.43 | 6.22 | 0.39 | 6.44 | 0.39 |
| 90% | 15 | 17.64 | 0.78 | 14.98 | 0.74 | 15.77 | 0.7 | 13.05 | 0.68 | 11.91 | 0.69 |
| 95% | 5 | 14.38 | 0.91 | 15.26 | 0.87 | 15.67 | 0.85 | 17.7 | 0.83 | 16.43 | 0.85 |
| 100% | 5 | 47.26 | 1 | 52.86 | 1 | 51.78 | 1 | 56.26 | 1 | 58.69 | 1 |
| >75% | 79.28 | 83.1 | 83.22 | 87.01 | 87.03 | ||||||
| Summer Season | 1-Fold Cross Validation | 5-Fold Cross Validation | 9-Fold Cross Validation | ||||||||
| Standard Model | Neighboring Vegetation | Standard Model | Neighboring Vegetation | Neighboring Vegetation | |||||||
| Classes | Total Area (%) | Testing BA (%) | Prob_Value | Testing BA (%) | Prob_Value | Testing BA (%) | Prob_Value | Testing BA (%) | Prob_Value | Testing BA (%) | Prob_Value |
| 25% | 25 | 4.71 | 0.08 | 1.04 | 0.04 | 4.04 | 0.06 | 0.8 | 0.04 | 0.8 | 0.04 |
| 50% | 25 | 7.52 | 0.23 | 4.64 | 0.17 | 9.39 | 0.19 | 5.08 | 0.14 | 5.54 | 0.14 |
| 75% | 25 | 17.94 | 0.51 | 18.27 | 0.41 | 15.16 | 0.44 | 19.77 | 0.35 | 18.44 | 0.35 |
| 90% | 15 | 24.45 | 0.78 | 26.19 | 0.7 | 23.31 | 0.69 | 21.51 | 0.65 | 22.11 | 0.66 |
| 95% | 5 | 14.06 | 0.91 | 14.6 | 0.87 | 14.6 | 0.83 | 15.06 | 0.83 | 14.73 | 0.85 |
| 100% | 5 | 30.66 | 1 | 33.43 | 1 | 33.5 | 1 | 37.71 | 1 | 38.31 | 1 |
| >75% | 69.17 | 74.22 | 71.41 | 74.28 | 75.15 | ||||||
| Winter Season | 1-Fold | 5-Folds | 9-Folds |
|---|---|---|---|
| Standard model | 0.407 | 0.380 | - |
| Neighboring vegetation | 0.377 | 0.354 | 0.351 |
| Summer season | 1-fold | 5-folds | 9-folds |
| Standard model | 0.437 | 0.428 | - |
| Neighboring vegetation | 0.411 | 0.411 | 0.411 |
| Year | Winter Season | Summer Season | Tot_Year | ||||
|---|---|---|---|---|---|---|---|
| BA > 75 % | BA > 75% | Tot_Winter | BA > 75 % | BA > 75% | Tot_Summer | ||
| (%) | (# pixels) | (# pixels) | (%) | (# pixels) | (# pixels) | (# pixels) | |
| 2012 | 84.1 | 844 | 1003 | 77.8 | 337 | 433 | 1436 |
| 2013 | 83.4 | 121 | 145 | 86.9 | 140 | 161 | 306 |
| 2014 | 86.0 | 117 | 136 | 92.8 | 103 | 111 | 247 |
| 2015 | 91.2 | 465 | 510 | 84.9 | 535 | 630 | 1140 |
| 2016 | 91.7 | 220 | 240 | 92.7 | 936 | 1010 | 1250 |
| 2017 | 86.4 | 3144 | 3640 | 45.7 | 449 | 983 | 4623 |
| Tot | 5674 | 3328 | 9002 | ||||
© 2020 by the authors. Licensee MDPI, Basel, Switzerland. This article is an open access article distributed under the terms and conditions of the Creative Commons Attribution (CC BY) license (http://creativecommons.org/licenses/by/4.0/).
Share and Cite
Tonini, M.; D’Andrea, M.; Biondi, G.; Degli Esposti, S.; Trucchia, A.; Fiorucci, P. A Machine Learning-Based Approach for Wildfire Susceptibility Mapping. The Case Study of the Liguria Region in Italy. Geosciences 2020, 10, 105. https://doi.org/10.3390/geosciences10030105
Tonini M, D’Andrea M, Biondi G, Degli Esposti S, Trucchia A, Fiorucci P. A Machine Learning-Based Approach for Wildfire Susceptibility Mapping. The Case Study of the Liguria Region in Italy. Geosciences. 2020; 10(3):105. https://doi.org/10.3390/geosciences10030105
Chicago/Turabian StyleTonini, Marj, Mirko D’Andrea, Guido Biondi, Silvia Degli Esposti, Andrea Trucchia, and Paolo Fiorucci. 2020. "A Machine Learning-Based Approach for Wildfire Susceptibility Mapping. The Case Study of the Liguria Region in Italy" Geosciences 10, no. 3: 105. https://doi.org/10.3390/geosciences10030105
APA StyleTonini, M., D’Andrea, M., Biondi, G., Degli Esposti, S., Trucchia, A., & Fiorucci, P. (2020). A Machine Learning-Based Approach for Wildfire Susceptibility Mapping. The Case Study of the Liguria Region in Italy. Geosciences, 10(3), 105. https://doi.org/10.3390/geosciences10030105