Article

Bat Algorithm Based Non-linear Contrast Stretching for Satellite Image Enhancement

1
Karunya Institute of Technology and Sciences, Coimbatore 641114, India
2
Faculty of Electrical Engineering and Information Technology, University of Oradea, 410087 Oradea, Romania
*
Author to whom correspondence should be addressed.
Geosciences 2020, 10(2), 78; https://doi.org/10.3390/geosciences10020078
Submission received: 26 December 2019 / Revised: 15 February 2020 / Accepted: 19 February 2020 / Published: 21 February 2020
(This article belongs to the Special Issue Image processing and satellite imagery analysis in environments)

Abstract

:
The remote sensing images acquired from the satellites are low contrast images. The availability of low contrast images and failure of the traditional methods such as Histogram Equalization and Gamma correction in preserving the brightness levels in the image are the main issues in satellite image processing. This paper proposes an optimized contrast stretching using non-linear transformation for image enhancement. The non-linear transformation is influenced by the appropriate choice of control parameters for the sample images since manual tuning for individual images is tedious. A Bat algorithm based tuning is employed for the automated selection of control parameters in the transformation. The performance of the optimization algorithm is compared against other metaheuristic algorithms such as Ant Colony Optimization (ACO) and Particle Swarm Optimization (PSO). It is noted that the bat algorithm based contrast enhancement outperforms the other optimization techniques in terms of metrics such as Peak Signal to Noise Ratio (PSNR), Mean Square Error (MSE), Absolute Mean Brightness Error (AMBE), Entropy and CPU time (Central Processing Unit).

1. Introduction

Remote sensing images are used in a range of applications such as agriculture, navigation, surveillance and so on. The images obtained from satellites being low quality have to be improved for better human perception and for other remote sensing applications [1]. In order to use the remote sensing images for advanced applications, it is necessary that the original information in the image is retained and the image quality is improved.
Over the years, many image enhancement techniques have been developed for improving the visibility of the remote sensing images. The most commonly used technique is Histogram Equalization (HE). Though the image is enhanced, there is a shift in the mean brightness of the image which does not make it ideal for human perception. To overcome this drawback, many variations of histogram equalization have been proposed [2]. Bi-histogram Equalization and Contrast Limited Adaptive Histogram Equalization are some of the modified HE. Even though, the quality of the image is improved to a great extent, the limitations of HE are still present. Contrast enhancement is another category of image enhancement which stretches the dynamic range of the image to improve the image visibility. It is one of the most critical problems faced in areas such as medical image processing [3,4], video processing and remote sensing [5,6]. An image contrast enhancement using sub-histogram equalization and fuzzy clustering is presented in [7]. Here the images are separated into sub-histograms by utilizing clustering technique based on the brightness level where the number of clusters is determined by the image histogram analysis. A non-uniform illumination correction using contrast optimization has an adaptive contrast enhancement involving fusion technique [8]. A histogram planting based contrast enhancement is presented in [9].
Gamma correction is yet another contrast enhancement technique which is a non-linear technique and modifies the individual image pixels [10]. Various modifications of gamma correction are also done to improve the performance of this method [11]. An image brightness enhancement using adaptive gamma correction involving fusion of source image, histogram equalized and gamma corrected images is proposed in [12]. A hybrid image enhancement using optimal gamma correction and weighted sum technique is presented in [13]. The weighted sum approach is mainly adopted for preserving the image brightness. Combining optimization algorithm with traditional contrast enhancement approaches is an upcoming area of research and is effective in improving the accuracy of the enhancement technique. A differential evolution based contrast and brightness enhancement of satellite images is presented in [14]. Another image enhancement technique involving DWT (Discrete Wavelet Transform) and SVD (Singular Value Decomposition) optimized using Artificial Bee Colony optimization is proposed in [15,16]. Here the DWT of the image is adaptively thresholded using the optimization technique. An image contrast enhancement utilizing Differential evolution is described in [17]. Here an optimal fuzzy system is designed for the enhancement of images. An adaptive histogram compaction for contrast enhancement is presented in [18]. A local remapping method is utilized to extend the dynamic range of the image. Another most prominent method for brightness preservation is fusion approach. A social spider based optimization for contrast enhancement is proposed in [19]. Here two enhanced version of the image namely: one with high PSNR (Peak Signal-to-Noise Ratio) and another with high entropy are considered.
In the proposed method, an optimized contrast stretching using bat optimization is presented wherein a histogram equalized image is subjected to a non-linear contrast stretching transformation to overcome the limitation of HE that it fails to preserve the image brightness. The enhanced image using the proposed method is compared against other optimization schemes such as ACO and PSO and the results are compared in terms of PSNR, MSE, AMBE, Entropy and CPU time. With the use of frequency tuning method in Bat algorithm, the variation of solution in the population is increased and utilizes zooming for balancing the exploitation and exploration during the search phase by imitating the changes in pulse emission and loudness of the bat while searching its prey.
The paper is organized as follows: Section 2 explains the materials and the proposed methodology. The sub divisions under this section explain contrast stretching transformation and the optimization algorithms in detail. Section 3 explains the experimental results of the enhanced image in terms of various performance metrics such as PSNR, MSE, AMBE, Entropy and CPU time for 3 different samples. Section 4 discusses the inference from the proposed work and finally, the conclusion of the paper with the future works is presented in Section 5.

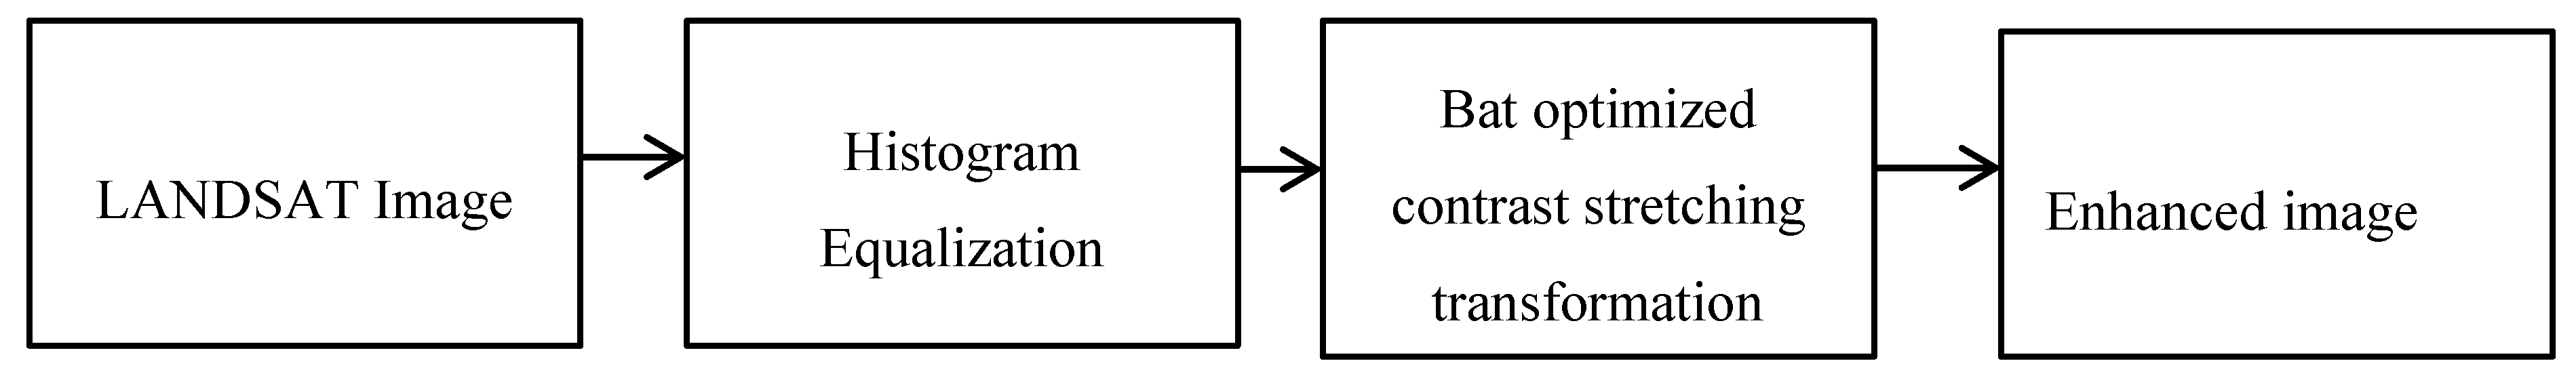
2. Materials and Methods

In this work, the input RGB (Red Green Blue) or true color image is transformed to HSI (Hue-Saturation-Intensity) color domain and the transformed intensity image is subjected to histogram equalization and this image is further enhanced using a bat algorithm based contrast stretching. Figure 1 shows the framework for contrast enhancement.
The histogram enhanced image by itself may not be suitable for further processing stages as it limits the brightness level of the entire image. In order to attain a better image quality, the histogram equalized image is contrast enhanced. Contrast stretching is done using a non-linear transformation whose parameters are optimized using various evolutionary algorithms including Bat algorithm, Ant Colony optimization and Particle swarm optimization and the performance metrics for the enhanced image is analyzed.

2.1. Histogram Equalization

Histogram equalization improves the global image contrast by distributing the image intensities. It leads to improvement in contrast of the low contrast images. It is done by spreading the most common intensity values.
Let X = X(i,j) be the source image to be equalized where X(i,j) is the intensity values in the image and made up of L discrete levels {X0, X1, X2, …, XL1} with X(i,j) ∈ {X0, X1, X2, …, XL1}. For the source image X, the probability density function or PDF p(Xk) is given using Equation (1) as [20]:
p ( X k ) = n k n ,
for k = 0, 1, 2, …, L − 1, where nk denotes the number of pixels having intensity Xk and n denotes the number of samples in the entire image X.
In relation to the image PDF, its cumulative distribution function or CDF is calculated using Equation (2) as:
c ( X k ) i = 0 k p ( X k )
where k = 0, 1, 2, …, L − 1. HE maps the source image to a wider range (X0, XL1) by employing CDF in the form of a transformation function which is defined using Equation (3) as:
f ( x ) = X 0 + ( X L 1 X 0 ) c ( X k )
and the histogram equalized output image Y = { Y(i,j)} can be computed using Equation (4) as:
Y = { f ( X ( i , j ) / X ( i , j ) X }
where (i,j) represents the co-ordinates of the image pixels.

2.2. Contrast Stretching Transformation

Spatial domain transformation on an input image f(x,y) is defined by the Equation (5) as [21]:
g ( x , y ) = T [ f ( x , y ) ] ,
where g(x,y) is the transformed image, T is the transformation operation applied on the input image in the neighborhood of pixels (x,y). The transformation is denoted using Equation (6) as:
g ( x , y ) = K ( x , y ) [ f ( x , y ) c m ( x , y ) ] + m ( x , y ) a
where a and c are the unknown variables, m(x,y) represents the mean of the input image centered around (x,y) by moving an n × n window over the entire image and K(x,y) is the contrast stretching function considering the local and global details in the image. The local mean of the image is described using Equation (7) as:
m ( x , y ) = 1 n × n x = 0 n 1 y = 0 n 1 f ( x , y )
The contrast stretching function K(x,y) is defined using Equation (8) as:
K ( x , y ) = k D σ ( x , y ) + b
where k and b are the contrast stretching parameters which control the extend by which the contrast is enhanced, D is the global mean and σ(x,y) is the standard deviation of (x,y) pixel in the image as the n × n window is moved around the image. D is defined using Equation (9) as:
D = 1 M × N m = 0 M 1 n = 0 N 1 f ( m , n )
where M × N denotes the image size and the standard deviation σ(x,y) is described using Equation (10) as:
σ ( x , y ) = 1 n × n x = 0 n y = 0 n ( f ( m , n ) m ( x , y ) ) 2
The contrast stretching transformation can be expanded to get Equation (11):
g ( x , y ) = k D σ ( x , y ) + b [ f ( x , y ) c m ( x , y ) ] + m ( x , y ] a
where k and b are the unknown parameters which control the extend of contrast stretching and a and c are the unknowns which decide the mean brightness of the image.
Satellite images are complex in size, color and textural variations. Manually tuning a, b, c and k for contrast stretching may not be a feasible solution considering the complexity and the number of satellite images. Also slight variations in the control parameters can lead to very dark or overly bright images which may not be pleasant for the human vision. Hence choice of the control parameters is critical. For this, selection of control parameters adaptively is preferred.

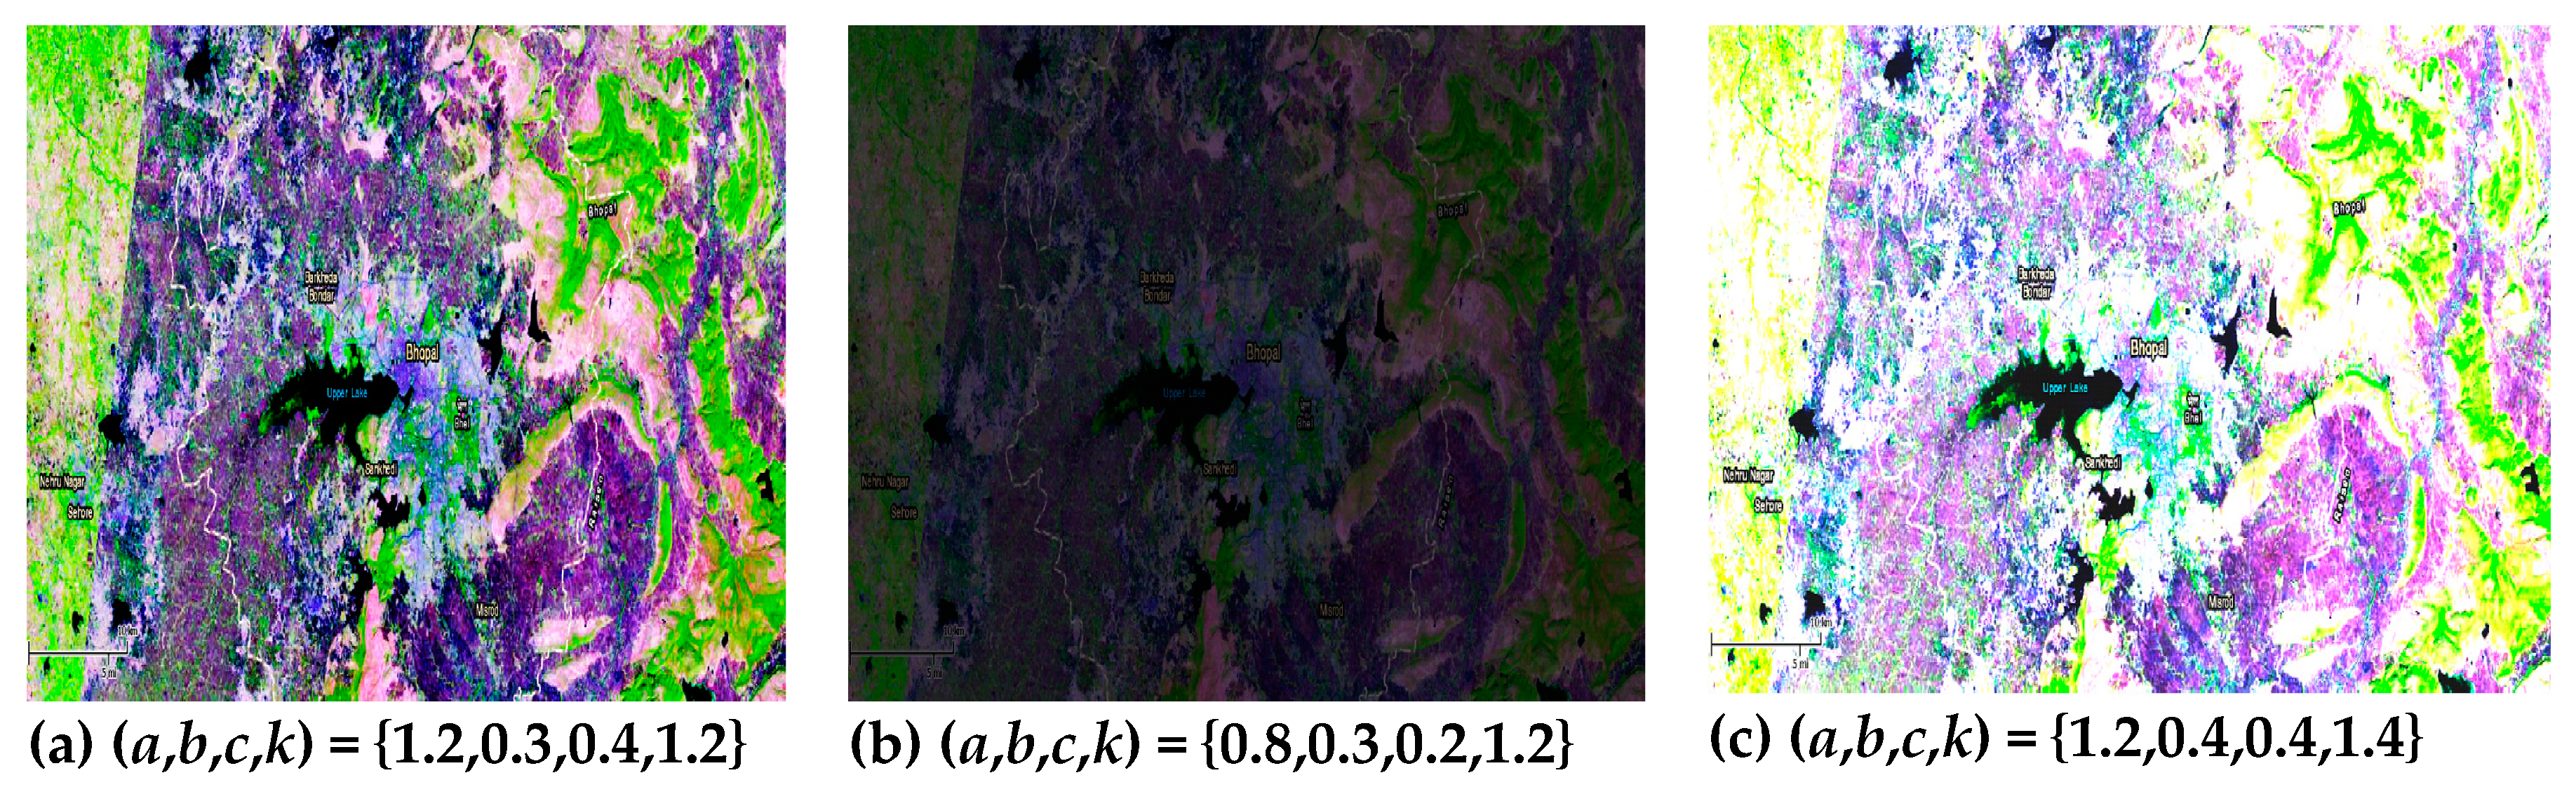
2.3. BAT Optimized Contrast Stretching

The parameters a, b, c and k control the contrast stretching enhancement. Finding the optimal values of these control parameters result in optimized contrast enhancement. Bat algorithm takes inspiration from the echo location behavior of the bat community. Bats uses a type of echo to detect the prey, to keep away from obstacles and locate their habitats in the dark. By listening to the echo which bounce back from the object, the bats decide their hunting strategies. The bat algorithm was developed based on three ideas [22].
(i)
Bats use the echos to measure the distance and can identify the difference between food and obstacles.
(ii)
Bats fly with a velocity vi at a position xi, having a frequency fmin and degree of loudness A0 to search the prey.
(iii)
The loudness of the bats vary by a great extend and changes from a large positive value A0 to a minimum value Amin.
The bat algorithm can be described as follows:
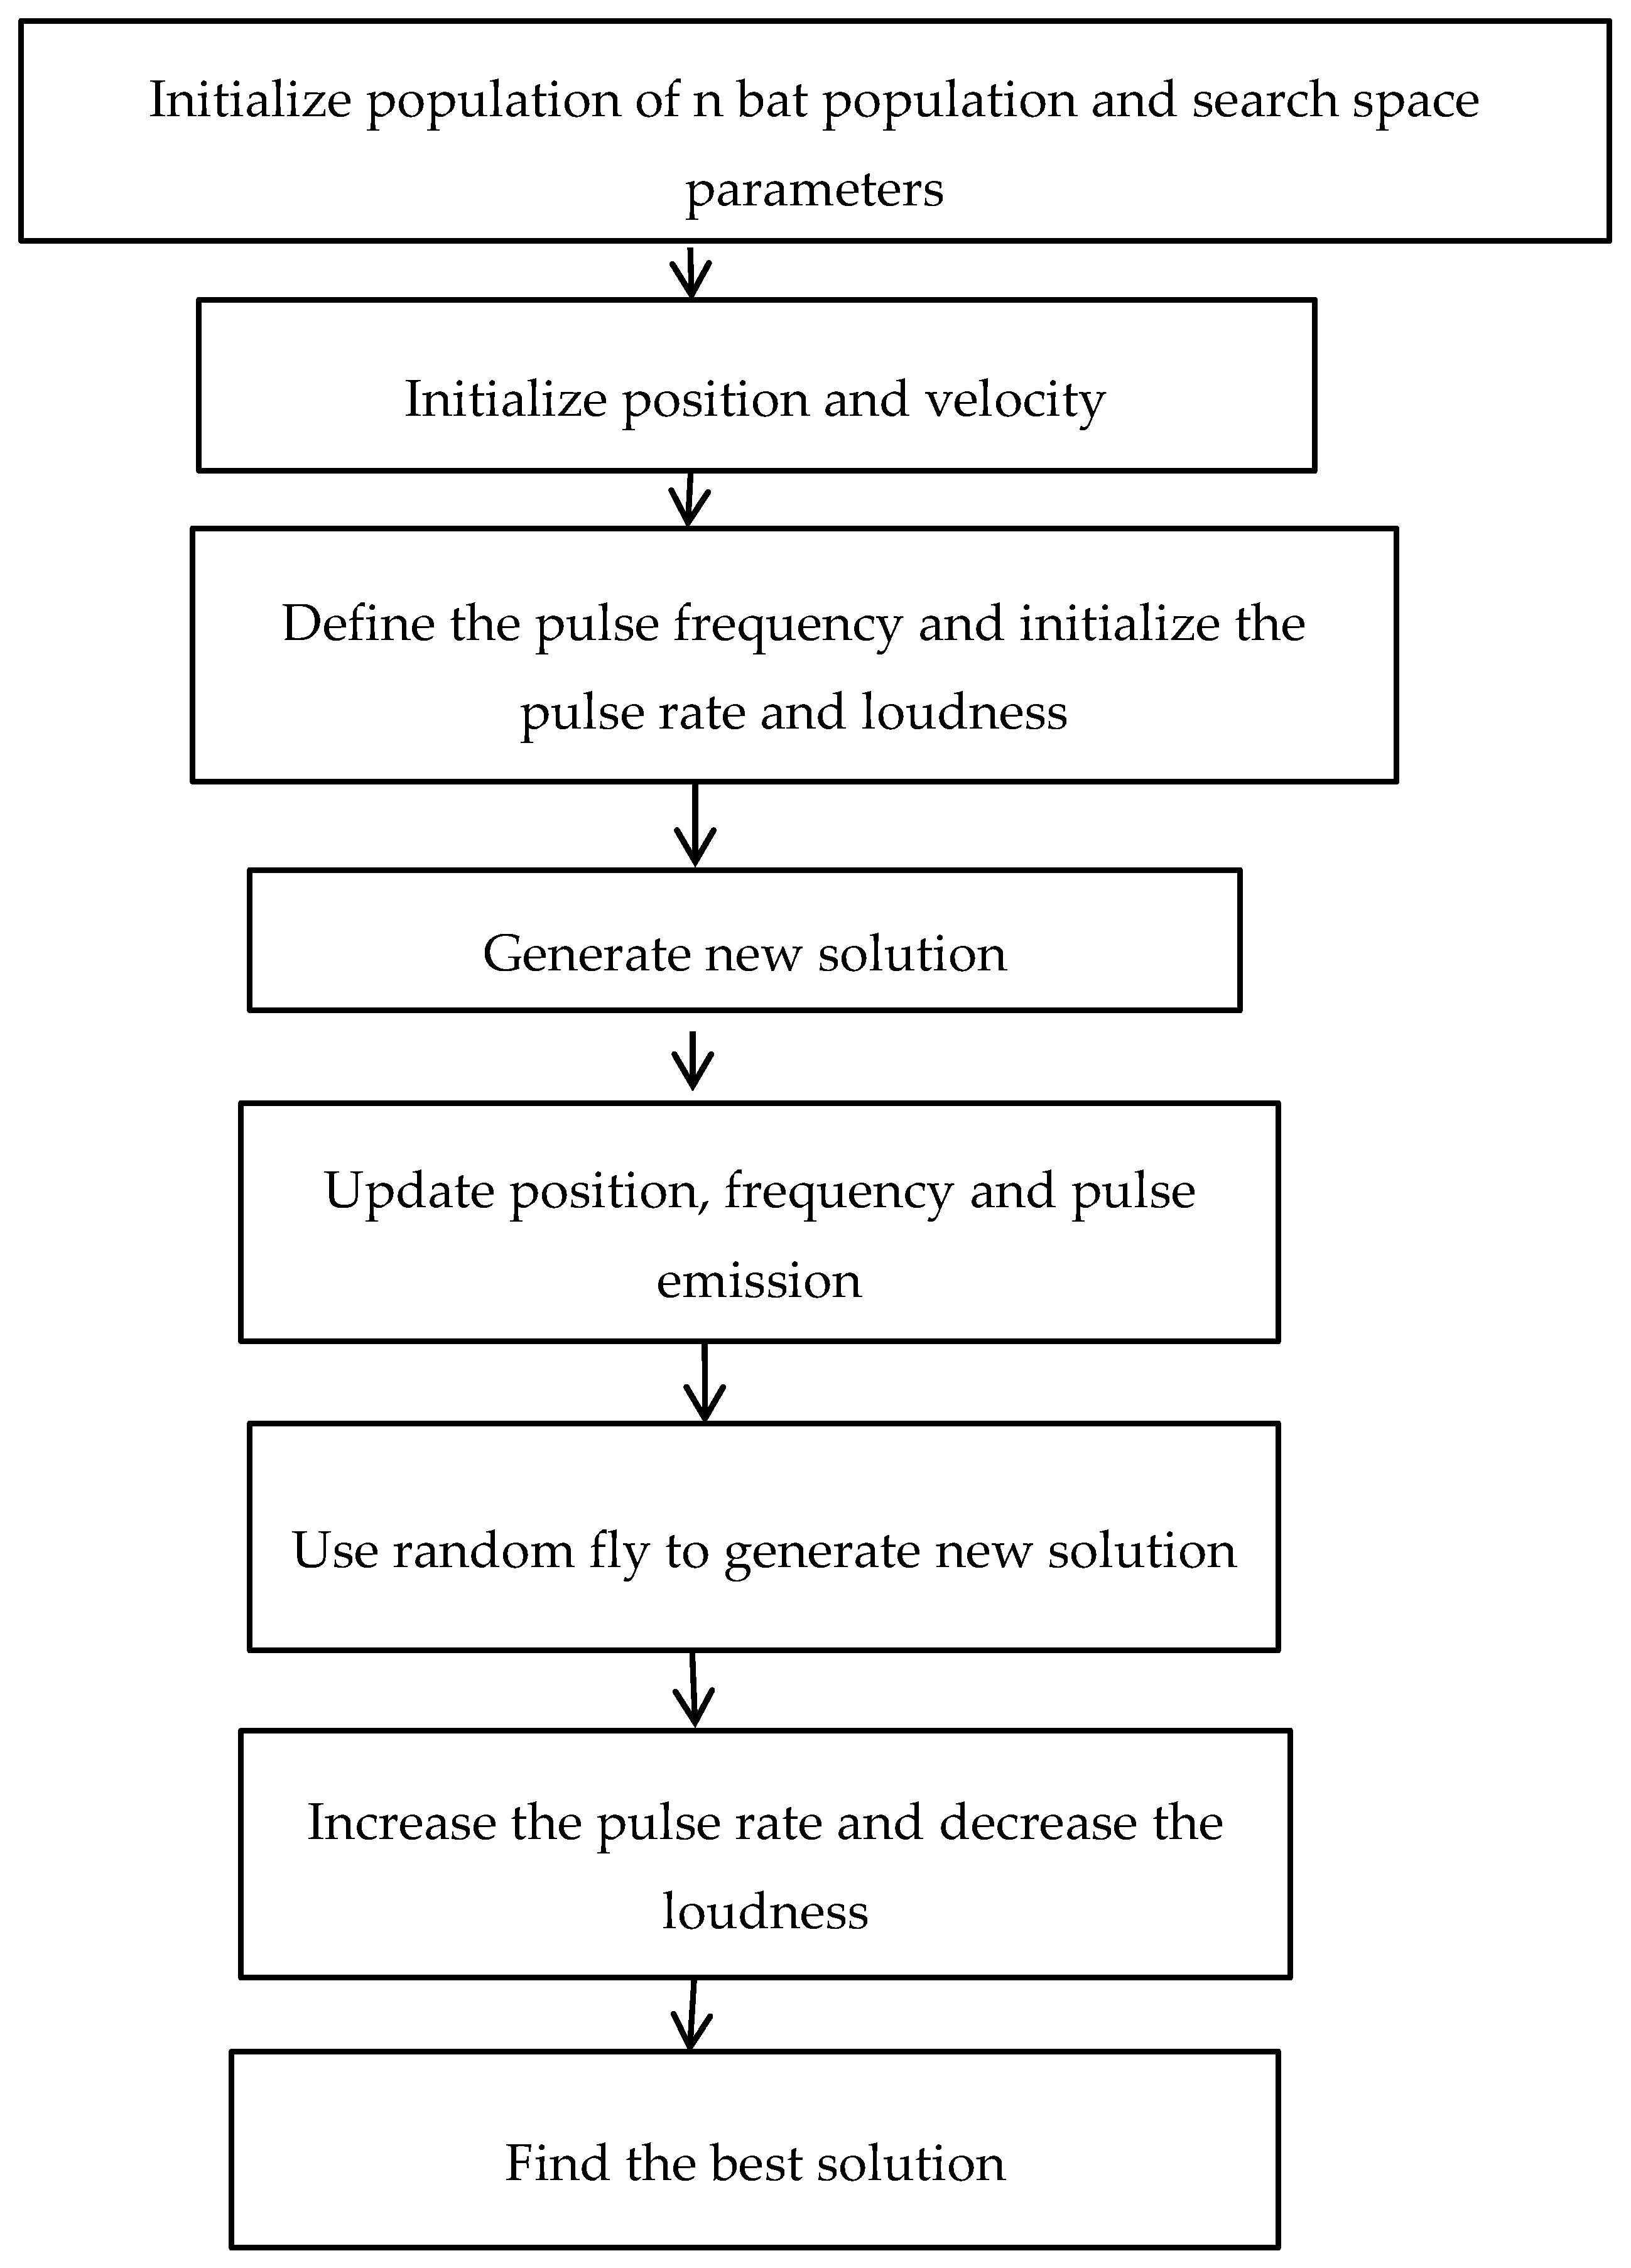
  • Initialize the n bat population randomly and it is considered that each bat represents a solution to the optimization problem. This algorithm is used to find the optimal values for a, b, c and k. The parameters of the bat algorithm are initialized. Let the bat population size n = 20, number of iterations = 100, pulse rate = 0.4, fmin = 0.1, fmax = 2, loudness = 0.5.
  • Initialize the search space for the control parameters a = [0, 1.5], b = [0, 0.5], c = [0, 1] and k = [0.5, 1.5].
  • Retain the current best value and find the new solutions by moving the bats around the search space. After each iteration, fitness value is computed and the new frequency, position and velocity are updated using Equations (12)–(14) as:
    f i = f min + ( f max f min ) β
    v i t = v i t 1 + ( x * x i t 1 ) f i
    x i t = x i t 1 + v i t
    where β is a random value in [0, 1], x* is the current best solution. Here the fitness value computed is the MSE. A local search to change the current best solution is performed using random walk and is given by Equation (15):
    x n e w = x * + ε A t
    where At is the average loudness of the bat and ε is a random value chosen from [−1,1]. The search path is modified in terms of the pulse rate r and loudness A which are also to be updated with the iteration using Equations (16) and (17):
    A i t + 1 = α A i t
    r i t + 1 = r i 0 ( 1 e γ t )
    where α and γ are constants such that 0 < α < 1 and γ > 0. Figure 2 shows the bat optimization algorithm.
The advantage of Bat algorithm is that it can automatically tune into region where promising solutions to the optimization problem can be found and has a very fast convergence rate. By using parameter control, the pulse rate and loudness can be varied as the iteration progresses such that as the optimal solution is reached, it can switch from exploration to exploitation phase easily.

2.4. ACO Optimization

ACO is based on the behavior of ants in their colony. While searching for food, the ants leave a trail of chemical called pheromone which helps the other ants in foraging for food. With time and increasing number of ants, the pheromone concentration varies using which the ants can arrive at their solution. The shortest path is found using the pheromone deposit. The ant selects the suceeding node based on the pheromone accumulation [23].This process continues until the solution is reached. The ant moves from node i to j with probability given by Equation (18) [24]:
p i , j = ( τ i , j α ) ( η i , j β ) ( τ i , j α ) ( η i , j β )
where τi,j represents the quantity of pheromone at the edge i, j. α controls the effect of τi,j, ηi,j represents the desirabilityof i, j and β controls the effect of ηi,j.
The amount of pheromone is calculated using Equation (19) as:
τ i , j = ( 1 ρ ) τ i , j + Δ τ i , j
where τi,j represents the quantity of pheromone at the edge i, j and ρ is the rate of pheromone evaporation.
The density of deposited pheromone at (i,j) by m ants is denoted using Equations (20) and (21) as:
Δ τ i , j = k = 1 m Δ τ i , j k
Δ τ i , j = Q L k
where Δτi,jk is the pheromone density, Q is a constant and L is the length of the route.

2.5. PSO Optimization
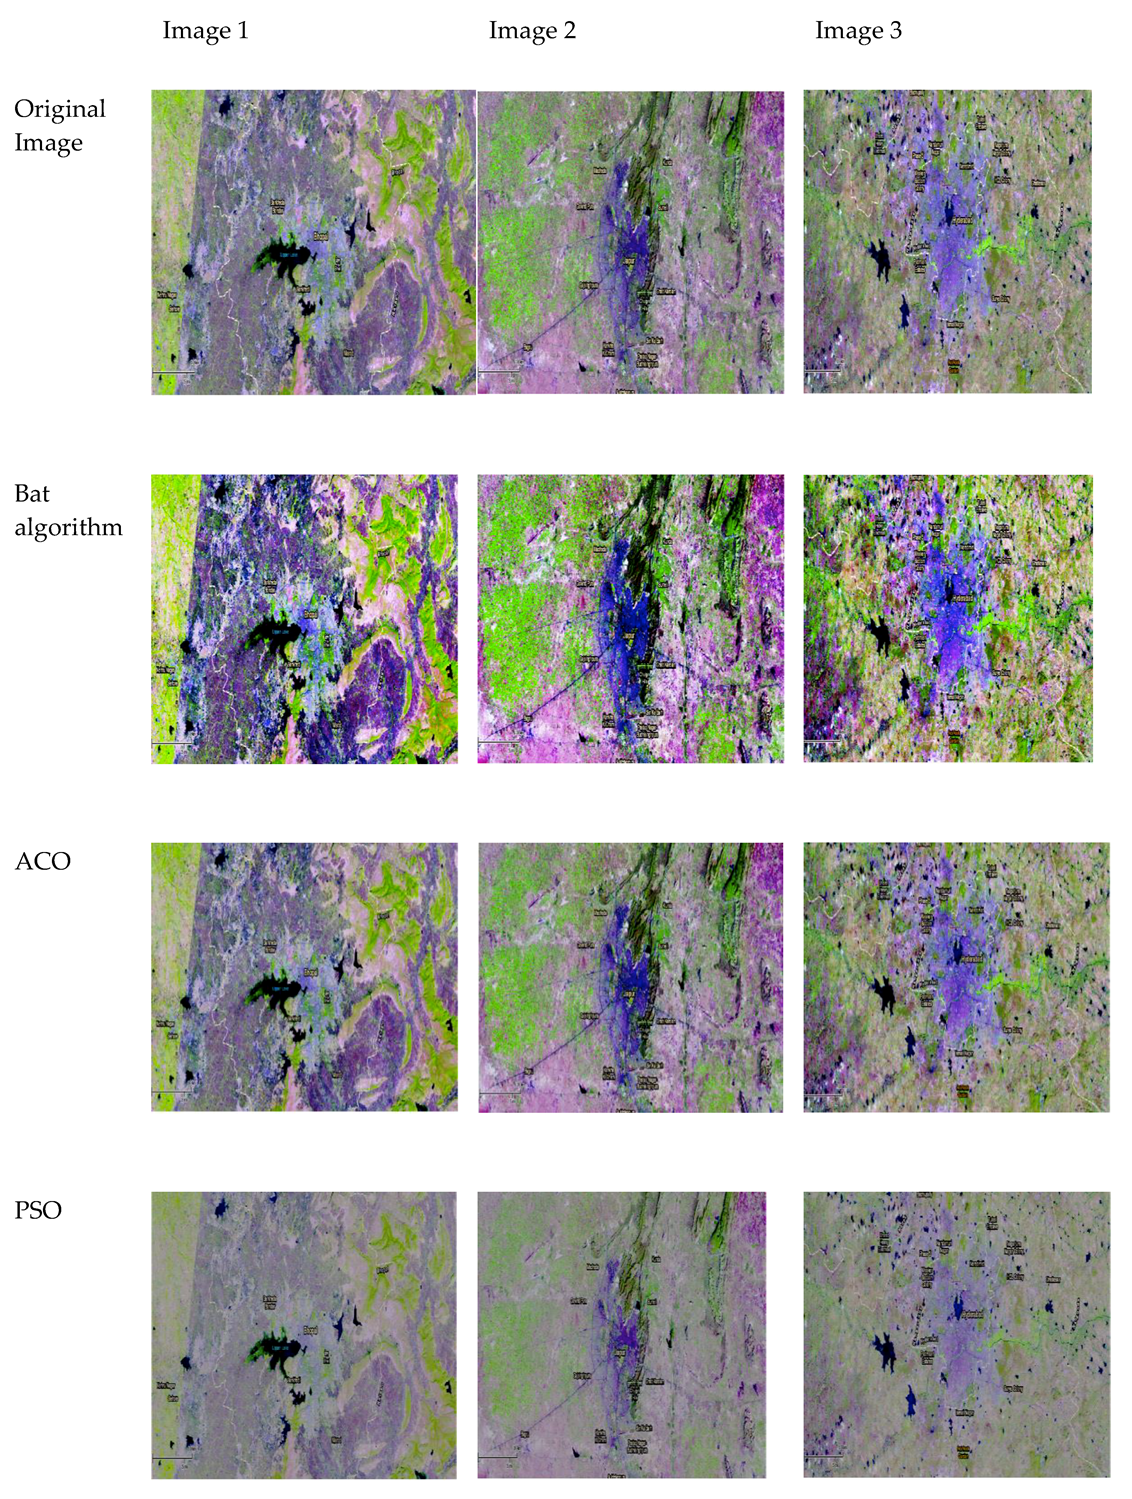
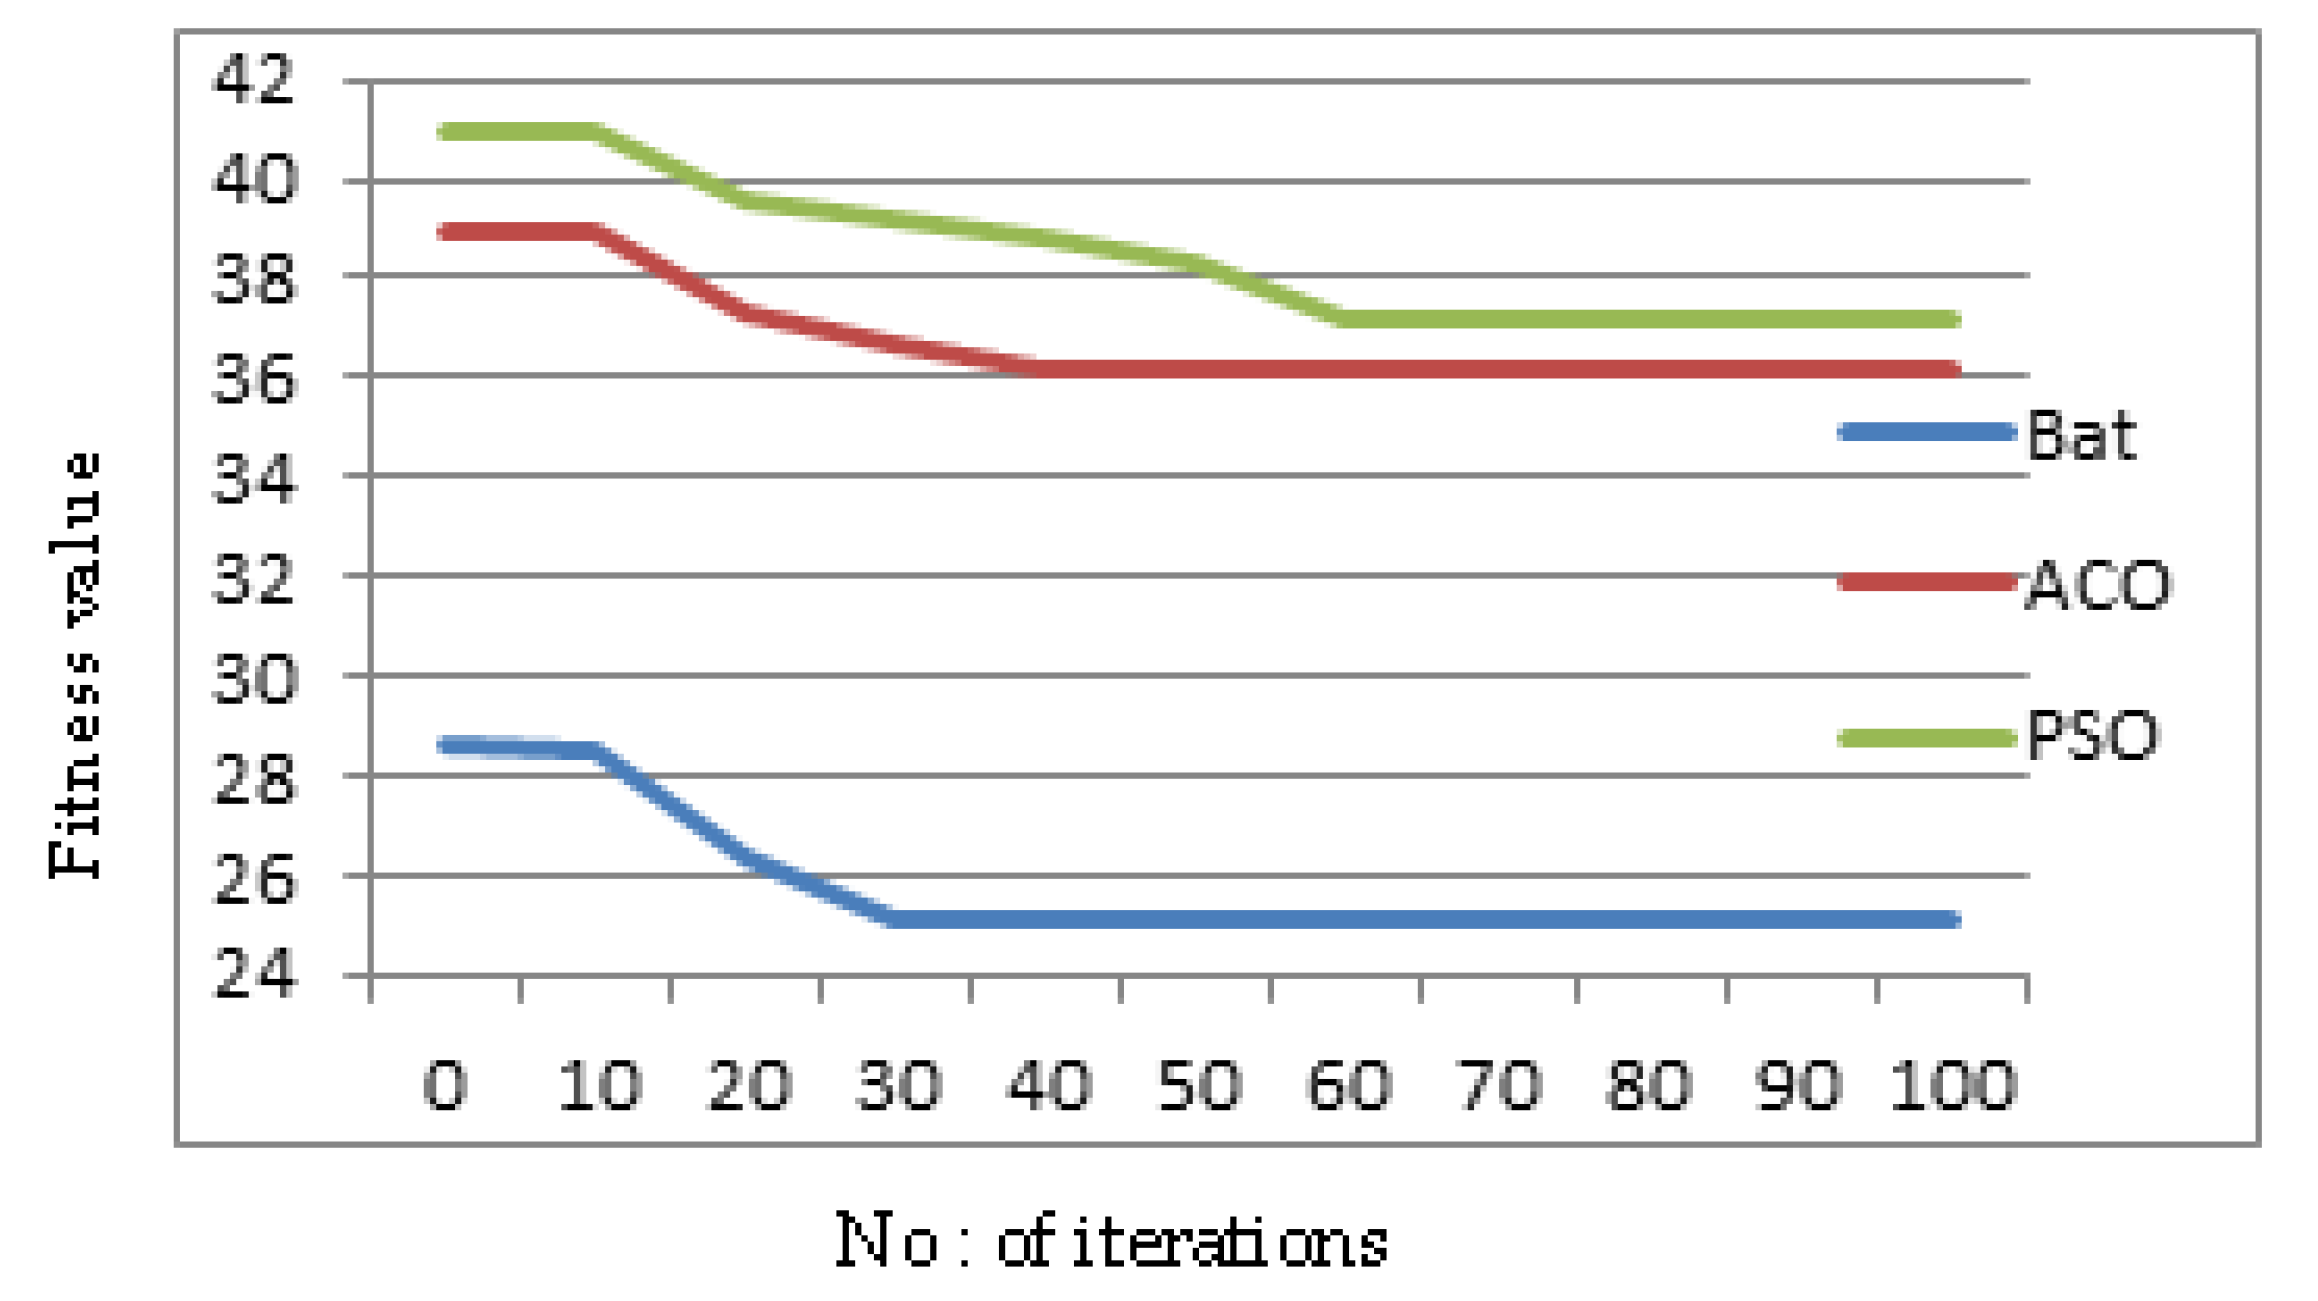
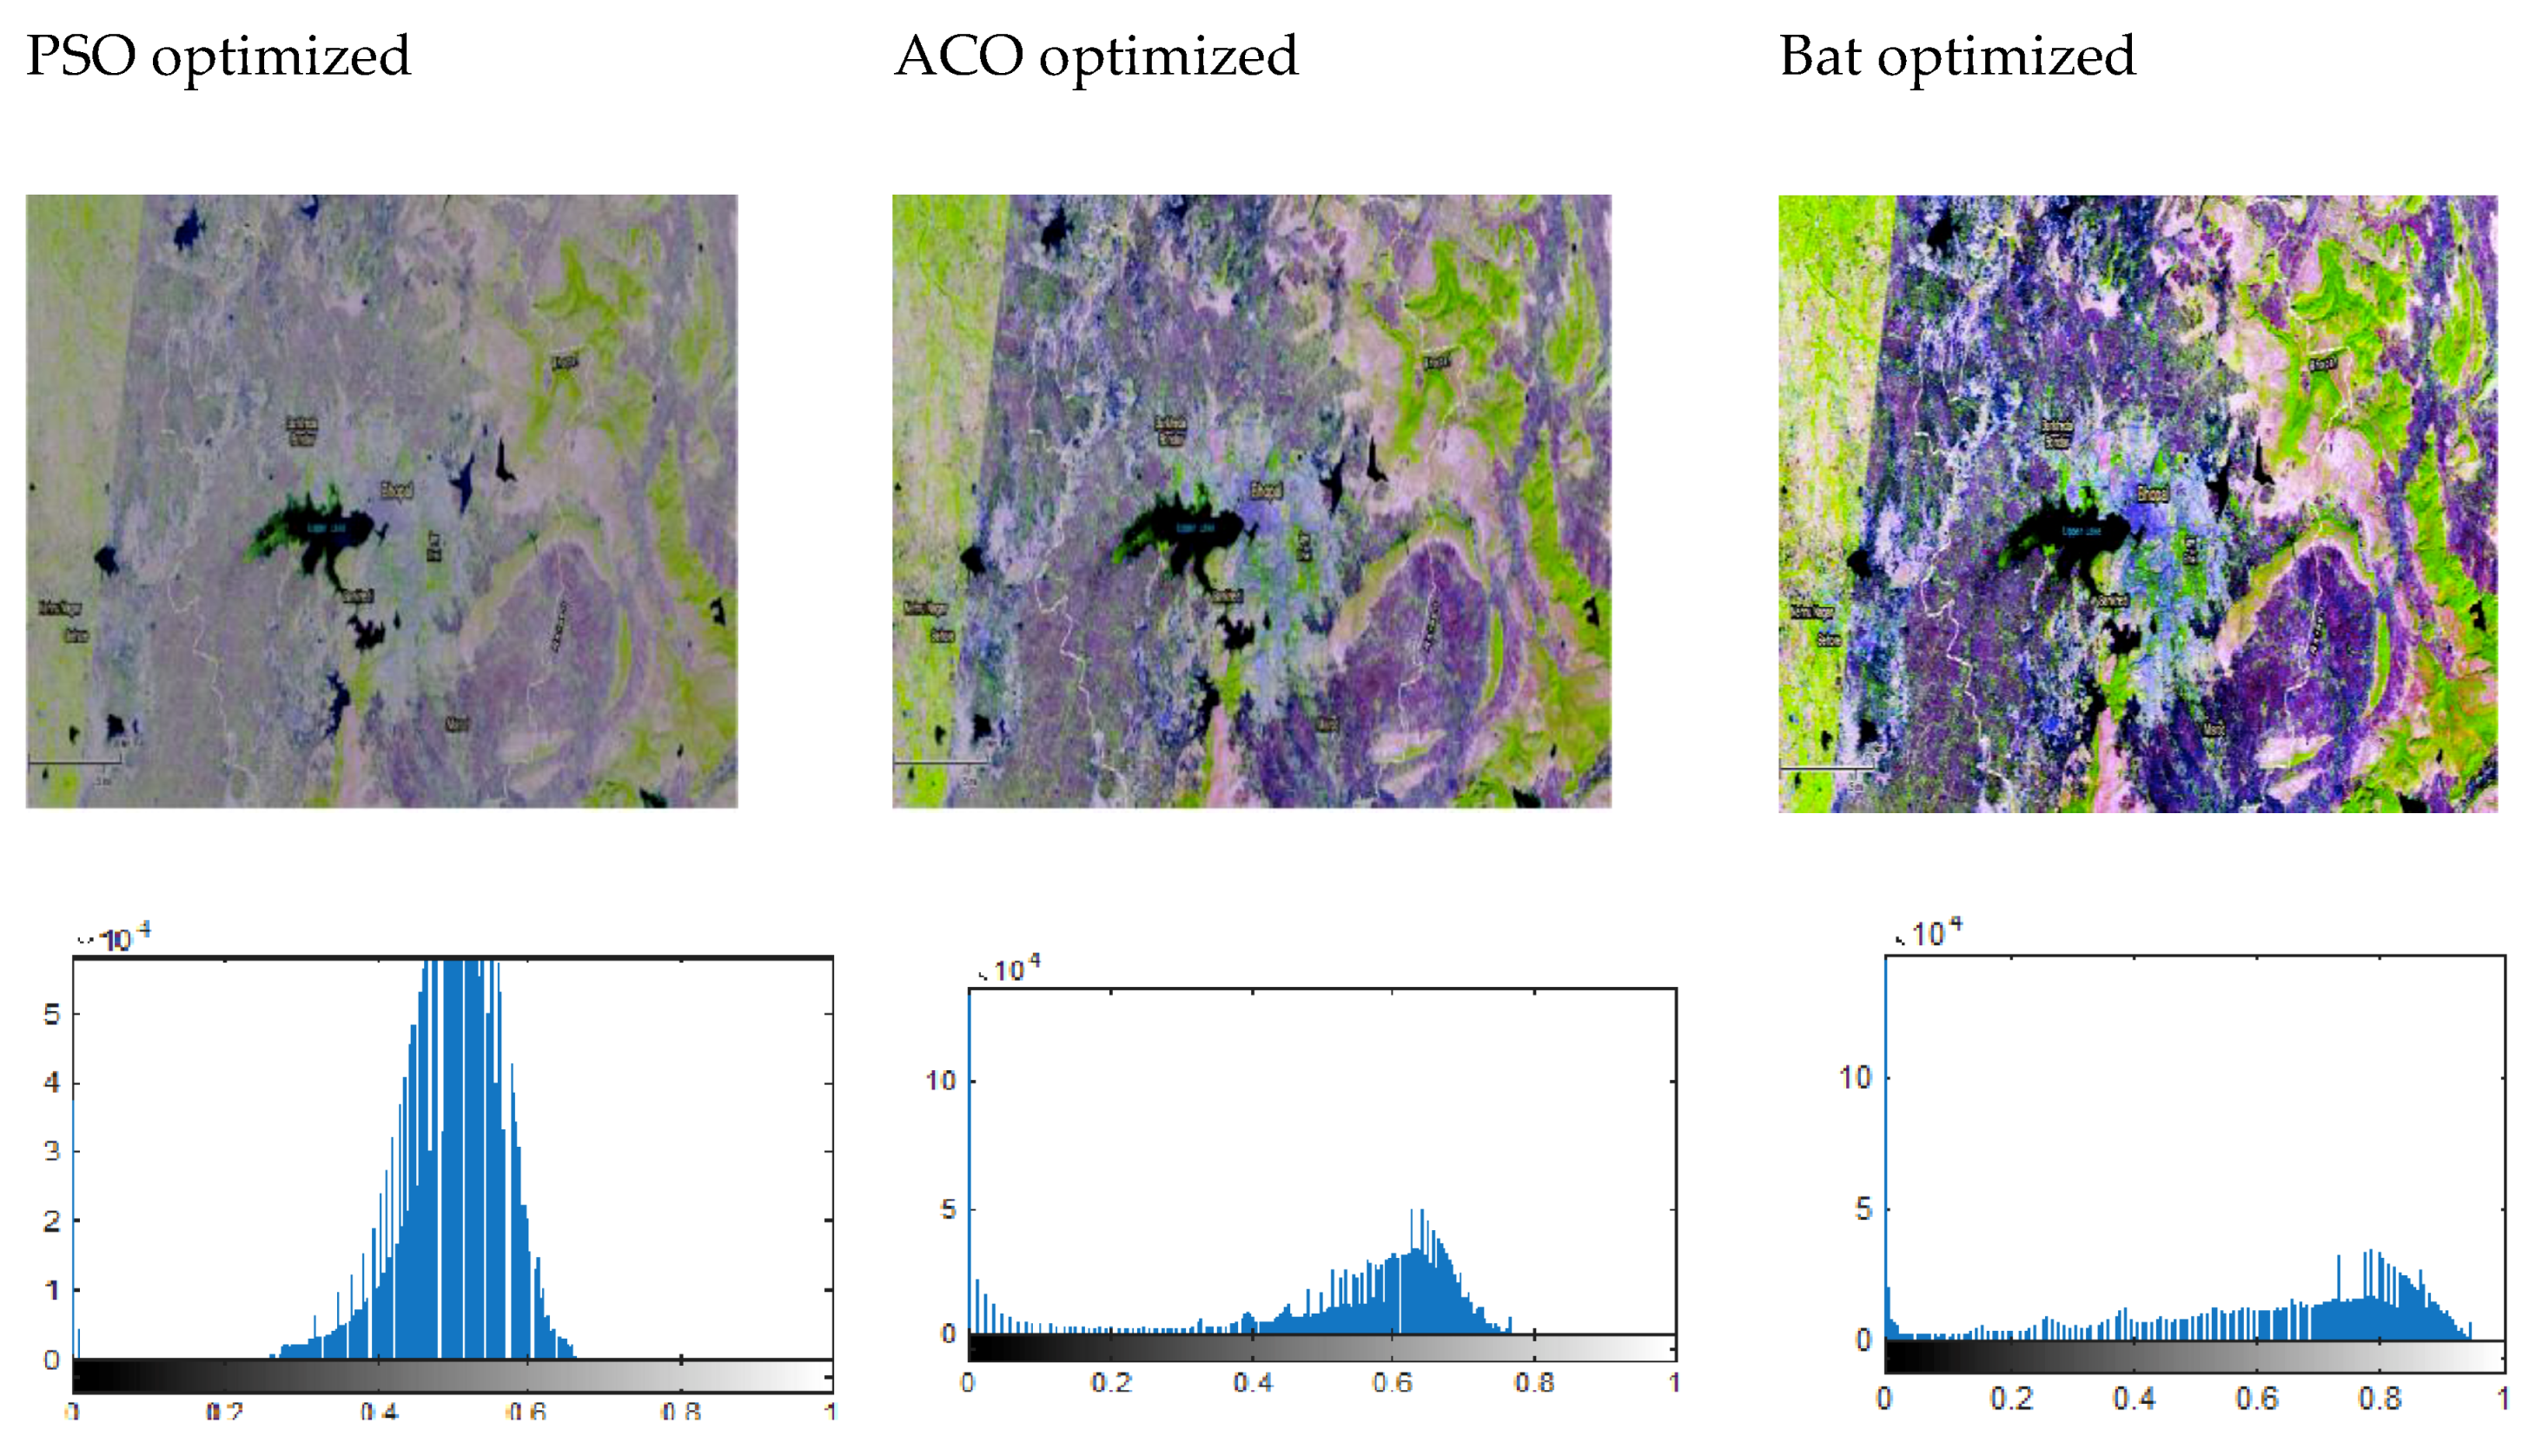
PSO is inspired by the behavior of a swarm of birds. The algorithm initiates each particle as the solution to the optimization problem under consideration. Each particle is identified by velocity with which it traverses the search space. The velocity and position of the particle gets updated following each iteration [25]. The algorithm remembers the best position of the particle and also considers its own previous best solution. Thus the particle best and global best solutions are found and the new velocity of the particle is updated using Equation (22) as [26]:
V i ( k + 1 ) = w × V i ( k ) + c 1 ϕ 1 ( P i b e s t ( k ) P i ( k ) ) + c 2 ϕ 2 ( G b e s t ( k ) P i ( k ) )
where Vi(k) is the ith particle’s velocity for time k, Pi(k) is the ith particle’s position for time k, Pibest is the best known position of ith particle and Gbest is the best position of the entire swarm, w is the weight factor, c1 and c2 denote the cognitive and social accelerating factor. ɸ1 and ɸ2 denote the uniformly distributed random numbers in the range 0 to 1.
The new position of the particle is found using Equation (23) as:
P i ( k + 1 ) = P i ( k ) + V i ( k + 1 )
Vi(k + 1) is the new velocity of ith particle, Pi(k) is the ith particle’s position for time k.

3. Results

To evaluate the effect of the control parameters on contrast stretching, a set of 30 LANDSAT images are considered as sample images and the results for 3 images are displayed. The images are taken Google Earth portal (http://earth.google.com). Table 1 gives the initialized parameters and their values for different optimization techniques. All the techniques are simulated in Matlab 2018a on an Intel(R) Core(TM) i3-4005U CPU @ 1.70GHz system. This system is manufactured by HP, Bangalore, India.
The performance evaluation of the enhanced image is done by comparing the enhanced contrast stretching results for different optimization technoques such as Bat algorithm, ACO and PSO in terms of performance metrics such as PSNR, MSE, AMBE, Entropy and CPU time. Table 2 show the comparison of performance metrics for different optimization techniques
PSNR and MSE measure the quality of the enhanced image. A high value of PSNR and a small value of MSE guarantees that the image quality has improved and is suitable for human vision. Entropy(H) is a measure of the information content present in the image. A high value of H ensures that all the details in the original image are retained in the enhanced image. Absolute Mean Brightness Error or AMBE is a measure of the change in the brigtness levels of the original image. AMBE is calculated using Equation (24) as:
A M B E = | X m Y m |
where Xm is the mean of the source image and Ym is the mean of the enhanced image. Smaller the value of AMBE, better is the brightness preservation.
It is seen that the values of MSE, AMBE and CPU time are lesser and PSNR and Entropy values are higher for the Bat optimized contrast stretching over other optimization techniques which indicate that the proposed technique outperforms other optimization techniques.On an average, the PSNR has increased to 44.9777 dB for Bat optimized contrast stretching over 34.2593 dB for PSO optimized contrast stretching. The entropy values have increased to 6.0519 for Bat optimized contrast stretching over 5.1059 for PSO optimized contrast stretching and CPU time has decreased to 220.8396 sec for Bat optimized contrast stretching over 428.8161 sec for PSO optimized contrast stretching. Figure 3 shows the enhanced images for different optimization techniques.
From Figure 3, it is clear the Bat optimized contrast stretching gives a better quality image over ACO and PSO based contrast stretching where the images are over darkened and not at all suitable for further image processing analysis.

4. Discussion

Contrast stretching is mainly used for enhancing the dynamic range of the low resolution satellite imagery and making it suitable for human vision. The non-linear contrast stretching transformation has four control variables a, b, c and k where a and c decide the mean brightness preservation and b and k decide the extent of contrast stretching. Selecting the values of a, b, c, and k manually can be difficult since a slight variation in the control parameter values can drastically affect the satellite image by over-stretching or under-stretching the image contrast which makes the image unpleasant to view. Figure 4 shows a sample image with selected values of control parameters.
It is clear from Figure 4 that manual tuning of the control parameters with a slight change in its values can over-stretch or under-stretch the image thus leading to bad quality images. Hence it is necessary that proper selection of parameters is critical for which we have optimized the control parameters for individual images. Saturation refers to the richness in color details in the image. Over stretching of the image contrast leads to saturation artifacts which gives the image an unrealistic appearance as shown in Figure 4c whereas under stretching of the image contrast leads to darker image as shown in Figure 4b which does not convey any details. Thus appropriate tuning of the parameters can limit the extent of contrast stretching and prevent over-saturation or under-saturation thereby retaining the natural color details in the image as shown in Figure 4a. Figure 5 represents the convergence plots for different optimization techniques.
From Figure 5, it is seen that the proposed bat optimization converges faster when compared to ACO and PSO optimizations. This is mainly attributed to the ability of Bat optimization to tune automatically into the region of possible solutions which makes this technique faster and leads to a reduced CPU time. Figure 6 shows the enhanced image outputs with the corresponding histogram plots.
From Figure 6, it is seen that the histogram plot for Bat optimized contrast stretching covers wider dynamic range when compared to the PSO and ACO optimized contrast stretching.

5. Conclusions

In this work, a bat algorithm for optimizing the control parameters of contrast stretching transformation is presented. The main aim of using bat optimization is that it can zoom into the region of potential solution automatically. In this method, a histogram equalized image is contrast enhanced using a non-linear transformation in which the control parameters are optimized using bat algorithm. The results of the enhanced image are compared against other optimization algorithms such as ACO and PSO. The results indicate that the proposed bat optimization based contrast stretching gives better results over ACO and PSO based contrast stretching. This technique can be extended by exploring hybrid optimization techniques and multi-objective functions to improve the accuracy of the technique.

Author Contributions

Formal analysis, A.A.; Conceptualization, D.E.P.; Supervision, J.A.; Validation, D.J.H. All authors have read and agreed to the published version of the manuscript.

Funding

This research has received no external funding.

Conflicts of Interest

The authors declare no conflict of interest.

References

  1. Kaplan, N.H. Remote sensing image enhancement using hazy image model. Optik 2018, 155, 139–148. [Google Scholar] [CrossRef]
  2. Wan, M.; Gu, G.; Qian, W.; Ren, K.; Chen, Q.; Maldague, X. Particle swarm optimization-based local entropy weighted histogram equalization for infrared image enhancement. Infrared Phys. Technol. 2018, 91, 164–181. [Google Scholar] [CrossRef]
  3. Rundo, L.; Tangherloni, A.; Nobile, M.S.; Militello, C.; Besozzi, D.; Mauri, G.; Cazzaniga, P. MedGA: A novel evolutionary method for image enhancement in medical imaging systems. Expert Syst. Appl. 2019, 119, 387–399. [Google Scholar] [CrossRef]
  4. Singh, M.; Verma, A.; Sharma, N. Bat optimization based neuron model of stochastic resonance for the enhancement of MR images. Biocybern. Biomed. Eng. 2017, 37, 124–134. [Google Scholar] [CrossRef]
  5. Tang, S.; Wu, B.; Zhu, Q. Combined adjustment of multi-resolution satellite imagery for improved geo-positioning accuracy. ISPRS J. Photogramm. Remote Sens. 2016, 114, 125–136. [Google Scholar] [CrossRef]
  6. Jadhav, B.D.; Patil, P.M. Satellite image resolution enhancement using Dyadic-integer coefficients based bi-orthogonal wavelet filters. Procedia Comput. Sci. 2015, 49, 17–23. [Google Scholar] [CrossRef] [Green Version]
  7. Shakeri, M.; Dezfoulian, M.H.; Khotanlou, H.; Barati, A.H.; Masoumi, Y. Image contrast enhancement using fuzzy clustering with adaptive cluster parameter and sub-histogram equalization. Digit. Signal Process. 2016, 1, 1–13. [Google Scholar] [CrossRef]
  8. Tian, Q.C.; Cohen, L.D. A variational-based fusion model for non-uniform illumination image enhancement via contrast optimization and color correction. Signal Process. 2018, 153, 210–220. [Google Scholar] [CrossRef] [Green Version]
  9. Chang, Y.C. A flexible contrast enhancement method with visual effects and brightness preservation: Histogram planting. Comput. Electr. Eng. 2018, 69, 796–807. [Google Scholar] [CrossRef]
  10. Singh, H.; Kumar, A.; Balyan, L.K.; Singh, G.K. A novel optimally weighted framework of piecewise gamma corrected fractional order masking for satellite image enhancement. Comput. Electr. Eng. 2017, 1–17. [Google Scholar] [CrossRef]
  11. Cao, G.; Huang, L.; Tian, H.; Huang, X.; Wang, Y.; Zhi, R. Contrast enhancement of brightness-distorted images by improved adaptive gamma correction. Comput. Electr. Eng. 2017, 66, 1–14. [Google Scholar] [CrossRef] [Green Version]
  12. Varghese, A.K.; Nisha, J.S. A Novel Approach for Image Enhancement Preserving Brightness Level using Adaptive Gamma Correction. Int. J. Eng. Res. 2015, 4, 842–847. [Google Scholar]
  13. Jiang, G.; Wong, C.Y.; Lin, S.C.F.; Rahman, M.A.; Ren, T.R.; Kwok, N.; Shi, H.; Yu, Y.H.; Wu, T. Image contrast enhancement with brightness preservation using an optimal gamma correction and weighted sum approach. J. Mod. Opt. 2015, 62, 536–547. [Google Scholar] [CrossRef]
  14. Suresh, S.; Lal, S. Modified differential evolution algorithm for contrast and brightness enhancement of satellite images. Appl. Soft Comput. J. 2017, 61, 622–641. [Google Scholar] [CrossRef]
  15. Bhandari, A.K.; Soni, V.; Kumar, A.; Singh, G.K. Artificial Bee Colony-based satellite image contrast and brightness enhancement technique using DWT-SVD. Int. J. Remote Sens. 2014, 35, 1601–1624. [Google Scholar] [CrossRef]
  16. Chen, J.; Yu, W.; Tian, J.; Chen, L.; Zhou, Z. Image contrast enhancement using an artificial bee colony algorithm. Swarm Evol. Comput. 2018, 38, 287–294. [Google Scholar] [CrossRef]
  17. Parihar, A.S.; Verma, O.P.; Yadav, D. Image Contrast Enhancement Using Differential Evolution. Lect. Notes Electr. Eng. 2018, 462, 517–526. [Google Scholar]
  18. Liu, J.; Zhou, C.; Chen, P.; Kang, C. An Efficient Contrast Enhancement Method for Remote Sensing Images. IEEE Geosci. Remote Sens. Lett. 2017, 14, 1715–1719. [Google Scholar] [CrossRef]
  19. Maurya, L.; Mahapatra, P.K.; Kumar, A. A social spider optimized image fusion approach for contrast enhancement and brightness preservation. Appl. Soft Comput. 2017, 52, 575–592. [Google Scholar] [CrossRef]
  20. Santhi, K.; Wahida Banu, R.S.D. Adaptive contrast enhancement using modified histogram equalization. Optik 2015, 126, 1809–1814. [Google Scholar] [CrossRef]
  21. Panigrahi, B.K.; Suganthan, P.N.; Das, S.; Satapathy, S.C. Differential Evolution for Optimizing the Hybrid Filter Combination in Image Edge Enhancement. In Swarm, Evolutionary, and Memetic Computing Second; Springer: Berlin, Germany, 2011; pp. 1–352. ISBN 9783642272417. [Google Scholar]
  22. Tuba, M.; Jordanski, M.; Arsic, A. Improved weighted thresholded histogram equalization algorithm for digital image contrast enhancement using the bat algorithm. In Bio-Inspired Computation and Applications in Image Processing; Academic Press: Amsterdam, The Netherlands, 2016; ISBN 9780128045367. [Google Scholar]
  23. Oonsrikaw, Y.; Thammano, A. Modified ant colony optimization algorithm for multiple-vehicle traveling salesman problems. Int. J. Netw. Distrib. Comput. 2018, 7, 29–36. [Google Scholar] [CrossRef] [Green Version]
  24. Mary, G.G.; Rani, M.M.S. Application of ant colony optimization for enhancement of visual cryptography images. In Nature Inspired Optimization Techniques for Image Processing Applications; Springer: Berlin, Germany, 2019; pp. 147–163. [Google Scholar]
  25. Bhandari, A.K.; Kumar, D.; Kumar, A.; Singh, G.K. Optimal sub-band adaptive thresholding based edge preserved satellite image denoising using adaptive differential evolution algorithm. Neurocomputing 2016, 174, 698–721. [Google Scholar] [CrossRef]
  26. Singh, H.; Kumar, A.; Balyan, L.K.; Singh, G.K. Swarm intelligence optimized piecewise gamma corrected histogram equalization for dark image enhancement. Comput. Electr. Eng. 2017, 70, 1–14. [Google Scholar] [CrossRef]
Figure 1. Contrast enhancement framework.
Geosciences 10 00078 g001
Figure 2. Bat optimization algorithm.
Geosciences 10 00078 g002
Figure 3. Enhanced outputs for different optimization.
Geosciences 10 00078 g003
Figure 4. Optimization results for sample image (a) Bat optimized contrast stretching (b) under-stretched image (c) over-stretched image.
Geosciences 10 00078 g004
Figure 5. Convergence plot.
Geosciences 10 00078 g005
Figure 6. Histogram plots for image outputs.
Geosciences 10 00078 g006
Table 1. Optimization parameters.
AlgorithmsParametersValues
PSOSwarm size200
Number of iterations100
Cognitive and social acceleration Constant (c1, c2)2.2
Inertia weight (w)0.9
ACOInitial pheromone0.5
Evaporation rate0.1
Population size200
Number of iterations100
Bat optimizationBat population size20
Number of iterations100
Pulse rate0.4
fmin0.1
fmax2
Loudness0.5
Table 2. Performance comparison for various optimization.
Technique PSNR (dB)MSEAMBEEntropyCPU Time (sec)
Bat algorithm optimized contrast stretchingSample 146.499525.16629.81246.1722216.1233
Sample 245.311226.719012.78356.0912222.3012
Sample 343.122528.463312.90345.8924224.0944
ACO optimized contrast stretchingSample 136.901934.211311.10935.5105362.0443
Sample 238.112232.901314.90125.3922356.6544
Sample 336.788333.813613.99835.3422359.1456
PSO optimized contrast stretchingSample 134.008437.110516.90125.2101421.3429
Sample 235.648837.014418.94815.1044435.0934
Sample 333.120939.204119.20185.0023430.0122

