Three-Dimensional Response of the Supported-Deep Excavation System: Case Study of a Large Scale Underground Metro Station


Abstract
1. Introduction
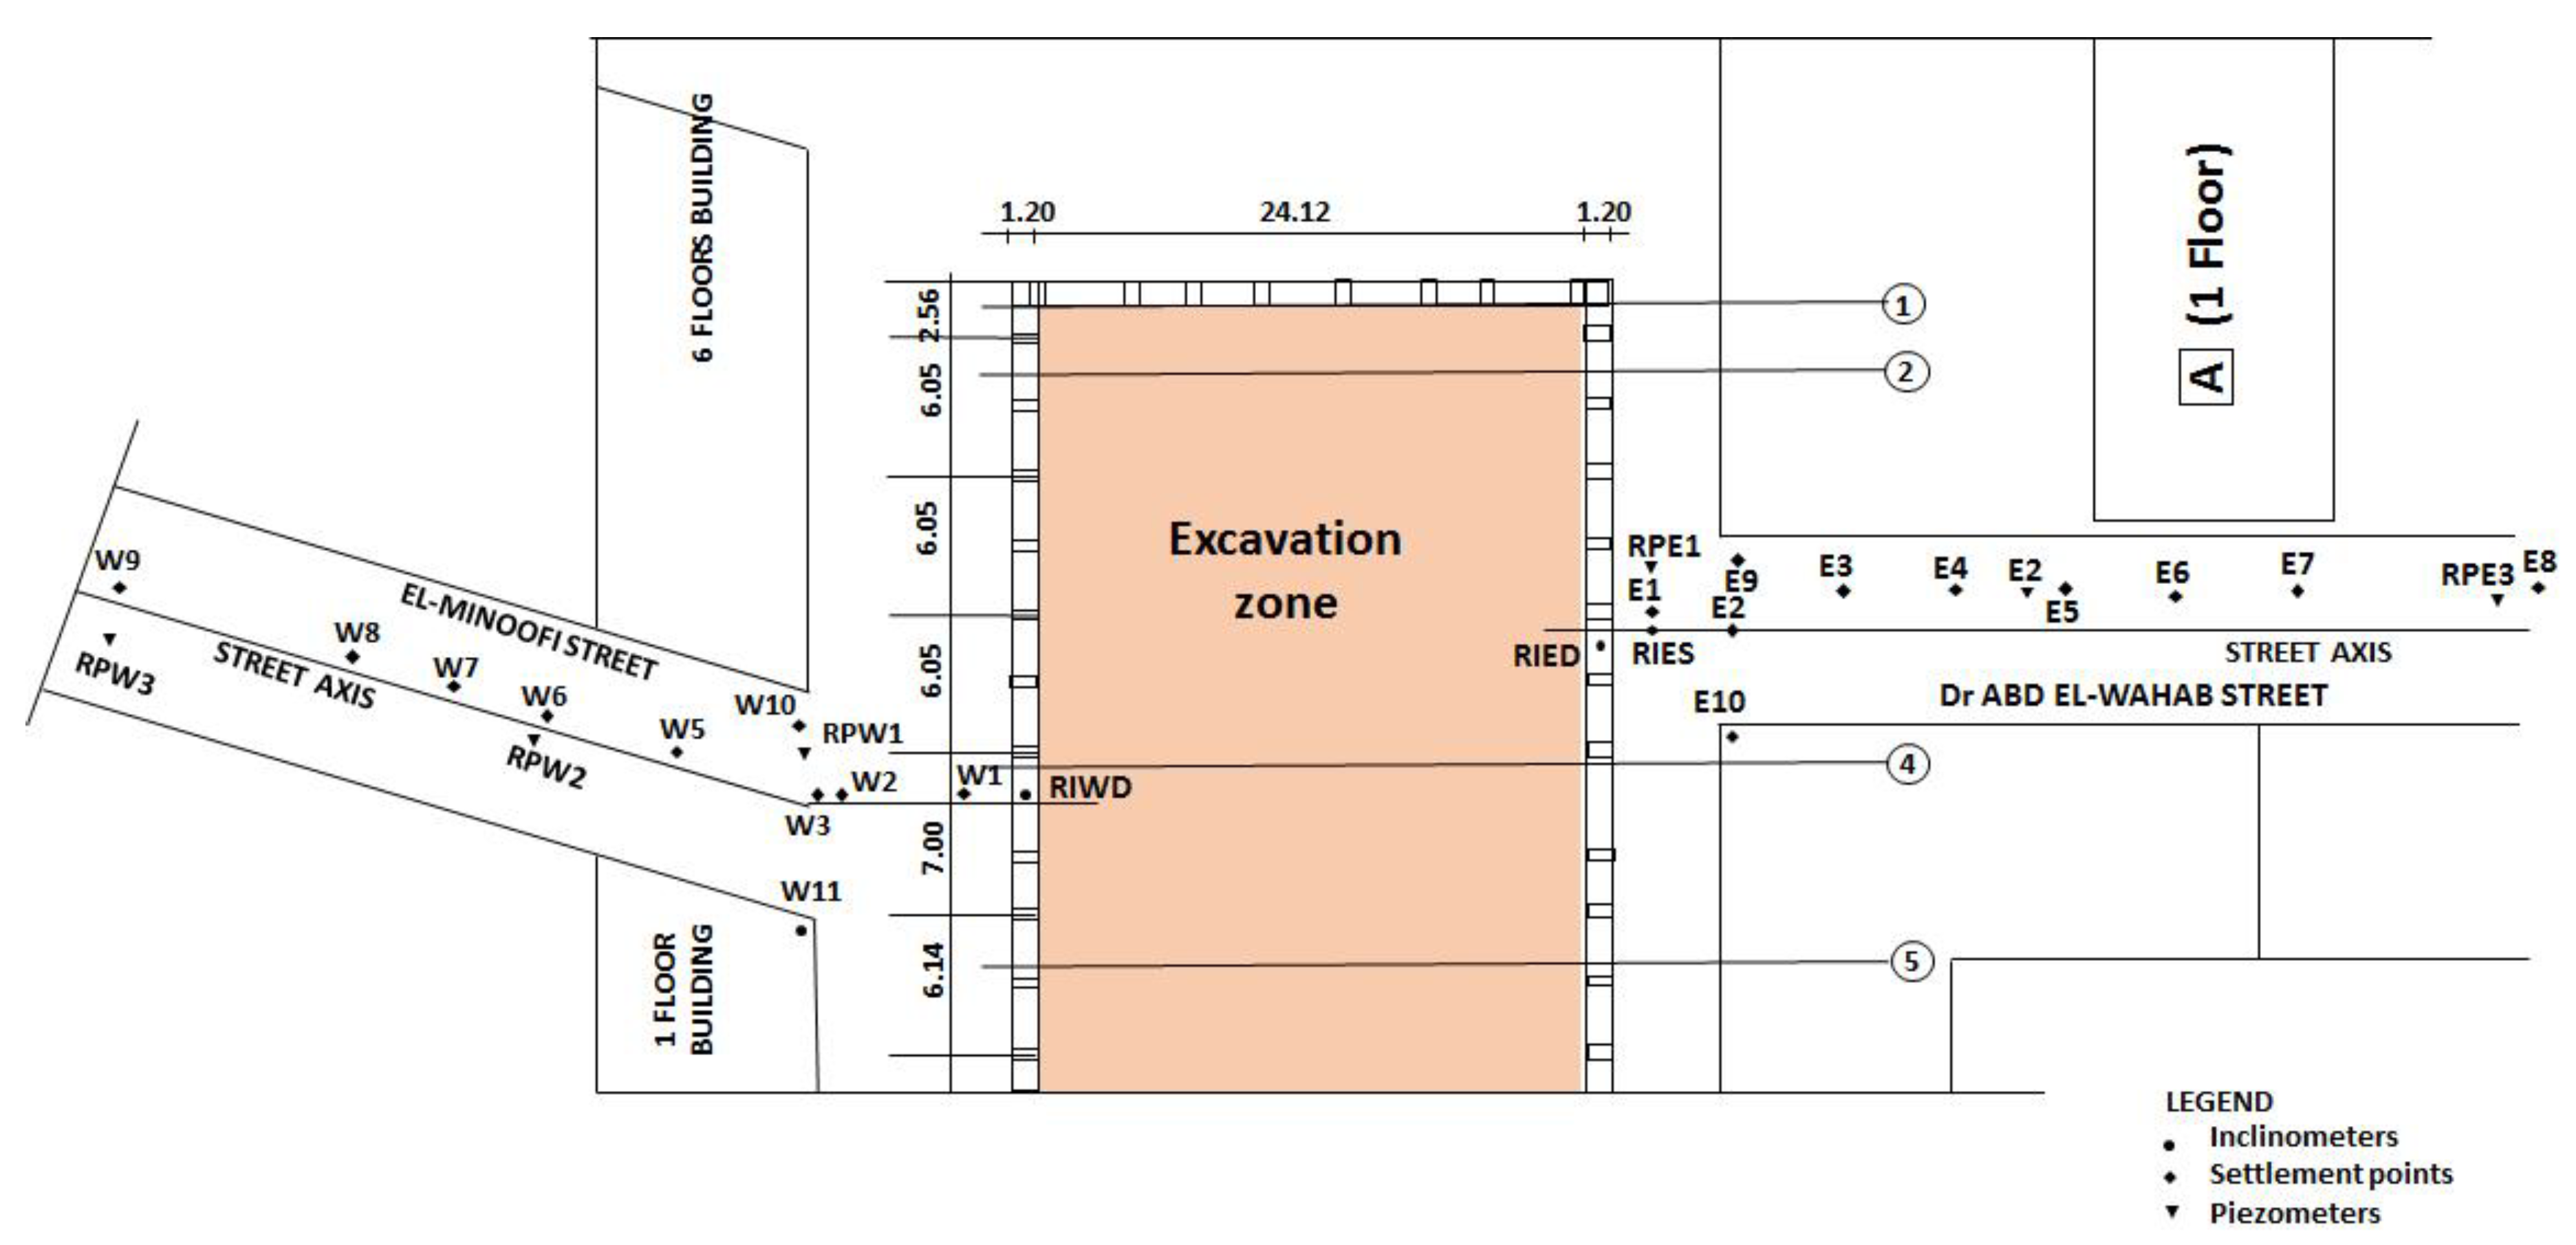
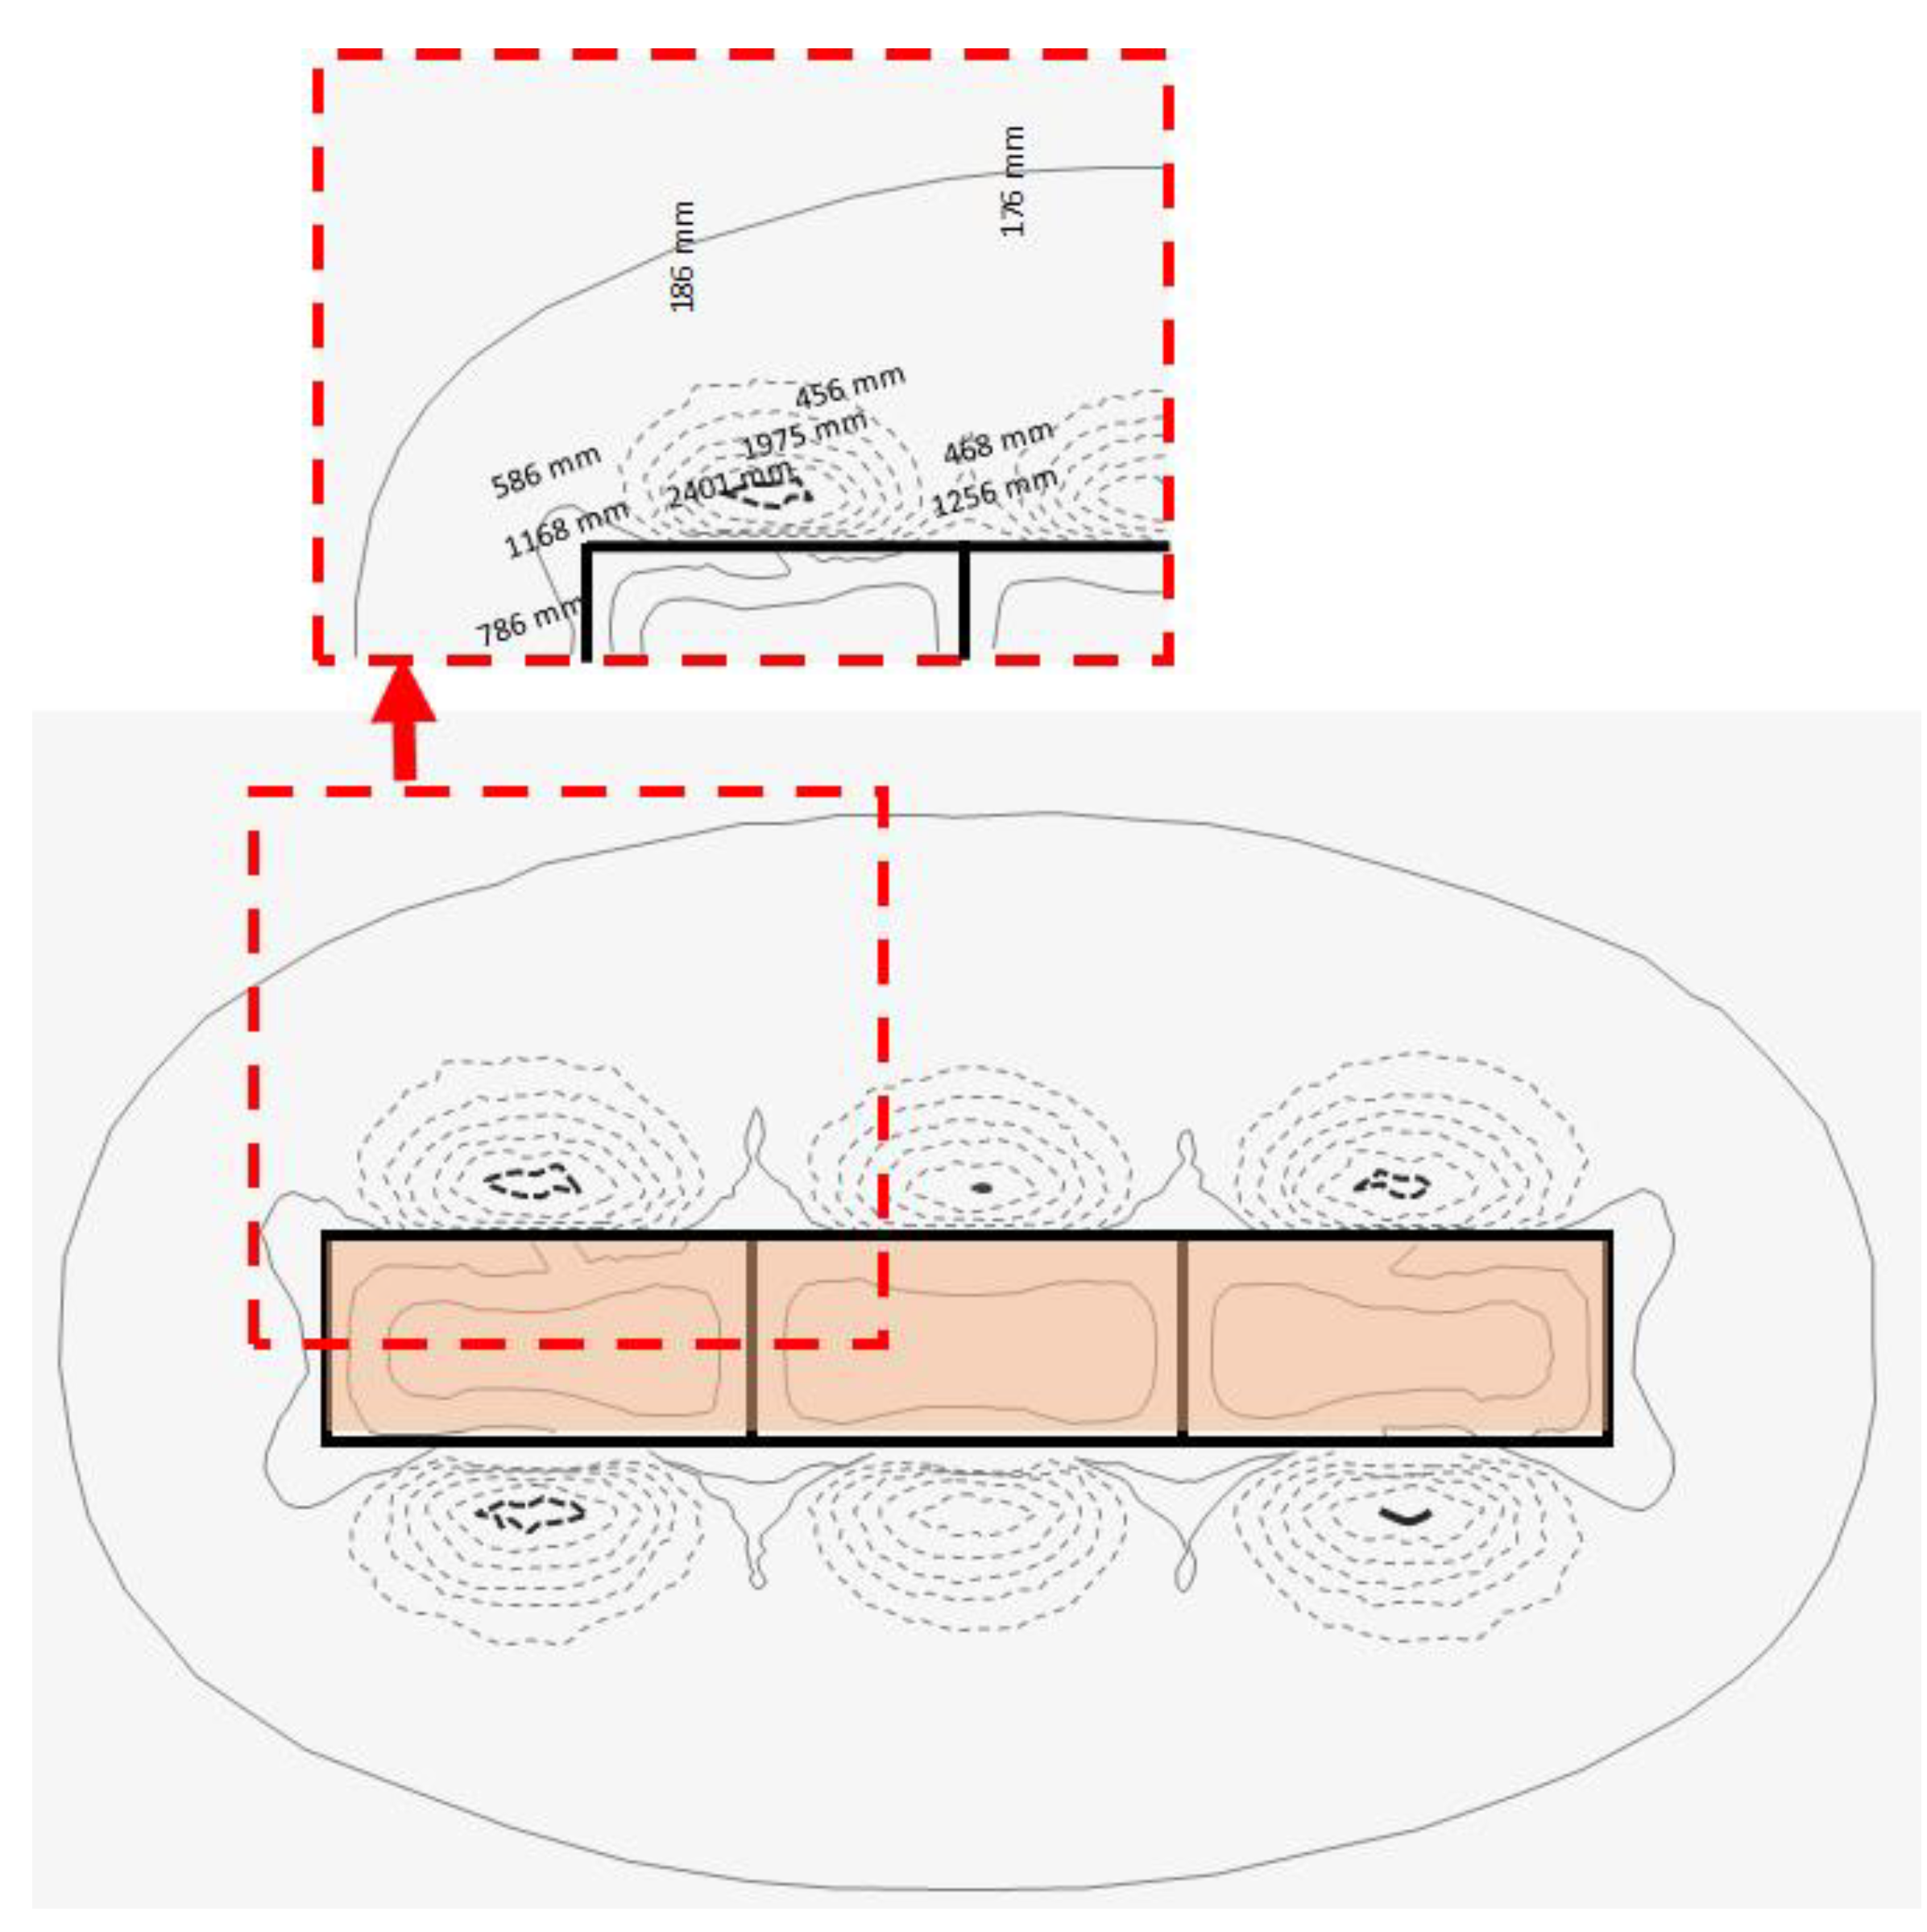
2. Case Study
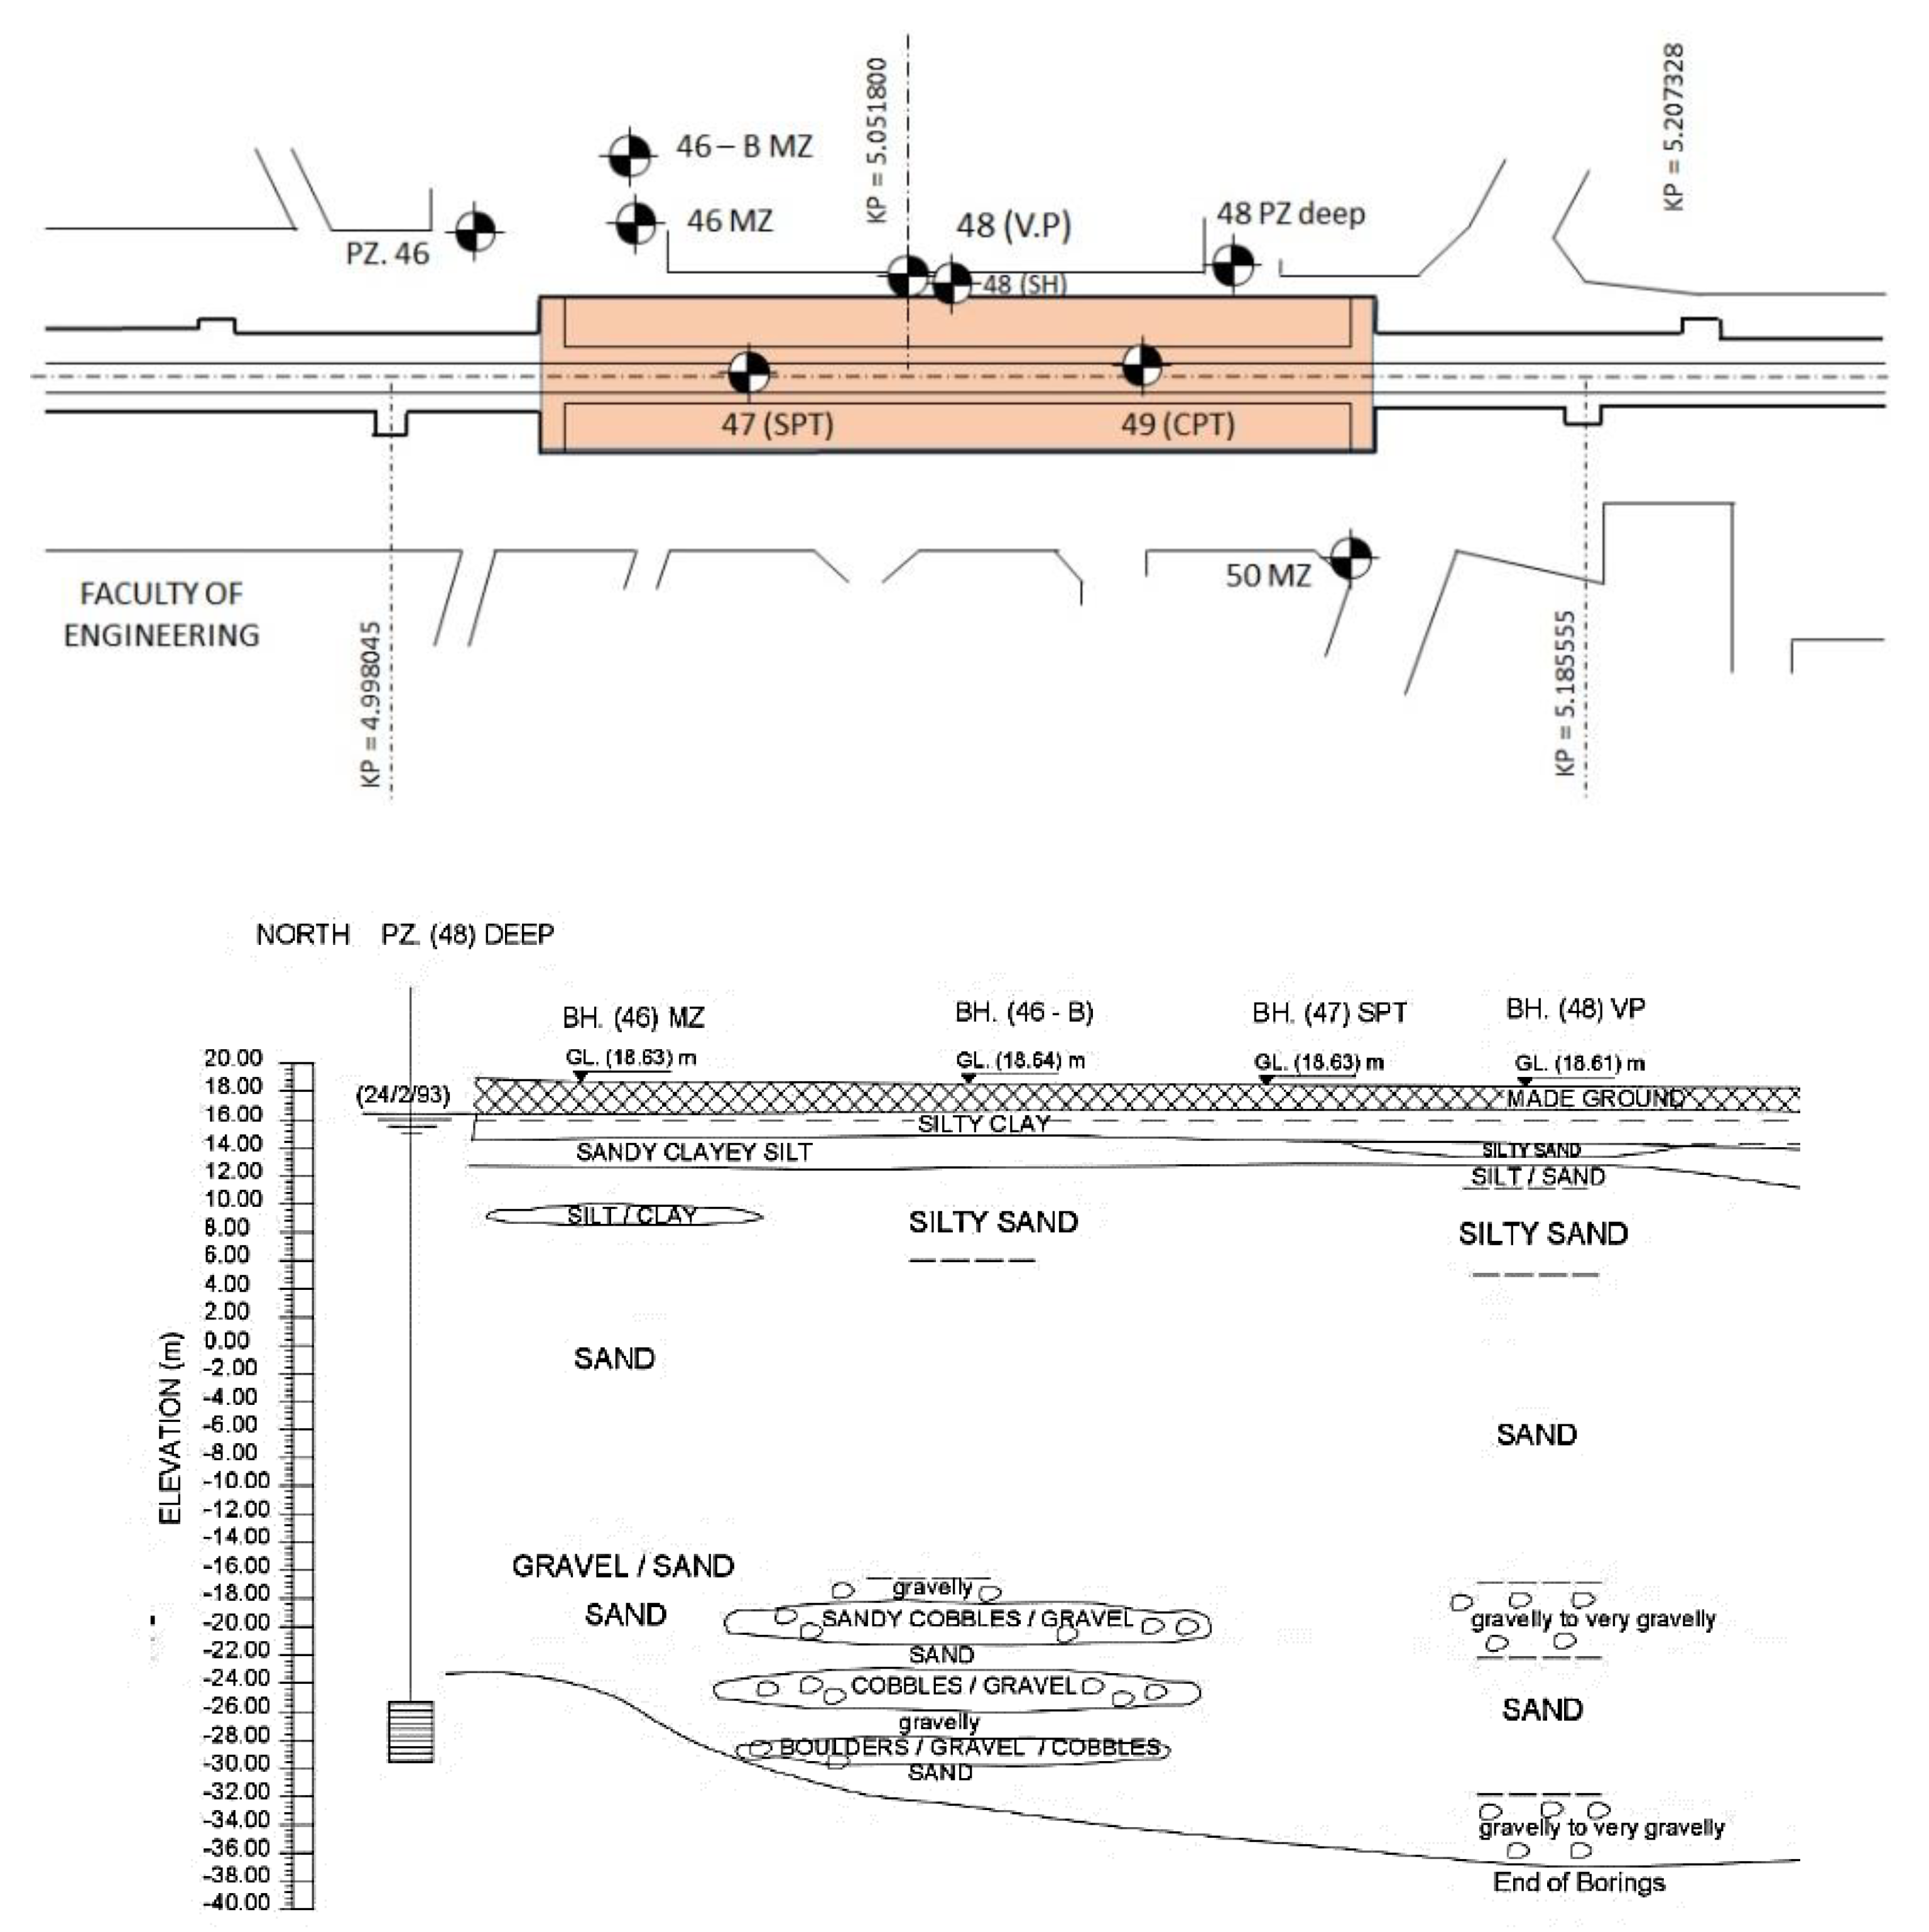
2.1. Site Conditions
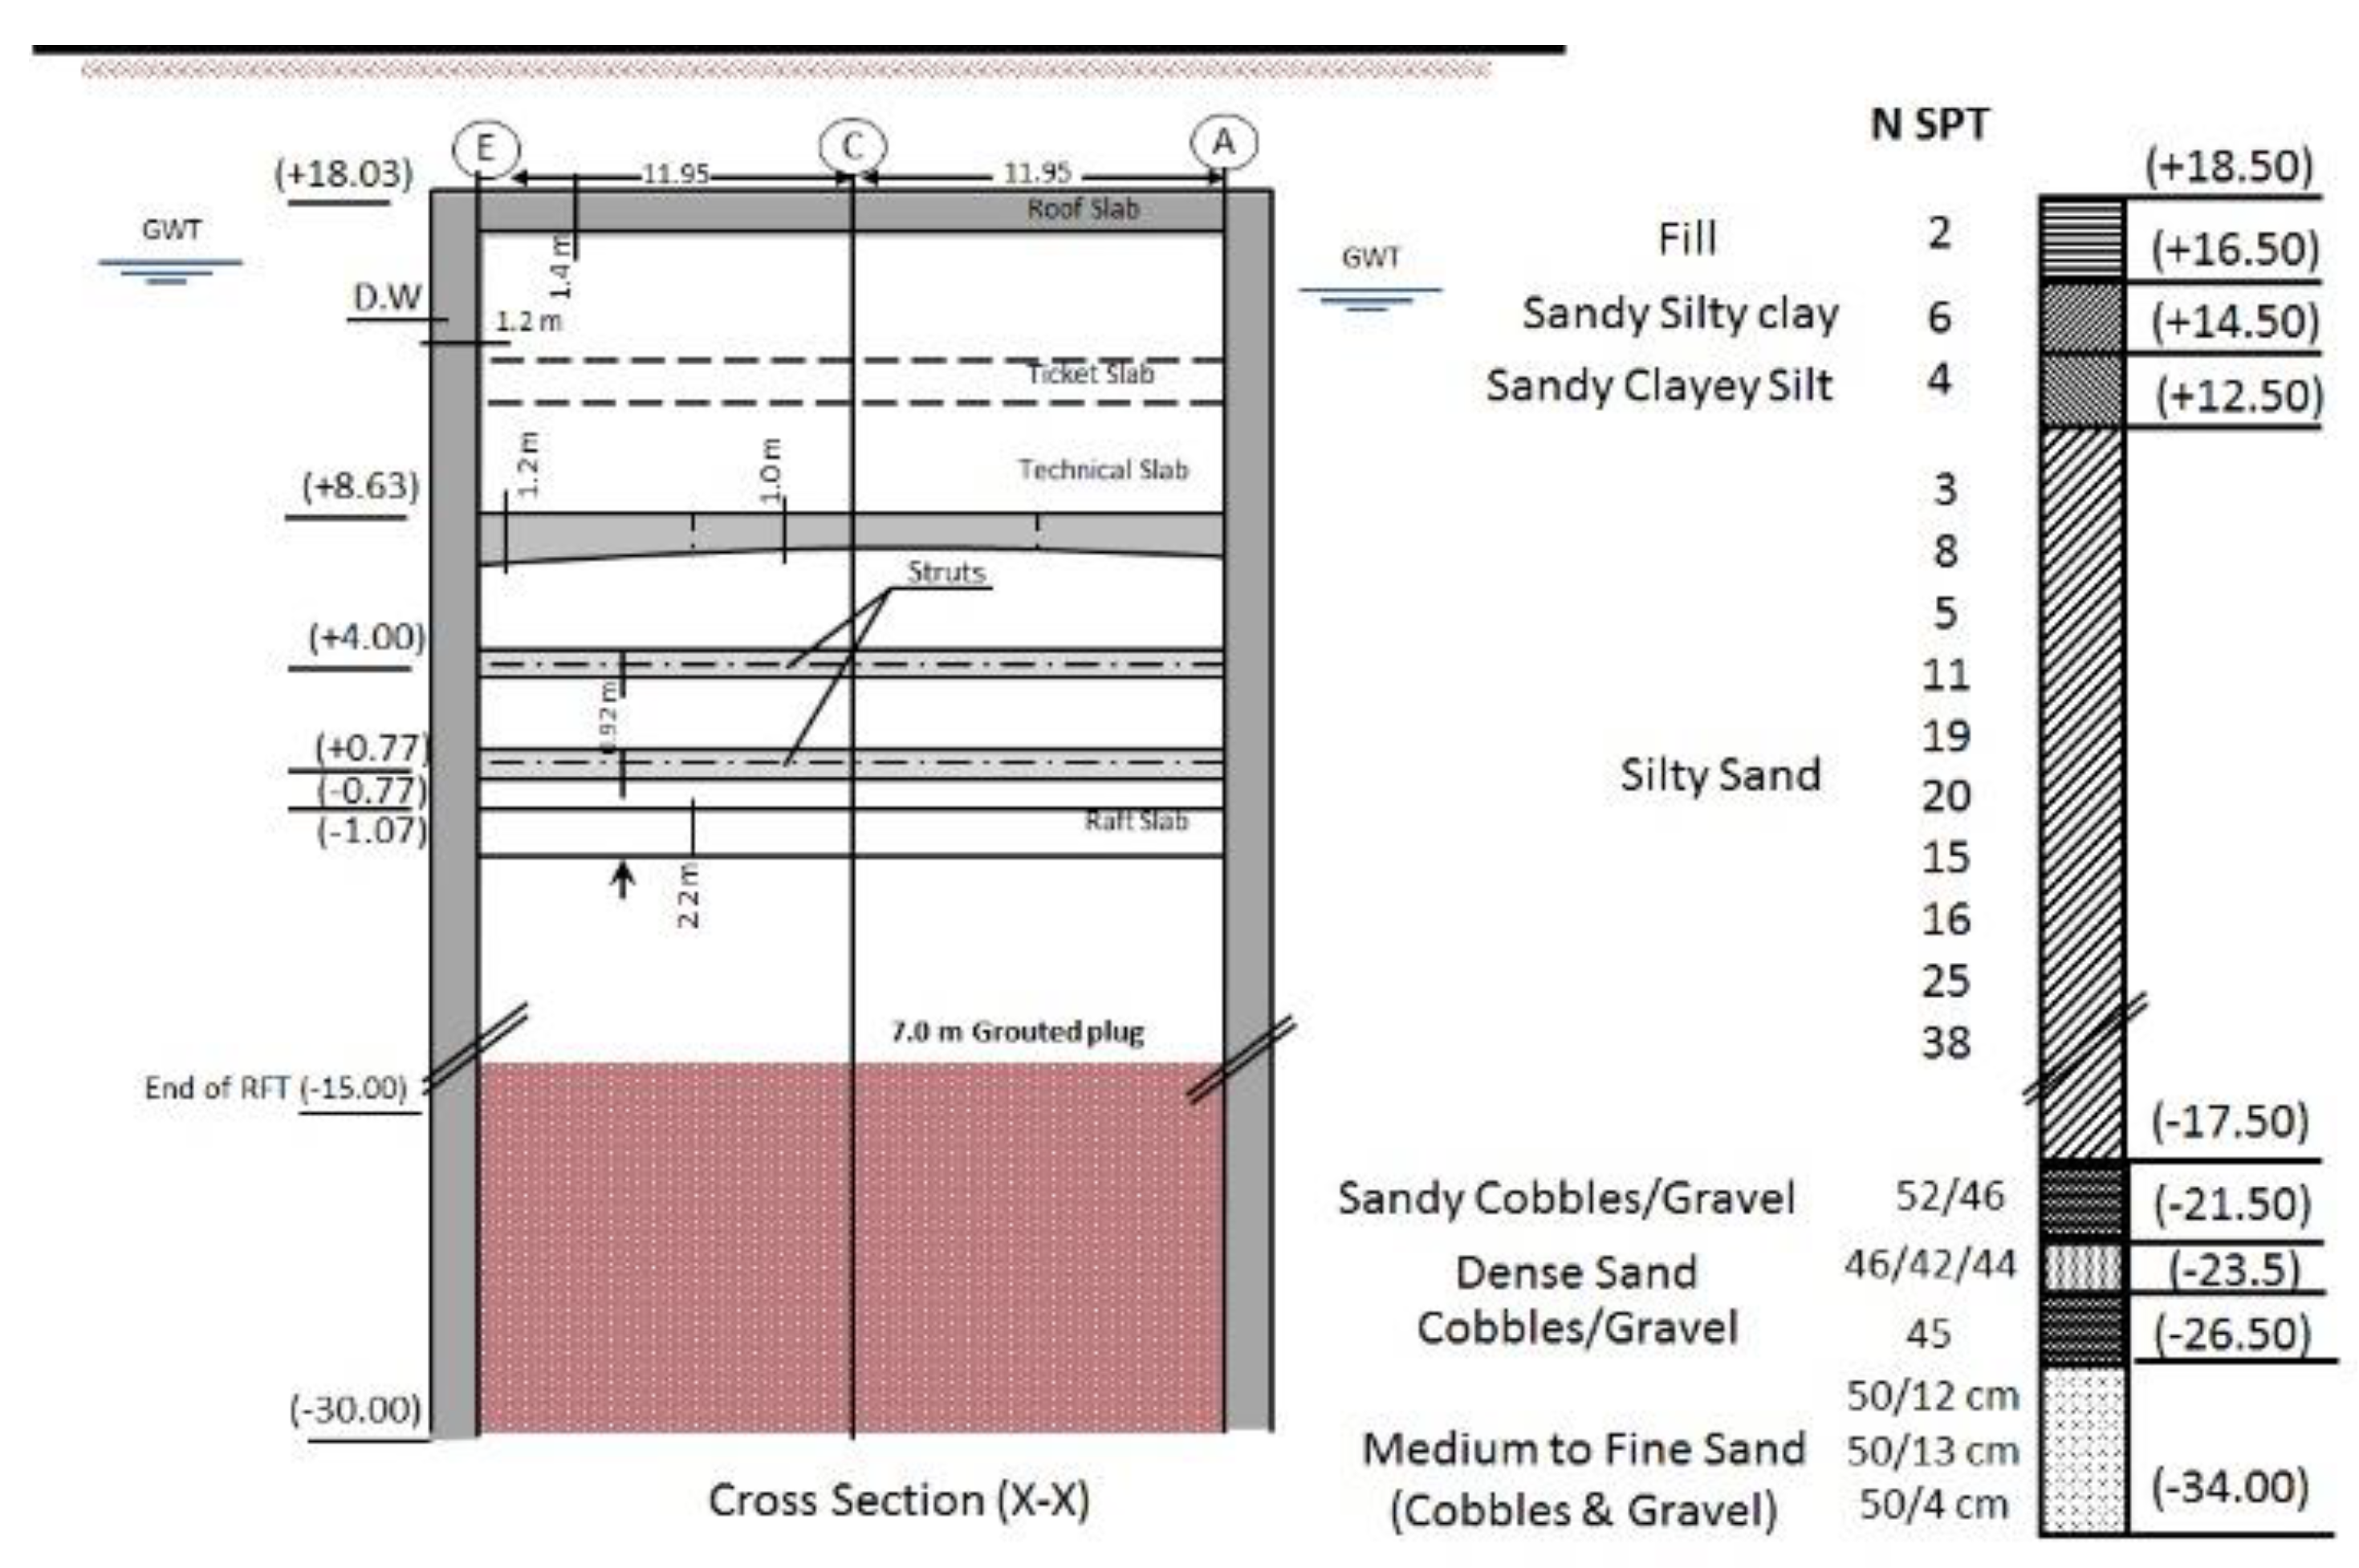
2.2. Stages of Construction
- 1st Stage: Construction of diaphragm walls to a depth of 48.0 m. Bentonite slurry installation procedure was involved in this stage.
- 2nd Stage: Grouting the essential water plug with a thickness of 7.0 m between the diaphragm walls.
- 3rd Stage: Dewatering the groundwater table to level of (–3.30), excavation to roof slab level, and roof slab concreting.
- 4th Stage: Excavation to technical slab level and technical slab concreting.
- 5th Stage: Excavation to the level of the first row of struts and installation of steel beams. Also, a pre-stressing force of 1500 kN was applied on each strut steel beam in this stage.
- 6th Stage: Excavation to the level of the second row of struts, then installation and pre-stressing of the second row of steel struts.
- 7th Stage: Excavation to raft slab level and raft slab concreting.
- 8th Stage: Removal of the first and the second rows of struts.
- 9th Stage: Concreting the ticket slab and stopping the dewatering process.
2.3. Field Measurements
3. Numerical Modeling
3.1. Properties of the Soil Model
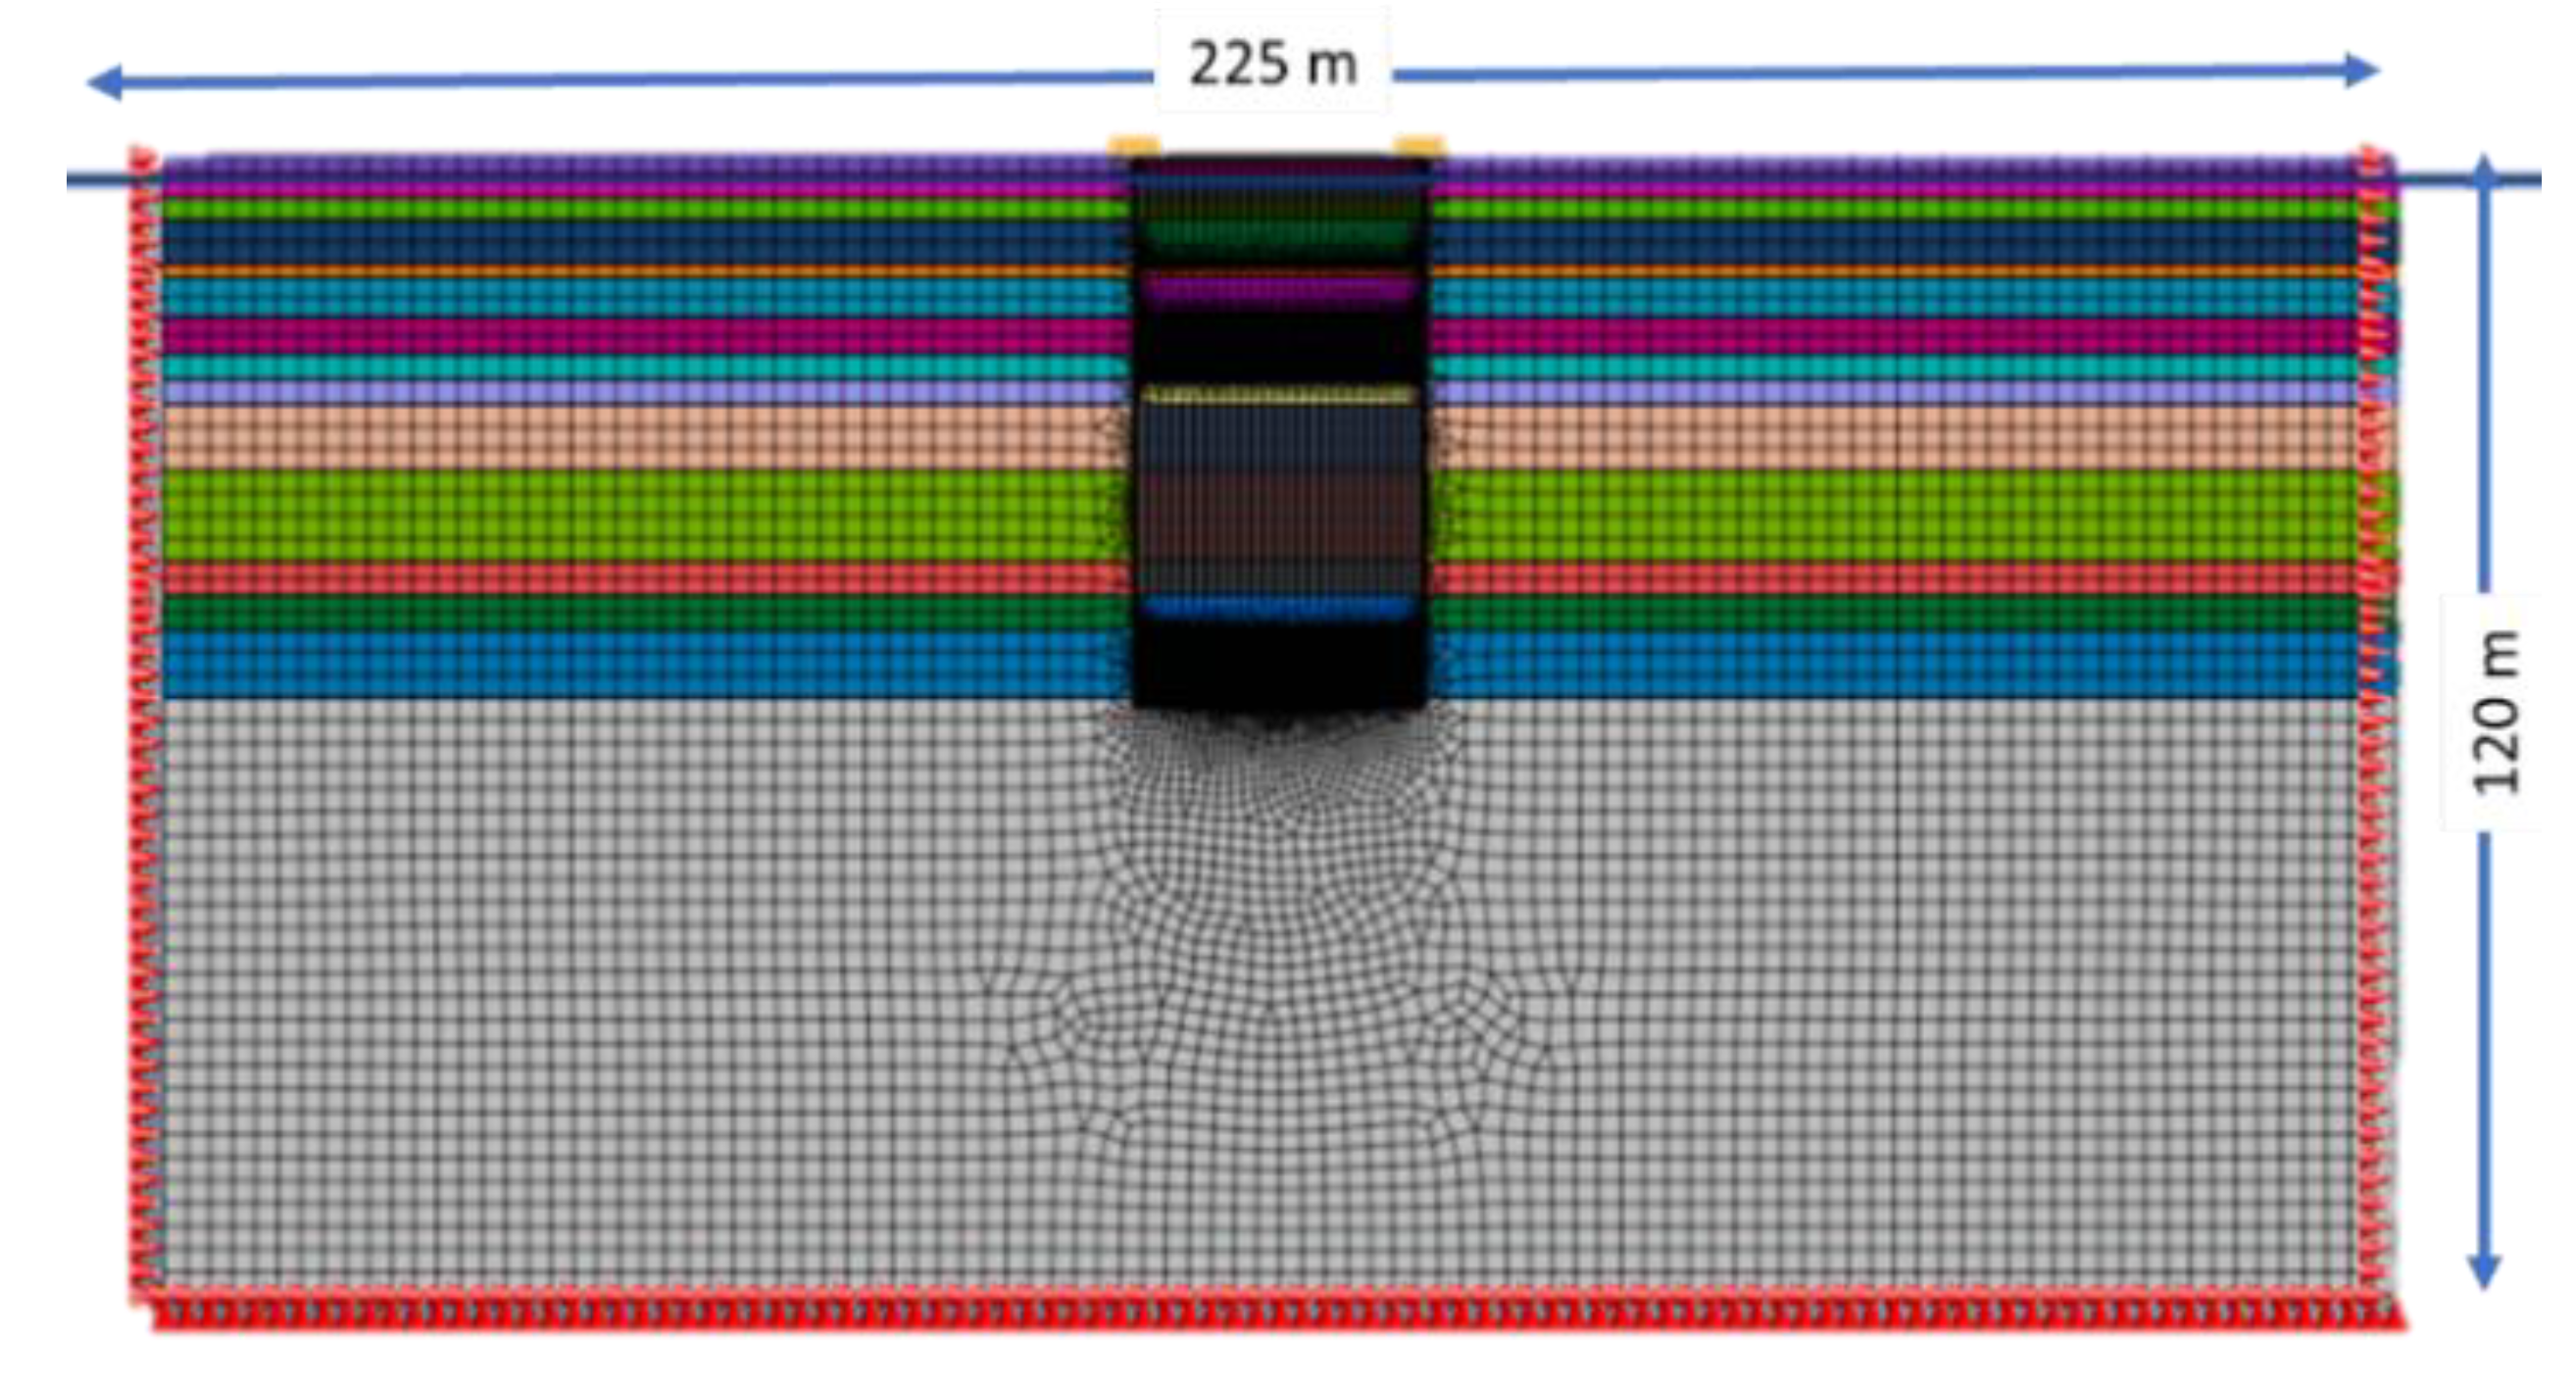
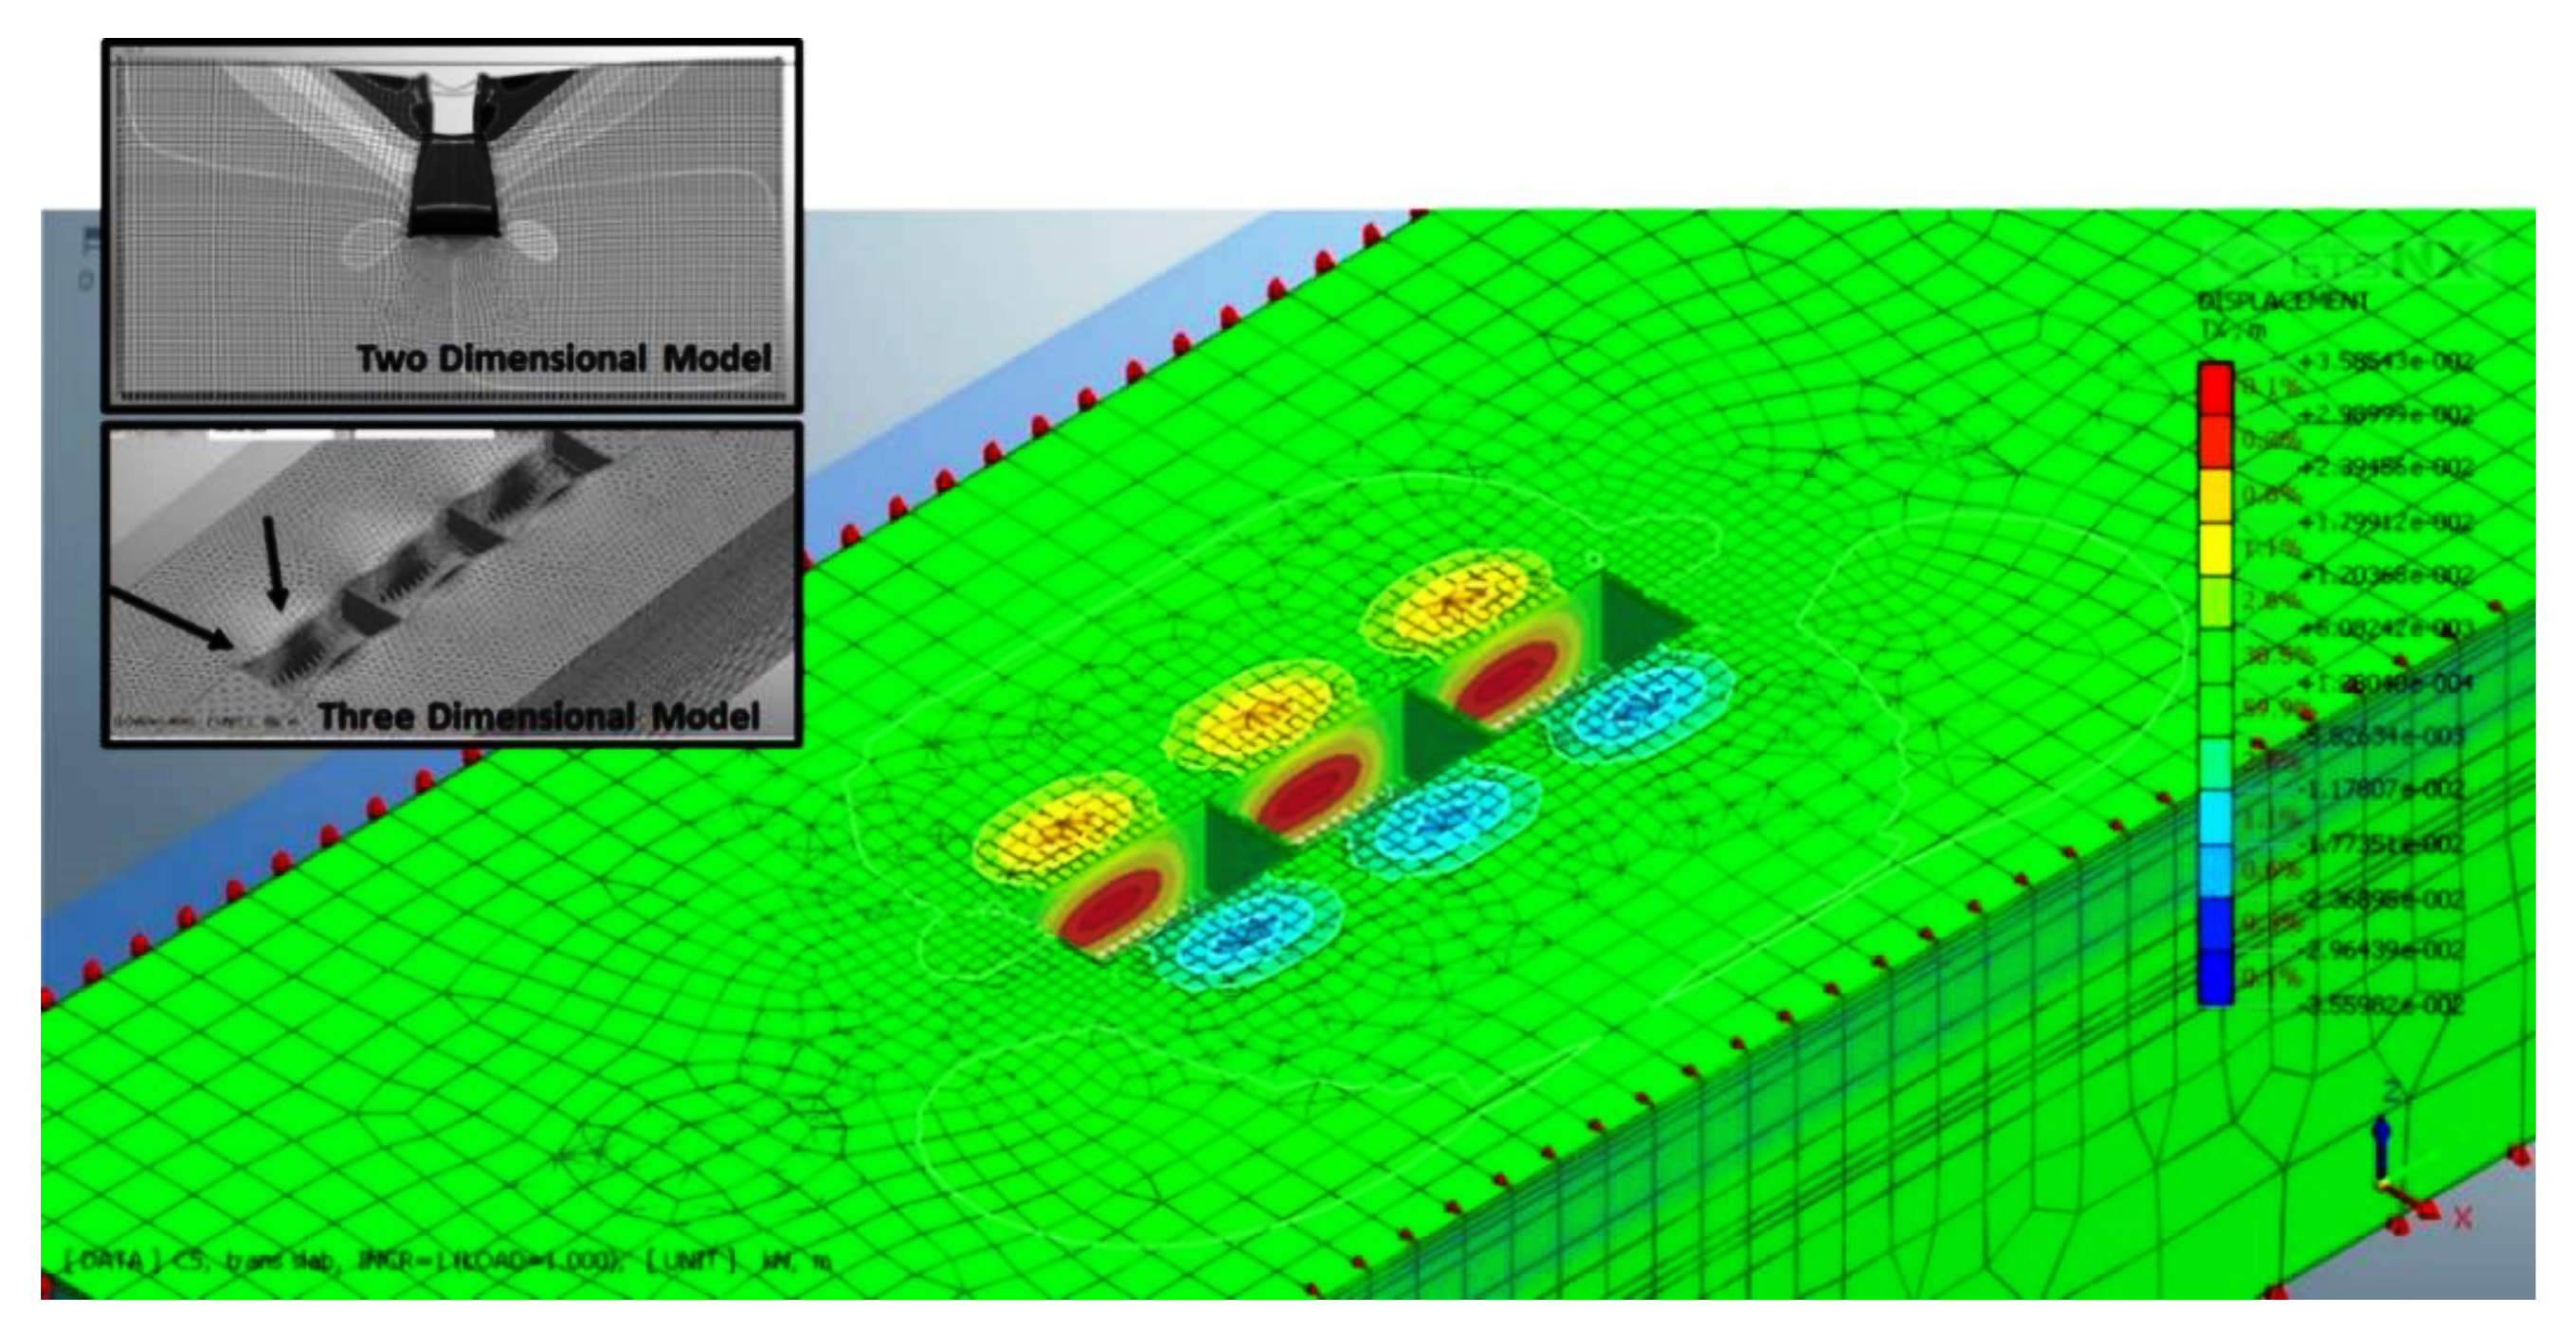
3.2. Two Dimensional Numerical Modeling
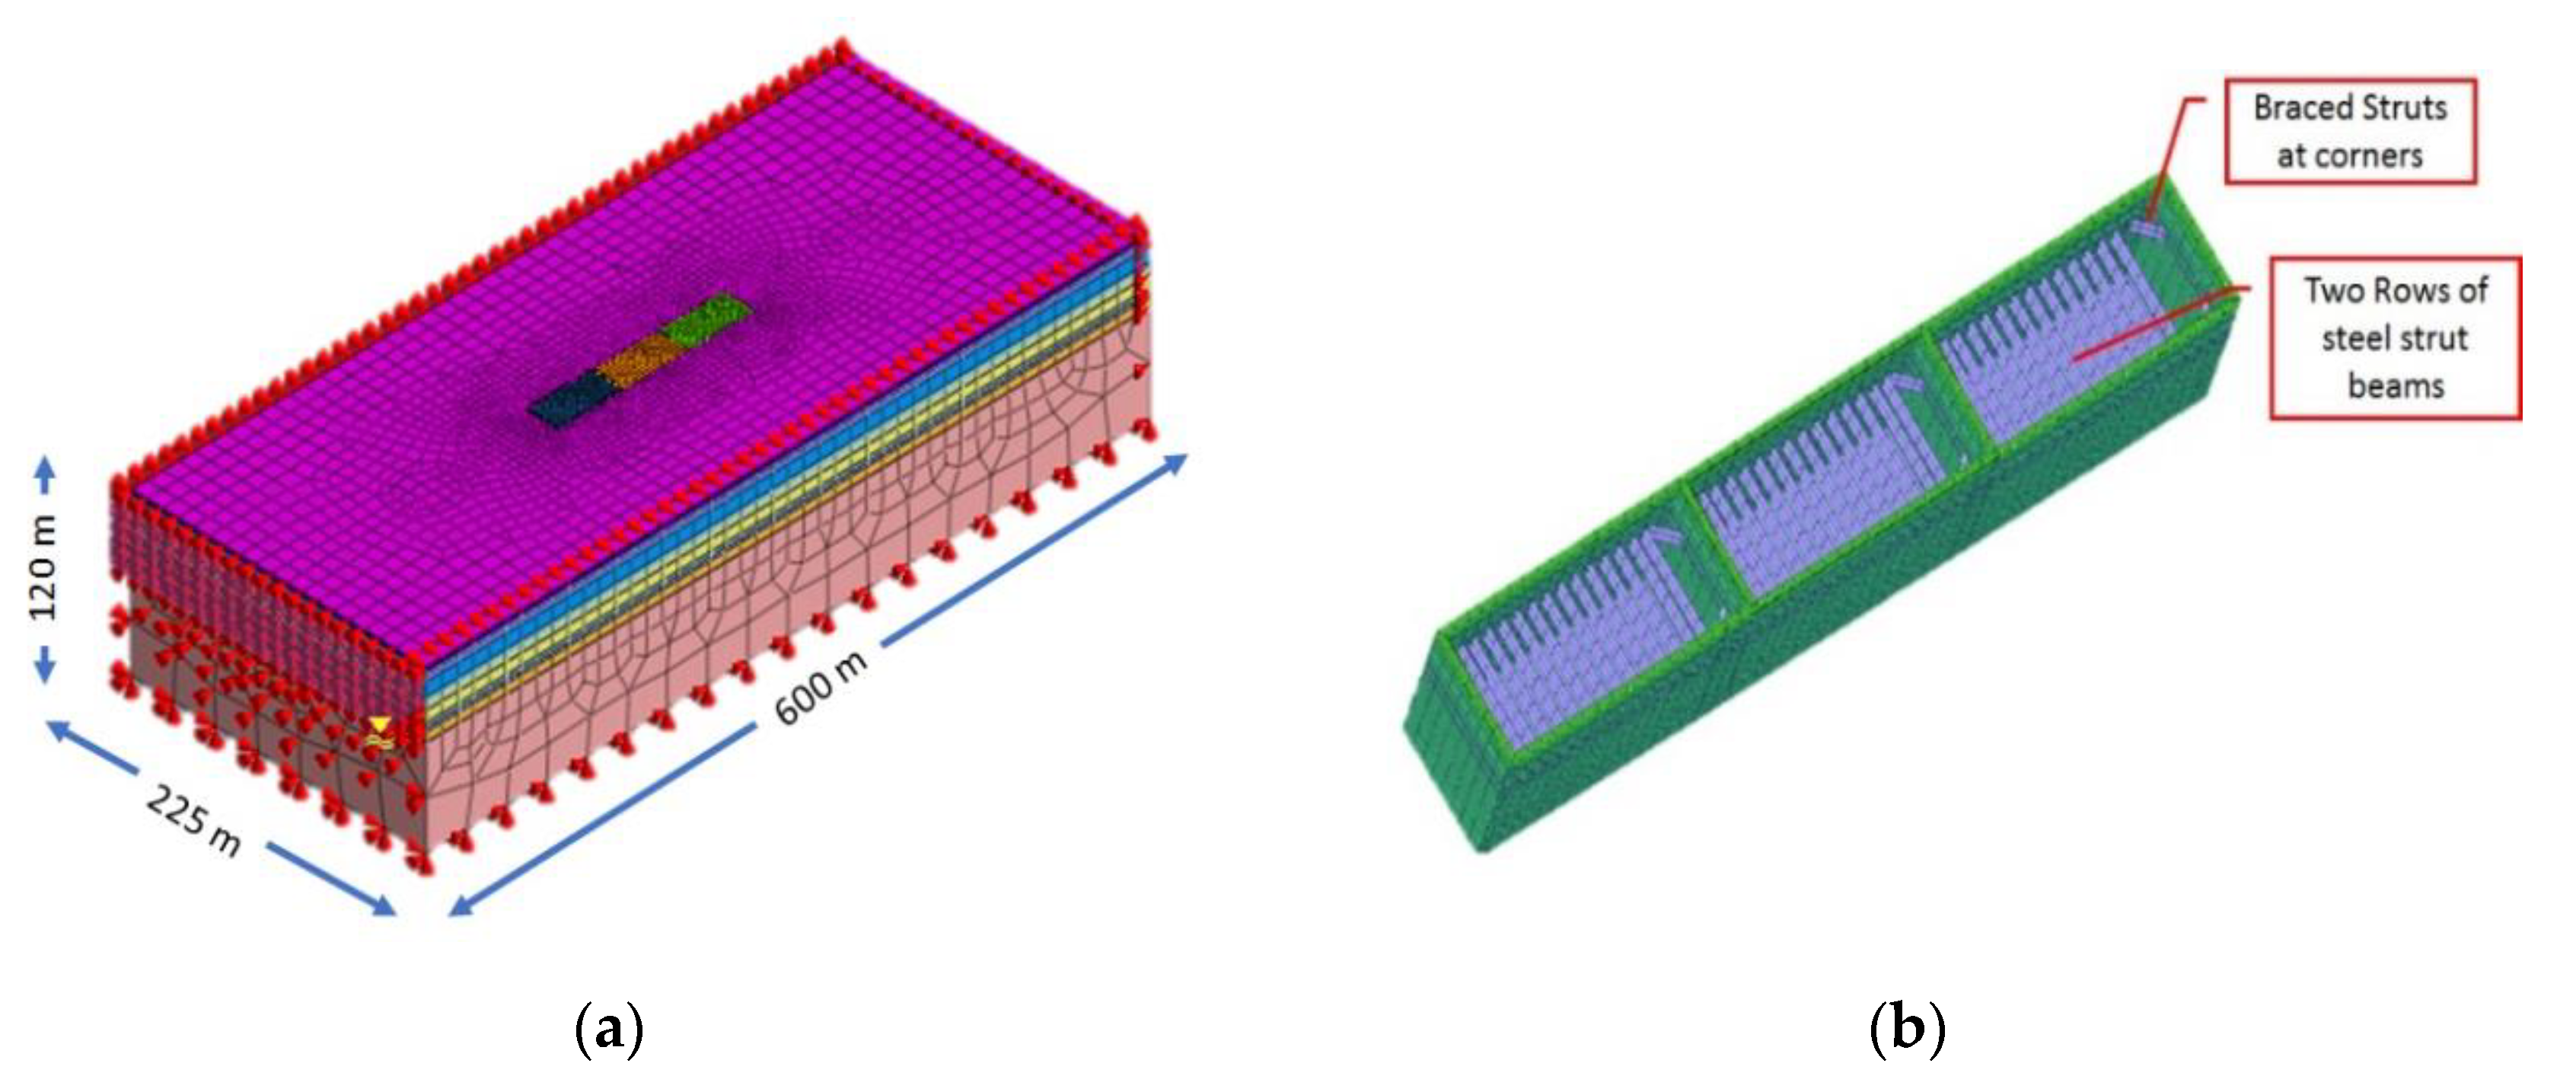
3.3. Three Dimensional Numerical Modeling
3.4. Analysis Stages
4. Results and Discussion
5. Conclusions
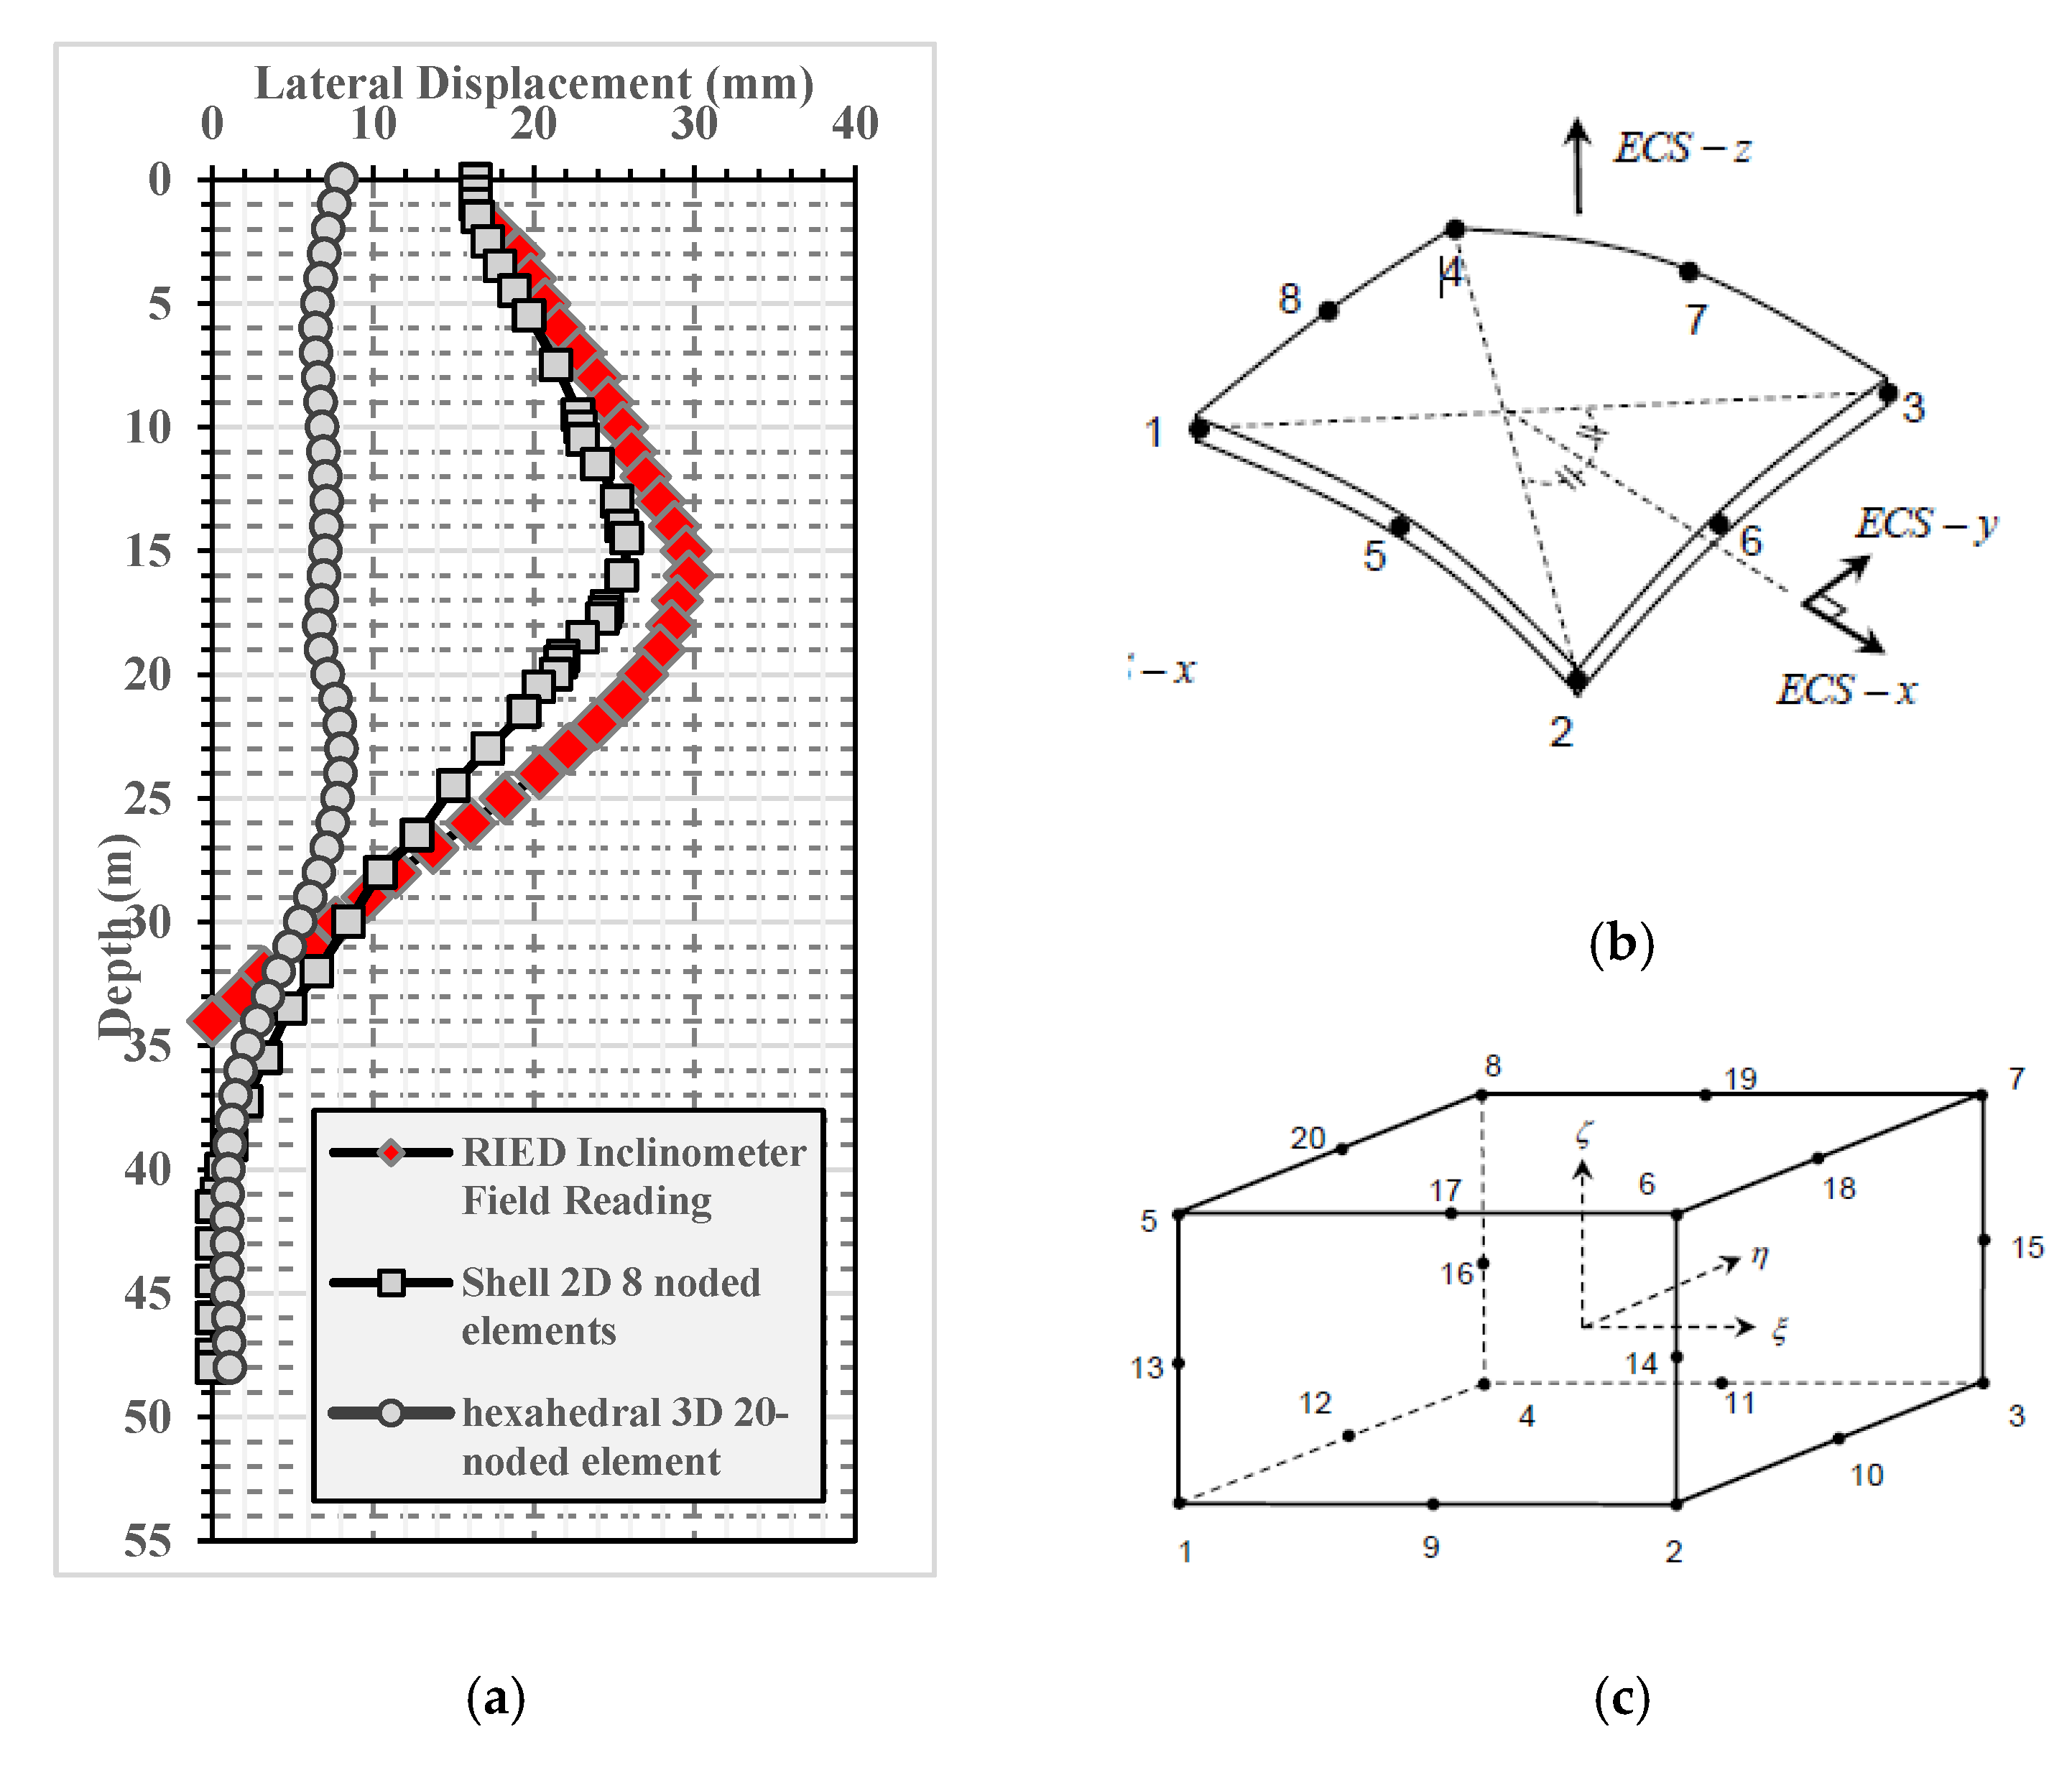
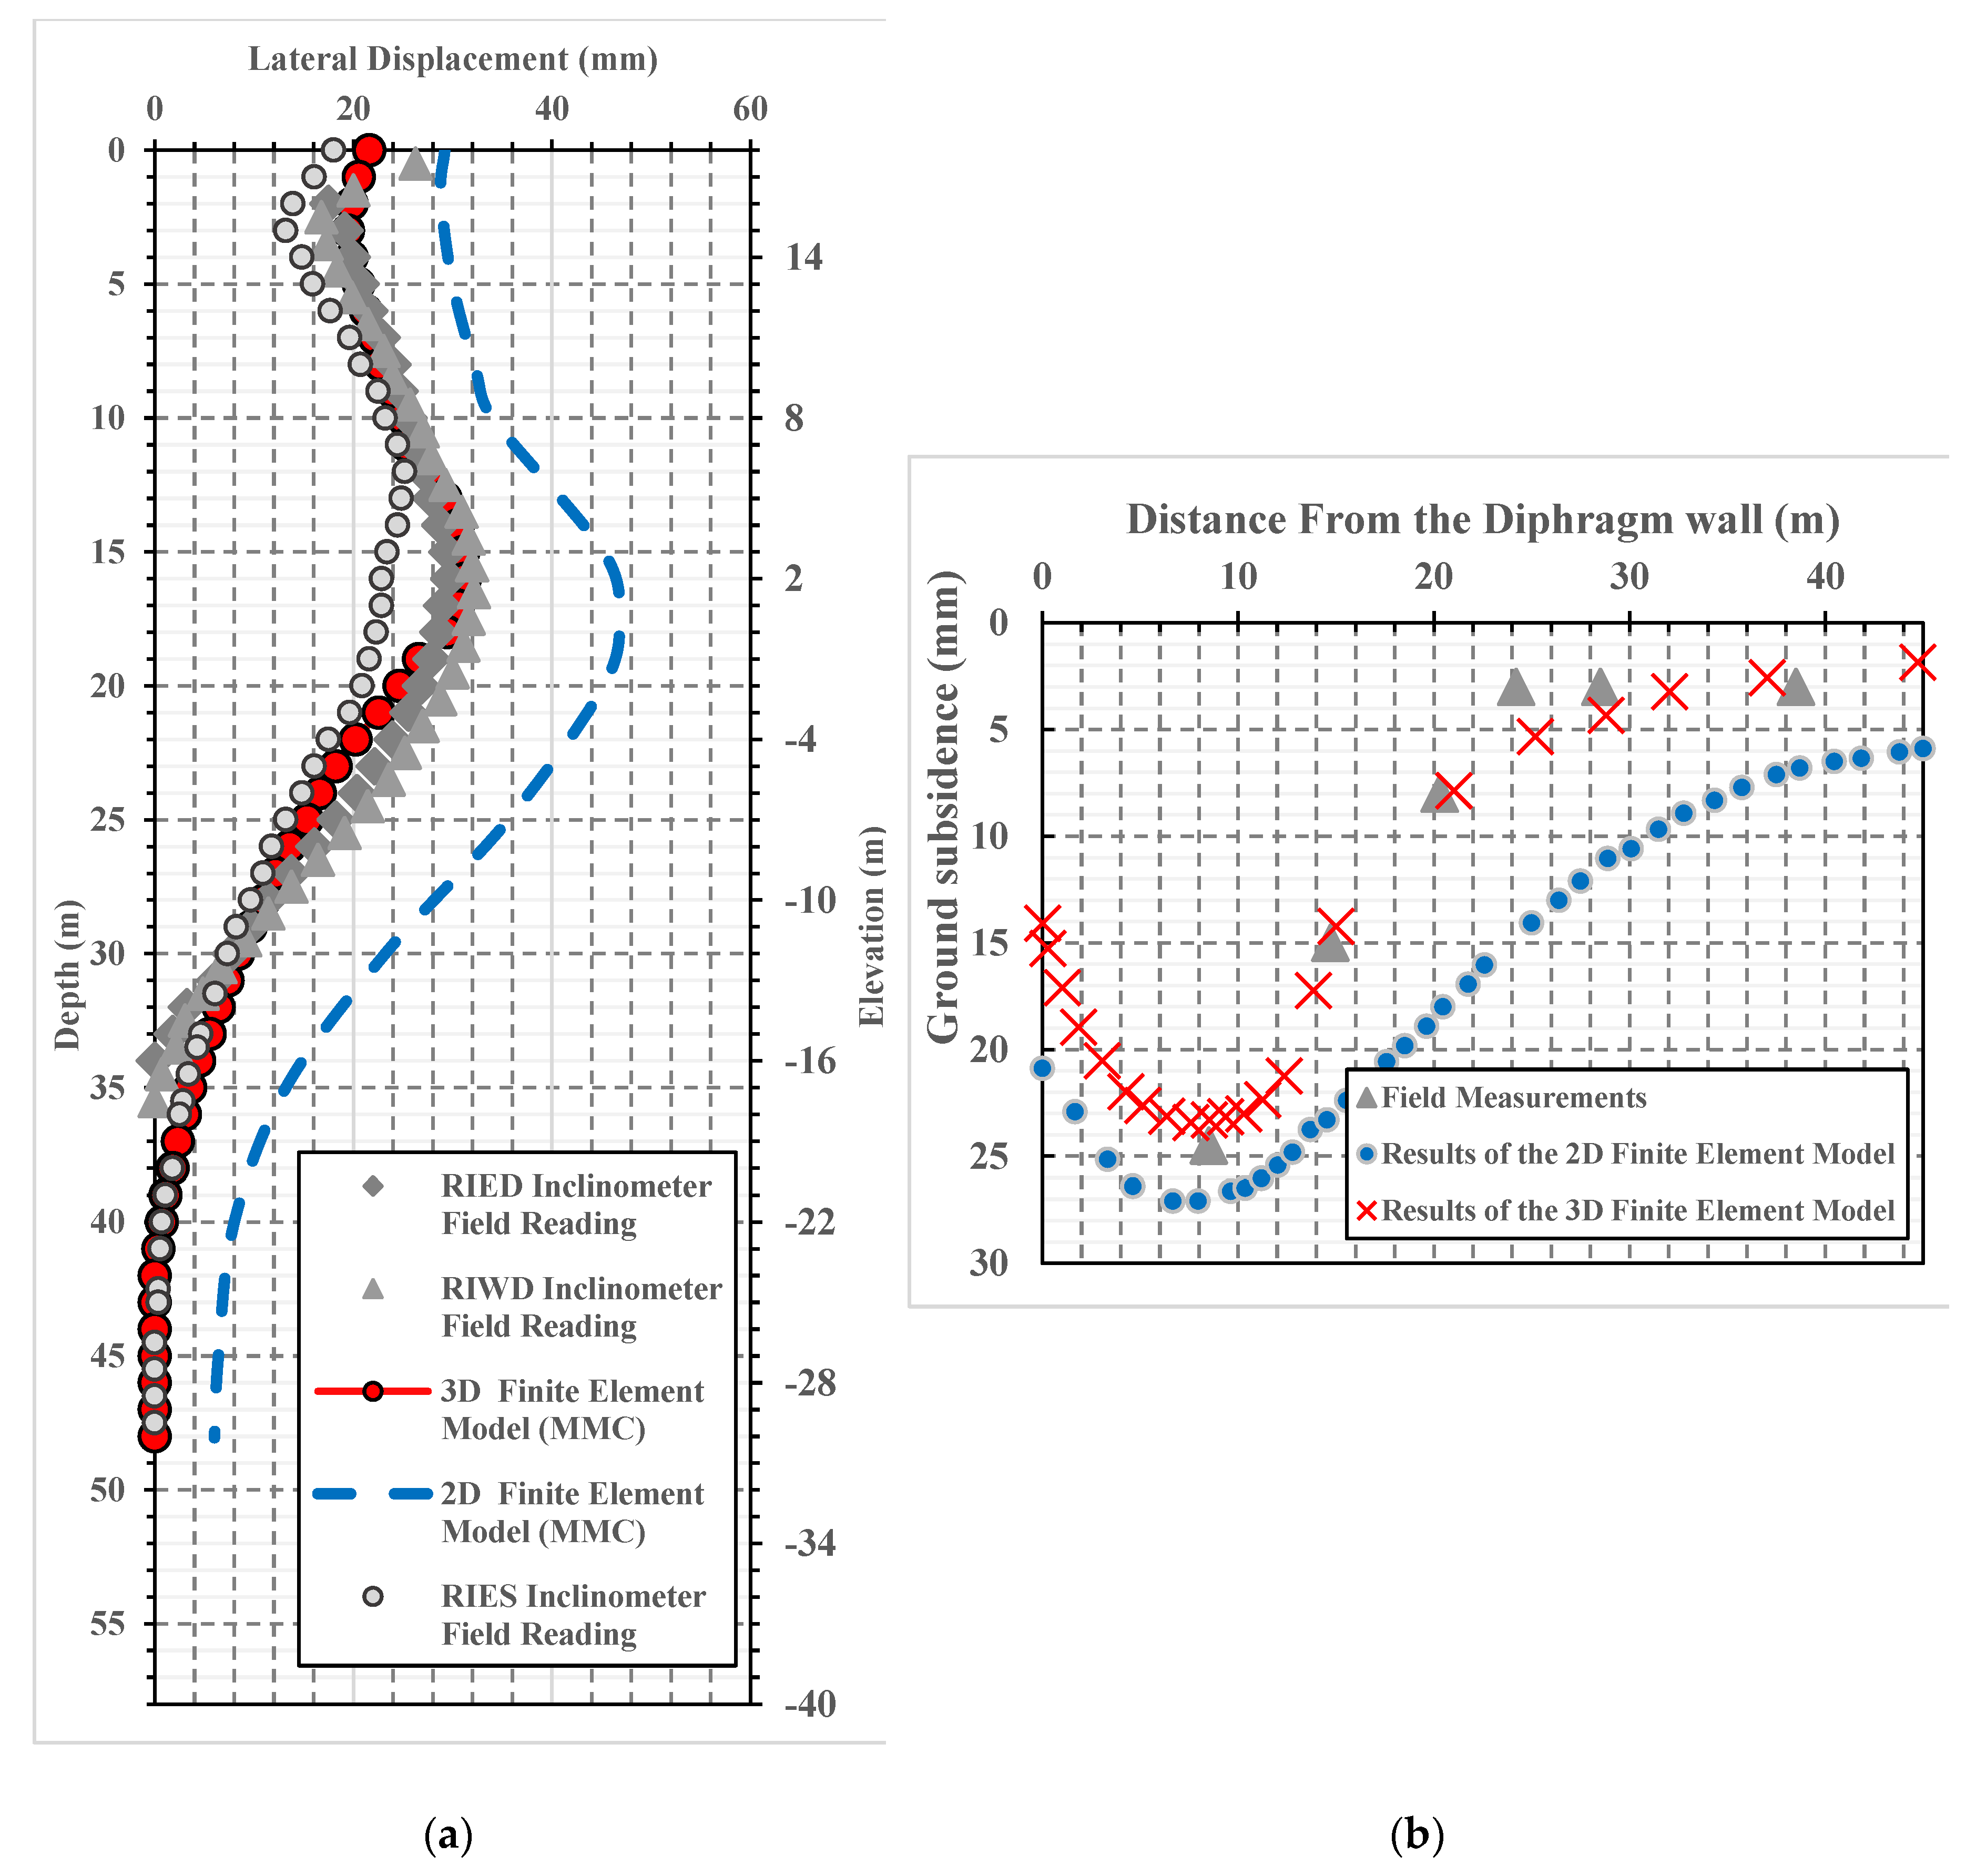
- Excellent agreement was obtained between field measurements and results of the three-dimensional finite element model in both wall lateral displacement and neighboring soil vertical settlement.
- In this case, the three-dimensional finite element model was superior to the two-dimensional plane strain model, in terms of prediction of both the diaphragm wall lateral deformation and the vertical soil settlement. The maximum wall lateral deformation obtained using the 2D model was 54% greater than the in-situ measured values.
- In the Rod El Farag case, despite the relatively high aspect ratio (6.25) of the plan dimensions, the existence of cross walls significantly affected the lateral wall deformation. This is because the location of the maximum lateral wall deformation point was shifted from the mid-span of the whole primary wall length, to be at the mid-span point of every single panel.
- The higher stiffness not only at the primary wall corners but also at the cross wall locations significantly causes the three-dimensional behavior of the supported deep excavation systems, and the lateral wall deformation decreased with decreasing distance from both the wall corners and the cross walls.
- The three-dimensional stiffening effect at corners and cross walls has a significant impact not only on the lateral wall deformations but also on the neighboring soil vertical settlement.
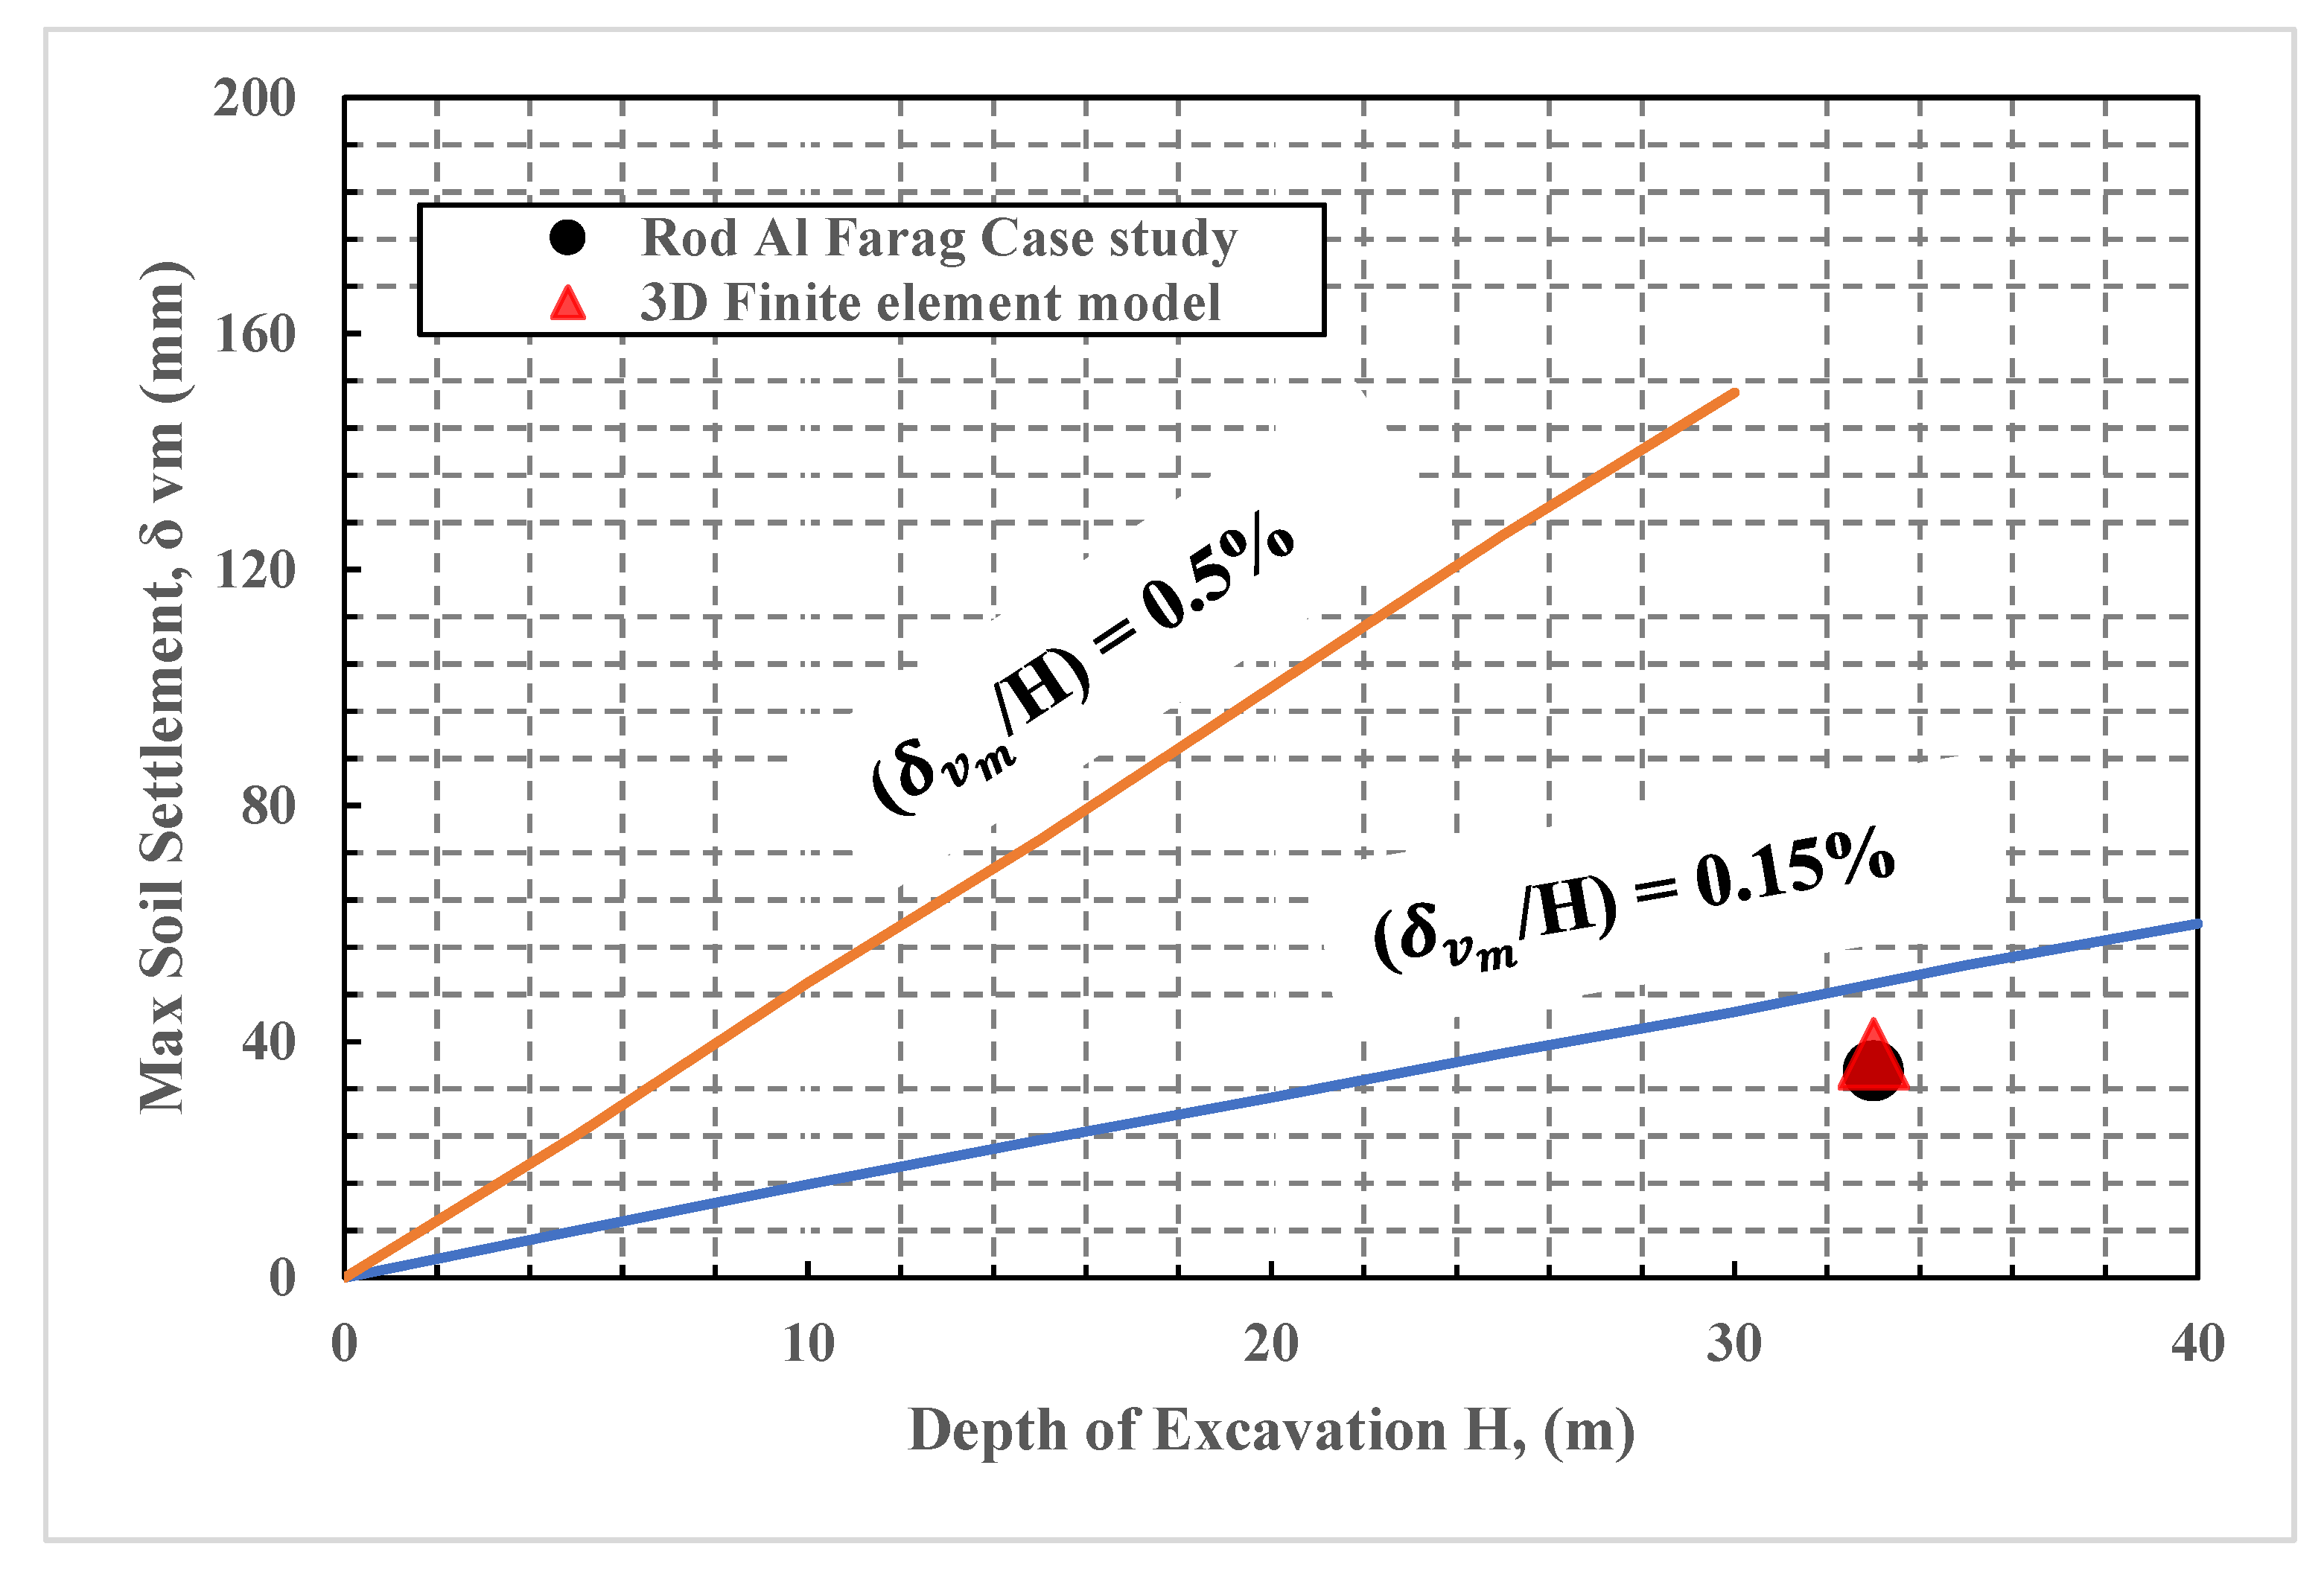
- The zone influenced by deep excavation may be affected and depends mainly on the magnitude of absolute settlement and the slope angle of the settlement rough. For the Rod El Farag case, the vertical ground settlement became insignificant at a horizontal distance equal to one times the excavated depth from the diaphragm wall.
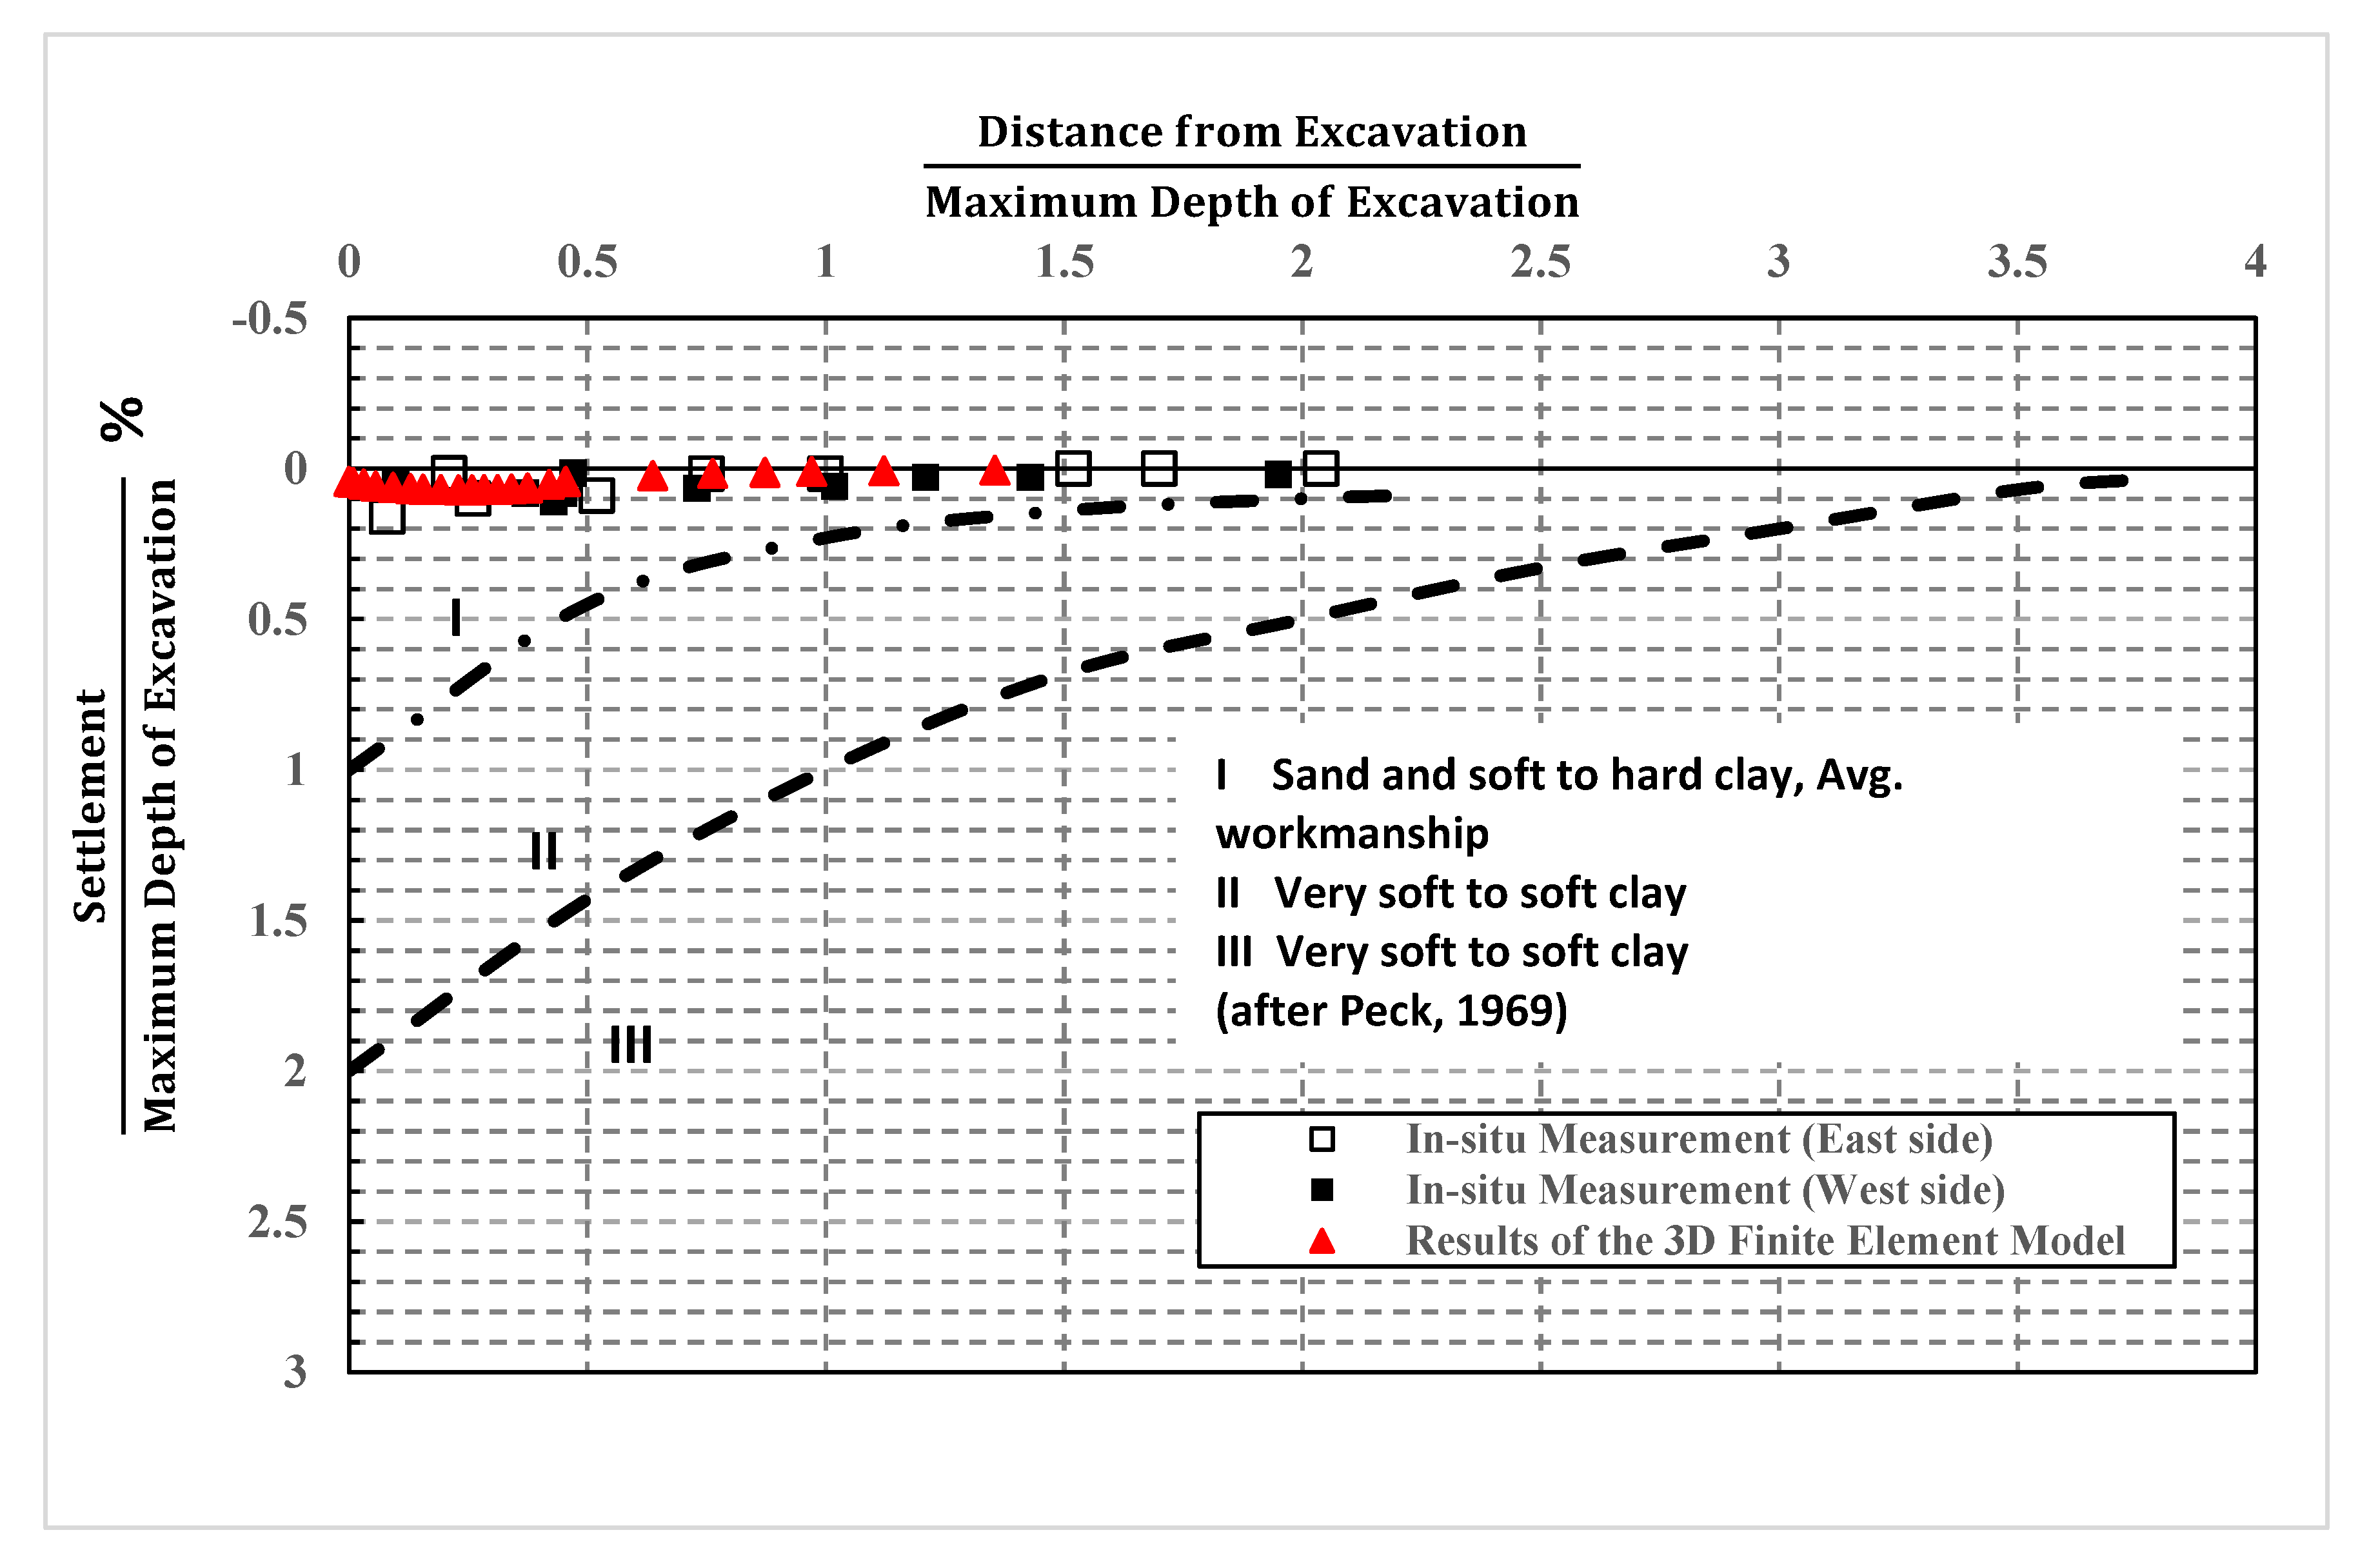
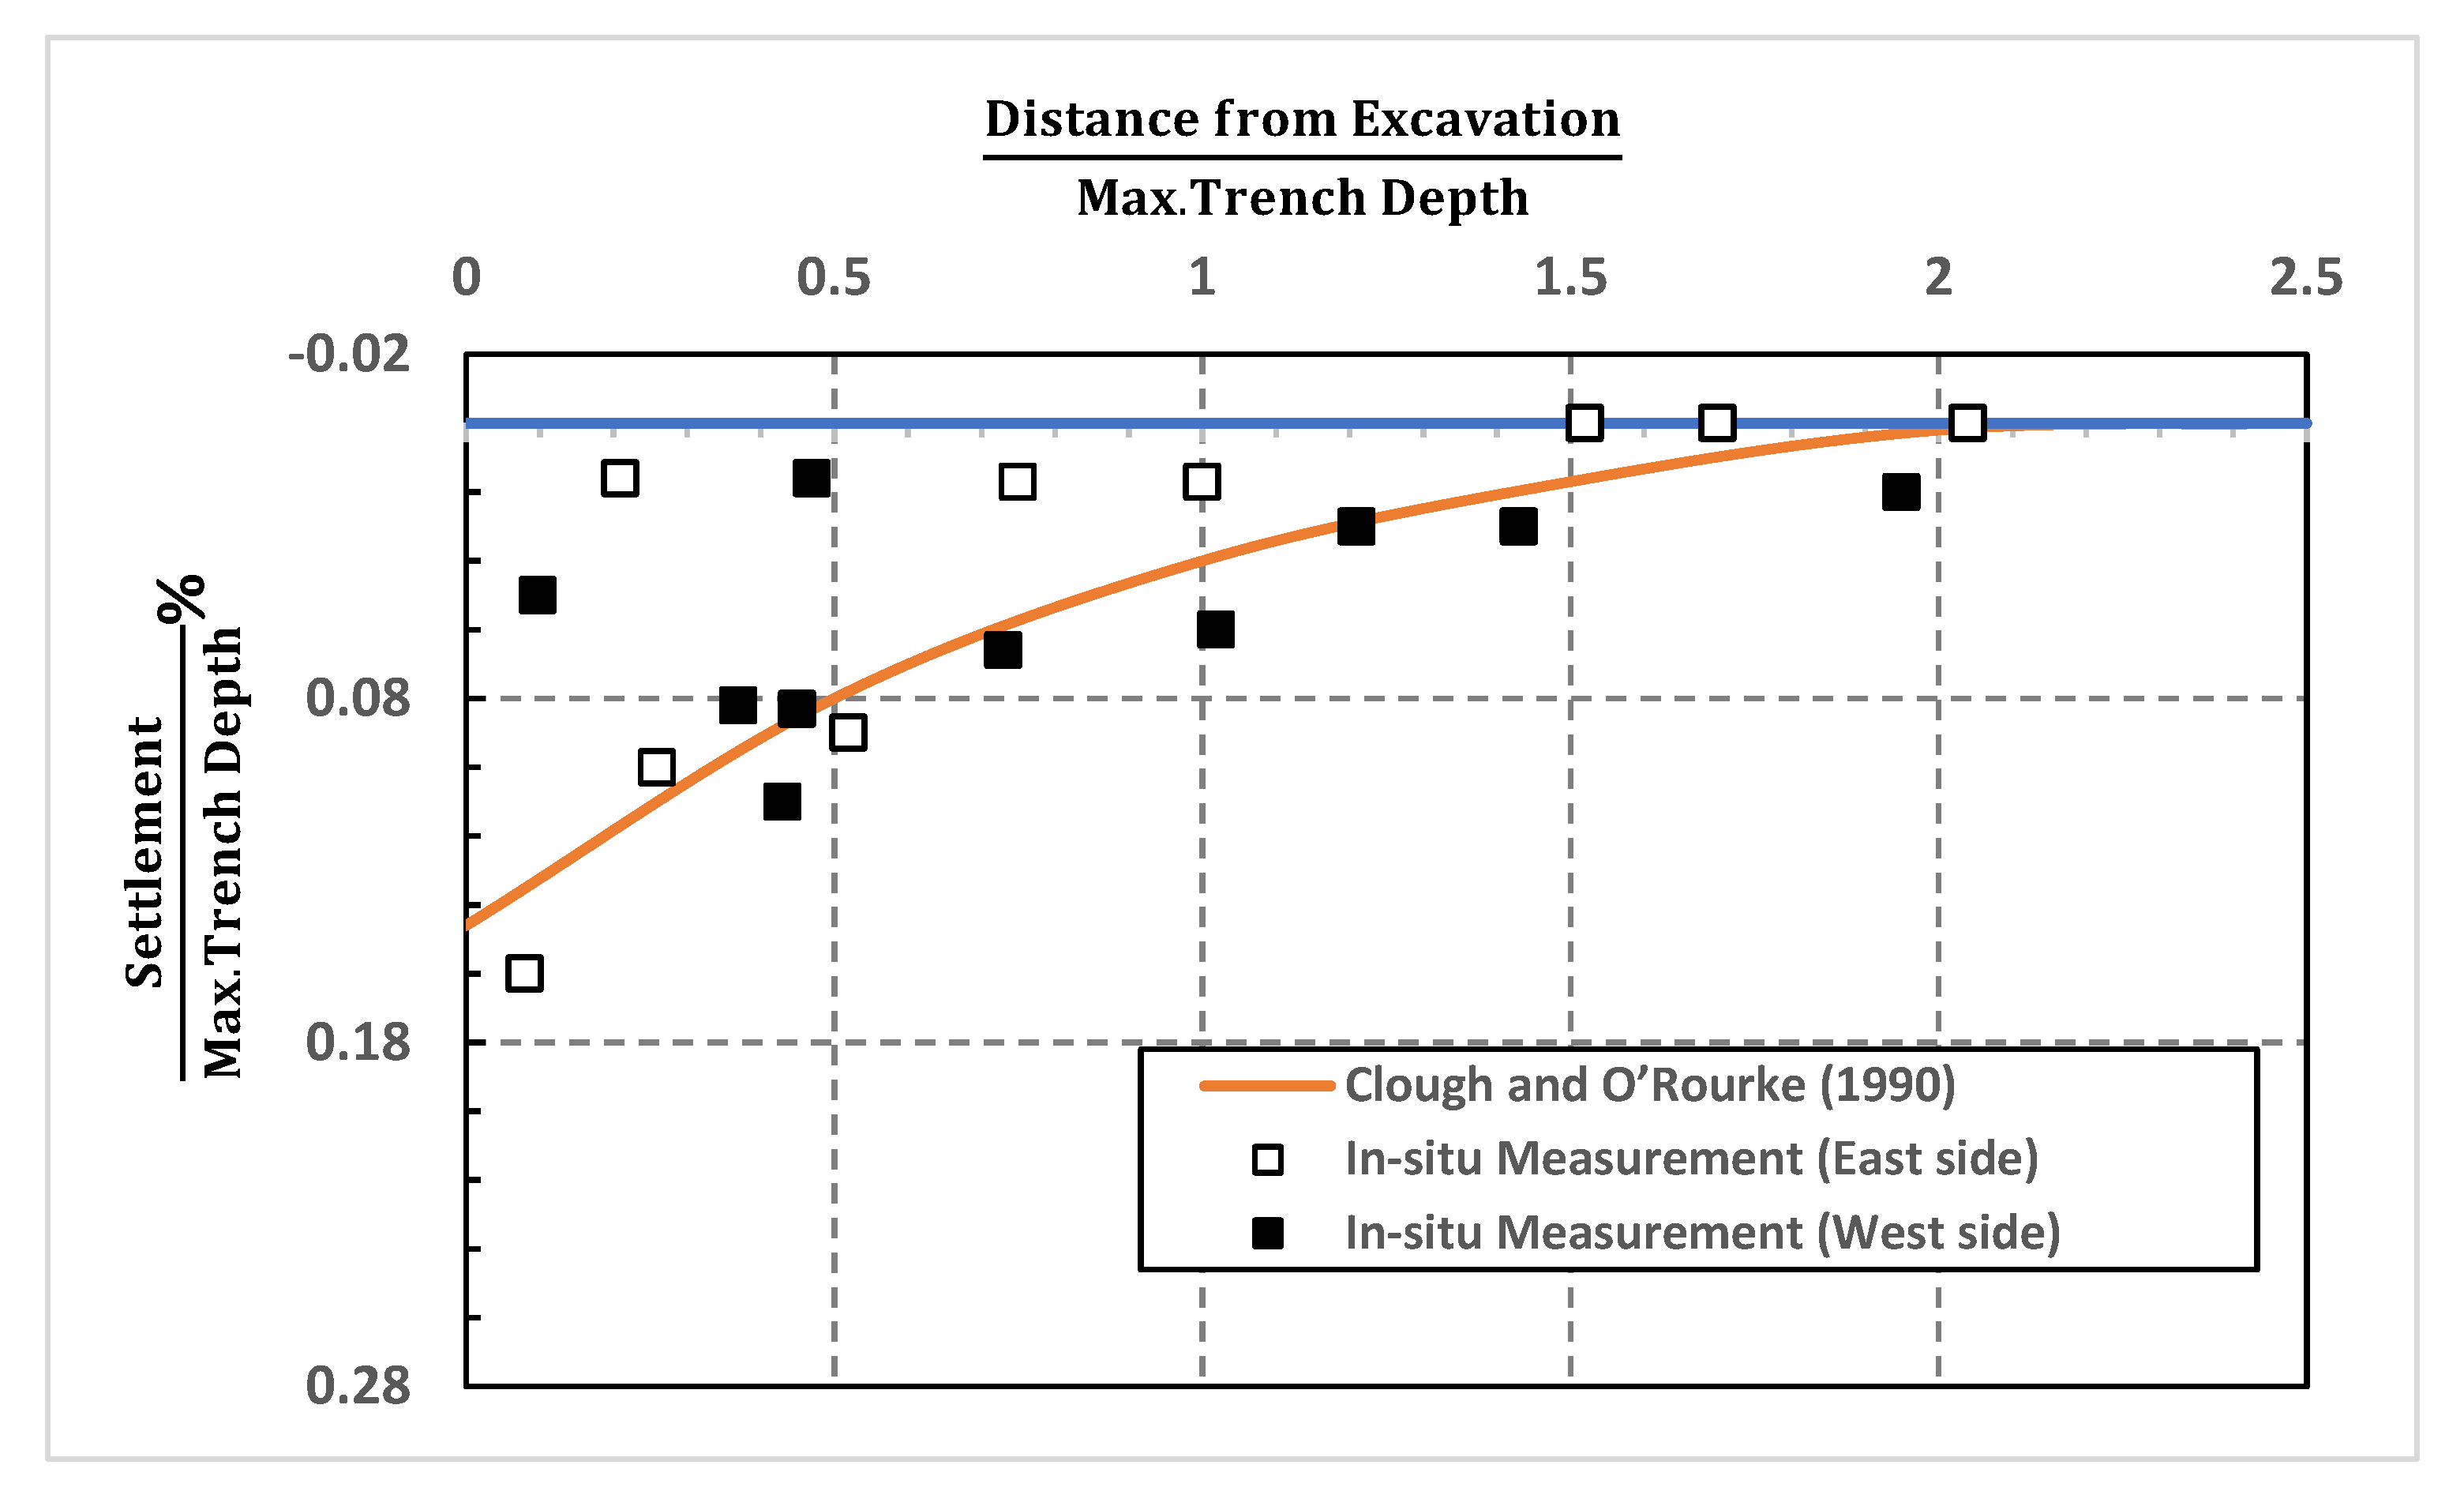
- In this case, the lateral wall movements (0.11% of excavated depth) were in good agreement with the practical approach proposed by Clough and O’Rourke (1990). However, Peck’s (1969) approach overestimated the induced deformation resulting due to deep excavation.
- Three-dimensional finite element analysis is recommended for deep excavation cases with internal cross walls, even for cases with relatively high aspect ratios.
Author Contributions
Funding
Conflicts of Interest
References
- Niu, Y.; Deng, X.; Zhao, X.; Zhang, N. Hexagonal Diamond Model for International Competitive Advantages of High-Speed Railway Industry. J. Manag. Eng. 2020, 36, 04020001. [Google Scholar] [CrossRef]
- Gill, S.A.; Lukas, R.G. Ground Movement Adjacent to Braced Cuts. In Design and Performance of Earth Retaining Structures; American Society of Civil Engineers: Reston, VA, USA, 1990. [Google Scholar]
- Son, M. The Response of Buildings to Excavation-induced Ground Movements. Ph.D. Thesis, Civil and Environmental Engineering, University of Illinois at Urbana-Champaign, Urbana, IL, USA, 2003. [Google Scholar]
- Son, M.; Cording, E.J. Estimation of Building Damage Due to Excavation-Induced Ground Movements. J. Geotech. Geoenviron. Eng. 2005, 131, 162–177. [Google Scholar] [CrossRef]
- Son, M.; Cording, E.J. Evaluation of Building Stiffness for Building Response Analysis to Excavation-Induced Ground Movements. J. Geotech. Geoenviron. Eng. 2007, 133, 995–1002. [Google Scholar] [CrossRef]
- Hsiao, C.L. Wall and Ground Movements in a Braced Excavation in Clays and Serviceability Reliability of Adjacent Buildings. Ph.D. Thesis, Clemson University, Clemson, SC, USA, 2007. [Google Scholar]
- Zapata-Medina, D.G. Semi-Empirical Method For Designing Excavation Support Systems Based on Deformation Control. Master’s Thesis, University of Kentucky, Lexington, KY, USA, 2007. [Google Scholar]
- Lam, S. Ground Movements due to Excavation in Clay: Physical and Analytical Models. Ph.D. Thesis, Churchill College, University of Cambridge, Cambridge, UK, 2010. [Google Scholar]
- Chai, J.; Shen, S.; Ding, W.; Zhu, H.; Carter, J. Numerical investigation of the failure of a building in Shanghai, China. Comput. Geotech. 2014, 55, 482–493. [Google Scholar] [CrossRef]
- Hefny, A.M.; Sorour, T.M.; Ezzat, M.; Bulut, R.; Yu, X.; Yang, S.-R. Prediction of the Field Response of Soil-Support Systems in Deep Excavations. In Proceedings of the Geo-China, Shandong, China, 25 July 2016; pp. 141–151. [Google Scholar]
- Peck, R.B. State-of-the-art: Deep excavation and tunneling in soft ground. In Proceedings of the Seventh International Conference on Soil Mechanics and Foundation Engineering, Mexico City, Mexico, 1969; pp. 225–290. [Google Scholar]
- Mana, A.I.; Clough, G.W. Prediction of movements for braced cuts in clay. J. Geotech. Eng. Div. 1981, 107, 759–777. [Google Scholar]
- Clough, G.W.; Smith, E.M.; Sweeney, B.P. Movement Control of Excavation Support Systems by Iterative Design. In Foundation Engineering: Current Principles and Practices; American Society of Civil Engineers: Reston, VA, USA, 1989. [Google Scholar]
- Clough, G.W.; O’Rourke, T.D. Construction Induced Movements of Insitu Walls. In Design and Performance of Earth Retaining Structures; American Society of Civil Engineers: Reston, VA, USA, 1990. [Google Scholar]
- Bowles, J.E. Foundation Analysis and Design, 5th ed.; McGraw-Hill: New York, NY, USA, 1988; pp. 589–646. [Google Scholar]
- Hsieh, P.G.; Ou, C.Y. Shape of ground surface settlement profiles caused by excavation. Can. Geotech. J. 1998, 35, 1004–1017. [Google Scholar] [CrossRef]
- Ou, C.Y.; Hsieh, P.G.; Chiou, D.-C. Characteristics of ground surface settlement during excavation. Can. Geotech. J. 1993, 30, 758–767. [Google Scholar] [CrossRef]
- Long, M. Database for Retaining Wall and Ground Movements due to Deep Excavations. J. Geotech. Geoenviron. Eng. 2001, 127, 203–224. [Google Scholar] [CrossRef]
- Moormann, C. Analysis of wall and ground movement due to deep excavation in soft soil based on a new worldwide database. Soils Found. 2004, 44, 87–98. [Google Scholar] [CrossRef]
- Roboski, J.; Finno, R.J. Distributions of ground movements parallel to deep excavations in clay. Can. Geotech. J. 2006, 43, 43–58. [Google Scholar] [CrossRef]
- Finno, R.J.; Hashash, Y.M.A. Integrated Tools for Predicting, Monitoring and Controlling Ground Movements due to Excavations. In Proceedings of the NSF Engineering Research and Innovation Conference, Honolulu, HI, USA, 22–25 June 2009. [Google Scholar]
- Ralph, B. Peck, Fifty Years of Lateral Earth Support. In Design and Performance of Earth Retaining Structures; American Society of Civil Engineers: Reston, VA, USA, 1990. [Google Scholar]
- Wood, L.A.; Perrin, A.J. Observations of a strutted diaphragm wall in London clay: A preliminary assessment. Géotechnique 1984, 34, 563–579. [Google Scholar] [CrossRef]
- Powrie, W.; Li, E.S.F. Finite element analyses of an in situ wall propped at formation level. Géotechnique 1991, 41, 499–514. [Google Scholar] [CrossRef]
- El-Nahhas, F. Prediction of ground movement adjacent to a supported deep excavation. In Proceedings of the Ninth Regional Conference for Africa on SMFE, Lagos, Nigeria, 1987; pp. 285–291. [Google Scholar]
- Konokike, K.; Ono, K. Prediction of the behavior of earth retaining walls. In Proceedings of the 9th Southeast Asian Geotechnical Conference, Bankok, Thailand, 7–11 December 1987. [Google Scholar]
- Fang, M.L. A Deep Excavation Taipei Basin. In Proceedings of the 9th Southeast Asian Geotechnical Conference, Bankok, Thailand, 7–11 December 1987. [Google Scholar]
- Ou, C.Y.; Chiou, D.C.; Wu, T.S. Three-Dimensional Finite Element Analysis of Deep Excavations. J. Geotech. Eng. 1996, 122, 337–345. [Google Scholar] [CrossRef]
- Finno, R.J.; Roboski, J.F. Three-Dimensional Responses of a Tied-Back Excavation through Clay. J. Geotech. Geoenviron. Eng. 2005, 131, 273–282. [Google Scholar] [CrossRef]
- Abd El-Salam, N. Insitu Performance Of A Subway Station in Cairo. Master’s Thesis, Ain Shams University, Cairo, Egypt, 1995. [Google Scholar]
- Ahmed, A.A.; Abd El-Salam, N. In-Situ Performance of Subway Stations in Cairo. In Proceedings of the Seventh International Colloquium on Structural and Geotechnical Engineering, El-Abaseya, Egypt, 1996; pp. 447–460. [Google Scholar]
- Ezzat, M.; Zaghloul, Y.; Sorour, T.; Hefny, A.; Eid, M. Numerical Simulation of Axially Loaded to Failure Large Diameter Bored Pile. Int. J. Earth Energy Environ. Sci. 2019, 13, 1–15. [Google Scholar]
- Stroud, M.A. The standard penetration test in insensitive clays and soft rocks. In Proceedings of the European Symposium on Penetration Testing; National Swedish Building Research: Stockholm, Sweden, 1974; pp. 367–375. [Google Scholar]
- Duncan, J.M.; Buchignani, A. An Engineering Manual for Settlement Studies; University of California: Oakland, CA, USA, 1976. [Google Scholar]
- Janbu, N. Soil compressibility as determined by oedometer and triaxial tests. Proc. Europ. Conf. SMFE 1963, 1, 19–25. [Google Scholar]
- Kulhawy, F.H.; Mayne, P.W. Manual on Estimating Soil Properties for Foundation Design; Report No. EPRI EL-6800; Electric Power Research Institute: Palo Alto, CA, USA, 1990; pp. 2–25. [Google Scholar]
- MIDAS, GTS. NX user manual, Analysis Reference chapter 4 materials, Section 2. Plast. Mater. Prop. 2009, 3, 33–68, 120–165. [Google Scholar]
- Zdravković, L.; Potts, D.M.; John, H.D.S. Modelling of a 3D excavation in finite element analysis. Géotechnique 2005, 55, 497–513. [Google Scholar] [CrossRef]
- Dong, Y.; Burd, H.; Houlsby, G.; Hou, Y. Advanced finite element analysis of a complex deep excavation case history in Shanghai. Front. Struct. Civ. Eng. 2014, 8, 93–100. [Google Scholar] [CrossRef]
- Eid, M.; Hefny, A.; Sorour, T.; Zaghloul, Y.; Ezzat, M. Numerical Analysis of Large Diameter Bored Pile Installed in Multi Layered Soil: A Case Study of Damietta Port New Grain Silos Project. Int. J. Curr. Eng. Technol. 2018, 8, 220–226. [Google Scholar] [CrossRef]


| Soil Layer Soil | Fill | Sandy Silty Clay | Sandy Clayey Silt | Silty Sand | Sandy Cobbles | Dense Sand/Gravel | Cobbles and Gravel | Med. to Fine Sand | |
|---|---|---|---|---|---|---|---|---|---|
| Parameter | |||||||||
| Unit weight γsat (kN/m3) | 17 | 18 | 18 | 19.9 | 21 | 21 | 22 | 21 | |
| Triaxial loading stiffness E50 (MPa) | 4 | 10 | 16 | 30 | 40 | 50 | 75 | 40 | |
| Oedometer loading stiffness Eoed (MPa) | 4 | 10 | 16 | 30 | 40 | 50 | 75 | 40 | |
| Triaxial unloading stiffness Eur (MPa) | 16 | 30 | 48 | 90 | 120 | 150 | 220 | 120 | |
| Poisson’s ratio v (-) | 0.30 | 0.35 | 0.30 | 0.30 | 0.30 | 0.30 | 0.30 | 0.30 | |
| Cohesion Cref (kPa) | 0.1 | 3 | 0 | 0 | 0 | 0 | 0 | 0 | |
| Friction angle ϕ (degrees) | 28 | 30 | 30 | 34 | 36 | 38 | 40 | 36 | |
| Dilatancy angle ψ (degrees) | 0 | 0 | 0 | 0 | 2 | 3 | 5 | 3 | |
| lateral earth pressure coefficient (K0) | 0.53 | 0.5 | 0.5 | 0.44 | 0.412 | 0.38 | 0.33 | 0.412 | |
| interface reduction factor (R) | 0.67 | 0.67 | 0.67 | 0.67 | 0.67 | 0.67 | 0.67 | 0.67 | |
| Element | Material | Unit Weight (kN\m3) | Thickness (m) | Poisson’s Ratio (-) | Modulus of Elasticity (MPa) |
|---|---|---|---|---|---|
| Diaphragm wall | Concrete | 25.0 | 1.20 | 0.15 | 24,100 |
| Raft slab | Concrete | 25.0 | 2.20 | 0.15 | 24,100 |
| Roof slab | Concrete | 25.0 | 1.40 | 0.15 | 24,100 |
| Technical slab | Concrete | 25.0 | 1.10 | 0.15 | 24,100 |
| Ticker slab | Concrete | 25.0 | 1.20 | 0.15 | 24,100 |
| Strut Beams | Steel | 78.0 | 12.7 mm | 0.3 | 210,000 |
© 2020 by the authors. Licensee MDPI, Basel, Switzerland. This article is an open access article distributed under the terms and conditions of the Creative Commons Attribution (CC BY) license (http://creativecommons.org/licenses/by/4.0/).
Share and Cite
Hefny, A.; Al-Atroush, M.E.; Abualkhair, M.; Alnuaimi, M.J. Three-Dimensional Response of the Supported-Deep Excavation System: Case Study of a Large Scale Underground Metro Station. Geosciences 2020, 10, 76. https://doi.org/10.3390/geosciences10020076
Hefny A, Al-Atroush ME, Abualkhair M, Alnuaimi MJ. Three-Dimensional Response of the Supported-Deep Excavation System: Case Study of a Large Scale Underground Metro Station. Geosciences. 2020; 10(2):76. https://doi.org/10.3390/geosciences10020076
Chicago/Turabian StyleHefny, Ashraf, Mohamed Ezzat Al-Atroush, Mai Abualkhair, and Mariam Juma Alnuaimi. 2020. "Three-Dimensional Response of the Supported-Deep Excavation System: Case Study of a Large Scale Underground Metro Station" Geosciences 10, no. 2: 76. https://doi.org/10.3390/geosciences10020076
APA StyleHefny, A., Al-Atroush, M. E., Abualkhair, M., & Alnuaimi, M. J. (2020). Three-Dimensional Response of the Supported-Deep Excavation System: Case Study of a Large Scale Underground Metro Station. Geosciences, 10(2), 76. https://doi.org/10.3390/geosciences10020076