Article

Three-Dimensional Response of the Supported-Deep Excavation System: Case Study of a Large Scale Underground Metro Station

by
Ashraf Hefny
1,
Mohamed Ezzat Al-Atroush
2,*,
Mai Abualkhair
1 and
Mariam Juma Alnuaimi
1
1
Department of Civil and Environmental Engineering, United Arab Emirates University, Al Ain 15258, UAE
2
Department of Engineering Management, College of Engineering, Prince Sultan University, Riyadh 11543, Saudi Arabia
*
Author to whom correspondence should be addressed.
Geosciences 2020, 10(2), 76; https://doi.org/10.3390/geosciences10020076
Submission received: 28 December 2019 / Revised: 7 February 2020 / Accepted: 15 February 2020 / Published: 19 February 2020
(This article belongs to the Special Issue Urban Geophysics)

Abstract

:
The complexities and the economic computational infeasibility associated in some cases, with three-dimensional finite element models, has imposed a motive for many investigators to accept numerical modeling simplification solutions such as assuming two-dimensional (2D) plane strain conditions in simulation of several supported-deep excavation problems, especially for cases with a relatively high aspect ratio in plan dimensions. In this research, a two-dimensional finite element model was established to simulate the behavior of the supporting system of a large-scale deep excavation utilized in the construction of an underground metro station Rod El Farrag project (Egypt). The essential geotechnical engineering properties of soil layers were calculated using results of in-situ and laboratory tests and empirical correlations with SPT-N values. On the other hand, a three-dimensional finite element model was established with the same parameters adopted in the two-dimensional model. Sufficient sensitivity numerical analyses were performed to make the three-dimensional finite element model economically feasible. Results of the two-dimensional model were compared with those obtained from the field measurements and the three-dimensional numerical model. The comparison results showed that 3D high stiffening at the primary walls’ corners and also at the locations of cross walls has a significant effect on both the lateral wall deformations and the neighboring soil vertical settlement.

1. Introduction

The rapid growth of urban areas always imposes development in the construction of underground structures such as tunnels, underground parking garages, basements, and utilities, etc. Recently, a new generation of transportation modes was proposed. These transportation modes aspire to overcome the traffic congestion problems using a high-speed railway (HSR) technology of magnetic levitation and vacuum underground tunnels and tubes [1]. For instance, in the United States, more than 68.4 billion USD has been proposed to implement this new mode of transportation under the name of the hyperloop [1]. This new system consists of a low-pressure tunnel with capsules that are transported at both low and high speeds throughout the length of the tunnel. The capsules are accelerated via a magnetic linear accelerator affixed at various stations on the low-pressure tunnel with rotors contained in each capsule. Passengers may enter and exit the hyperloop at stations located either at the ends of the tunnel, or at branches along the tunnel length. The average speed of this new model is 164 mph (264 kph), and the travel time of 2 h and 38 min is expected between San Francisco and Los Angeles, compared with 1 h and 15 min by air and 5 h and 30 min by car. Thus, this new mode of transport will provide benefits compared to the current modes without the negative aspects of each. However, construction of such urban development projects always involves deep vertical excavations and underground tunneling that are frequently close to existing structurally-sensitive buildings and utilities. Implementation of such underground structures through soil deposits or weak rock formations always requires meticulous considerations in terms of construction methods: Movements in the soil surrounding the deep excavations might cause a settlement of the adjacent ground surface, and affect the overlying structures [2].
It is well-acknowledged that the control of ground movements and protection of adjacent or overlying structures is a significant concern in the design and construction of deep excavations and tunneling in urban areas [2,3,4,5,6,7,8]. To date, failures of structures or roadways adjacent to excavation still occur, despite the recent advances made in assessing the stability of excavations and eliminating the expected effects of the excavation process on the response nearby soils. One of the most recent examples of such failure case histories is the collapsed 13-floor building due to toppling in the Minhang District of Shanghai, China (2009). The main reason for this failure, as explained by Chai et al., [9] was a nearby deep excavation that overloaded the piles of the collapsed building. Chai et al., [9] indicated that the failure was initiated by lateral overloading on the pile foundation due to excavation near one side of the collapsed building and stockpiling the excavation at another side of the building. The unbalanced excavation and fill on the sides of the collapsed building induced lateral loads on the piles, also accompanied by unforeseen soil softening due to a rain event.
The ground movements associated with the construction of underground stations depend on several factors such as the properties of the soil, the general dimensions of the excavations, the general procedure of excavation, the bracing system employed, and the experience of the workmanship [3]. Therefore, the prediction of the response of the support systems of deep excavations is a challenge because of the existence of those influencing factors [10].
Generally, deep excavation mainly has two principal effects on the neighboring soil. The first is that the removal of the weight of the excavated soil causes a decrease in the vertical stress in the soil beneath the excavation level. The second is that the removal of the inside soil from the excavation pit causes a loss of lateral support for the soil around the excavation pit. Thus, the primary purpose of the excavation-support system is to provide essential lateral support for the neighboring soil around the excavation to eliminate the corresponding movements. Hence deep excavations initiate lateral and vertical ground deformations due to stress relaxation and bottom heave associated with the excavation process. The adjacent buildings and buried utilities become kinematically loaded by the induced ground deformations, (magnitude and direction) and the building proximity to the excavations [7,8].
In the past decades, significant advances have been made in research, and several approaches have been developed to estimate the deflection and expected deformation patterns and magnitudes induced by deep excavations, for different soil types. However, empirical approaches such as [11,12,13,14,15,16,17,18,19,20,21] relied on graphical methods and, most of them only depended on experience gained from previous cases.
On the other hand, one of the recent great achievements in geotechnical engineering is the utilization of finite element analysis to solve several geotechnical problems. The soil properties, including their strain dependence, the construction, excavation stages, and the stiffness of the support system can be simulated [22]. The development in finite element analysis has become evident with comprehensive field observations of the behavior of excavations and with improved in-situ methods for evaluating the appropriate soil properties.
Different approaches have been utilized to simulate the in-situ response of soil-support systems in deep excavations and to model the different stress-strain relationships such as linear, nonlinear, inelastic, anisotropic, and time-dependent soil response. Realistic modeling of the stress-strain behavior leads to reliable prediction for the performance of soil-support systems of deep excavations. Despite that, several numerical studies have shown that the calculated horizontal displacements of the support system are somehow inconsistent with the field measurements [23,24,25,26,27]. One of the most common reseasons of this inconsistency was presented and discussed in the numerical study [28]. It was concluded that for typical rectangular excavation cases, the accuracy of predicted values is affected by the existence of the corner of excavation, especially in excavations having relatively short walls. Plane strain analysis might give conservative results, especially for the center section of a relatively short excavation wall. For the sections near corners, the analysis would be much more conservative because the three-dimensional effects in this region are not considered. Excavations are in nature, three-dimensional problems [28].
Parametric three-dimensional finite element analyses [28] have also been presented to investigate the features of three-dimensional deep excavation behaviors. A close relationship exists between the aspect ratio of the excavation geometry (B/L) and the wall deformation while B and L are the excavation dimensions in the horizontal plane in the direction of lateral wall measurements and the perpendicular direction, respectively. Increasing B/L decreases the wall deformation. Additionally, the wall deformation of a deep excavation is directly related to the smallest distance from the corner (d). The smaller the value of d; the less is the wall deformation.
Ou et al., [28] defined a ratio called the Plane Strain Ratio (PSR) as the ratio of the maximum wall deformation of the cross-section at a distance (d) from the excavation corner to the maximum wall deformation in the plane strain conditions of the same geometry. They established the relationship between (PSR), (B/L), and (d) based on the results of parametric studies.
In the same line, several studies [20,29] discussed the response of a supported deep excavations system in soft to medium clays. The excavation was supported by a flexible sheet pile wall and three levels of re-groutable anchors. They suggest a parallel distribution for the deformation to account for the corner effect. They developed also a complementary error function (erfc) to define the three-dimensional settlement distributions of ground movement around the excavation of finite length.
With that in mind, the differences between the two- and three-dimensional behavior of the supported deep excavation systems may not only be affected by the corners but also by several factors such as the cross walls which may be an additional cause for the lack of accuracy of 2D plane strain numerical models. Since cross-walls are constructed before excavation, so this is expected to effectively influence the lateral wall displacements and the subsequent ground settlements by the significant axial stiffness. In this case, the anticipated effect of the cross walls may be also an issue.
In this paper, two- and three-dimensional finite element models were established to simulate the in-situ response of the deep excavation soil-support system utilized to provide the essential lateral stability during the construction of the large-scale underground metro station of Rod El Farag (Cairo, Egypt). The results of these finite element models were used to assess the effect of three-dimensional wall corners and cross walls on the performance of the support system of this large-scale deep excavation.

2. Case Study

Cairo belongs to one of the highly populated cities. Several decades ago, the Egyptian Government decided to construct a transit underground network (Cairo Metro). Cairo Metro network contains three lines, line 1 (Regional Line), line 2, and line 3. The regional line has been completed and has been already in operation since 1987. Rod El Farag subway underground station is one of seven stations constructed to serve the second line (Line 2) of the Greater Cairo Metro in phase A1.
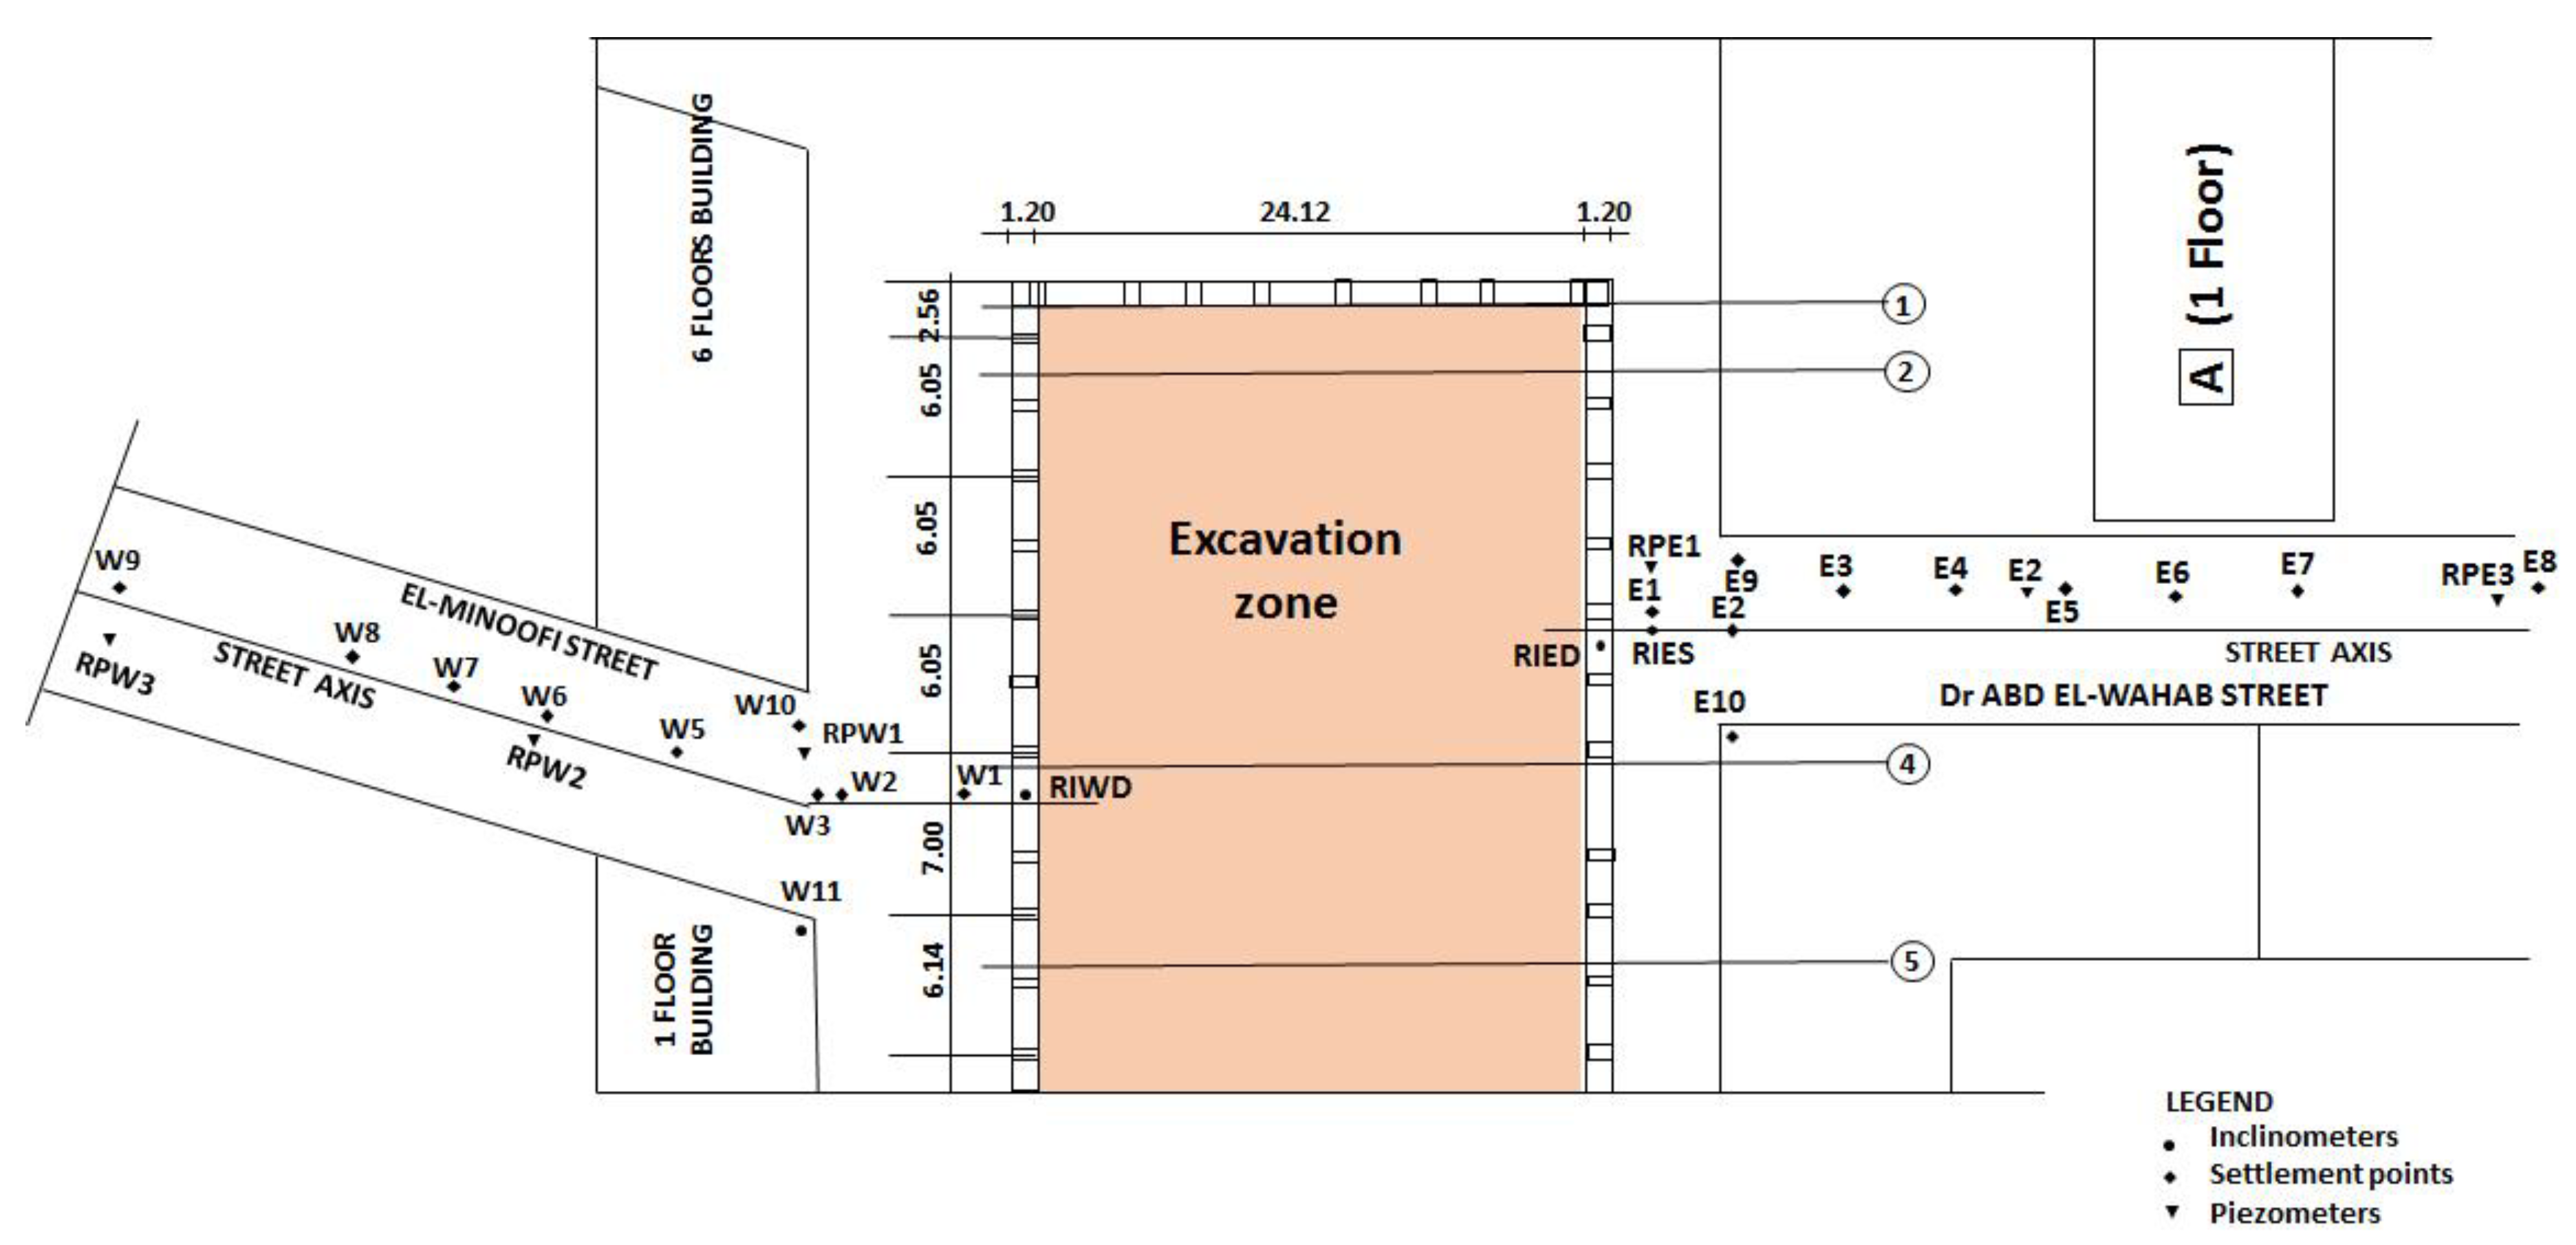
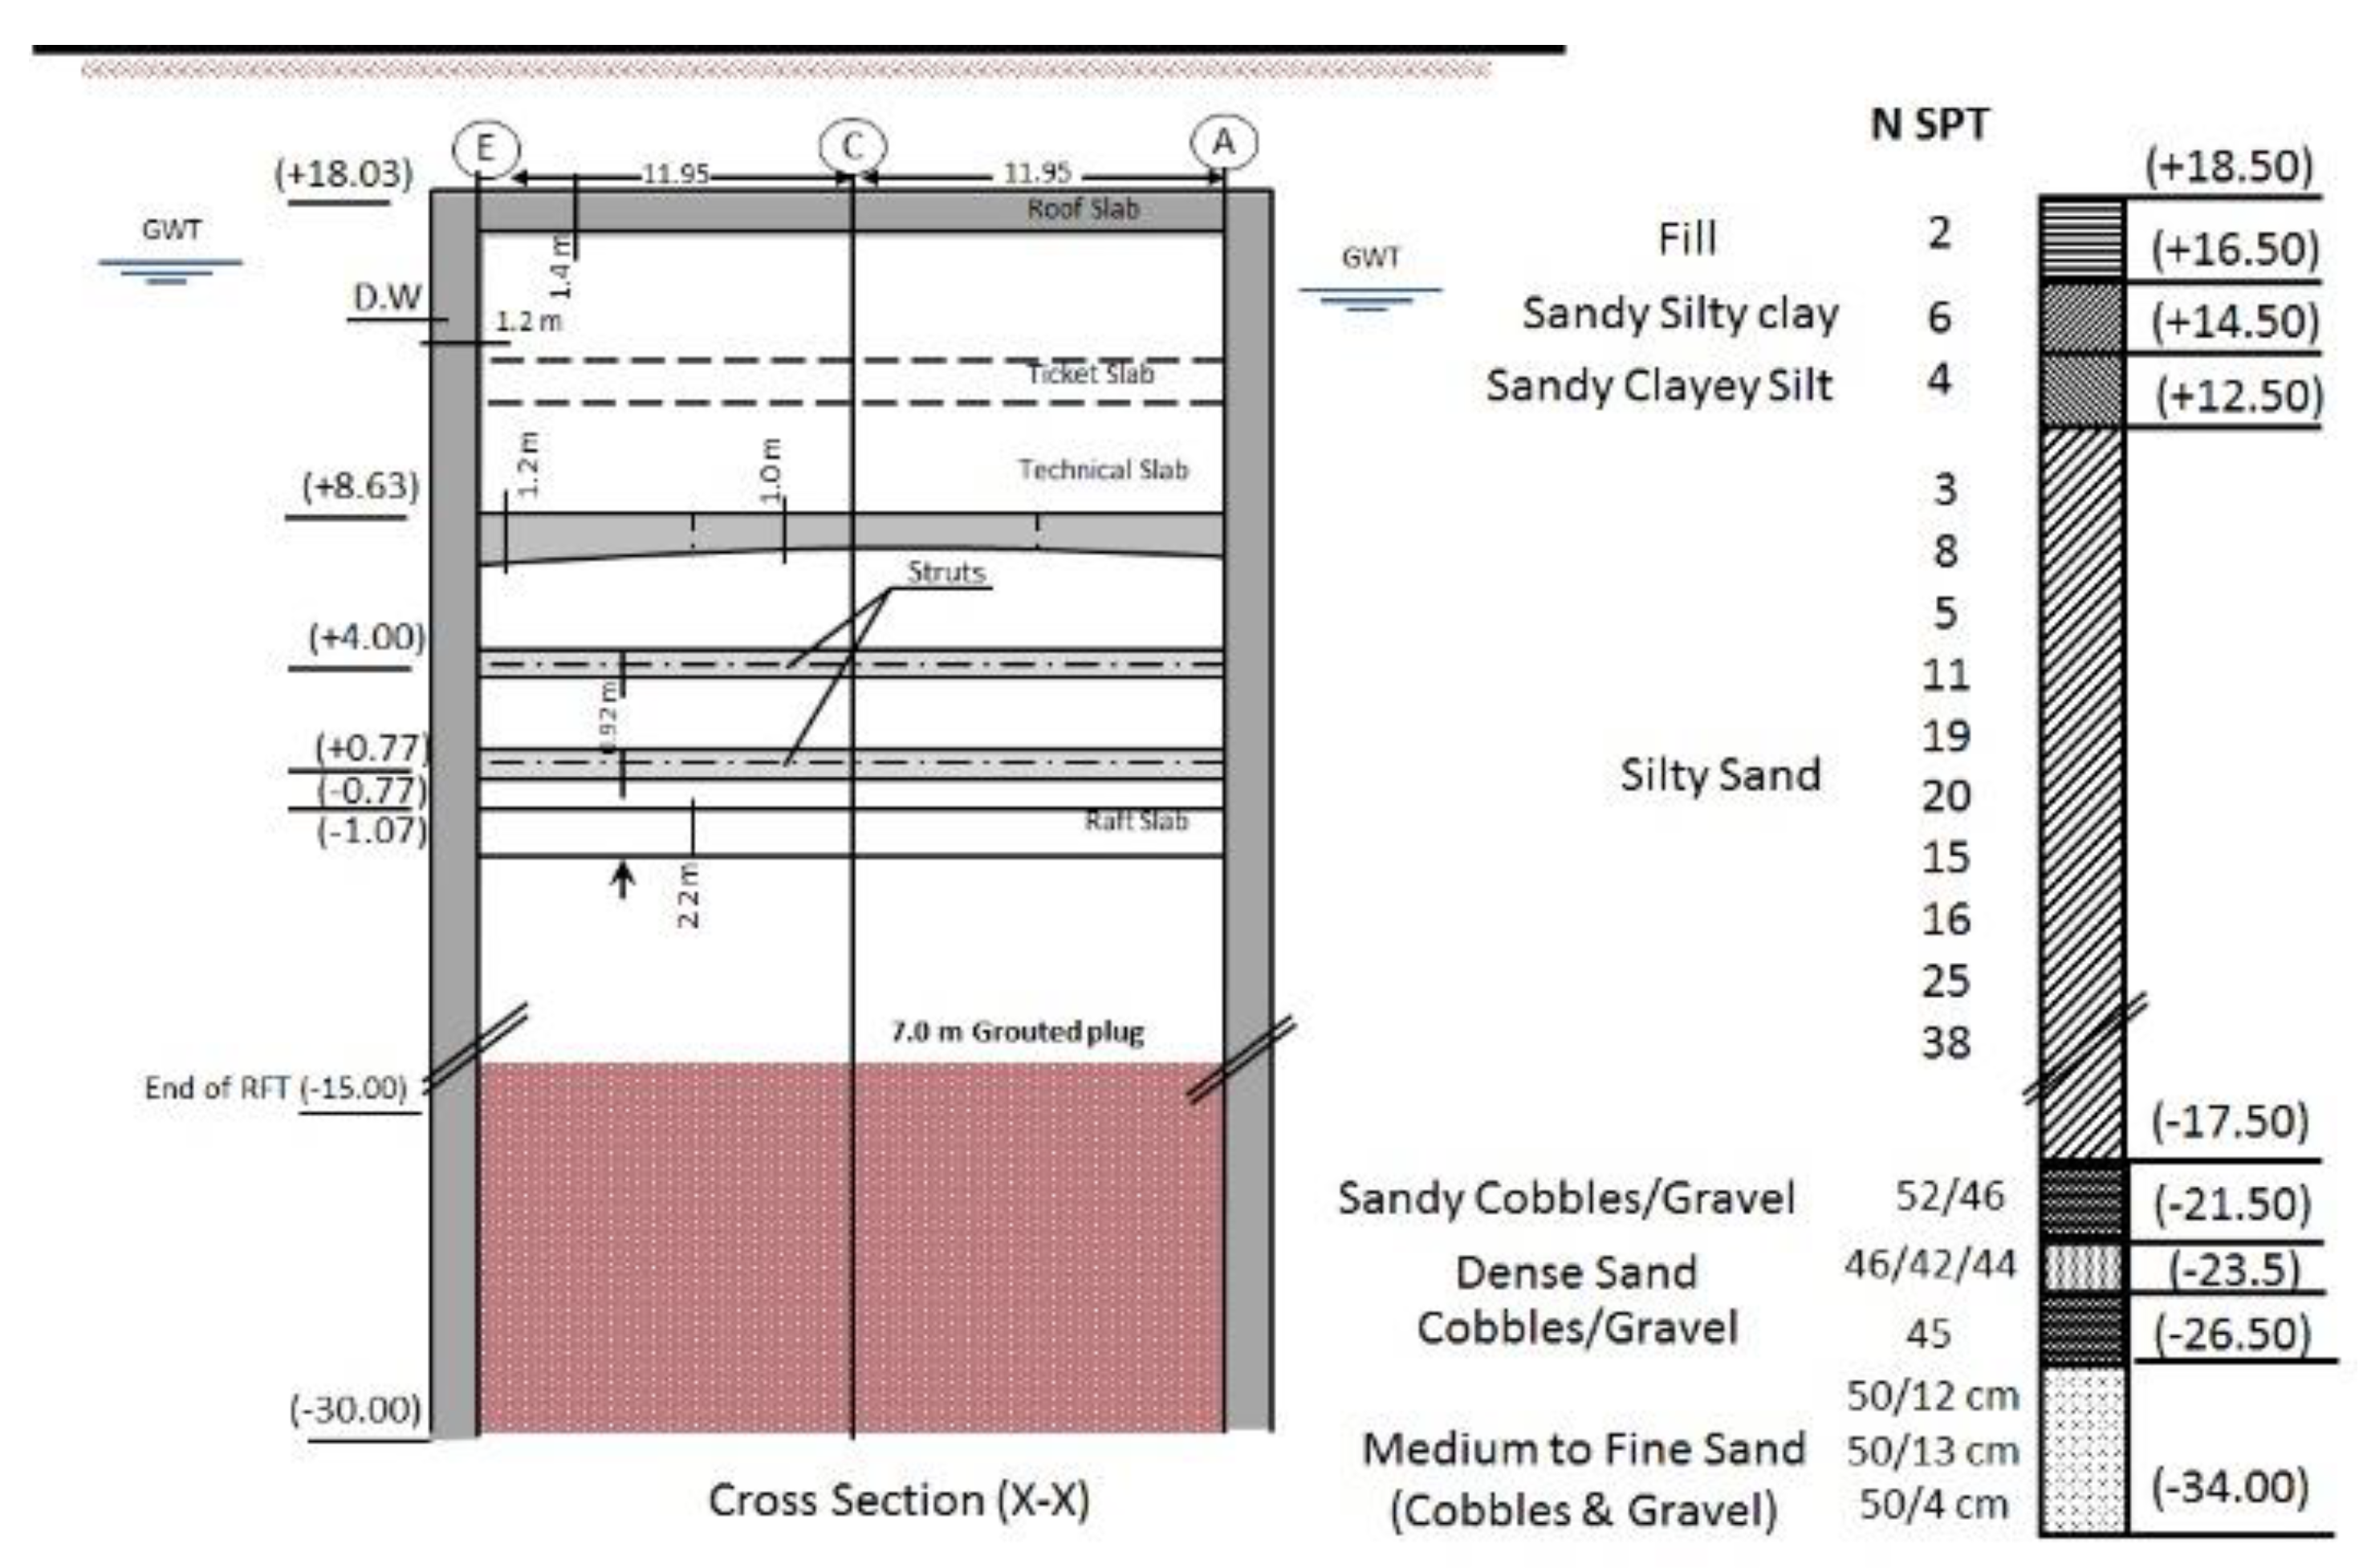
Figure 1 presents the layout and cross-section of the Rod El Farag underground station. As shown, dimensions of this large deep excavation were 150 m width, 24 m length, and nearly about 35 m clear depth. A braced-system was used to provide the essential lateral support, compulsory for the neighboring soil stability during the excavation process. The system consisted of four primary outer walls and two interior cross diaphragm walls of 1.2 m thickness, and 48.0 m depth. Besides, three levels of reinforced concrete slabs were also implemented to act as lateral supporting elements during the excavation, namely, the roof, ticket, and technical slabs. Additionally, two rows of steel struts were erected at elevations of + 4.0 m and + 0.77 m to provide sufficient stability at the deeper levels of excavation. Also, inclined struts were implemented at the twelve corners of this large scale station. The spacing between the successive temporary pipe struts was 3 m. The upper strut had an outer diameter of 1016 mm with a thickness of 12.7 mm. The lower strut had an outer diameter of 914 mm with a thickness of 12.7 mm. Also, a pre-stressing force of 1500 kN/strut was developed on the temporary struts. Details of the monitoring of wall movement and soil deformation were reported in [30,31].
Several instrumentations were used to monitor the expected deformations of the soil and the support system during different excavation stages. Ten settlement points were installed on the east side of the diaphragm wall (E1, E2, E3, E4, E5, E6, E7, and E8), while eleven settlement points were installed on the west side (W1-11). The locations of those settlement points are indicated in Figure 2 Unfortunately, the settlement points were installed after the diaphragm wall construction which means that these settlement points did not monitor the soil settlement during the diagram walls’ implementation and began only to monitor in the excavation phase.
Three inclinometers were installed at the instrumented section of the station. Two inclinometers were installed inside the east (RIED) and the west (RIWD) diaphragm walls (diaphragm wall inclinometers), while the third inclinometer was installed in the soil at the east side (RIES), as shown in Figure 2. A steel casing of 0.10 m was implemented within the reinforcement cage to protect the inclinometer during the concrete casting phase.
Embedment strain gauges were welded on the horizontal steel struts, and on the reinforcement of the concrete slabs to measure the induced strains in the structural elements due to the excavation process. On the other hand, piezometers were utilized to record the change in water level during the dewatering process.

2.1. Site Conditions

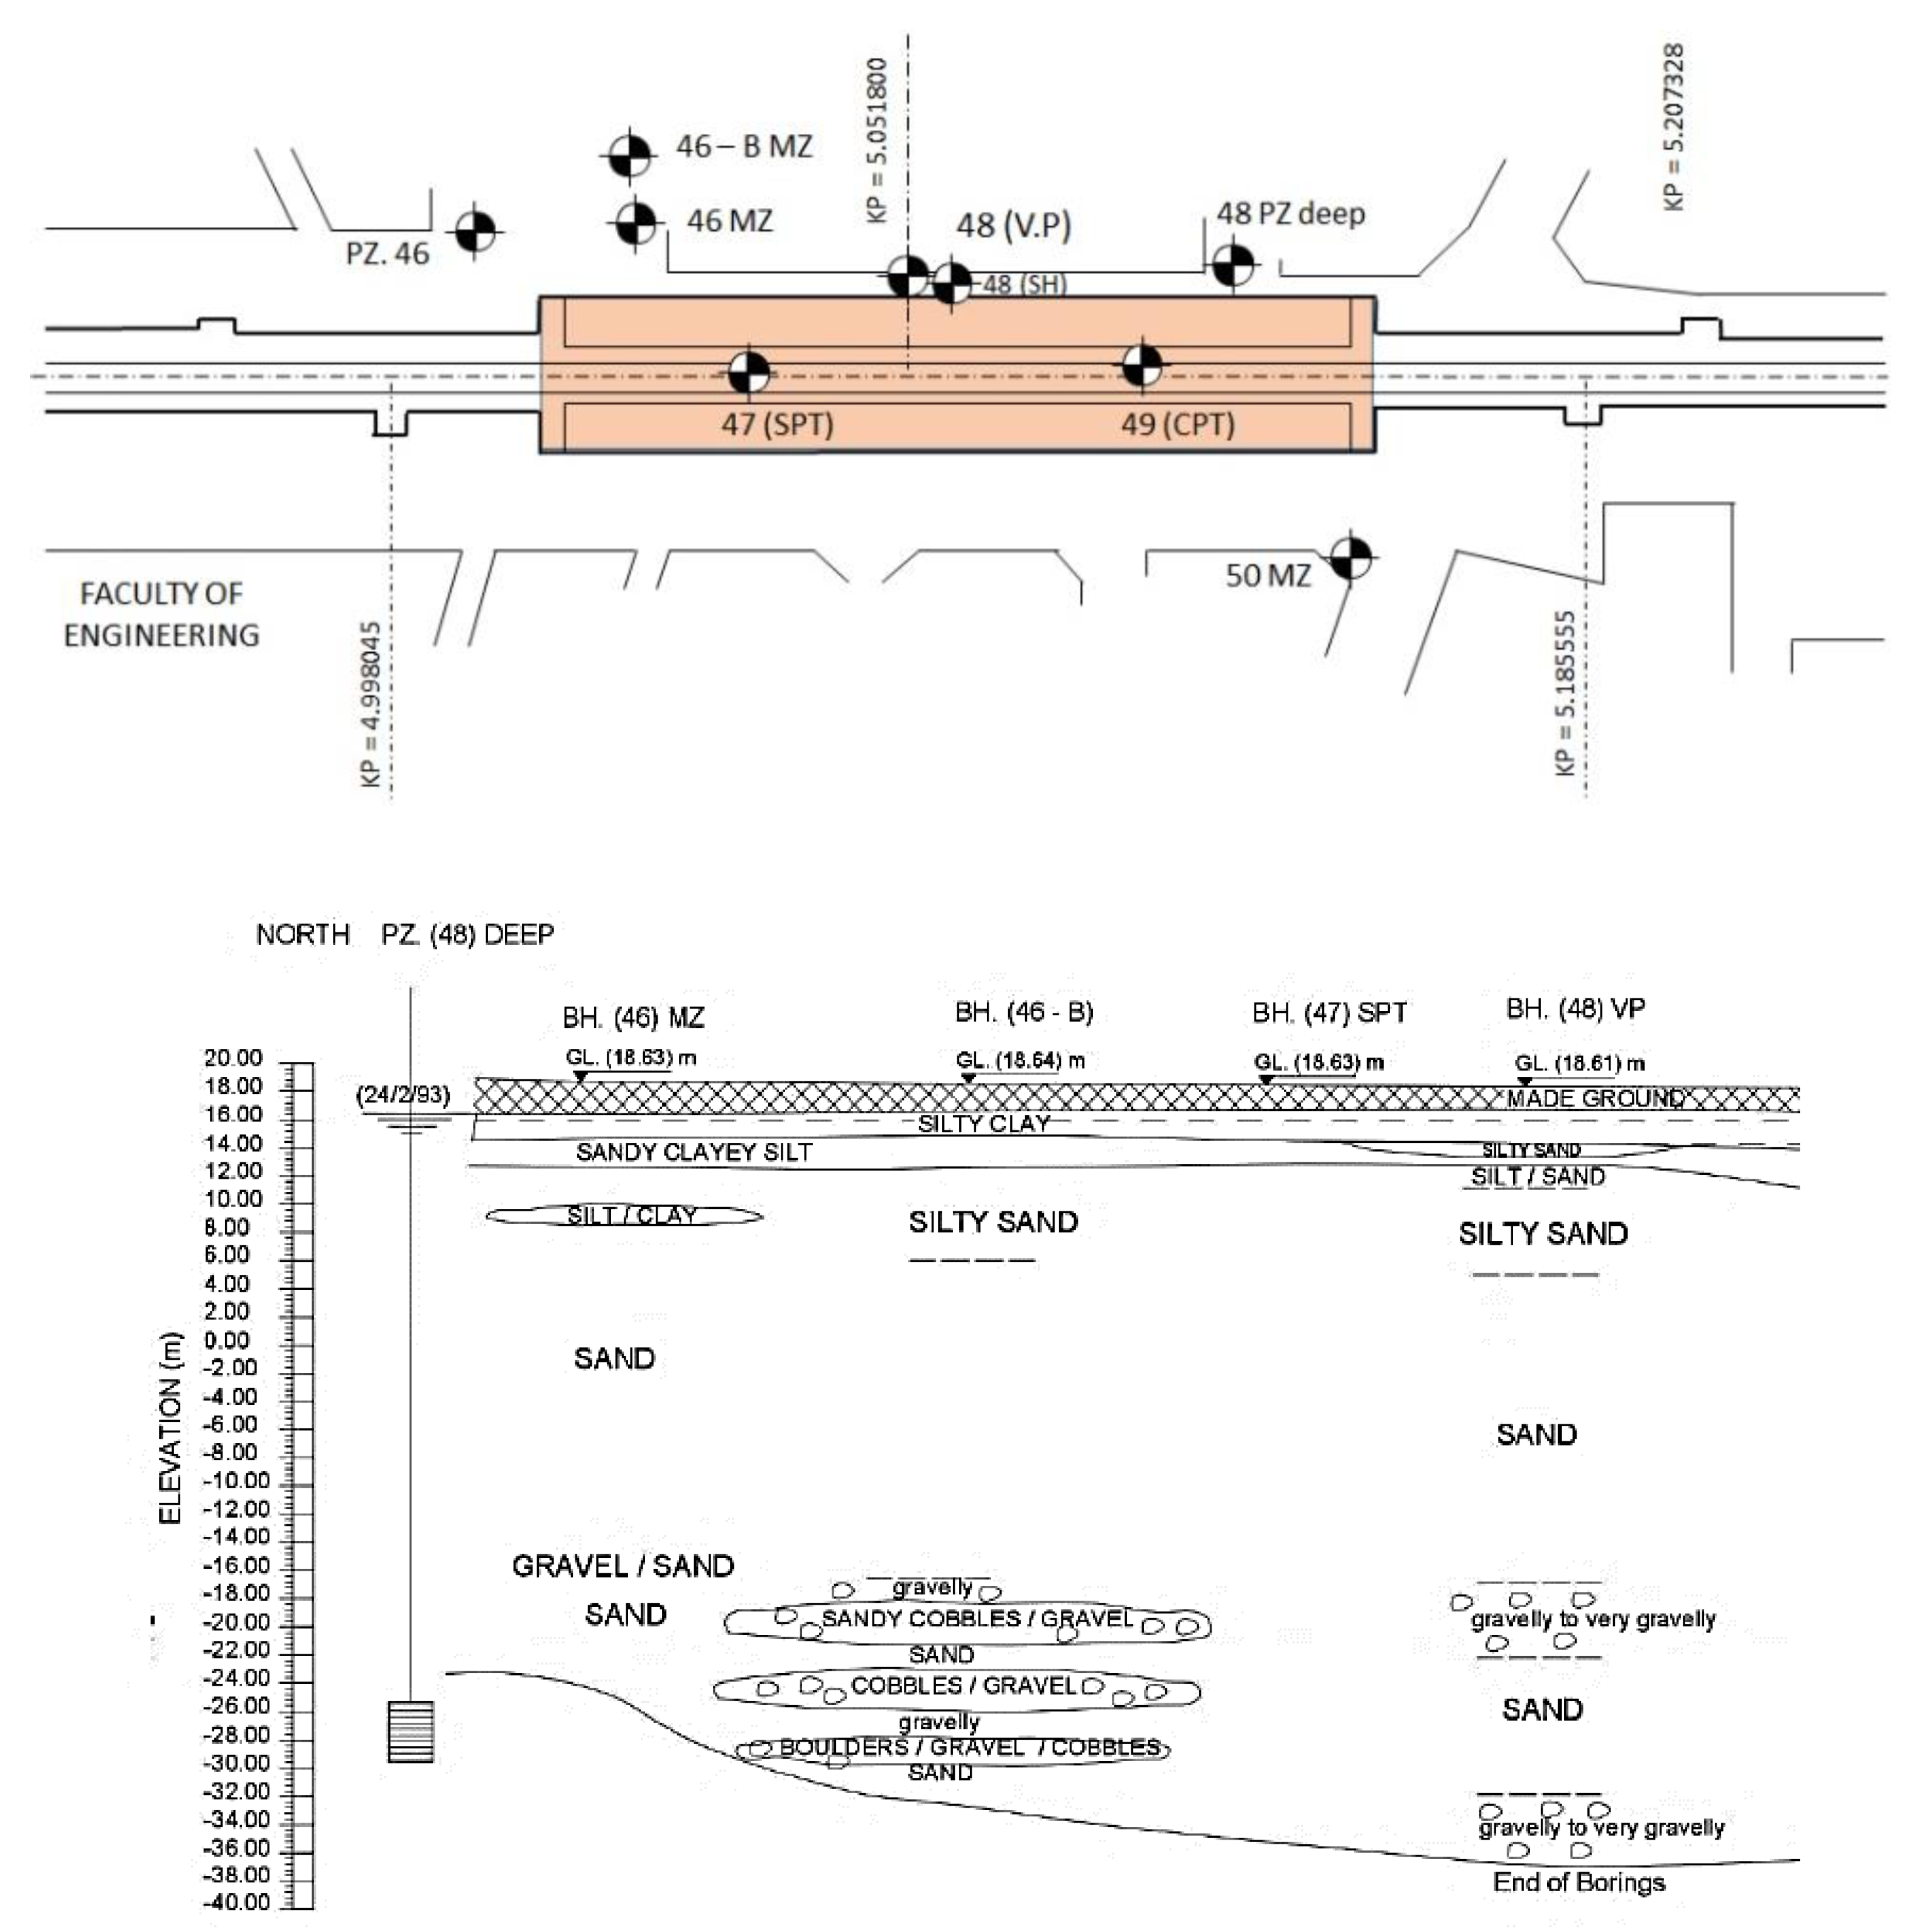
Geotechnical investigation of Rod El Farag subway station included the drilling of more than five boreholes, standard penetration tests, and cone penetrations tests. A layout plan and elevation showing the locations of boreholes and in-situ tests conducted at the subway’s location are presented in Figure 3 below.
Figure 4 shows the details of borehole no.46-B that lies in the section under study (North Block). Data obtained from this borehole were used in this study. Based on the results of the conducted in- situ and laboratory tests, the groundwater existed at an average depth of 2.50 m below the ground surface. Also, the soil stratification can be summarized as follows: Layer (1) starts at level (+18.50) and extends to level (+16.5), and it is a fill layer consisting of sand and silt intermixed with gravel, asphalt, and building debris. Layer (2) begins from level (+16.5) to level (+12.5), and it consists of slightly sandy silt clay soil with a liquid limit and plasticity index of 48% and 21%, respectively. Layer (3) is a thick segment of silty sand that starts from level (+12.5) to level (−17.5) with a thickness of 30.0 m; water content obtained for this layer ranges from 17% to 25%. Layer (4) starts from level (− 17.00) to level (−30.00), and it consists of very dense medium to fine sand underlined by cobbles and gravel with a thickness of 6.0 m. The last layer is medium to fine sand extended to the end of boring. Figure 4 illustrates the soil profile along with the Rod El Farag station and also shows the different layers and NSPT results for each segment.

2.2. Stages of Construction

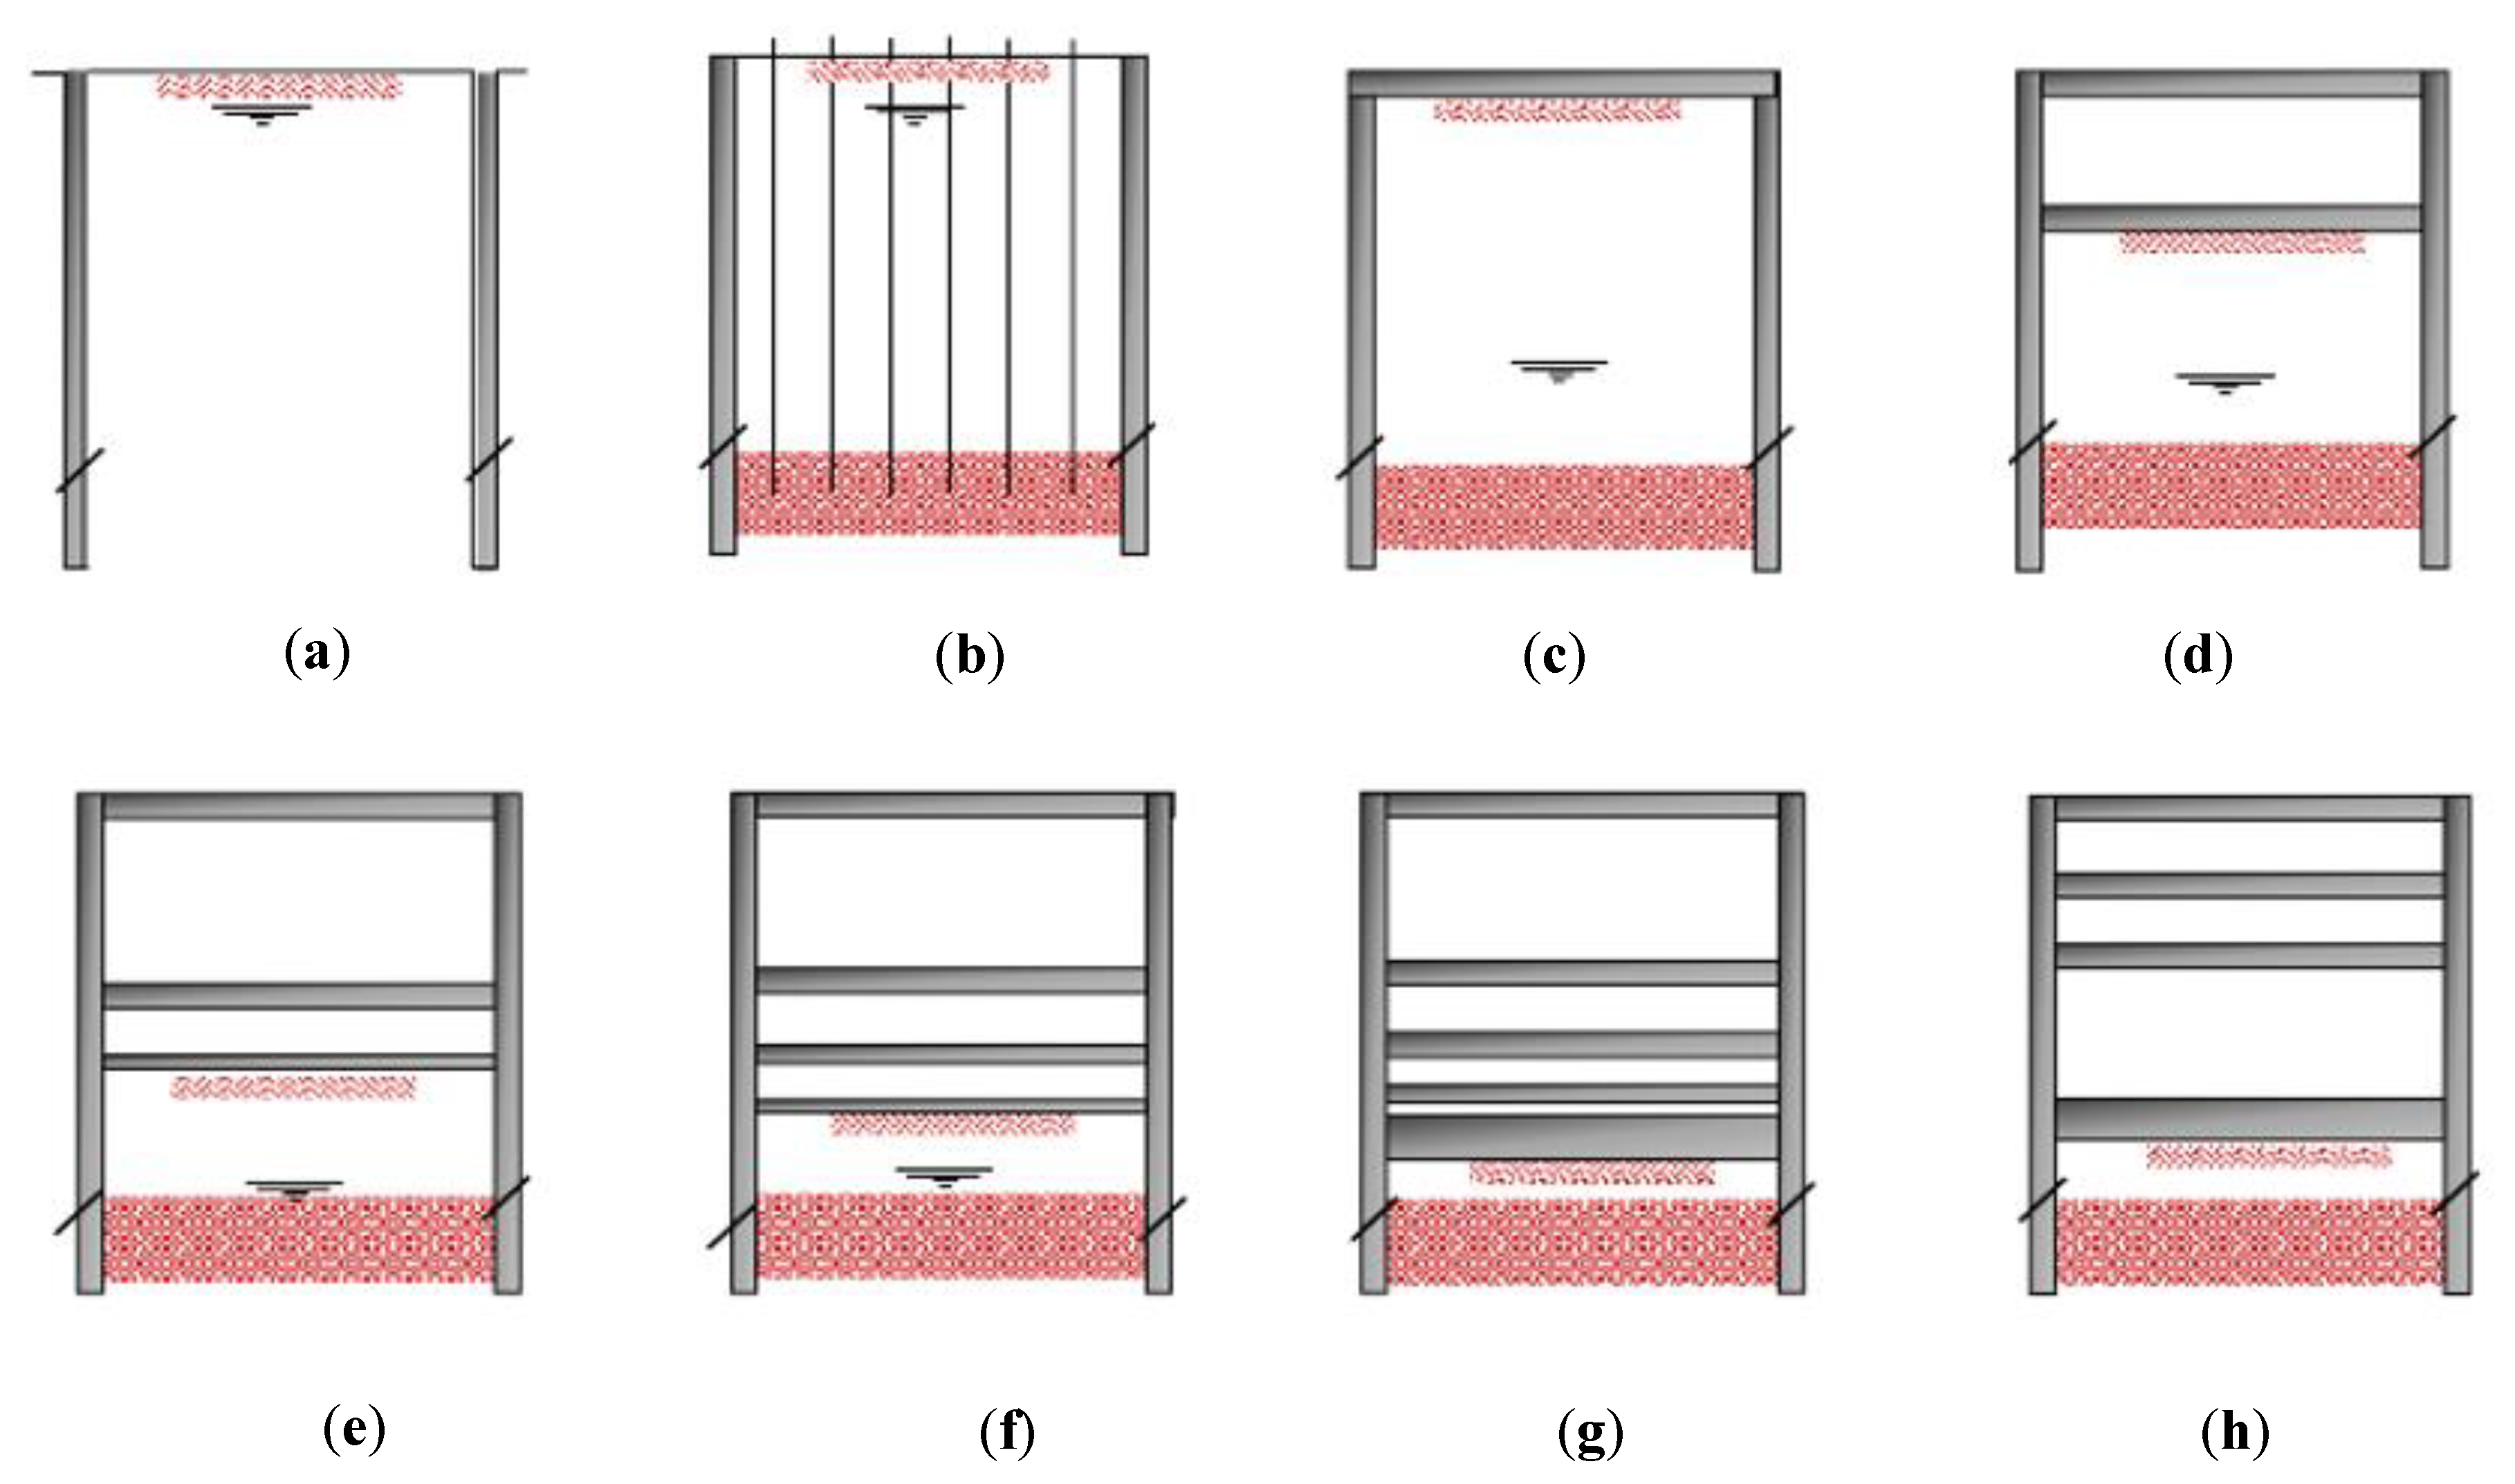
Figure 5 describes the top and down sequence followed in the construction of the metro subway. Eight stages of construction were adopted as follows:
  • 1st Stage: Construction of diaphragm walls to a depth of 48.0 m. Bentonite slurry installation procedure was involved in this stage.
  • 2nd Stage: Grouting the essential water plug with a thickness of 7.0 m between the diaphragm walls.
  • 3rd Stage: Dewatering the groundwater table to level of (–3.30), excavation to roof slab level, and roof slab concreting.
  • 4th Stage: Excavation to technical slab level and technical slab concreting.
  • 5th Stage: Excavation to the level of the first row of struts and installation of steel beams. Also, a pre-stressing force of 1500 kN was applied on each strut steel beam in this stage.
  • 6th Stage: Excavation to the level of the second row of struts, then installation and pre-stressing of the second row of steel struts.
  • 7th Stage: Excavation to raft slab level and raft slab concreting.
  • 8th Stage: Removal of the first and the second rows of struts.
  • 9th Stage: Concreting the ticket slab and stopping the dewatering process.
Fundamental to note is that the groundwater table was lowered to be at a level of 0.90 m below the raft slab level, and this dewatering process was accomplished before starting excavation works [30]. Ticket slab concreting mentioned in stage 9 was performed on a date after this field study was completed so that the corresponding effect of this stage on the diaphragm wall response is not included.

2.3. Field Measurements

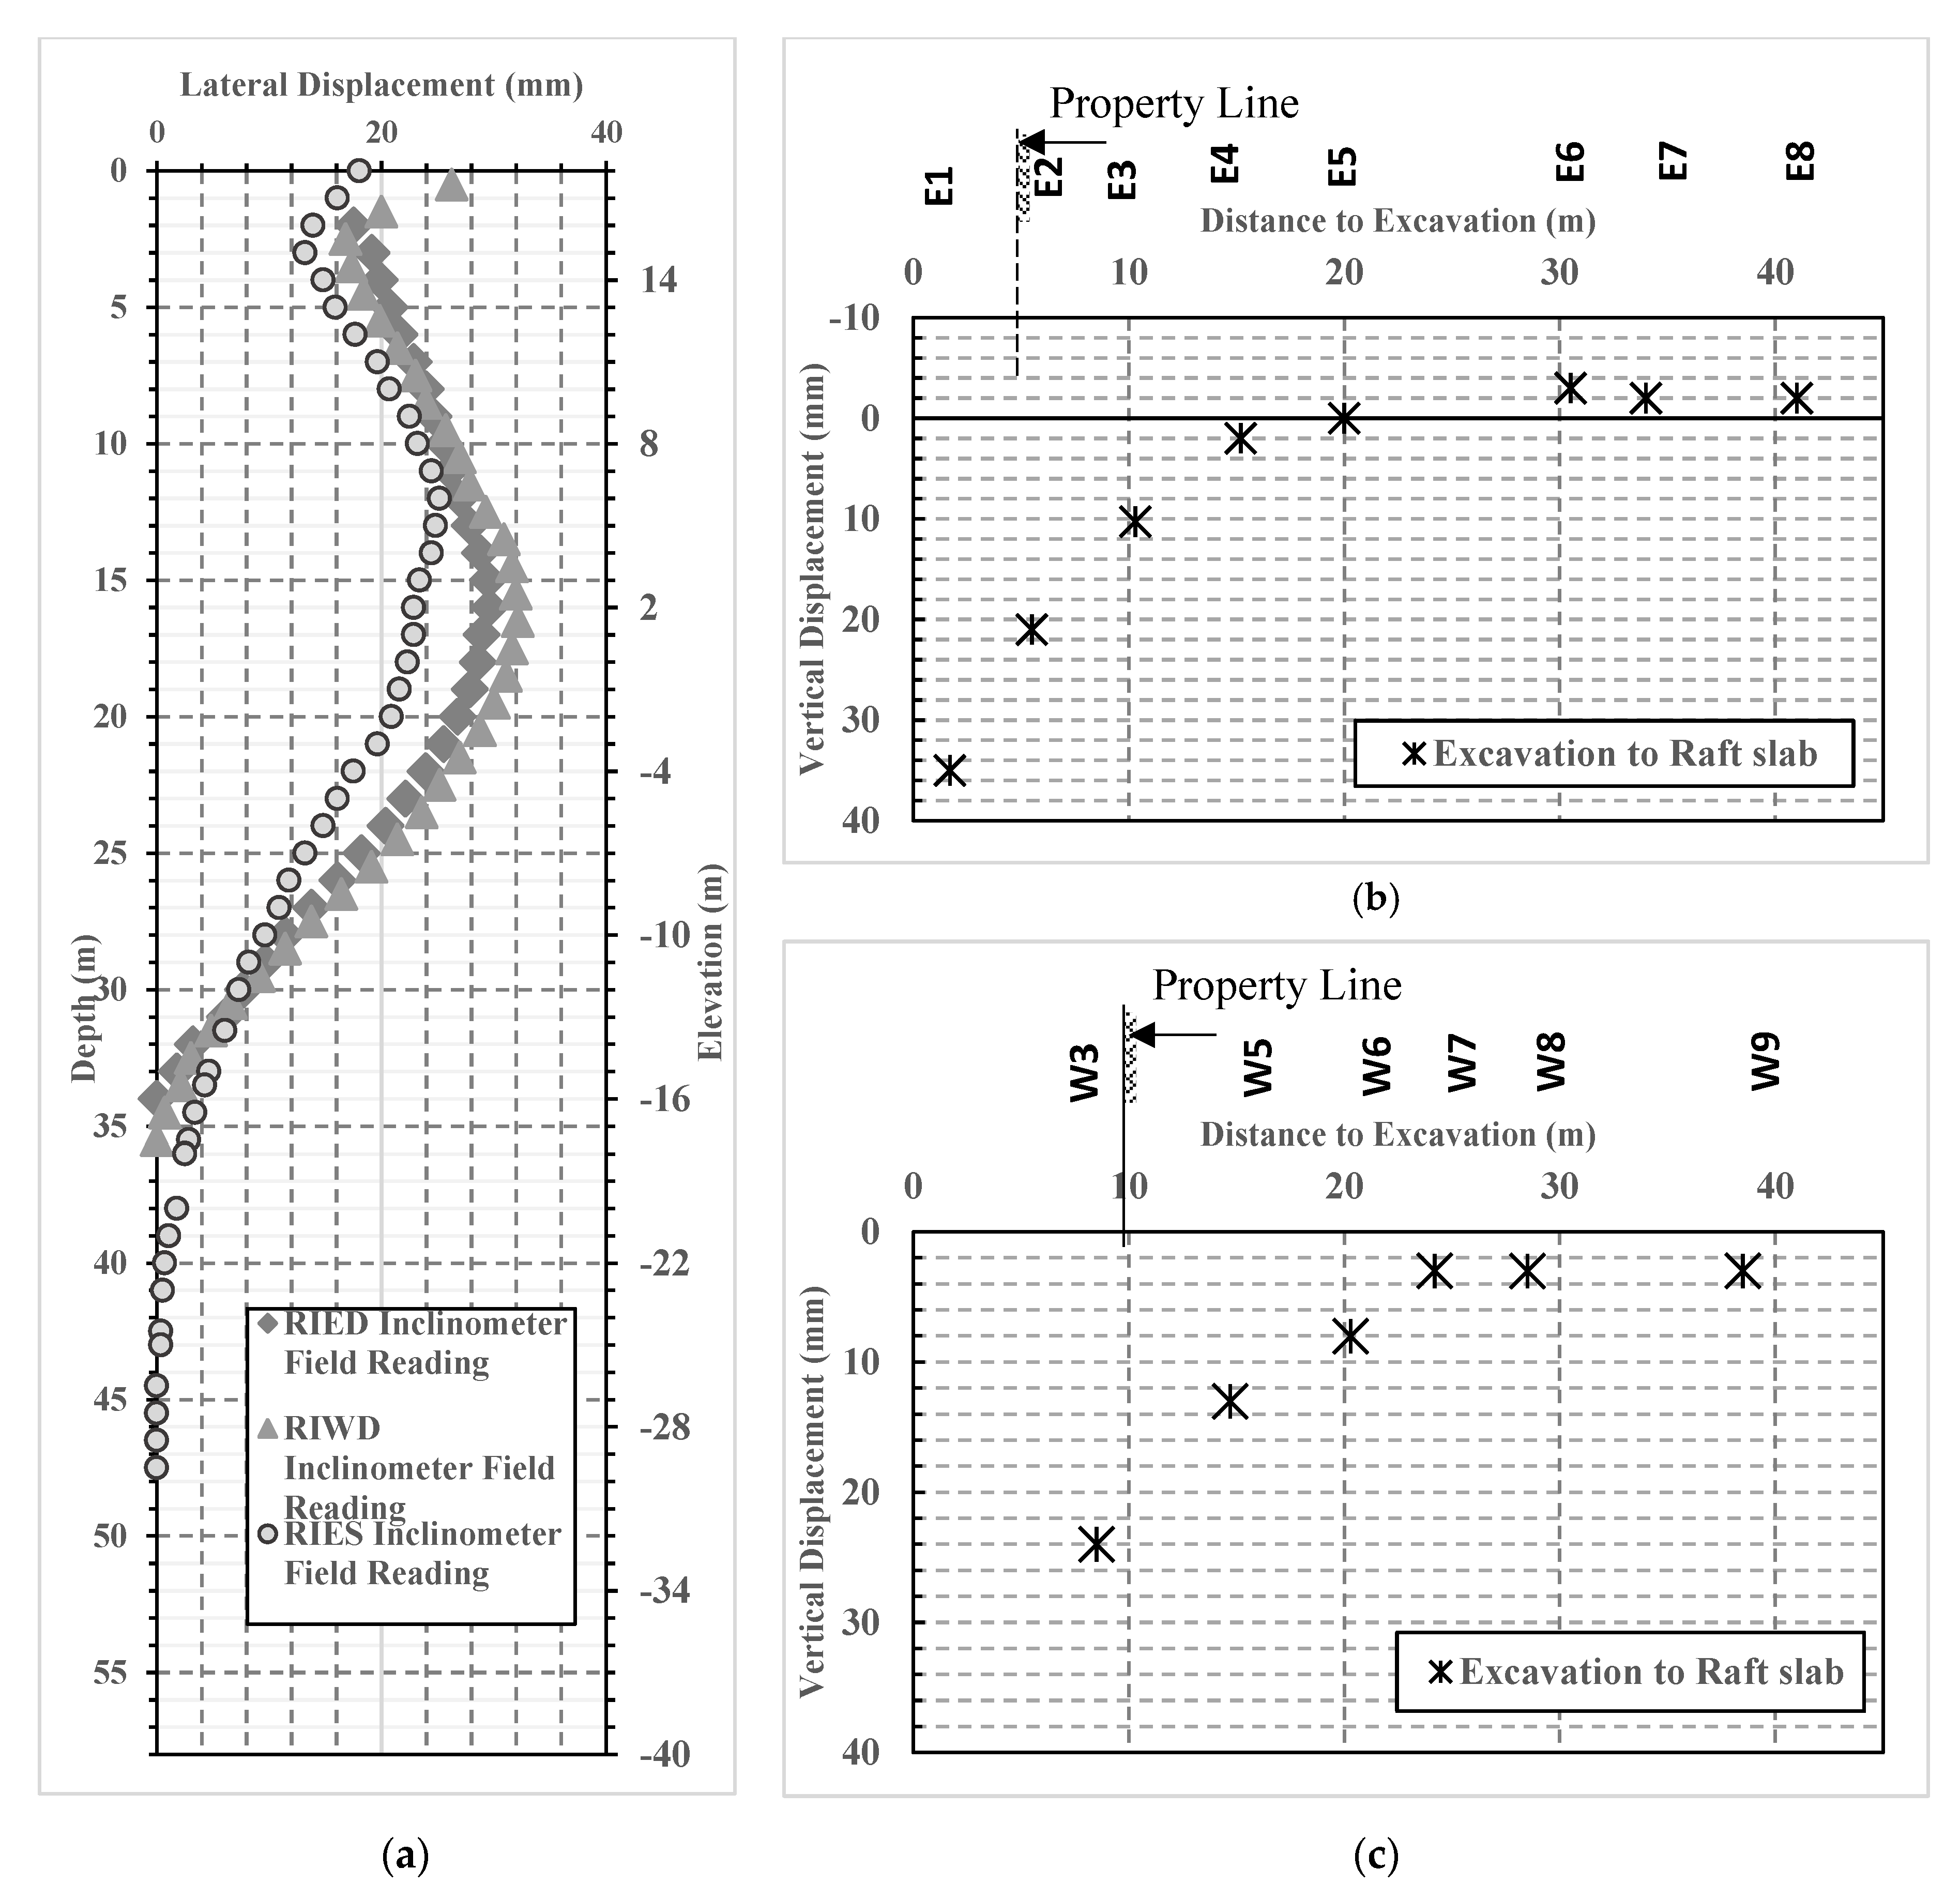
Measurements of the diaphragm walls lateral displacement were obtained using the two inclinometers implemented in both the east and west sides (RIED, and RIWD). Figure 6a presents the variation in diaphragm walls lateral displacement with depth. The relation between the in-situ measurements of the soil surface settlement and the horizontal distance from the excavation area are also shown in Figure 6b,c for both measurements obtained using the settlement points erected in east and west sides (E1-8, and W1-11) of the excavation area. Fundamental to note is that measurements shown in the figures were observed after the accomplishment of diaphragm walls’ construction.
The maximum wall lateral displacements measured at the end of excavation stages were 29.5 mm and 31.5 mm at an elevation of (0.00) as recorded by RIED and RIWD respectively, while the maximum soil displacement was 21.50 mm at the same elevation. These displacements represent the percentage of 0.09%, 0.10%, and 0.07%, respectively, of the maximum depth of excavation.
As shown in Figure 6a, the performance monitored by the west wall inclinometer (RIWD) is in good agreement with the diaphragm wall inclinometer (RIED) measurements. Also, the maximum soil displacement recorded by RIES was less than the maximum diaphragm wall displacement recorded by RIED with only 8.0 mm, and approximately at the same elevation.
On the other hand, the maximum ground vertical settlement value of about 35 mm was recorded at E1 (east side). The observed settlement rough agreed with the general pattern of ground movement presented by Clough and O’Rourke [14]. In case the excavation cumulative advanced to more profound elevations, Clough and O’Rourke [14] found that on the contrary the maximum settlement did not occur at the nearest point to the diaphragm wall.

3. Numerical Modeling

Two and three-dimensional finite element models were established to simulate the behavior of the supported deep excavation system of Rod El Farag underground station. Fundamental to note is that the effect of the three-dimensional corners, and the cross walls as well as the inclined-bracing are not included in the 2D numerical model. However, the impact of these parameters on the results of both soil settlement, and wall lateral deformation, can be simulated through the three-dimensional finite element model. So that comparing results of both numerical models (2D and 3D) with the field measurements will be vital to assess the effect of 3D corners and the cross walls on the behavior of the supported system.

3.1. Properties of the Soil Model

In several practical cases, it has always been appropriate to use the Modified Mohr–Coulomb constitutive model (also known as the Hardening Soil Model), to define the drained and undrained conditions of soil layers, as has been concluded by different authors e.g., [10] that this model is superior to the Mohr-Coulomb model in predicting the displacements of the supported deep excavations problems. The reason being, this constitutive model simulates the soil material more precisely by considering three different values of stress-dependent moduli [Eeod, E50, and Eur] [32]. Also, the stress-strain behavior for primary loading is highly nonlinear, and unloading response can be represented.
For the cohesive soil layer, the undrained shear strength (Cu) is calculated using Equation (1) [33], based on the in-situ measurements of N-SPT, and plasticity index (PI). Also, the undrained Young’s modulus (Eu) of the cohesive soil layers is estimated using Equation (2) [34], based on the determined undrained shear strength Cu, the plasticity index PI, and the over consolidation ratio (OCR) obtained from the CPT results.
On the other hand, shear strength parameters of cohesionless soil layers are mainly determined based on the corrected in-situ N-SPT measurements. Also, the in situ water content is used to calculate the drained soil Young’s modulus (Eeod) using the Janbu chart [35].
Cu (kPa) = f * (N60)
where, f is a factor, function in the plasticity index PI.
Eu = k * Cu
where k is estimated using Duncan chart [34].
K0 = (1−sinØ) OCR sin Ø
In several practical cases, it was appropriate to set Eur equal to two to five times the E50, and to adopt the E50 with a value equal to the calculated value of Eeod [32]. The soil lateral earth pressure coefficient (k0) is calculated using the effective friction angle, and over-consolidation ratio obtained using the in-situ soil testing (Equation (3)) [36].
Mohr-Coulomb criterion is used to distinguish between the elastic interface behavior where small displacements can occur within the interface and plastic interface behavior when permanent slip may occur. Also, shear strength parameters of the interface elements are linked to the strength of the neighboring soil layers through a strength reduction factor (R), as given in Table 1, which summarizes the soil parameters adopted in this numerical study.

3.2. Two Dimensional Numerical Modeling

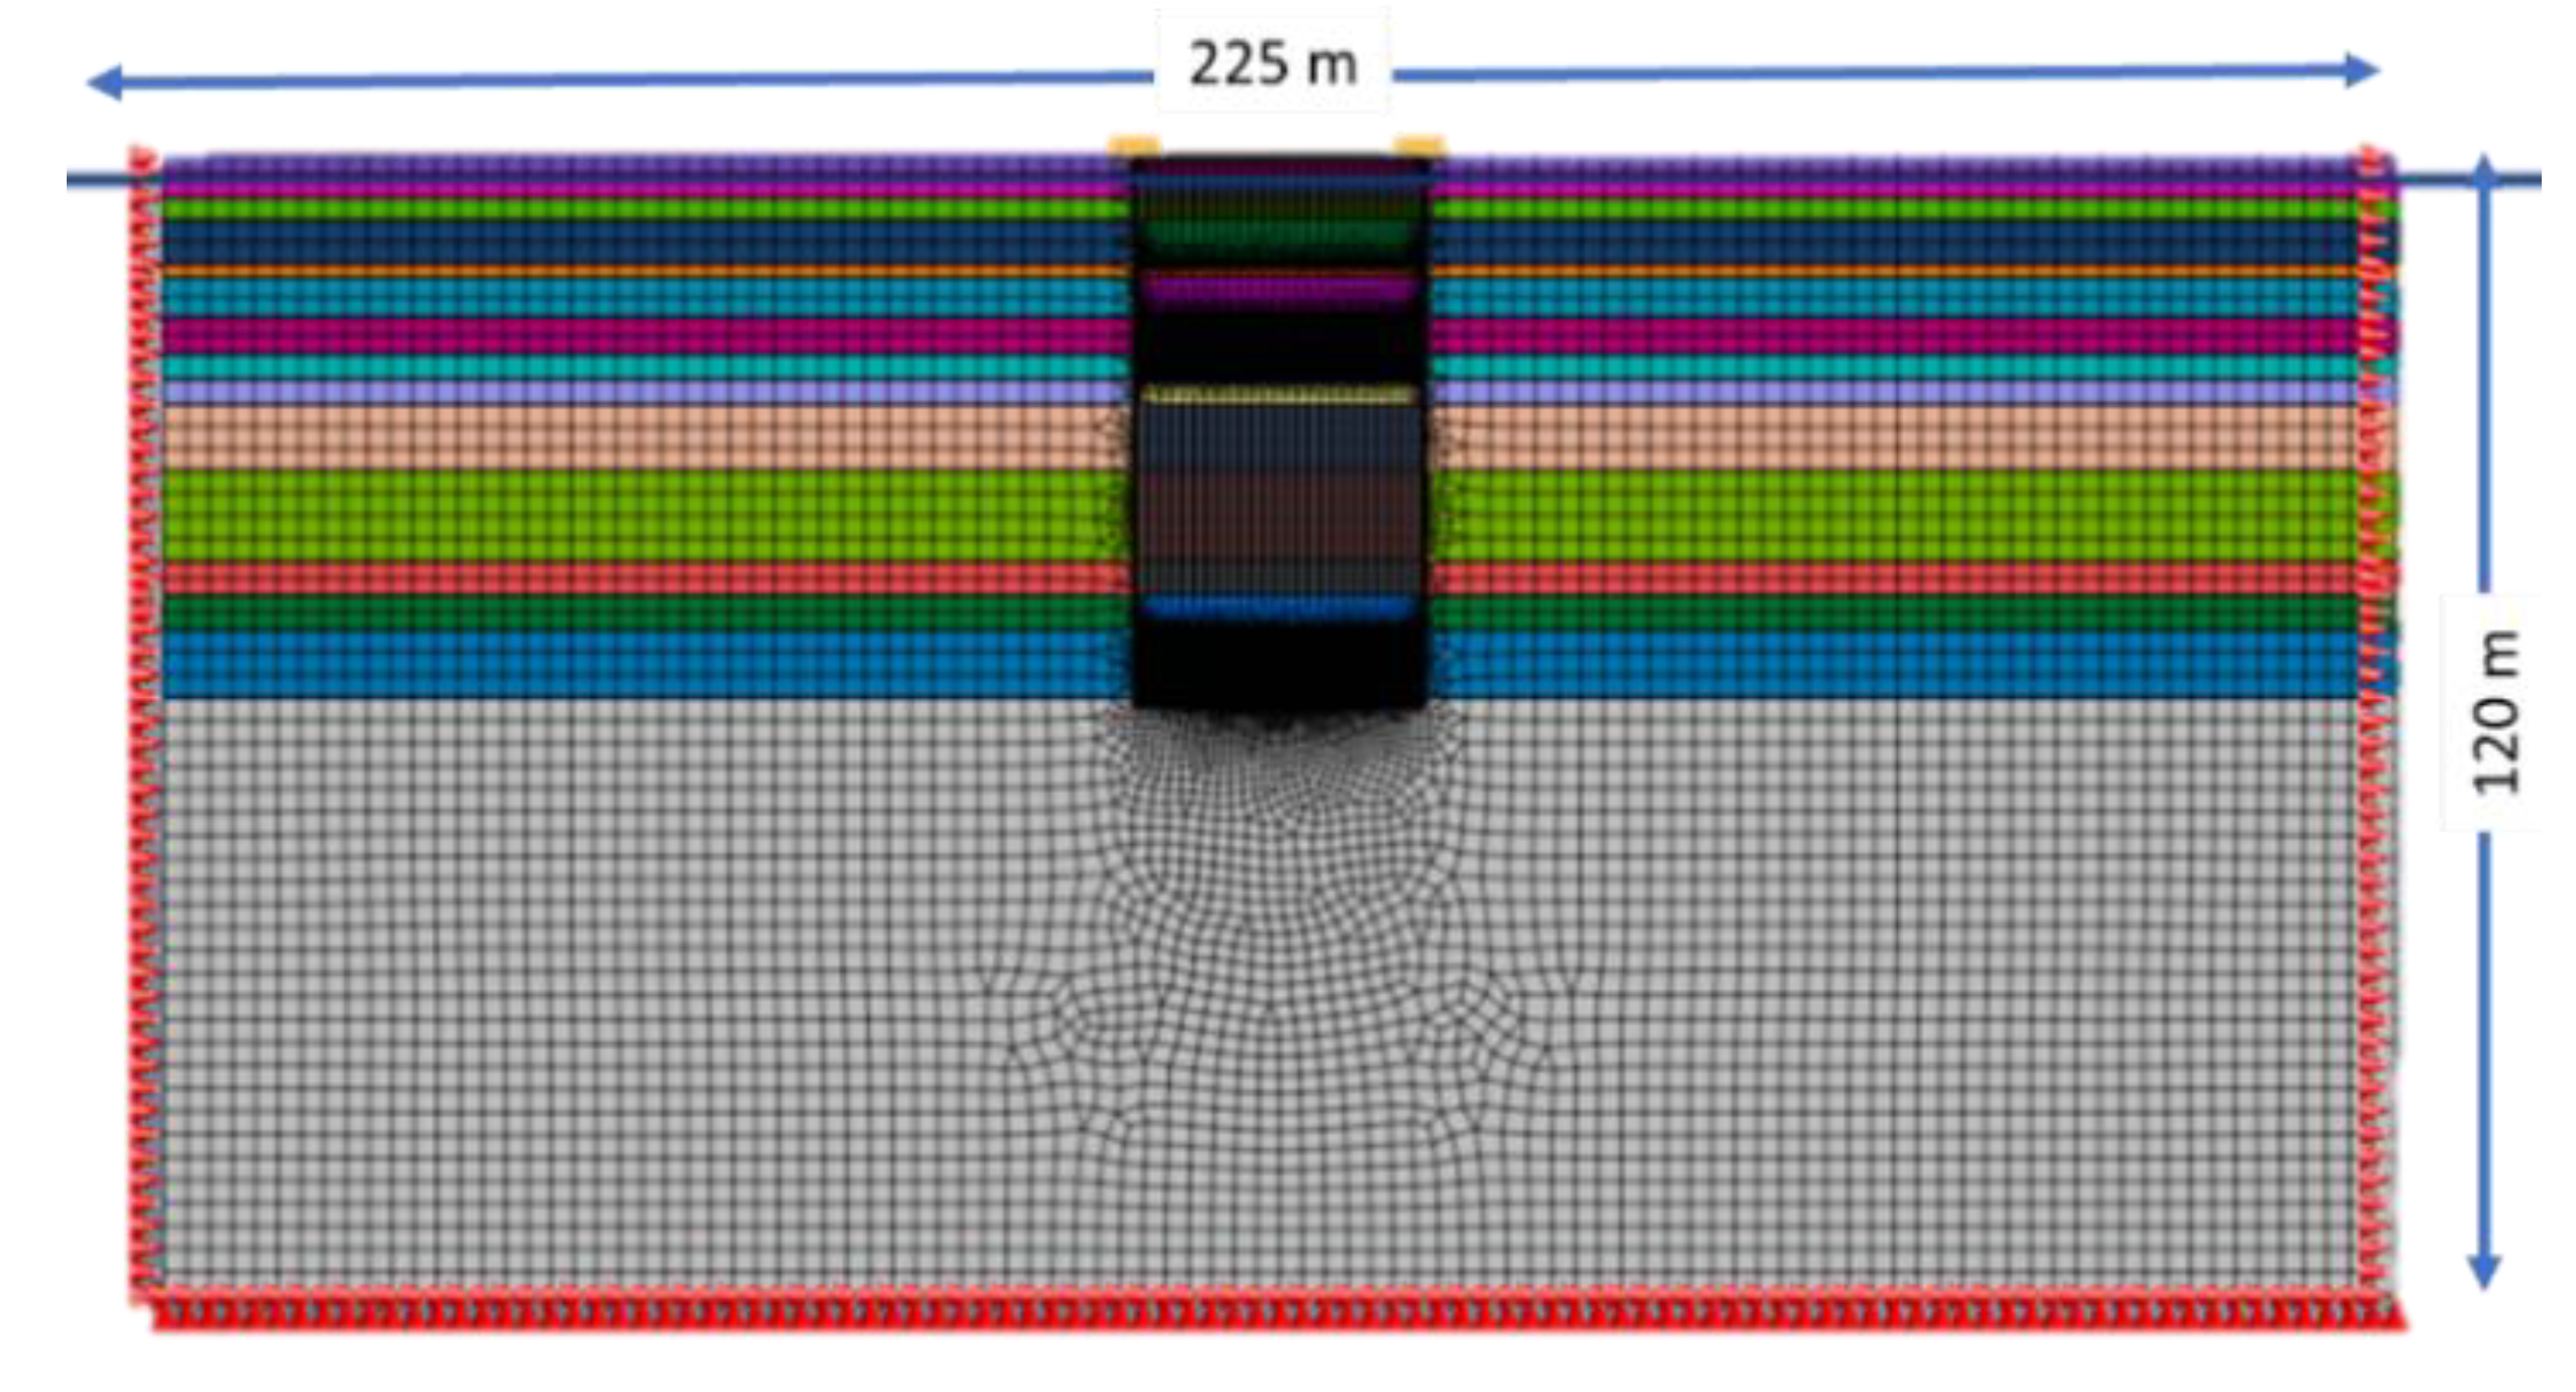
Quadratic high order 8-noded two-dimensional mesh elements were used to simulate the soil layers in the two-dimensional finite element model. Also, one-dimensional structural embedded beam elements were utilized to simulate the diaphragm walls and the two rows of temporary struts. Three different mesh sizes were used to investigate the sensitivity of the soil mesh refinement and their effect on the deformation results. Excellent enhancement was observed in the results when fine mesh (1.0 m) was adopted in the analysis. However, the analysis time and the computational usage were significantly increased.
A sensitivity analysis study was carried out and based on the obtained results, dimensions of the geometry were adopted as 225 m width and 120 m depth, as indicated in Figure 7. The distance between the boundaries and the walls is about 99.50 m, which represents about three times the excavation depth (3H). Based on the results of the sensitivity analysis the adopted positions of the model boundaries do not affect the obtained results of stresses and displacements around the support system. Besides, the outer boundaries of the model are supported to avoid instability (singularity) of the finite element model. These outer edges are considered as fixed in the horizontal direction, and free to move in the vertical direction. The bottom boundary is deemed to be fixed in both horizontal and vertical directions, and the top boundary was taken as free.

3.3. Three Dimensional Numerical Modeling

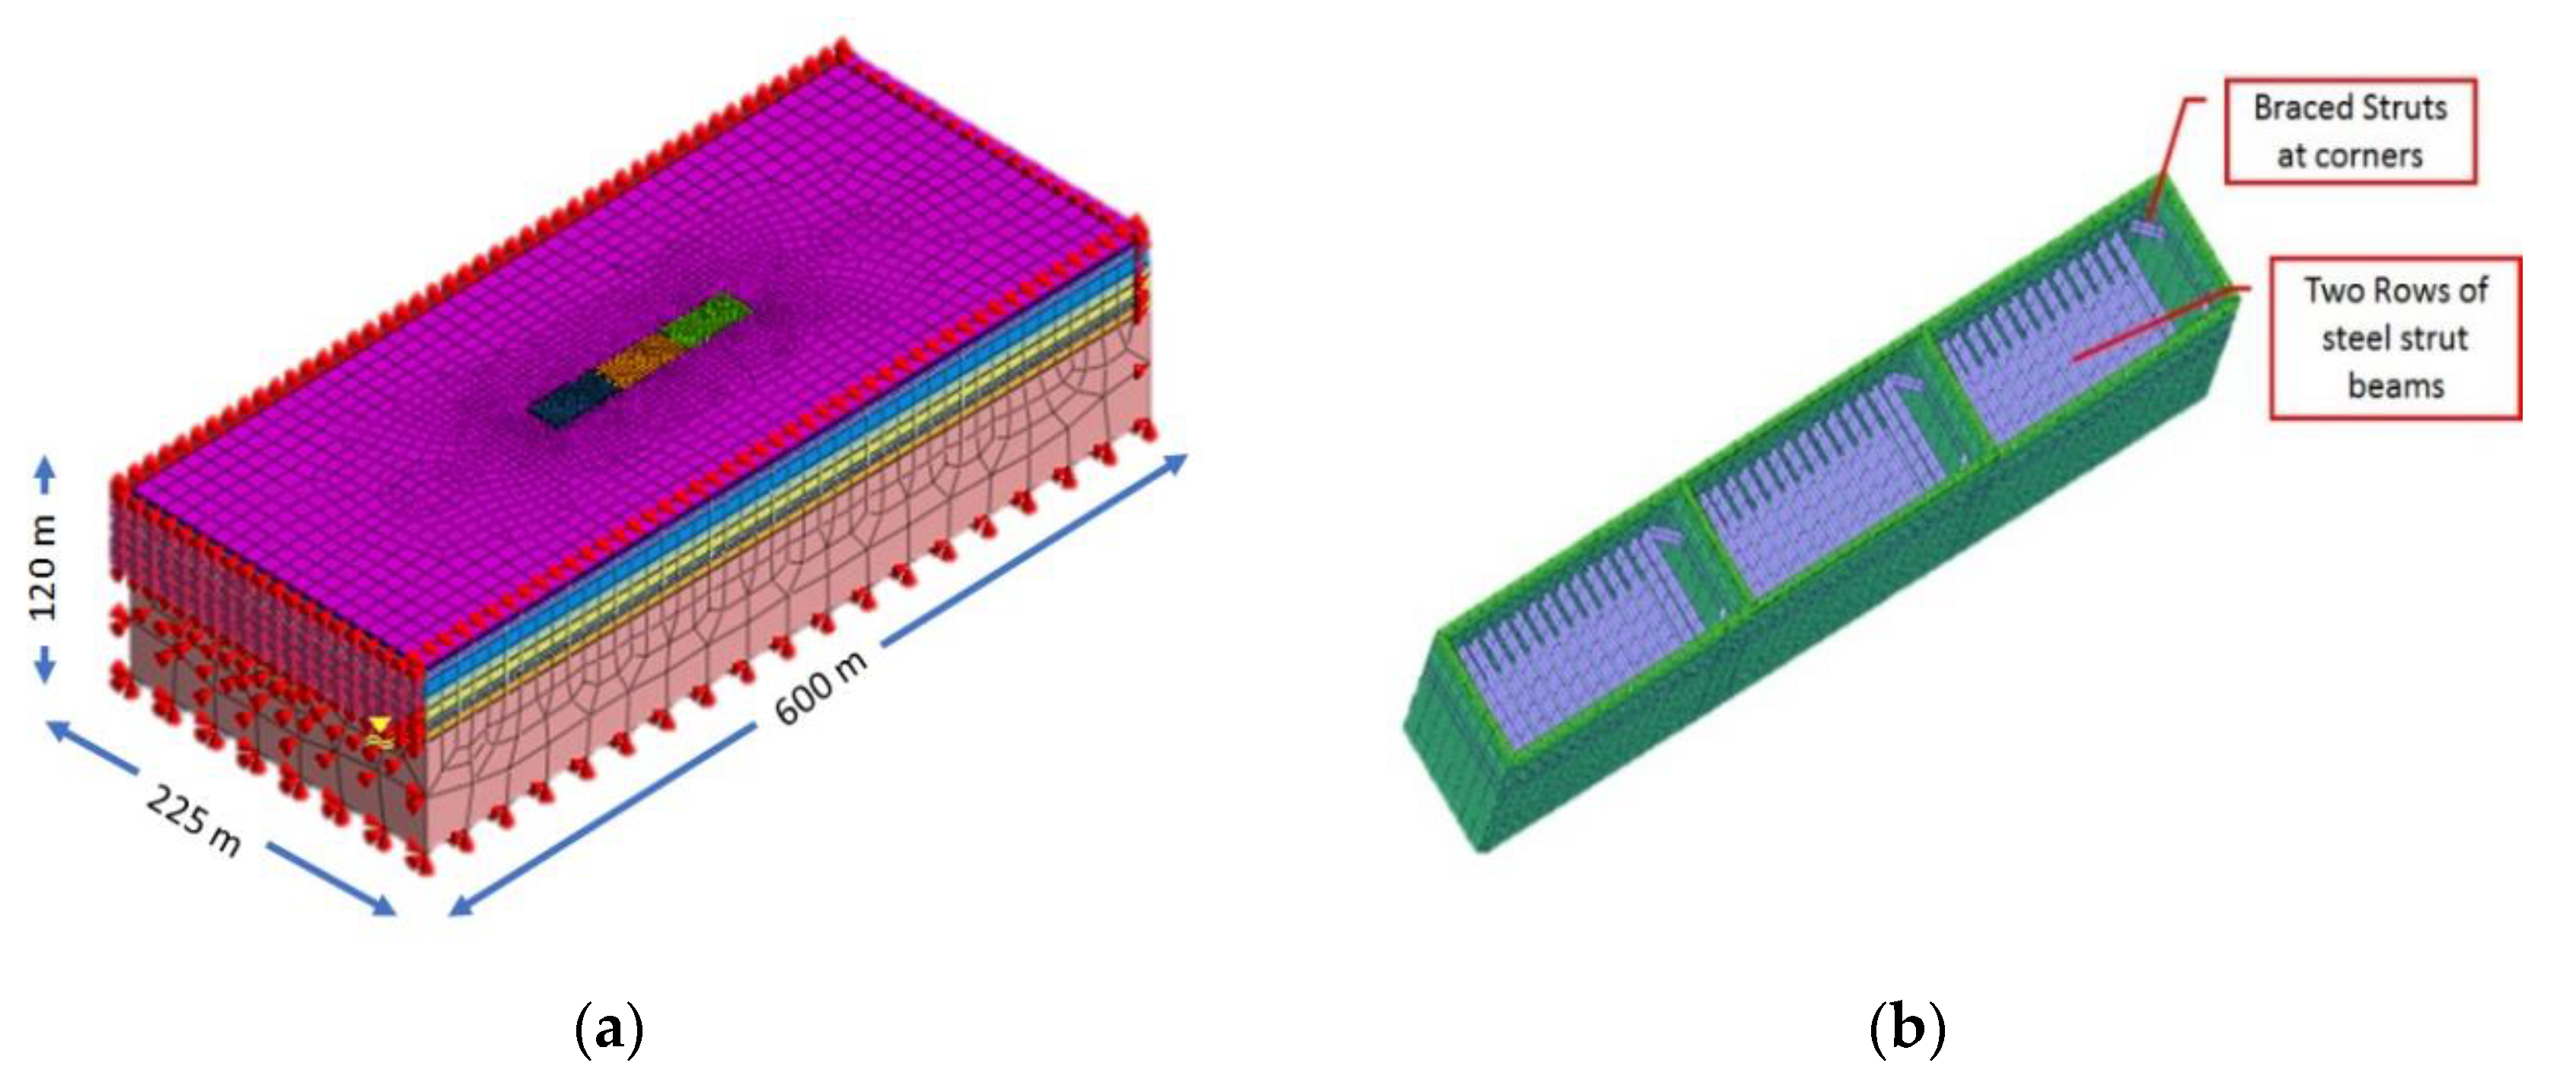
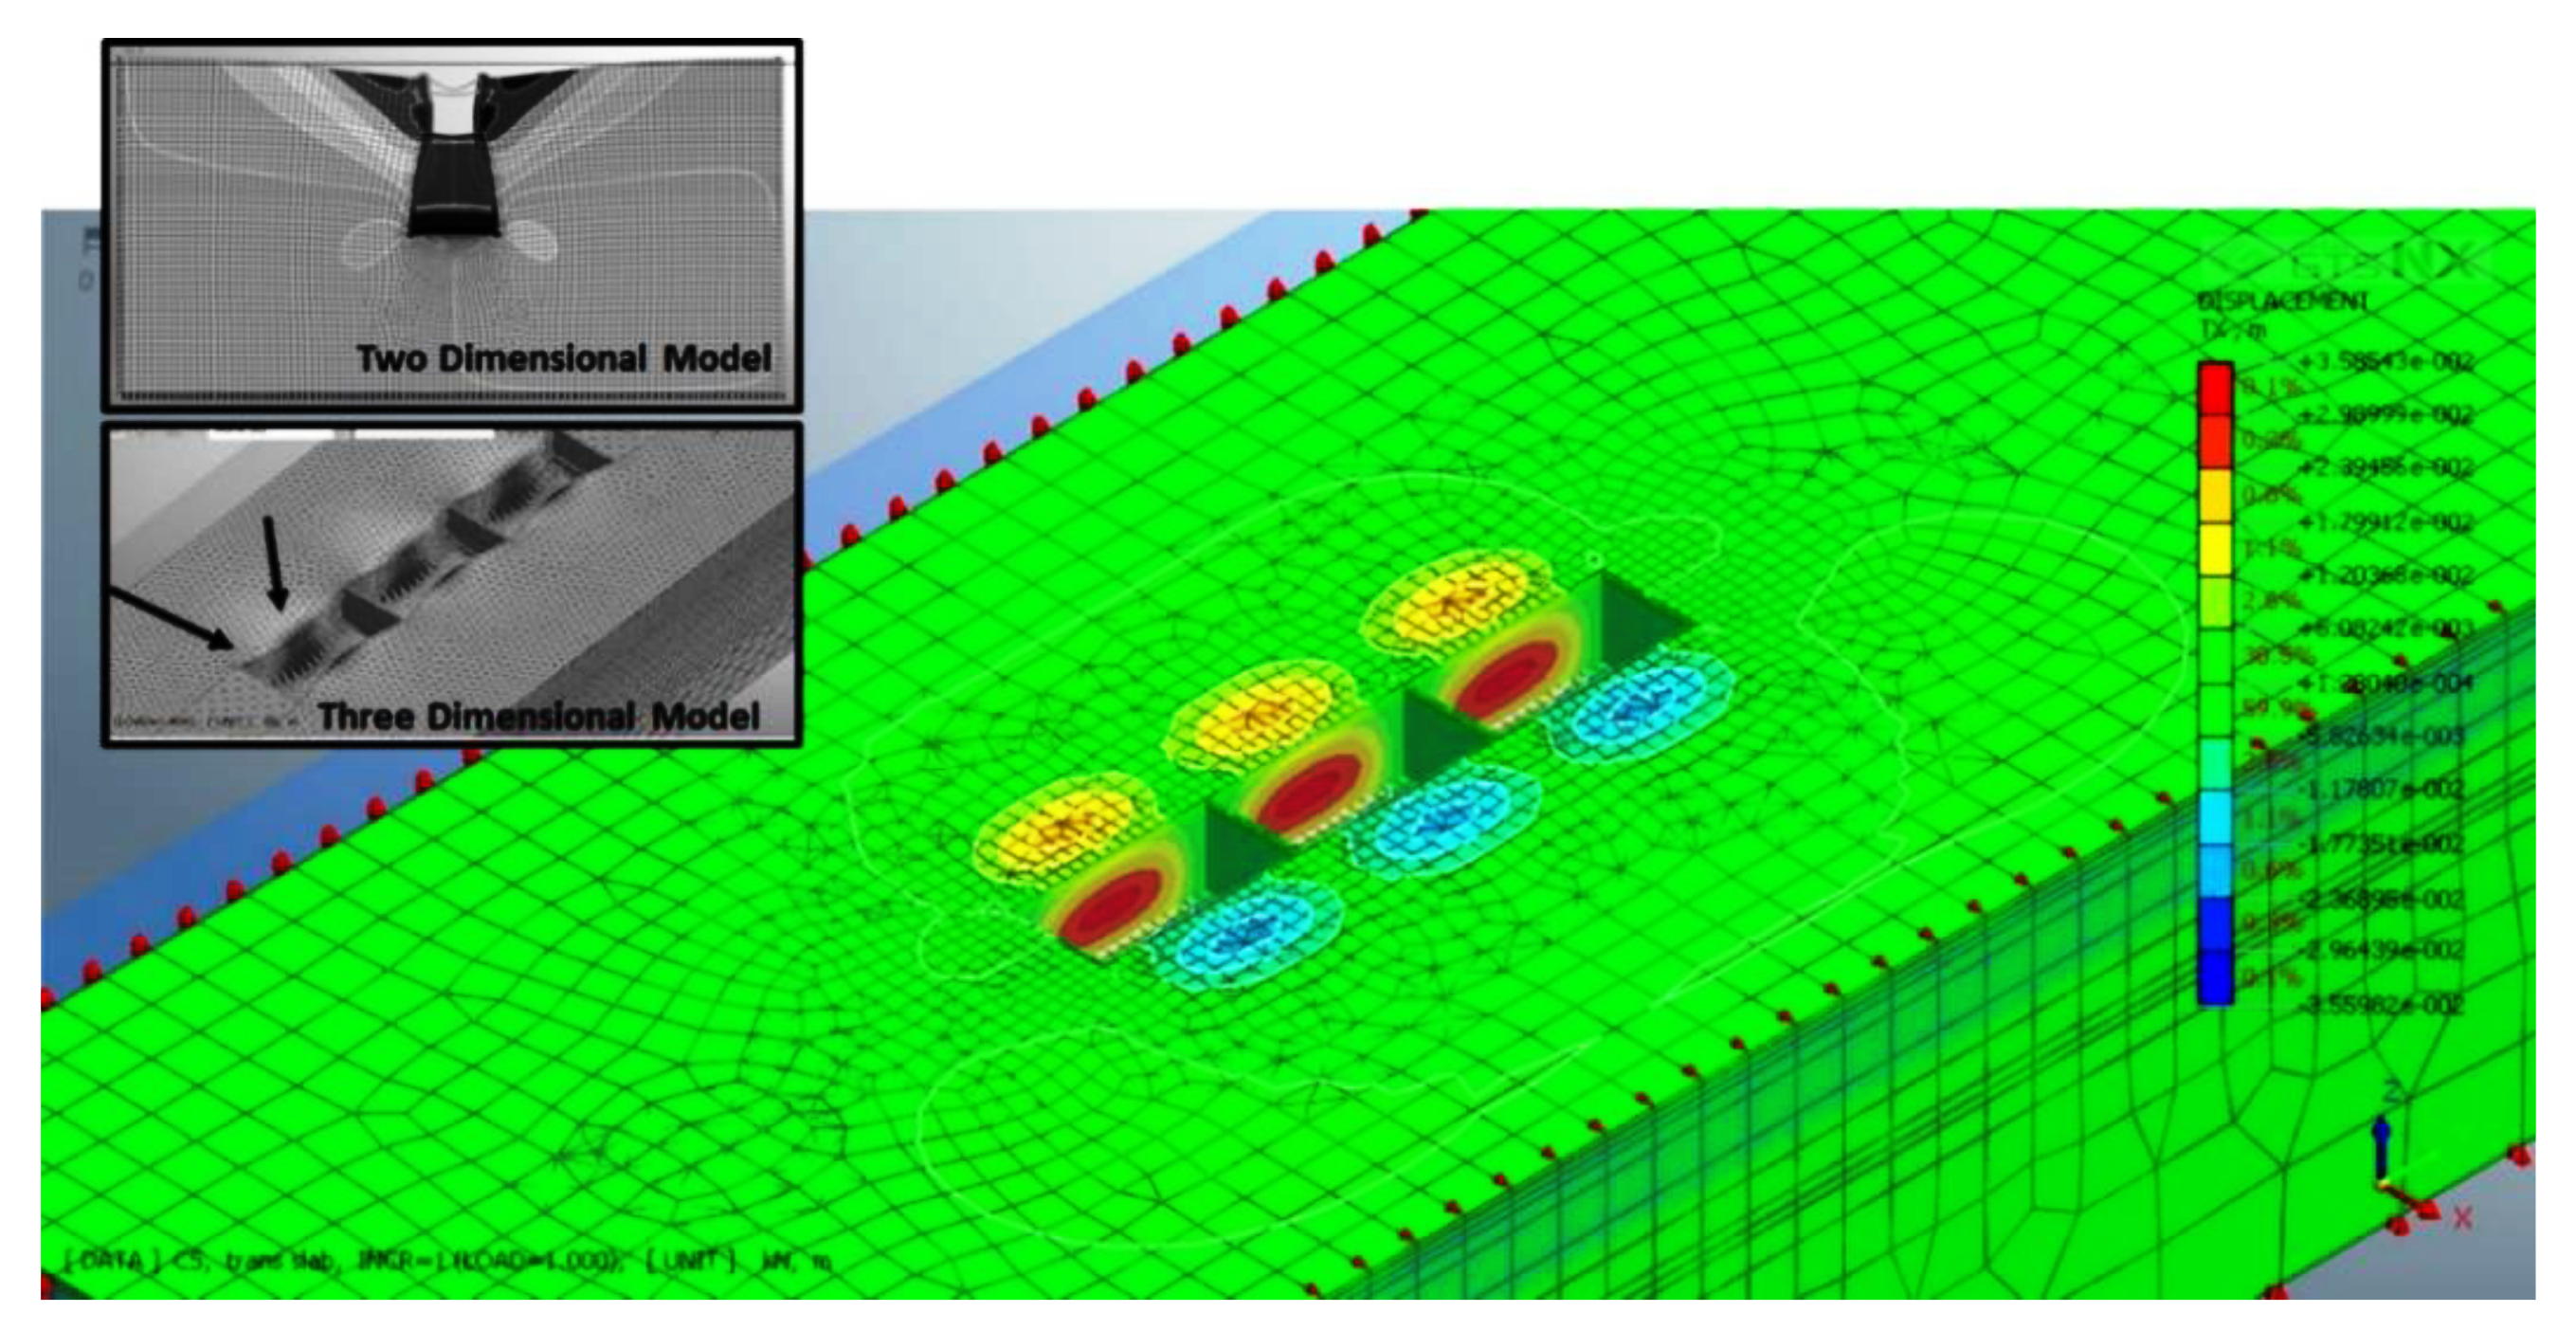
Hexahedral high order 20-noded mesh elements were used to represent the soil layers in the three-dimensional finite element model. The density of the mesh within the excavation had a major effect on the accuracy of analysis and, the mesh density outside the excavation apparently had less significant impact on the accuracy of analysis [28]. Based on the sensitivity performed using the two-dimensional model, fine mesh (1.0 m) was also adopted in the three-dimensional model. However, the time of the analysis and computational usage were significantly increased. So that as a compromise solution, a zone of fine mesh with a size of 1.0 m was adopted inside, around and below the excavation zone and gradually increased to be 3.0 m after a horizontal distance of 35 m (H) and to be 12 m at the locations of the external boundaries. This solution significantly reduced the number of degrees of freedom which makes three-dimensional analysis economically feasible. Besides, as shown in Figure 8a, a few triangular mesh elements were automatically generated to adjust for the aspect ratio of the model geometry in the transition zone.
Sensitivity analyses were performed to assess the estimated geometry dimensions on the analysis results. Based on the obtained results of those attempts, dimensions of the geometry were adopted as 600 m length, 225 m width, and 120 m depth, as indicated in Figure 8a. The outer boundaries in both X, and Y directions of the model were supported to avoid instability (singularity) of the finite element model. These outer edges are considered fixed in the lateral direction, and free to move in the vertical direction (Z-Direction). The bottom boundary is deemed to be fixed and the top boundary is taken as free. On the other hand, one-dimensional structural beam elements were utilized to simulate the two rows of temporary struts (Figure 8b).
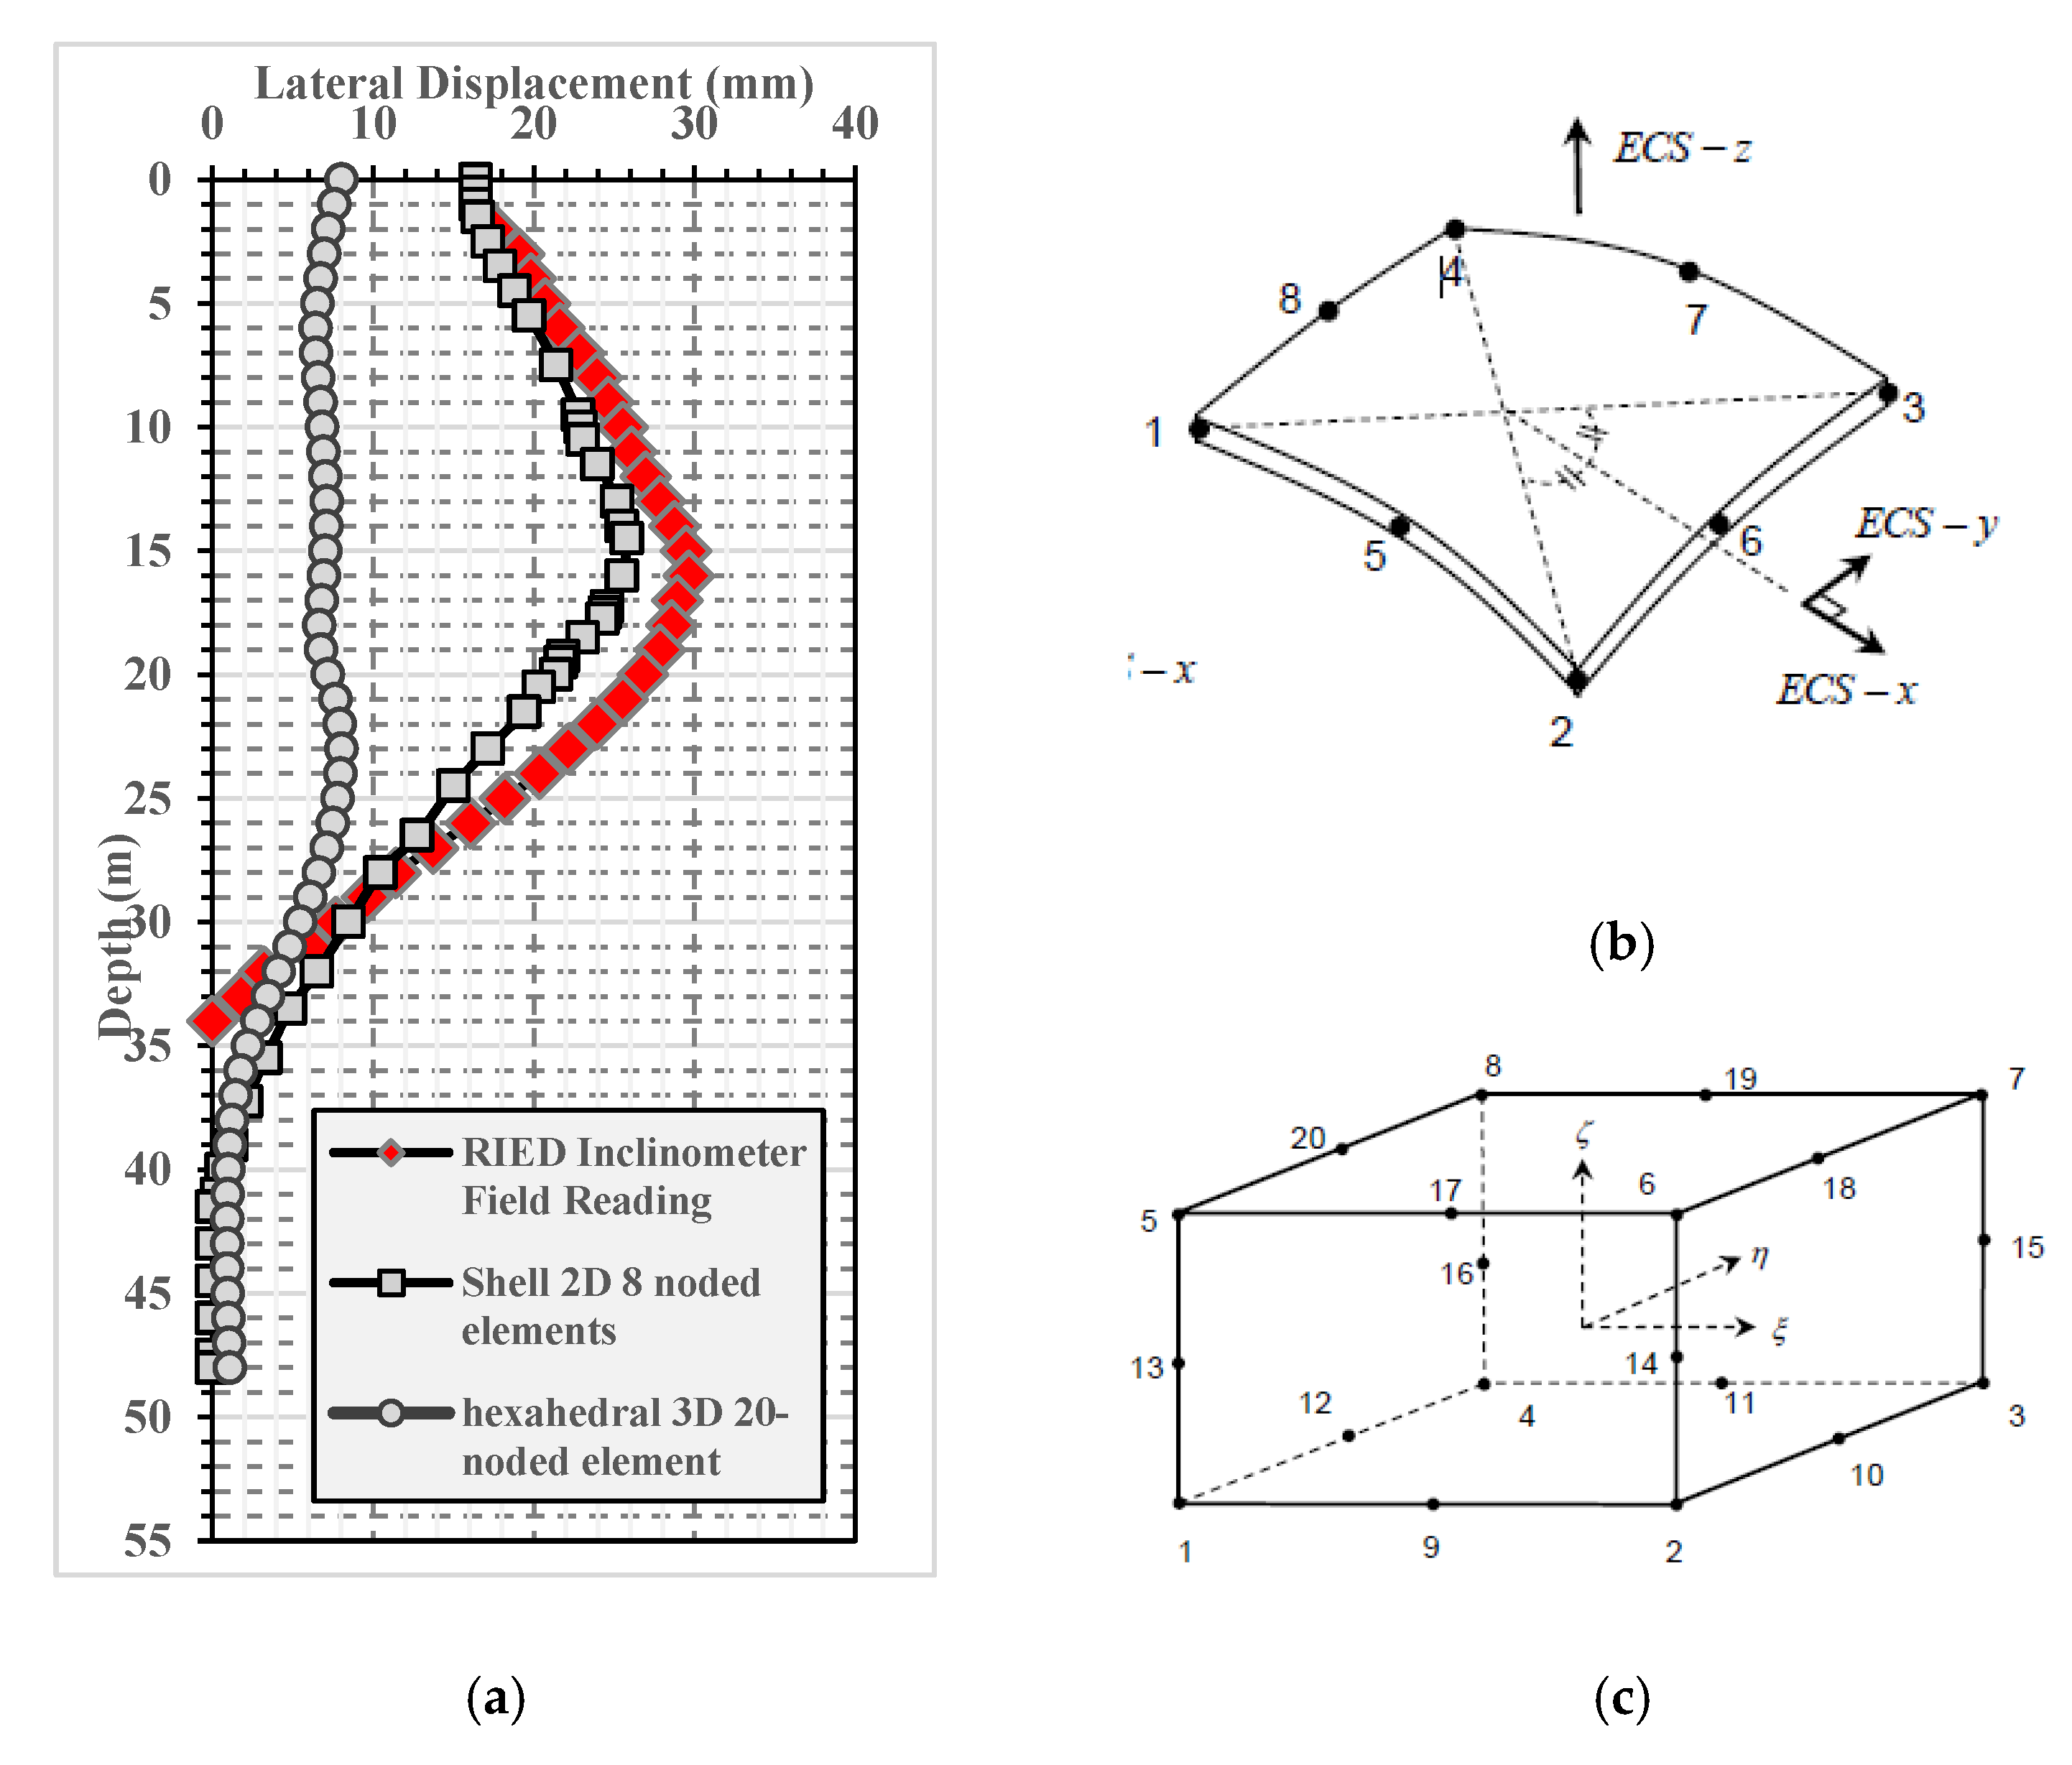
Diaphragm walls can be represented by shell (Plate) elements (Figure 9b) or volume elements (Figure 9c). Two numerical analyses attempts were performed to identify the most efficient element type that can accurately represent the behavior of diaphragm walls with respect to the analysis time and economic feasibility of the computational analysis method. Two dimensional 8-noded shell elements and hexahedral 20-noded three-dimensional elements were utilized in this evaluation. The same soil properties and mesh size were used in the two analysis attempts. Figure 9 compares the obtained results of the diaphragm wall lateral displacement using the two analyses attempts.
It can be seen from Figure 9a that the obtained wall lateral deformation using two-dimensional quadratic shell mesh elements is greater than those obtained using 3D hexahedral elements. Also, as shown the obtained results using 2D shell elements are much closer to the field measurements (RIED). In contrast, the obtained results using the 3D hexahedral elements show a more stiff behavior. The obtained lateral deformation results are less than those found using the 2D shell elements. This is attributed to the efficiency of shell elements in considering both the bending and shear deformations in the analysis. This difference of wall lateral deformation between modeling using shell elements and volume elements agrees well with previous studies such as [38,39].

3.4. Analysis Stages

The same soil, and structural element properties presented in Table 1 and Table 2 respectively were utilized in both two- and three-dimensional models. For both 2D and 3D models analysis was performed in ten stages. The first stage represents the initial stresses of the soil before the support system implementation. The second stage starts with changing the diaphragm walls’ volume to concrete material as a replacement for soil material. At this stage, rigid interface elements were used to connect the wall and soil mesh elements to avoid any numerical instability (singularity) [37,40], and the wall’s self-weight is also considered at this stage. The calculated deformations of the first and second stages of analysis were discarded in order to start to account for wall deformation due to the excavation process only. Interface elements were activated in the third stage of analysis, and the rigid interface elements were deactivated. Similar to the field case study, the remaining analysis stages were considered with the same sequence presented in Section 2.2 (Figure 5).

4. Results and Discussion

Figure 10 shows the deformed shape in the horizontal direction (X-Direction) for both the 2D and 3D numerical models. As shown, the maximum lateral deformation result is obtained at almost the middle of the diaphragm height in both the 2D and 3D numerical models. However, the 3D model results showed that the lateral displacement of walls varies along the primary wall length. This is because horizontal displacement is relatively small (near about zero value) at the location of both the wall corners and the cross walls, and increases to achieve its maximum value at the mid-length of the three excavation panels (spans between the cross walls). These results can be explained as lateral wall deformation significantly decreases at the higher wall stiffness zones such as locations of wall corners and cross walls. These results are also consistent with the findings of [29]; and [20], although their studies only focused on the 3D corner effect without considering the impact of the cross walls. However, the shown numerical results below pinpoint to the significant effect of the stiffness of the cross walls on the wall lateral deformation.
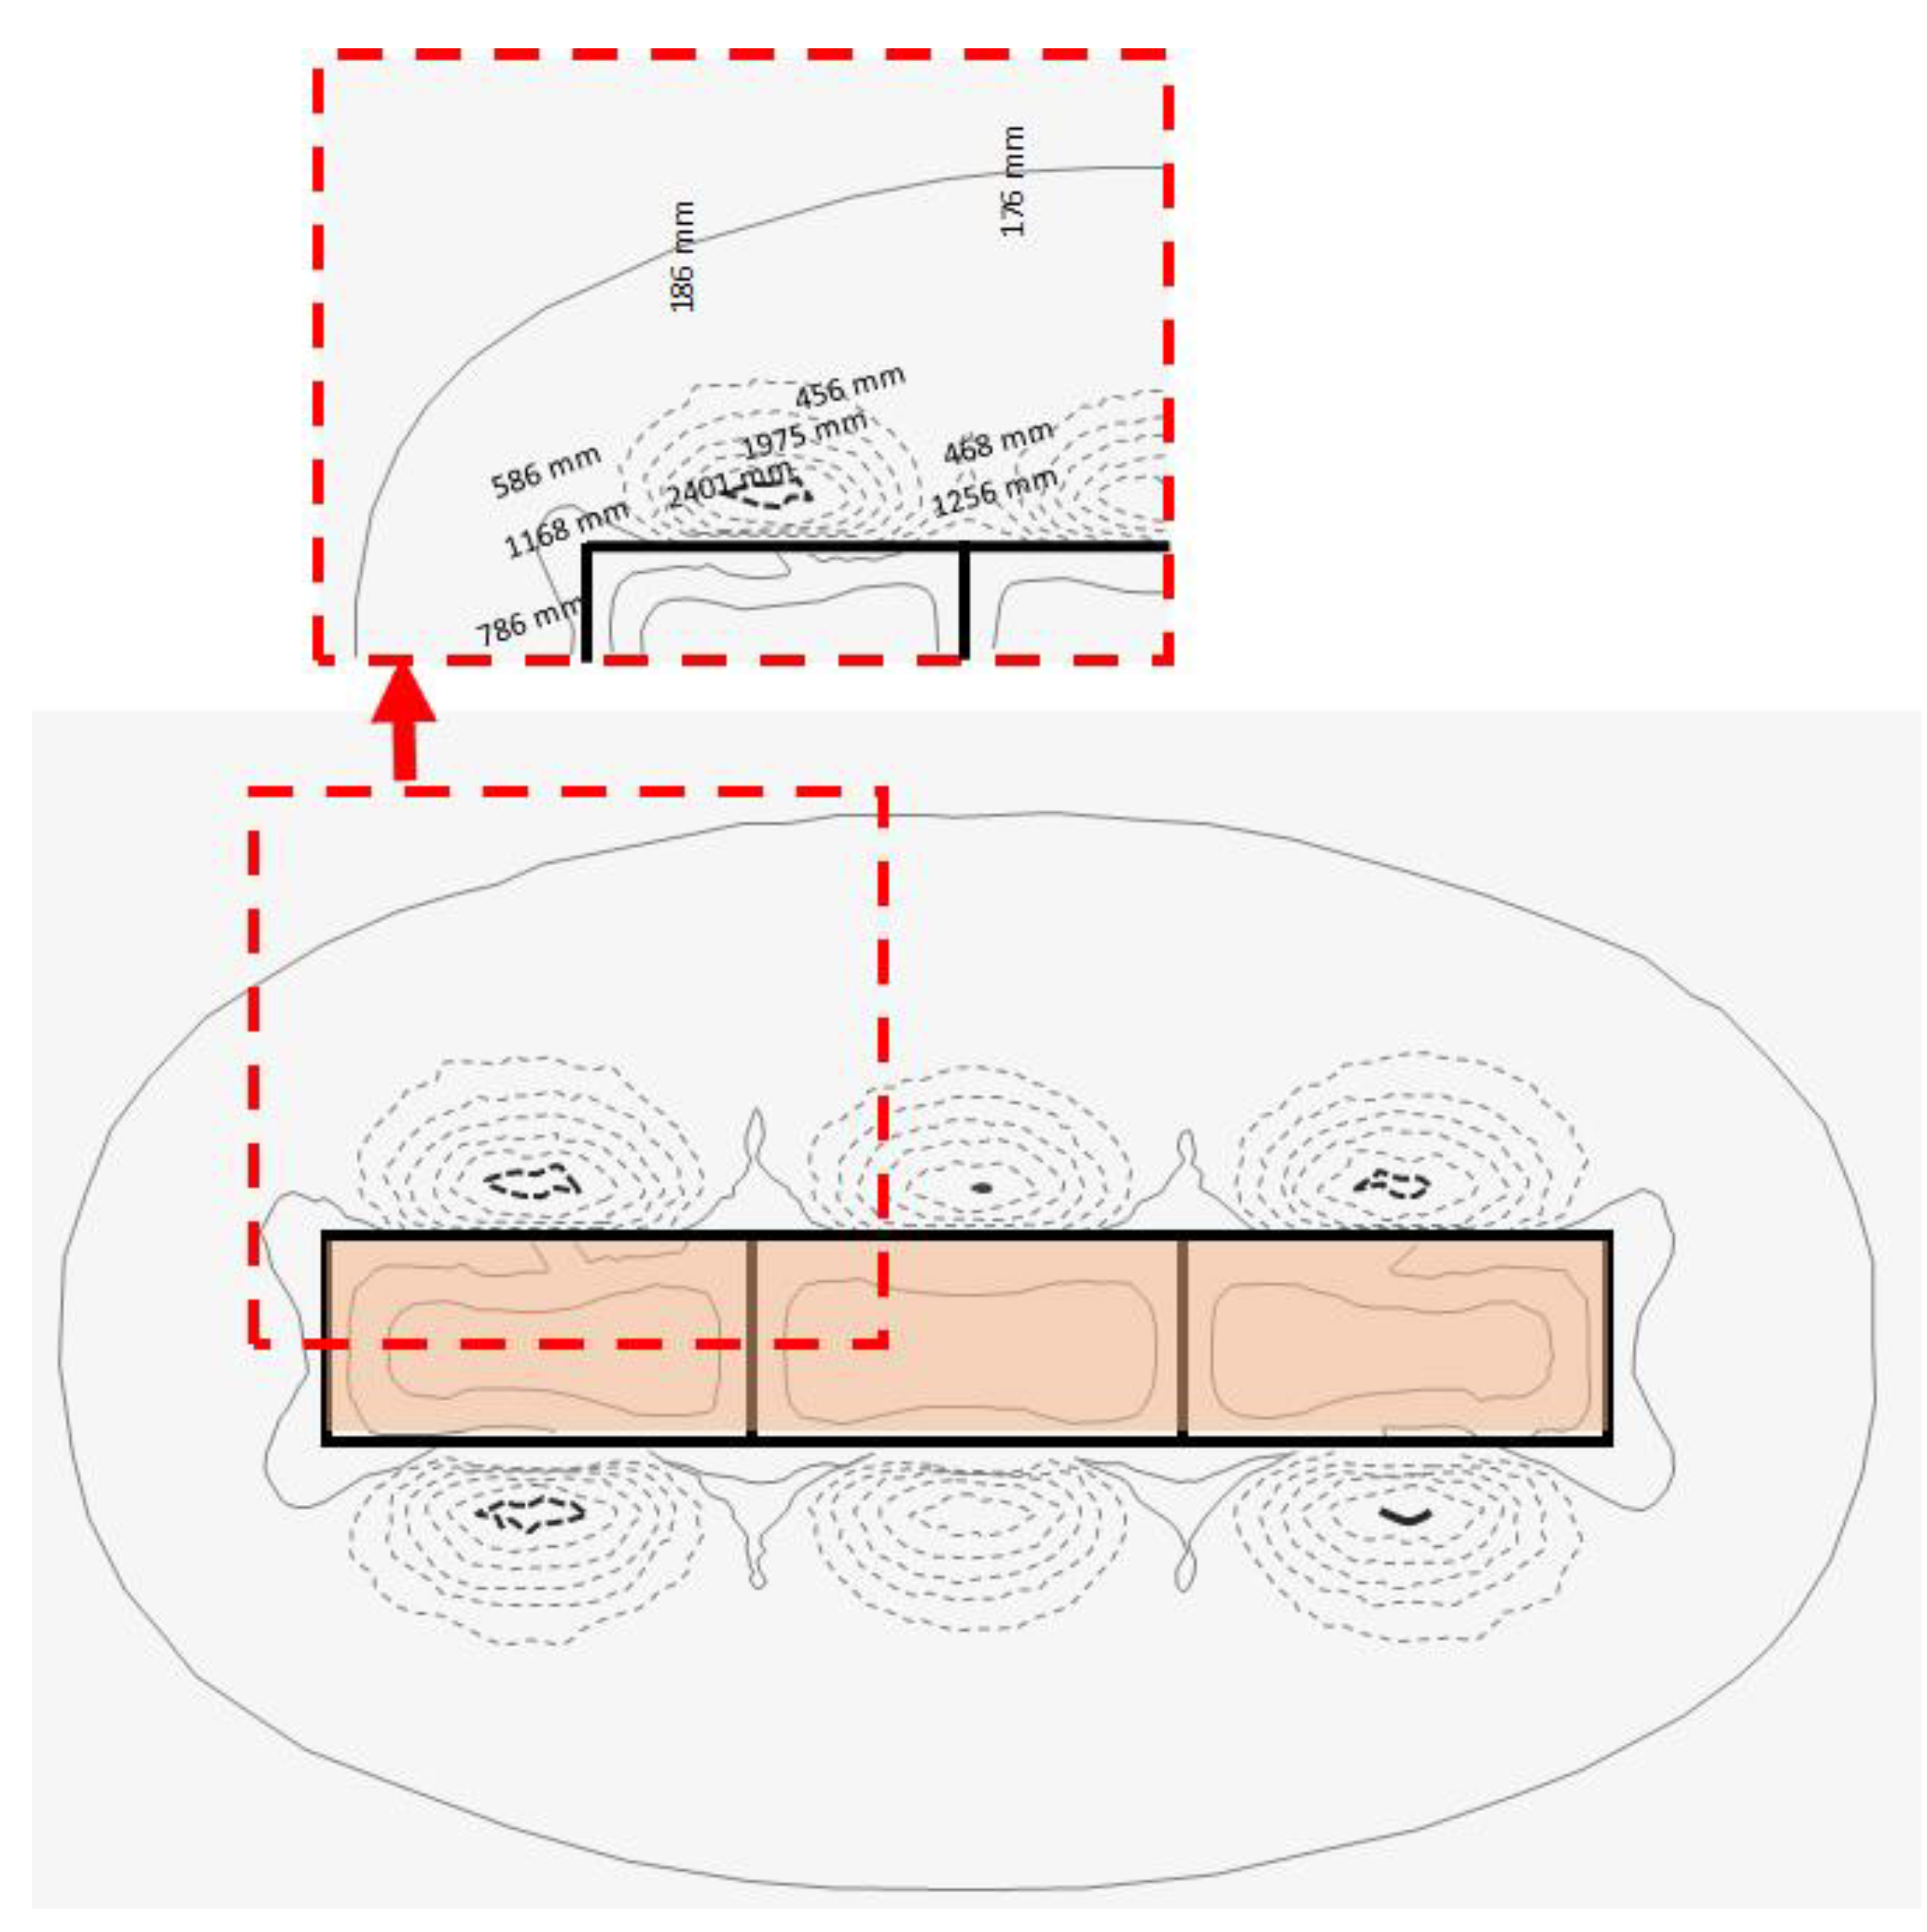
Figure 11 presents the results of the vertical soil settlement distribution around the excavation zone using contour lines obtained from the three-dimensional numerical model. As shown in this figure, the higher stiffness at the corners and cross wall locations, also affected the vertical soil settlement results as soil settlement is decreased at the positions of both wall corners and the cross walls.
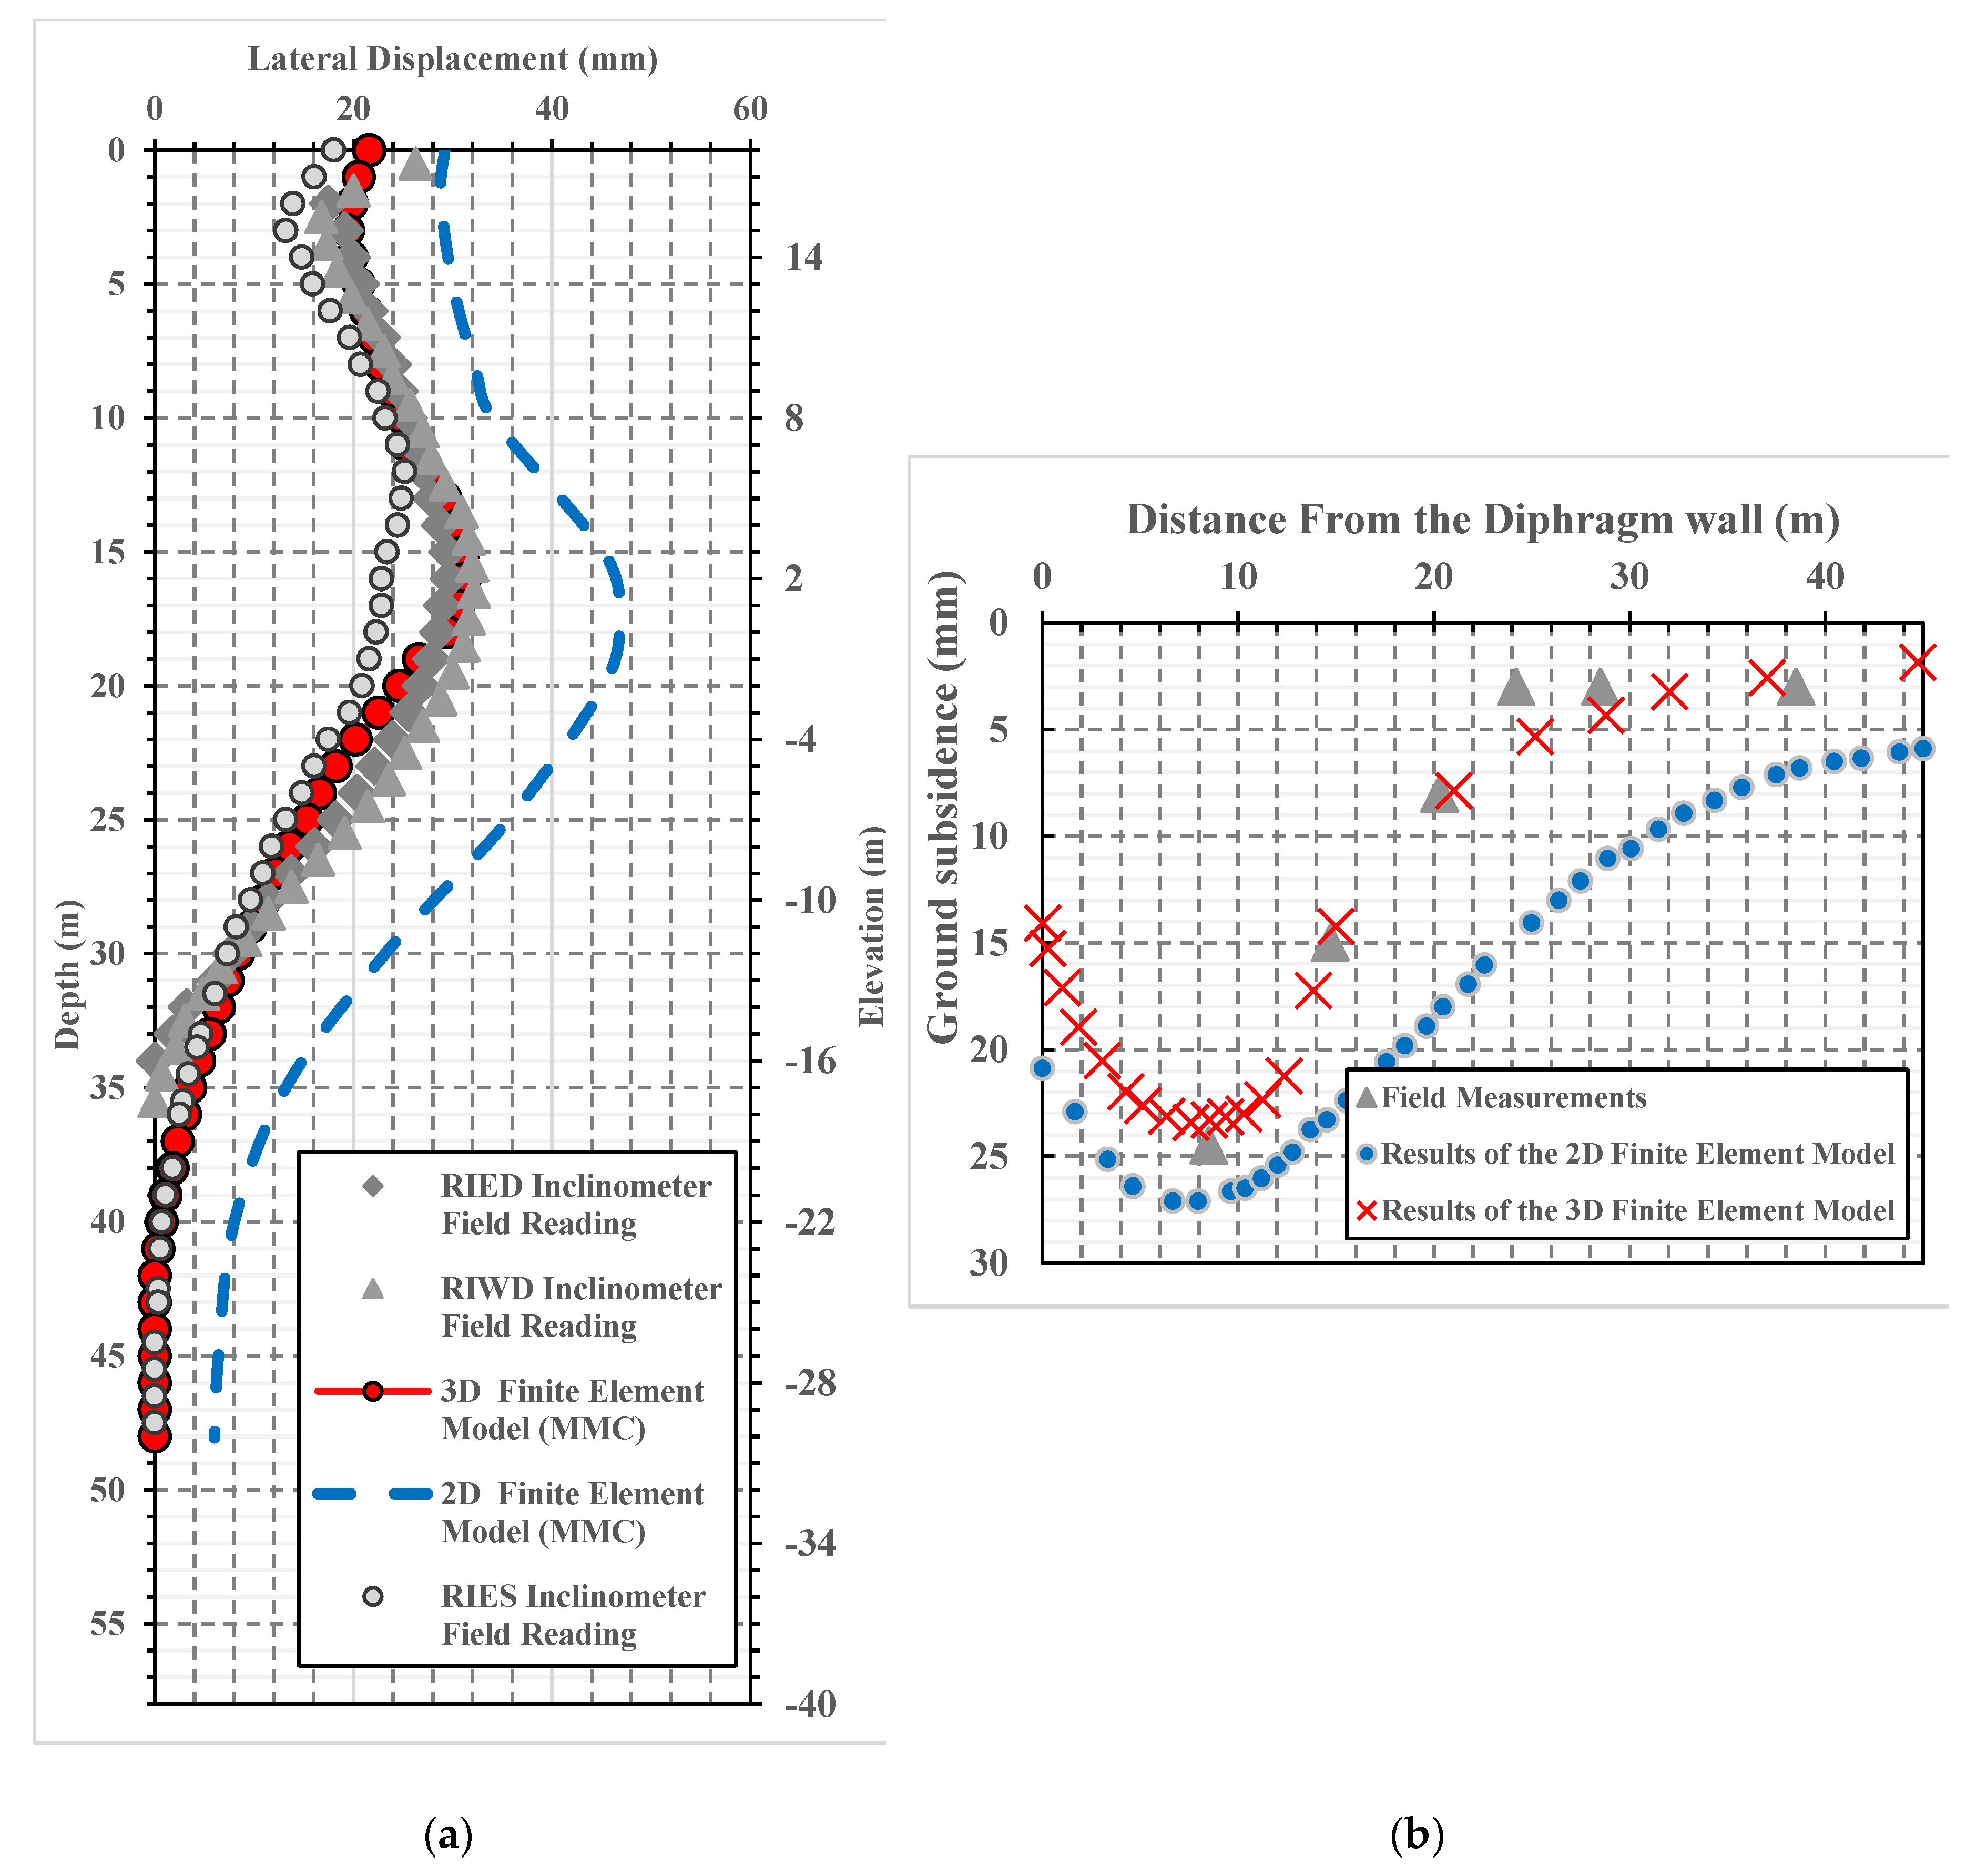
Numerical results of both lateral wall displacement and vertical soil settlement were obtained using the two and three-dimensional models. The obtained results are compared with field measurements in Figure 12a,b to assess the capability of both finite element models in accurately predicting the response of the deep excavation supported system.
It can be seen from Figure 12a, that an excellent agreement is obtained between the wall lateral deformation measured in the field and that calculated using the 3D finite element model. Although the same soil, wall, interface properties are adopted in both the 2D, 3D finite element models, the three-dimensional finite element model seems to be superior to the two-dimensional plane strain model in predicting the lateral wall deformation: The max wall lateral displacement is obtained as 47 mm using the 2D numerical model, which is higher than the in-situ measurements with a difference of about 54%. In contrast, the three-dimensional analysis provides a more realistic prediction of the maximum lateral wall displacements.
Figure 12b compares the measured ground surface settlements compiled at the end of the construction of the Rod El Farag subway, with the results determined using both 2D and 3D analyses. The in-situ measured ground settlement ranged from 4 to 25 mm (west-side). As shown in Figure 12b, good agreement is also obtained between the three-dimensional finite element model results of vertical soil settlement and the field measured values. In contrast, large differences ranging from 5% to 49% are observed between the 2D model obtained soil settlement results and the field measurement.
The significant difference between the results of the two-dimensional model and the field measurements is mainly attributed to the small distance between the corners and mid-span points of each excavation panel (point of maximum lateral deformation), as explained before in [28] where it was concluded that, the wall deformation decreases with decreasing distance from the corner. In the Rod El Farag case despite the relatively high aspect ratio (6.25) of the plan dimensions of this large scale station, the existence of the interior cross walls significantly affected the lateral wall deformation. This is beacuse the location of the maximum lateral wall deformation point is shifted from the mid- span of the whole primary wall length (150.0 m/2.0 (If there are no cross walls)), to be at the mid-span points of every single panel (about 50.0 m/2) as shown previously in Figure 10. Also, in this case, intersections between primary walls and cross walls almost similarly act as the traditional wall corners, which explains the relatively large wall lateral deformation results obtained using the two-dimensional finite element model.
Fundamental to note is that the results of both 2D and 3D are consistent with the field measurements in terms of locations of both maximum lateral wall displacement and vertical soil settlement. Besides, as shown in Figure 12b after a horizontal distance of about 30 m (almost equals the excavation depth (H)), the effect of the excavation becomes insignificant, as indicated from the results of vertical soil settlement of both west and east directions.
On the other hand, in-situ field measurements of the Rod El Farag case study were utilized to assess the estimated deformation using two empirical approaches [11,14]. Figure 13 illustrates the allocation of the in-situ measurements on the Peck’s chart [11] of the estimated ground vertical settlement roughs. As shown, the in-situ measurements of the Rod El Farag case lie in zone (I) for excavations in the sand and hard clay layers. The comparison indicates that for this case, the Peck’s chart is overestimating the induced deformation resulting due to deep excavation.
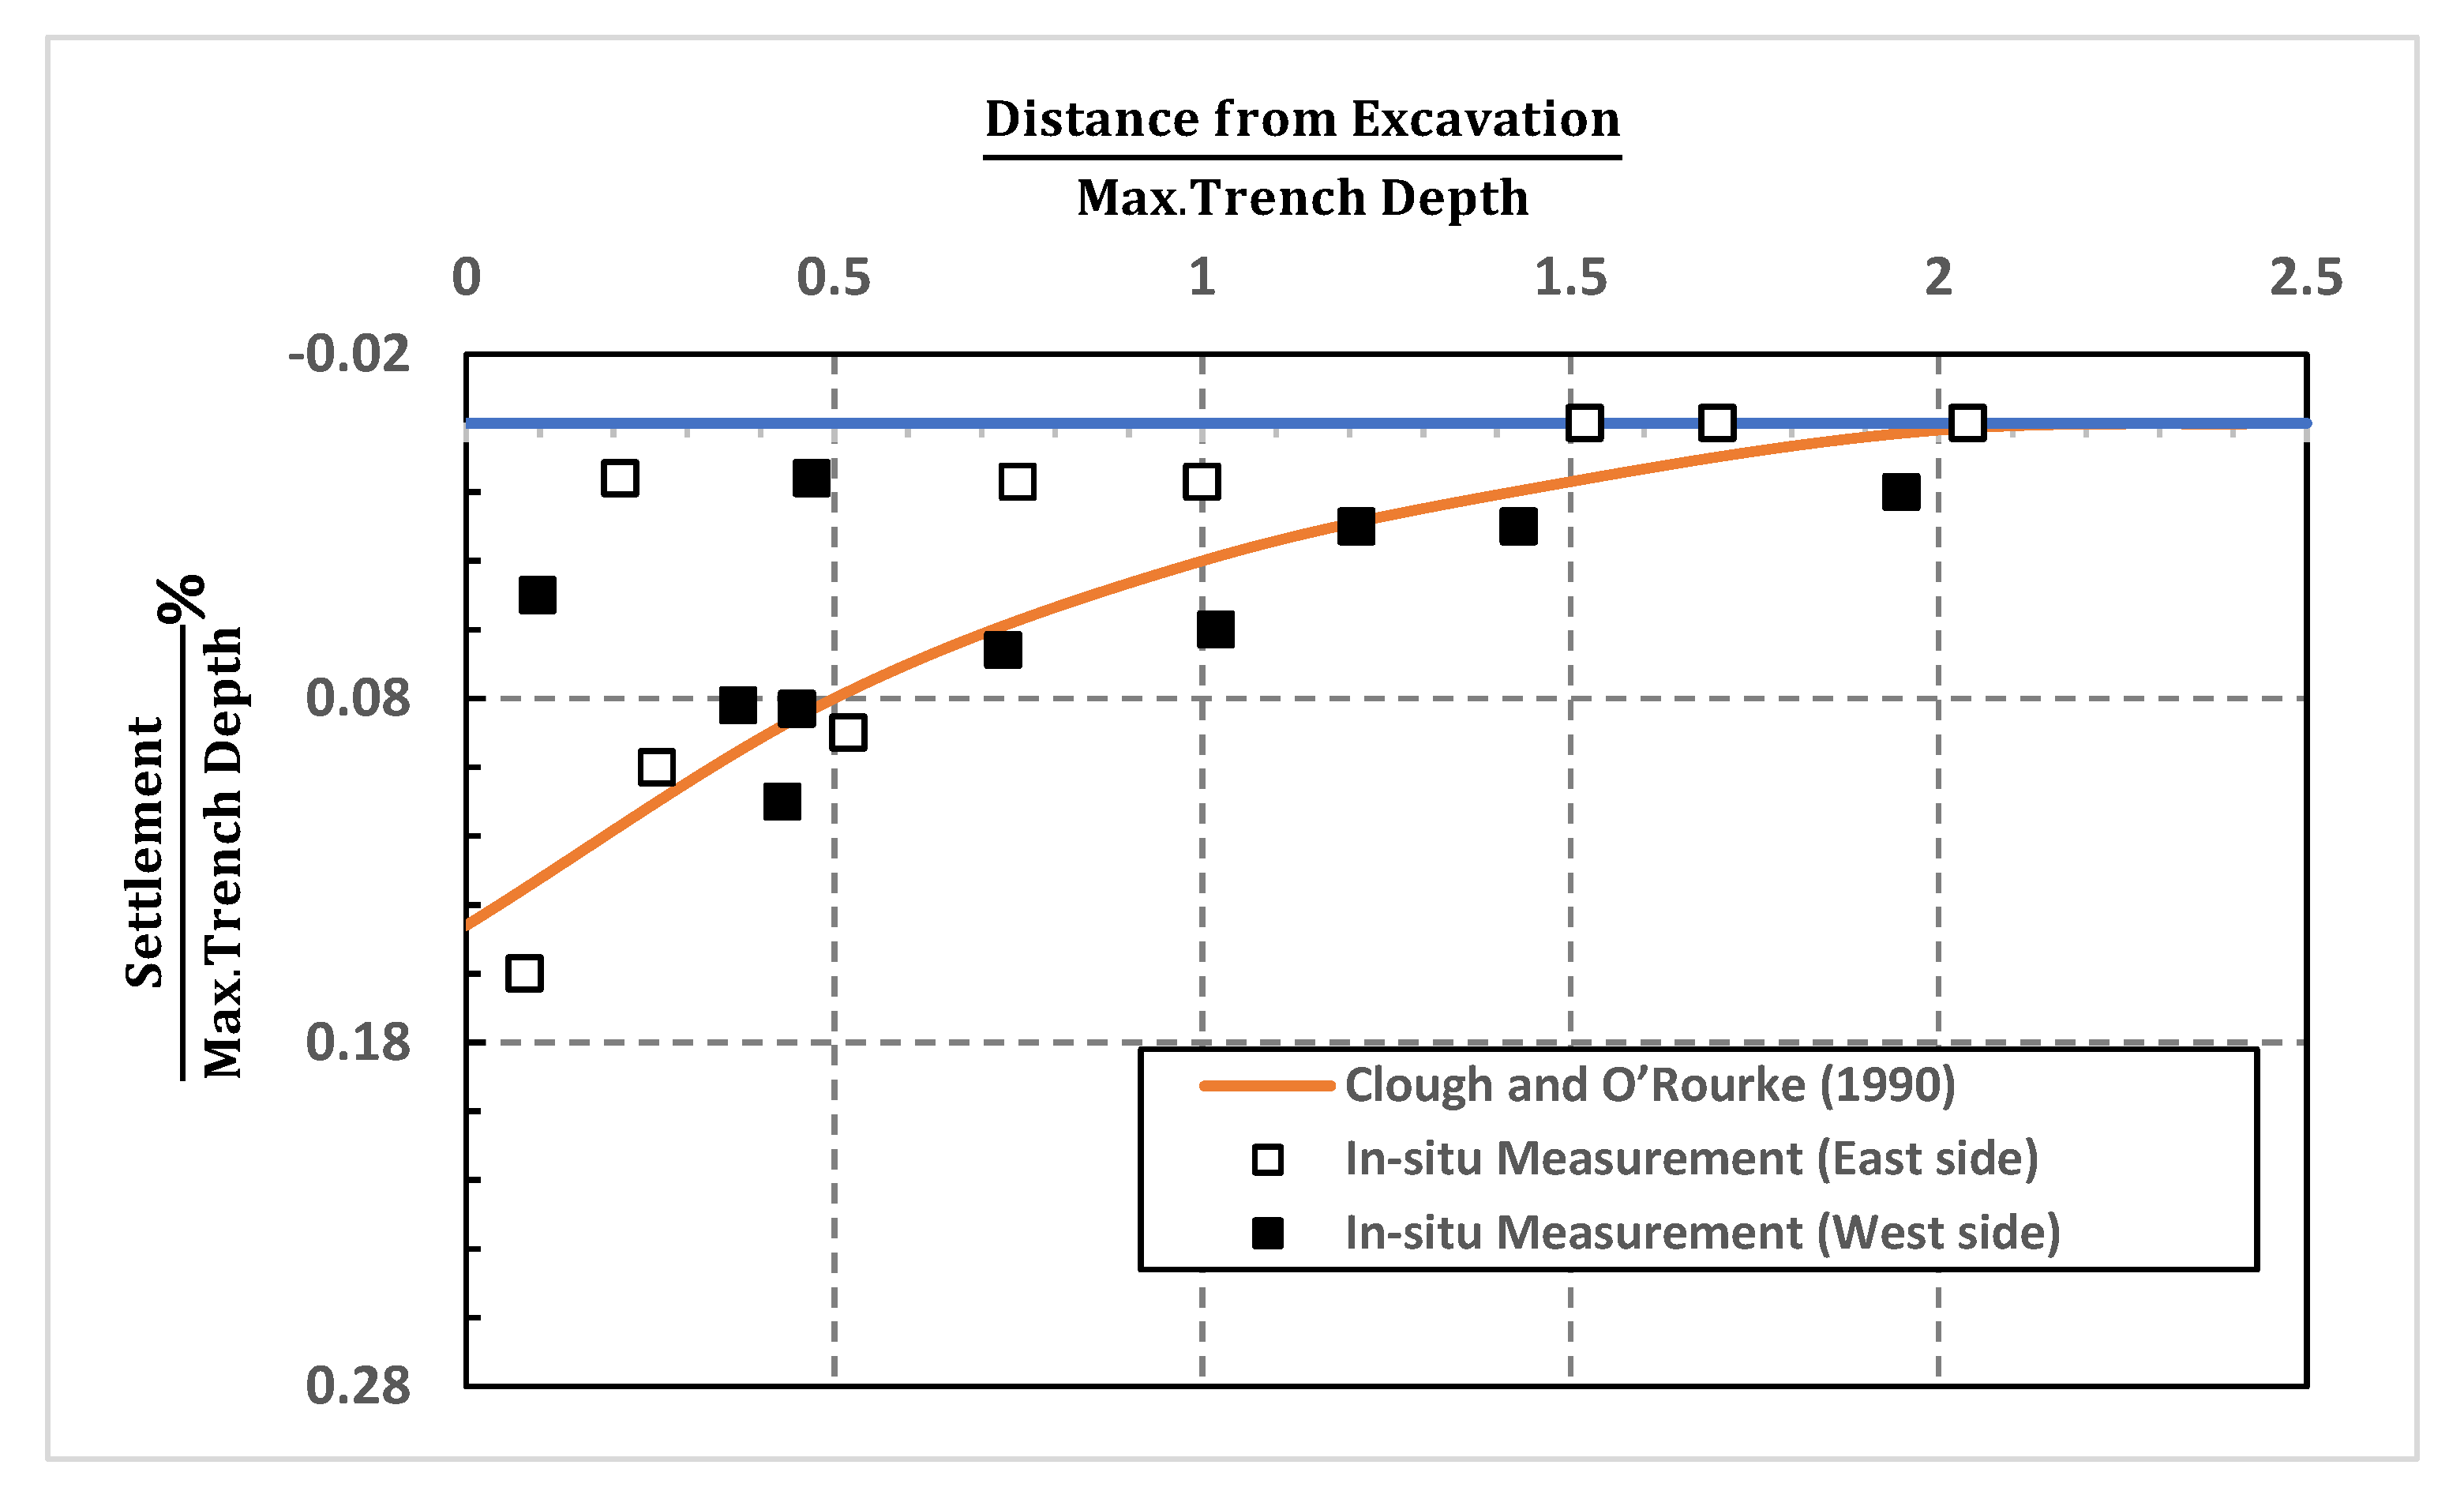
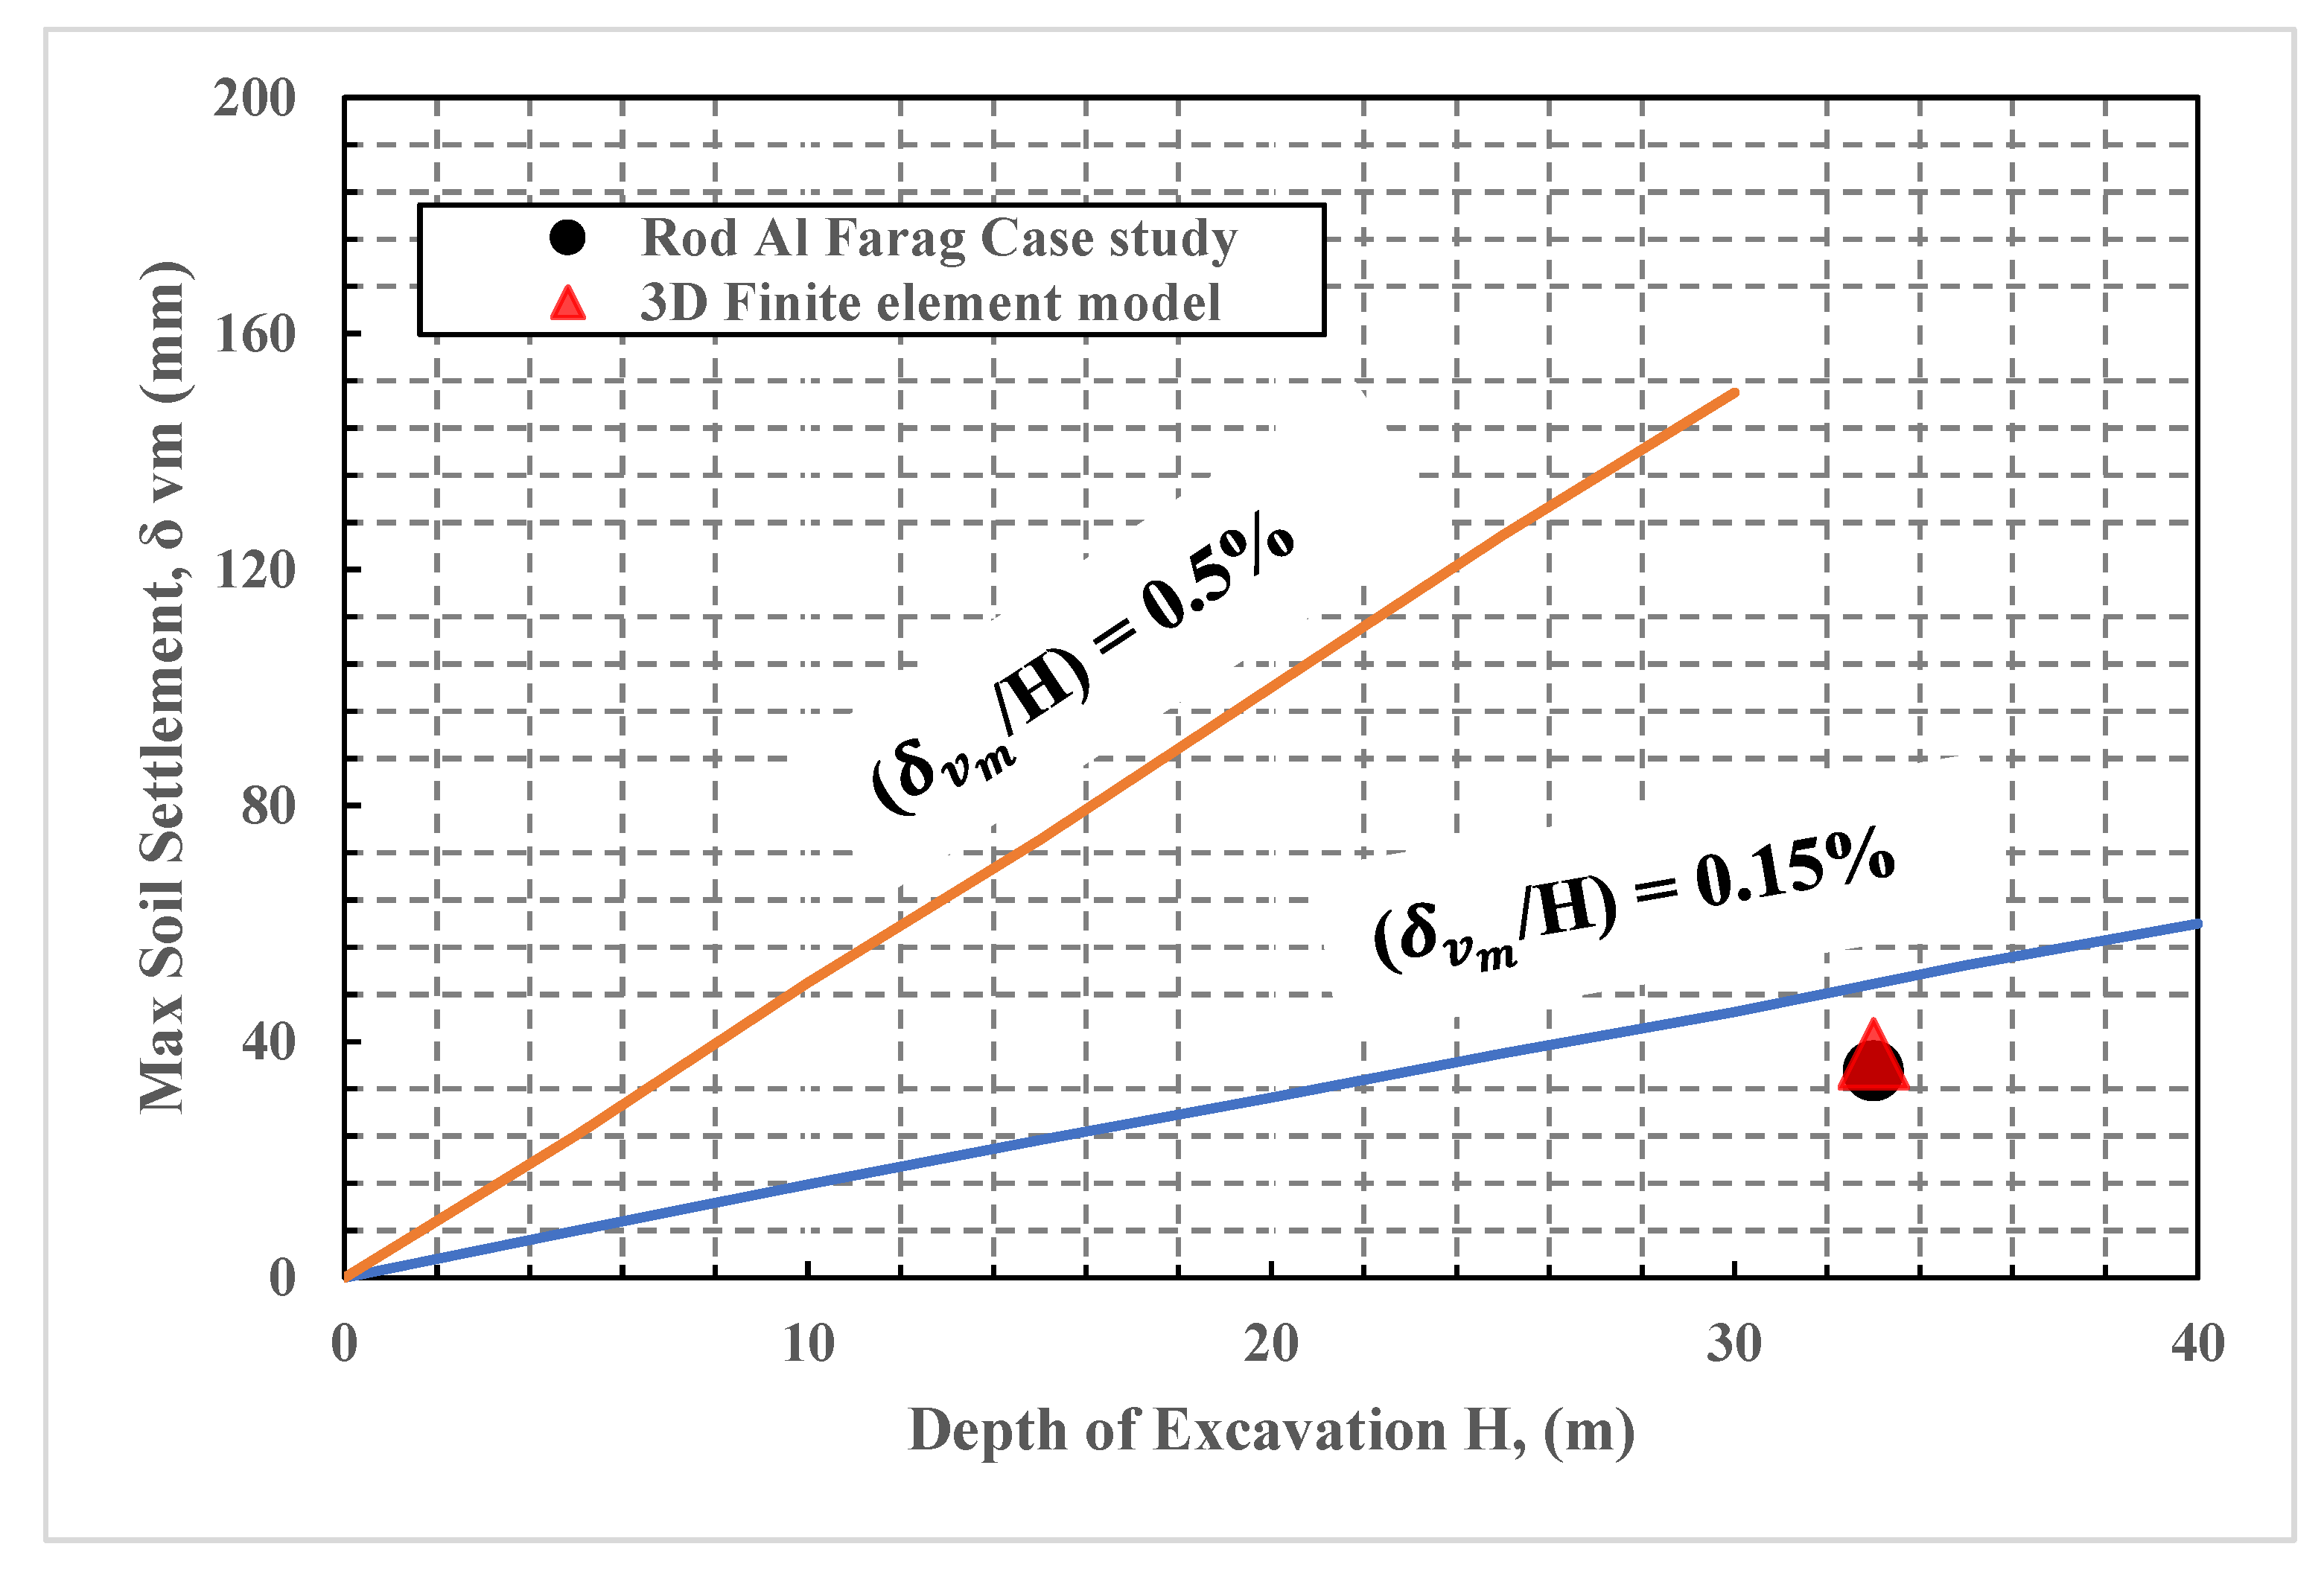
In the same way, Figure 14 compares the estimated values of vertical soil settlement using Clough and O’Rourke’s chart [14], with the in-situ measurements. As shown, the in-situ measurements of the soil settlement using east and west settlement points lie close to the estimated chart by Clough and O’Rourke [14]. Furthermore, Figure 15, compares the estimated maximum soil vertical settlement by Clough and O’Rourke [14] corresponding to the excavation depth, and the field measurements of the Rod El Farag station. As shown, good agreement is also obtained between the field measurements and the estimation of Clough and O’Rourke [14]. As the allocated point of field measurements lies close to the first line that represents the measured settlement of several supported excavations by the diaphragm wall system as compiled in various case studies, the ratio between the maximum settlement to excavation depth is less than 0.15%, which agrees with the measurements of the Rod El Farag case study.

5. Conclusions

In this numerical study, three-dimensional behavior of the supported deep excavation was investigated and the following conclusions drawn:
  • Excellent agreement was obtained between field measurements and results of the three-dimensional finite element model in both wall lateral displacement and neighboring soil vertical settlement.
  • In this case, the three-dimensional finite element model was superior to the two-dimensional plane strain model, in terms of prediction of both the diaphragm wall lateral deformation and the vertical soil settlement. The maximum wall lateral deformation obtained using the 2D model was 54% greater than the in-situ measured values.
  • In the Rod El Farag case, despite the relatively high aspect ratio (6.25) of the plan dimensions, the existence of cross walls significantly affected the lateral wall deformation. This is because the location of the maximum lateral wall deformation point was shifted from the mid-span of the whole primary wall length, to be at the mid-span point of every single panel.
  • The higher stiffness not only at the primary wall corners but also at the cross wall locations significantly causes the three-dimensional behavior of the supported deep excavation systems, and the lateral wall deformation decreased with decreasing distance from both the wall corners and the cross walls.
  • The three-dimensional stiffening effect at corners and cross walls has a significant impact not only on the lateral wall deformations but also on the neighboring soil vertical settlement.
  • The zone influenced by deep excavation may be affected and depends mainly on the magnitude of absolute settlement and the slope angle of the settlement rough. For the Rod El Farag case, the vertical ground settlement became insignificant at a horizontal distance equal to one times the excavated depth from the diaphragm wall.
  • In this case, the lateral wall movements (0.11% of excavated depth) were in good agreement with the practical approach proposed by Clough and O’Rourke (1990). However, Peck’s (1969) approach overestimated the induced deformation resulting due to deep excavation.
  • Three-dimensional finite element analysis is recommended for deep excavation cases with internal cross walls, even for cases with relatively high aspect ratios.

Author Contributions

A.H. and M.E.A.-A. collaborated to outline the study, together with the methodology, data analysis, and writing. Both M.J.A. and M.A. authors assisted in collecting the literature review. A.H., M.E.A.-A., M.J.A. and M.A. collaborated in the reviews of the final stage of the writing to discuss the interpretation of the outcomes. All authors have agreed to the published version of the manuscript.

Funding

This study is substantially supported by the United Arab Emirates University (UAEU) Grant No. G00002855.

Conflicts of Interest

The authors declare that there is no conflict of interest. The funders were not involved in the design of the research; in the collection, analyses, or interpretation of the results; in the writing of the manuscript, or in the decision to publish the results.

References

  1. Niu, Y.; Deng, X.; Zhao, X.; Zhang, N. Hexagonal Diamond Model for International Competitive Advantages of High-Speed Railway Industry. J. Manag. Eng. 2020, 36, 04020001. [Google Scholar] [CrossRef]
  2. Gill, S.A.; Lukas, R.G. Ground Movement Adjacent to Braced Cuts. In Design and Performance of Earth Retaining Structures; American Society of Civil Engineers: Reston, VA, USA, 1990. [Google Scholar]
  3. Son, M. The Response of Buildings to Excavation-induced Ground Movements. Ph.D. Thesis, Civil and Environmental Engineering, University of Illinois at Urbana-Champaign, Urbana, IL, USA, 2003. [Google Scholar]
  4. Son, M.; Cording, E.J. Estimation of Building Damage Due to Excavation-Induced Ground Movements. J. Geotech. Geoenviron. Eng. 2005, 131, 162–177. [Google Scholar] [CrossRef]
  5. Son, M.; Cording, E.J. Evaluation of Building Stiffness for Building Response Analysis to Excavation-Induced Ground Movements. J. Geotech. Geoenviron. Eng. 2007, 133, 995–1002. [Google Scholar] [CrossRef]
  6. Hsiao, C.L. Wall and Ground Movements in a Braced Excavation in Clays and Serviceability Reliability of Adjacent Buildings. Ph.D. Thesis, Clemson University, Clemson, SC, USA, 2007. [Google Scholar]
  7. Zapata-Medina, D.G. Semi-Empirical Method For Designing Excavation Support Systems Based on Deformation Control. Master’s Thesis, University of Kentucky, Lexington, KY, USA, 2007. [Google Scholar]
  8. Lam, S. Ground Movements due to Excavation in Clay: Physical and Analytical Models. Ph.D. Thesis, Churchill College, University of Cambridge, Cambridge, UK, 2010. [Google Scholar]
  9. Chai, J.; Shen, S.; Ding, W.; Zhu, H.; Carter, J. Numerical investigation of the failure of a building in Shanghai, China. Comput. Geotech. 2014, 55, 482–493. [Google Scholar] [CrossRef]
  10. Hefny, A.M.; Sorour, T.M.; Ezzat, M.; Bulut, R.; Yu, X.; Yang, S.-R. Prediction of the Field Response of Soil-Support Systems in Deep Excavations. In Proceedings of the Geo-China, Shandong, China, 25 July 2016; pp. 141–151. [Google Scholar]
  11. Peck, R.B. State-of-the-art: Deep excavation and tunneling in soft ground. In Proceedings of the Seventh International Conference on Soil Mechanics and Foundation Engineering, Mexico City, Mexico, 1969; pp. 225–290. [Google Scholar]
  12. Mana, A.I.; Clough, G.W. Prediction of movements for braced cuts in clay. J. Geotech. Eng. Div. 1981, 107, 759–777. [Google Scholar]
  13. Clough, G.W.; Smith, E.M.; Sweeney, B.P. Movement Control of Excavation Support Systems by Iterative Design. In Foundation Engineering: Current Principles and Practices; American Society of Civil Engineers: Reston, VA, USA, 1989. [Google Scholar]
  14. Clough, G.W.; O’Rourke, T.D. Construction Induced Movements of Insitu Walls. In Design and Performance of Earth Retaining Structures; American Society of Civil Engineers: Reston, VA, USA, 1990. [Google Scholar]
  15. Bowles, J.E. Foundation Analysis and Design, 5th ed.; McGraw-Hill: New York, NY, USA, 1988; pp. 589–646. [Google Scholar]
  16. Hsieh, P.G.; Ou, C.Y. Shape of ground surface settlement profiles caused by excavation. Can. Geotech. J. 1998, 35, 1004–1017. [Google Scholar] [CrossRef]
  17. Ou, C.Y.; Hsieh, P.G.; Chiou, D.-C. Characteristics of ground surface settlement during excavation. Can. Geotech. J. 1993, 30, 758–767. [Google Scholar] [CrossRef]
  18. Long, M. Database for Retaining Wall and Ground Movements due to Deep Excavations. J. Geotech. Geoenviron. Eng. 2001, 127, 203–224. [Google Scholar] [CrossRef]
  19. Moormann, C. Analysis of wall and ground movement due to deep excavation in soft soil based on a new worldwide database. Soils Found. 2004, 44, 87–98. [Google Scholar] [CrossRef] [Green Version]
  20. Roboski, J.; Finno, R.J. Distributions of ground movements parallel to deep excavations in clay. Can. Geotech. J. 2006, 43, 43–58. [Google Scholar] [CrossRef]
  21. Finno, R.J.; Hashash, Y.M.A. Integrated Tools for Predicting, Monitoring and Controlling Ground Movements due to Excavations. In Proceedings of the NSF Engineering Research and Innovation Conference, Honolulu, HI, USA, 22–25 June 2009. [Google Scholar]
  22. Ralph, B. Peck, Fifty Years of Lateral Earth Support. In Design and Performance of Earth Retaining Structures; American Society of Civil Engineers: Reston, VA, USA, 1990. [Google Scholar]
  23. Wood, L.A.; Perrin, A.J. Observations of a strutted diaphragm wall in London clay: A preliminary assessment. Géotechnique 1984, 34, 563–579. [Google Scholar] [CrossRef]
  24. Powrie, W.; Li, E.S.F. Finite element analyses of an in situ wall propped at formation level. Géotechnique 1991, 41, 499–514. [Google Scholar] [CrossRef]
  25. El-Nahhas, F. Prediction of ground movement adjacent to a supported deep excavation. In Proceedings of the Ninth Regional Conference for Africa on SMFE, Lagos, Nigeria, 1987; pp. 285–291. [Google Scholar]
  26. Konokike, K.; Ono, K. Prediction of the behavior of earth retaining walls. In Proceedings of the 9th Southeast Asian Geotechnical Conference, Bankok, Thailand, 7–11 December 1987. [Google Scholar]
  27. Fang, M.L. A Deep Excavation Taipei Basin. In Proceedings of the 9th Southeast Asian Geotechnical Conference, Bankok, Thailand, 7–11 December 1987. [Google Scholar]
  28. Ou, C.Y.; Chiou, D.C.; Wu, T.S. Three-Dimensional Finite Element Analysis of Deep Excavations. J. Geotech. Eng. 1996, 122, 337–345. [Google Scholar] [CrossRef]
  29. Finno, R.J.; Roboski, J.F. Three-Dimensional Responses of a Tied-Back Excavation through Clay. J. Geotech. Geoenviron. Eng. 2005, 131, 273–282. [Google Scholar] [CrossRef]
  30. Abd El-Salam, N. Insitu Performance Of A Subway Station in Cairo. Master’s Thesis, Ain Shams University, Cairo, Egypt, 1995. [Google Scholar]
  31. Ahmed, A.A.; Abd El-Salam, N. In-Situ Performance of Subway Stations in Cairo. In Proceedings of the Seventh International Colloquium on Structural and Geotechnical Engineering, El-Abaseya, Egypt, 1996; pp. 447–460. [Google Scholar]
  32. Ezzat, M.; Zaghloul, Y.; Sorour, T.; Hefny, A.; Eid, M. Numerical Simulation of Axially Loaded to Failure Large Diameter Bored Pile. Int. J. Earth Energy Environ. Sci. 2019, 13, 1–15. [Google Scholar]
  33. Stroud, M.A. The standard penetration test in insensitive clays and soft rocks. In Proceedings of the European Symposium on Penetration Testing; National Swedish Building Research: Stockholm, Sweden, 1974; pp. 367–375. [Google Scholar]
  34. Duncan, J.M.; Buchignani, A. An Engineering Manual for Settlement Studies; University of California: Oakland, CA, USA, 1976. [Google Scholar]
  35. Janbu, N. Soil compressibility as determined by oedometer and triaxial tests. Proc. Europ. Conf. SMFE 1963, 1, 19–25. [Google Scholar]
  36. Kulhawy, F.H.; Mayne, P.W. Manual on Estimating Soil Properties for Foundation Design; Report No. EPRI EL-6800; Electric Power Research Institute: Palo Alto, CA, USA, 1990; pp. 2–25. [Google Scholar]
  37. MIDAS, GTS. NX user manual, Analysis Reference chapter 4 materials, Section 2. Plast. Mater. Prop. 2009, 3, 33–68, 120–165. [Google Scholar]
  38. Zdravković, L.; Potts, D.M.; John, H.D.S. Modelling of a 3D excavation in finite element analysis. Géotechnique 2005, 55, 497–513. [Google Scholar] [CrossRef]
  39. Dong, Y.; Burd, H.; Houlsby, G.; Hou, Y. Advanced finite element analysis of a complex deep excavation case history in Shanghai. Front. Struct. Civ. Eng. 2014, 8, 93–100. [Google Scholar] [CrossRef]
  40. Eid, M.; Hefny, A.; Sorour, T.; Zaghloul, Y.; Ezzat, M. Numerical Analysis of Large Diameter Bored Pile Installed in Multi Layered Soil: A Case Study of Damietta Port New Grain Silos Project. Int. J. Curr. Eng. Technol. 2018, 8, 220–226. [Google Scholar] [CrossRef] [Green Version]
Figure 1. Layout and cross-section of Rod El-Farag subway station [30].
Geosciences 10 00076 g001
Figure 2. Instrumentation system layout [30].
Geosciences 10 00076 g002
Figure 3. Layout plan, and the elevation of the borehole locations at Rod El Farag subway station [30].
Geosciences 10 00076 g003
Figure 4. Soil profile at the location of BH No. 46-B. [30].
Geosciences 10 00076 g004
Figure 5. Stages of construction of Rod El Farag subway station case study [30]. (a) Stage 1: Wall construction. (b) Stage 2: Grouting. (c) Stage 3: Dewatering Excavation to roof slab level and concreting roof slab. (d) Stage 4: Excavation to technical slab level and concreting technical slab. (e) Stage 5: Excavation to the first layer of struts and installing the struts. (f) Stage 6: Excavation to the second layer of struts and installing the strut. (g) Stage 7: Excavation to raft slab level and concreting raft slab. (h) Stage 8: Removal of struts concreting ticket slab and stopping dewatering.
Geosciences 10 00076 g005
Figure 6. Summary of in-situ measurements of walls lateral deformation and ground surface settlement for both the west and east sides. (a) Lateral diaphragm wall displacement at East (RIED) and west (RIWD) sides. (b) Settlement profile adjacent to the excavation on the east side. (c) Settlement profile adjacent to the excavation at the west side.
Geosciences 10 00076 g006
Figure 7. Two-dimensional plane strain finite element model.
Geosciences 10 00076 g007
Figure 8. Three-dimensional finite element model. (a) Geometry dimensions and boundary conditions. (b) Temporary two steel strut rows.
Geosciences 10 00076 g008
Figure 9. (a) Comparison between wall lateral displacement results obtained using two different methods of wall simulation. (b) Two-dimensional shell element (8-noded) [37]. (c) Three-dimensional hexahedral element (20-noded) [37].
Geosciences 10 00076 g009
Figure 10. Deformed shape showing results of three-dimensional diaphragm walls’ lateral deformation.
Geosciences 10 00076 g010
Figure 11. Contour lines showing the results of vertical soil settlement around the excavation pit.
Geosciences 10 00076 g011
Figure 12. Comparison between field measurements and the obtained numerical results. (a) Results of lateral wall deformation. (b) Results of vertical ground settlement.
Geosciences 10 00076 g012
Figure 13. Allocation of the measured soil vertical settlement corresponding to horizontal distance from the excavation zone on the Peck’s chart [11].
Geosciences 10 00076 g013
Figure 14. Allocation of the in-situ measured soil vertical settlement corresponding to the horizontal distance from the excavation zone on the Clough and O’Rourke, chart [14].
Geosciences 10 00076 g014
Figure 15. Allocation of the obtained ratio of the maximum measured vertical soil settlement to the excavation depth of the Rod El Farag case study on the Clough and O’Rourke chart [14].
Geosciences 10 00076 g015
Table 1. Properties of soil layers and interface.
Soil Layer SoilFillSandy Silty ClaySandy Clayey SiltSilty SandSandy CobblesDense Sand/GravelCobbles and GravelMed. to Fine Sand
Parameter
Unit weight γsat (kN/m3)17181819.921212221
Triaxial loading stiffness E50 (MPa)410163040507540
Oedometer loading stiffness Eoed (MPa)410163040507540
Triaxial unloading stiffness Eur (MPa)16304890120150220120
Poisson’s ratio v (-)0.300.350.300.300.300.300.300.30
Cohesion Cref (kPa)0.13000000
Friction angle ϕ (degrees)2830303436384036
Dilatancy angle ψ (degrees)00002353
lateral earth pressure coefficient (K0)0.530.50.50.440.4120.380.330.412
interface reduction factor (R)0.670.670.670.670.670.670.670.67
Table 2. Properties of structural elements.
ElementMaterialUnit Weight
(kN\m3)
Thickness
(m)
Poisson’s Ratio
(-)
Modulus of Elasticity
(MPa)
Diaphragm wallConcrete25.01.200.1524,100
Raft slabConcrete25.02.200.1524,100
Roof slabConcrete25.01.400.1524,100
Technical slabConcrete25.01.100.1524,100
Ticker slabConcrete25.01.200.1524,100
Strut BeamsSteel78.012.7 mm0.3210,000