1. Introduction
Surveying of geometric characteristics of discontinuities in a rock mass is fundamental for the evaluation of potential detachable blocks. A geostructural survey devoted to a systematic and quantitative description of rock discontinuities is crucial to understand the stability conditions of a rock mass. Discontinuity sampling can be applied to rock faces, natural or artificial (such as excavations), or on boreholes depending on the available data. Discontinuity properties to be measured include dip, dip direction, length, spacing, roughness, persistence, aperture, filling, and termination [
1]. A correct joint geometry representation is suggested by ISRM [
2], providing that a collected sample is representative of the entire joint population [
3,
4]. Measurements of dip and dip direction are used to represent the discontinuity orientation on a two-dimensional (2D) map, in order to describe the directional aspects of joints, faults, bedding planes and any other fracture present into the rock mass.
However, in certain contexts, such as ornamental stone quarries, traditional survey method could lead to inaccurate and incomplete results, due to conditions of faces and the excavation environment. In fact, in addition to being a very demanding environment in terms of safety for both workers and possible people performing the survey (chain-sawing machines and/or diamond wire saws at work, heavy machineries carrying blocks, etc.), the peculiarity of a quarry is the presence of both natural rock faces and excavated benches. The traditional geomechanical survey allows for both geometric and geomechanical (roughness, alteration, etc.) description of the discontinuities that intersect the scanline; however, it is limited in terms of accessibility of the higher portions of the slope and it can be very time demanding for large rock slopes.
To overcome these limitations, recent advances in non-contact survey techniques are becoming increasingly used; digital photography for mapping traces [
5,
6,
7,
8,
9,
10,
11,
12] and detecting failure [
13,
14,
15], digital photogrammetry, or laser scanner for surveying discontinuity planes [
16,
17,
18,
19,
20,
21,
22,
23,
24,
25].
The acquisition of three-dimensional (3D) data of the terrain surface is now obtained with a high accuracy, in less time and over a wider area thanks to the evolution of satellite and remote sensing imaging technologies. This progress has also changed the way to collect and interpret information about the geostructural setting of large areas [
26,
27,
28,
29,
30] or the structure of rock mass for the stability assessment [
31,
32,
33,
34,
35,
36,
37], with the great advantage of allowing for the survey of high inaccessible steep slopes in safe conditions. To become a real alternative (both in terms of productivity as well as accuracy) to a traditional survey, interactive or automated software tools are necessary, to allow the efficient selection on the point cloud of elements of interest (i.e., discontinuity planes and traces, etc.).
In this work, image sequences shot both from remotely piloted aircraft and from the ground have been used to obtain 3D point clouds to be analyzed for extracting information on the discontinuity orientation and persistence at different scales, to be coupled with data from traditional surveys and geostructural studies.
The test site is a marble quarry, called Piastrone, in the Carrara extraction basin: excavation process has brought to light the rock mass, allowing for a complete outcrop of the rock structure and making the place an ideal site for rock mechanics studies.
2. Failure Mode in Ornamental Stone Quarries
Ornamental stone exploitation is based on the extraction of large sound rock blocks to be cut into slabs by special frames. Such an operation is possible only in massive rock masses characterized by a low degree of fracturing. This main feature also affects the possible failure modes occurring along the excavation fronts.
Pre-existing discontinuities and their orientation, in relation with the orientation of excavation, determines the possible kinematic instability mode: some case studies regarding different kinds of quarry are reported in [
38,
39,
40,
41]. Stability conditions are further affected by discontinuity persistence in the form of rock bridges that can increase the available shear resistance [
42,
43,
44]. Finally, the volume of detachable rock block is determined by spacing of rock joints.
Planar or wedge sliding, flexural or block toppling must be identified before stability analysis are performed [
45]. Stereographic projections for the kinematic analysis of these simple failure modes are described by Richards et al. [
46] and Hoek and Bray [
47].
In massive rock masses, consequently, the assessment of the discontinuity geometrical features is of crucial importance for an accurate evaluation of stability conditions of the potentially unstable volume.
3. Geological and Structural Setting
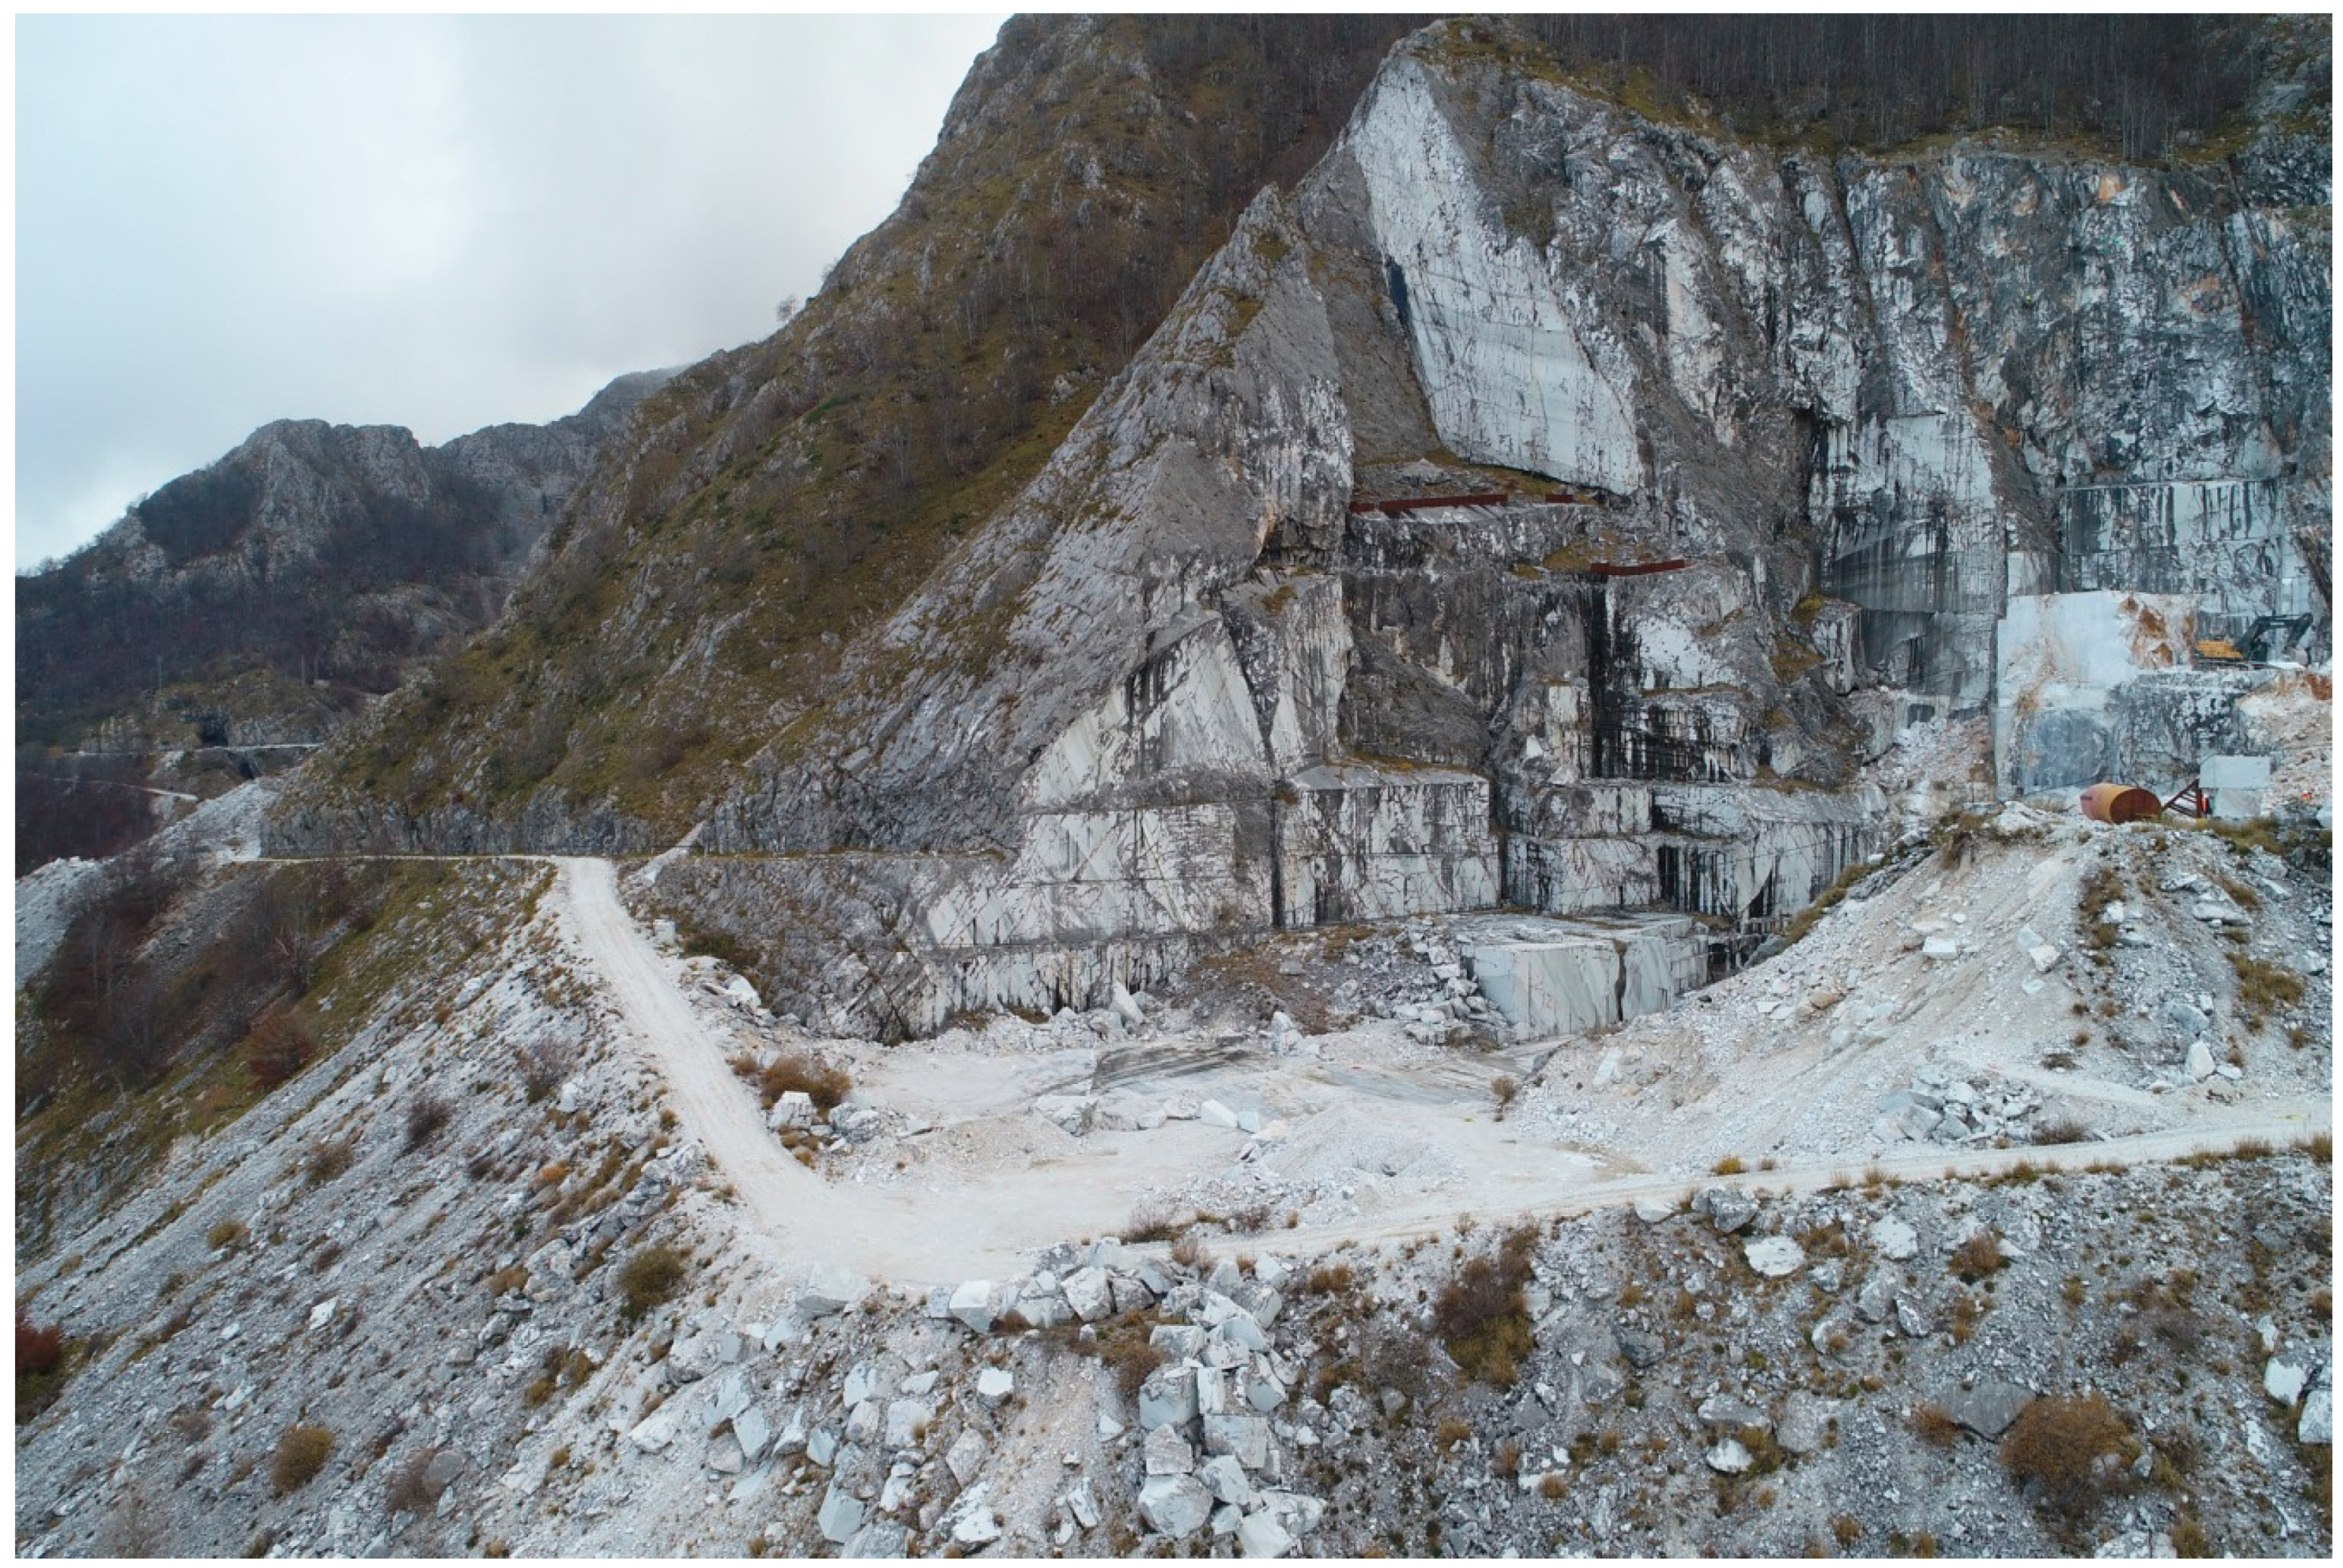
Piastrone quarry is located in the territory of Seravezza (Lucca, Italy). It is part of the northern slope of Mt. Altissimo in the extraction district of the Apuan Alps. The mining activity was recently resumed after about thirty years of inactivity. It is an open pit quarry (
Figure 1) and it extends between 1179 m and 1280 m a.s.l. The metamorphic complex of the Apuan Alps crops out in the northern Apennines. It consists of a Paleozoic basement and its Meso-Cenozoic metasedimentary cover, metamorphosed up to greenschist facies conditions [
48,
49]. It is separated from the overlying non-metamorphic sedimentary rocks of the Tuscan nappe and Liguride units by breccias and cataclasites belonging to the “Calcare Cavernoso” formation that acted as a slip horizon both during Oligocene and Miocene [
48].
According to Carmignani and Kligfield [
48] in the Apuan Alps two deformation phases, D1 and D2, can be recognized. During D1, which is linked to the nappe staking, kilometric-scale folds with an associated axial plane foliation (S1), and a stretching lineation (L1) were developed. Carmignani and Kligfield [
48] and Molli [
50] recognized during D1 a northeast transport direction by considering the map-scale and meso-scale geometry of folds.
The peak metamorphism, estimated at 350–450 °C and 0.6 GPa [
49], was reached during the early D1 phase and was dated at ~27 Ma (K-Ar and
40Ar-
39Ar on white mica [
51]). The D2 event is responsible of the formation of a complex mega-antiform with Apenninic trending axis (NW-SE) during the exhumation of the metamorphic units [
48,
52]. D2 is correlated to the development of folds with an associated S2 foliation and high-strain shear zones. D2 phase initiated at temperature higher than 250 °C and is considered to happen earlier than 11 Ma according to zircon fission track ages [
53].
The final exhumation and uplift of the metamorphic units is characterized by the transition from a ductile to a brittle regime, with the formation of kink folds, low- and high-angle faults, and joint systems [
48].
The Piastrone quarry exploits marbles cropping out in the normal limb of a km-scale fold. The fold is a syncline, with younger rocks in its core and older rocks in the limbs, and it is named as “Monte Altissimo syncline” [
54] (
Figure 2). The fold has a marble core and the axis trends NW-SE with axial plane schistosity dipping to SW. This fold developed during the oligo-miocenic tectonics linked to the D1 deformation event in the Apuan Alps and the Northern Apennines.
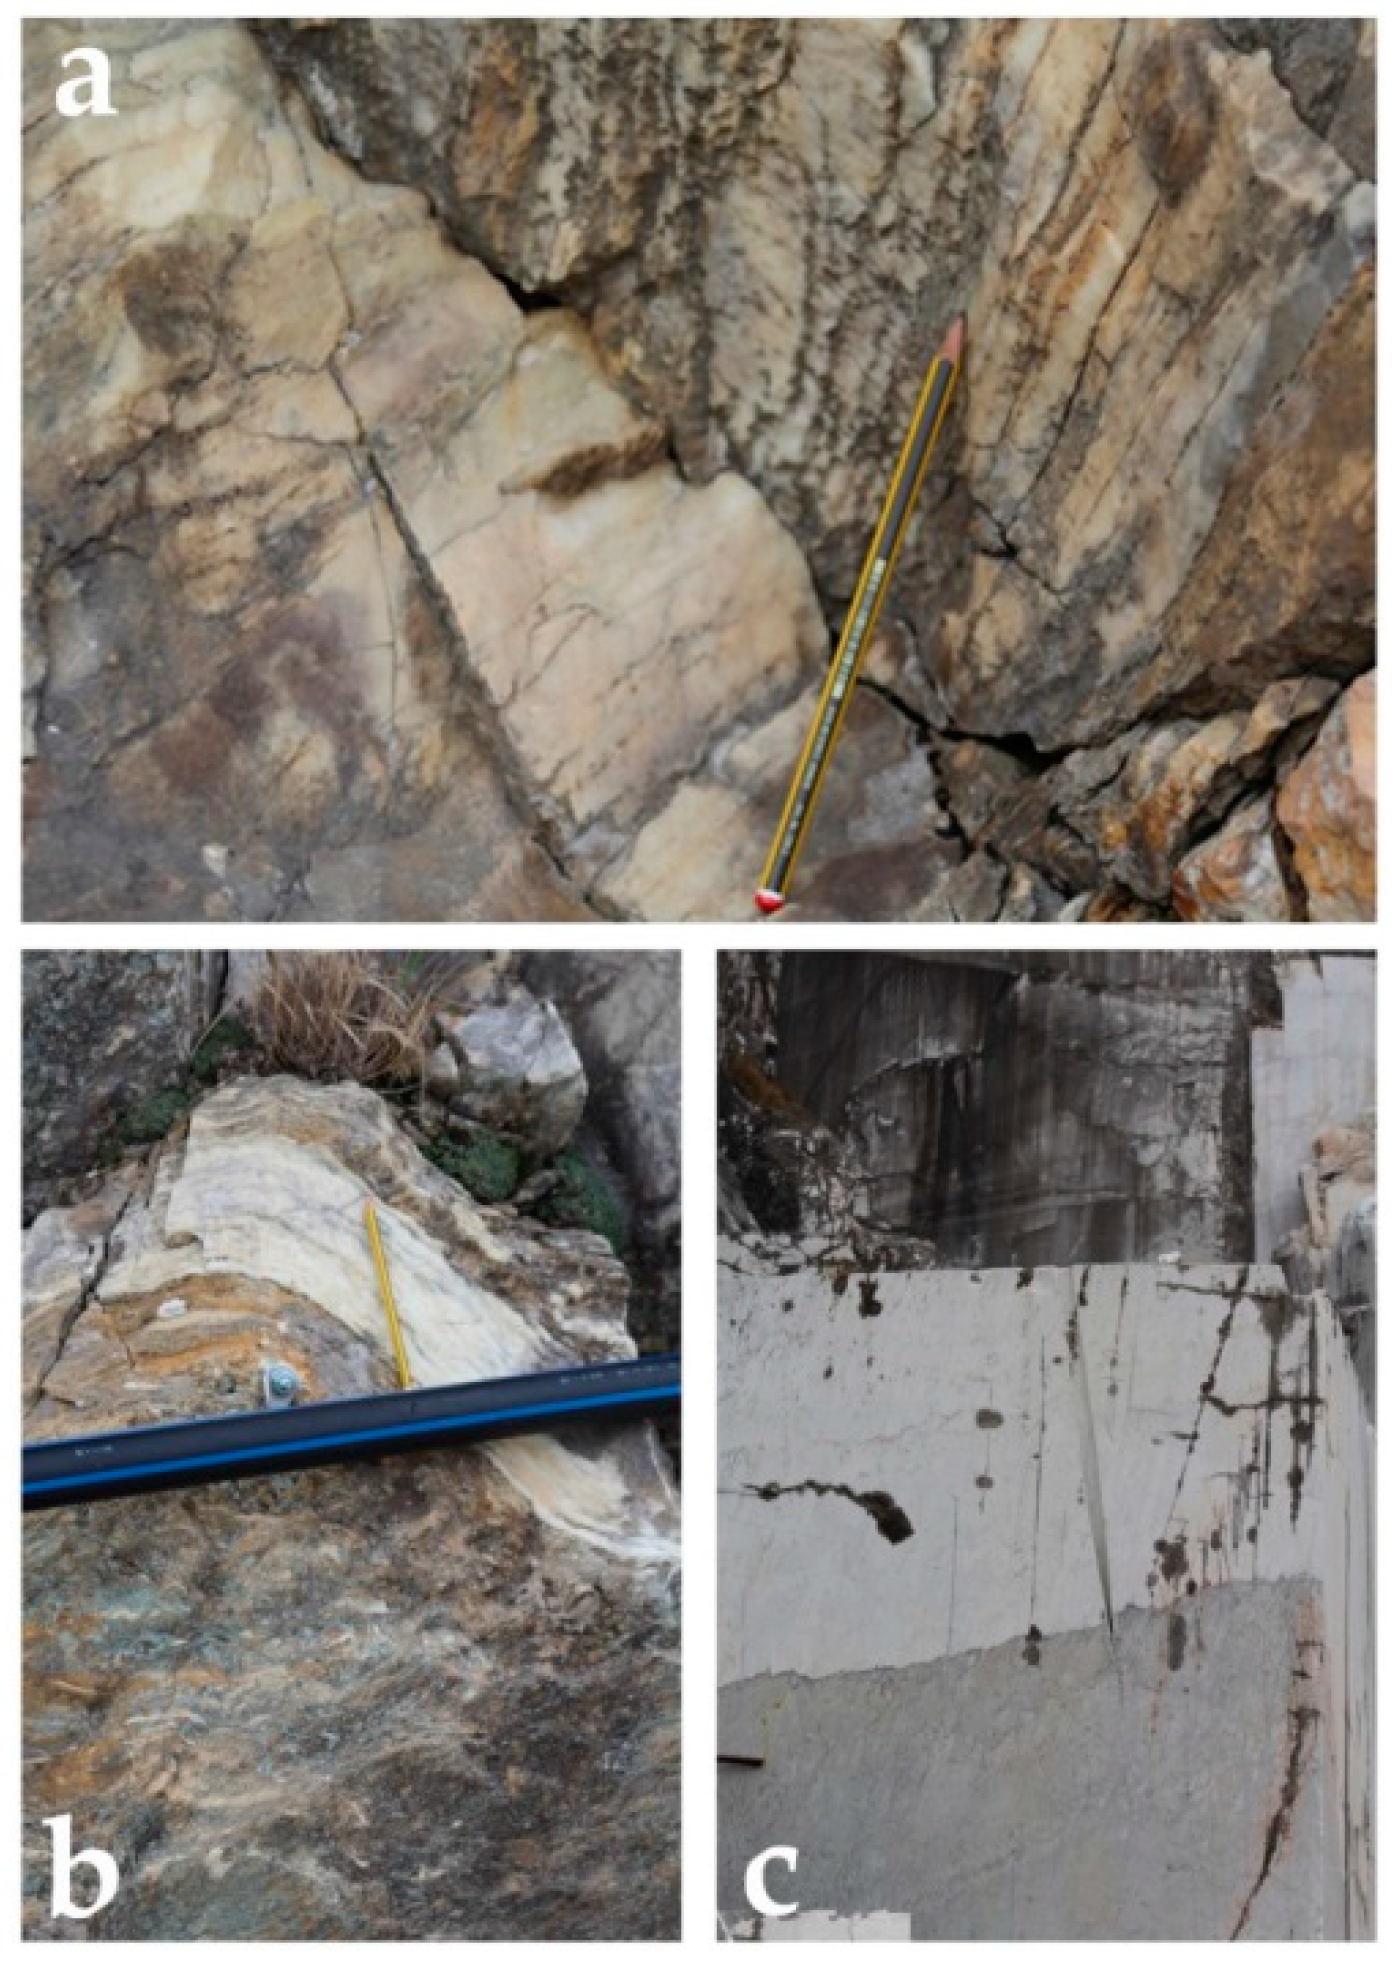
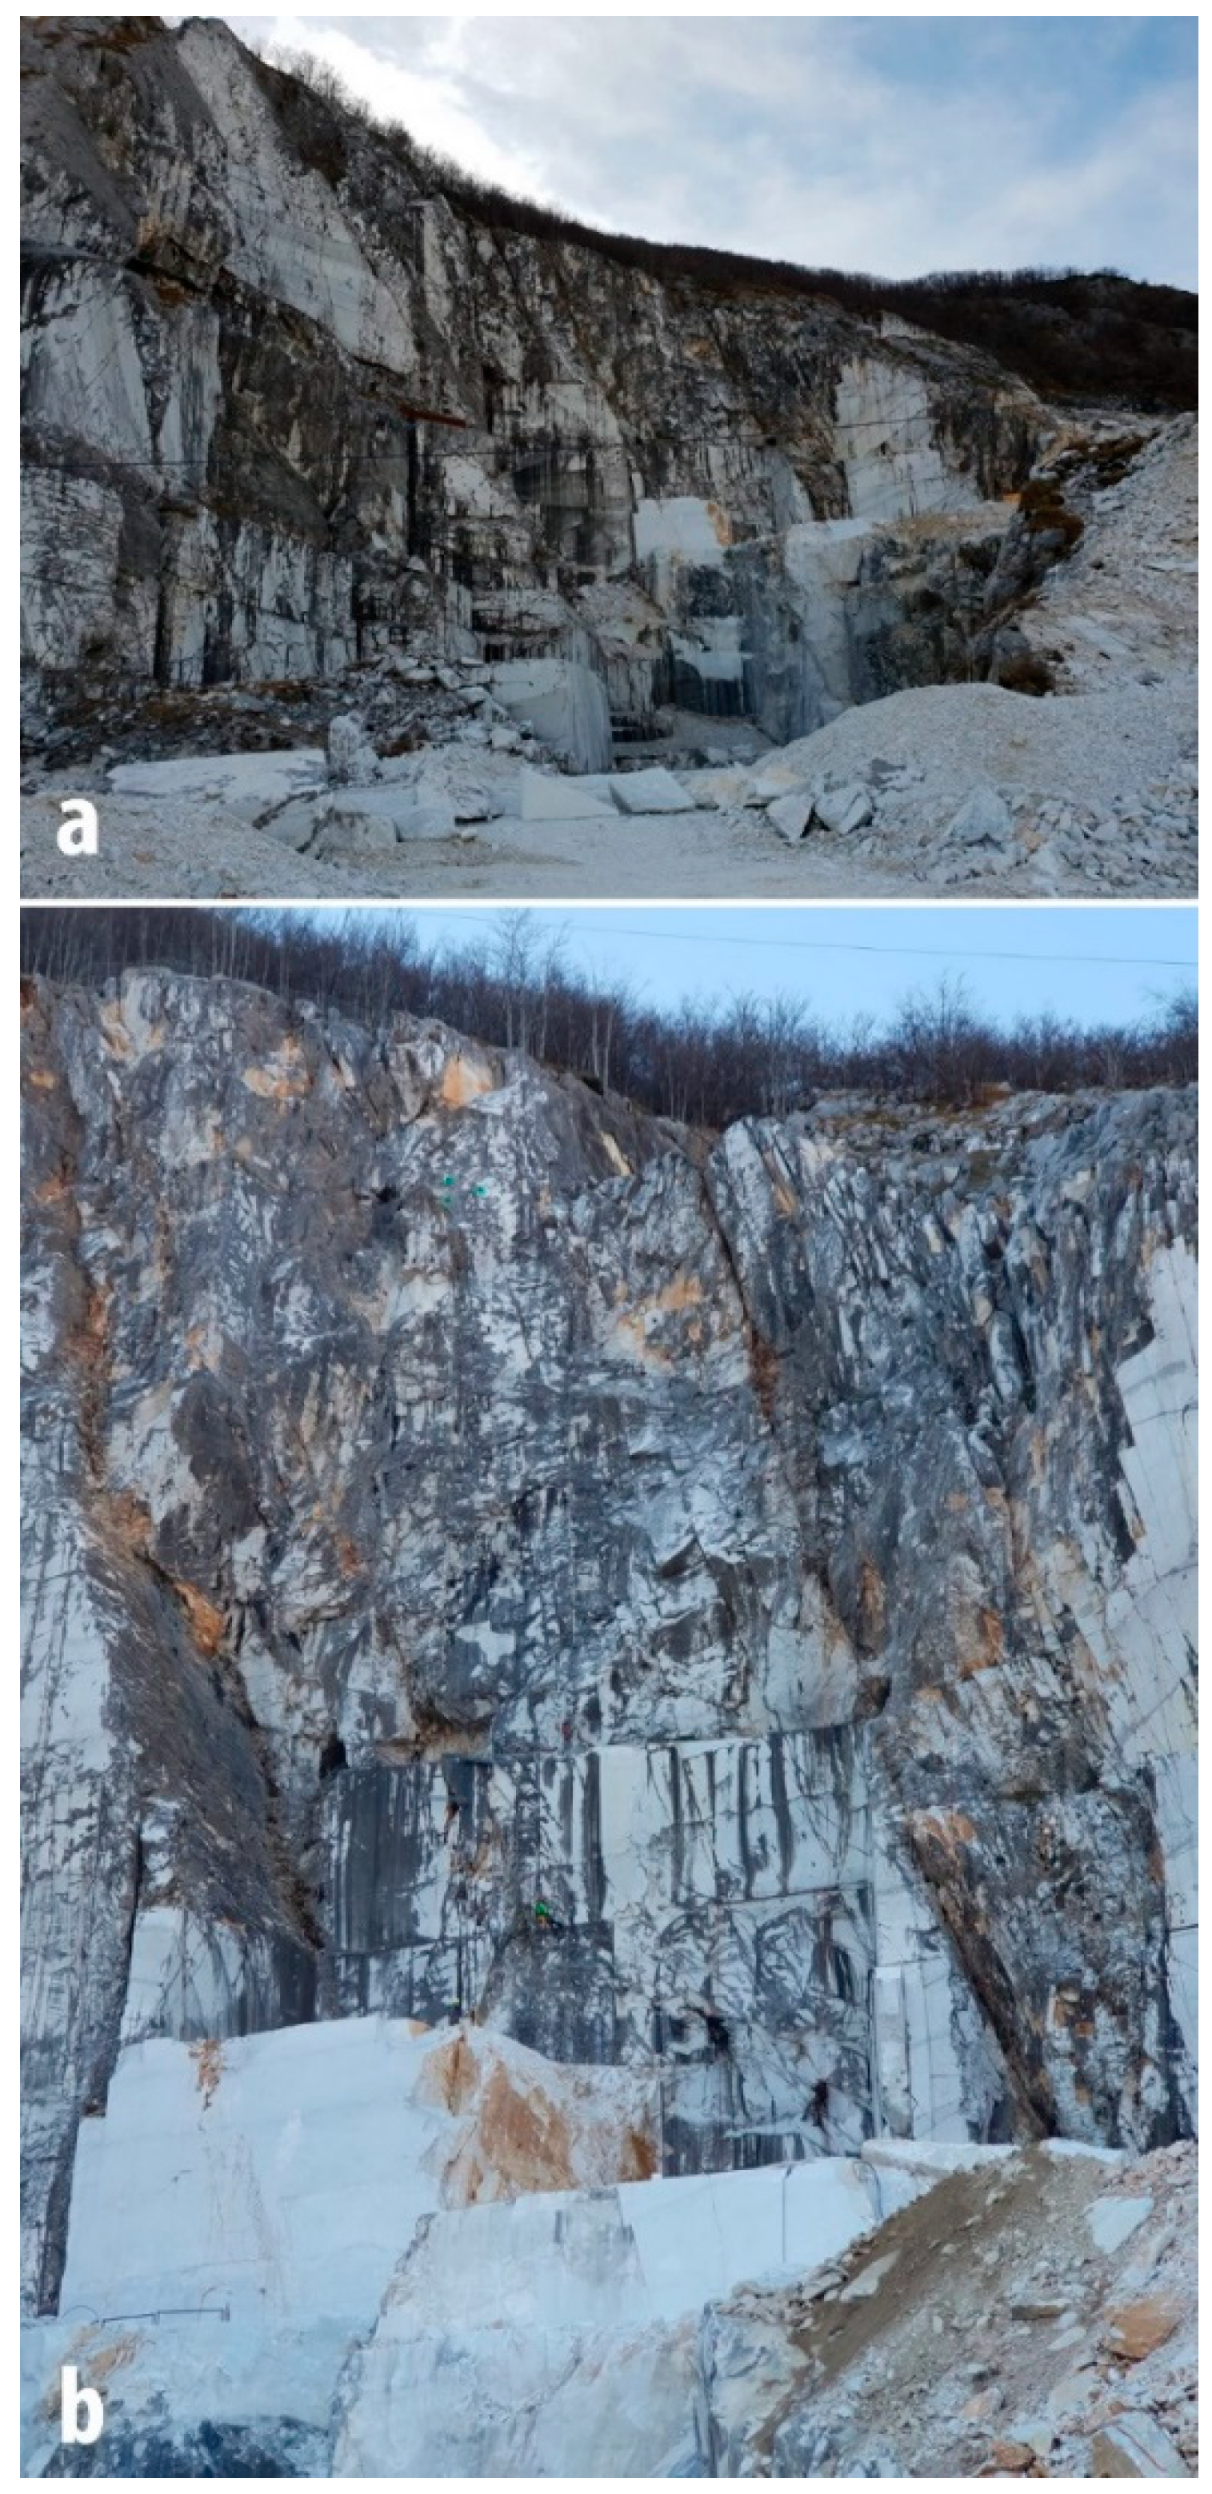
All the formations that outcrop in the quarry area belong to the Apuane Unit (Autoctono “Auct.”) that underwent metamorphism in low temperature and pressure conditions (greenschist metamorphism) during the thickening stage of the Northern Apennines. The following lithologies are present from the older to the younger [
56]: (a) white marble (
Figure 3a) of Raethian age known in literature as Megalodon-bearing marble; (b) metabreccia of Raethian-Liassic age made by marble and dolomitic clasts (
Figure 3b) within a red or green chloritoid-bearing phylladic matrix known as Seravezza breccia; (c) massive white marble interbedded with grey marble strata (
Figure 3c), characterized by veins and brecciated levels, of Hettangian age [
54]. The last two lithologies belongs to the “Marmi
stricto sensu (s.s.) Formation”, which is the main formation that crops out in the study area and the target of the mining activity.
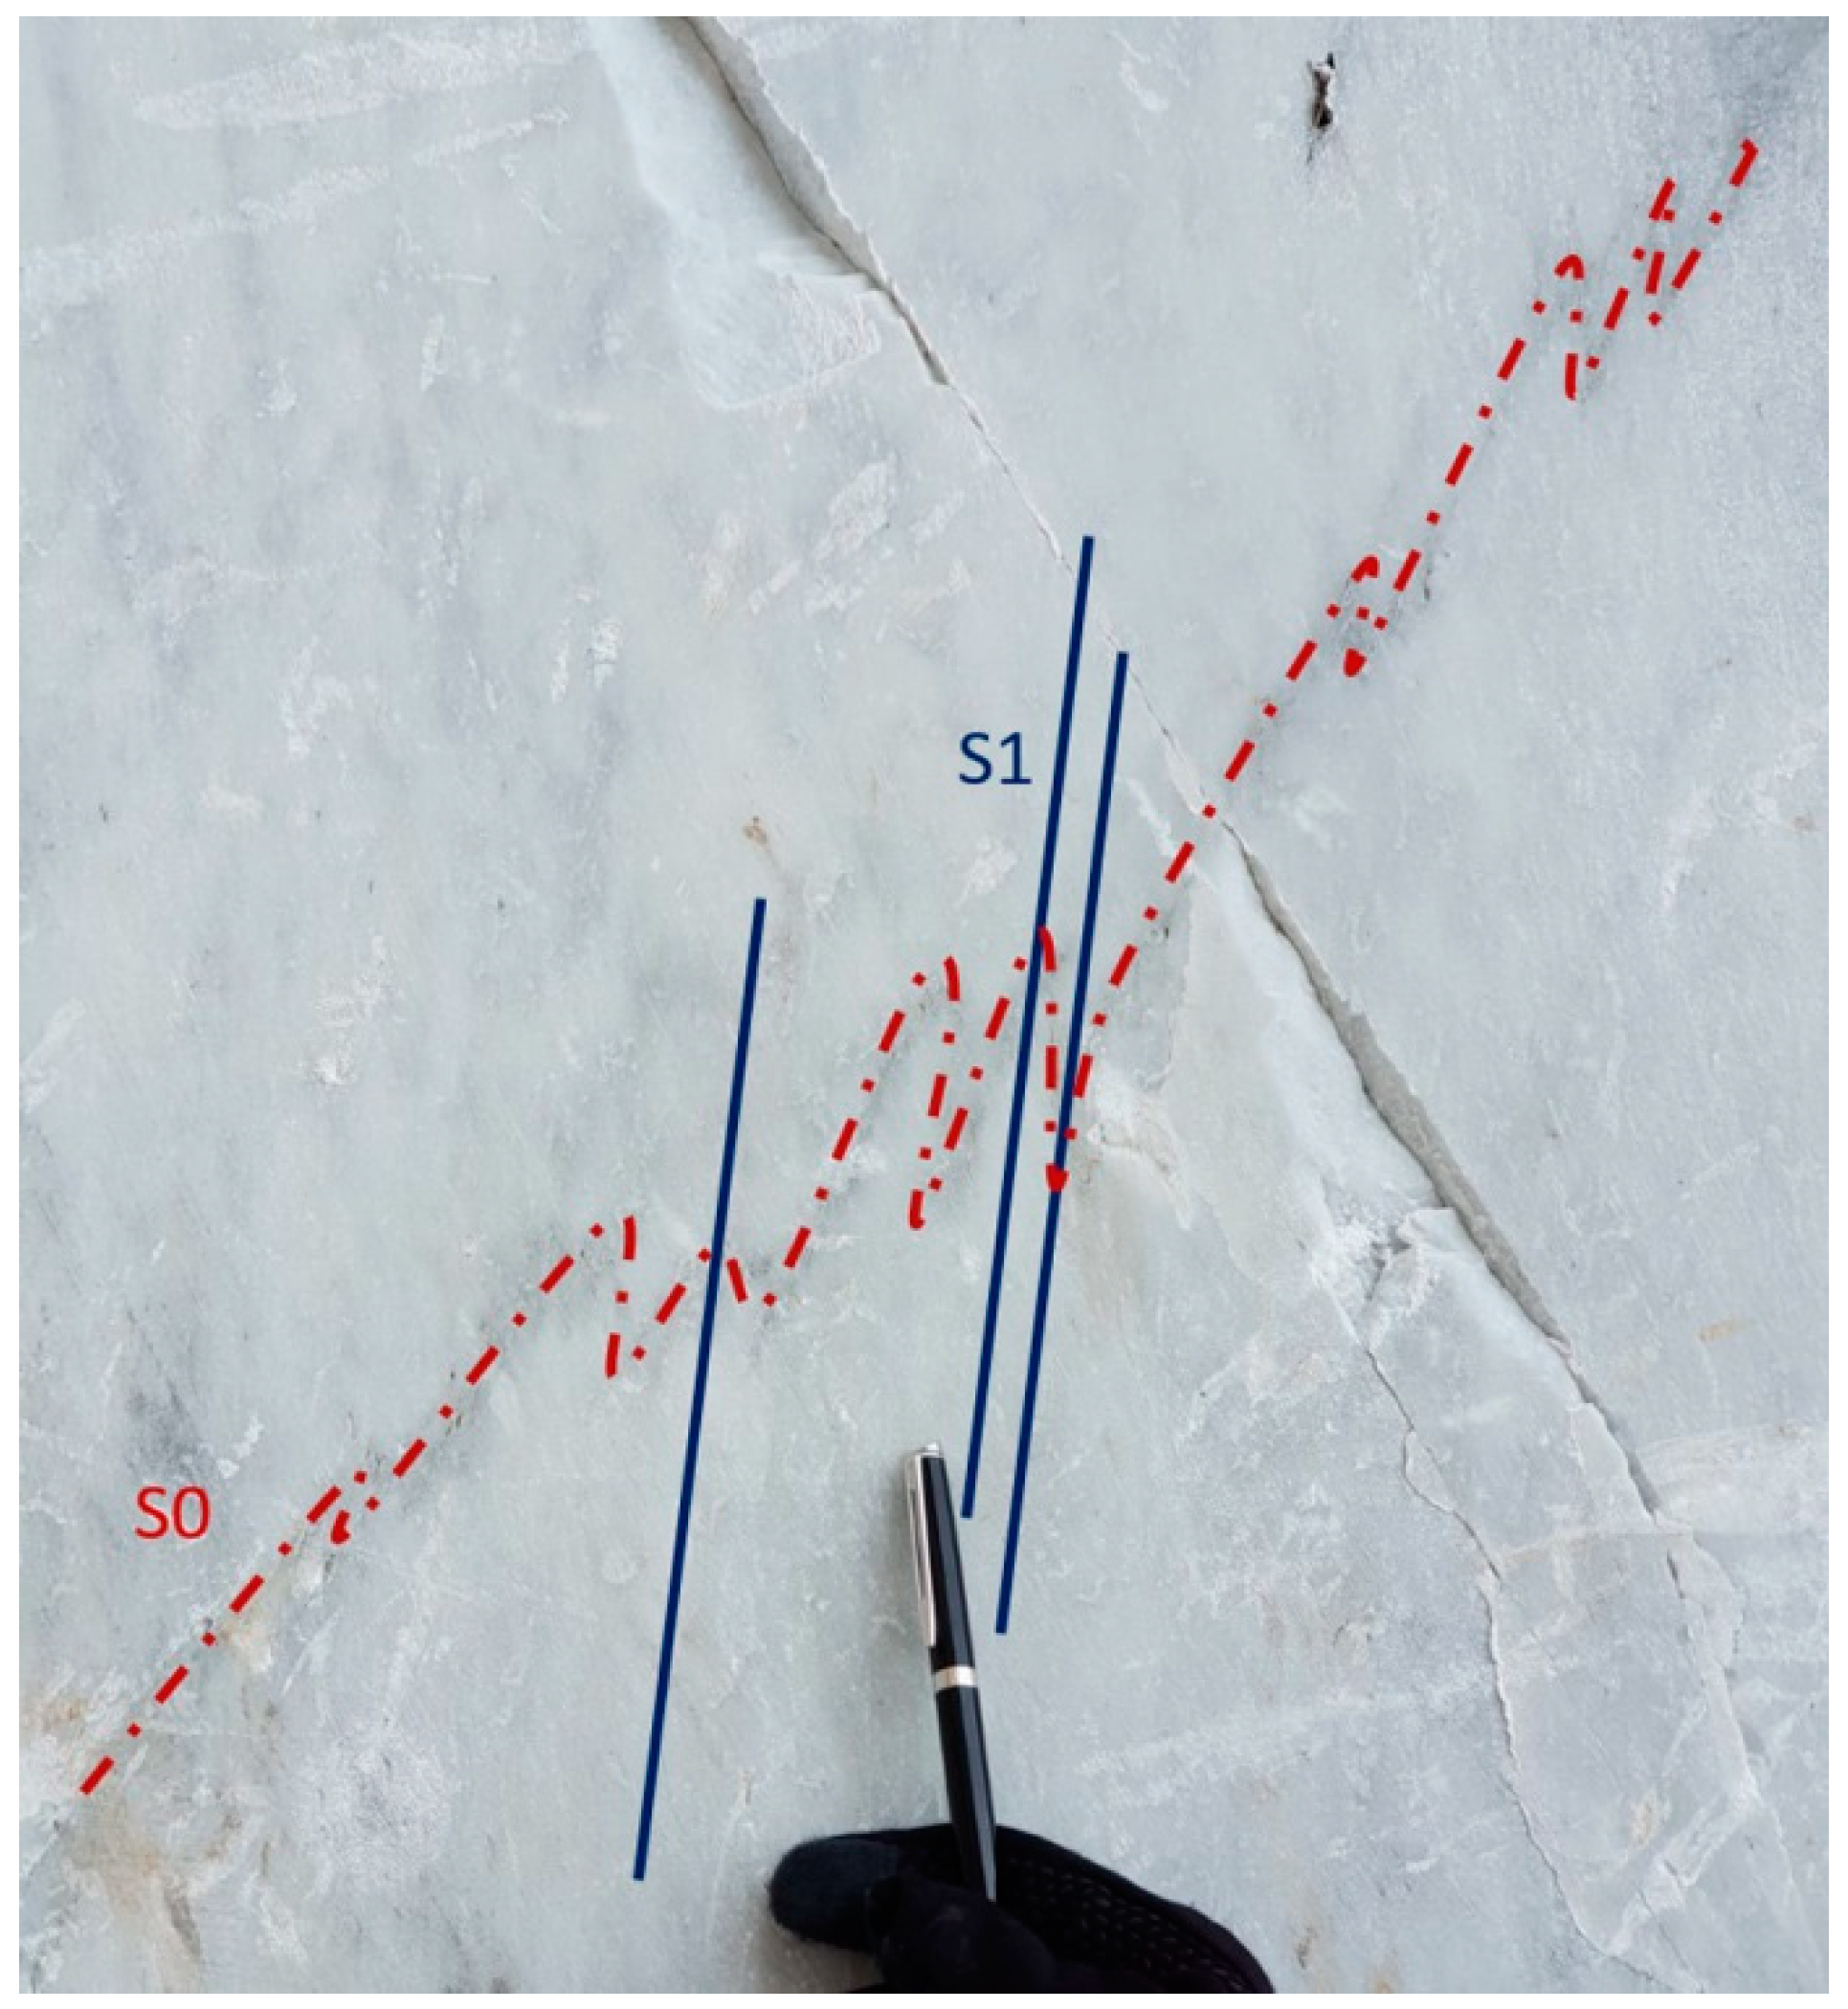
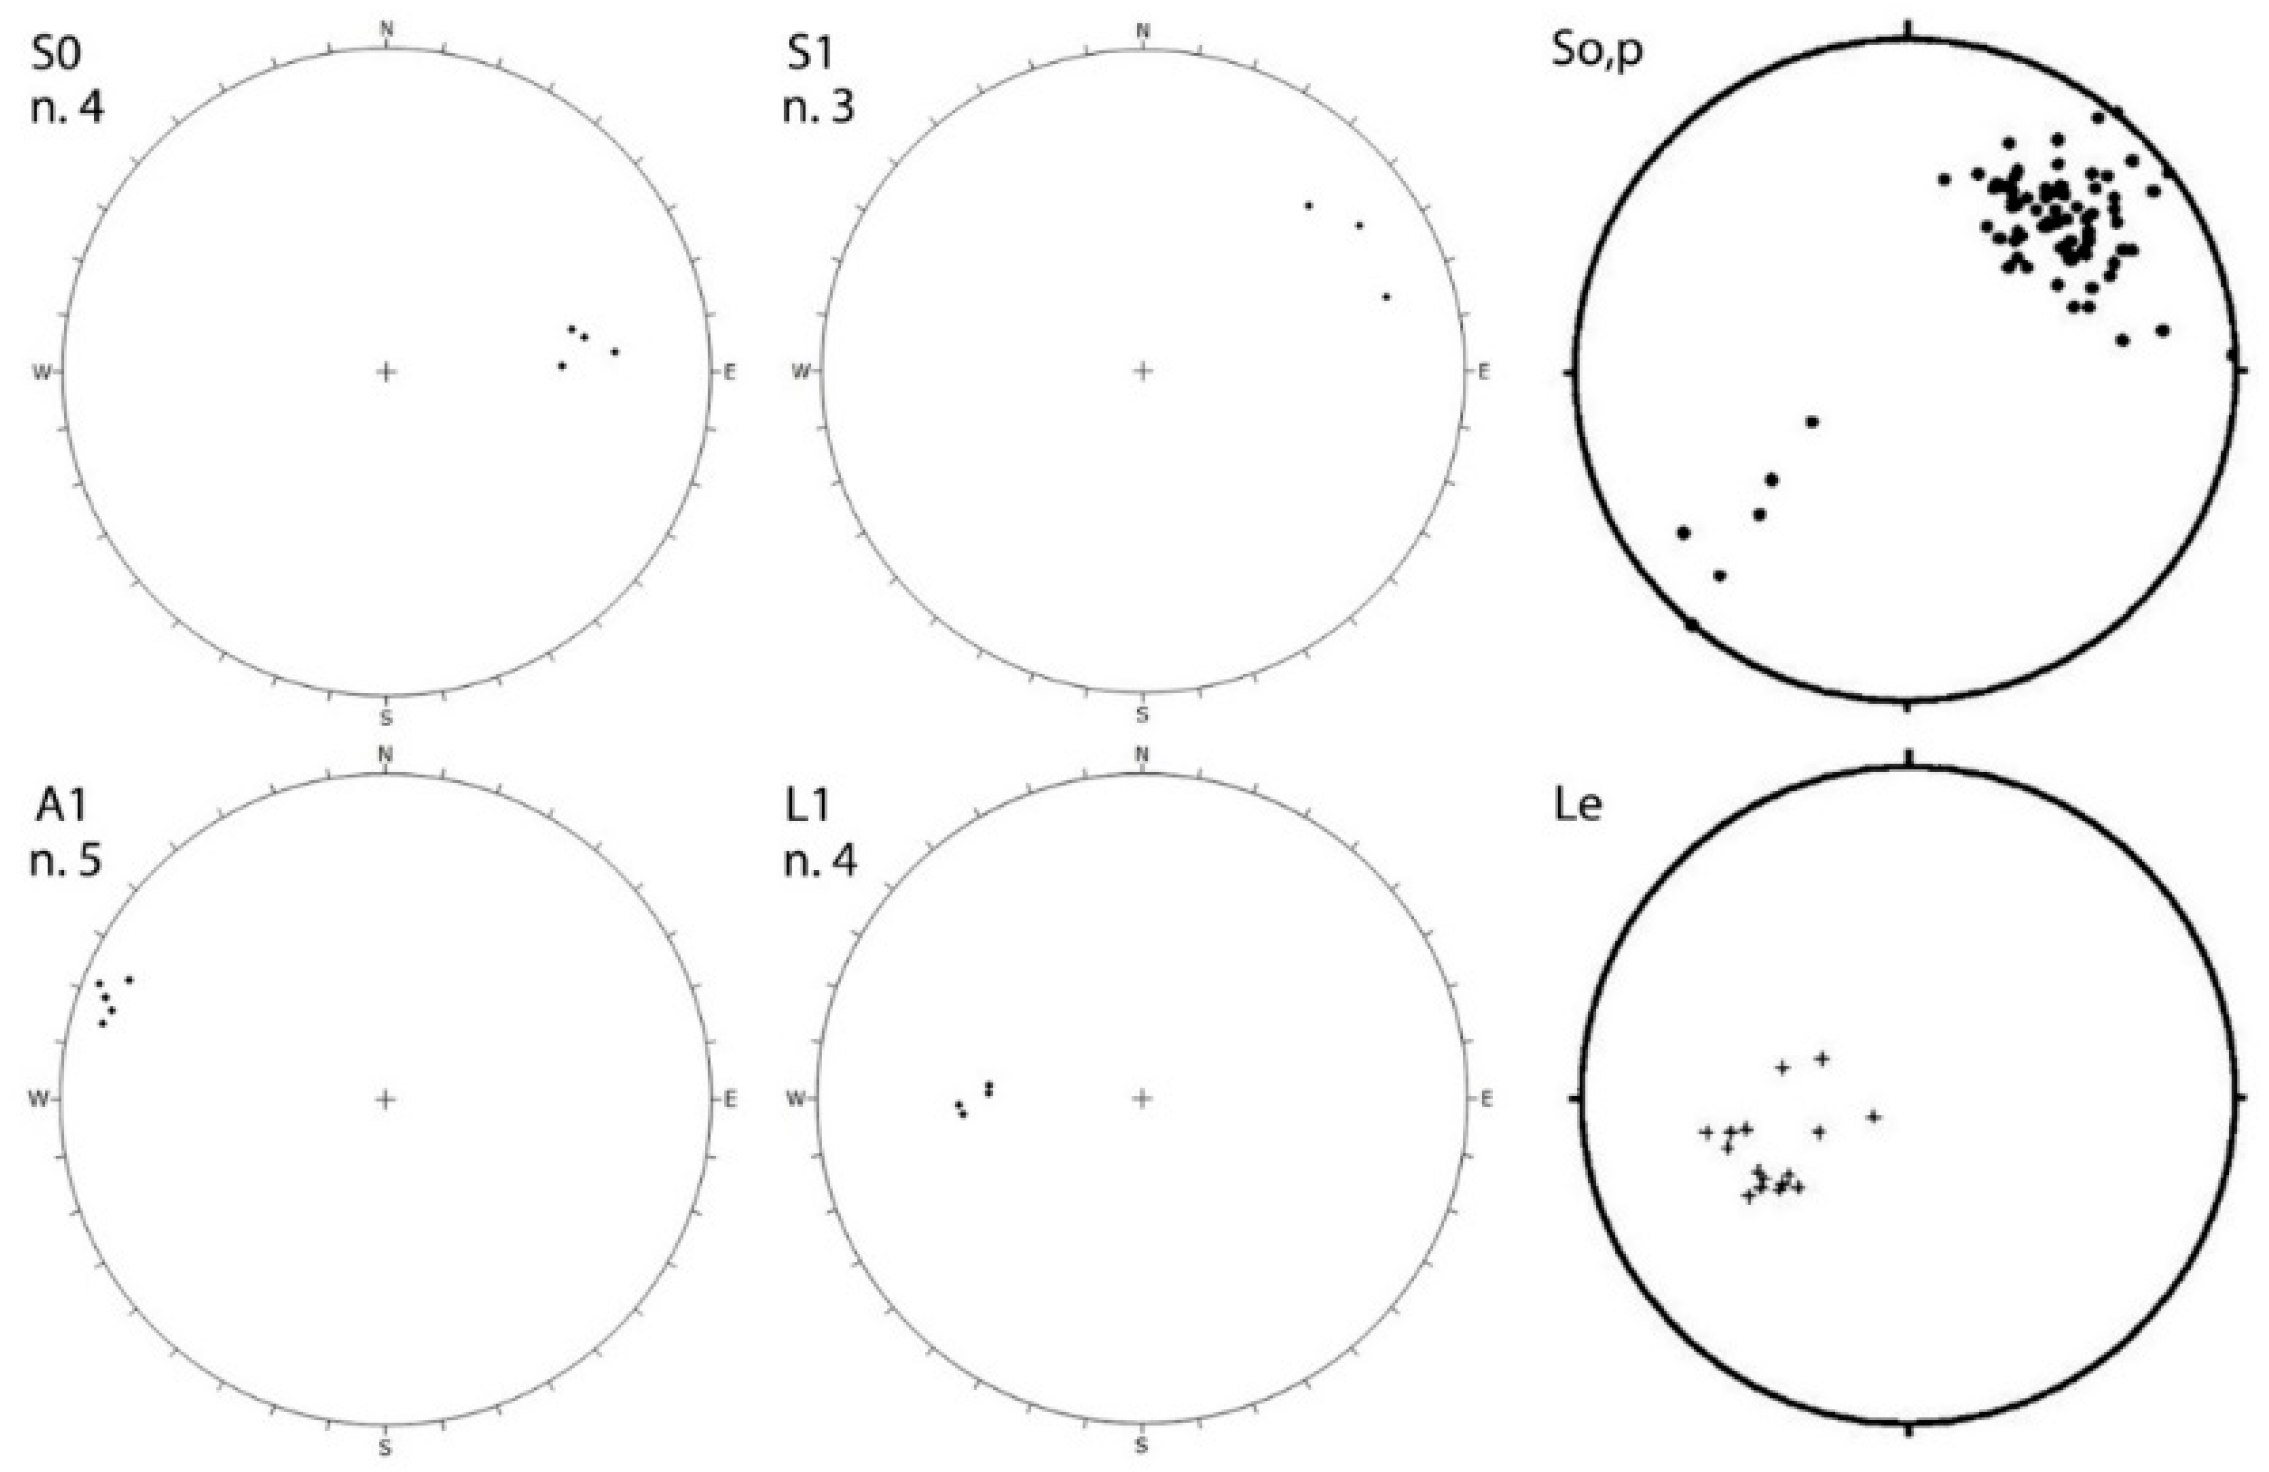
In the study area, D1 structures are present in the marble (
Figure 4): here, the sedimentary bedding (S0) is folded and crosscut at medium-high angle by a penetrative S1 foliation, oriented NW-SE and dipping at high-angle toward SW (
Figure 5). On this foliation, a L1 mineral lineation plunges at medium angle toward W-SW. These data are in good agreement with results obtained by Molli et al. [
57] in the Apuane Unit (
Figure 5).
Early D2 deformation structures are not present in the study area. Late D2 deformation is associated with the development of a network of joints, fractures and faults (
Figure 6) under brittle conditions. Faults show mainly a strike-slip kinematic and, in places, also a minor normal component.
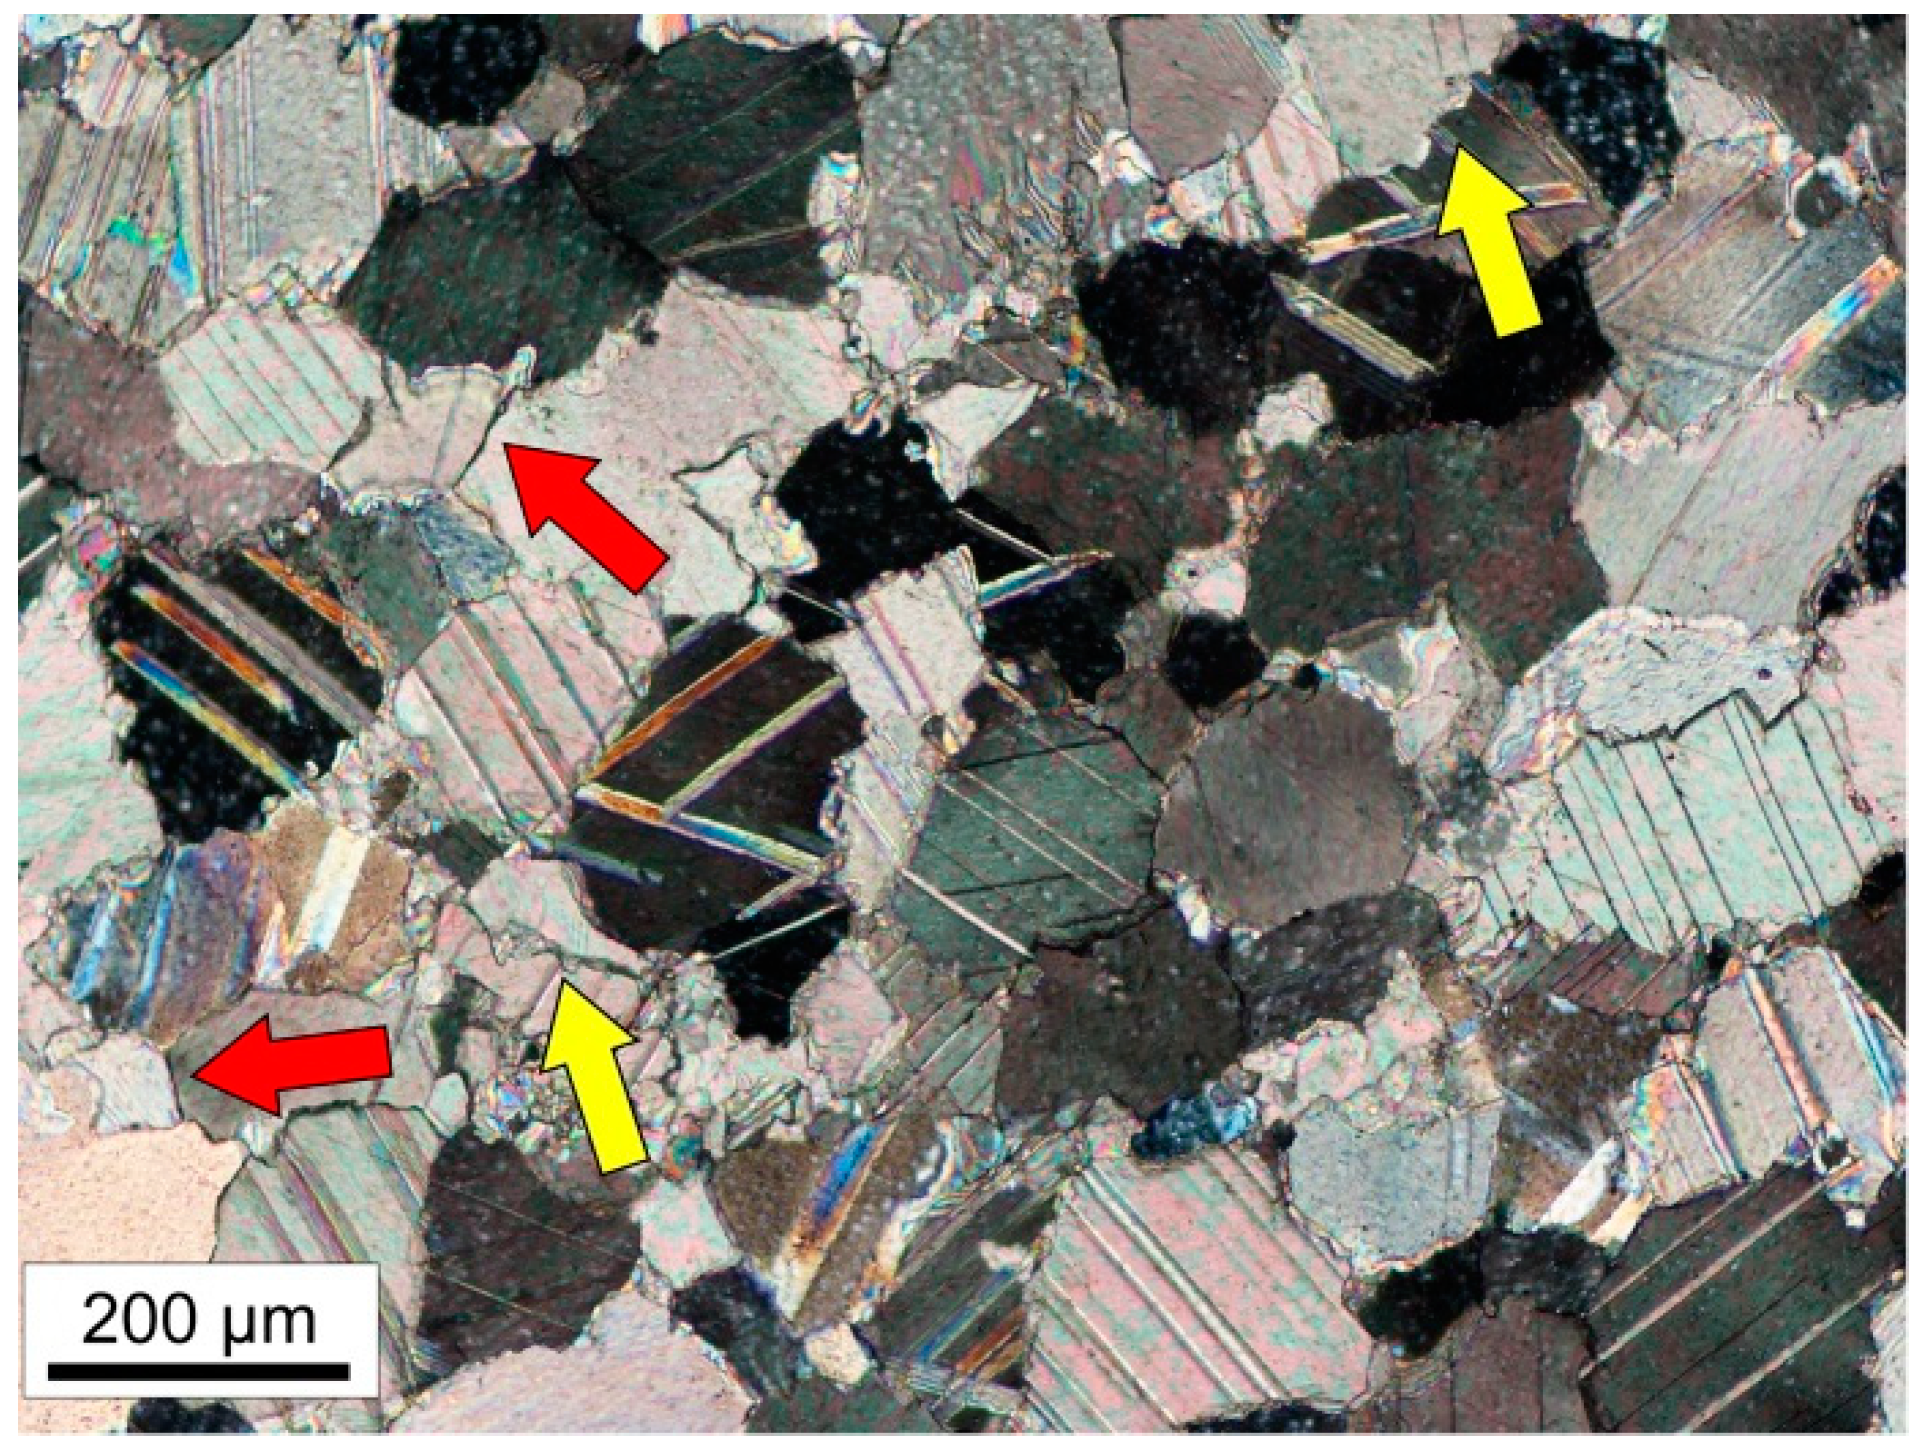
Microstructural analysis of the studied marbles highlights a granoblastic and isotropic structure. In some cases, crystals present straight grain boundaries while in other cases the grain boundary is lobed (
Figure 7). Those features are indicative of a late- or post-D1 static recrystallization.
4. Materials and Methods
4.1. Geomechanical Survey
For the purposes of cataloguing and characterization of the discontinuity sets, a geomechanical survey campaign was performed according to ISRM standards [
2], describing all the discontinuities intersecting a scanline. Moreover, bibliographic data by Lorenzoni [
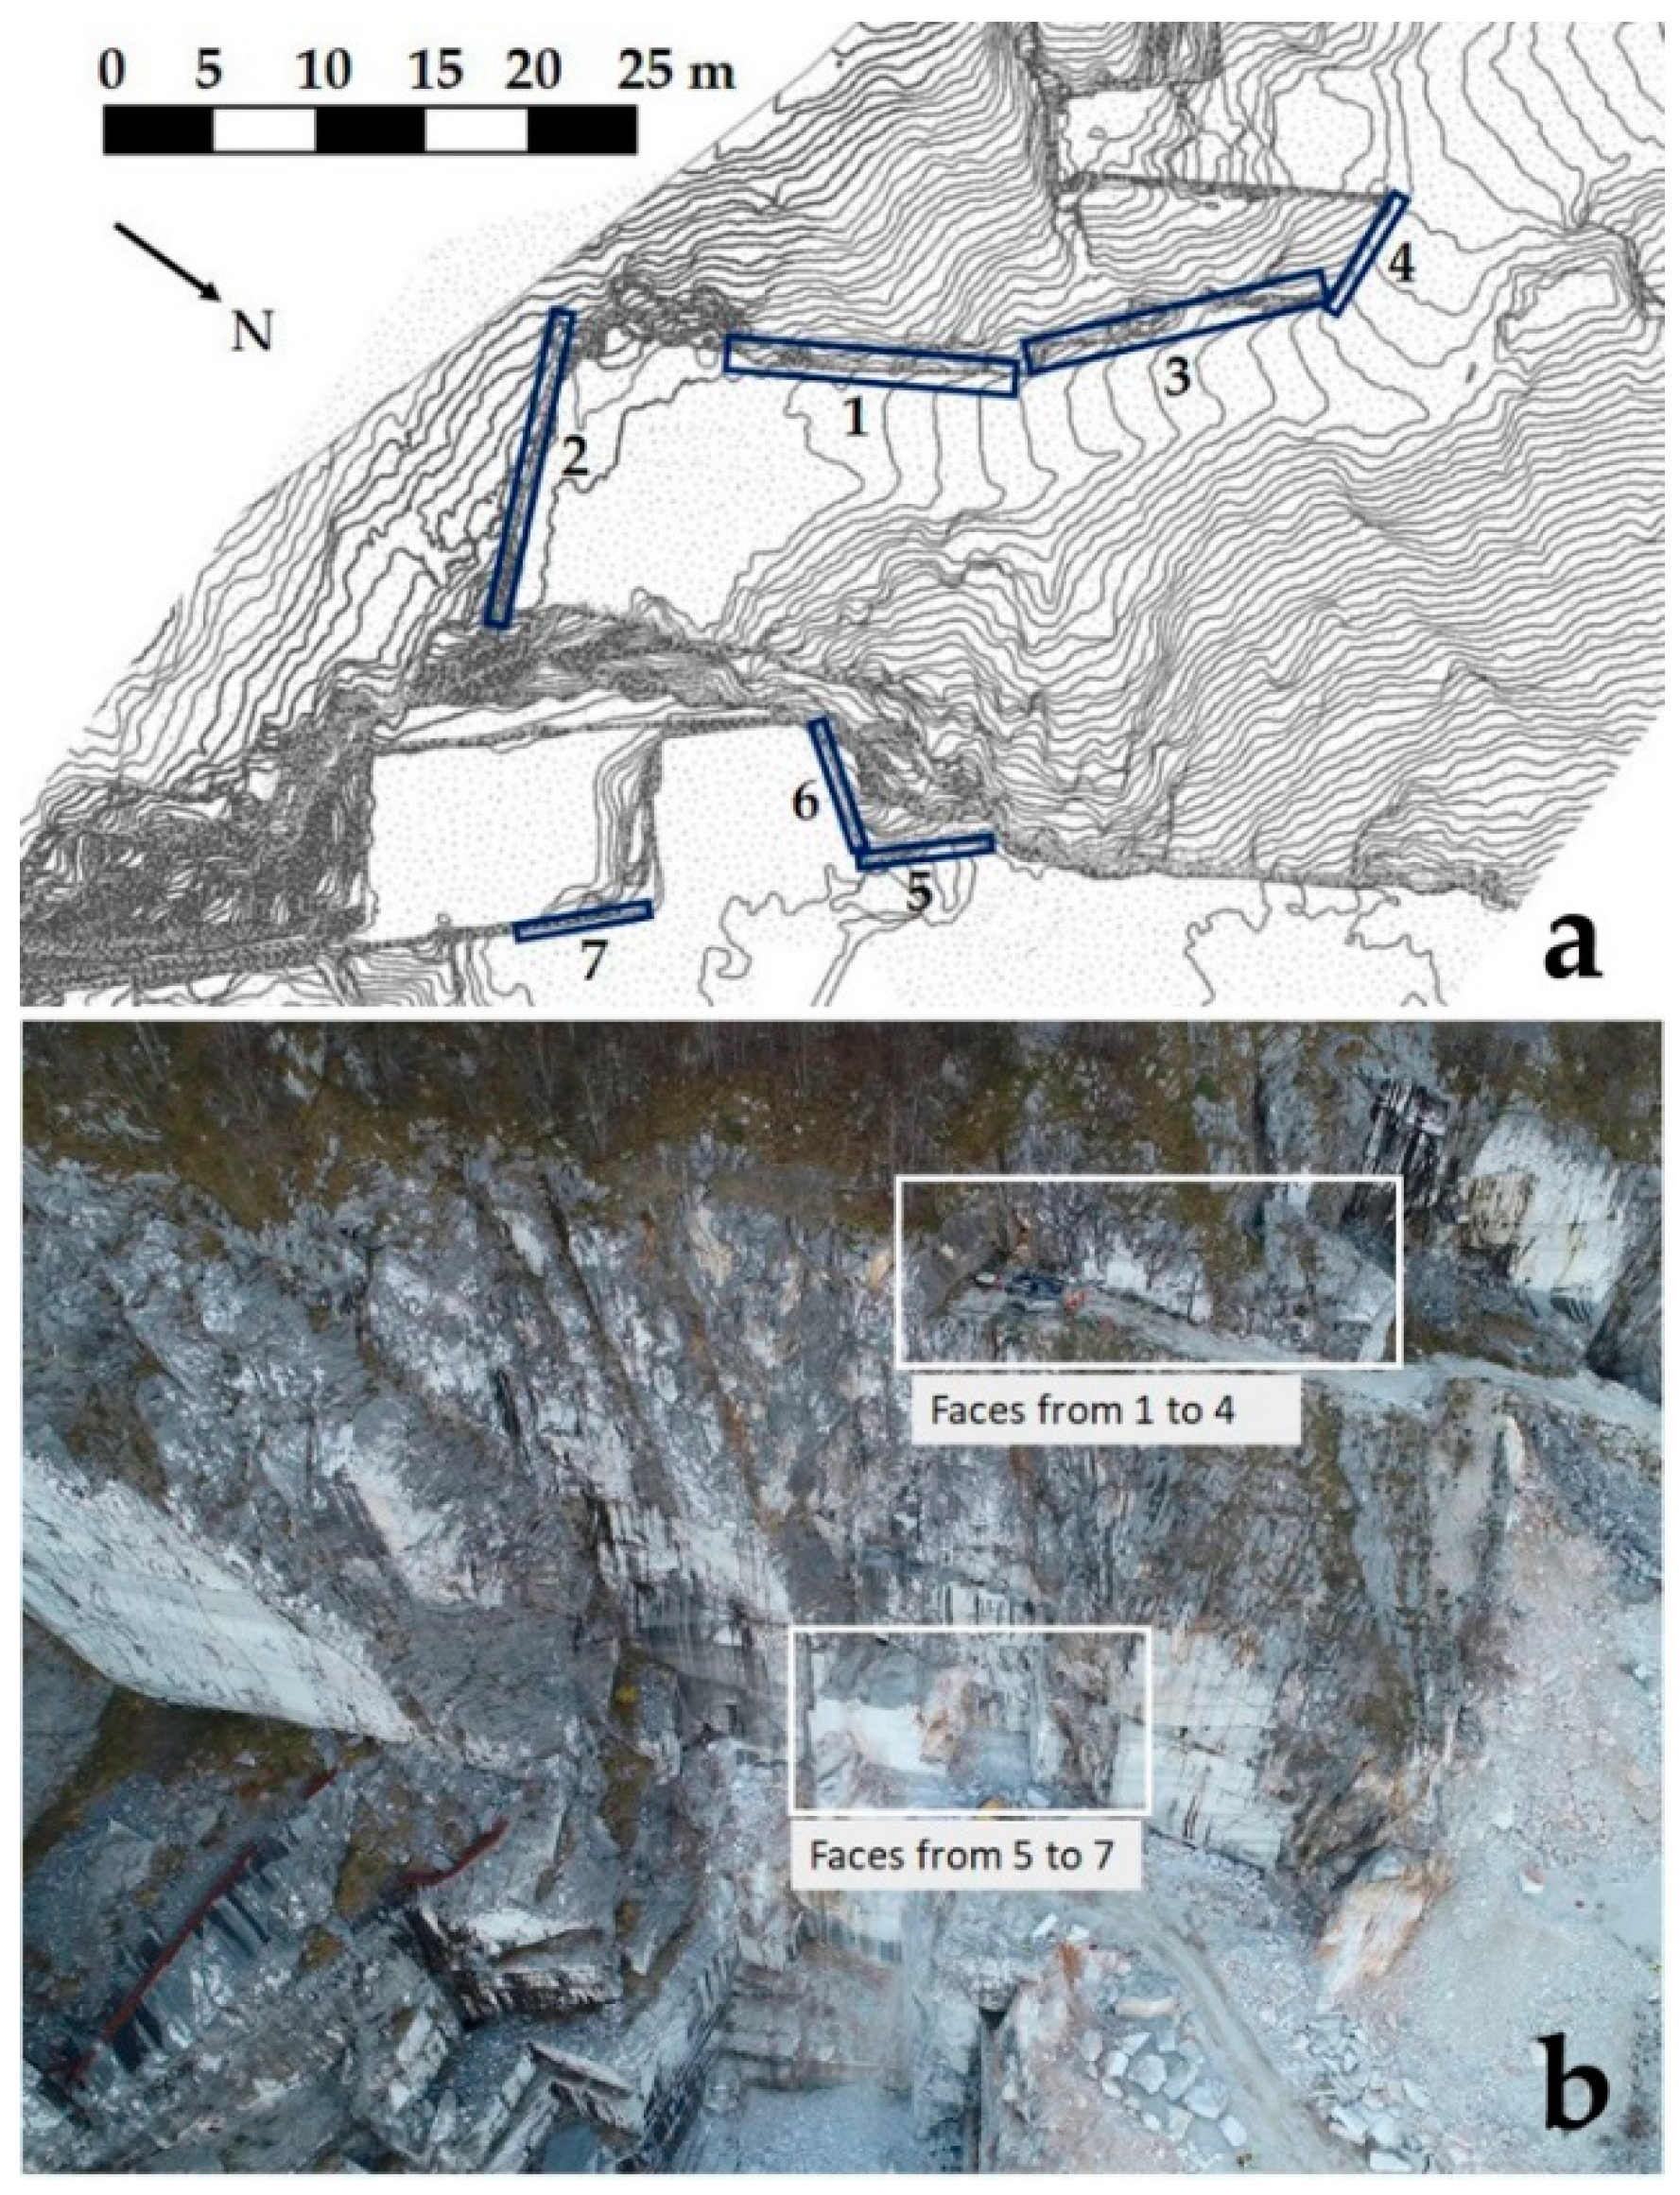
58] were utilized for comparison. Seven traditional surveys along horizontal scanlines were performed, of which four were on excavation faces in the upper portion of the quarry, located at about 1260 m a.s.l. and three in the intermediate part at 1224 m a.s.l. (
Figure 8).
4.2. Non-Contact Survey
Non-contact techniques are based on the setting up and elaboration of 3D models, each consisting of a dense cloud of points representing the area of study. Many digital image sequences were shot, both from remotely piloted aircraft and from the ground, covering all the quarry area. The technical specifications of the instrumentation are reported in
Table 1. Digital image sequences were processed by the photogrammetric software Photoscan [
59]: this code is based on Structure from Motion algorithms and is able to reconstruct the surface of the photographed object, by calculating the tridimensional coordinates of the points of the surface, and to assign a colored texture to the surface. Point clouds, namely sets of 3D points representing, in this case, portions of rock mass surface, were created and georeferenced, namely referred to the chosen reference system, by inputting the coordinates of points acquired by GPS.
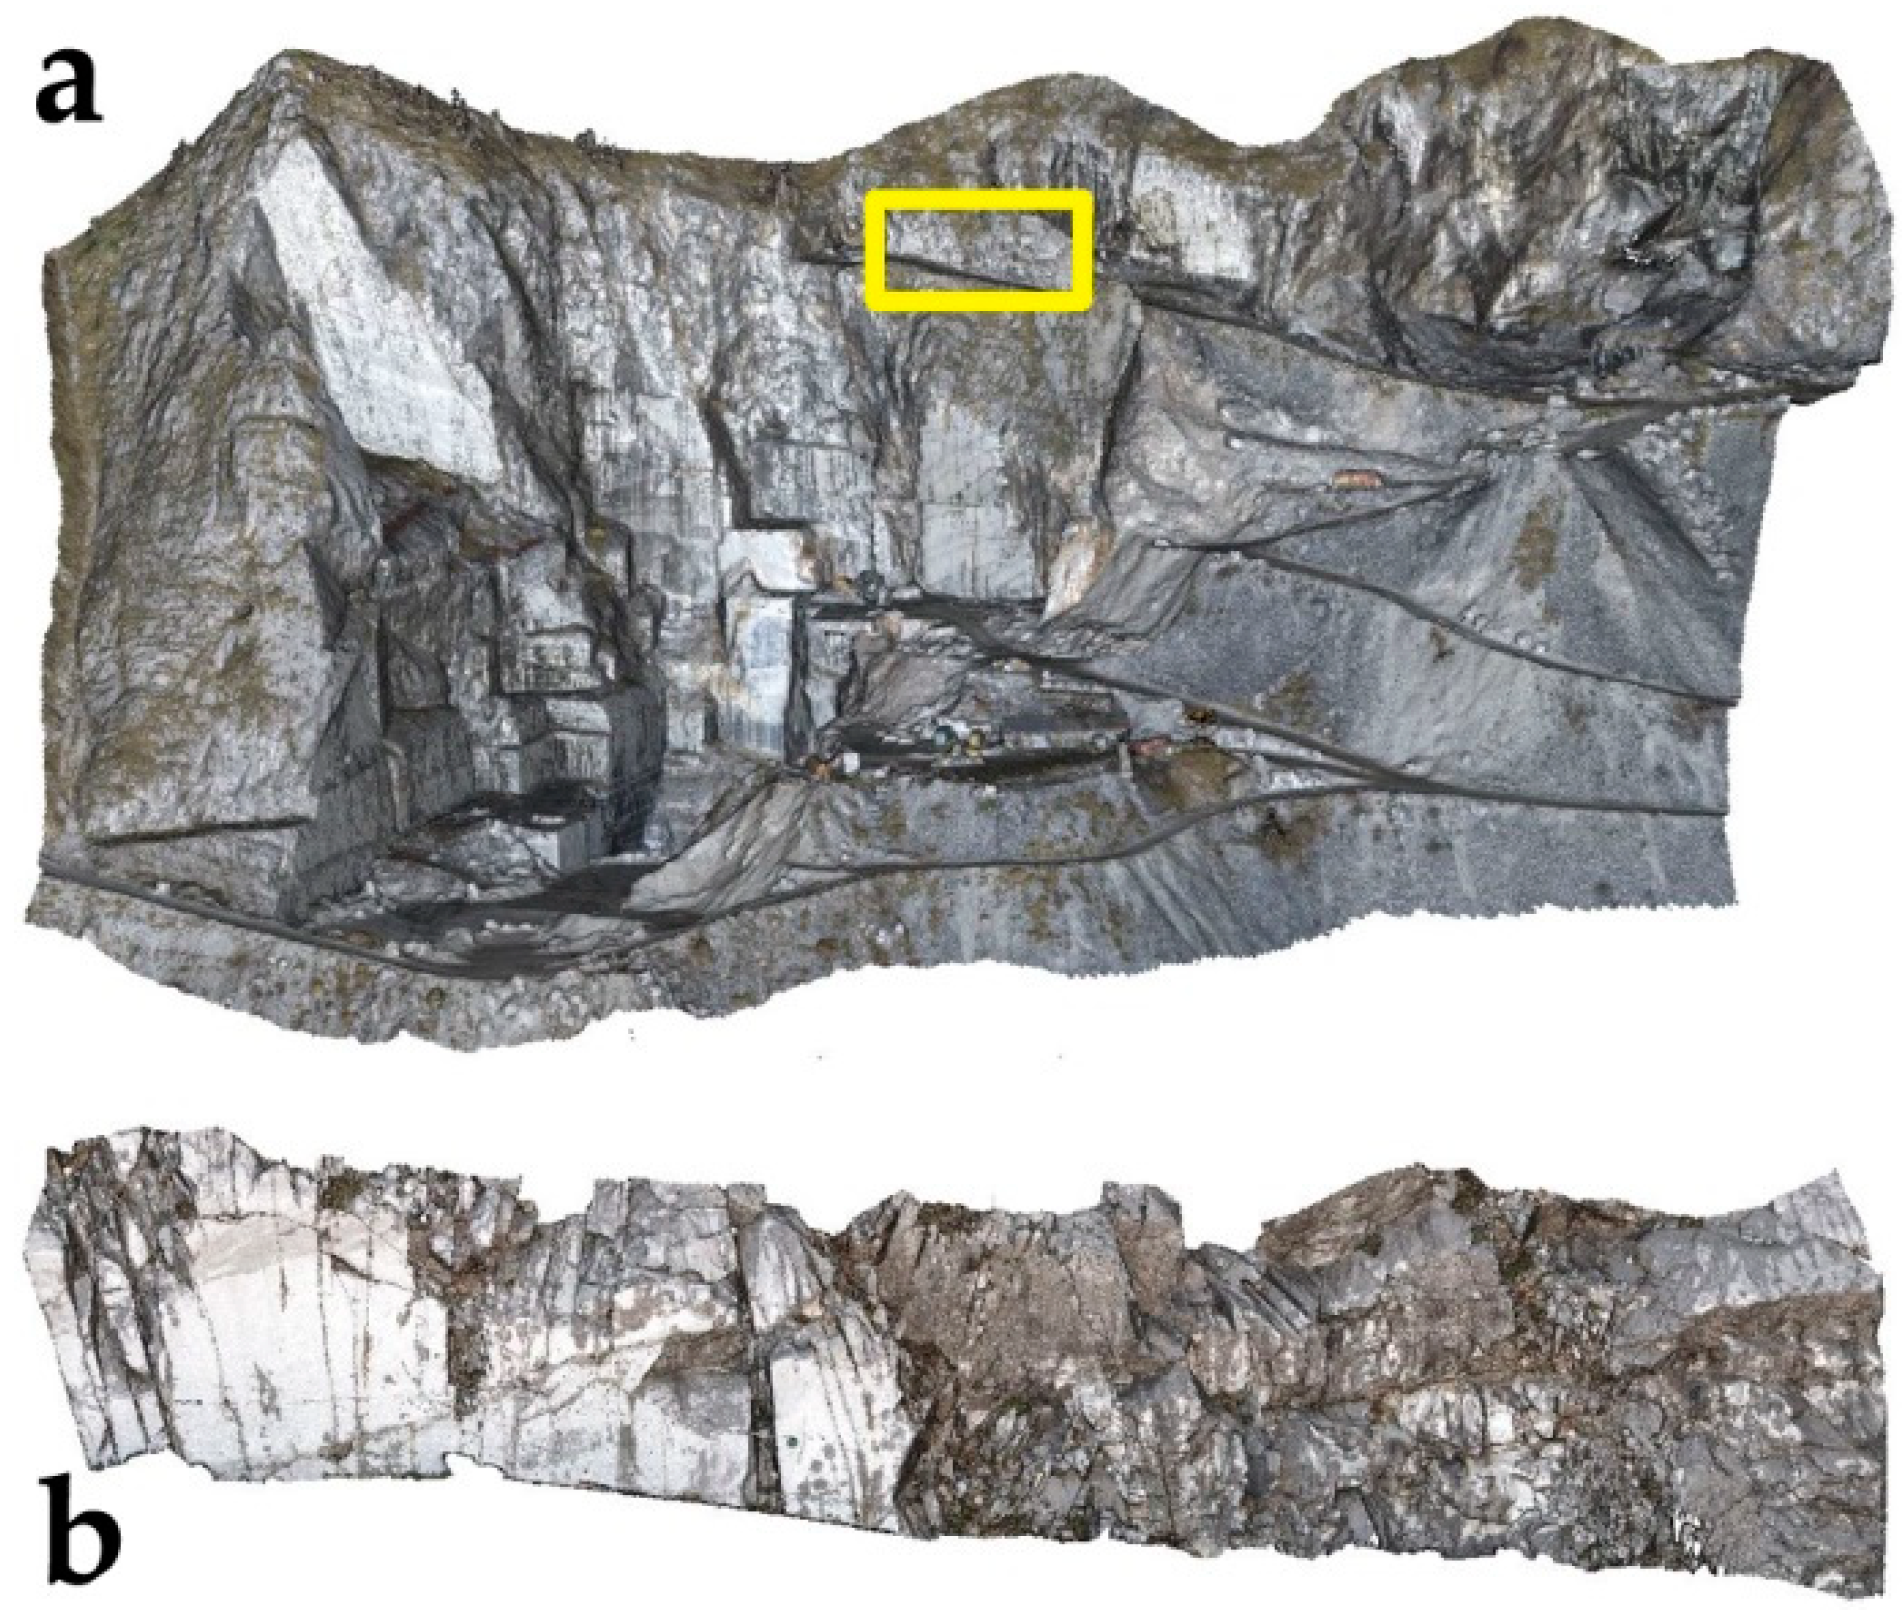
Specifically, two point clouds were provided: the first one represents the entire quarry (
Figure 9a) and was obtained from digital images shot by a camera carried by a drone; dimensions of the point cloud are about 350 × 250 × 160 m, with a total of 11,117,143 points and an average resolution of 1 point every 0.1 m.
The second point cloud (
Figure 9b) represents with a higher degree of detail the studied bench, positioned at about 1260 m a.s.l., and includes excavation faces 1 and 3 (
Figure 8). It was created by means of close-range images shot from the ground; the point cloud in this case is very similar to a plane of about 28 × 10 m, with a total of 1,439,000 points and an average resolution of 1 point every 0.01 m.
The models were analyzed using CloudCompare [
60], in particular with the Trace tool included in qCompass plugin. This tool allows the user to manually draw a segment connecting two points of the point cloud in order to automatically obtain its orientation in terms of trend and plunge. Along the excavation face discontinuity traces, namely intersections between the plane of the face and discontinuity planes, are outlined as segments and their orientations plotted on a stereonet. The procedure was repeated both in the case of the excavation face in detail (separated into two portions representing excavation faces 1 and 3, respectively, characterized by different degrees of fracturing) and the entire quarry.
4.3. Stability Assessment
Once the main discontinuity sets are known, it is possible to perform a stability analysis along the different excavation faces. The first step is a kinematic analysis, using the Markland Test [
61] as modified by Hudson and Harrison [
62] in order to identify along which discontinuities potential kinematic mechanisms may arise. In this case, the test was carried out with respect to planar and three-dimensional (wedge) sliding by means of Dips software [
63]. Planar sliding occurs in rock masses where a discontinuity set has an average dip direction similar to the slope face dip direction. Wedge sliding occurs when two discontinuity surfaces intersect on a line, which has a dip direction coming out of the slope face. These geometric relationships, in addition to a dip value of plane (intersection, in case of wedge sliding) greater than friction angle, are the conditions for the verification of the test.
The factor of safety (FoS) was calculated for every joint set (or combination of sets, in case of wedge sliding) resulting in a positive response of the test on the considered fronts. FoS was calculated according to the limit equilibrium method (LEM) and is interpreted as the ratio between resisting forces FR that oppose the movement of a block and forces FA acting in favor of the kinematic motion.
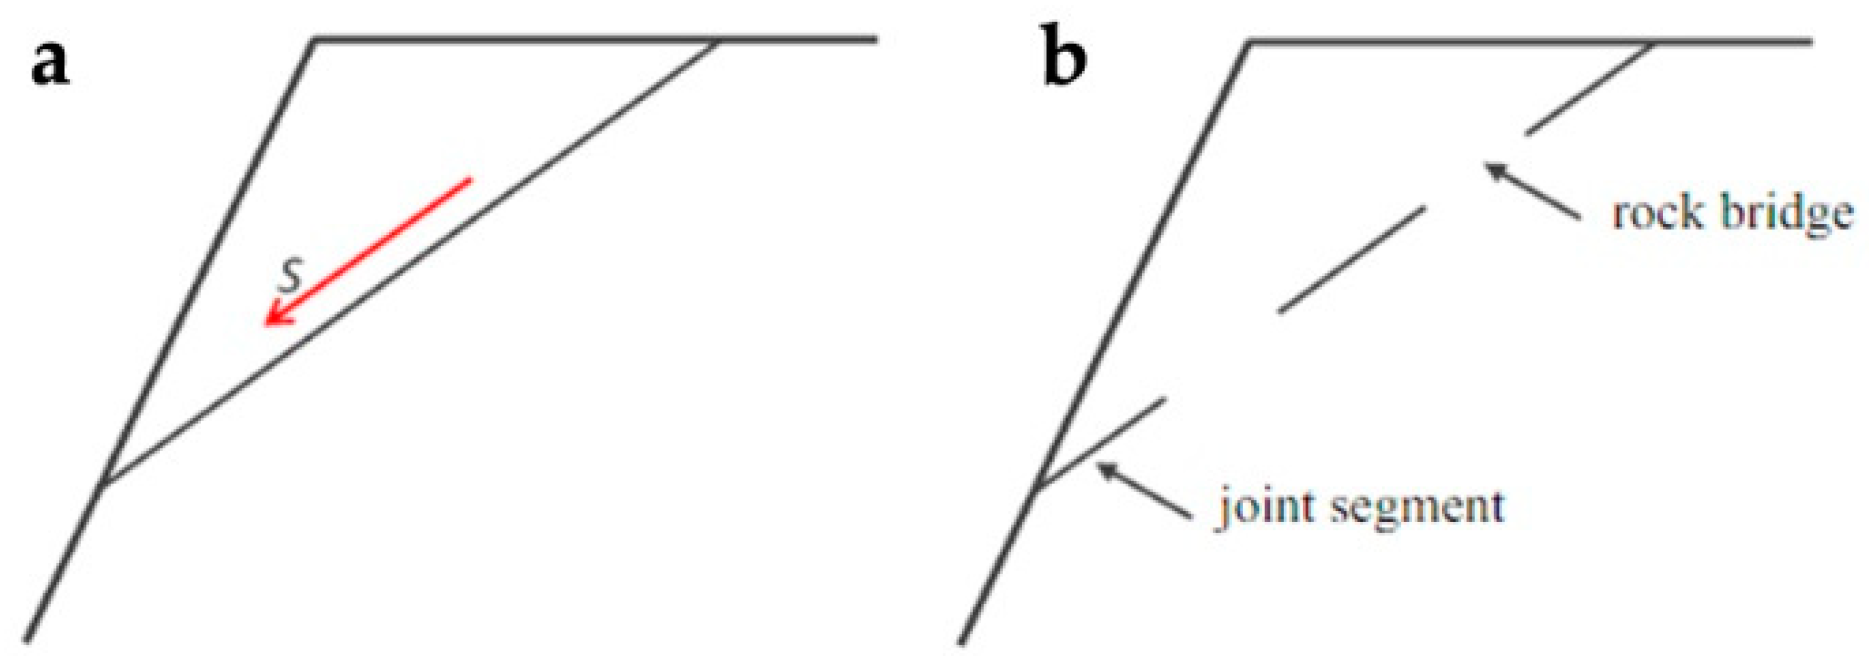
With respect to planar sliding, FoS was calculated according to three resistance criteria:
Mohr-Coulomb criterion with fully (100%) persistent joint (
Figure 10a): in this case, the cohesion is considered null.
Mohr-Coulomb criterion with less than 100% persistent (therefore not fully persistent) joints, due to the presence of rock bridges, namely intact portions of rock that constitute a considerable resistant contribution.
The cohesion of the rock bridges, called apparent cohesion, is ideally spread along the entire discontinuity (
Figure 10b). Apparent cohesion c
app was assumed as a portion of intact rock cohesion c
int, ruled by persistence P as expressed by the formula:
Persistence P was assumed equal to the ratio between trace length measurable on an excavation face and the dimension of the face that is more similar to the direction of the discontinuity; trace length was determined with non-contact survey, in particular measuring, by means of CloudCompare, segments representing traces on point clouds.
- 3.
Barton-Bandis criterion [
64], which considers conditions of peak resistance and persistence of joints equal to 100%.
To improve confidence in the results, FoS with respect to planar sliding was calculated in two ways: the analytical method developed on a spreadsheet and RocPlane software [
66], theoretically based on the same calculation process. Equations adopted for the analytical model are the following ones [
45]:
FoS equations according to Mohr-Coulomb criterion in absence of cohesion and to Barton-Bandis criterion are geometric relationships given by the ratio between the tangent of residual (Φr) and peak (Φp) friction angle, respectively, and the tangent of inclination (dip) of the discontinuity (α), while in case of Mohr-Coulomb criterion with presence of cohesion, the area of sliding surface (A) and the weight of sliding block (W) are also involved.
FoS with respect to wedge sliding was calculated considering two different situations: in the first one, persistence of joints is equal to 100% and cohesion is zero (Equation (5)), while in the second one, persistence is less than 100% and there are rock bridges producing a certain apparent cohesion (Equation (6)). The following formulas were applied [
45]:
In addition to volume weight of the rock (γ) and height of the front (H), apparent cohesion of the two discontinuity planes A and B (c
appA and c
appB) and their residual friction angles (Φ
rA and Φ
rB) are of considerable importance; coefficients A, B, X, and Y depend on the geometry of the wedge [
45]. To improve confidence in the results, FoS values are calculated using two approaches: the analytical method developed on a spreadsheet and Swedge software [
67], theoretically based on the same calculation process.
5. Results and Discussion
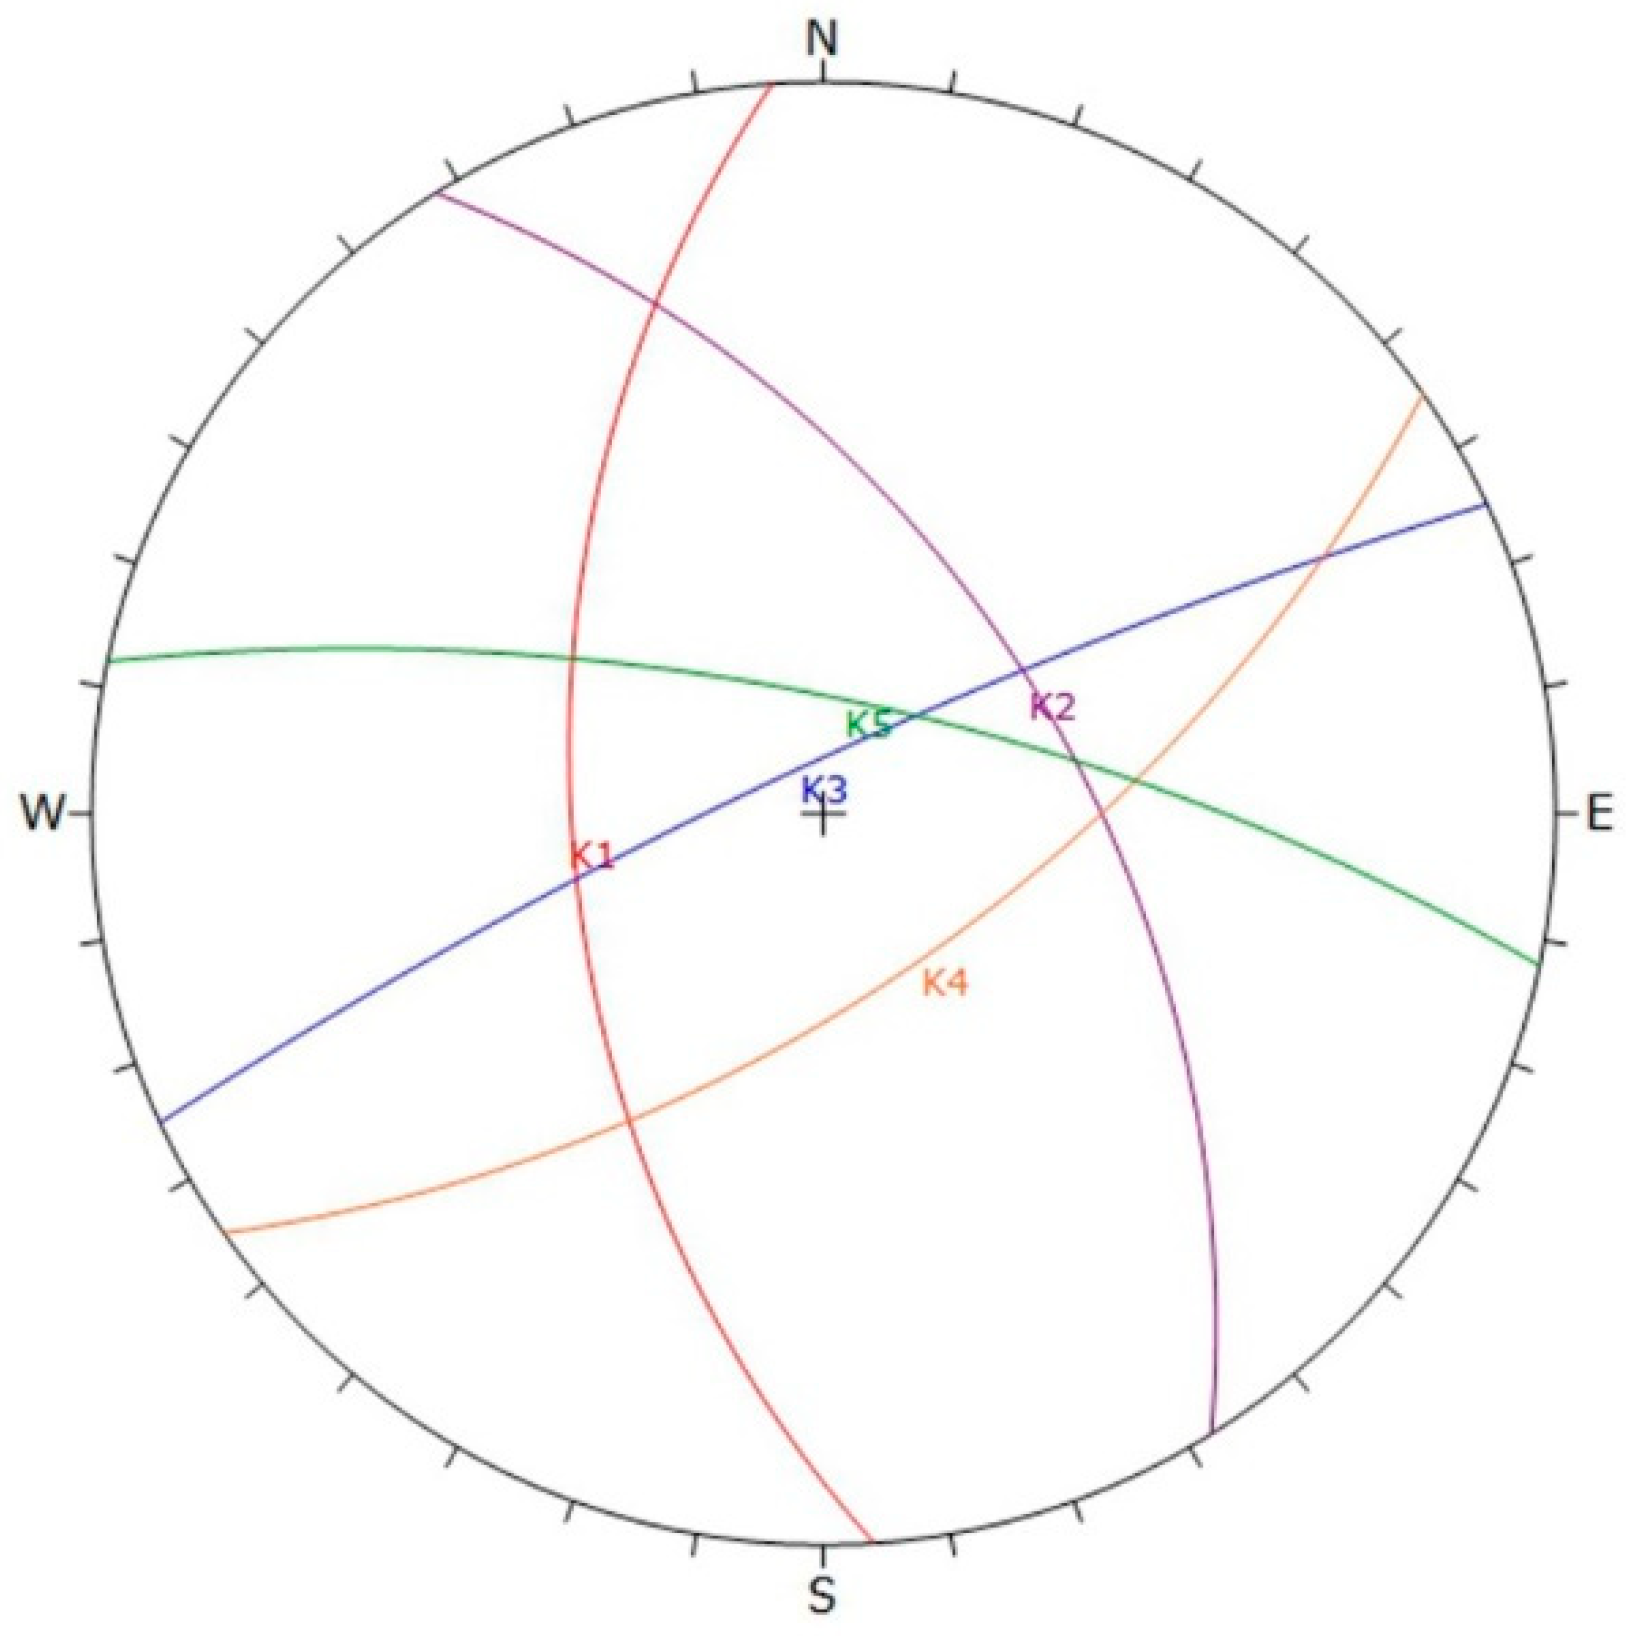
5.1. Identification of the Main Discontinuity Sets
Discontinuities orientation data, obtained with the compass along seven scanlines, each materialized on a different excavation face (
Figure 8), were plotted on stereonets by means of Dips software [
63]. Five main sets of discontinuities were obtained, and then compared with those described by Lorenzoni [
58]. This comparison led to the confirmation of the obtained results: sets are reported in terms of ranges of variability of dip and dip direction (
Table 2) and represented in
Figure 11.
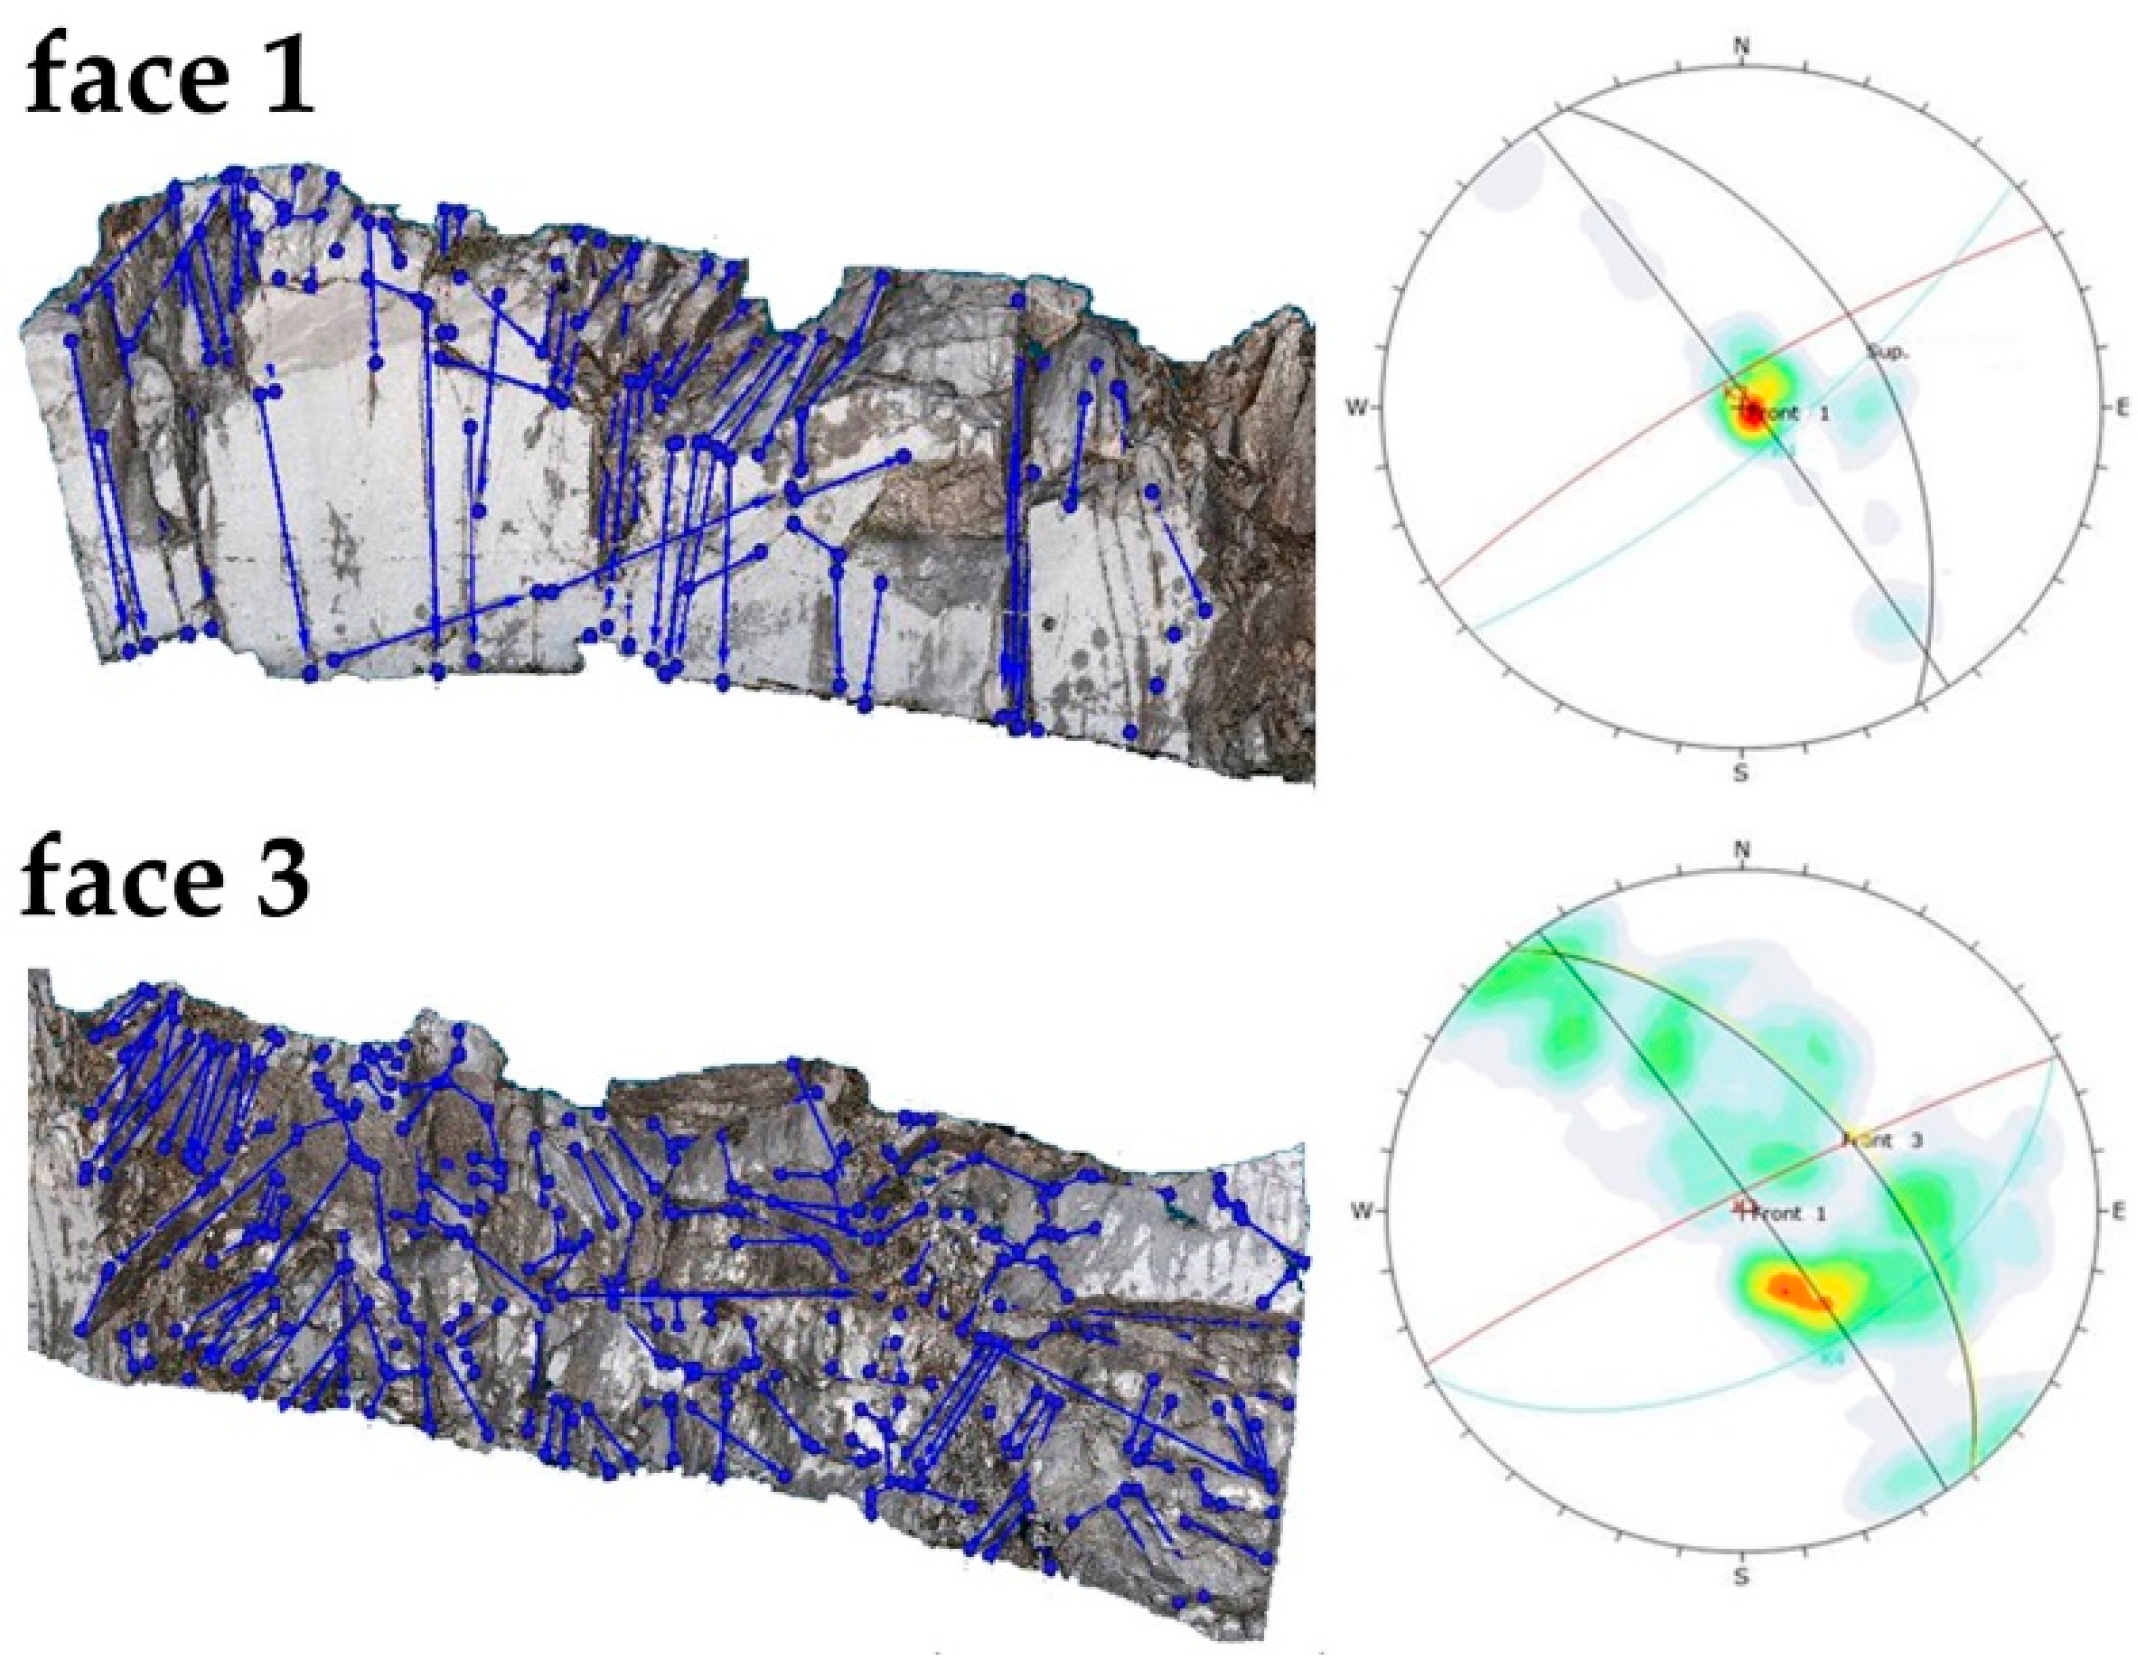
5.2. Traces Identification
The process of identification of discontinuity traces by means of the Trace tool, included in qCompass plugin of CloudCompare [
60], was performed on point clouds representing excavation faces 1 and 3. Traces were outlined manually drawing segments that followed trace paths: the result associated to each segment is its orientation expressed in terms of trend/plunge. By representing the orientation data on stereonets and performing a cluster analysis, the authors were able to identify sets K3 and K4 in the portion of the point cloud representing excavation face 1 and K2-K3-K4 sets in the one representing excavation face 3 (
Figure 12).
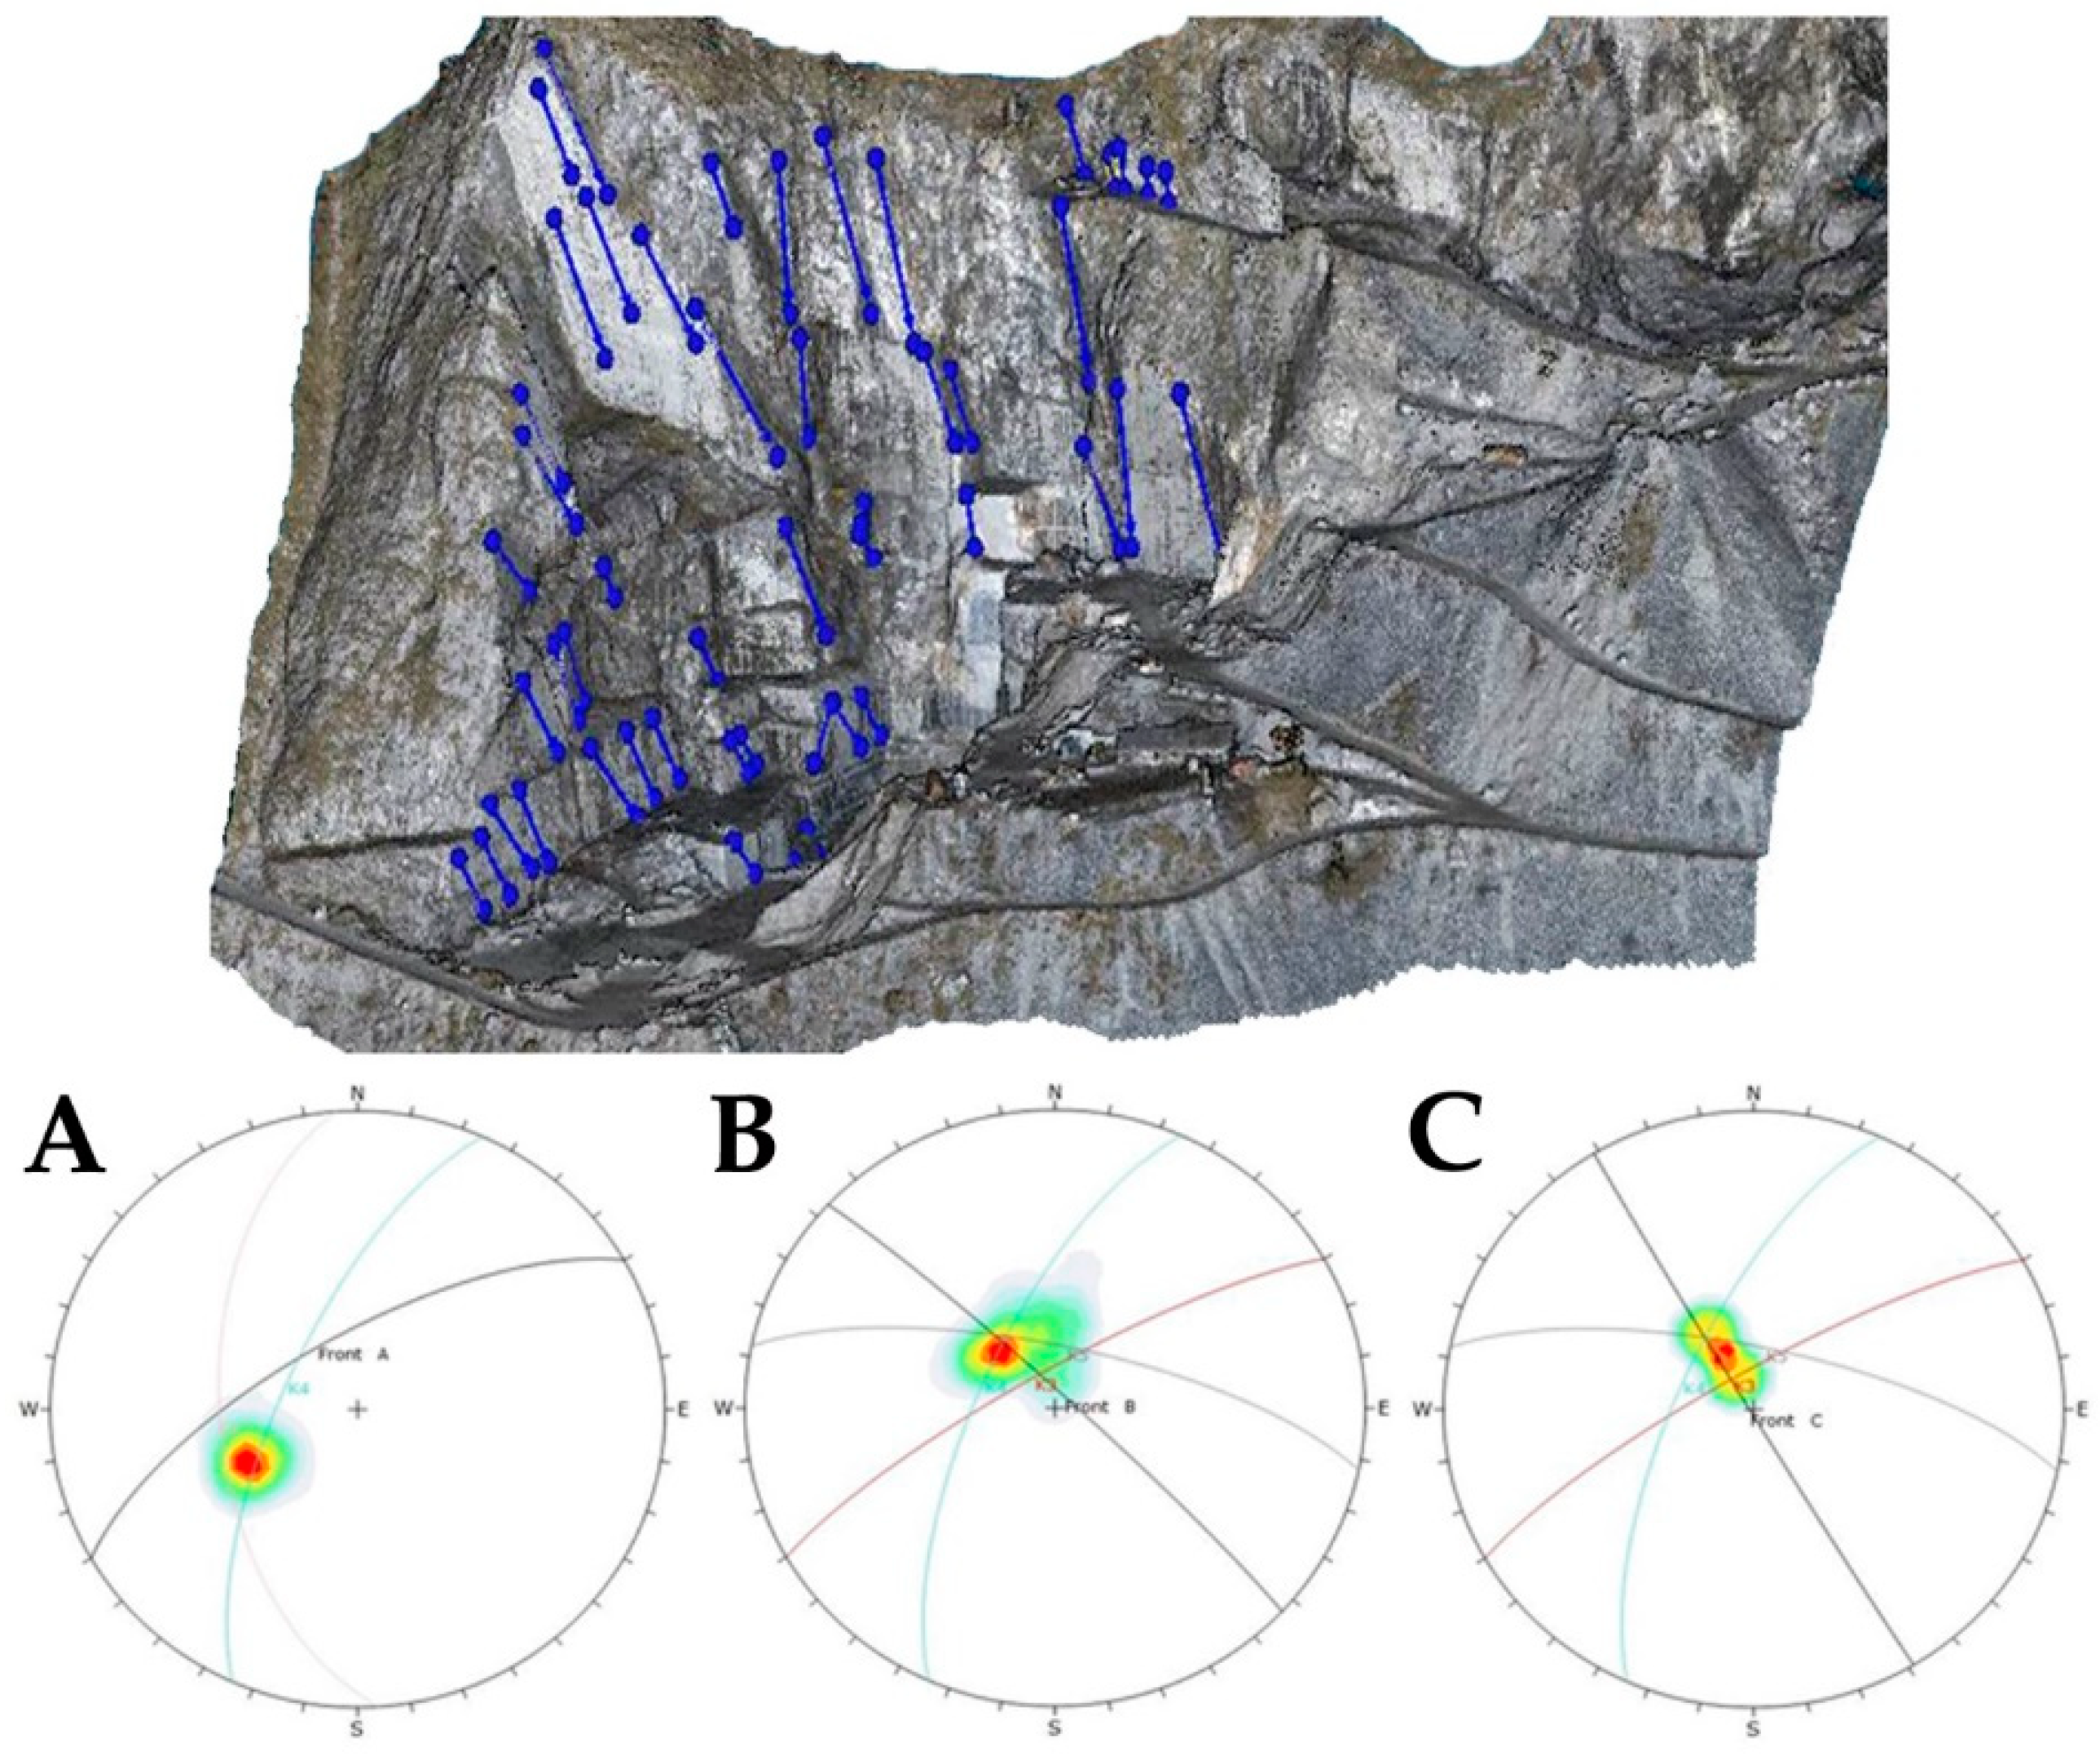
Regarding the model of the entire quarry, having a lower resolution, only the most significant discontinuities along three excavation faces named A, B, and C were considered (
Figure 13). Sets K1 and K4 were found in face A, while in the other faces, sets K3, K4, and K5 were identified.
5.3. Stability Analysis
The results of the kinematic analyses performed following the modified Markland test are reported in
Table 3 and
Table 4. This kind of analysis only indicates the susceptibility of a front with respect to a certain failure mechanism, because the test is based only on geometrical and frictional conditions. Therefore, no indications regarding the probability of occurrence, when or where it can occur are given. However, in a peculiar environment such as a marble quarry, in which there is a continuous change of the morphology, this kind of stability assessment is fundamental in order to understand which directions of excavation could involve instabilities.
Excavation faces resulted susceptible to planar sliding, mainly along discontinuities belonging to set K2, and to wedge sliding: different combinations among discontinuity sets were found to be able to potentially isolate wedges, depending on front orientation.
Thanks to traditional survey performed by the authors it was possible to obtain geotechnical parameters useful for calculating FoS, such as JRC (with a profile gauge or Barton’s comb) and JCS (with Schmidt hammer) (
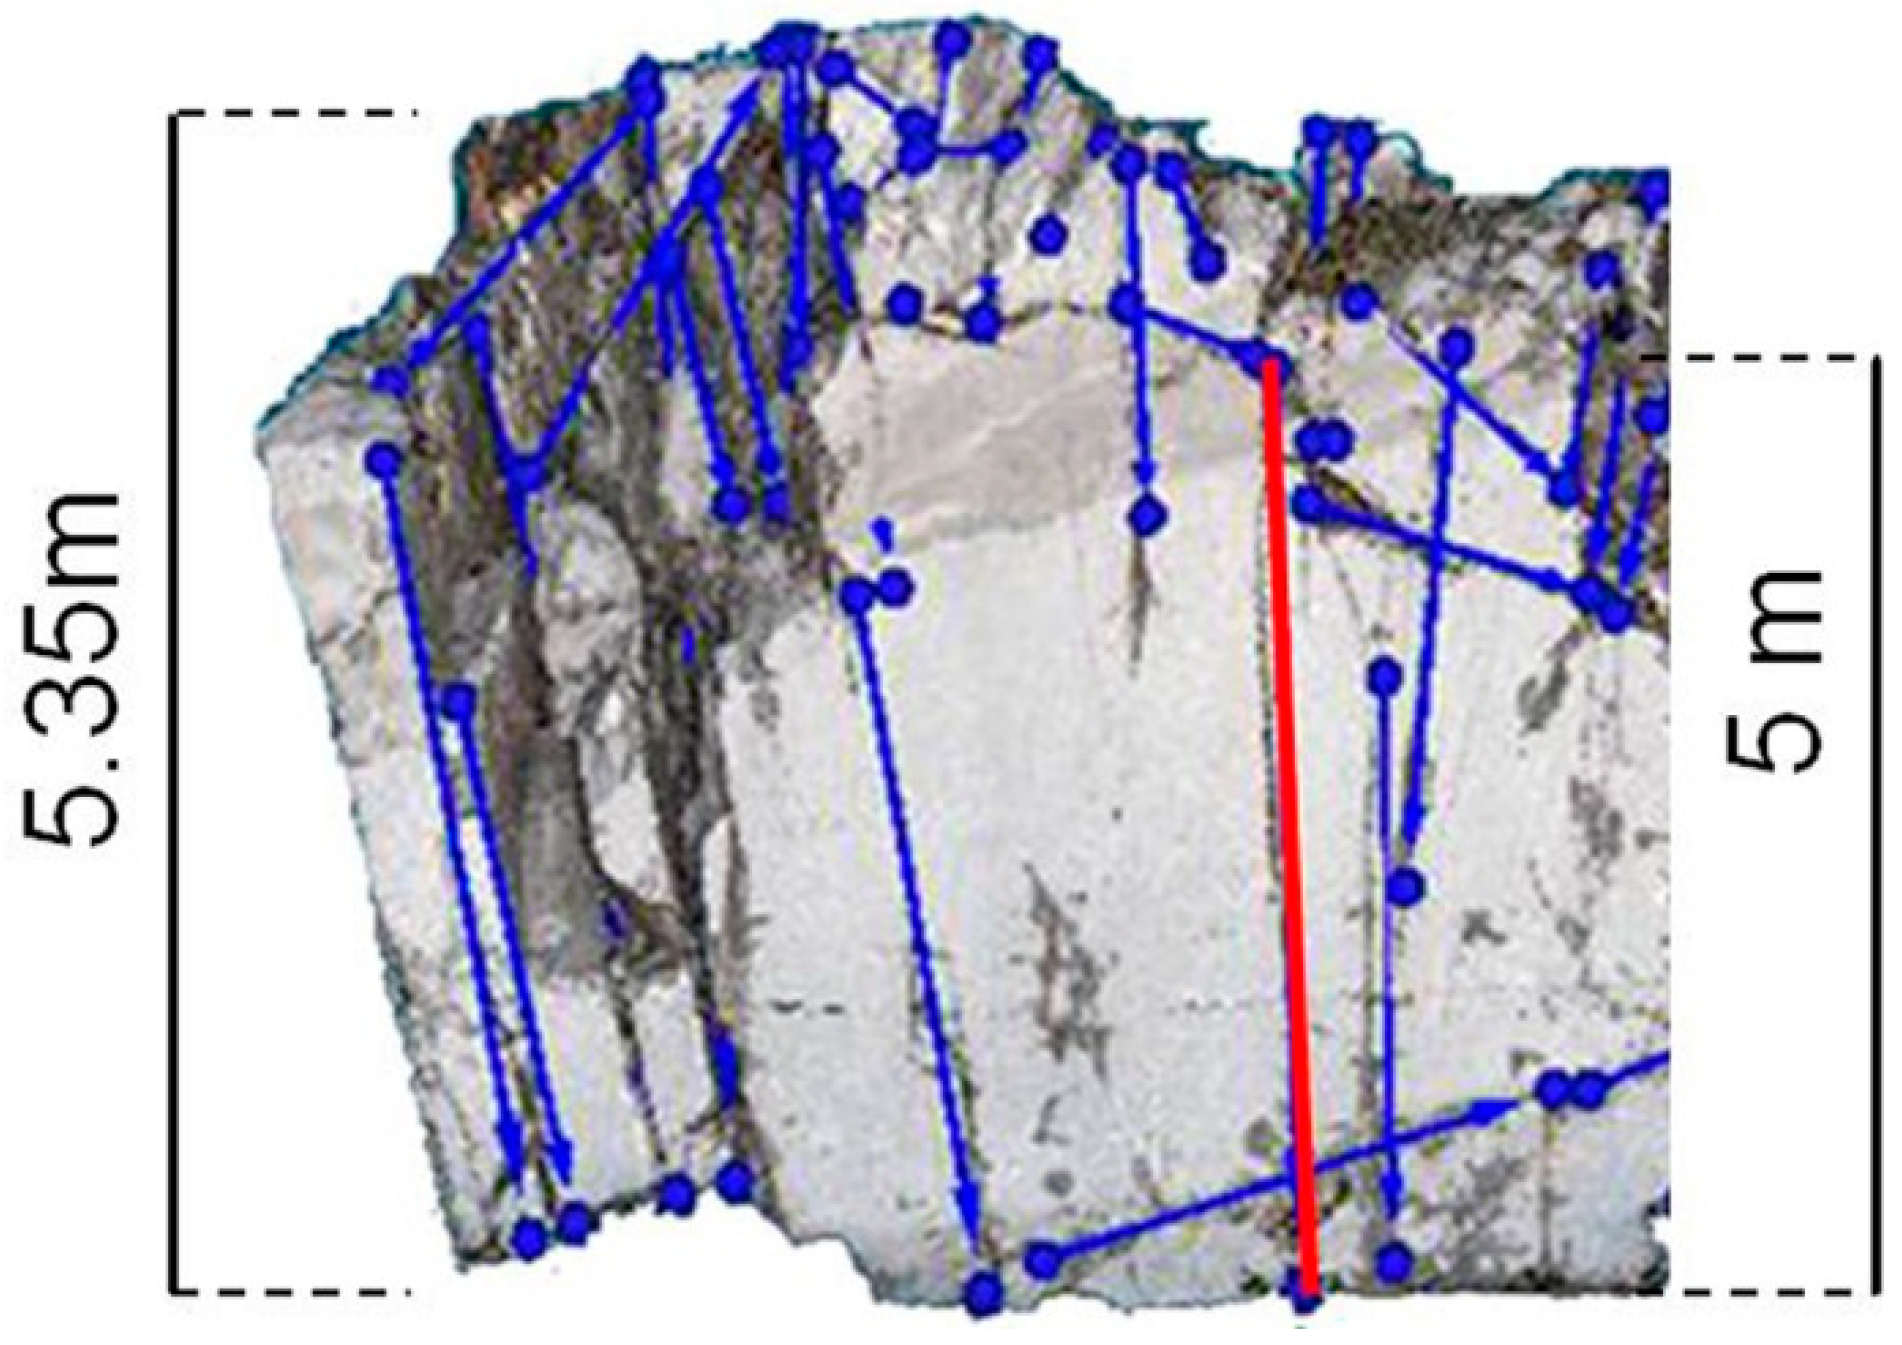
Table 5). In addition, persistence P was assumed equal to the ratio between the longest trace length of the considered discontinuity set measurable on an excavation face and the dimension of the face that is more similar to the direction of the set.
Figure 14 shows an example with a face 5.35 m high and a sub-vertical trace 5 m long, resulting in an estimated persistence of 0.935. Residual friction angle Φr of discontinuities was obtained from direct shear tests. Unit volume weight, friction angle and cohesion of the rock matrix have been assumed equal to 2700 kg/m
3, 36° and 17.74 MPa, respectively, according to laboratory tests performed by the authors.
Table 6 summarizes the results relating to FoS with respect to planar sliding. As noted, with the Mohr-Coulomb criterion, the absence of cohesion determines conditions of instability, while the presence of rock bridges establishes values markedly higher than the stability threshold (equal to 1).
With the Barton-Bandis method, an intermediate situation is outlined with respect to the two ones previously described. The values obtained with the two methods are in accordance.
In the case of wedge sliding, the absence of cohesion determines conditions of instability in most cases (
Table 7 and
Table 8), while rock bridges act to increase the degree of safety significantly: even a small decrease of persistence is able to produce resisting forces more than 10 times greater than acting forces. The values obtained with the two calculation methods are close in most of the cases. Differences between results that should be theoretically equal can be attributed to numerical approximation, particularly influent considering the great number of terms expressed with trigonometric functions that are involved in FoS calculation (see Equations (5) and (6)); in cases in which differences are significant, it is possible to suppose the presence of optimization routines in Swedge code that put geometrical constraints.
In general, since no sliding events were reported in the quarry, it is possible to affirm that the more realistic situation to be considered is the one in which cohesion is not null and discontinuities are not fully persistent: basically, rock bridges control the stability. In the peculiar environment of a quarry, this fact highlights the importance of a properly designed exploitation, in order to ensure a safety workplace and not to produce rock bridges sudden breakage.
5.4. Seismic Conditions
Finally, the seismic conditions of the study area, which falls into the Zone 2 of the Italian seismic hazard zonation [
68], were analyzed with the pseudo static method. This technique considers dynamic forces as static ones by means of a coefficient k, proportional to the peak ground acceleration (PGA). Coefficient k was calculated according to the Italian technical legislation [
69], assuming a PGA equal to 0.215 g (correspondent to a return period of 975 years), a subsoil category A (lithoid material) and a topography category T2 (slope with average inclination higher than 15°). In this case, only the horizontal component of the coefficient (k
h), equal to 0.077, was considered.
Table 9,
Table 10 and
Table 11 report FoS values obtained considering the presence of seismic action with respect to planar and wedge sliding mechanism; calculation was performed with software RocPlane and SWedge, respectively.
Similar to results in
Table 6, with Mohr-Coulomb criterion the absence of cohesion determines conditions of instability (
Table 9), while the presence of rock bridges establishes values markedly higher than the stability threshold (equal to 1). With Barton-Bandis method an intermediate situation is outlined with respect to the two ones previously described.
Moreover, similar to results in
Table 7 and
Table 8, in the case of wedge sliding, the absence of cohesion determines conditions of instability in almost every case (
Table 10 and
Table 11).
In general, it is possible to observe a slight decrease of all the calculated FoS values, due to the presence of the seismic action.
6. Conclusions
In ornamental stone quarries, the application of non-contact survey techniques for rock mass characterization is a relatively recent research topic. This study aimed to highlight the potential of the application of non-contact survey based on point clouds to the stability assessment of a marble quarry. To guarantee the completeness of the discontinuity database, this survey was performed in conjunction with traditional survey methodologies. The results obtained confirm the potential of non-contact survey techniques for the geomechanical study of a quarry, in particular in terms of data sample reliability. Non-contact techniques, besides guaranteeing a higher safety level of the operators and the observation of inaccessible parts, allow for the analysis of all the discontinuities on the entire surface of the rock face.
The results of application of CloudCompare for the identification of discontinuity traces demonstrate the great potential of this code on perfectly flat excavation faces: discontinuity sets were recognized by performing a cluster analysis on traces orientation. In view of the excavation progress, this could represent an efficient alternative to a standard survey of discontinuity planes, which would not produce results on excavation faces.
Markland testing of the obtained discontinuity sets revealed the susceptibility of many rock faces to two potential failure modes (planar and wedge sliding), which were further analyzed with LEM methods. Since no failures have been reported during the excavation activity, stability analyses were focused on the evaluation of the influence of discontinuity strength. The authors considered the presence of rock bridges, as these represent a source of cohesion and contribute to an increase in the resisting force opposing the sliding. Results in terms of FoS, assuming the Mohr-Coulomb criterion, demonstrate that the absence of cohesion determines conditions of instability, while the presence of rock bridges results in values markedly higher than the stability threshold (equal to 1). The Barton-Bandis method, assumed for planar sliding, produces an intermediate situation with respect to the two previously described. This comparison shows that even a small percentage of rock bridges contribute to stability more than peak resistance conditions. Rock bridges, whose quantification is actually very difficult in terms of geometry and strength, basically control the stability of the slopes in the quarry, therefore they should be the subject of a detailed investigation, involving geometrical and mineralogical aspects.
The seismic conditions of the quarry were also considered: the observed slight decrease of FoS values produced by the seismic action does not affect the rock mass stability in cases in which the presence of rock bridges is considered; in the other cases the already observed instability conditions worsen in terms of calculated FoS.
Author Contributions
Conceptualization, A.M.F. and R.C.; methodology, S.B. (Sabrina Bonetto); software, G.U.; validation, G.U. and S.B. (Sabrina Bonetto); formal analysis, G.U., A.M.F., and A.B.; investigation, A.B.; resources, S.B. (Stefano Bianchini); data curation, A.B.; writing—original draft preparation, A.B., A.M.F., and M.S.; writing—review and editing, G.U.; visualization, A.B.; supervision, A.M.F. and R.C.; project administration, A.M.F., M.R.M., and R.C.; funding acquisition, S.B. (Stefano Bianchini). All authors have read and agreed to the published version of the manuscript.
Funding
This research received no external funding.
Acknowledgments
Authors would like to thank Paolo Corradeghini, who performed the photogrammetric surveys and provided the point clouds used in this study.
Conflicts of Interest
The authors declare no conflict of interest.
References
- Priest, S.D. The collection and analysis of discontinuity orientation data for engineering design, with examples. In Rock Testing and Site Characterization; Hudson, J.A., Ed.; Pergamon: Oxford, UK, 1993; pp. 167–192. [Google Scholar]
- International Society for Rock Mechanics. ISRM commission on standardization of laboratory and field tests: Suggested methods for the quantitative description of discontinuities in rock masses. Int. J. Rock Mech. Min. 1978, 15, 319–368. [Google Scholar] [CrossRef]
- Davis, J.C. Statistics and Data Analysis in Geology; Wiley: New York, NY, USA, 1986. [Google Scholar]
- Kulatilake, P.H.S.W.; Wathugala, D.N.; Stephansson, O. Joint network modelling with a validation exercise in Stripa mine, Sweden. Int. J. Rock Mech. Min. 1993, 30, 503–526. [Google Scholar] [CrossRef]
- Crosta, G. Evaluating rock mass geometry from photographic images. Rock Mech. Rock Eng. 1997, 30, 35–58. [Google Scholar] [CrossRef]
- Reid, T.R.; Harrison, J.P. A semi-automated methodology for discontinuity trace detection in digital images of rock mass exposures. Int. J. Rock Mech. Min. 2000, 37, 1073–1089. [Google Scholar] [CrossRef]
- Post, R.; Kemeny, J.; Murphy, R. Image Processing for Automatic Extraction of Rockjoint Orientation Data from Digital Images. In Proceedings of the 38th US Rock Mechanics Symposium, Washington, DC, USA, 7–10 July 2001; pp. 877–884. [Google Scholar]
- Kemeny, J.; Post, R. Estimating three-dimensional rock discontinuity orientation from digital images of fracture traces. Comput. Geosci. 2003, 29, 65–77. [Google Scholar] [CrossRef]
- Lemy, F.; Hadjigeorgiou, J. Discontinuity trace map construction using photographs of rock exposures. Int. J. Rock Mech. Min. 2003, 40, 903–917. [Google Scholar] [CrossRef]
- Deb, D.; Hariharan, S.; Rao, U.M.; Chang-Ha, R. Automatic detection and analysis of discontinuity geometry of rock mass from digital images. Comput. Geosci. 2008, 34, 115–126. [Google Scholar] [CrossRef]
- Mohebbi, M.; Yarahmadi Bafghi, A.R.; Fatehi Marji, M.; Gholamnejad, J. Rock mass structural data analysis using image processing techniques (Case study: Choghart iron ore mine northern slopes). J. Min. Environ. 2017, 8, 61–74. [Google Scholar] [CrossRef]
- Underground Application of Photographic and GPR Techniques for Discontinuity Survey. Available online: http://www.patroneditore.com/Rig/2019/2/7892/applicazione_in_sotterraneo_di_tecniche_fotografiche_e_gpr_per_il_rilievo_di_discontinuit.html (accessed on 7 February 2020).
- Nguyen, T.L.; Hall, S.A.; Vacher, P.; Viggiani, G. Fracture mechanisms in soft rock: Identification and quantification of evolving displacement discontinuities by extended digital image correlation. Tectonophysics 2011, 503, 117–128. [Google Scholar] [CrossRef]
- Blaber, J.; Adair, B.; Antoniou, A. Ncorr: Open-Source 2D Digital Image Correlation Matlab Software. Exp. Mech. 2015, 55, 1105–1122. [Google Scholar] [CrossRef]
- Caselle, C.; Umili, G.; Bonetto, S.; Ferrero, A.M. Application of DIC analysis method to the study of failure initiation in gypsum rocks. Geotech. Lett. 2019, 9, 35–45. [Google Scholar] [CrossRef]
- Kemeny, J.; Donovan, J. Rock mass characterization using LiDAR and automated point cloud processing. Ground Eng. 2005, 38, 26–29. [Google Scholar]
- Trinks, I.; Clegg, P.; McCaffrey, K.; Jones, R.; Hobbs, R.; Holdsworth, B. Mapping and analyzing virtual outcrops. Vis. Geosci. 2005, 10, 13–19. [Google Scholar] [CrossRef]
- Feng, Q.; Roshoff, K. A Survey of 3D Laser Scanning Techniques for Application to Rock Mechanics and Rock Engineering. In The ISRM Suggested Methods for Rock Characterization, Testing and Monitoring 2007–2014; Ulusay, R., Ed.; Springer: Berlin/Heidelberg, Germany, 2014; pp. 265–293. [Google Scholar]
- Haneberg, W.C. 3-D rock mass characterization using terrestrial digital photogrammetry. AEG News 2006, 49, 12–15. [Google Scholar]
- Ferrero, A.M.; Forlani, G.; Roncella, R.; Voyat, H.I. Advanced Geostructural survey Methods Applied to Rock Mass Characterization. Rock Mech. Rock Eng. 2009, 42, 631–665. [Google Scholar] [CrossRef]
- Sturzenegger, M.; Stead, D. Close-range terrestrial digital photogrammetry and terrestrial laser scanning for discontinuity characterization on rock cuts. Eng. Geol. 2009, 106, 163–182. [Google Scholar] [CrossRef]
- Gigli, G.; Casagli, N. Semi-automatic extraction of rock mass structural data from high resolution LIDAR point clouds. Int. J. Rock Mech. Min. 2011, 48, 187–198. [Google Scholar] [CrossRef]
- Lato, M.; Vöge, M. Automated mapping of rock discontinuities in 3D LIDAR models. Int. J. Rock Mech. Min. 2012, 54, 150–158. [Google Scholar] [CrossRef]
- Riquelme, A.J.; Abellán, A.; Tomás, R.; Jaboyedoff, M. A new approach for semi-automatic rock mass joints recognition from 3D point clouds. Comput. Geosci. 2014, 68, 38–52. [Google Scholar] [CrossRef]
- Francioni, M.; Salvini, R.; Stead, D.; Giovannini, R.; Riccucci, S.; Vanneschi, C.; Gullì, D. An integrated remote sensing-GIS approach for the analysis of an open pit in the Carrara marble district, Italy: Slope stability assessment through kinematic and numerical methods. Comput. Geotech. 2015, 67, 46–63. [Google Scholar] [CrossRef]
- Matasci, B.; Carrea, D.; Abellan, A.; Derron, M.H.; Humair, F.; Jaboyedoff, M.; Metzger, R. Geological mapping and fold modeling using Terrestrial Laser Scanning point clouds: Application to the Dents-du-Midi limestone massif (Switzerland). Eur. J. Remote Sens. 2015, 48, 569–591. [Google Scholar] [CrossRef]
- Masoud, A.; Koike, K. Autodetection and integration of tectonically significant lineaments from SRTM DEM and remotely-sensed geophysical data. ISPRS J. Photogramm. Remote Sens. 2011, 66, 818–832. [Google Scholar] [CrossRef]
- Bonetto, S.; Facello, A.; Ferrero, A.M.; Umili, G. A Tool for Semi-Automatic Linear Feature Detection Based on DTM. Comput. Geosci. 2015, 75, 1–12. [Google Scholar] [CrossRef]
- Bonetto, S.; Facello, A.; Umili, G. A new application of CurvaTool semi-automatic approach to qualitatively detect geological lineaments. Environ. Eng. Geosci. 2017, 23, 179–190. [Google Scholar] [CrossRef]
- Bonetto, S.; Facello, A.; Umili, G. The contribution of CurvaTool semi-automatic approach in structural and groundwater investigations. A case study in the Main Ethiopian Rift Valley. Egypt. J. Remote Sens. Space Sci. 2018. [Google Scholar] [CrossRef]
- Kim, D.H.; Gratchev, I.; Balasubramaniam, A. Back analysis of a natural jointed rock slope based on the photogrammetry method. Landslides 2015, 12, 147–154. [Google Scholar] [CrossRef]
- Assali, P.; Grussenmeyer, P.; Villemin, T.; Pollet, N.; Viguier, F. Surveying and modeling of rock discontinuities by terrestrial laser scanning and photogrammetry: Semi-automatic approaches for linear outcrop inspection. J. Struct Geol. 2014, 66, 102–114. [Google Scholar] [CrossRef]
- Racaniello, A.; Bonetto, S.; Enrici Baion, R.; Ferrero, A.M.; Umili, G. Caratterizzazione di ammassi rocciosi in sotterraneo mediante rilievo geostrutturale “non a contatto”. GEAM 2015, 2, 51–58. [Google Scholar]
- Coïsson, E.; Segalini, A.; Bonetto, S. Buildings under the Rocks: An Interdisciplinary Approach for a Safe Conservation. Procedia Eng. 2016, 161, 2222–2228. [Google Scholar] [CrossRef][Green Version]
- Umili, G.; Bonetto, S.; Ferrero, A.M. An integrated multiscale approach for characterization of rock masses subjected to tunnel excavation. J. Rock Mech. Geotech. Eng. 2018, 10, 513–522. [Google Scholar] [CrossRef]
- Ferrero, A.M.; Migliazza, M.; Pirulli, M.; Umili, G. Some Open Issues on Rockfall Hazard Analysis in Fractured Rock Mass: Problems and Prospects. Rock Mech. Rock Eng. 2016, 49, 3615–3629. [Google Scholar] [CrossRef]
- Curtaz, M.; Ferrero, A.M.; Roncella, R.; Segalini, A.; Umili, G. Terrestrial photogrammetry and numerical modelling for the stability analysis of rock slopes in high mountain areas: Aiguilles Marbrées case. Rock Mech. Rock Eng. 2014, 47, 605–620. [Google Scholar] [CrossRef]
- Agliardi, F.; Crosta, G.B.; Meloni, F.; Valle, C.; Rivolta, C. Structurally-controlled instability, damage and slope failure in a porphyry rock mass. Tectonophysics 2013, 605, 34–47. [Google Scholar] [CrossRef]
- Havaej, M.; Coggan, J.; Stead, D.; Elmo, D. A combined remote sensing–numerical modelling approach to the stability analysis of Delabole Slate Quarry, Cornwall, UK. Rock Mech. Rock Eng. 2016, 49, 1227–1245. [Google Scholar] [CrossRef]
- Rafeh, F.; Mroueh, H.; Burlon, S. Accounting for joints effect on the failure mechanisms of shallow underground chalk quarries. Comput. Geotech. 2015, 69, 247–261. [Google Scholar] [CrossRef]
- Alejano, L.R.; Veiga, M.; Pérez-Rey, I.; Castro-Filgueira, U.; Arzúa, J.; Castro-Caicedo, Á.J. Analysis of a complex slope failure in a granodiorite quarry bench. Bull. Eng. Geol. Environ. 2019, 78, 1209–1224. [Google Scholar] [CrossRef]
- Shang, J.; West, L.J.; Hencher, S.R.; Zhao, Z. Geological discontinuity persistence: Implications and quantification. Eng. Geol. 2018, 241, 41–54. [Google Scholar] [CrossRef]
- Hencher, S.R.; Richards, L.R. Assessing the Shear Strength of Rock Discontinuities at Laboratory and Field Scales. Rock Mech. Rock Eng. 2015, 48, 883–905. [Google Scholar] [CrossRef]
- Alejano, L.R.; Castro-Filgueira, U.; Pérez-Rey, I.; Arzúa, J. Stability Analysis of an Over-tilted Slope in a Granite Quarry: The Role of Joint Spacing. Procedia Eng. 2017, 191, 402–409. [Google Scholar] [CrossRef]
- Giani, G.P. Rock Slope Stability Analysis; Balkema: Rotterdam, The Netherlands, 1992. [Google Scholar]
- Richards, L.R.; Leg, G.M.M.; Whittle, R.A. Appraisal of stability conditions in rock slopes. In Foundation Engineering in Difficult Ground; Newnes-Butterworths: London, UK, 1978; pp. 449–512. [Google Scholar]
- Hoek, E.; Bray, J.W. Rock Slope Engineering, 3rd ed.; The Institution of Mining and Metallurgy: London, UK, 1981; 358p. [Google Scholar]
- Carmignani, L.; Kligfield, R. Crustal extension in the Northern Apennines: The transition from compression to extension in the Alpi Apuane core complex. Tectonics 1990, 9, 1275–1303. [Google Scholar] [CrossRef]
- Molli, G.; Giorgetti, G.; Meccheri, M. Tectono-metamorphic evolution of the Alpi Apuane metamorphic complex: New data and constraints for geodynamic models. Boll Soc. Geol. Ital. 2002, 1, 789–800. [Google Scholar]
- Molli, G. Northern Apennine-Corsica orogenic system: An updated review. In Tectonic Aspects of the Alpine-Dinaride-Carpathian System: 2008; Siegesmund, S., Fügenschuh, B., Froitzheim, N., Eds.; Geological Society of London: London, UK, 2008. [Google Scholar] [CrossRef]
- Kligfield, R.; Hunziker, J.; Dallmeyer, R.D.; Schamel, S. Dating of deformational phases using K–Ar and 40Ar/39Ar techniques: Results from the Northern Apennines. J. Struct. Geol. 1986, 8, 781–798. [Google Scholar] [CrossRef]
- Molli, G. Deformation and fluid flow during underplating and exhumation of the Adria continental margin: A one day field trip in the Alpi Apuane (northern Apennines, Italy). In Deformation, Fluid Flow and Mass Transfer in the Forearc of Convergent Margins: Field Guides to the Northern Apennines in Emilia and the Apuan Alps (Italy): 2012; Vannucchi, P., Fisher, D., Eds.; The Geological Society of America: New York, NY, USA, 2012. [Google Scholar] [CrossRef]
- Fellin, M.G.; Reiners, P.W.; Brandon, M.T.; Wuthrich, E.; Balestrieri, M.L.; Molli, G. Thermo-chronologic evidence of exhumational history of the Alpi Apuane metamorphic core complex, northern Apennines, Italy. Tectonics 2007, 26. [Google Scholar] [CrossRef]
- Conti, P.; Carmignani, L.; Massa, G.; Meccheri, M.; Fantozzi, P.L.; Masetti, G.; Rossetto, R. Note Illustrative Della Carta Geologica d’Italia Alla Scala 1:50,000 “Foglio 260—Viareggio”; Progetto CARG, ISPRA, Istituto Superiore per la Protezione e la ricerca Ambientale, Servizio Geologico d’Italia: Rome, Italy, 2012. [Google Scholar]
- Conti, P.; Carmignani, L.; Giglia, G.; Meccheri, M.; Fantozzi, P.L. Evolution of geological interpretations in the Alpi Apuane Metamorphic Complex, and their relevance for the geology of the Northern Apennines. In The Regione Toscana Project of Geological Mapping; Morini, D., Bruni, P., Eds.; Regione Toscana-Servizio Geologico Regionale: Firenze, Italy, 2004; Volume 23, pp. 241–262. [Google Scholar]
- Carmignani, L.; Conti, P.; Disperati, L.; Fantozzi, P.L.; Giglia, G.; Meccheri, M. Carta Geologica del Parco delle Alpi Apuane, 1:50,000; Se.l.ca: Firenze, Italy, 2000. [Google Scholar]
- Molli, G.; Giorgetti, G.; Meccheri, M. Structural and petrological constraints on the tectono-metamorphic evolution of the Massa Unit (Alpi Apuane, NW Tuscany, Italy). Geol. J. 2000, 35, 251–264. [Google Scholar] [CrossRef]
- Lorenzoni, V. (Università di Siena, Arezzo, Italy). Progetto Di Coltivazione Della Cava “Piastrone”: Studio Geomeccanico e Analisi di Stabilità. Personal communication, 2012. [Google Scholar]
- Agisoft Photoscan. Available online: https://www.agisoft.com/features/ (accessed on 11 October 2019).
- CloudCompare, 3D Point Cloud and Mesh Processing Software, Open Source Project. Available online: http://www.cloudcompare.org (accessed on 11 October 2019).
- Markland, J.T. A Useful Technique for Estimating the Stability of Rock Slope When the Rigid Wedge Sliding Type of Failure Is Expected; Imperial College of Science and Technology: Landon, UK, 1972. [Google Scholar]
- Hudson, J.A.; Harrison, J.P. Engineering Rock Mechanics—An Introduction to the Principles; Pergamon Press: Oxford, UK, 1997. [Google Scholar]
- Rocscience-Dips. Available online: https://www.rocscience.com/software/dips (accessed on 11 October 2019).
- Barton, N.R.; Bandis, S. Review of predictive capabilities of JRC-JCS model in engineering practice. In Rock Joints, Proceedings of the International Symposium on Rock Joints, Loen, Oslo, Norway, 4–6 June 1990; Barton, N., Stephansson, O., Eds.; Balkema: Rotterdam, The Netherlands, 1990; pp. 603–610. [Google Scholar]
- Bonilla–Sierra, V.; Scholtès, L.; Donzé, F.V.; Elmouttie, M. DEM analysis of rock bridges and the contribution to rock slope stability in the case of translational sliding failures. Int. J. Rock Mech. Min. 2015, 80, 67–78. [Google Scholar] [CrossRef]
- Rocscience-RocPlane. Available online: https://www.rocscience.com/software/rocplane (accessed on 11 October 2019).
- Rocscience-SWedge. Available online: https://www.rocscience.com/software/swedge (accessed on 11 October 2019).
- Ordinanza PCM 3519 Del 28 Aprile 2006, All. 1b: Pericolosità Sismica Di Riferimento Per il Territorio Nazionale. Available online: http://zonesismiche.mi.ingv.it/mappa_ps_apr04/consultazione_005.html (accessed on 11 October 2019).
- NTC. Norme Tecniche per le Costruzioni, Ministero Delle Infrastrutture e Dei Trasporti, Decreto Ministeriale del 14 Gennaio 2008, Supplemento Ordinario Alla G.U. n. 29 del 4 Febbraio 2008. Available online: https://www.gazzettaufficiale.it/eli/id/2008/02/04/08A00368/sg (accessed on 11 October 2019).
Figure 1.
View of the Piastrone open pit quarry.
Figure 1.
View of the Piastrone open pit quarry.
Figure 2.
Geological map of the “Retro Altissimo” extraction district [
55]; location of Piastrone quarry is marked in red.
Figure 2.
Geological map of the “Retro Altissimo” extraction district [
55]; location of Piastrone quarry is marked in red.
Figure 3.
Outcrop appearance of the lithologies of the study area: (a) Megalodon-bearing marble, (b) Seravezza breccia, (c) contact between white and grey marbles.
Figure 3.
Outcrop appearance of the lithologies of the study area: (a) Megalodon-bearing marble, (b) Seravezza breccia, (c) contact between white and grey marbles.
Figure 4.
Outcrop-scale evidence of deformed of bedding (S0) and foliation (S1) in the “marmi s.s.” (marble).
Figure 4.
Outcrop-scale evidence of deformed of bedding (S0) and foliation (S1) in the “marmi s.s.” (marble).
Figure 5.
Equal area, lower hemisphere projections of D1 structural elements measured in the study area: S0 sedimentary bedding, S1 foliation, L1 stretching lineation, A1 fold axis. On the right: bedding parallel D1 foliation (p), extension and mineral lineation (Le) (modified from [
57]).
Figure 5.
Equal area, lower hemisphere projections of D1 structural elements measured in the study area: S0 sedimentary bedding, S1 foliation, L1 stretching lineation, A1 fold axis. On the right: bedding parallel D1 foliation (p), extension and mineral lineation (Le) (modified from [
57]).
Figure 6.
(a) strike-slip faults cross-cutting the Marmi s.s. Formation in the quarry area; (b) detail of the fault and damage zone.
Figure 6.
(a) strike-slip faults cross-cutting the Marmi s.s. Formation in the quarry area; (b) detail of the fault and damage zone.
Figure 7.
Typical granoblastic structure of the marble of Piastrone quarry: both straight (red arrows) and lobated (yellow arrows) grain boundaries can be recognized in calcite crystals.
Figure 7.
Typical granoblastic structure of the marble of Piastrone quarry: both straight (red arrows) and lobated (yellow arrows) grain boundaries can be recognized in calcite crystals.
Figure 8.
(a) Location of the seven surveys along scanlines performed in the quarry; (b) image of the quarry showing locations of faces from 1 to 7.
Figure 8.
(a) Location of the seven surveys along scanlines performed in the quarry; (b) image of the quarry showing locations of faces from 1 to 7.
Figure 9.
Point cloud representing (a) the entire quarry (in yellow the location of bench in the quarry); (b) the studied bench.
Figure 9.
Point cloud representing (a) the entire quarry (in yellow the location of bench in the quarry); (b) the studied bench.
Figure 10.
Slope section representing (
a) a fully persistent joint (persistence equal to 100%), (
b) an intermittent joint (persistence < 100% due to rock bridges) (from [
65]).
Figure 10.
Slope section representing (
a) a fully persistent joint (persistence equal to 100%), (
b) an intermittent joint (persistence < 100% due to rock bridges) (from [
65]).
Figure 11.
Main discontinuity sets obtained from in situ survey (orientation in
Table 2).
Figure 11.
Main discontinuity sets obtained from in situ survey (orientation in
Table 2).
Figure 12.
Traces identification (blue lines) on the portions of point cloud of the studied bench representing excavation faces 1 and 3 and obtained stereonets.
Figure 12.
Traces identification (blue lines) on the portions of point cloud of the studied bench representing excavation faces 1 and 3 and obtained stereonets.
Figure 13.
Traces identification (blue lines) on the portion of point cloud of the entire quarry representing excavation faces A, B and C and obtained stereonets.
Figure 13.
Traces identification (blue lines) on the portion of point cloud of the entire quarry representing excavation faces A, B and C and obtained stereonets.
Figure 14.
Example of persistence calculation.
Figure 14.
Example of persistence calculation.
Table 1.
Technical specifications of the instrumentation used for the photogrammetric survey.
Table 1.
Technical specifications of the instrumentation used for the photogrammetric survey.
| Aerial Survey | Terrestrial Survey |
|---|
| Remotely piloted aircraft | DJI Phantom 4 Pro | Camera | Nikon D800 |
| Camera resolution | 5520 × 3680 | Camera resolution | 7360 × 4912 |
| Focal length | 24 mm | Focal lengths | 24 mm, 35 mm |
Table 2.
Range of variability of main discontinuity sets.
Table 2.
Range of variability of main discontinuity sets.
| Set | Dip Range [°] | Dip Direction Range [°] |
|---|
| K1 | 45–60 | 265–268 |
| K2 | 45–72 | 035–071 |
| K3 | 78–86 | 328–343 |
| K4 | 52–75 | 139–151 |
| K5 | 70–75 | 010–015 |
Table 3.
Summary of potential failure mechanisms that may affect excavation faces from 1 to 7.
Table 3.
Summary of potential failure mechanisms that may affect excavation faces from 1 to 7.
| Face (Dip/Dip Direction) | Planar Sliding | Wedge Sliding |
|---|
| 1 (87/055) | K2 | K2–K3 |
| K2–K4 |
| 2 (88/345) | K3 | K2–K3 |
| 3 (60/050) | K2 | K2–K3 |
| K2–K4 |
| 4 (89/353) | K5 | K1–K5 |
| K1–K2 |
| 5 (89/057) | - | - |
| 6 (89/300) | - | K1–K5 |
| 7 (89/048) | - | - |
Table 4.
Summary of potential failure mechanisms that may affect excavation faces A, B, and C.
Table 4.
Summary of potential failure mechanisms that may affect excavation faces A, B, and C.
| Face (Dip/Dip Direction) | Planar Sliding | Wedge Sliding |
|---|
| A (70/330) | - | K1–K5 |
| K2–K4 |
| K4–K5 |
| B (86/043) | K2 | K2–K3 |
| K2–K4 |
| K2–K5 |
| K3–K5 |
| K4–K5 |
| K1–K2 |
| C (89/239) | - | K1–K3 |
| K1–K4 |
| K1–K5 |
| K3–K4 |
Table 5.
Geotechnical parameters used for calculating FoS.
Table 5.
Geotechnical parameters used for calculating FoS.
| | Discontinuities |
|---|
| Face | P [-] | Fr [°] | JRC [-] | JCS [t/m2] |
|---|
| 1 | 0.935 | 28 | 12 | 6220 |
| 2 | 0.930 | 28 | 11 | 9565 |
| 3 | 0.949 | 28 | 8 | 8668 |
| 4 | 0.452 | 28 | 12 | 6118 |
| 6 | 0.922 | 28 | 11 | 6328 |
| A | 0.990 | 28 | 10 | 8668 |
| B | 0.990 | 28 | 10 | 8668 |
| C | 0.990 | 28 | 10 | 8668 |
Table 6.
Summary of results in terms of FoS with respect to planar sliding mechanism.
Table 6.
Summary of results in terms of FoS with respect to planar sliding mechanism.
| Face | FoS (Mohr-Coulomb) | FoS (Barton-Bandis) |
|---|
| Equation (2) (capp = 0) | Equation (3) (capp ≠ 0) | Equation (4) |
|---|
| Spreadsheet | RocPlane | Spreadsheet | RocPlane | Spreadsheet | RocPlane |
|---|
| 1 | 0.27 | 0.27 | 45.42 | 45.42 | 1.57 | 1.39 |
| 2 | 0.10 | 0.10 | 86.60 | 86.60 | 0.94 | 0.53 |
| 3 | 0.33 | 0.33 | 381.52 | 381.51 | 1.41 | 1.41 |
| 4 | 0.14 | 0.14 | 150.13 | 150.13 | 1.20 | 0.74 |
| B | 0.42 | 0.42 | 3.02 | 3.02 | 1.04 | 1.04 |
Table 7.
Summary of results in terms of FoS with respect to wedge sliding mechanism for excavation faces from 1 to 7.
Table 7.
Summary of results in terms of FoS with respect to wedge sliding mechanism for excavation faces from 1 to 7.
| Face | Pair of Sets | FoS
Equation (5) (capp = 0) | FoS
Equation (6) (capp ≠ 0) |
|---|
| Spreadsheet | Swedge | Spreadsheet | Swedge |
|---|
| 1 | K2–K3 | 0.30 | 0.27 | 79.15 | 72.17 |
| K2–K4 | 0.50 | 0.27 | 89.88 | 81.94 |
| 2 | K2–K3 | 0.38 | 0.10 | 161.07 | 149.37 |
| 3 | K2–K3 | 0.31 | 0.37 | 228.14 | 556.37 |
| K2–K4 | 0.77 | 0.76 | 474.15 | 695.77 |
| 4 | K1–K5 | 0.77 | 0.80 | 92.23 | 145.81 |
| K1–K2 | 1.45 | 1.42 | 21.19 | 18.77 |
| 6 | K1–K5 | 0.54 | 0.59 | 8.28 | 6.49 |
Table 8.
Summary of results in terms of FoS with respect to wedge sliding mechanism for excavation faces A, B, and C.
Table 8.
Summary of results in terms of FoS with respect to wedge sliding mechanism for excavation faces A, B, and C.
| Face | Pair of Sets | FoS
Equation (5) (capp = 0) | FoS
Equation (6) (capp ≠ 0) |
|---|
| Spreadsheet | Swedge | Spreadsheet | Swedge |
|---|
| A | K1–K5 | 0.63 | 0.67 | 20.55 | 18.99 |
| K2–K4 | 0.67 | 1.07 | 23.00 | 22.19 |
| K4–K5 | 0.28 | 0.29 | 88.19 | 73.40 |
| B | K2–K3 | 0.49 | 0.49 | 12.47 | 11.19 |
| K2–K4 | 0.67 | 1.07 | 15.02 | 13.69 |
| K2–K5 | 0.37 | 0.42 | 12.61 | 8.18 |
| K3–K5 | 0.15 | 0.27 | 40.59 | 39.65 |
| K4–K5 | 0.28 | 0.16 | 120.10 | 118.65 |
| K1–K2 | 1.91 | 2.86 | 33.74 | 25.29 |
| C | K1–K3 | 0.36 | 0.52 | 20.01 | 23.70 |
| K1–K4 | 0.38 | 1.48 | 27.83 | 34.88 |
| K1–K5 | 0.62 | 0.40 | 29.27 | 20.91 |
| K3–K4 | 0.16 | 0.51 | 66.16 | 66.89 |
Table 9.
FoS values obtained considering the presence of seismic action with respect to planar sliding mechanism.
Table 9.
FoS values obtained considering the presence of seismic action with respect to planar sliding mechanism.
| Face | FoS (Mohr-Coulomb) | FoS (Barton-Bandis) |
|---|
| (capp = 0) | (capp ≠ 0) | |
|---|
| 1 | 0.22 | 43.67 | 1.14 |
| 2 | 0.06 | 85.28 | 0.32 |
| 3 | 0.28 | 363.96 | 1.20 |
| 4 | 0.10 | 147.06 | 0.51 |
| B | 0.35 | 2.81 | 0.90 |
Table 10.
FoS values obtained considering the presence of seismic action with respect to wedge sliding for excavation faces from 1 to 7.
Table 10.
FoS values obtained considering the presence of seismic action with respect to wedge sliding for excavation faces from 1 to 7.
| Face | Pair of Sets | FoS | FoS |
|---|
| (capp = 0) | (capp ≠ 0) |
|---|
| 1 | K2–K3 | 0.22 | 69.43 |
| K2–K4 | 0.24 | 79.79 |
| 2 | K2–K3 | 0.09 | 148.31 |
| 3 | K2–K3 | 0.31 | 509.98 |
| K2–K4 | 0.65 | 624.73 |
| 4 | K1–K5 | 0.69 | 134.15 |
| K1–K2 | 1.18 | 16.25 |
| 6 | K1–K5 | 0.50 | 6.06 |
Table 11.
FoS values obtained considering the presence of seismic action with respect to wedge sliding for excavation faces A, B, and C.
Table 11.
FoS values obtained considering the presence of seismic action with respect to wedge sliding for excavation faces A, B, and C.
| Face | Pair of Sets | FoS | FoS |
|---|
| (capp = 0) | (capp ≠ 0) |
|---|
| A | K1–K5 | 0.57 | 17.68 |
| K2–K4 | 0.91 | 20.13 |
| K4–K5 | 0.23 | 70.98 |
| B | K2–K3 | 0.41 | 10.50 |
| K2–K4 | 0.91 | 12.40 |
| K2–K5 | 0.36 | 7.71 |
| K3–K5 | 0.20 | 38.65 |
| K4–K5 | 0.13 | 116.50 |
| K1–K2 | 2.21 | 19.98 |
| C | K1–K3 | 0.44 | 22.32 |
| K1–K4 | 1.27 | 32.30 |
| K1–K5 | 0.35 | 19.90 |
| K3–K4 | 0.40 | 64.73 |
© 2020 by the authors. Licensee MDPI, Basel, Switzerland. This article is an open access article distributed under the terms and conditions of the Creative Commons Attribution (CC BY) license (http://creativecommons.org/licenses/by/4.0/).

 ,
, 


