Abstract
Several urban areas in the Mediterranean have already been subjected to seismic microzonation studies aimed at determining the acceleration expected on the ground surface, therefore mitigating the associated seismic risks. These studies have been generally related to free-field conditions. The present paper shows innovative seismic microzonation maps based on a large-scale estimate of soil-structure interaction (SSI) effects on design accelerations for some areas characterized by a high seismic risk in Catania, Italy. The proposed procedure combined: (1) geotechnical characteristics; (2) building features; and (3) 1-D seismic response analyses in free-field conditions. The seismic hazard and site effects were evaluated using artificial inputs and inputs recorded recently in Catania. Structural fundamental periods and related spectral accelerations, considering both the fixed-base building configuration and flexible-base configuration, were mapped in the Google My Maps environment. These results showed that SSI often had a beneficial effect, but sometimes it had detrimental effects, especially for some masonry buildings. These maps provided important information for planning the seismic retrofitting of investigated buildings, which were based on more detailed analyses of SSI and the developed maps requiring them.
1. Introduction
Frequently, when structures and infrastructures designed to resist violent seismic actions are affected by a particularly significant seismic event, they lose their “performance/efficiency” or collapse due to problems depending on the subsoil and dynamic soil-structure interaction [1,2,3,4,5,6]. Despite the well-known effect of soil-structure interaction (SSI), the structural design is commonly based on the assumption of fixed-base structures, without considering the foundation soil. Figure 1 shows four acceleration response spectra that consider SSI effects. The first ones are associated with the label “Flexible-base”, whereas the second ones are associated with the label “Fixed-base”. A flexible-base structure has a fundamental period, TSSI, higher than the fixed-base structure one, Tfixed, and the response spectrum of a flexible-base structure lies below the fixed-base structure one due to the lower damping ratio of the flexible-base structure. Generally, the spectral ordinates corresponding to the fixed-base structure, Sa(Tfixed), are higher than the flexible-base case, Sa(TSSI) (Figure 1a). However, sometimes the trend of response spectra modifies this behavior, leading to an underestimation of seismic actions (Figure 1b). Moreover, while Sa(Tfixed) corresponding to Tfixed can be estimated in a straightforward manner, the spectral acceleration Sa(TSSI) corresponding to TSSI requires energy dissipation mechanisms generated in an oscillating soil-structure system through radiation and soil hysteretic damping, with no counterpart in fixed-base structures.
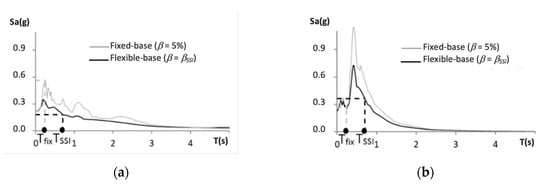
Figure 1.
A schematic explanation of the period elongation effect due to the soil-structure interaction (SSI) on the seismic force imposed on a structure depending on the seismic input and soil conditions: (a) beneficial effect of SSI reflected in Sa(TSSI)/Sa(Tfixed) ratio below unity; (b) detrimental effect of SSI reflected in Sa(TSSI)/Sa(Tfixed) ratio above unity.
According to these considerations, a procedure for a large-scale estimate of SSI effects on the design accelerations is proposed. It combines: (1) geotechnical characteristics of the soil; (2) buildings features (height and foundation geometry) and construction type of the buildings (masonry or concrete); and (3) 1D seismic response analyses in free-field conditions. Based on this information, innovative seismic microzonation maps have been developed, particularly structural fundamental periods and related spectral accelerations considering both the fixed-base structure configuration (no SSI) and the flexible-base one (with SSI).
These maps are precious tools when managing the building heritage of urban areas. They offer important information for planning the seismic retrofitting of buildings, suggesting more detailed analyses of SSI phenomena [7,8,9] when Sa(TSSI)/Sa(Tfixed) > 1.15. Finally, it was possible to make interesting considerations on the reliability of the Italian building code, NTC2018, prescriptions [10].
2. Evaluation of SSI Effects for the Estimation of the Design Accelerations
A soil-structure system may be modelled by an equivalent oscillator with an allowable translational and rocking motion for its base [11]. Its effective period (TSSI) may be computed by means of the following equation [12]:
where Tfixed and kstr are the fundamental period and the horizontal stiffness of the fixed-base structure, heff is the effective height of the structure equal to 0.7H (except for single-story buildings where h = H), and kh and kr are the translational and rocking stiffness of the foundation, respectively [13].
The above equation refers to a single isolated structure but, in this study, it was extended to an urban context where adjacent structures were present. Obviously, multiple interactions between structures of a building cluster may further affect the resulting seismic response due to combined soil-structure (SSI) and structure-soil-structure (SSSI) interaction phenomena [14,15]. However, the fundamental frequencies of the system with additional SSSI effects are negligible if compared to the SSI effect, and thus they are not considered [16].
The fundamental period of the fixed-base structure (Tfixed) is estimated according to the easy-to-use equation suggested by the old Italian Technical Code [17]:
where C1 is equal to 0.075 for concrete structures and 0.050 for masonry structures and H is the height of the structure.
The horizontal stiffness of the fixed-base structure kstr is obtained by reversing the known equation:
where m is the mass of the structure.
The translational (kh) and rocking (kr) stiffness of the foundation may be computed by the following equations [12]:
where ν is the Poisson ratio of the soil, G is the shear modulus of soil, and αθ is a dimensionless coefficient that depends on the excitation period, the dimension of the foundation, and the properties of the supporting medium [18] assumed equal to 1 without accurate studies.
In the above expressions, the foundation stiffness is considered by an equivalent rectangular surface foundation, according to the procedure suggested by [13,14]. According to [19], the equivalent radii of the structure’s foundation area in translational and rocking motion are:
where A0 and I0 stand for the area and moment of inertia for the foundation, respectively. In particular, A0 is the footprint area of each structure (it refers to a rectangular footprint area of dimension Beq = √ A0); in this manner, the moment of inertia for the foundation I0 may be computed by Beq4/12.
The shear modulus of soil is introduced for each structure along an effective depth of soil equal to 0.75ra and 0.75rm for the translational and rocking stiffness of the foundation [13]. In particular, the degradation of the shear modulus of soil is considered with the deformation level G(γ). Therefore, the degradation coefficient is estimated according to the procedure suggested by the EC8 [20].
According to [12], the effective damping factor βSSI of a soil-structure system is defined as:
where β0 is a foundation damping factor depending on TSSI/Tfixed. It is defined as:
where:
In the above expressions, “e” is a coefficient taking into account the foundation depth, which is assumed to be equal to 1 without careful studies.
The damping factor βSSI is generally higher than the damping factor βfixed (more than 5% for concrete structures and 8% for masonry structures) with the exception of the rare case of the foundation damping itself being very low (smaller than 5%), and the period ratio being large [21]. In fact, the system damping gradually decreases when the period ratio increases. However, it should be noted that the effective damping may not generally be taken less than the structural damping of 5% [22,23]. These damping ratios will be used to plot the response spectra in accordance with the procedure proposed by [24].
Then, according to the effective periods (TSSI and Tfixed), the spectral accelerations will be calculated and compared, according the flow chart shown in Figure 2.
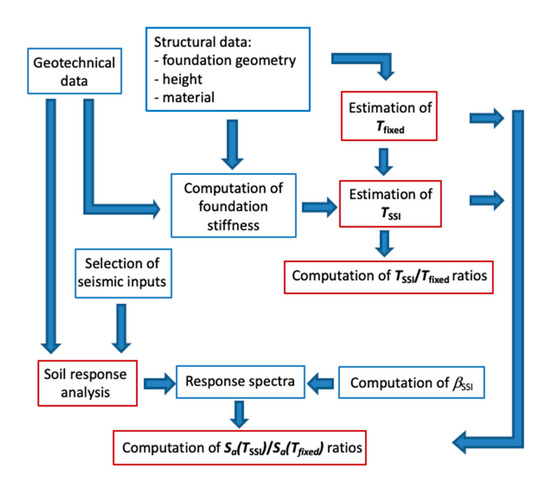
Figure 2.
Flow chart of the adopted procedure.
3. The Catania Case History
The subsoil of the city of Catania (Figure 3a) was extensively investigated by many in situ and laboratory tests [25,26,27,28], above all within two important research projects (i.e., “Catania Project 1 and 2” [29,30]), which obtained a database of over 1200 surveys and allowed for the development of important site responses and dynamic SSI analyses [31,32,33,34,35,36,37,38].
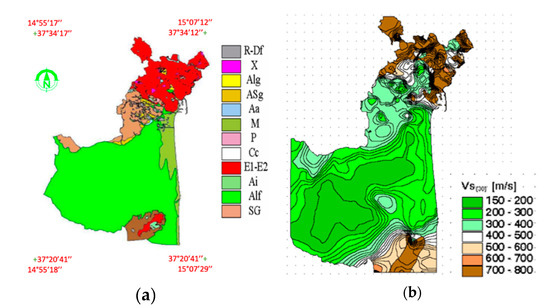
Figure 3.
(a) Geological map of the city of Catania. (b) Map of average shear wave velocity (m/s) in 0–30 m depth interval for the city of Catania (after [29]).
The main lithotypes are shown in Figure 3a. The performed geotechnical tests (C-H, D-H, and SASW) allowed us to find the shear wave velocity, whose spatial distribution is shown in Figure 3b. Instead, the values of some representative geotechnical parameters for each lithotype of Figure 3a are shown in Table 1.

Table 1.
Characteristic values of some representative geotechnical parameters [29].
All surveys executed in the “Catania Project 1 and 2” were identified in the Google My Maps environment. In particular, the surveys near buildings were taken into account for identifying the soil stratigraphy. The geotechnical parameters corresponded to different structures. Therefore, different layers were loaded in order to identify the survey, building height, and structure type.
3.1. The Investigated Areas
The areas investigated in the present paper are: in the west zone of Catania; in the northeast zone of the city; in the north Old Town of the city; in the south Old Town of the city (Figure 4).
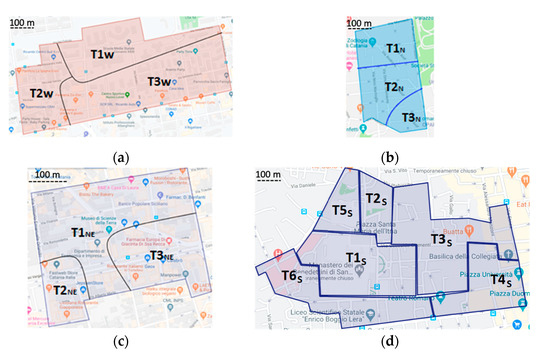
Figure 4.
The investigated areas: (a) west area; (b) northeast area; (c) north Old Town; and (d) south Old Town.
The first area included 197 buildings (59 masonry and 138 concrete structures); the second area included 212 buildings (111 masonry and 101 concrete structures); the third area included 198 buildings (107 masonry and 91 concrete structures); finally, the fourth area included 371 buildings, almost all of which were concrete structures rebuilt after the earthquake that destroyed Catania in 1693. According to the stratigraphy of the foundation soil (Figure 5), each area was divided into different areas: the first area into T1W, T2W, and T3W; the second area into T1NE, T2NE, and T3NE; the third area into T1N, T2N, and T3N; the fourth area into T1S, T2S, T3S, T4S, T5S, and T6S (Figure 4 and Figure 5).
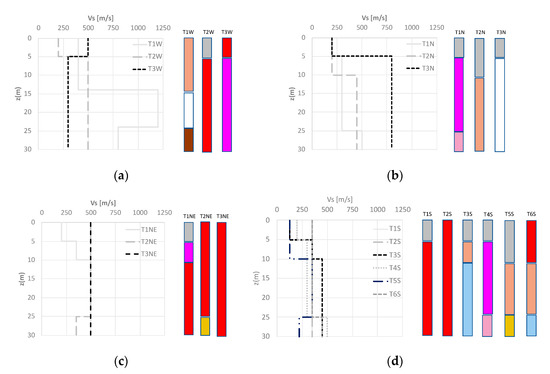
Figure 5.
Profile of Vs for all the considered sub-areas of the four investigated areas and corresponding stratigraphies: (a) west area; (b) northeast area; (c) north Old Town; (d) south Old Town.
3.2. The Utilized Inputs
The seismic hazard was evaluated for the analyzed areas using both artificial and recorded inputs that affected Catania in the past two centuries: 1818 (artificial); 1990 (recorded); 2002 (recorded); 2018 (recorded). As for the artificial input, it was achieved considering the source on the Hyblean–Maltese fault and generating the scenario earthquake of 1818. The use of an artificial input was due to the scarcity of significant recorded inputs in the examined area. As for the recorded accelerograms, the 1990 input was recorded at the Sortino station, while the 2002 and the 2018 inputs were recorded at the Santa Venerina station (Table 2). All inputs were scaled at the same PGA (peak ground acceleration, on average equal to 0.207 g), corresponding to the limit state of safeguarding life (SLV) for buildings mainly of class II and nominal life VN equal to 50 years, in accordance with the NTC2018 [10].
Table 2.
Main properties of the utilized inputs.
4. The 1-D Site Response Analysis
Preliminary, 1D seismic response analyses were performed using the Strata code [39] for the free-field conditions, adopting all 4 inputs. Therefore, the amax at the ground surface for the response spectra described in the following section were evaluated. In particular, since the shown procedure deals with rough analyses were carried out on large scale, we decided to standardize the seismic bedrock for all performed analyses, setting it at 30 m, which is a typical value prescribed via technical codes [10]. Investigations were characterized by trends that sometimes led to different bedrock depths.
As for the results, the T1W and T3W stratigraphies in the west area, the T1NE stratigraphy of the northeast area, the T1N and T2N stratigraphies of the north Old-Town area, as well as the T3S and T5S stratigraphies of the south Old-Town areas amplified the signal more than the others stratigraphies, due to their poor mechanical and dynamic characteristics.
By way of example, Figure 6 shows the results of the seismic response analysis executed for the 1818 seismic input for the three considered sub-areas of the northeast area (Figure 4b and Figure 5b). For the abovementioned reasons, just the Fourier spectrum concerning the T1NE stratigraphy presented higher peaks compared to the other ones.
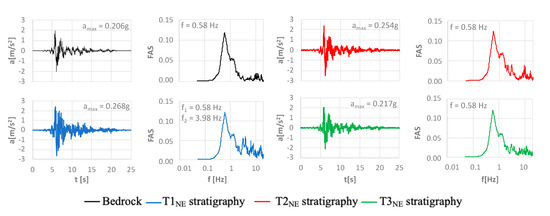
Figure 6.
Results of 1D response analysis for the 1818 seismic input for the northeast area.
5. New Seismic Microzonation Maps for the Investigated Areas
According to the urban morphology, the investigated areas were further divided into different blocks (Figure 7): (i) the west area into 5 blocks; (ii) the northeast Area into 15 blocks; (iii) the north Old Town into 16 blocks; and (iv) the south Old Town into 21 blocks.
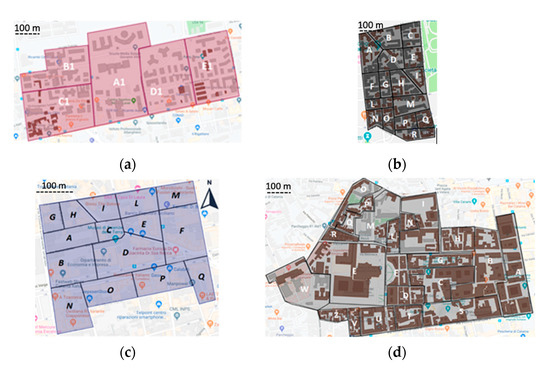
Figure 7.
Division of the areas in blocks according to the urban morphology: (a) west area; (b) northeast area; (c) north Old Town; (d) south Old Town.
In accordance with a previously reported procedure [12] and summarized in Section 2, both the fixed-base building configuration and the flexible-base configuration were taken into account for all structures in order to evaluate the corresponding building fundamental periods, Tfixed and TSSI, the response spectra and the related spectral accelerations, Sa(TSSI) and Sa(Tfixed). The results were mapped in the Google My Maps environment and presented via pie charts. The procedure was adopted for each individual building of the investigated areas, but the developed maps summarized the results, referring to each identified block of the relative area (representing a pie chart for each block).
Figure 8 shows the spatial distribution of Tfixed values for the investigated areas, summarizing the achieved results for each chosen block. In order to provide a systematic presentation of the obtained results, three different ranges were selected for the fundamental periods: Tfixed < 0.40 s (i.e., buildings having H < 10 m), 0.40 < Tfixed < 0.80 s (i.e., buildings having 10 < H < 20 m), and Tfixed < 0.80 s (i.e., buildings having H > 20 m).
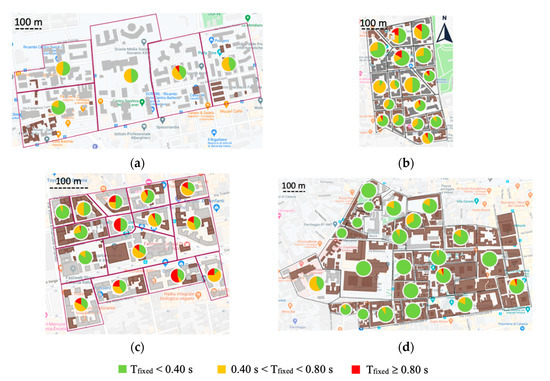
Figure 8.
Spatial distribution of Tfixed for the investigated areas: (a) west area; (b) northeast area; (c) north Old Town; (d) south Old Town.
Figure 9 shows the TSSI/Tfixed ratios for all investigated areas. As seen from the previous figures, the results refer to three different ranges, indicating probable negligible (TSSI/Tfixed < 1.15), moderate (1.15 < TSSI/Tfixed < 1.30), and high (TSSI/Tfixed ≥ 1.30) SSI effects on the fundamental period of the structures.
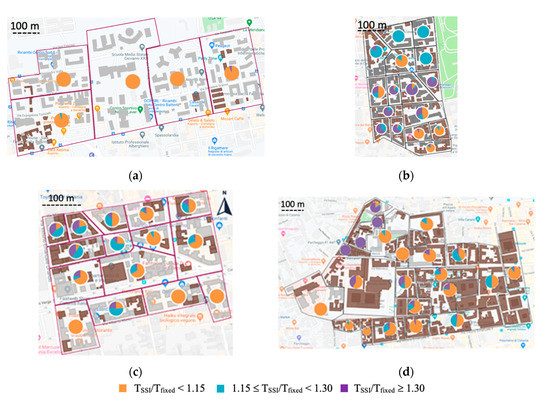
Figure 9.
Spatial distribution of TSSI/Tfixed for the investigated areas: (a) west area; (b) northeast area; (c) north Old Town; (d) south Old Town.
As for the west area (Figure 9a), the assumption of the fixed-base structure was not far from the real situation and therefore was considered acceptable, as it obtained TSSI/Tfixed < 1.15 for almost every building. The greater proximity of the TSSI values to those of Tfixed was due to the presence of more recent buildings in this area, which were therefore built according to a better geometric configuration of the entire structure and its foundations. This was in agreement with the seismic technical standards after the 1970s. As for the northeast area (Figure 9b), negligible DSSI effects (TSSI/Tfixed < 1.15) were observed mainly for the T2NE and T3NE stratigraphies, characterized mainly by rock soils. Therefore, for these cases, the assumption of the fixed-base structure was acceptable. As for the north Old Town area (Figure 9c), it was evident that for the T3N stratigraphy, the period of the generic structure in the flexible-base configuration did not differ much from the period of the same structure in the fixed-base configuration: given the predominantly rocky nature of the soil, the assumption of the fixed-base structure faithfully captured reality. Different considerations were made for the T1N and T2N soils, which were characterized by a lower stiffnesses: for the T1N stratigraphy, the TSSI/Tfixed ratios were mainly between 1.15 and 1.30, while for the T2N stratigraphy, the ratios were mainly greater than 1.30. Therefore, with reference to the entire north Old Town area, it can be stated that most buildings were characterized by TSSI/Tfixed > 1.15, for which the effects of the dynamic SSI could be relevant. Finally, as for the south Old Town area (Figure 9d), most buildings were characterized by ratios TSSI/Tfixed < 1.15. This was in accordance with the nature of the foundation soil, which is mainly rock soil. Nevertheless, a good percentage of buildings with a higher period of ratios allowed us to make interesting considerations relating to the effects of soil-structure interaction.
In order to assess if the SSI effects were beneficial or detrimental, Sa(TSSI)/Sa(Tfixed) ratios were evaluated and mapped considering three different ranges: beneficial (Sa(TSSI)/Sa(Tfixed) ≤ 0.85), negligible (0.85 < Sa(TSSI)/Sa(Tfixed) ≤ 1.15) and detrimental (Sa(TSSI)/Sa(Tfixed) > 1.15) SSI effected the seismic response of the structures. Figure 10, Figure 11, Figure 12 and Figure 13 show the developed maps, considering the adopted 4 inputs.
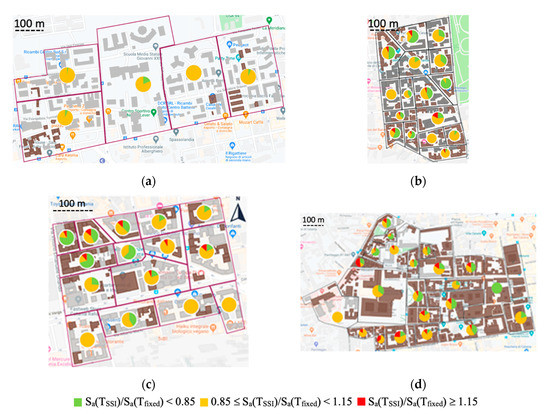
Figure 10.
Spatial distribution of Sa(TSSI)/Sa(Tfixed) ratios for the 1818 seismic input: (a) west area; (b) northeast area; (c) north Old Town; (d) south Old Town.
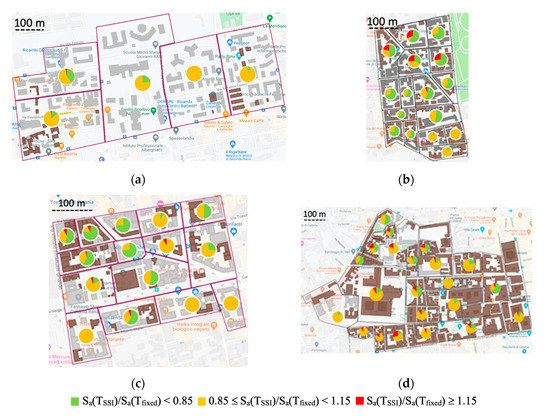
Figure 11.
Spatial distribution of Sa(TSSI)/Sa(Tfixed) ratios for the 1990 seismic input: (a) west area; (b) northeast area; (c) north Old Town; (d) south Old Town.
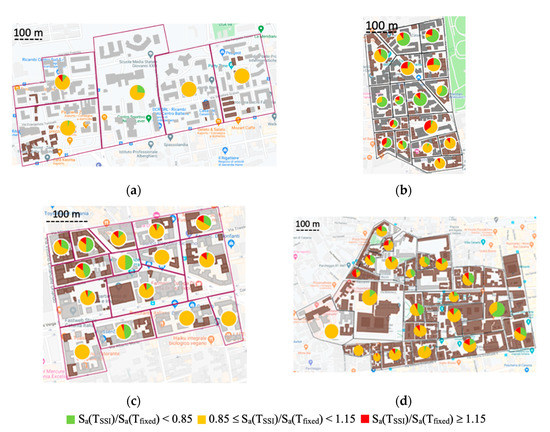
Figure 12.
Spatial distribution of Sa(TSSI)/Sa(Tfixed) ratios for the 2002 seismic input: (a) west area; (b) northeast area; (c) north Old Town; (d) south Old Town.
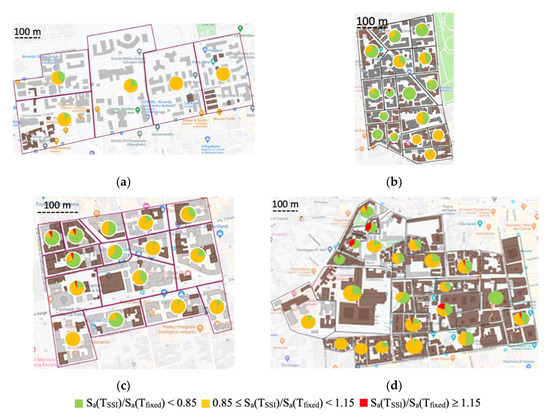
Figure 13.
Spatial distribution of Sa(TSSI)/Sa(Tfixed) ratios for the 2018 seismic input: (a) west area; (b) northeast area; (c) north Old Town; (d) south Old Town.
As for the west area (Figure 10a, Figure 11a, Figure 12a and Figure 13a), the DSSI effects were mainly negligible (0.85 < Sa(TSSI)/Sa(Tfixed) ≤ 1.15) or beneficial, with ratios Sa(TSSI)/Sa(Tfixed) ≤ 0.85. For the 2002 input, the B1 block had a small percentage of Sa(TSSI)/Sa(Tfixed) > 1.15, probably due to the poor properties of soil foundation.
As for the northeast area (Figure 10b, Figure 11b, Figure 12b and Figure 13b), non-negligible DSSI phenomena concerned mainly the T1NE stratigraphy, as it was constituted by poor soil. The higher spectral accelerations ratios (Sa(TSSI)/Sa(Tfixed) > 1.15) were obtained for the seismic inputs of 1818 and 2002, especially in the northern part of the investigated area, i.e., for the T1NE stratigraphy. This was due both to the irregular development of the response spectra and to the nature of the foundation soil. For the rock foundation soil, i.e., for the T2NE and T3NE stratigraphies in the southern part of the investigated area, the spectral accelerations ratios were generally beneficial or negligible. The most worrying cases were related to block “A” (34 structures). In particular, 4 structures for 1818 seismic input and 5 structures for 2002 presented higher spectral accelerations ratios (Sa(TSSI)/Sa(Tfixed) > 1.15); these were mainly masonry structures.
As for the north Old Town (Figure 10c, Figure 11c, Figure 12c and Figure 13c), in most cases ratios Sa(TSSI)/Sa(Tfixed) < 1.15 were achieved. Thus, neglecting the DSSI was almost always a safety advantage. However, for some blocks, there were ratios Sa(TSSI)/Sa(Tfixed) > 1.15 and neglecting the DSSI meant working by spectral accelerations lower than those expected to impact the structure. This result was due to the poor soil foundation (T1N and T2 N) on which old buildings were built.
As for the south Old Town (Figure 10d, Figure 11d, Figure 12d and Figure 13d), the dependence of the DSSI effects on the characteristics of the seismic input and on the soil-structure system was evident. For the 1818, 1990, and 2002 inputs, more than 50% of the blocks had buildings for which the spectral accelerations ratios were in the third range, while for the 2018 input the blocks were less than 50%. This confirmed that the soil-structure interaction phenomena depended both on the input and nature of the soil; in fact, for 2018 input, the results were completely different in blocks according to the soil foundation, while for the other inputs, despite the differences of the soils, comparable behaviors were detectable.
In Figure 14, the buildings for which Sa(TSSI)/Sa(Tfixed) > 1.15 are highlighted; for these structures, the performed microzonation analysis suggests a more accurate study of the SSI effects before carrying out any seismic retrofitting.
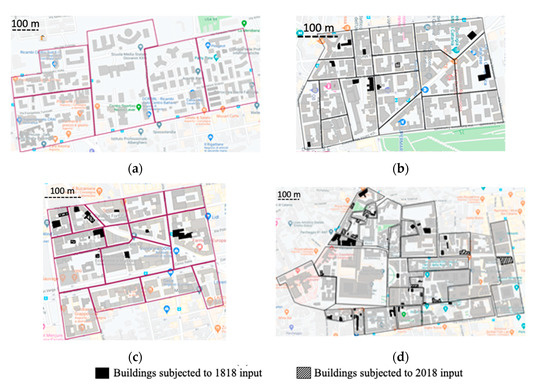
Figure 14.
Identification of the buildings for which Sa(TSSI)/Sa(Tfixed) > 1.15: (a) west area; (b) northeast area; (c) north Old Town; (d) south Old Town.
Figure 15, Figure 16, Figure 17 and Figure 18 report the values of Sa(Tfixed) and Sa(TSSI) for all buildings in the analyzed areas with reference to the inputs of 1818 (a) and 2018 (b), according to the numbering assigned to the buildings shown in Figure 19.
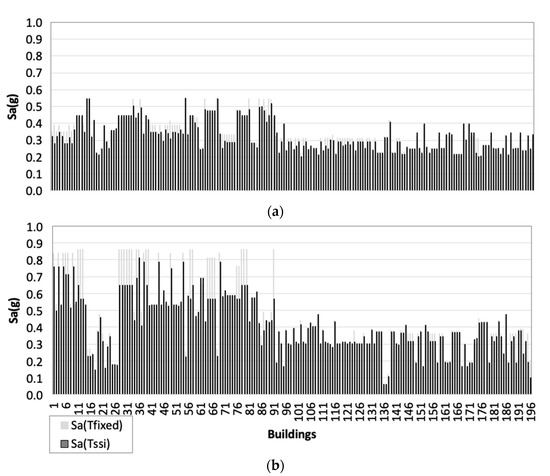
Figure 15.
Spectral accelerations Sa(TSSI) and Sa(Tfixed) evaluated for each building of the west area (shown in Figure 19a) for (a) 1818 input; (b) 2018 input.
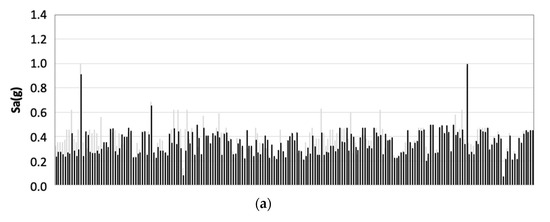
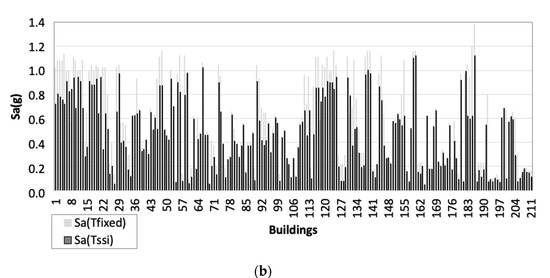
Figure 16.
Spectral accelerations Sa(TSSI) and Sa(Tfixed) evaluated for each building of the northeast area (shown in Figure 19b) for (a) 1818 input; (b) 2018 input.
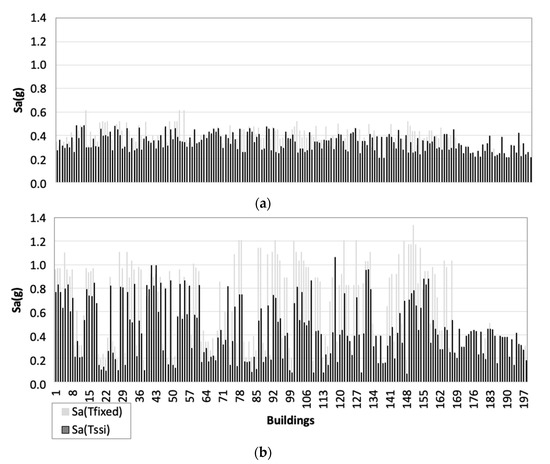
Figure 17.
Spectral accelerations Sa(TSSI) and Sa(Tfixed) evaluated for each building of the north Old Town area (shown in Figure 18c) for (a) 1818 input; (b) 2018 input.
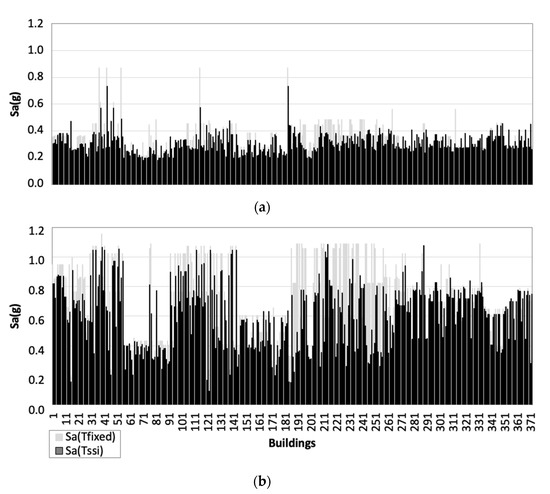
Figure 18.
Spectral accelerations Sa(TSSI) and Sa(Tfixed) evaluated for each building of the south Old Town area (shown in Figure 18c) for (a) 1818 input; (b) 2018 input.
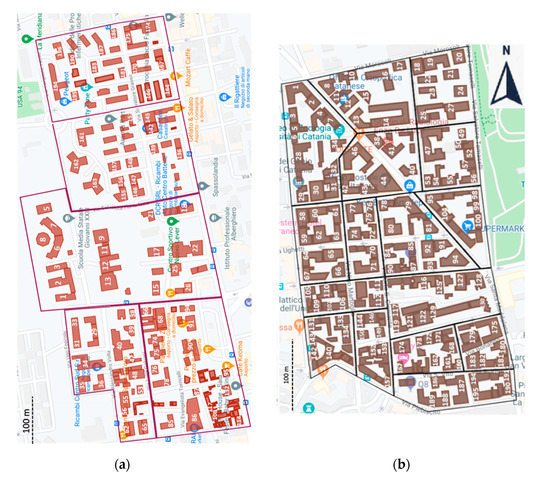
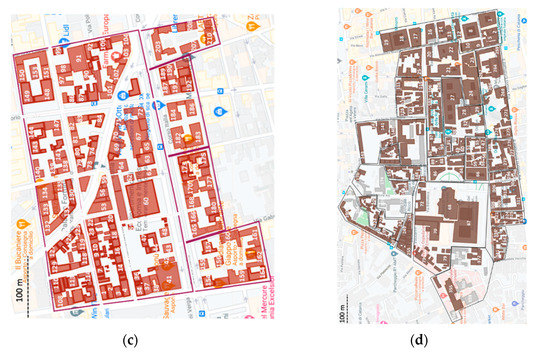
Figure 19.
Location of buildings in the investigated areas: (a) west area; (b) northeast area; (c) north Old Town; (d) south Old Town.
The spectral accelerations Sa(TSSI) are also compared with those suggested by the Italian Technical Code [10]. The results in terms of the spectral accelerations ratio Sa(TSSI)/Sa(NTC2018) are shown in Figure 20, Figure 21, Figure 22 and Figure 23.
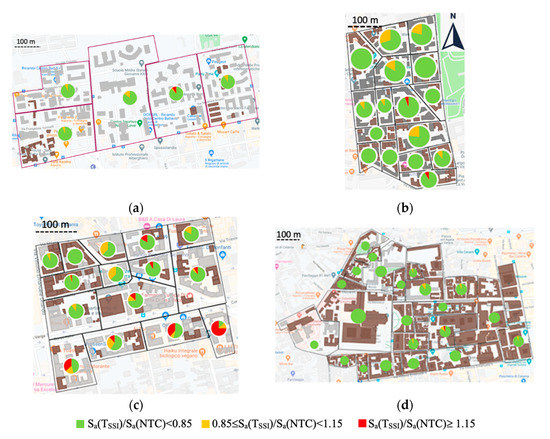
Figure 20.
Spatial distribution of Sa(TSSI)/Sa(NTC2018) ratios for the 1818 seismic input: (a) west area; (b) northeast area; (c) north Old Town; (d) south Old Town.
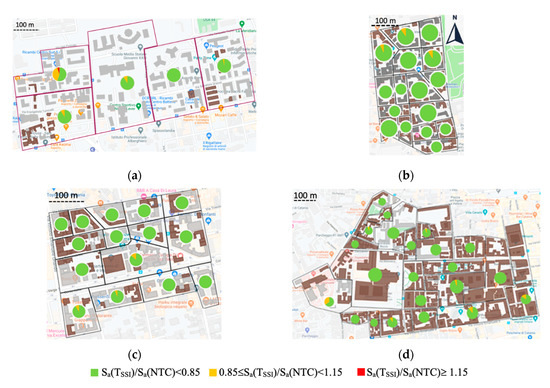
Figure 21.
Spatial distribution of Sa(TSSI)/Sa(NTC2018) ratios for the 1990 seismic input: (a) west area; (b) northeast area; (c) north Old Town; (d) south Old Town.
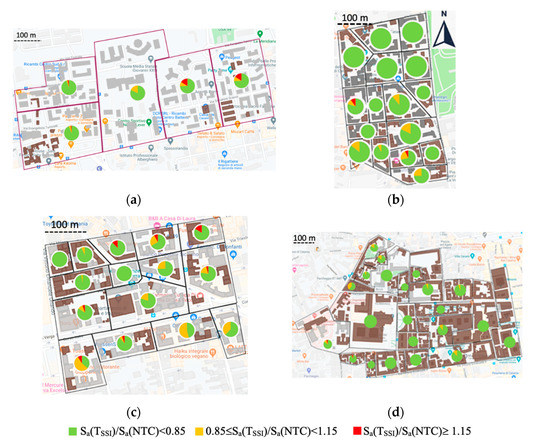
Figure 22.
Spatial distribution of Sa(TSSI)/Sa(NTC2018) ratios for the 2002 seismic input: (a) west area; (b) northeast area; (c) north Old Town; (d) south Old Town.
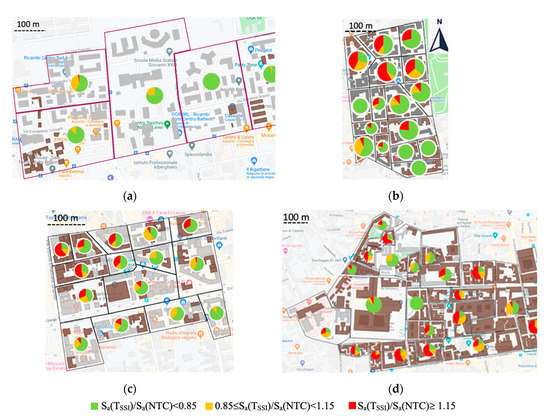
Figure 23.
Spatial distribution of Sa(TSSI)/Sa(NTC2018) ratios for the 2018 seismic input: (a) west area; (b) northeast area; (c) north Old Town; (d) south Old Town.
As for the west area (Figure 20a, Figure 21a, Figure 22a and Figure 23a), the results show that the [10] are essentially conservative, providing Sa(NTC2018) values greater than or almost equal to the Sa(TSSI) values obtained considering the SSI interaction.
As for the northeast area (Figure 20b, Figure 21b, Figure 22b, Figure 23b) and the results indicated that a previously suggested design [10] was not always advantageous; i.e., sometimes the spectral accelerations of the flexible-base structure Sa(TSSI) were higher than those suggested by [10] (Sa(NTC2018)). In fact, the higher spectral accelerations ratios (Sa(TSSI)/Sa(NTC2018) > 1.15) were obtained for the 2018 input, especially in the northern part of the investigated area, i.e., for the T1NE stratigraphy.
As for the north Old Town (Figure 20c, Figure 21c, Figure 22c and Figure 23c), the results showed that [10] were conservative, providing almost always Sa(TSSI)/Sa(NTC2018) < 1.15, except for the 2018 input, for which the spectral accelerations of the flexible-base structure Sa(TSSI) were higher than those suggested by [10] (Sa(NTC2018)). Therefore, the design suggested by [10] was not advantageous.
As for the south Old Town (Figure 20d, Figure 21d, Figure 22d and Figure 23d), the same considerations made for the north Old Town were applied.
Finally, we considered the trends of the TSSI/Tfixed ratios and the Sa(TSSI)/Sa(Tfixed) ratios versus the soil Vs. For lack of space, Figure 24 and Figure 25 show that the results achieved the “south Old Town” area. Figure 24 shows that the ratio between the period of the flexible-base building configuration and the fixed-base one tended to unify as the velocity Vs increased. This behavior was more evident for Vs values higher than 300 m/s. Figure 25 shows that the ratio between the spectral accelerations tended to the unit, as the value of Vs increased. In particular, as the velocity of the shear waves increased, the range of Sa(TSSI)/Sa(Tfixed) ratios decreased and it approached unity from Vs > 300 m/s.
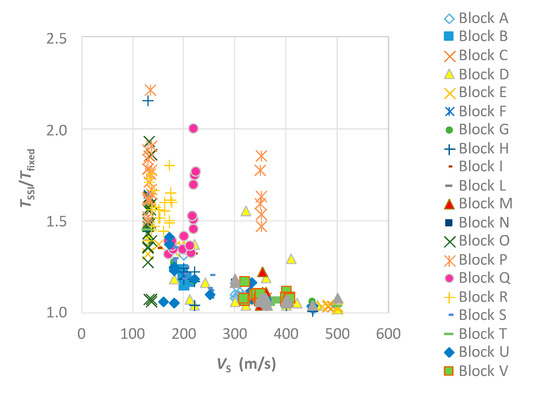
Figure 24.
TSSI/Tfixed ratios versus the shear waves velocities Vs for the south Old Town area.
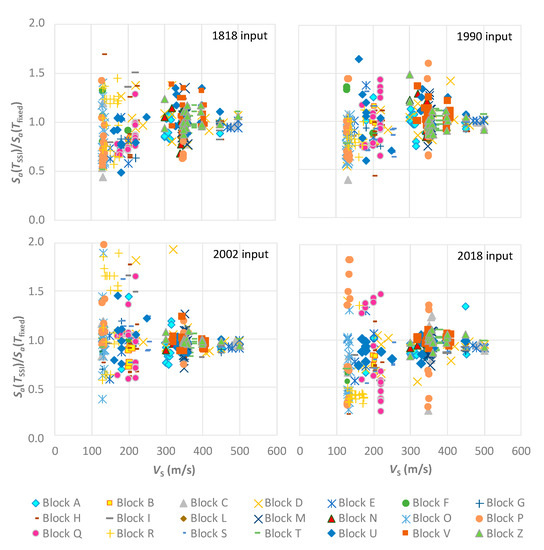
Figure 25.
Sa(TSSI)/Sa(Tfixed) ratios versus shear waves velocities Vs for the south Old Town area.
6. Conclusions
The present paper shows a methodology for a large-scale estimate of SSI effects in some interesting areas of Catania, Italy characterized by high seismic risk. The proposed procedure has a great advantage of being a quick analysis based on simple calculations to evaluate dynamic soil and structural characteristics, as well as the soil seismic response in free-field conditions.
We mapped the ratios of the structural fundamental periods and their related spectral accelerations considering both the fixed-base structure configuration (no SSI) and the flexible-base one (with SSI), in Google My Maps environment. We compared the results with NTC2018 suggestions [10]. These developed maps allowed us to plan the seismic retrofitting of investigated buildings, suggesting more detailed analyses of SSI phenomena when Sa(TSSI)/Sa(Tfixed) > 1.15.
For the analyzed areas, the study showed that the DSSI effects were negligible for the majority of structures (and sometimes they were beneficial). Anyhow, for recent structures, it would be better to consider the DSSI in order to reduce construction costs. However, the DSSI led to detrimental effects for a significant number of buildings, especially for masonry buildings located in soil with poor dynamic characteristics. Furthermore, the study allowed us to make interesting considerations on the reliability of the NTC2018 prescriptions [10], concluding that the design suggested by [10] was not always advantageous and, sometimes, the spectral accelerations of the flexible-base structure Sa(TSSI) were higher than those suggested by [10] (Sa(NTC2018)).
The performed study highlighted the importance of considering the nature of seismic input in addition to the structure's dynamic characteristics and to the geotechnical characteristics of the foundation soil. In fact, the results may have been different if the frequency and input spectrum response were varied. In particular, it could be important to compare the input’s fundamental frequencies with those of soils and structures to understand the differences that occur when input changes. In fact, although the fundamental frequencies of the inputs were only in a few cases close to those of the foundation soils, an important role was assumed by the frequencies for each structure that conducted different spectral accelerations ratios (Sa(TSSI)/Sa(Tfixed)).
The results confirmed the necessity of evaluating DSSI effects for appropriately developed and subsequent seismic retrofitting of existing structures, as well as the seismic design of new ones.
Author Contributions
G.A., S.B., and M.R.M. carried out the investigation and prepared the original manuscript according to the following percentages: 34% G.A., 33% S.B., and 33% M.R.M. All authors have read and agreed to the published version of the manuscript.
Funding
Financial supports provided by the PON Research Project “eWAS_ARS01_00926”, funded by the European Community, and provided by the DPC/ReLUIS 2019-21 Research Project, which is funded by Civil Protection Department, and allowed the authors to achieve the results reported in this paper.
Conflicts of Interest
The authors declare no conflict of interest.
References
- Grassi, F.; Massimino, M.R. Evaluation of kinematic bending moments in a pile foundation using the finite element approach. WIT Trans. Built Environ. 2009, 104, 479–488. [Google Scholar]
- Anastasopoulos, I.; Loli, M.; Georgarakos, T.; Drosos, V. Shaking Table Testing of Rocking−Isolated Bridge Pier on Sand. J. Earthq. Eng. 2013, 17, 1–32. [Google Scholar] [CrossRef]
- Gazetas, G. 4th Ishihara lecture: Soil–foundation–structure systems beyond conventional seismic failure thresholds. Soil Dyn. Earthq. Eng. 2015, 68, 23–39. [Google Scholar] [CrossRef]
- De Silva, F.; Pitilakis, D.; Ceroni, F.; Sica, S.; Silvestri, F. Experimental and numerical dynamic identification of a historic masonry bell tower accounting for different types of interaction. Soil Dyn. Earthq. Eng. 2018, 109, 235–250. [Google Scholar] [CrossRef]
- Abate, G.; Grasso, S.; Massimino, M.R. The role of shear wave velocity and non-linearity of soil in the seismic response of a coupled tunnel-soil-above ground building system. Geosciences 2019, 9, 473. [Google Scholar] [CrossRef]
- Arabpanahan, M.; Mirghaderi, S.R.; Hosseini, A.; Ghalandarzadeh, A.; Sharif, A.P. Hysteretic cyclic response of “SDOF-embedded foundation” system rocking on sand: An experimental study. Bull. Earthq. Eng. 2019, 17, 5897–5958. [Google Scholar] [CrossRef]
- Abate, G.; Massimino, M.R. Dynamic soil-structure interaction analysis by experimental and numerical modelling. Riv. Ital. Geotec. 2016, 50, 44–70. [Google Scholar]
- Abate, G.; Massimino, M.R.; Romano, S. Finite Element Analysis of DSSI Effects for a Building of Strategic Importance in Catania (Italy). Procedia Eng. 2016, 158, 374–379. [Google Scholar] [CrossRef][Green Version]
- Massimino, M.R.; Abate, G.; Grasso, S.; Pitilakis, D. Some aspects of DSSI in the dynamic response of fully-coupled soil-structure systems. Riv. Ital. Geotec. 2019, 1, 44–70. [Google Scholar]
- NTC 2018. D.M. 17/01/18—Updating of technical standards for buildings. Off. J. Ital. Repub. 2018, 42. Available online: https://www.gazzettaufficiale.it/eli/gu/2018/02/20/42/so/8/sg/pdf (accessed on 19 November 2020).
- Veletsos, A.S.; Meek, J. Dynamic behaviour of building-foundation systems. Earthq. Eng. Struct. Dyn. 1974, 3, 121–138. [Google Scholar] [CrossRef]
- Building Seismic Safety Council (BSSC). NEHRP Recommended Seismic Provisions for New Buildings and Other Structures; FEMA P-750; Federal Emergency Management Agency: Washington, DC, USA, 2009. [Google Scholar]
- Rovithis, E.; Kirtas, E.; Bliziotis, D.; Maltezos, E.; Pitilakis, D.; Makra, K.; Savvaidis, A.; Karakostas, C.; Lekidis, V. A LiDAR-aided urban-scale assessment of soil-structure interaction effects: The case of Kalochori residential area (N. Greece). Bull. Earthq. Eng. 2017, 15, 4821–4850. [Google Scholar] [CrossRef]
- Gueguen, P.; Brad, P. Site-City Seismic Interaction in Mexico City-Like Environments: An Analytical Study. Bull. Seismol. Soc. Am. 2002, 92, 794–811. [Google Scholar] [CrossRef]
- Knappett, J.A.; Madden, P.; Caucis, K. Seismic structure-soil-structure interaction between pairs of adjacent building structures. Geotechnique 2015, 65, 429–441. [Google Scholar] [CrossRef]
- Isbiliroglu, Y.; Taborda, R.; Bielak, J. Coupled soil-structure interaction effects of building clusters during earthquakes. Earthq. Spectra 2015, 31, 463–500. [Google Scholar] [CrossRef]
- NTC 2008. D.M. 14/01/08—New technical standards for buildings. Off. J. Ital. Repub. 2008, 29. Available online: https://www.camera.it/cartellecomuni/leg15/RapportoAttivitaCommissioni/commissioni/allegati/08/08_all_dm_2008.pdf (accessed on 19 November 2020).
- Veletsos, A.S.; Verbic, B. Vibration of Viscoelastic Foundations. Earthq. Eng. Struct. Dyn. 1973, 2, 87–105. [Google Scholar] [CrossRef]
- U. S. Department of Homeland Security; FEMA. Improvement of Nonlinear Static Seismic Analysis Procedures; FEMA 440; Federal Emergency Management Agency: Washington, DC, USA, 2005. [Google Scholar]
- EC8—Design of Structures for Earthquake Resistance. European Pre-Standard. ENV 1998. Europ. Com. for Stand. Brux. 2003. Available online: https://www.phd.eng.br/wp-content/uploads/2015/02/en.1998.1.2004.pdf (accessed on 19 November 2020).
- Worku, A. Soil-structure-interaction provisions. A potential tool to consider for economical seismic design of buildings? J. S. Afr. Inst. Civ. Eng. 2014, 56, 54–62. [Google Scholar]
- Building Seismic Safety Council (BSSC). National Earthquake Hazard. Reduction Program. (NEHRP): Recommended Provisions (and Commentary) for Seismic Regulations for New Buildings and Other Structures; FEMA 450-1 and 450–2; BSSC: Washington, DC, USA, 2004. [Google Scholar]
- Building Seismic Safety Council (BSSC). National Earthquake Hazard. Reduction Program. (NEHRP): Recommended Provisions for Seismic Regulations for Buildings and Other Structures; FEMA 750; BSSC: Washington, DC, USA, 2010. [Google Scholar]
- Chopra, K.A. Dynamics of Structures, Theory and Ap-plications to Earthquake Engineering; Prentice Hall International: Des Moines, IA, USA, 1995. [Google Scholar]
- Cavallaro, A.; Grasso, S.; Maugeri, M. Volcanic soil characterization and site response analysis in the city of Catania. In Proceedings of the 8th US National Conference on Earthquake Engineering 2006, San Francisco, CA, USA, 18–22 April 2006; Volume 2, pp. 835–844. [Google Scholar]
- Cavallaro, A.; Grasso, S.; Ferraro, A. A Geotechnical Engineering Study for the Safeguard, Restoration and Strengthening of Historical Heritage. Procedia Eng. 2016, 158, 134–139. [Google Scholar] [CrossRef][Green Version]
- Castelli, F.; Grasso, S.; Lentini, V.; Massimino, M.R. In situ measurements for evaluating liquefaction potential under cyclic loading. In Proceedings of the 1st IMEKO TC4 International Workshop on Metrology for Geotechnics, MetroGeotechnics 2016, Benevento, Italy, 17–18 March 2016; pp. 79–84, Code 121564. [Google Scholar]
- Grasso, S.; Massimino, M.R. A GIS for data mining in seismic microzonation studies. Smart Innov. Syst. Technol. 2019, 142, 191–201. [Google Scholar]
- Faccioli, E.; Pessina, V. The Catania Project: Earthquake Damage Scenarios for High Risk Area in the Mediterranean; Faccioli, E., Pessina, V., Eds.; CNR-Gruppo Nazionale per la Difesa dai Terremoti: Roma, Italy, 2000; 225p. [Google Scholar]
- Maugeri, M. Advances in earthquake engineering. In Seismic Prevention of Damage: A Case Study in a Mediterranean City; WIT Press: Southampton, UK, 2005; Volume 14. [Google Scholar]
- Grasso, S.; Maugeri, M. Vulnerability of physical environment of the city of Catania using GIS technique. In Seismic Prevention of Damage: A Case Study in a Mediterranean City; Maugeri, M., Ed.; WIT Press: Southampton, UK, 2005; Chapter IX; pp. 155–175. [Google Scholar]
- Grasso, S.; Laurenzano, G.; Maugeri, M.; Priolo, E. Seismic response in Catania by different methodologies. In Seismic Prevention of Damage: A Case Study in a Mediterranean City; Maugeri, M., Ed.; WIT Press: Southampton, UK, 2005; Chapter IV; pp. 63–79. [Google Scholar]
- Abate, G.; Bosco, M.; Massimino, M.R.; Maugeri, M. Limit state analysis for the Catania fire-station (Italy). In Proceedings of the 8th US National Conference on Earthquake Engineering 2006, San Francisco, CA, USA, 18–22 April 2006; Volume 11, pp. 6532–6541. [Google Scholar]
- Abate, G.; Corsico, S.; Massimino, M.R. FEM Modelling of the Seismic Behaviour of a Tunnel-Soil-Aboveground Building System: A Case History in Catania (Italy). Procedia Eng. 2016, 158, 380–385. [Google Scholar] [CrossRef]
- Caruso, S.; Ferraro, A.; Grasso, S.; Massimino, M.R. Site Response Analysis in eastern Sicily based on direct and indirect Vs measurements. In Proceedings of the 1st IMEKO TC4 International Workshop on Metrology for Geotechnics, MetroGeotechnics, Benevento, Italy, 17–18 March 2016; pp. 115–120. [Google Scholar]
- Castelli, F.; Cavallaro, A.; Ferraro, A.; Grasso, S.; Lentini, V.; Massimino, M.R. Static and dynamic properties of soils in Catania (Italy). Ann. Geophys. 2018, 61, 221. [Google Scholar] [CrossRef]
- Ferraro, A.; Grasso, S.; Massimino, M.R. Site effects evaluation in Catania (Italy) by means of 1-D numerical analysis. Ann. Geophys. 2018, 61, 224. [Google Scholar] [CrossRef]
- Massimino, M.R.; Abate, G.; Corsico, S.; Louarn, R. Comparison between two approaches for non-linear FEM modelling of the seismic behaviour of a coupled soil–structure system. Geotech. Geol. Eng. 2019, 37, 1957–1975. [Google Scholar] [CrossRef]
- Kottke, A.R.; Rathie, E.M.; Wang, X. Technical Manual for Strata; Pacific Earthquake Engineering Research Center: Berkeley, CA, USA, 2013. [Google Scholar]


Publisher’s Note: MDPI stays neutral with regard to jurisdictional claims in published maps and institutional affiliations. |
© 2020 by the authors. Licensee MDPI, Basel, Switzerland. This article is an open access article distributed under the terms and conditions of the Creative Commons Attribution (CC BY) license (http://creativecommons.org/licenses/by/4.0/).