Methane and Dissolved Organic Matter in the Ground Ice Samples from Central Yamal: Implications to Biogeochemical Cycling and Greenhouse Gas Emission

 , , , and
Abstract
1. Introduction
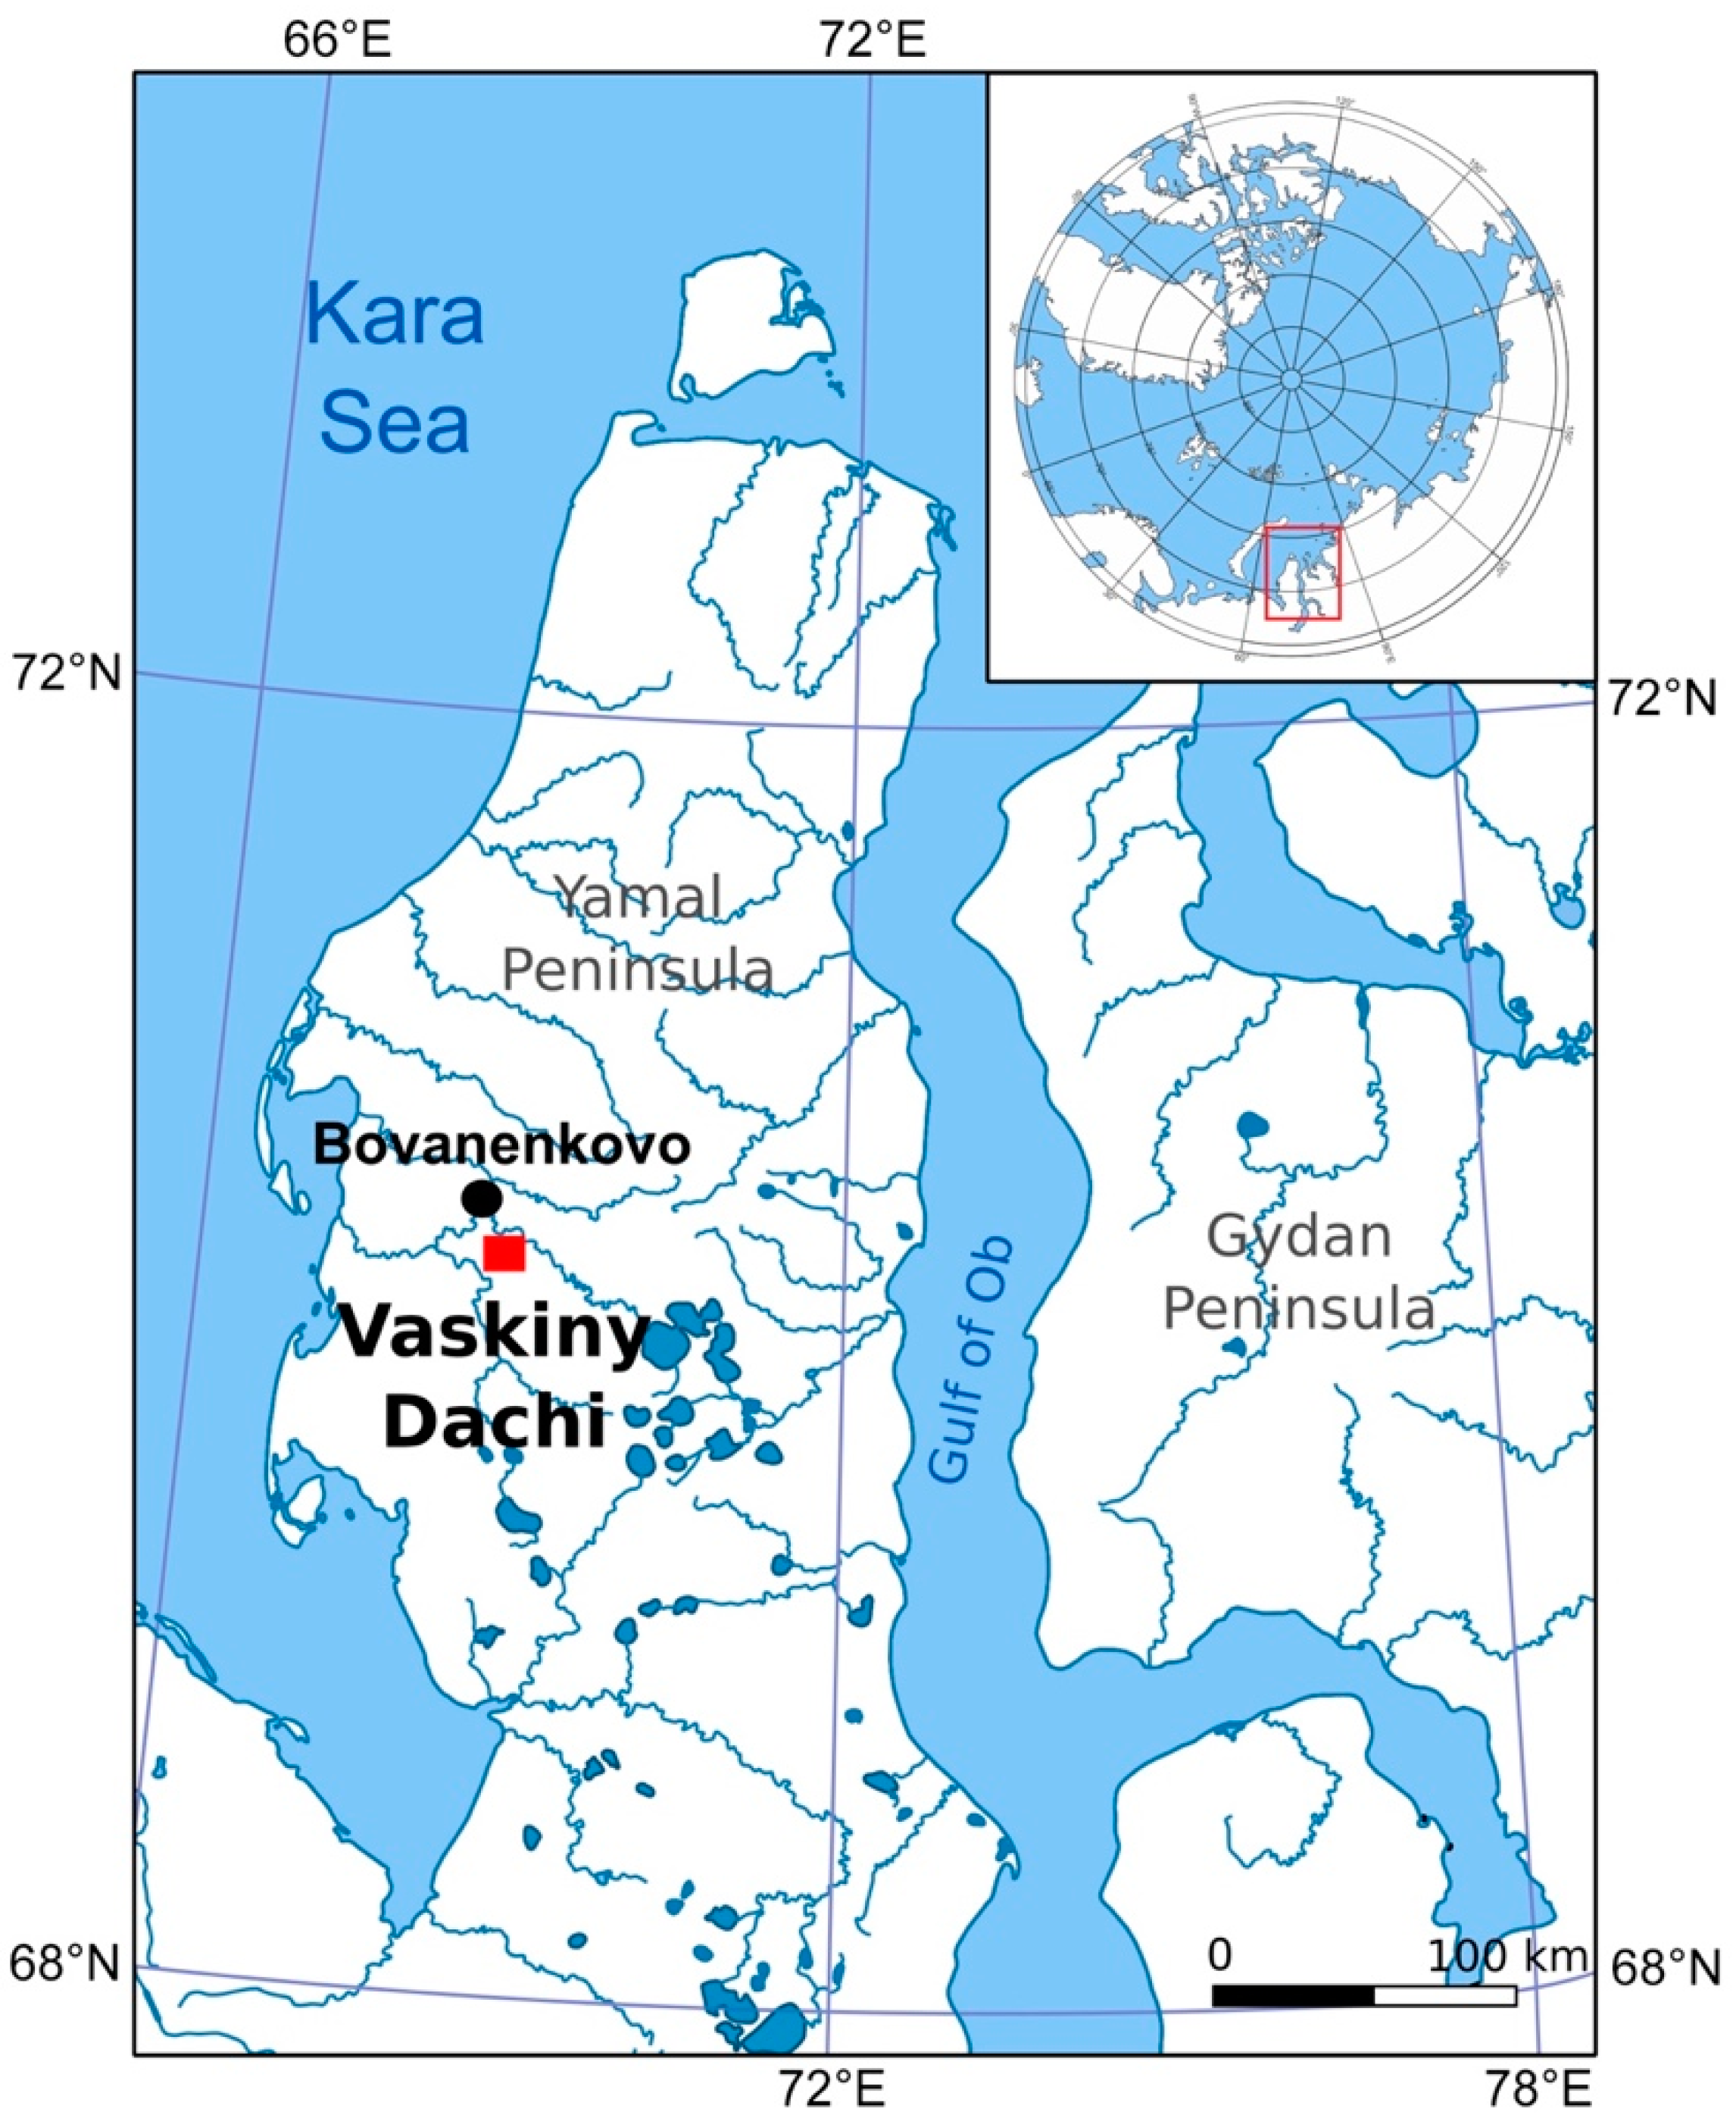
2. Study Area
3. Materials and Methods
3.1. Ground Ice Physical Properties and Dissolved Gas Analysis
3.2. Stable Isotopic Composition of Carbon and Hydrogen in Methane
3.3. Dissolved Organic Carbon (DOC) and Dissolved Inorganic Carbon (DIC) Measurements
3.4. Thaw Water Solutes
3.5. Fluorescence Measurements of Dissolved Organic Matter Molecular Composition
3.6. Statistical Analyses
4. Results
4.1. Free Gas, Soil Content, and pH
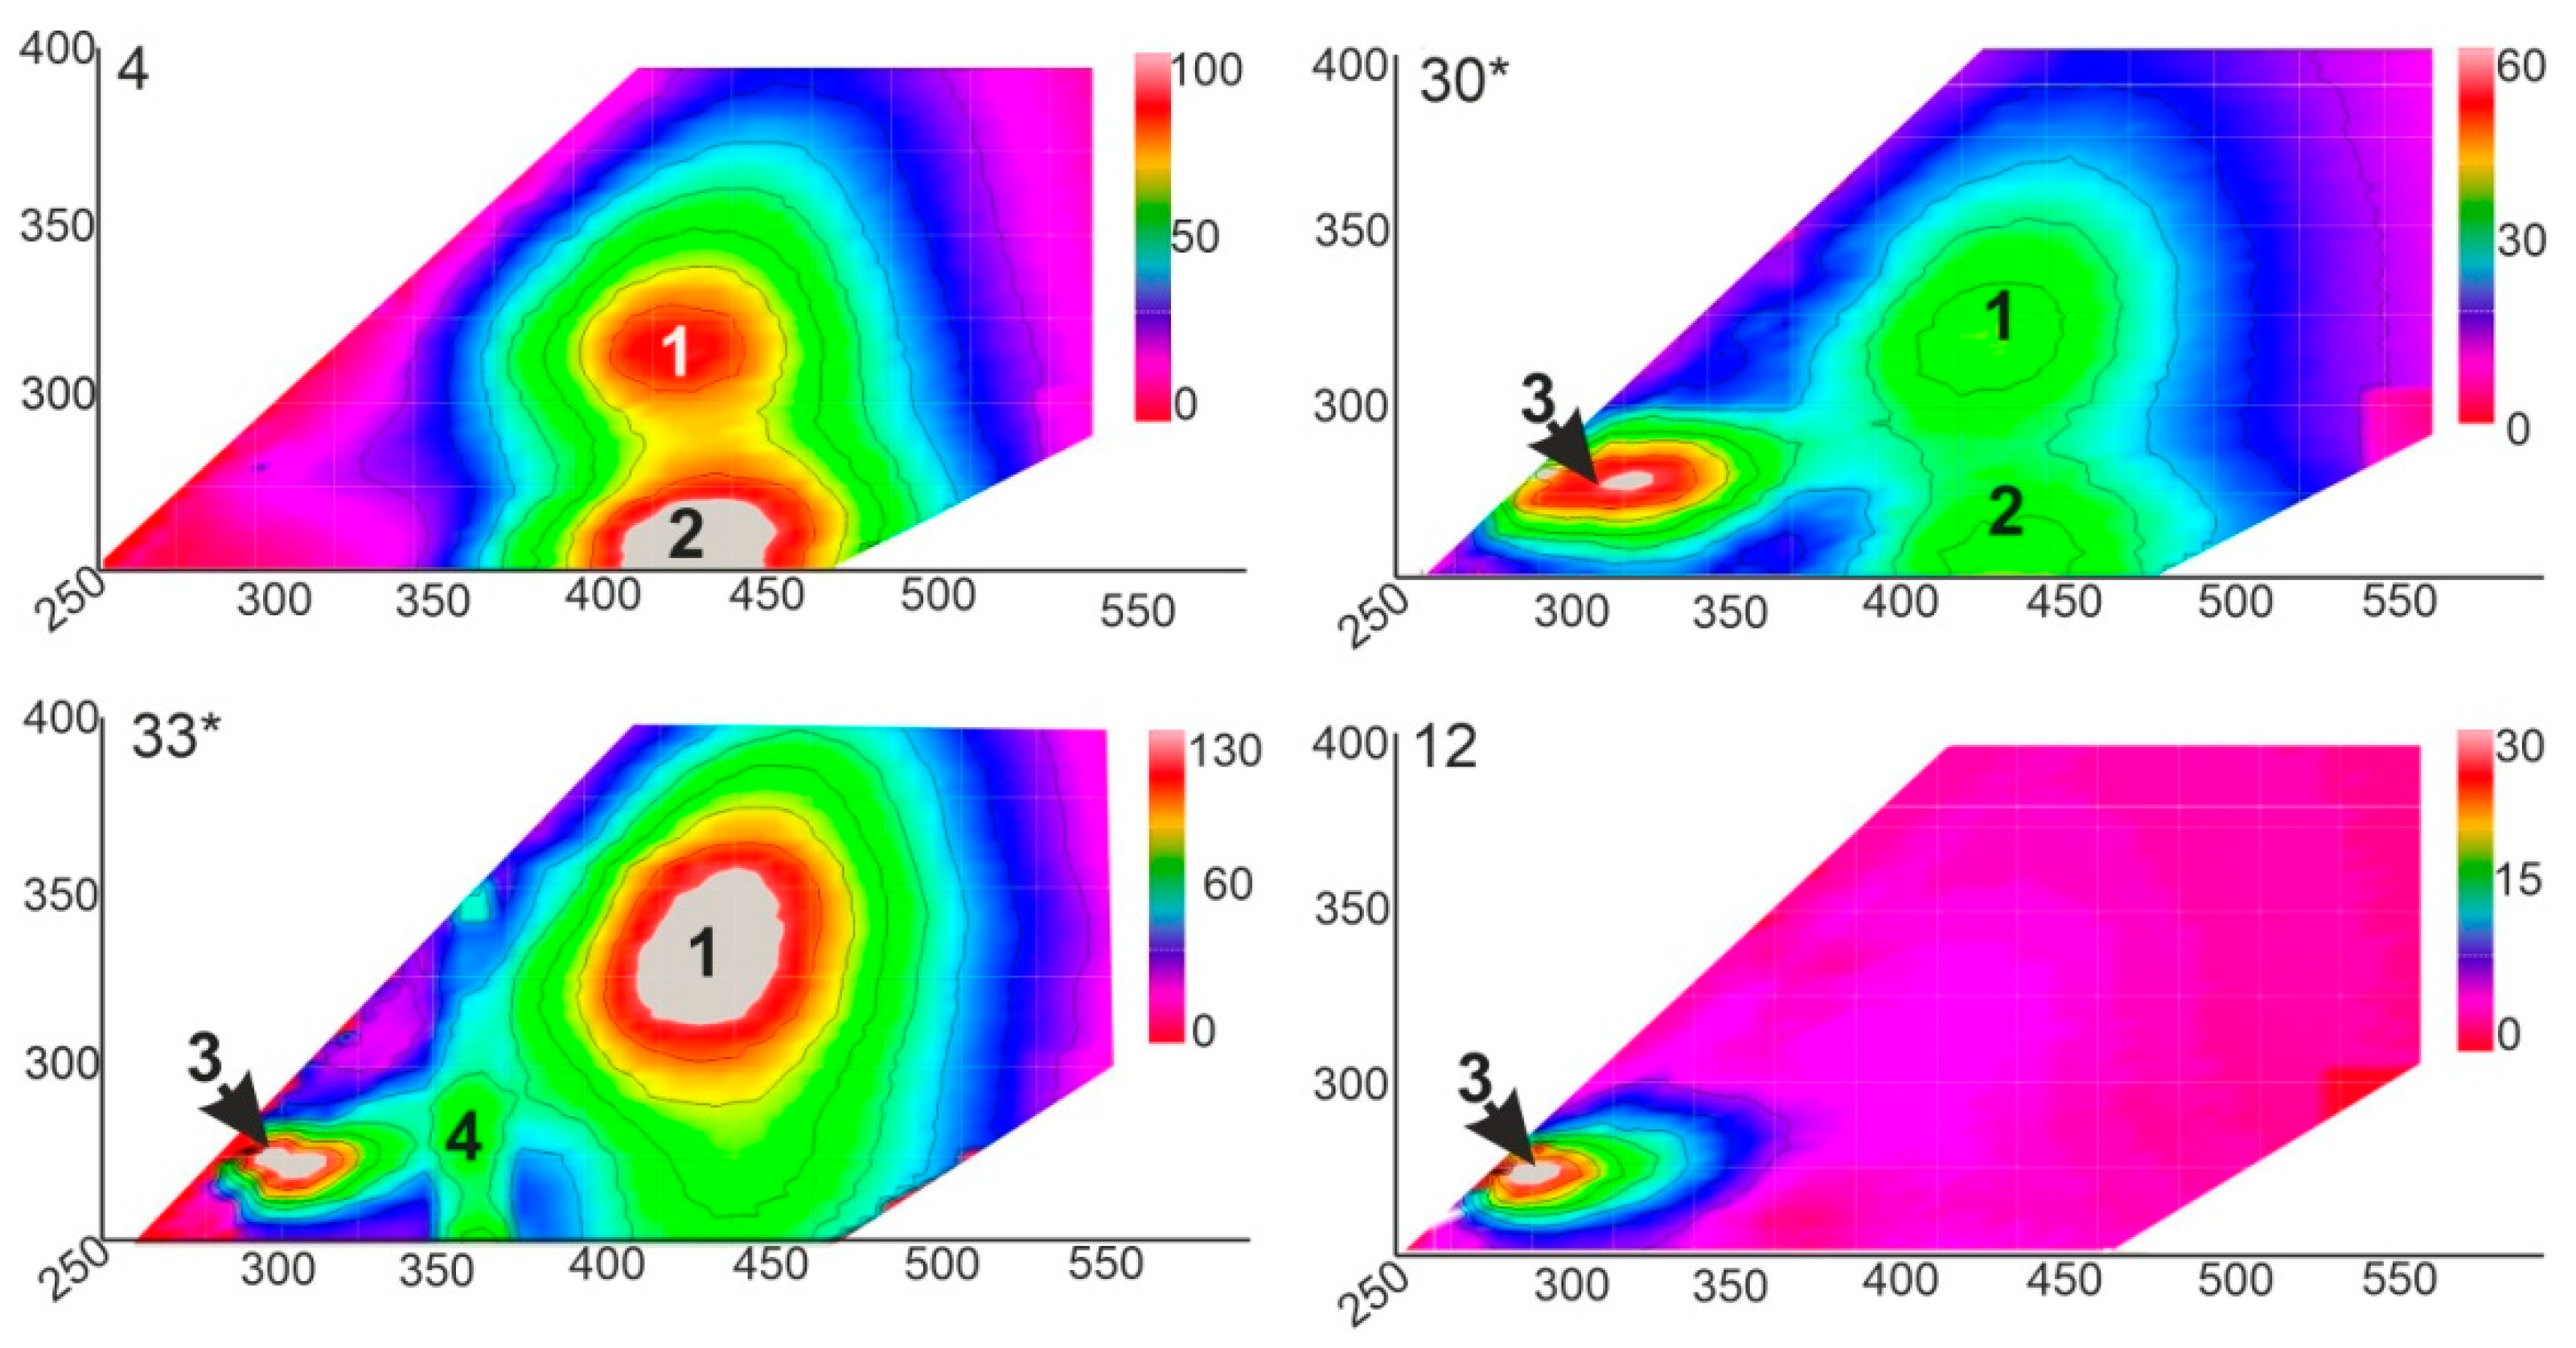
4.2. CH4 Content, C2–C5 Gases
4.3. Bulk Geochemical Parameters (DOC, DIC, DIN), Dissolved Nutrients, and Electron Acceptors (NH4+, NO3−, SO42−, PO43−)
4.4. DOM Fractions
5. Discussion
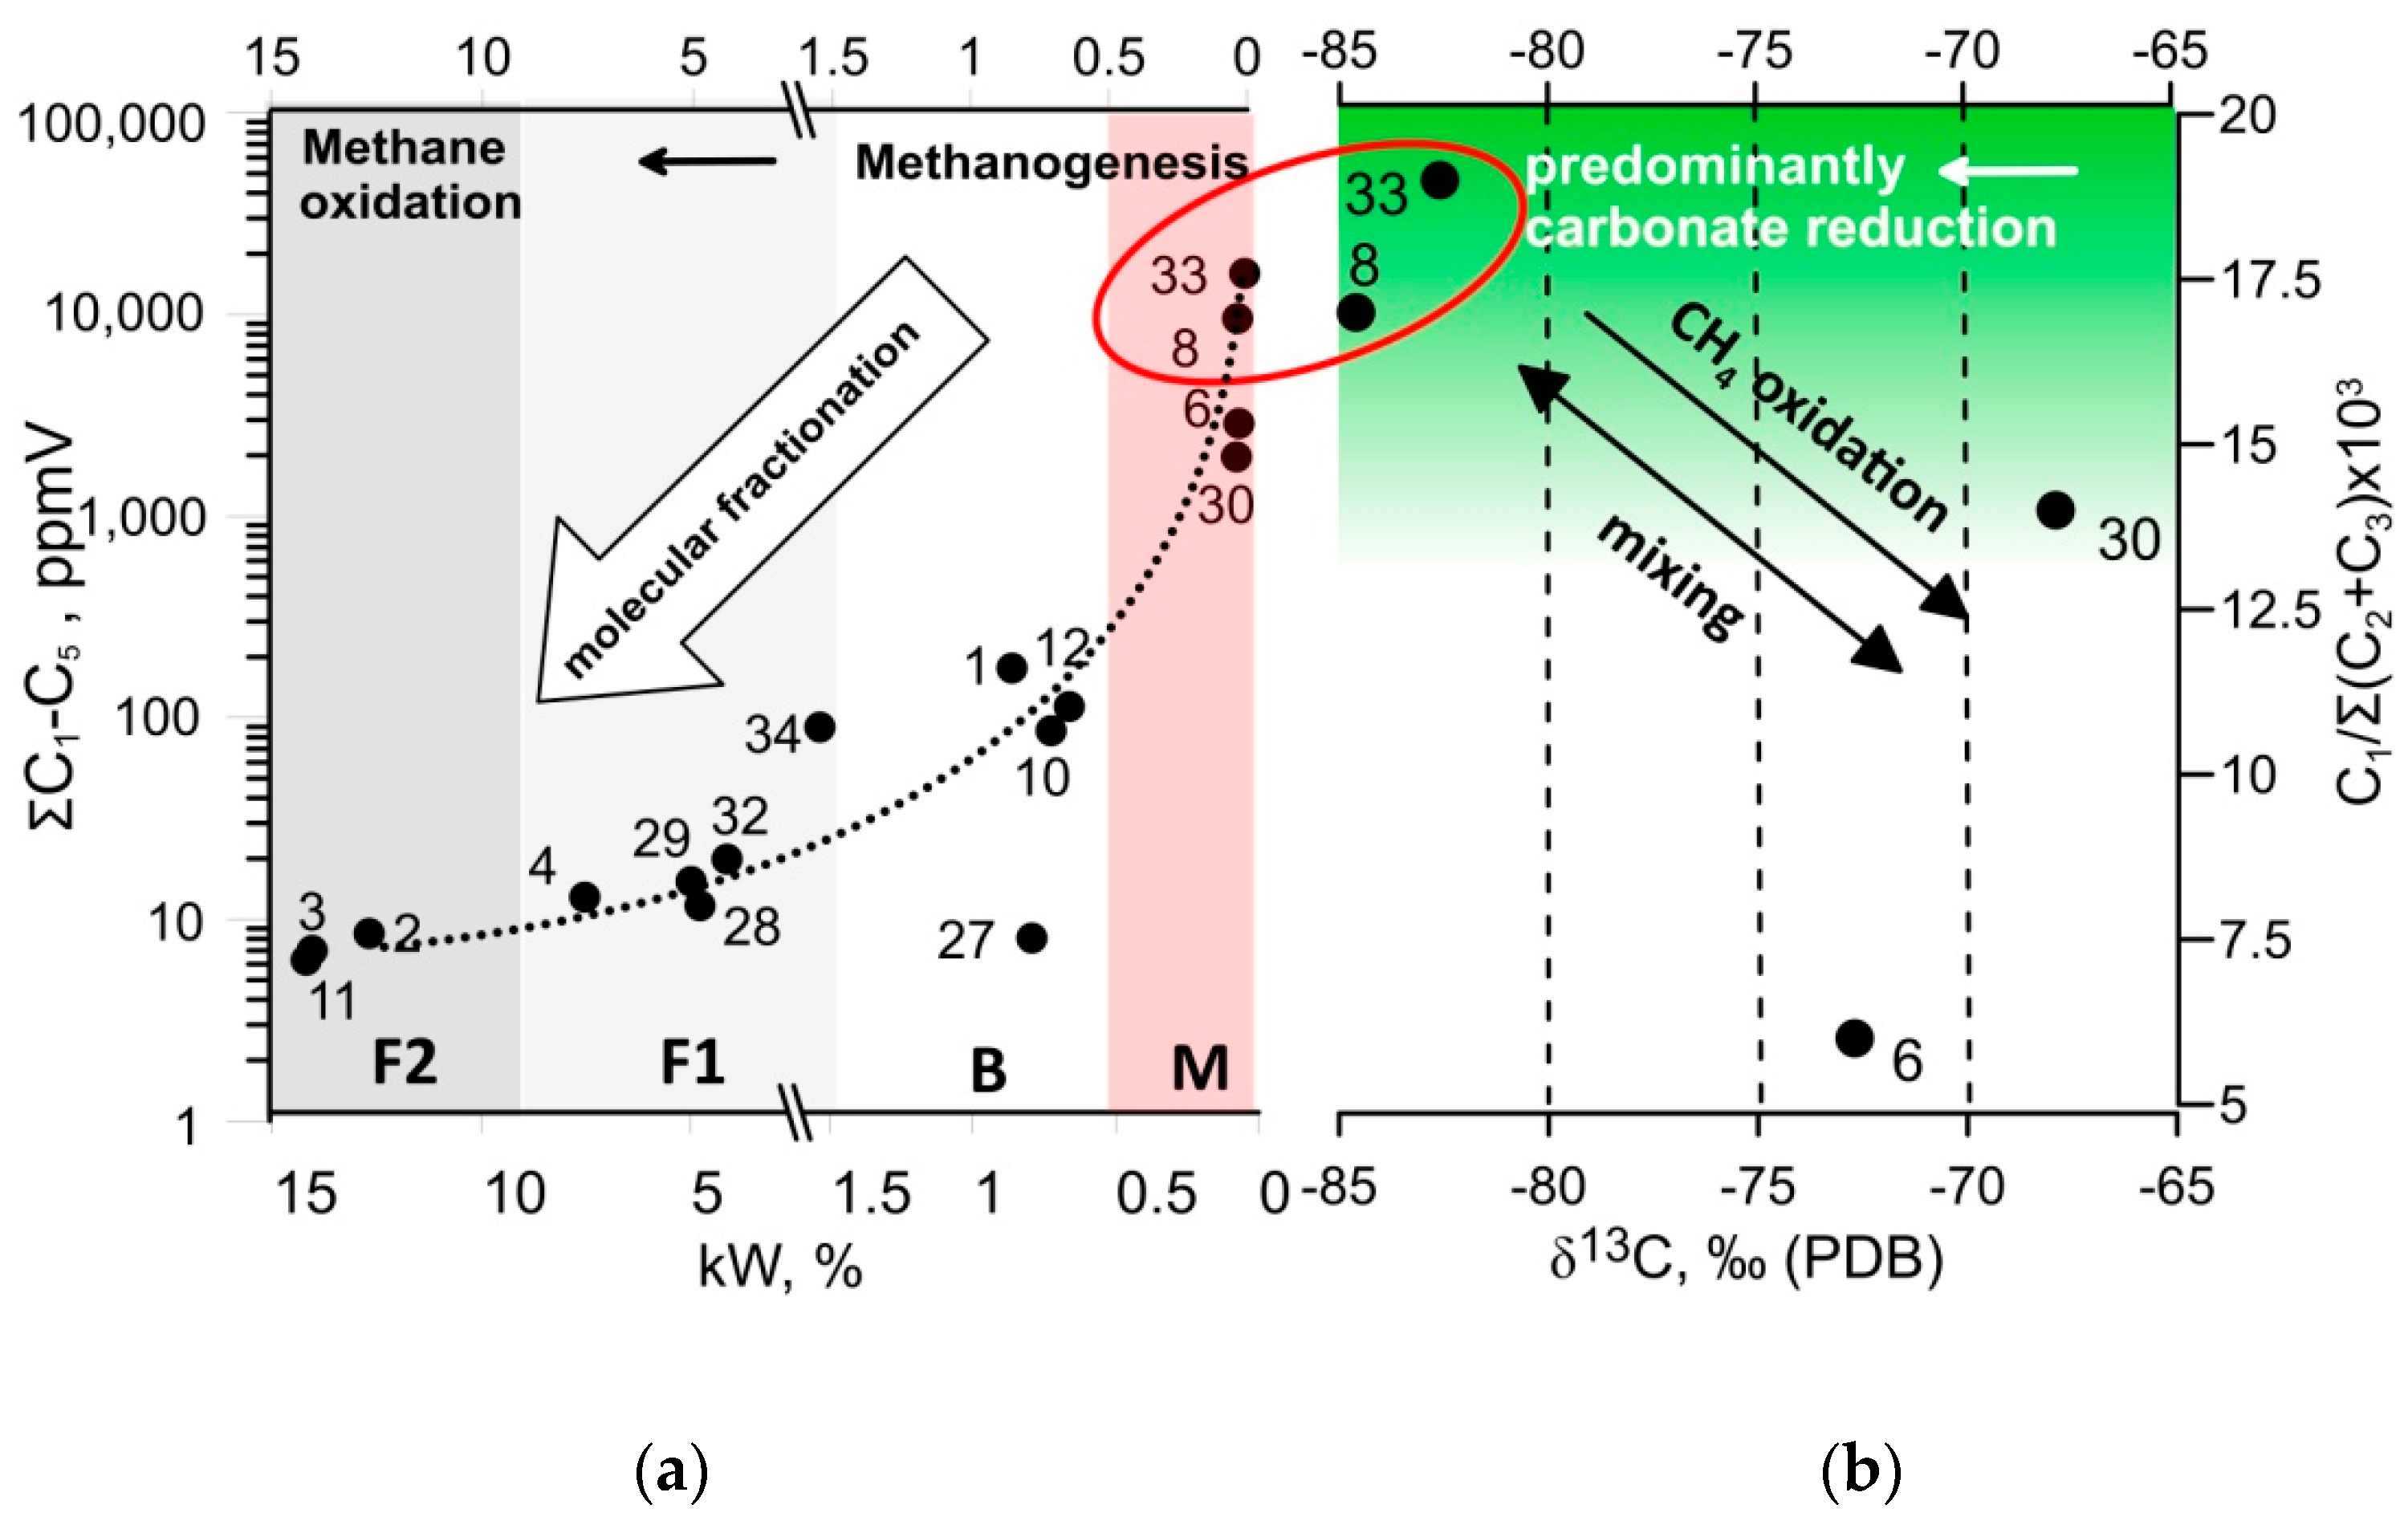
5.1. Methane Genesis, Storage, and Cycling
5.2. Fluorescent Dissolved Organic Matter (fDOM) Composition and Labile DOM Contribution to Biogeochemical Cycling
5.3. Biogeochemical Environments and Their Potential for the GHG Liberation upon Thawing
6. Conclusions
Author Contributions
Funding
Acknowledgments
Conflicts of Interest
Abbreviations
| DOC | Dissolved organic carbon |
| DOM | Dissolved organic matter |
| GHG | Greenhouse gas |
| OM | Organic matter |
| BDOC | Biodegradable dissolved organic carbon |
| TGI | Tabular ground ice |
| CDOM | Colored dissolved organic matter |
| ALD | Active layer depth |
| MIS | Marine isotope stage |
| HG | Light hydrocarbon gases |
| GC | gas chromatograph |
| DIC | Dissolved inorganic carbon |
| GF/F | glass microfiber syringe filter |
| IC | ion chromatograph |
| DIN | Dissolved inorganic nitrogen |
| EEM | Excitation Emission Matrix fluorimetry |
| FI | fluorescent index |
| BIX | biological index |
| fDOM | fluorescent dissolved organic matter |
| hDOM | humic-like dissolved organic matter |
| fDOM | fluorescent dissolved organic matter |
| pDOM | protein-like dissolved organic matter |
| TrpDOM | tryptophan-like dissolved organic matter |
| TyrDOM | tyrosine-like |
| KIE | kinetic isotope effect |
| LMW | low molecular weight |
| IRMS | isotopic-ratio mass spectrometry |
References
- Romanovsky, V.; Isaksen, K.; Drozdov, D.; Anisimov, O.; Instanes, A.; Leibman, M.; McGuire, A.D.; Shiklomanov, N.; Smith, S.; Walker, D.; et al. Snow, Water, Ice and Permafrost in the Arctic (SWIPA); Arctic Monitoring and Assessment Programme (AMAP): Oslo, Norway, 2017; pp. 65–102. [Google Scholar]
- Mu, C.; Zhang, T.; Wu, Q.; Peng, X.; Cao, B.; Zhang, X.; Cao, B.; Cheng, G. Organic carbon pools in permafrost regions on the Qinghai-Xizang (Tibetan) Plateau. Cryosphere 2015, 9, 479–486. [Google Scholar] [CrossRef]
- Zimov, S.A.; Schuur, E.A.G.; Chapin, F.S. Permafrost and the global carbon budget. Science 2006, 312, 1612–1613. [Google Scholar] [CrossRef]
- Chapin, F.S., III; Woodwell, G.M.; Randerson, J.T.; Rastetter, E.B.; Lovett, G.M.; Baldocchi, D.D.; Clark, D.A.; Harmon, M.E.; Schimel, D.S.; Valentini, R.; et al. Reconciling carbon-cycle concepts, terminology, and methods. Ecosystems 2006, 9, 1041–1050. [Google Scholar] [CrossRef]
- Cole, J.J.; Prairie, Y.T.; Caraco, N.F.; McDowell, W.H.; Tranvik, L.J.; Striegl, R.G.; Duarte, C.M.; Kortelainen, P.; Downing, J.A.; Middelburg, J.J.; et al. Plumbing the global carbon cycle: Integrating inland waters into the terrestrial carbon budget. Ecosystems 2007, 10, 172–185. [Google Scholar] [CrossRef]
- Textor, S.R.; Wickland, K.P.; Podgorski, D.C.; Johnston, S.E.; Spencer, R.G.M. Dissolved Organic Carbon Turnover in Permafrost-Influenced Watersheds of Interior Alaska: Molecular Insightsand the Priming Effect. Front. Earth Sci. 2019, 7. [Google Scholar] [CrossRef]
- Vonk, J.E.; Tank, S.E.; Mann, P.J.; Spencer, R.G.M.; Treat, C.C.; Striegl, R.G.; Abbott, B.W.; Wickland, K.P. Biodegradability of dissolved organic carbon in permafrost soils and aquatic systems: A meta-analysis. Biogeosciences 2015, 12, 6915–6930. [Google Scholar] [CrossRef]
- Drake, T.W.; Wickland, K.P.; Spencer, R.G.M.; McKnight, D.M.; Striegl, R.G. Ancient low-molecular-weight organic acids in permafrost fuel rapid carbon dioxide production upon thaw. Proc. Natl. Acad. Sci. USA 2015, 112, 13946–13951. [Google Scholar] [CrossRef]
- Spencer, R.G.M.; Mann, P.J.; Dittmar, T.; Eglinton, T.I.; McIntyre, C.; Holmes, R.M.; Zimov, N.; Stubbins, A. Detecting the signature of permafrost thaw in Arctic rivers. Geophys. Res. Lett. 2015, 42, 2830–2835. [Google Scholar] [CrossRef]
- Knoblauch, C.; Beer, C.; Liebner, S.; Grigoriev, M.N.; Pfeiffer, E.M. Methane production as key to the greenhouse gas budget of thawing permafrost. Nat. Clim. Change 2018, 8, 309–312. [Google Scholar] [CrossRef]
- Kraev, G.; Schulze, E.-D.; Yurova, A.; Kholodov, A.; Chuvilin, E.; Rivkina, E. Cryogenic Displacement and Accumulation of Biogenic Methane in Frozen Soils. Atmosphere 2017, 8, 105. [Google Scholar] [CrossRef]
- Streletskaya, I.D.; Vasiliev, A.A.; Oblogov, G.E.; Streletskiy, D.A. Methane Content in Ground Ice and Sediments of the Kara Sea Coast. Geosciences 2018, 8, 434. [Google Scholar] [CrossRef]
- Kraev, G.; Rivkina, E.; Vishnivetskaya, T.; Belonosov, A.; van Huissteden, J.; Kholodov, A.; Smirnov, A.; Kudryavtsev, A.; Teshebaeva, K.; Zamolodchikov, D. Methane in Gas Shows from Boreholes in Epigenetic Permafrost of Siberian Arctic. Geosciences 2019, 9, 67. [Google Scholar] [CrossRef]
- Rivkina, E.; Shcherbakova, V.; Laurinavichius, K.; Petrovskaya, L.; Krivushin, K.; Kraev, G.; Pecheritsina, S.; Gilichinsky, D. Biogeochemistry of methane and methanogenic archaea in permafrost. FEMS Microbiol. Ecol. 2007, 61, 1–15. [Google Scholar] [CrossRef] [PubMed]
- Whiticar, M.J. Carbon and hydrogen isotope systematics of bacterial formation and oxidation of methane. Chem. Geol. 1999, 161, 291–314. [Google Scholar] [CrossRef]
- Leibman, M.O.; Khomutov, A.V.; Gubarkov, A.A.; Mullanurov, D.R.; Dvornikov, Y.A. The research station “Vaskiny Dachi”, Central Yamal, West Siberia, Russia–A review of 25 years of permafrost studies. Fennia 2015, 193, 3–30. [Google Scholar] [CrossRef][Green Version]
- Khomutov, A.V.; Leibman, M.O.; Dvornikov, Y.A.; Gubarkov, A.A.; Mullanurov, D.R.; Khairullin, R.R. Activation of Cryogenic Earth Flows and Formation of Thermocirques on Central Yamal as a Result of Climate Fluctuations. In Advancing Culture of Living with Landslides, Vol. 5: Landslides in Different Environments; Mikoš, M., Vilímek, V., Eds.; Springer International Publishing: Berlin, Germany, 2017; pp. 209–216. [Google Scholar]
- Dvornikov, Y.A.; Leibman, M.O.; Heim, B.; Khomutov, A.V.; Roessler, S.; Gubarkov, A.A. Thermodenudation on Yamal peninsula as a source of the dissolved organic matter increase in thaw lakes. Earth’s Cryosphere 2017, 21, 28–37. [Google Scholar] [CrossRef]
- Fouché, J.; Lafrenière, M.J.; Rutherford, K.; Lamoureux, S. Seasonal hydrology and permafrost disturbance impacts on dissolved organic matter composition in High Arctic headwater catchments. Arct. Sci. 2017, 3, 378–405. [Google Scholar] [CrossRef]
- Leibman, M.O.; Kizyakov, A.I.; Plekhanov, A.V.; Streletskaya, I.D. New permafrost feature–deep crater in Central Yamal, West Siberia, Russia, as a response to local climate fluctuations. Geogr. Environ. Sustain. 2014, 7, 68–80. [Google Scholar] [CrossRef]
- Streletskaya, I.D.; Leibman, M.O.; Kizyakov, A.I.; Oblogov, G.E.; Vasiliev, A.A.; Khomutov, A.V.; Dvornikov, Y.A. Podzemnye ldy i ih rol v formirovanii voronki gazovogo vybrosa na poluostrove Yamal. Ground Ice and its Role in the Formation of Gas-Emission Crater in the Yamal Peninsula. Moscow Univ. Bull. Ser. Geogr. 2017, 2, 91–99. (In Russian) [Google Scholar]
- Badu, Y.B.; Podborny, E.E. Osobennosti kriosfery Bovanenkovskogo NGKM. Specific features of the cryosphere of the Bovanenkovo OGCF. In Cryosphere of Oil and Gas Condensate Fields of the Yamal Peninsula. The cryosphere of the Bovanenkovo Oil-Gas-Condensate Field; Badu, Y.B., Gafarov, N.A., Podborny, E.E., Eds.; OOO Gazprom Expo: Moscow, Russia, 2013; Volume 2, pp. 391–411. (In Russian) [Google Scholar]
- Leibman, M.O.; Kizyakov, A.I. Kriogennye Opolzni Yamala i Yugorskogo Poluostrova. Cryogenic Landslides of the Yamal and Yugorsky Peninsulas; Earth Cryosphere Institute SB RAS: Moscow, Russia, 2007; 206p. (In Russian) [Google Scholar]
- Nekrasov, D.; Kizyakov, A.; Leibman, M.; Khomutov, A.; Dvornikov, Y.; Streletskaya, I. Comprehensive studies of ground ice at central Yamal. In Proceedings of the 5th European Conference on Permafrost (EUCOP 2018), Chamonix-Mont Blanc, France, 23 June–1 July 2018; Deline, P., Bodin, X., Ravanel, L., Eds.; Publisher: Chamonix, France, 2018; pp. 658–659. [Google Scholar]
- Streletskaya, I.D.; Leibman, M.O. Kriogeohimicheskaya vzaimosvyaz plastovyh ldov, kriopegov i vmeshchayushchih ih otlozhenij Centralnogo Yamala. Cryogeochemical interrelation of massive ground ice, cryopegs, and enclosing deposits of Central Yamal. Kriosf. Zemli Cryosphere Earth 2002, 4, 15–24. (In Russian) [Google Scholar]
- Fotiev, S.M. Himicheskij sostav i genezis vody, sformirovavshej povtorno-inekcionnye plastovye ldy na ploshchadi Bovanenkovskogo mestorozhdeniya. Chemical composition and origin of water which formed intrusive massive ice beds in the area of the Bovanekovo field. Kriosf. Zemli Cryosphere Earth 2012, 16, 3–28. (In Russian) [Google Scholar]
- Vasil’chuk, Y.K.; Vasil’chuk, A.C.; Budantseva, N.A.; Chizhova, J.N.; Papesch, W.; Podborny, Y.Y. 14C age, stable isotope composition and pollen analysis of massive ice, Bovanenkovo gas field, Central Yamal Peninsula. Geogr. Environ. Sustain. 2014, 7, 49–70. [Google Scholar] [CrossRef][Green Version]
- Ioffe, B.V.; Vitenberg, A.G. Head-Space Analysis and Related Methods in Gas Chromatography; Wiley: New York, NY, USA, 1984. [Google Scholar]
- Yamamoto, S.; Alcauskas, J.B.; Crozier, T.E. Solubility of methane in distilled water and seawater. J. Chem. Eng. 1976, 21, 78–80. [Google Scholar] [CrossRef]
- Abrams, M.A. Significance of hydrocarbon seepage relative to sub-surface petroleum generation and entrapment. Mar. Petrol. Geol. 2005, 22, 457–478. [Google Scholar] [CrossRef]
- Waldron, S.; Lansdrown, J.V.; Scott, E.M. The global influence of the hydrogen isotope composition of water on that of bacteriogenic methane from shallow freshwater environments. Geochim. Cosmochim. Acta 1999, 63, 2237–2245. [Google Scholar] [CrossRef]
- Trivittayasil, V.; Tsuta, M.; Kokawa, M.; Yoshimura, M.; Sugiyama, J.; Fujita, K.; Shibata, M. Method of determining the optimal dilution ratio for fluorescence fingerprint of food constituents. Biosci. Biotechnol. Biochem. 2015, 79, 652–657. [Google Scholar] [CrossRef][Green Version]
- Lawaetz, A.J.; Stedmon, C.A. Fluorescence Intensity Calibration Using the Raman Scatter Peak of Water. Appl. Spectrosc. 2009, 63, 936–940. [Google Scholar] [CrossRef]
- McKnight, D.M.; Boyer, E.W.; Westerhoff, P.K.; Doran, P.T.; Kulbe, T.; Andersen, D.T. Spectrofluorometric characterization of aquatic fulvic acids for determination of precursor organic material and general structural properties. Limnol. Oceanogr. 2001, 46, 38–48. [Google Scholar] [CrossRef]
- Coble, P.G.; Green, S.; Blough, N.V.; Gagosian, R.B. Characterization of dissolved organic matter in the Black Sea by fluorescence spectroscopy. Nature 1990, 348, 432–435. [Google Scholar] [CrossRef]
- Hudson, N.; Baker, A.; Reynolds, D. Fluorescence analysis of dissolved organic matter in natural, waste and polluted waters-a review. Riv. Res. Applic. 2007, 23, 631–649. [Google Scholar] [CrossRef]
- Fritz, M.; Opel, T.; Tanski, G.; Herzschuh, U.; Meyer, H.; Eulenburg, A.; Lantuit, H. Dissolved organic carbon (DOC) in Arctic ground ice. Cryosphere 2015, 9, 737–752. [Google Scholar] [CrossRef]
- Jørgensen, B.B. Bacteria and marine biogeochemistry. In Marine Geochemistry; Schulz, H.D., Zabel, M., Eds.; Springer: Berlin/Heidelberg, Germany, 2006; pp. 169–206. [Google Scholar]
- Bernard, B.B.; Brooks, J.M.; Sackett, W.M. Light hydrocarbons in recent Texas continental shelf and slope sediments. J. Geophys. Res. 1978, 83, 4053–4061. [Google Scholar] [CrossRef]
- Streletskaya, I.D.; Vasiliev, A.A.; Oblogov, G.E.; Semenov, P.B.; Vanshtein, B.G.; Rivkina, E.M. Metan v podzemnyh ldah i myorzlyh otlozheniyah na poberezhe i shelfe Karskogo moray. Methane in ground ice and frozen sediments in the coastal zone and on the shelf of Kara Sea. Led Sneg Ice Snow 2018, 58, 65–77. [Google Scholar] [CrossRef]
- Rivkina, E.M.; Krayev, G.N.; Krivushin, K.V.; Laurinavichyus, K.S.; Fedorov-Davydov, D.G.; Kholodov, A.L.; Shcherbakova, V.A.; Gilichinskiy, D.A. Metan v vechnomerzlykh otlozheniyakh severo-vostochnogo sektora Arktiki. Methane in the permafrost deposits of the northeastern sector of the Arctic. Kriosf. Zemli. Cryosphere Earth 2006, 10, 23–41. (In Russian) [Google Scholar]
- Koch, K.; Knoblauch, C.; Wagner, D. Methanogenic community composition and anaerobic carbon turnover in submarine permafrost sediments of the Siberian Laptev Sea. Environ. Microbiol. 2009, 11, 657–668. [Google Scholar] [CrossRef]
- Zimov, S.; Zimov, N. Role of Megafauna and Frozen Soil in the Atmospheric CH4 Dynamics. PLoS ONE 2014, 9. [Google Scholar] [CrossRef]
- Brouchkov, A.; Fukuda, M. Preliminary Measurements on Methane Content in Permafrost, Central Yakutia, and some Experimental Data. Permafr. Periglac. Process. 2002, 13, 187–197. [Google Scholar] [CrossRef]
- Lein, A.Y.; Leybman, M.O.; Savichev, A.S.; Miller, Y.M.; Pimenov, N.V. Izotopno–biogeokhimicheskiye osobennosti podzemnogo plastovogo lda poluostrovov Yugorskogo i Yamal. Isotope-biogeochemical features of underground formation ice of the Yugorsk and Yamal peninsulas. Geokhimiya Geochem. 2003, 10, 1084–1104. (In Russian) [Google Scholar]
- Vasiliev, A.A.; Melnikov, V.P.; Semenov, P.B.; Oblogov, G.E.; Streletskaya, I.D. Methane Concentration and 36 Emission in Dominant Landscapes of Typical Tundra of Western Yamal. Dokl. Earth Sci. 2019, 485, 284–287. [Google Scholar] [CrossRef]
- Yamashita, Y.; Tanoue, E. Chemical characterization of protein-like fluorophores in DOM in relation to aromatic aminoacids. Mar. Chem. 2003, 82, 255–271. [Google Scholar] [CrossRef]
- Yamashita, Y.; Fichot, C.G.; Shen, Y.; Jaffé, R.; Benner, R. Linkages among fluorescent dissolved organic matter, dissolved aminoacids and lignin-derived phenols in ariver-influenced ocean margin. Front. Mar. Sci. 2015, 2. [Google Scholar] [CrossRef]
- Jan, M.T.; Roberts, P.; Tonheim, S.K.; Jones, D.L. Protein breakdown represents a major bottleneck in nitrogen cycling in grassland soils. Soil Biol. Biochem. 2009, 41, 2272–2282. [Google Scholar] [CrossRef]
- Kogel-Knabner, I. The macromolecular organic composition of plant and microbial residues as inputs to soil organic matter. Soil Biol. Biochem. 2002, 34, 139–162. [Google Scholar] [CrossRef]
- Savvichev, A.S.; Leibman, M.O.; Kadnikov, V.; Kallistova, A.; Pimenov, N.; Ravin, N.; Dvornikov, Y.A.; Khomutov, A.V. Microbiological Study of Yamal Lakes: A Key to Understanding the Evolution of Gas Emission Craters. Geosciences 2018, 8, 478. [Google Scholar] [CrossRef]
- Selvam, B.P.; Lapierre, J.F.; Guillemette, F.; Voigt, C.; Lamprecht, R.E.; Biasi, C.; Christensen, T.R.; Martikainen, P.J.; Berggren, M. Degradation potentials of dissolved organic carbon (DOC) from thawed permafrost peat. Sci. Rep. 2017, 7, 45811. [Google Scholar] [CrossRef]
- Wickland, K.P.; Aiken, G.R.; Butler, K.; Dornblaser, M.M.; Spencer, R.G.M.; Striegl, R.G. Biodegradability of dissolved organic carbon in the Yukon River and its tributaries: Seasonality and importance of inorganic nitrogen. Glob. Biogeochem. Cycles 2012, 26, GB0E03. [Google Scholar] [CrossRef]
- Topp, E.; Pattey, E. Soils as sources and sinks for atmospheric methane. Can. J. Soil Sci. 1997, 77, 167–178. [Google Scholar] [CrossRef]


| Ex300-370 Em400-500 | Ex237-270 Em400-500 | Ex270-280 Em300-320 | Ex270-280 Em320-350 |
|---|---|---|---|
| Humic-like, hDOM-1 | Humic-like, hDOM-1 | Protein-like (Tyrosine-like), TyrDOM | Protein-like (Tryptophan-like), TrpDOM |
| Sample # | Sampling Depth, m | Bulk Free Gas, cm3/kg | Soil, g/kg | pH |
|---|---|---|---|---|
| 1 | 4.26 | 27.1 | 1.40 | 7.1 |
| 2 | 4.26 | 55.4 | 3.80 | 7.1 |
| 3 | 6.01 | 42.6 | 36.80 | 7.32 |
| 4 | 6.01 | 34.2 | 0.04 | 8.36 |
| 10 | 5.06 | 40.2 | 57.64 | 6.96 |
| 11 | 5.06 | 37.5 | 1.22 | 6.76 |
| 12 | 5.06 | 27.4 | 0.01 | 6.45 |
| 27 | 5.46 | 19.6 | 0.02 | 6.9 |
| 28 | 5.01 | 29.3 | 4.62 | 6.41 |
| 29 | 3.91 | 24.0 | 12.44 | 7.42 |
| 30 | 3.46 | 47.7 | 0.33 | 7.55 |
| 6 * | 7.96 | 5.4 | 15.90 | 7.4 |
| 8 * | 7.96 | 8.8 | 844.65 | 7.5 |
| 32 * | 6.2 | 35.2 | 2.13 | 7.16 |
| 33 * | 4.9 | 14.5 | 0.43 | 7.08 |
| 34 * | 4.9 | 18.1 | 50.70 | 7.06 |
| Median value | 28.3 | 2.92 | 7.1 | |
| Std.dev. | 13.9 | 208.94 | 0.5 | |
| Coff.Var. | 47.7 | 323.91 | 6.5 | |
| Sample # | CH4, ng/g | δ 13C1, ‰ | δD1, ‰ | Total HCG in HP, ppm | kW, % |
|---|---|---|---|---|---|
| 1 | 81.41 | - | - | 114 | 0.64 |
| 2 | 45.23 | - | - | 9 | 12.68 |
| 3 | 4.08 | - | - | 6 | 14.18 |
| 4 | 7.90 | - | - | 13 | 7.58 |
| 10 | 141.45 | - | - | 176 | 0.85 |
| 11 | 3.60 | - | - | 7 | 14.04 |
| 12 | 51.34 | - | - | 86 | 0.71 |
| 27 | 5.77 | - | - | 8 | 0.78 |
| 28 | 7.82 | - | - | 12 | 4.85 |
| 29 | 9.53 | - | - | 15 | 5.06 |
| 30 | 1282.30 | −68 | −378 | 1968 | 0.03 |
| 6 * | 1875.88 | −72 | −369 | 2880 | 0.04 |
| 8 * | 7890.47 | −84 | −394 | 9558 | 0.15 |
| 32 * | 78.72 | - | - | 20 | 4.21 |
| 33 * | 11,278.03 | −82 | −397 | 16,016 | 0.01 |
| 34 * | 60.59 | - | - | 90 | 1.55 |
| Median value | 55.96 | 53 | 1.19 | ||
| Std.dev. | 3287.34 | 4473 | 5.19 | ||
| Coff.Var. | 230.44 | 231 | 123.30 |
| Sample # | PO43−, mkg/L | NO3−, mg/L | NH4+, mg/L | SO42−, mg/L | DIN, mg/L | DOC, mg/L | DIC, mg/L | |
|---|---|---|---|---|---|---|---|---|
| 1 | 13.0 | 0.04 | 1.43 | 3.80 | 1.1 | 10.55 | 7.03 | |
| 2 | 9.0 | 0.02 | 3.05 | 0.89 | 2.4 | 10.52 | 5.96 | |
| 3 | 0.0 | 0.01 | 3.40 | 2.89 | 2.7 | 13.46 | 16.37 | |
| 4 | 4.0 | 0.19 | 0.37 | 1.43 | 0.3 | 6.59 | 11.99 | |
| 10 | 3.6 | 0.17 | 2.76 | 1.27 | 2.2 | 6.22 | 6.03 | |
| 11 | 6.0 | 0.00 | 1.61 | 1.49 | 1.3 | 7.34 | 4.71 | |
| 12 | 0.0 | 0.14 | 0.72 | 0.19 | 0.6 | 5.49 | 0.91 | |
| 27 | 4.0 | 0.03 | 0.90 | 1.76 | 0.7 | 4.89 | 2.48 | |
| 28 | 8.0 | 0.03 | 3.14 | 2.46 | 2.5 | 10.98 | 8.44 | |
| 29 | 6.0 | 0.00 | 2.54 | 1.87 | 2.0 | 8.2 | 10.05 | |
| 30 | 5.0 | 0.00 | 2.55 | 0.26 | 2.0 | 8.06 | 7.66 | |
| 6 * | 8.0 | 0.32 | 1.61 | 8.35 | 3.2 | 13.34 | 9.9 | |
| 8 * | 30.0 | 1.65 | 7.08 | 22.90 | 5.9 | 21.42 | 12.78 | |
| 32 * | 6.0 | 0.01 | 1.98 | 5.93 | 1.5 | 6.58 | 3.08 | |
| 33 * | 9.0 | 0.00 | 1.35 | 1.02 | 1.1 | 4.51 | 2.11 | |
| 34 * | 8.0 | 0.04 | 3.00 | 2.06 | 2.3 | 9.65 | 7.33 | |
| Median | 6.00 | 0.03 | 2.26 | 1.82 | 1.98 | 8.13 | 7.18 | |
| Std.dev | 6.87 | 0.41 | 1.57 | 5.55 | 1.33 | 4.28 | 4.24 | |
| Coef.Var | 91.89 | 244.13 | 67.05 | 151.68 | 67.05 | 46.28 | 58.00 |
| Sample # | fDOM, RU | hDOM-1, RU | hDOM-2, RU | TyrDOM, RU | TrpDOM, RU | fDOM, RU/mg × L−1C | BIX | FI |
|---|---|---|---|---|---|---|---|---|
| 1 | 3.38 | 1.70 | 1.26 | 0.42 | 0.00 | 10.55 | 0.4 | 1.5 |
| 2 | 3.06 | 1.44 | 1.16 | 0.46 | 0.00 | 10.52 | 0.5 | 1.7 |
| 3 | 2.72 | 1.23 | 1.11 | 0.38 | 0.00 | 13.46 | 0.6 | 1.6 |
| 4 | 0.87 | 0.50 | 0.32 | 0.04 | 0.00 | 6.59 | 0.6 | 1.6 |
| 10 | 0.96 | 0.28 | 0.30 | 0.39 | 0.00 | 6.22 | 0.6 | 1.6 |
| 11 | 1.68 | 0.74 | 0.67 | 0.27 | 0.00 | 7.34 | 0.5 | 1.6 |
| 12 | 0.24 | 0.00 | 0.00 | 0.24 | 0.00 | 5.49 | 0.8 | 2.0 |
| 27 | 0.80 | 0.27 | 0.28 | 0.26 | 0.00 | 4.89 | 0.5 | 1.5 |
| 28 | 2.54 | 1.21 | 1.21 | 0.12 | 0.00 | 10.98 | 0.5 | 1.6 |
| 29 | 1.53 | 0.67 | 0.67 | 0.18 | 0.00 | 8.20 | 0.5 | 1.7 |
| 30 | 0.39 | 0.09 | 0.16 | 0.14 | 0.00 | 8.06 | 0.6 | 1.6 |
| 06 * | 2.09 | 0.65 | 0.39 | 0.67 | 0.38 | 13.34 | 0.6 | 1.5 |
| 08 * | 4.91 | 2.32 | 1.08 | 0.96 | 0.54 | 21.42 | 0.8 | 1.6 |
| 32 * | 1.45 | 0.47 | 0.45 | 0.31 | 0.23 | 6.58 | 0.6 | 1.5 |
| 33 * | 1.06 | 0.31 | 0.28 | 0.25 | 0.23 | 4.51 | 0.6 | 1.6 |
| 34 * | 1.80 | 0.59 | 0.51 | 0.70 | 0.00 | 9.65 | 0.7 | 1.6 |
| Median value | 1.60 | 0.62 | 0.48 | 0.29 | 0.23 | 8.13 | 0.59 | 1.58 |
| Std.dev. | 1.23 | 0.64 | 0.42 | 0.24 | 0.20 | 4.27 | 0.10 | 0.12 |
| Coff.Var. | 67.10 | 81.83 | 67.95 | 66.57 | 73.52 | 46.28 | 18.39 | 7.83 |
Publisher’s Note: MDPI stays neutral with regard to jurisdictional claims in published maps and institutional affiliations. |
© 2020 by the authors. Licensee MDPI, Basel, Switzerland. This article is an open access article distributed under the terms and conditions of the Creative Commons Attribution (CC BY) license (http://creativecommons.org/licenses/by/4.0/).
Share and Cite
Semenov, P.B.; Pismeniuk, A.A.; Malyshev, S.A.; Leibman, M.O.; Streletskaya, I.D.; Shatrova, E.V.; Kizyakov, A.I.; Vanshtein, B.G. Methane and Dissolved Organic Matter in the Ground Ice Samples from Central Yamal: Implications to Biogeochemical Cycling and Greenhouse Gas Emission. Geosciences 2020, 10, 450. https://doi.org/10.3390/geosciences10110450
Semenov PB, Pismeniuk AA, Malyshev SA, Leibman MO, Streletskaya ID, Shatrova EV, Kizyakov AI, Vanshtein BG. Methane and Dissolved Organic Matter in the Ground Ice Samples from Central Yamal: Implications to Biogeochemical Cycling and Greenhouse Gas Emission. Geosciences. 2020; 10(11):450. https://doi.org/10.3390/geosciences10110450
Chicago/Turabian StyleSemenov, Petr B., Anfisa A. Pismeniuk, Sergei A. Malyshev, Marina O. Leibman, Irina D. Streletskaya, Elizaveta V. Shatrova, Alexander I. Kizyakov, and Boris G. Vanshtein. 2020. "Methane and Dissolved Organic Matter in the Ground Ice Samples from Central Yamal: Implications to Biogeochemical Cycling and Greenhouse Gas Emission" Geosciences 10, no. 11: 450. https://doi.org/10.3390/geosciences10110450
APA StyleSemenov, P. B., Pismeniuk, A. A., Malyshev, S. A., Leibman, M. O., Streletskaya, I. D., Shatrova, E. V., Kizyakov, A. I., & Vanshtein, B. G. (2020). Methane and Dissolved Organic Matter in the Ground Ice Samples from Central Yamal: Implications to Biogeochemical Cycling and Greenhouse Gas Emission. Geosciences, 10(11), 450. https://doi.org/10.3390/geosciences10110450