Article

Gas Permeability of Salt Crusts Formed by Evaporation from Porous Media

by
Joseph Piotrowski
1,*,
Johan Alexander Huisman
1,
Uri Nachshon
2,
Andreas Pohlmeier
1 and
Harry Vereecken
1
1
Agrosphere (IBG-3), Institute of Bio- and Geosciences, Forschungszentrum Jülich, 52425 Jülich, Germany
2
Institute of Soil, Water and Environmental Sciences, Agricultural Research Organization, The Volcani Research Center, Bet-Dagan 5025001, Israel
*
Author to whom correspondence should be addressed.
Geosciences 2020, 10(11), 423; https://doi.org/10.3390/geosciences10110423
Submission received: 4 September 2020 / Revised: 9 October 2020 / Accepted: 21 October 2020 / Published: 25 October 2020
(This article belongs to the Special Issue Soil Degradation: Salinization, Compaction, and Erosion)

Abstract

:
Soil salinization in irrigated croplands is a key factor in soil degradation and directly affects plant growth and soil hydrological processes such as evaporation and infiltration. In order to support the development of appropriate irrigation strategies, it is important to understand the impact of salt crusts that form during evaporation from saline soils on water flow. The determination of the effective hydraulic properties of salt crusts that control evaporation is still a challenge due to the lack of suitable measurement techniques. In this study, we propose an approach using gas flow to determine the permeability of salt crusts obtained from evaporation of unsaturated saline solutions of three different salt types and investigate the impact of the crust permeability on evaporation. For this, sand columns saturated with initial solutions of sodium chloride (NaCl), magnesium sulfate (MgSO 4 ), and sodium sulfate (Na 2 SO 4 ) at concentrations corresponding to 33% of the solubility limit were prepared and allowed to evaporate in order to induce crust formation. The results demonstrated that the intrinsic permeability of the dry salt crusts was similar for the different types of salts (≈ 4   ×   10 12   m 2 ), whereas the evaporation of the prepared columns differed significantly. We conclude that the intrinsic crust permeability only partly explains the impact of the crust on evaporation. Other effective crust properties such as porosity or unsaturated hydraulic properties may provide additional information on how evaporation is affected by salt crust formation.

1. Introduction

Soil salinization is one of the key factors controlling soil degradation [1], especially in arid and semi-arid areas. Unsustainable agricultural and farming practices have already caused problematic salinization of more than 20% of irrigated land [2]. Furthermore, about 40% of agricultural production is produced on irrigated land [3], which illustrates the potential threat of salinization for food supply. At the same time, irrigation water of sufficient quality (i.e., low salinity) is becoming less available in many parts of the world. A high solute content in soil water has a negative impact on root water uptake, photosynthesis, and plant growth [4], which leads to reduced crop yields for many crops [5]. A key factor determining soil salinization is evaporation [6]. When water evaporates from the soil, dissolved salt ions that are incapable of crossing the liquid-gas interface accumulate at the soil surface [7]. When the solubility limit is reached, salt precipitates in the pore space or at the soil surface [8,9], which affects the effective hydraulic properties, such as porosity and permeability. These changes at the soil surface may prevent rainwater to infiltrate the soil and can thus enhance erosion through surface runoff [10]. In addition, the hydraulic properties of the crust also play an important role for remediation of salt-affected soils [11]. Depending on the type of salt that is present, salt precipitation occurs on top or inside of the porous medium. When salt precipitates on top of the porous medium, this is referred to as efflorescence (e.g., sodium chloride (NaCl) [12,13,14]). When salts precipitate inside of the porous medium, this is called subflorescence (e.g., sodium sulfate (Na 2 SO 4 ) [15,16] and magnesium sulfate (MgSO 4 ) [17]). In order to improve understanding of salt crust formation by evaporation, it is important to investigate the effective hydraulic properties of salt crusts.
The general driving force of evaporation e from porous media is the difference between the saturation vapor pressure directly above the surface p sat H 2 O and the water vapor pressure of the ambient air p amb H 2 O [18,19]:
e p sat H 2 O p amb H 2 O
The evaporation process of pure water can be divided into two stages (S1 and S2 [19]). In stage S1, liquid capillary flow provides water to the soil surface, where the water then can evaporate with a relatively high evaporation rate controlled by the atmospheric demand as expressed by Equation (1). When capillarity is not able to transport water to the surface anymore, the liquid connections start to break off and the evaporation front moves down into the porous medium. This transition to stage S2 of evaporation is indicated by a sharp drop of the evaporation rate. A complete disconnection of the capillary liquid supply to the surface results in a very low evaporation rate that is maintained by vapor diffusion only.
The evaporation of saline water from porous media can be divided into three stages (SS1 to SS3 [12]), which are only partly related to the stages for the evaporation of pure water [7,12,20,21]. At the start of SS1, the lower saturation pressure of saline water compared to pure water leads to a lower evaporation rate, e.g., p sat solution < p sat H 2 O in Equation (1) [7,12,22]. Due to evaporation, the solute concentration at the surface increases, which leads to a decrease in evaporation rate in the course of stage SS1. In stage SS2, the evaporation rate is further reduced by the development of salt crusts. In this stage, the liquid is still fully connected to the surface of the porous medium unlike during stage S2 for evaporation of pure water [7,12]. Stage SS3 is associated with low evaporation rates, which can be caused by dense crust formation or the disconnection of liquid supply paths to the surface [7].
A range of studies have investigated the influence of experimental and ambient conditions on the evaporation of saline water and the associated salt crust formation. It was shown that the evaporation of initially unsaturated NaCl solution leads to an earlier crust development for coarse sand than for fine sand and that the appearance of the crust was more patchy in case of the fine sand [23]. It was also shown that NaCl crusts remained wet during evaporation, as indicated by fluctuations of the surface temperature obtained from infrared thermography [24], and that variation in the initial concentration of the NaCl solution resulted in differences in the initial evaporation rate and in crust development [24,25]. This diverse crust development was attributed to differences in the total amount of salt ions in solution. The higher the initial concentration, the earlier the crust starts to form and the thicker the crust will develop. As pointed out in several studies, it is important to realize that NaCl precipitation generates a new porous medium on top of the soil with its own hydraulic properties in terms of porosity, water retention and permeability [24,26]. Using micro X-Ray computed tomography ( μ XRCT) measurements, it was shown that NaCl crust formation begins from a limited number of nucleation centers that precipitate at the sample surface [27]. With time, the salt crust develops out of these centers and grows laterally and upward, eventually forming a detached dome-shaped salt crust with limited contact to the sample surface.
Despite the wide range of studies on evaporation of saline solutions from porous media, the hydraulic properties of salt crusts have rarely been investigated. In one of the few studies dealing with this topic, μ XRCT scans of a salt crust that developed from an initial 5 weight%NaCl solution were used to estimate the permeability with the help of Lattice-Bolzmann simulations [28]. This resulted in an estimated crust permeability of 3.7   ×   10 12   m 2 . In another study on salt crust permeability, evaporation experiments were performed using sand columns initially saturated with NaCl and MgSO 4 solutions at the solubility limit [29]. The change in bulk permeability of the entire sand column determined before and after evaporation was used to calculate the crust permeability (4   ×   10 12   m 2 for NaCl and 3   ×   10 11   m 2 for MgSO 4 ). In this approach, it is assumed that the permeability of the sand below the crust remains unchanged during evaporation and resaturation. However, it is possible that resaturation of a porous sample with a liquid may lead to air entrapment and associated changes in flow and transport properties [30]. This approach for crust permeability determination is also difficult to extend to samples with initially unsaturated saline solutions because resaturation with a saturated salt solution may nevertheless lead to dissolution of the crust for samples where the unsaturated salt solution did not evaporate entirely. In case of resaturation of partly evaporated samples, the correct fluid properties (i.e., density and viscosity) are also not known, and this additionally affects the accuracy of the permeability determination. Therefore, an alternative approach for crust permeability determination based on gas flow is proposed in this study.
The aim of this study is to determine the permeability of salt crusts obtained from evaporation of unsaturated saline solutions of NaCl, MgSO 4 , and Na 2 SO 4 from sand. With our novel approach using gas flow for the permeability determination, we aim to improve the understanding of evaporation processes in the presence of salt crusts. In the following, we first describe the details of the evaporation experiments and the permeability determination of salt crusts. Then, the results of the evaporation of the different saline solutions are presented and discussed. After this, the results of the crust permeability determination are shown and the impact of the crust permeability on evaporation is discussed for both efflorescent and subflorescent salt crusts.

2. Materials and Methods

2.1. Evaporation Experiments

Saturated sand columns were prepared in triplicates with solutions of NaCl, MgSO 4 , and Na 2 SO 4 (see Table 1 for details). The initial concentration of each solution was set to 33% of the maximum solubility following previous studies [24,25]. Additionally, three samples with pure water were prepared as a reference. Custom-made sample holders made of polymethylmethacrylat (PMMA, plexiglass) with an inner diameter of d = 31   mm, a total length of l = 140   mm, and a maximum filling height h max = 100   mm were used for the evaporation experiments (see Figure 1). A filter plate (P3, Robu, Hattert, Germany, [31]) was fixed inside the sample holder with a removable plug in order to hold the sample material in place.
Unwashed F32 quartz sand with a mean grain diameter of 240 μ m (Quarzwerke Frechen, Frechen, Germany, [41]) was used for all evaporation experiments (see Table 2 for details on particle size distribution). In order to prepare samples, the sample holder was first filled with saline solution (or water). Next, 100 g of F32 quartz sand was dispersed in the liquid at once. Subsequently, tapping on the outside of the sample holder resulted in slight consolidation of the sand and a sample height h = 80   mm was achieved (see Figure 1). After sample preparation, excessive solution was allowed to drain out through an opening in the bottom plug that was closed after drainage. No liquid was supplied from the bottom during evaporation. The air-entry pressure of the sand and the filter plate were roughly estimated with the Young-Laplace Equation to be −300 mm and −750 mm, respectively. In the case of the quartz sand, the average pore size of a comparable packing of glass beads was used to estimate the air-entry pressure [42]. The maximum pore size of the filter plates (40 μ m) was provided by the manufacturer [31]. As these air-entry pressures are well below the matric potential at the sample surface after drainage to steady-state conditions (−80 mm), it is assumed that all samples were initially fully saturated with liquid. After sample preparation, the initial height and volume of each sample was determined by measuring the distance from the edge of the sample holder to the sample surface at four equidistant positions along the sample holder wall. The porosity ϕ of each sample was then determined from the total volume and the known weight and particle density of the sand (density ρ = 2.65 g/cm 3 , [41]), and was found to be ϕ = 0.37 ± 0.01 .
In an attempt to ensure similar evaporation conditions for all samples, they were placed beneath fans (Tristar Europe B.V., Tilburg, The Netherlands) with four samples at defined position below each fan. Temperature and relative humidity were automatically recorded every hour using a multi-purpose measuring device (FHAD 46-C2, ALMEMO® D06, Ahlborn, Holzkirchen, Germany). The temperature during evaporation was 25 ± 1 C and the relative humidity varied between 20–40%. Evaporation was determined from mass loss by measuring the mass of each sample with a scale (accuracy ±0.01 g, EX2202, Ohaus Cooperation, Parsippany, USA) two times per day during the first five days. After this, the mass was measured one time per day. After 13 days of evaporation, the mass was measured once every two days in order to ensure a mass loss greater than 0.1 g, which was the smallest amount that could be reliably measured with the scale. Subsequent to weighing, the position of each sample was changed randomly to avoid that one sample experienced the same ventilation conditions for a longer period of time. The water saturation of each sample was obtained from the mass loss and the known initial water content.

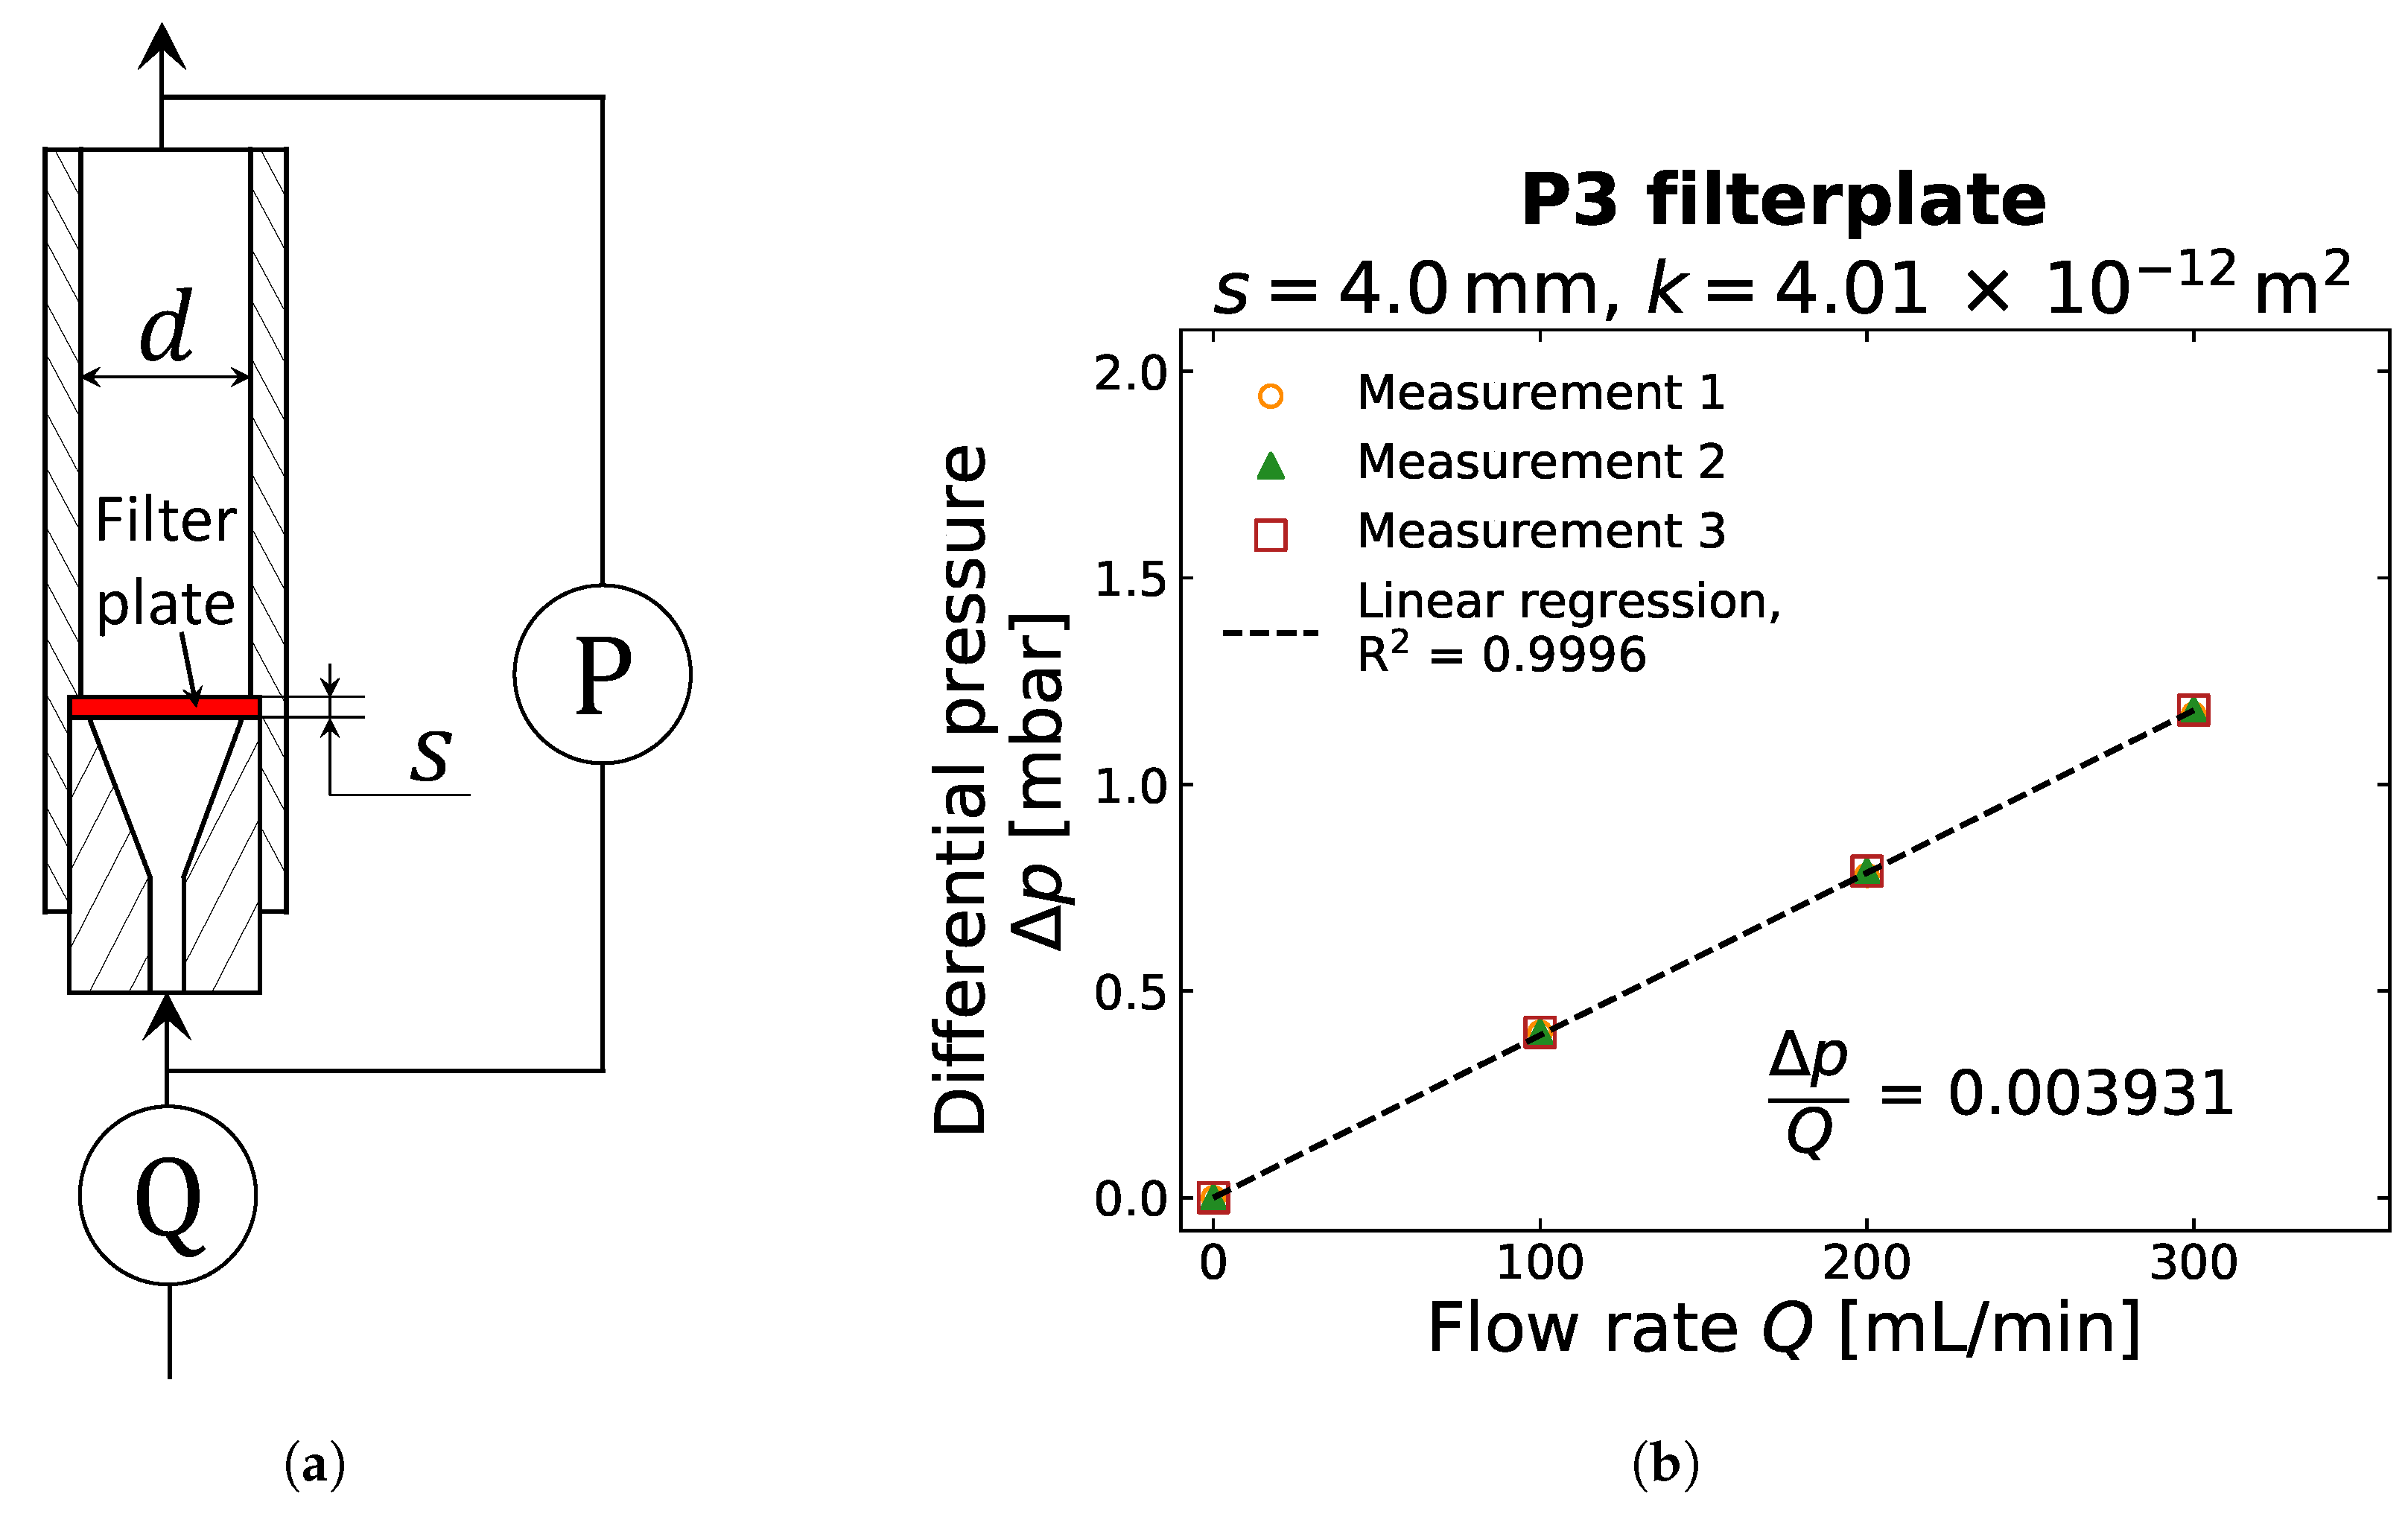
2.2. Gas Permeability Determination

The evaporation of the samples with NaCl and Na 2 SO 4 solution was stopped when the water saturation inside the column reached 20% after 9–17 days. In contrast, the evaporation of samples with MgSO 4 solution was stopped when 30% water saturation inside the column was reached after 60 days of evaporation (see Section 3.1 for details). In order to separate the crust, the bottom plug, the filter plate, and the sand below the crust were removed carefully while leaving the crust attached to the wall inside the sample holder (see Figure 1). A similar approach was used to study the migration of a crust along the wall of a Hele-Shaw cell [43]. Next, the mass of the removed sand and the crust was determined. The removed sand was found to be wet throughout the whole length of the sample. In order to determine crust thickness, the distance of the crust to the top and bottom of the sample holder was measured with a caliper at four positions along the perimeter of the salt crust close to the wall (see Table A1 in Appendix B). Afterwards, the bottom plug was inserted again and the permeability of the wet crust was determined using the gas permeameter set-up described below. After this initial permeability determination, the removed sand and the crust were dried at 60 C for 96 h. This relatively low temperature prevented morphological changes in the crystal structure of MgSO 4   ×   7H 2 O [44]. The measured water loss was used to determine the saturation of the sand and the crust after evaporation. It also served as a check of the water balance, where a maximum underestimation of 4% compared to the initial water content was found for all samples. After drying, the crust permeability of each sample was determined again.
The measurement set-up for gas permeability determination was based on methods for air permeability determination for soils (Figure 1) [45]. A known gas flux of dry nitrogen gas (density ρ = 1.162   ×   10 3 g/cm 3 and viscosity μ = 0.0176 mPas at 20 C) was introduced into the sample holder using a flow controller (High-Tech BV, Bronkhorst, Ruurlo, Netherlands), which induced a pressure difference across the salt crust. The upstream pressure was measured by a differential pressure transducer. Here, two types of pressure transducers that could easily be exchanged were used. The first type measured in the range of 0–10 mbar (accuracy ±0.01 mbar, DPS 300, BD-Sensors, Thierstein, Germany) and the second type measured in the range from 0–1000 mbar (accuracy ±1 mbar, DP2 Series, Ramco National Featuring Panasonic Sensors, West Des Moines, Iowa, USA). Both the downstream outlet of the sample holder and the outlet port of the differential pressure transducer were assumed to be at ambient pressure. The crust permeability was then determined from the pressure difference Δ p [Pa] across the crust and the known volumetric gas flow rate Q [m 3 /s] using:
k = μ   s A   1 Δ p Q ,
where k is the permeability [m 2 ], μ is the viscosity of dry nitrogen gas [Pas], A is the cross sectional surface area of the sample [m 2 ], and s is the thickness of the salt crust [m] [46].
In this study, three measurement series at four flow rates (0, 100, 200, and 300 mL/min) were performed for all salt crusts. In order to reach steady state conditions, each flow rate was applied until no changes in pressure were observed. It was found that the measured pressure differences were linearly related to the flow rate, as expected for laminar/Darcy flow conditions. A detailed analysis of the flow regime inside the sample holder and the considered porous media also confirmed that laminar/Darcy flow conditions can safely be assumed (see Appendix A and Appendix B). Therefore, a linear regression between pressure difference and flow rate was performed and the resulting slope was used to calculate the crust permeability using Equation (2).
The mass loss of the sand samples prepared with pure water was also monitored and the samples were dried at 60 C. Afterwards, the permeability of the entire sample including filter plate was determined using the gas permeability set-up, as the filter plate that kept the dried sand in position could not be removed (see Figure 1). A series connection of flow resistances was used to calculate the permeability of the sand only with the permeability (3.39–7.64   ×   10 12   m 2 ) and thickness (3.8–4.2mm) of each individual filter plate obtained before the start of the experiment [29]. Here, the permeability of the filter plates was determined using an empty sample holder with an inserted filter plate of known thickness (see Figure A1 in Appendix A for an example).

3. Results and Discussion

3.1. Evaporation of Saline Solutions

Figure 2 presents the mean cumulative mass loss and the evaporation rate for the triplicate samples saturated with pure water, NaCl, MgSO 4 , and Na 2 SO 4 solution. The samples saturated with pure water were evaporated entirely after eight days with a 1-2 day differences between the samples (see Figure 2a). The samples with NaCl and Na 2 SO 4 solution reached 20% water saturation after 9–17 days of evaporation. The evaporation rate of the samples with MgSO 4 solution was very low after 6 days of evaporation, and even after 60days of evaporation the saturation was still above 20%. Therefore, the crust permeability of the MgSO 4 samples was determined when 30% saturation was reached after 60days. This already suggests that the MgSO 4 crust had a substantial effect on the evaporation and almost sealed the surface of the porous medium in this study, which was not reported in previous studies [29]. This finding will be further elaborated when the results of the crust permeability determination are discussed.
The evaporation rate of all samples is shown in Figure 2b. The samples with pure water consistently showed the highest mean initial evaporation rate of 18.3 mm/day at day 0. The mean initial evaporation rate was 14.4 mm/day for the samples with Na 2 SO 4 solution and 14.1 mm/day for the samples with MgSO 4 solution. The mean initial evaporation rate of the samples with NaCl solution was the lowest with 12.1 mm/day. The order of the initial evaporation rates corresponds qualitatively to the initial saturation pressure of the solutions (see Table 1). Table 3 shows the ratio of the initial evaporation rate of samples with salt solution and pure water. Additionally, the vapor pressure difference of the initial saline solutions is normalized with the vapor pressure difference of pure water according to Equation (1). It can be seen that the ratios of the initial evaporation rates are lower compared to the normalized vapor pressure difference estimated from the solution concentration at the start of the experiment. This is attributed to the relatively low temporal resolution used to determine the “initial” evaporation rate (i.e., determination of weight at the start and after 0.25 days of evaporation). In this time period, ions already accumulated at the surface and reduced the saturation vapor pressure of the liquids. As the development of the concentration of the ions at the surface cannot be determined with our experimental approach, the comparison is considered to be qualitative only. Nevertheless, this qualitative agreement provides confidence that the method of sample preparation and the evaporation conditions in the laboratory provide meaningful results that are consistent with the general understanding of evaporation from porous media.
In the case of the samples with pure water, stage S1 evaporation occurred until day 1.5 (see Figure 2b). After 1.5 days, the evaporation rate dropped considerably indicating that stage S2 was reached. The slightly decreasing evaporation rate during stage S1 is attributed to the high level of the rate (>15 mm/day). This is in agreement with previous observations, where it was also reported that the evaporation rate during stage S1 is not necessarily constant for rates higher than 5 mm/day [19]. Similar results were also observed for unsaturated soils [47].
The evaporation rate of the saline samples decreased substantially within the first day. This is attributed to the accumulation of ions in the top layer during evaporation of water and the resulting decrease of the saturation pressure, which is characteristic for stage SS1 evaporation of saline solutions. Crust formation was visually monitored for all saline samples (Figure 3). The samples with NaCl solution developed a white efflorescent crust on top of the sand surface within the first two days (Figure 3d). For the samples with MgSO 4 solution, almost no change of the surface was visible besides some differences in color that were attributed to differences in saturation (Figure 3e). The crusts of the samples with Na 2 SO 4 solution appeared glassy with white patches on top after two days (Figure 3f), which is consistent with observations in previous studies [48]. In combination with the evaporation rates, these crust observations suggest that the impact of the crust on evaporation and thus the transition to stage SS2 evaporation already occurred between day 1 and day 2 for all saline samples.
Shortly after the start of evaporation stage SS2, the evaporation rate of the samples with MgSO 4 solution decreased below that of the samples with NaCl and Na 2 SO 4 solution and dropped below 0.1 mm/day after six days (Figure 2b). This low evaporation rate that was similar to the one of the samples with pure water in stage S2 suggests that stage SS3 started after six days. At that time, only half of the initial amount of water was evaporated (≈12 mL of 23 mL). Therefore, it seems likely that capillary liquid paths were still connected to the sample surface. At the end of the evaporation experiment (60 days), the sand below the MgSO 4 crusts was found to be wet throughout each column, which further supports the assumption of a liquid connection to the surface. Additionally, the crusts themselves were wet after separation (see below). The low evaporation rate is thus attributed to the presence of the subflorescent crust that may have caused a blocking of the capillary rise or may have induced a reduction of capillary rise of the saturated liquid in combination with capillary effects. A better understanding of the liquid and gas transport processes on the pore scale could provide more insights in the complexity of salt crust formation. This should be explored in future studies.
For the samples with NaCl solution, the evaporation rate remained between 4.1 and 2.7 mm/day from day 2 to day 3. This plateau in the evaporation rate during stage SS2 was also reported during the formation of the efflorescent NaCl crust in previous studies [24]. The evaporation rate of the samples with NaCl and Na 2 SO 4 solutions fell below 1 mm/day at day 9, shortly before the crust separation for the individual samples (see Figure 2b). As the removed sand below the crusts was wet and the crusts themselves contained water (see below), it is likely that a liquid capillary connection to the surface was present until the separation of the crust. Since the evaporation rate remained higher than 0.1 mm/day, it is not clear if the samples with NaCl and Na 2 SO 4 solution reached stage SS3 of evaporation at the end of the experiment.

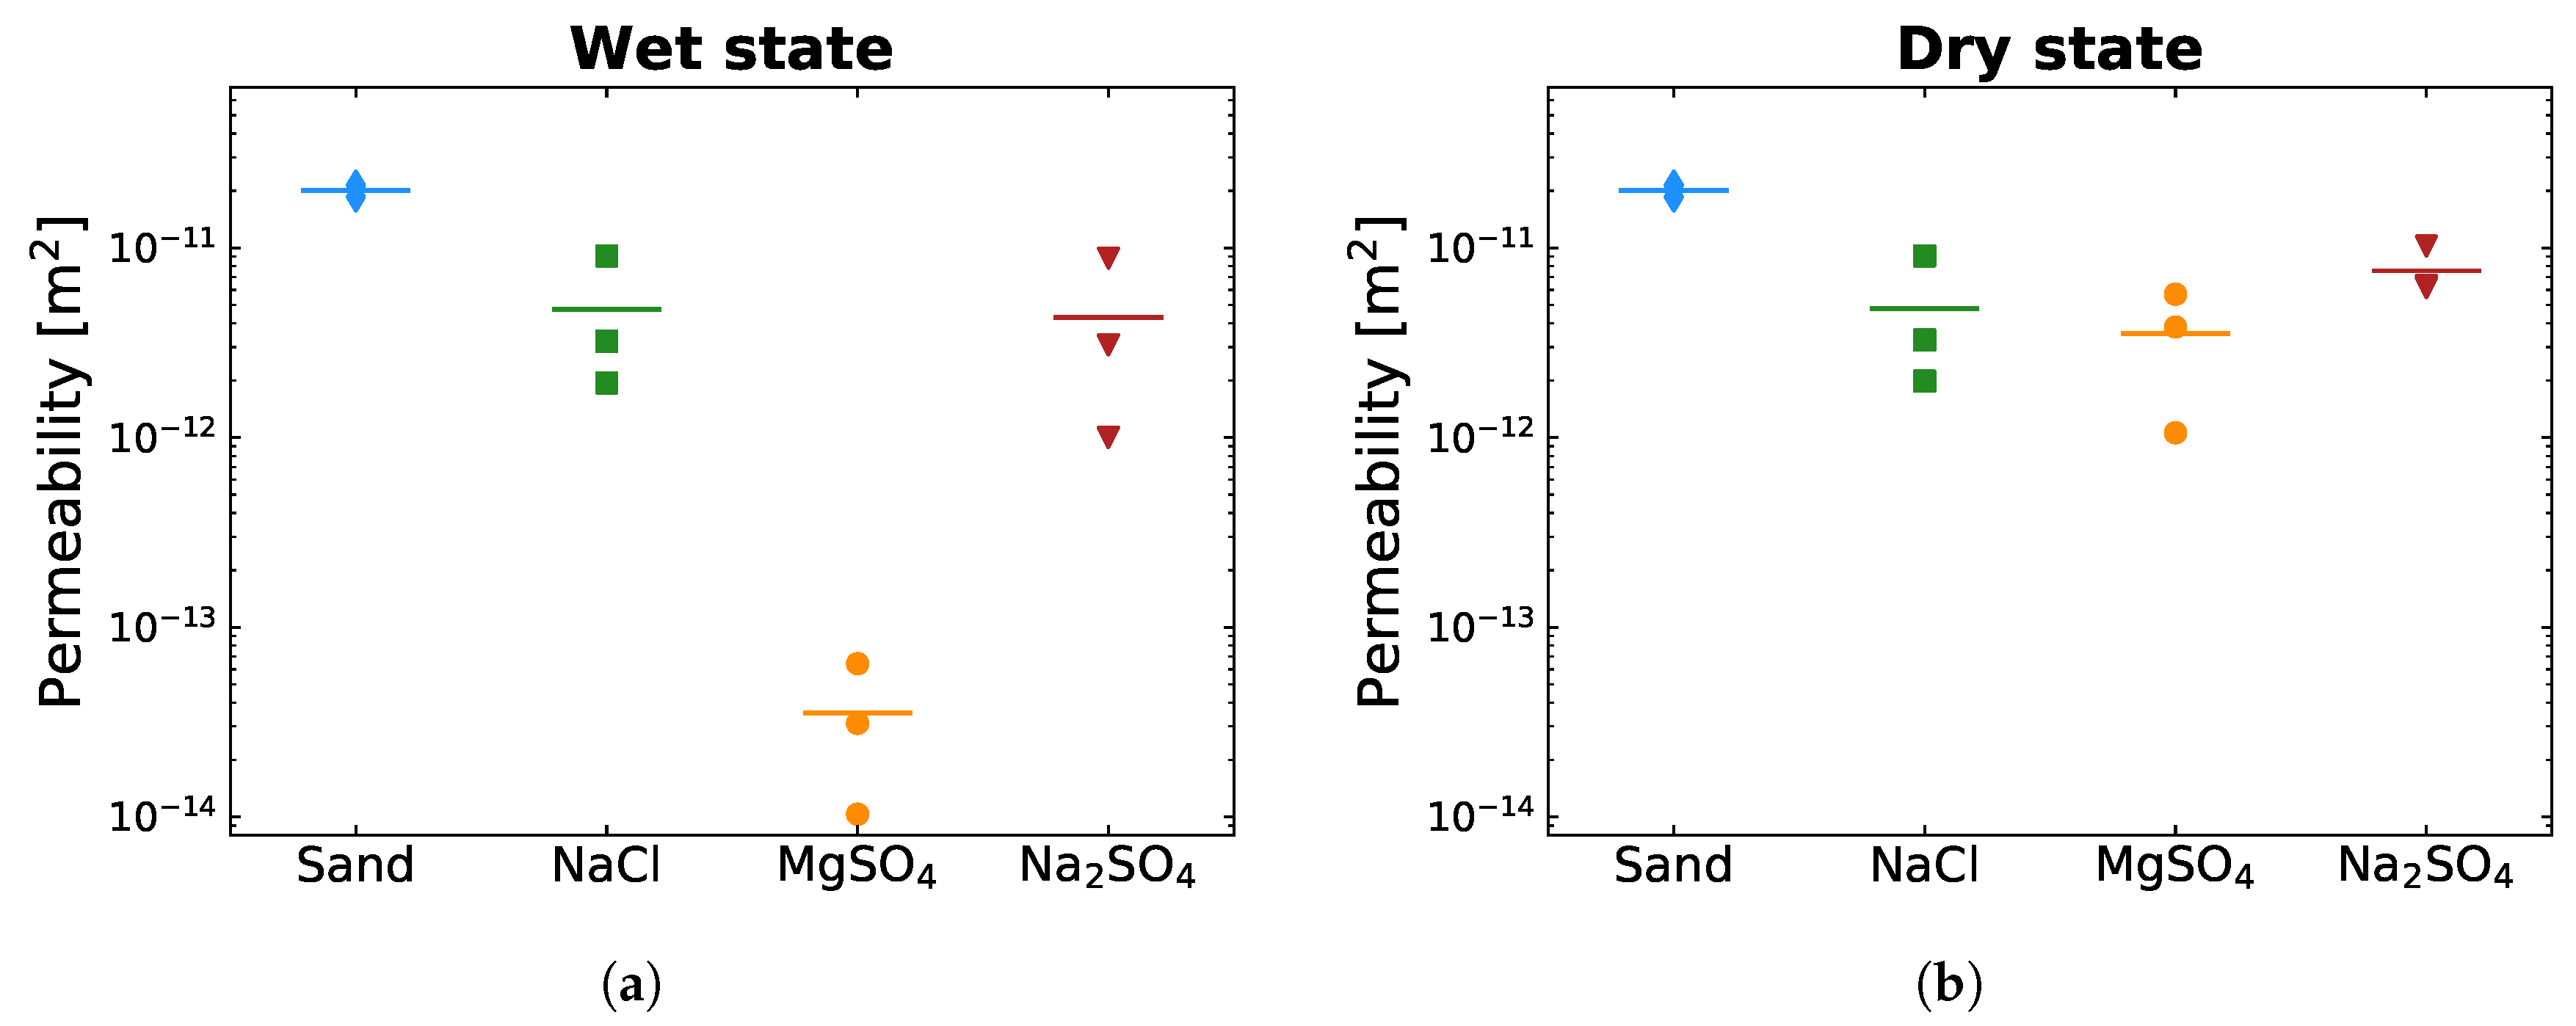
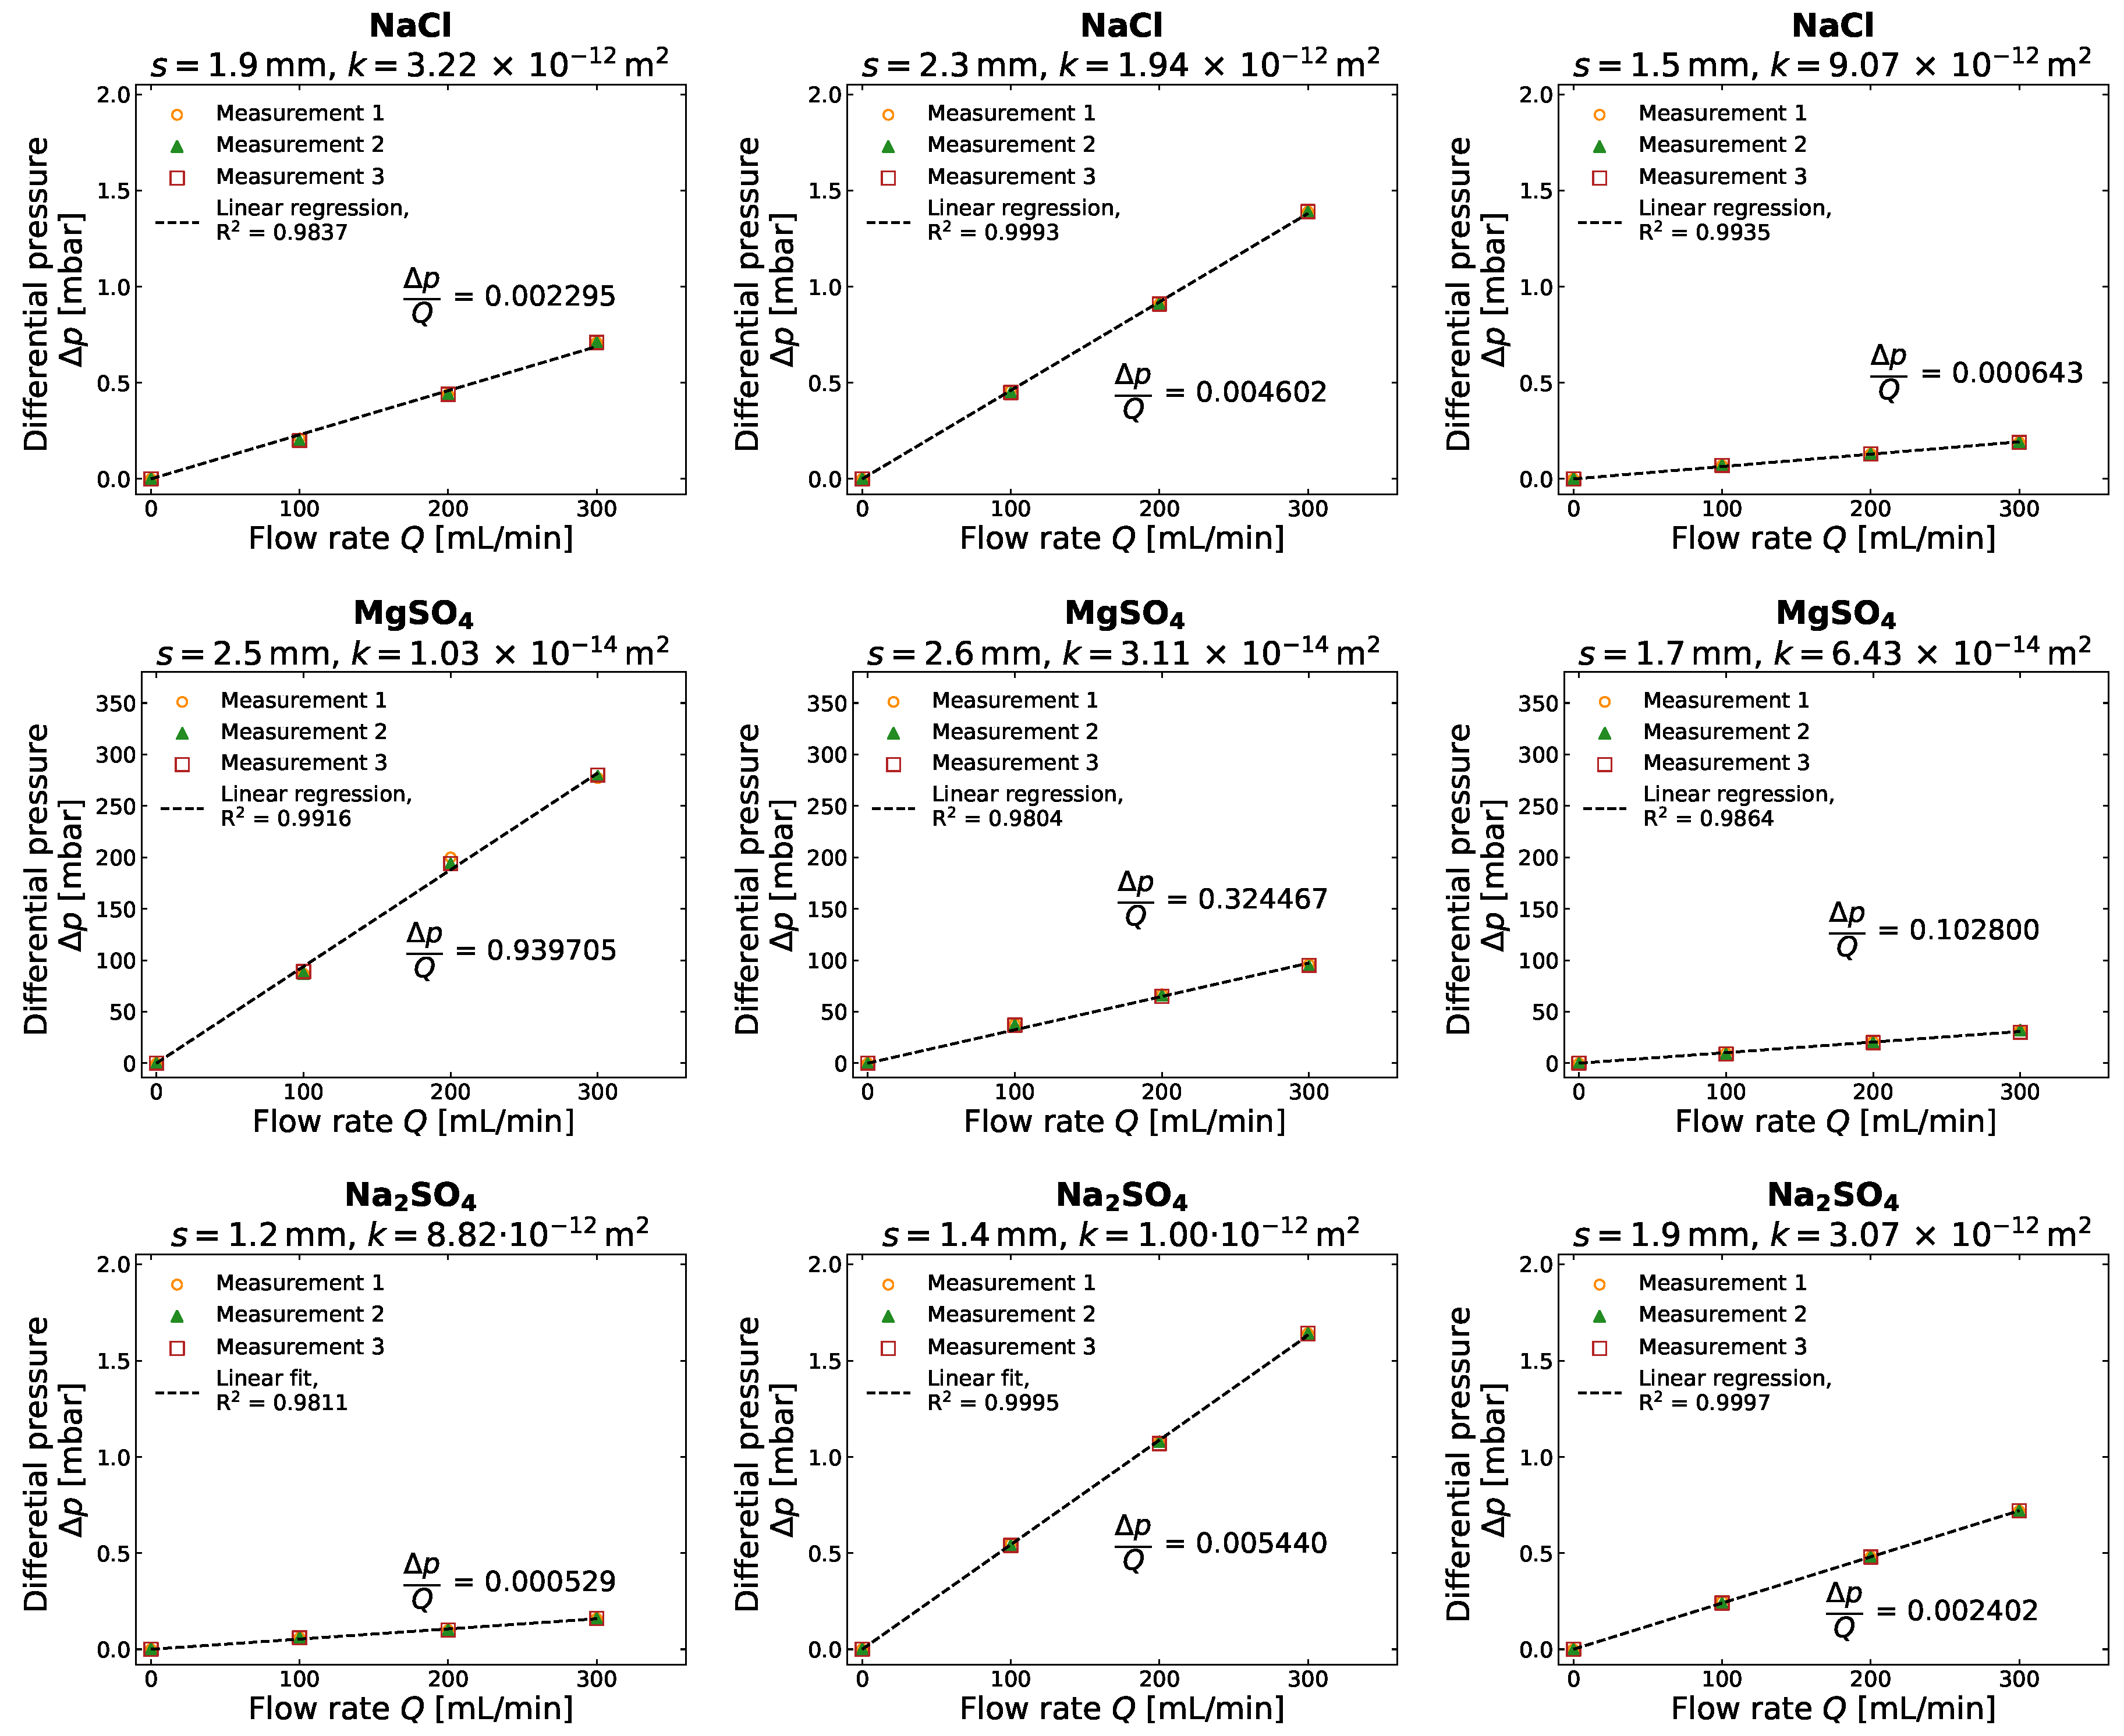
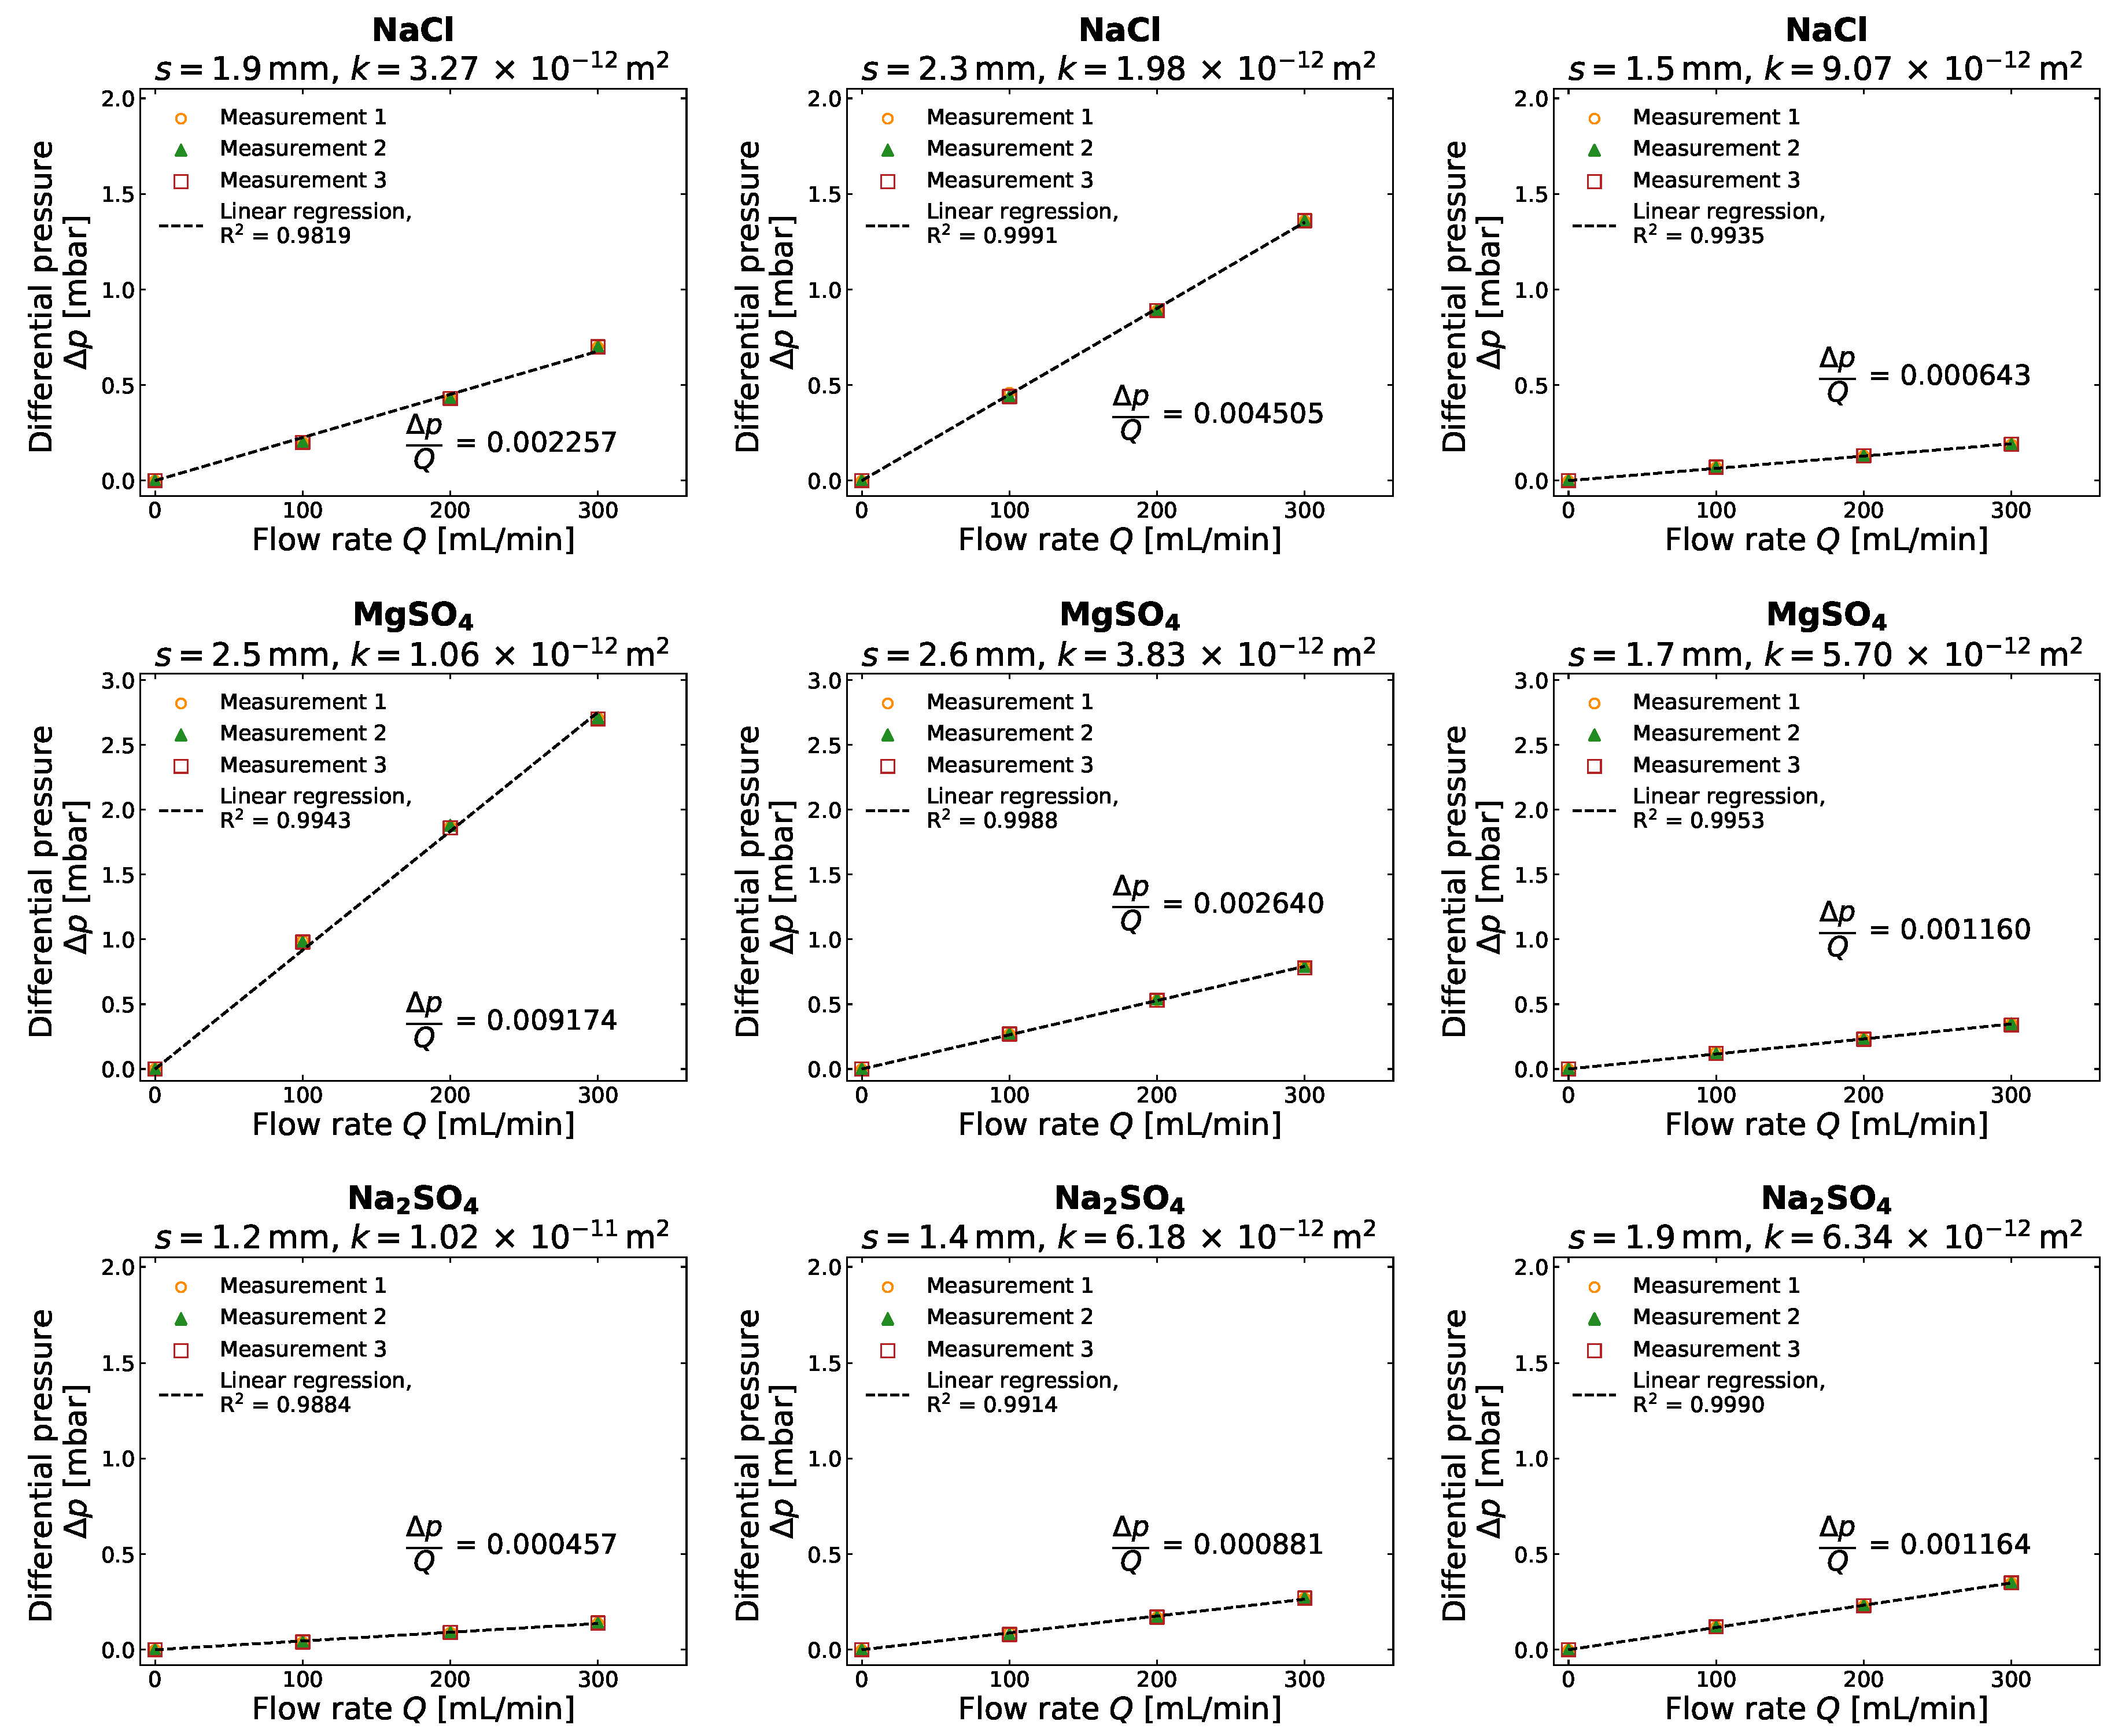
3.2. Gas Permeability of Different Salt Crusts

Exemplary results for the crust permeability determination are shown in Figure 4 for two selected crusts. In Figure 4a, the measured pressure differences for the Na 2 SO 4 crust were low and relatively close to the accuracy of the pressure transducer (0.01 mbar) for the low gas flow rates. Nevertheless, a strong linear relationship between pressure difference and gas flow rate was observed (R 2 = 0.9884). In case of the MgSO 4 crust (Figure 4b), the relationship between pressure difference and gas flow rate was also strongly linear (R 2 = 0.9916). The two examples shown in Figure 4 represent the lowest and highest measured pressure differences at the highest flow rate of 300 mL/min for all crusts. The analysis of the measurement with the highest pressure difference using the Forchheimer equation that accounts for gas compressibility showed an almost identical Darcy permeability (i.e., k 1 = 1.00   ×   10 14   m 2 for the Forchheimer equation and k = 1.03   ×   10 14   m 2 for Darcy equation) [49,50]. This indicates that gas compressibility can be neglected for the experimental conditions used in this study. A more detailed discussion of gas compressibility and the results of the gas permeability determination for all crusts are provided in Figure A2 and Figure A3 in Appendix B. All measurements resulted in linear regression equations with R 2 above 0.9804. This clearly indicates that the assumption of laminar flow conditions and incompressible gas were valid for all measurements performed in this study. The results of the crust thickness determination are listed in Table A1 in Appendix B. In the case of NaCl crusts, the dome-shaped structures filled with air were not considered for the crust thickness determination.
Figure 5 shows the gas permeability of the separated crusts from different salt types directly after evaporation (Figure 5a) and after further drying (Figure 5b). It should be noted that some additional salt precipitation likely occurred within the crust due to the oven drying, which may have affected the obtained crust permeability. The mean permeability of the sand columns is also provided (2.10   ×   10 11   m 2 ) and serves as a reference for the permeability of the different salt crusts. The mean permeability of the sand and both the wet (p = 0.0001) and the dry crusts (p = 0.0002) were significantly different according to a one-way analysis of variance (ANOVA). Obviously, only the intrinsic permeability of the salt crusts determined in the dry state can be compared to previously reported estimates of (intrinsic) permeability obtained using liquids. The mean permeability of the dry NaCl crusts was 4.77   ×   10 12   m 2 in this study (Figure 5b). This value is similar to the NaCl crust permeability found in previous studies (3.7   ×   10 12   m 2 [28] and 4   ×   10 12   m 2 [29]) although the initial concentration of the evaporating solutions was different (0.89 mol/L [28], 2.04 mol/L in this study, and 6.13 mol/L [29]). It is known that NaCl crusts build an efflorescent layer on top of the surface, which can be considered as a new porous medium with its own transport properties. The consistency of our results with previous studies suggests that the initial concentration of the NaCl solution affects the intrinsic permeability of the efflorescent NaCl crusts to a minor extent. Nevertheless, the speed of crust formation and the appearance of the crust depend substantially on the initial concentration, as already reported in previous studies [24,25].
The mean intrinsic gas permeability of the MgSO 4 crusts (3.53   ×   10 12   m 2 ) was similar to the mean permeability of the NaCl crusts (4.77   ×   10 12   m 2 ) (Figure 5b). This finding is not in agreement with previously reported results, where the permeability of the MgSO 4 crusts (3   ×   10 11   m 2 ) was almost one order of magnitude higher than the permeability of the NaCl crusts (4   ×   10 12   m 2 ) [29]. This is at least partly attributed to the difference in permeability of the sand used for the evaporation experiments (5   ×   10 10   m 2 [29] and 2.10   ×   10 11   m 2 in this study). Clearly, the permeability of subflorescent MgSO 4 crusts depends strongly on the properties of the porous medium. In addition, fully saturated salt solutions were used and the samples were allowed to evaporate for 80 h only [29]. In this study, the samples with MgSO 4 solution were allowed to evaporate for a much longer time (60 days). This may have led to a denser crust despite the use of a lower initial salt concentration. Therefore, the differences in permeability of the MgSO 4 crusts may also be due to the different experimental conditions and especially to differences in the time of evaporation. The temporal development of MgSO 4 crust permeability and the dependence on initial concentration will be investigated in more detail in a future study.
The mean intrinsic permeability of the subflorescent Na 2 SO 4 crusts is also reported in Figure 5b. It was found to be 7.57   ×   10 12   m 2 , which was slightly higher than that of the MgSO 4 crusts. To the best of our knowledge, this is the first time that the permeability of a subflorescent Na 2 SO 4 crust was determined.
It is interesting to note the differences in crust permeability before and after drying in Figure 5. In the case of the NaCl crusts, a considerable mass loss of 20% was observed upon drying of the crust, but the gas permeability before and after drying was nevertheless similar (see Figure 5). It was already reported that NaCl crusts were wet during evaporation [24]. Additionally, it was shown that efflorescent NaCl crusts partly detach from the surface of the sample and create dome-shaped structures with air between loosely connected “pillars” on the surface [27]. Similar structures were observed in this study (Figure 3g). The small difference in permeability before and after drying suggests that the remaining water in the crust was located in pore spaces that do not effectively contribute to gas flow, which may be related to the complicated structure of NaCl crusts [27]. In contrast, the mean intrinsic permeability of the MgSO 4 crusts in the dry state (3.53   ×   10 12   m 2 ) was two orders of magnitude higher than the mean relative gas permeability in the wet state (3.52   ×   10 14   m 2 ) (see Figure 5). This increase in permeability was associated with a mass loss of 30% during drying. In the case of the Na 2 SO 4 crusts, the intrinsic gas permeability in the dry state (7.57   ×   10 12   m 2 ) was also substantially higher than the relative permeability in the wet state (4.30   ×   10 12   m 2 ) and the associated mass loss after drying was 19%. Clearly, the remaining liquid inside the pores of these subflorescent crusts partly blocked the pores and reduced the permeability for gas in the wet state.
The results presented above suggest that the intrinsic permeability of salt crusts formed by evaporation of unsaturated saline solutions can be reliably determined with the proposed gas permeameter set-up. For the given experimental conditions, it was found that the NaCl and MgSO 4 crusts showed a comparable permeability in the dry state, whereas the mean gas permeability of Na 2 SO 4 was slightly higher. However, all crusts were found to be wet during the entire evaporation process indicating that the intrinsic crust permeability alone is not sufficient to explain the evaporation of the samples with salt crust formation. This is highlighted by the relatively high intrinsic permeability of the MgSO 4 crusts that was associated with a very low evaporation rate. Therefore, the relative permeability of the crust also needs to be considered to improve understanding of evaporation processes in the presence of salt crusts. In particular, it is of interest to investigate the location of the evaporation front in evaporating samples with crust formation in order to determine if liquid capillarity or gas diffusion governs water transport through the crust.

4. Conclusions

In this study, a novel approach using gas flow measurements allowed the analysis of the permeability of separated salt crusts that formed during the evaporation of unsaturated NaCl, MgSO 4 , and Na 2 SO 4 solutions from sand columns. The intrinsic permeability of the efflorescent NaCl crusts was found to be comparable to previously reported values. The intrinsic permeability of the subflorescent MgSO 4 crusts was lower than previously reported values, which was attributed to the different properties of the available porous medium and to differences in the time of evaporation. To the best of our knowledge, this was the first study that presented experimental results of the intrinsic permeability of subflorescent Na 2 SO 4 crusts. Overall, the results suggest that the gas permeameter set-up allowed an easy and more accurate determination of the permeability of salt crusts from the evaporation of initially unsaturated saline solutions from porous media. The applicability of the set-up for samples with finer texture should be investigated in a future study.
The impact of the intrinsic permeability of the salt crust on the evaporation differed for the three types of salt. In the case of the efflorescent NaCl crust, the formation of a crust with a lower intrinsic permeability than the underlying porous medium seemed to have reduced the evaporation rate, as was also reported in previous studies [29]. The low evaporation rate of the samples with MgSO 4 solution could not be explained by the relatively high intrinsic permeability of the subflorescent MgSO 4 crusts. The similar evaporation and slightly higher crust permeability of the samples with Na 2 SO 4 solution compared to the samples with NaCl solution indicated a similar impact on evaporation.
The large differences in (relative) gas permeability of the subflorescent salt crusts between the wet state and the dry state observed in this study suggest that the distribution of water in the salt crust in unsaturated conditions may have an underestimated impact on evaporation. Thus, future studies should also focus on unsaturated flow properties of salt crusts. In particular, the investigation of the water retention properties of the crust may provide information on how the unsaturated conditions inside the crust affect evaporation. Here, knowledge of the resolved pore space and the porosity of the crust obtained from micro X-Ray computed tomography ( μ XRCT) could facilitate numerical simulations of flow and evaporation on the pore scale. This would provide a basis for intrinsic and relative permeability estimations of the crust, which could be used to improve the understanding of the experimental results. It is also of interest to investigate the time dependency of the crust formation and the resulting effects on the intrinsic permeability using μ XRCT in order to explore the dynamic effects on evaporation. Furthermore, it would be interesting to use μ XRCT to investigate the location of salt precipitates and their effect on the liquid-gas interaction in order to obtain a deeper understanding of the processes that control the low evaporation in the presence of a subflorescent MgSO 4 crust.

Author Contributions

Conceptualization, J.P., J.A.H., U.N., A.P., and H.V.; data curation, J.P. and J.A.H.; formal analysis, J.P.; funding acquisition, J.A.H. and A.P.; investigation, J.P.; methodology, J.P., J.A.H., and U.N.; project administration, J.P., J.A.H.; resources, J.A.H., A.P., and H.V.; software, J.P.; supervision, J.A.H.; validation, J.P., J.A.H., A.P., and H.V.; visualization, J.P.; writing—original draft preparation, J.P.; writing—review and editing, J.P., J.A.H., U.N., A.P., and H.V.. All authors have read and agreed to the published version of the manuscript.

Funding

Funded by the Deutsche Forschungsgemeinschaft (DFG, German Research Foundation)—Project Number 327154368—SFB 1313.

Conflicts of Interest

The authors declare no conflict of interest.

Appendix A. Evaluation of Laminar Flow Conditions for the Gas Permeameter Set-Up

In order to evaluate flow conditions in the gas permeameter set-up, we determined the Reynolds number using a definition proposed for experiments on packed particles in tubes
R e = ρ   u 0   d p μ ,
where d p is the mean particle diameter [m], ρ is the fluid density [g/cm 3 ], μ is the dynamic viscosity [Pas], and u 0 is the superficial velocity of the fluid [m/s] that equals the volumetric flow rate per area Q/A (i.e., flux density) [51]. It was shown that the representative diameter in Equation (A1) can be applied to loosely consolidated sand as used in this study [52]. Using this definition, non-viscous/non-Darcy flow in porous media can be expected when R e exceeds 40. The Reynolds number for gas flow in packings of F32 quartz sand ( d p = 240   μ m) was calculated using Equation (A1) and the fluid properties of nitrogen at 20 C ( ρ = 1.162   ×   10 3 g/cm 3 , μ = 0.0176 mPas). It was found to be R e = 0.12 for the highest gas flow rate of 300 mL/min used in this study, which is substantially lower than the threshold of R e = 40 [51,52].
Equation (A1) was also used to evaluate the flow conditions of the empty sample holder. Here, a superficial fluid velocity of 300mL/min, the fluid properties of gaseous nitrogen, and the tube diameter d instead of the particle diameter d p were used [53]. The resulting Reynolds number for the smallest tube diameter ( d = 2 mm) of the gas permeameter set-up was found to be R e = 195. This is also well below the transition from laminar to turbulent flow inside pipes, which is known to occur above R e =2300 [51,53]. Test measurements with the empty sample holder using the highest flow rate of 300mL/min showed a pressure loss due to laminar flow resistance of only 0.02mbar, which was taken into account for all measurements. Overall, it was concluded that laminar/Darcy flow conditions in the sample holder were maintained in all experimental conditions and that the use of Equation (2) is thus justified.
The gas permeameter set-up was further tested by determining the permeability of 25 filter plates (VitraPOR P3 (16–40 μ m), ROBU, Hattert, Germany, [31]) with known dimensions. The filter plates were positioned above the bottom plug as indicated by the red line in Figure A1a. The particle diameter was estimated to be three times the pore size, e.g., d p = 120   μ m. This resulted in a Reynolds number of R e = 0.52 using Equation (A1). Three differential pressure measurements at four different flow rates (0 mL/min, 100 mL/min, 200 mL/min, and 300 mLmin, see Figure A1b) were performed and showed a strong linear relationship (R 2 = 0.9996 ). This again confirms that laminar/Darcy flow conditions can safely be assumed for the filter plates at given experimental conditions. The thickness of each filter plate was determined with a caliper. Then, Equation (2) was applied to calculate the permeability of every filter plate. The mean permeability of the P3 filter plates was 5.30   ×   10 12   m 2 (3.39–7.64   ×   10 12   m 2 ) and deviated only 16% from the permeability of 6.32   ×   10 12   m 2 reported by the manufacturer [31].
Figure A1. (a) Sketch of the gas permeameter set-up with a fixed filter plate (thickness s = 4   mm) in red and diameter d = 31   mm. The remaining dimensions of the sample holder are shown in Figure 1. Dry nitrogen was flown through the sample at a fixed flow rate Q set by the flow controller Q through filter plate. The pressure transducer P monitored the pressure difference Δ p over the filter plate. (b) Measured differential pressure versus flow rate for a dry P3 filter plate. The slope of the linear regression between Δ p and Q was used to obtain the permeability using Equation (2).
Geosciences 10 00423 g0a1

Appendix B. Detailed Results for Gas Compressibility and Gas Permeability Determination

Table A1 presents the crust thickness of each sample that was determined using a caliper. Figure A2 and Figure A3 show the results for the gas permeability determination for all crusts in the wet state and dry state, respectively. The analysis of the data with the highest pressure difference (i.e., middle left diagram in Figure A2) using the Forchheimer equation that accounts for gas compressibility [49,50] resulted in a very similar viscous permeability ( k 1 = 1.00   ×   10 14   m 2 ) as obtained with the Darcy equation ( k = 1.03   ×   10 14   m 2 ). Additionally, the analysis of the Forchheimer number F o = ρ q μ k 1 k 2 resulted in a value smaller than 1 ( F o = 0.1) even for the highest measured pressure difference [49,52]. This clearly indicates that incompressible Darcy flow can safely be assumed for all measurements with a pressure difference below 284mbar (i.e., for all measurements performed in this study).
Figure A2. Pressure difference as a function of gas flow rate for all crusts in the wet state (i.e., directly after evaporation). The crust thickness s and the permeability k obtained with Equation (2) are provided in the title of each subplot.
Geosciences 10 00423 g0a2
Figure A3. Pressure difference as a function of gas flow rate for all crusts in the dry state (i.e., after drying at 60 C for 96 h). The crust thickness s and the permeability k obtained with Equation (2) are provided in the title of each subplot.
Geosciences 10 00423 g0a3
Table A1. Measured crust distances from top and bottom of the sample holder and resulting thickness for each crust. The positions of the measurements 1 to 4 were equally distributed along the perimeter of the crust close to the wall. The crust thickness at each position was determined by subtracting the top and bottom distance from the length of the sample holder l = 140 mm (see Figure 1). The mean crust thickness is shown in the fourth column. The maximum deviation of the crust thickness at each position from the mean crust thickness was 26% for the NaCl crusts, 12% for the MgSO 4 crusts, and 17% for the Na 2 SO 4 crusts. The crust thickness of all crusts did not change during drying within the accuracy of the caliper (±0.05 mm).
CrustMeasuredMeasured at PositionMean Crust Thickness s
1234
[mm][mm][mm][mm][mm]
top16.617.417.017.11.9
NaCl bottom120.9120.8121.1121.4
thickness2.51.81.91.5
top17.517.818.317.92.3
NaCl bottom119.8119.6119.9119.9
thickness2.72.61.82.2
top18.518.418.618.52.5
MgSO 4 bottom118.8119.0118.9119.2
thickness2.72.62.52.3
top18.718.818.918.92.6
MgSO 4 bottom118.8118.5118.4118.7
thickness2.52.72.72.4
top18.718.718.518.71.7
MgSO 4 bottom119.5119.4119.9119.8
thickness1.81.91.61.5
top18.418.418.618.31.2
Na 2 SO 4 bottom120.2120.5120.3120.4
thickness1.41.11.11.3
top17.918.018.317.91.4
Na 2 SO 4 bottom120.5120.7120.5120.5
thickness1.61.31.21.6
top17.817.917.618.21.9
Na 2 SO 4 bottom120.1120.4120.3120.0
thickness2.11.72.11.8

References

  1. Nkonya, E.; Anderson, W. Exploiting provisions of land economic productivity without degrading its natural capital. J. Arid. Environ. 2015, 112, 33–43. [Google Scholar] [CrossRef]
  2. Pitman, M.G.; Läuchli, A. Global Impact of Salinity and Agricultural Ecosystems. In Salinity: Environment-Plants-Molecules; Läuchli, A., Lüttge, U., Eds.; Springer: Dordrecht, The Netherlands, 2002; pp. 3–20. [Google Scholar] [CrossRef]
  3. Vereecken, H.; Burauel, P.; Groeneweg, J.; Klumpp, E.; Mittelstaedt, W.; Narres, H.D.; Putz, T.; van der Kruk, J.; Vanderborght, J.; Wendland, F. Research at the Agrosphere Institute: From the Process Scale to the Catchment Scale. Vadose Zone J. 2009, 8, 664–669. [Google Scholar] [CrossRef]
  4. Chaves, M.M.; Flexas, J.; Pinheiro, C. Photosynthesis under drought and salt stress: Regulation mechanisms from whole plant to cell. Ann. Bot. 2009, 103, 551–560. [Google Scholar] [CrossRef] [PubMed] [Green Version]
  5. Oster, J.D. Irrigation with Poor Quality Water. Agric. Water Manag. 1994, 25, 271–297. [Google Scholar] [CrossRef]
  6. Gupta, R.K.; Abrol, I.P.; Finkl, C.W.; Kirkham, M.B.; Arbestain, M.C.; Macías, F.; Chesworth, W.; Germida, J.J.; Loeppert, R.H.; Cook, M.G.; et al. Soil salinity and salinization. In Encyclopedia of Soil Science; Springer: Dordrecht, The Netherlands, 2008; pp. 699–704. [Google Scholar] [CrossRef]
  7. Jambhekar, V.A.; Helmig, R.; Schroder, N.; Shokri, N. Free-Flow-Porous-Media Coupling for Evaporation-Driven Transport and Precipitation of Salt in Soil. Transp. Porous Media 2015, 110, 251–280. [Google Scholar] [CrossRef]
  8. Driessen, P.M.; Schoorl, R. Mineralogy and Morphology of Salt Efflorescences on Saline Soils in the Great Konya Basin, Turkey. J. Soil Sci. 1973, 24, 436–442. [Google Scholar] [CrossRef]
  9. Dowuona, G.; Mermut, A.; Krouse, H. Isotopic composition of salt crusts in Saskatchewan, Canada. Chem. Geol. Isot. Geosci. Sect. 1992, 94, 205–213. [Google Scholar] [CrossRef]
  10. Smoot, J.P.; Castens-Seidell, B.; Renaut, R.W.; Last, W.M. Sedimentary Features Produced by Efflorescent Salt Crusts, Saline Valley and Death Valley, California. In Sedimentology and Geochemistry of Modern and Ancient Saline Lakes Models; Society for Sedimentary Geology: Tulsa, OK, USA, 1994; Volume 50. [Google Scholar] [CrossRef]
  11. Liao, R.K.; Yu, H.L.; Lin, H.; Yang, P.L. A quantitative study on three-dimensional pore parameters and physical properties of sodic soils restored by FGD gypsum and leaching water. J. Environ. Manag. 2019, 248, 10. [Google Scholar] [CrossRef]
  12. Nachshon, U.; Weisbrod, N.; Dragila, M.I.; Grader, A. Combined evaporation and salt precipitation in homogeneous and heterogeneous porous media. Water Resour. Res. 2011, 47, 16. [Google Scholar] [CrossRef]
  13. Nachshon, U.; Shahraeeni, E.; Or, D.; Dragila, M.; Weisbrod, N. Infrared thermography of evaporative fluxes and dynamics of salt deposition on heterogeneous porous surfaces. Water Resour. Res. 2011, 47, 16. [Google Scholar] [CrossRef]
  14. Eloukabi, H.; Sghaier, N.; Ben Nasrallah, S.; Prat, M. Experimental study of the effect of sodium chloride on drying of porous media: The crusty-patchy efflorescence transition. Int. J. Heat Mass Transf. 2013, 56, 80–93. [Google Scholar] [CrossRef] [Green Version]
  15. Flatt, R.J.; Scherer, G.W. Hydration and crystallization pressure of sodium sulfate: A critical review. In Materials Issues in Art and Archaeology Vi; Vandiver, P.B., Goodway, M., Mass, J.L., Eds.; Materials Research Society: Warrendale, PA, USA, 2002; Volume 712, pp. 29–34. [Google Scholar]
  16. Tsui, N.; Flatt, R.J.; Scherer, G.W. Crystallization damage by sodium sulfate. J. Cult. Herit. 2003, 4, 109–115. [Google Scholar] [CrossRef]
  17. Espinosa-Marzal, R.M.; Scherer, G.W. Impact of in-pore salt crystallization on transport properties. Environ. Earth Sci. 2013, 69, 2657–2669. [Google Scholar] [CrossRef] [Green Version]
  18. Scherer, G.W. Theory of Drying. J. Am. Ceram. Soc. 1990, 73, 3–14. [Google Scholar] [CrossRef]
  19. Or, D.; Lehmann, P.; Shahraeeni, E.; Shokri, N. Advances in Soil Evaporation Physics-A Review. Vadose Zone J. 2013, 12, 16. [Google Scholar] [CrossRef]
  20. Lehmann, P.; Assouline, S.; Or, D. Characteristic lengths affecting evaporative drying of porous media. Phys. Rev. E 2008, 77, 16. [Google Scholar] [CrossRef] [PubMed]
  21. Jambhekar, V.A.; Mejri, E.; Schroder, N.; Helmig, R.; Shokri, N. Kinetic Approach to Model Reactive Transport and Mixed Salt Precipitation in a Coupled Free-Flow-Porous-Media System. Transp. Porous Media 2016, 114, 341–369. [Google Scholar] [CrossRef] [Green Version]
  22. Rad, M.N.; Shokri, N. Nonlinear effects of salt concentrations on evaporation from porous media. Geophys. Res. Lett. 2012, 39. [Google Scholar] [CrossRef]
  23. Rad, M.N.; Shokri, N.; Keshmiri, A.; Withers, P.J. Effects of Grain and Pore Size on Salt Precipitation During Evaporation from Porous Media. Transp. Porous Media 2015, 110, 281–294. [Google Scholar] [CrossRef]
  24. Shokri-Kuehni, S.M.S.; Vetter, T.; Webb, C.; Shokri, N. New insights into saline water evaporation from porous media: Complex interaction between evaporation rates, precipitation, and surface temperature. Geophys. Res. Lett. 2017, 44, 5504–5510. [Google Scholar] [CrossRef] [Green Version]
  25. Bergstad, M.; Or, D.; Withers, P.J.; Shokri, N. The influence of NaCl concentration on salt precipitation in heterogeneous porous media. Water Resour. Res. 2017, 53, 1702–1712. [Google Scholar] [CrossRef] [Green Version]
  26. Shokri-Kuehni, S.M.S.; Bergstad, M.; Sahimi, M.; Webb, C.; Shokri, N. Iodine k-edge dual energy imaging reveals the influence of particle size distribution on solute transport in drying porous media. Sci. Rep. 2018, 8, 9. [Google Scholar] [CrossRef] [PubMed]
  27. Nachshon, U.; Weisbrod, N.; Katzir, R.; Nasser, A. NaCl Crust Architecture and Its Impact on Evaporation: Three-Dimensional Insights. Geophys. Res. Lett. 2018, 45, 6100–6108. [Google Scholar] [CrossRef]
  28. Weisbrod, N.; Nachshon, U.; Dragila, M.; Grader, A. Micro-CT Analysis to Explore Salt Precipitation Impact on Porous Media Permeability. In Transport and Reactivity of Solutions in Confined Hydrosystems; NATO Science for Peace and Security Series C: Environmental Security; Springer: Dordrecht, The Netherlands, 2014; pp. 231–241. [Google Scholar]
  29. Nachshon, U.; Weisbrod, N. Beyond the Salt Crust: On Combined Evaporation and Subflorescent Salt Precipitation in Porous Media. Transp. Porous Media 2015, 110, 295–310. [Google Scholar] [CrossRef]
  30. Jelinkova, V.; Snehota, M.; Pohlmeier, A.; van Dusschoten, D.; Cislerova, M. Effects of entrapped residual air bubbles on tracer transport in heterogeneous soil: Magnetic resonance imaging study. Org. Geochem. 2011, 42, 991–998. [Google Scholar] [CrossRef]
  31. ROBU Glasfilter-Geräte GmbH, Hattert, Germany. VitraPOR® Sinterfilter. 2019. Available online: www.robuglas.com (accessed on 21 March 2020).
  32. Westphal, G.; Kristen, G.; Wegener, W.; Ambatiello, P.; Geyer, H.; Epron, B.; Bonal, C.; Steinhauser, G.; Götzfried, F. Sodium Chloride. In Ullmann’s Encyclopedia of Industrial Chemistry; American Cancer Society: Atlanta, GA, USA, 2010; pp. 320–322. [Google Scholar] [CrossRef]
  33. Clarke, E.C.W. Evaluaiton of the thermodynamic functions for aqueous sodium-chloride from equilibrium and calometric measurements below 154-degrees-C. J. Phys. Chem. Ref. Data 1985, 14, 489–610. [Google Scholar] [CrossRef] [Green Version]
  34. Merck KGaA. Material Data Safety Sheet—Sodium Chloride, 7.16th ed.; Merck KGaA: Darmstadt, Germany, 2018. [Google Scholar]
  35. Müller, E. Magnesium—Teil B, Die Verbindungen des Magnesium. In Gmelins Handbuch der Anorganischen Chemie; Pietsch, E., Ed.; Verlag Chemie: Berlin, Germany, 1939; pp. 243–249. [Google Scholar]
  36. Guendouzi, M.E.; Mounir, A.; Dinane, A. Water activity, osmotic and activity coefficients of aqueous solutions of Li2SO4, Na2SO4, K2SO4, (NH4)2SO4, MgSO4, MnSO4, NiSO4, CuSO4, and ZnSO4 at T = 298.15 K. J. Chem. Thermodyn. 2003, 35, 209–220. [Google Scholar] [CrossRef]
  37. Th. Geyer GmbH & Co. KG, Renningen, Germany. Technical Data Sheet—Magnesium Sulfate Heptahydrat. 2020. Available online: www.thgeyer.de (accessed on 15 February 2020).
  38. Plessen, H.V. Sodium Sulfates. In Ullmann’s Encyclopedia of Industrial Chemistry; American Cancer Society: Atlanta, GA, USA, 2000; pp. 383–385. [Google Scholar] [CrossRef]
  39. Merck KGaA. Material Data Safety Sheet—Sodium Sulfate, 8.2 ed.; Merck KGaA: Darmstadt, Germany, 2019. [Google Scholar]
  40. Weingärtner, H.; Teermann, I.; Borchers, U.; Balsaa, P.; Lutze, H.V.; Schmidt, T.C.; Franck, E.U.; Wiegand, G.; Dahmen, N.; Schwedt, G.; et al. Water, 1. Properties, Analysis, and Hydrological Cycle. In Ullmann’s Encyclopedia of Industrial Chemistry; American Cancer Society: Atlanta, GA, USA, 2016; pp. 1–40. [Google Scholar] [CrossRef]
  41. Quartzwerke GmbH. Stoffdaten F32–F36; Quartzwerke: Frechen, Germany, 2009. [Google Scholar]
  42. Glover, P.W.J.; Walker, E. Grain-size to effective pore-size transformation derived from electrokinetic theory. Geophysics 2009, 74, E17–E29. [Google Scholar] [CrossRef]
  43. Licsandru, G.; Noiriel, C.; Duru, P.; Geoffroy, S.; Abou Chakra, A.; Prat, M. Dissolution-precipitation-driven upward migration of a salt crust. Phys. Rev. E 2019, 100, 9. [Google Scholar] [CrossRef] [Green Version]
  44. Balboni, E.; Espinosa-Marzal, R.M.; Doehne, E.; Scherer, G.W. Can drying and re-wetting of magnesium sulfate salts lead to damage of stone? Environ. Earth Sci. 2011, 63, 1463–1473. [Google Scholar] [CrossRef] [Green Version]
  45. Ball, B.; Schjønning, P. Air Permeability. In Methods in Soil Analysis: Part 4 Physical Methods; Dane, J.H., Topp, C.G., Eds.; SSSA Book Series; Soil Science Society of America: Madison, WI, USA, 2020. [Google Scholar] [CrossRef] [Green Version]
  46. Green, D.W.; Perry, R.H. Perry’s Chemical Engineers’ Handbook, 8th ed.; The McGraw-Hill Companies: New York, NY, USA, 2008. [Google Scholar]
  47. An, N.; Tang, C.S.; Xu, S.K.; Gong, X.P.; Shi, B.; Inyang, H.I. Effects of soil characteristics on moisture evaporation. Eng. Geol. 2018, 239, 126–135. [Google Scholar] [CrossRef]
  48. Nield, J.M.; Neuman, C.M.; O’Brien, P.; Bryant, R.G.; Wiggs, G.F.S. Evaporative sodium salt crust development and its wind tunnel derived transport dynamics under variable climatic conditions. Aeolian Res. 2016, 23, 51–62. [Google Scholar] [CrossRef] [Green Version]
  49. Rust, A.C.; Cashman, K.V. Permeability of vesicular silicic magma: Inertial and hysteresis effects. Earth Planet. Sci. Lett. 2004, 228, 93–107. [Google Scholar] [CrossRef]
  50. Takeuchi, S.; Nakashima, S.; Tomiya, A. Permeability measurements of natural and experimental volcanic materials with a simple permeameter: Toward an understanding of magmatic degassing processes. J. Volcanol. Geotherm. Res. 2008, 177, 329–339. [Google Scholar] [CrossRef]
  51. Chilton, T.H.; Colburn, A.P. Pressure drop in packed tubes. Ind. Eng. Chem. 1931, 23, 913–919. [Google Scholar] [CrossRef]
  52. Zeng, Z.W.; Grigg, R. A criterion for non-Darcy flow in porous media. Transp. Porous Media 2006, 63, 57–69. [Google Scholar] [CrossRef]
  53. Schlichting, H.; Gersten, K. Boundary-Layer Theory, 9th ed.; Springer: Berlin/Heidelberg, Germany, 2017; Chapter 1; p. 12. [Google Scholar] [CrossRef]
Figure 1. (a) Sketch of the gas permeameter set-up with attached crust. The sample holder consisted of PMMA and had an inner diameter d = 31   mm, a sample holder length l = 140   mm, and a maximum filling height h max = 100   mm. The sample height h = 80   mm denotes the initial filling height of the sample. After crust formation, the sand below the crust was removed and dry nitrogen was flown through the crust with thickness s using four different flow rates controlled by the flow controller Q. A pressure transducer P monitored the pressure difference Δ p over the crust. The red dotted line indicates the position of the filter plate during evaporation, which was fixed with the removable bottom plug and was removed for the gas flow measurements. (b) Photo of the sample holder filled with sand and liquid.
Geosciences 10 00423 g001
Figure 2. Results of the evaporation experiment. The thin colored lines and the error bars illustrate the variation of the triplicate samples. (a) Cumulative mass loss over time. The legend shows the initial concentration of each saline solution (see Table 1). (b) Evaporation rate over time. The legend provides the saturation pressure according to the initial concentration (see Table 1). In order to provide a detailed visualization of the evaporation rate at the beginning of the experiments, results are shown until day 12 only.
Geosciences 10 00423 g002
Figure 3. Photos of sample surface for selected samples directly after preparation, two days of evaporation, and before crust separation for samples with NaCl solution (a,d,g), MgSO 4 solution (b,e,h), and Na 2 SO 4 solution (c,f,i).
Geosciences 10 00423 g003
Figure 4. Pressure difference as a function of gas flow rate for two selected salt crusts ((a) Na 2 SO 4 , (b) MgSO 4 ). The crust thickness s and the permeability k obtained with Equation (2) are provided in the title of each subplot.
Geosciences 10 00423 g004
Figure 5. Permeability of different salt crusts determined with the gas permeameter (a) directly after evaporation (wet state) and (b) after drying for 96 h at 60 C (dry state). The category “Sand” shows the permeability of the dry reference samples that were prepared with pure water. The data points indicate each individual sample and the horizontal bars show the mean value of each triplicate. The permeability in the wet state (a) represents the relative permeability for advective gas flow. As liquid was incorporated in the pores, this permeability has to be handled with care (see text for details).
Geosciences 10 00423 g005
Table 1. Properties of the saline solutions at 20 C. The density of the solutions and the vapor pressures are interpolated from the listed references in the last column. The vapor pressure of H 2 O corresponds to fully saturated wet air.
SubstancePhysical PropertiesSolutions Prepared for Evaporation ExperimentsReference
Molar massMaximumInitialInitial densityInitial vapor
solubilityconcentration pressure
[g/mol][mol/L][mol/L][g/cm 3 ][kPa] at 25 C
NaCl58.446.132.041.0792.935[32,33,34]
MgSO 4   ×   7H 2 O246.482.880.961.1073.111[35,36,37]
Na 2 SO 4 142.041.410.471.0583.111[36,38,39]
H 2 O18.01--0.9983.169[40]
Table 2. Particle size distribution of F32 Quartz sand [41].
Particle Size  [ mm ] Mass Fraction  [%]
>0.3355
0.250–0.35528
0.180–0.25049
0.125–0.18016
0.090–0.1252
<0.090-
Table 3. Normalized ratios of the initial evaporation rates from Figure 2 and the vapor pressure differences of the initial solutions from Table 1. The ambient vapor pressure p amb H 2 O = 0.950kPa was determined at 25 C and 30% relative humidity. According to Equation (1), this ambient vapor pressure was subtracted from the saturation vapor pressure of the initial solutions (Table 1). The resulting vapor pressure difference for each solution is listed in the third column of this table.
SolutionInitial Evaporation RateInitial Evaporation Rate MormalizedVapor Pressure DifferenceVapor Pressure Difference Normalized
[mm/day][-][kPa][-]
NaCl12.10.661.9850.89
MgSO 4   ×   7   H 2 O 14.10.772.1610.97
Na 2 SO 4 14.40.792.1610.97
H 2 O18.312.2171
Publisher’s Note: MDPI stays neutral with regard to jurisdictional claims in published maps and institutional affiliations.

