Abstract
Soil and groundwater salinization are very important environmental issues of global concern. They threaten mainly the arid and semiarid regions characterized by dry climate conditions and an increase of irrigation practices. Among these regions, the south of Tunisia is considered, on the one hand, to be a salt-affected zone facing a twofold problem: The scarcity of water resources and the degradation of their quality due to the overexploitation of the aquifers for irrigation needs. On the other hand, this Tunisian landform is the only adequate area for planting date palm trees which provide the country with the first and most important exportation product. In order to maintain the existence of these oases and develop the date production, a good understanding of the salinization problem threatening this region, and the ability to predict its distribution and evolution, should not be underestimated. The work presented in this paper deals with the Oasis of Segdoud in southern Tunisia, with the objective of modeling the evaporation-driven salt precipitation processes at the soil profile scale and under real climatic conditions. The model used is based on the one developed and presented in a previous work. In order to fulfil the real field conditions, a further extension of the geochemical system of the existing model was required. The precipitated salts considered in this work were halite (NaCl), gypsum (CaSO) and thenardite (NaSO). The extended model reproduces very well the same tendencies of the physico-chemical processes of the natural system in terms of the spatio-temporal distribution and evolution of the evaporation and multiple-salt precipitation. It sheds new lights on the simulation of sequences of salt precipitation in arid regions. The simulation results provide an analysis of the influence of salt precipitation on hydrodynamic properties of the porous medium (porosity and permeability). Moreover, the sensitivity analysis done here reveals the influence of the water table level on the evaporation rate.
1. Introduction
Saline water evaporation from porous media is involved in several applications such as building industries, agriculture and water resources management [1,2,3,4,5].
The evaporation of saline water from soils results in the precipitation of the dissolved salts, leading, therefore, to groundwater and soil salinization. This environmental problem is more pronounced in arid and semiarid regions where, apart from dry climatic conditions, the irrigated water, often salt-riched and of poor quality, provides an additional source of salts to the soil.
The intensification of irrigation practices as well as the rapidly increase of the intensity and magnitude of soil salinization during the last few decades, have made it necessary to provide a good understanding of the different processes which interplay in the evaporation-driven salt precipitation from soils. This would help preventing its negative consequences in the foreseeable future.
The complexity of the soil salinization problem is reflected in the diverse research done in this field which includes experimental investigations as well as mathematical and numerical modeling tools. Based on laboratory experiments, some authors have shown that, when water evaporates from a porous structure, the salt concentration increases and salt precipitates either as efflorescent or as subflorescent [6,7,8]. Furthermore, a good level of agreement has been found between several studies suggesting that the precipitated salt does not only affect the evaporation rate [9,10,11,12,13,14] but also the properties of the porous medium, mainly its porosity and permeability [1,15,16,17,18,19,20,21,22,23].
Besides, several sophisticated numerical tools have been developed in order to model the physical processes related to water flow and transport in porous media under evaporation conditions. Some of them are based on Richard’s equation [24,25] and are limited to describe either single-phase flow or evaporation of pure water. Other developed models are restricted to simulate combined evaporation and single-salt precipitation processes in homogeneous [6,7,12,26,27,28] and in heterogeneous porous media [7,9,12,26,27,29,30,31].
Southern Tunisia with its abundant drylands and evaporite deposits, presents an interesting application field that has been subject of many studies. In these works [2,3,32], the authors highlighted the importance of Chott environments (highly saline lake) in sedimentological and palaeoecological studies and also in investigating the origin and evolution of evaporite deposits and formation. Other irrigated lands dedicated to agricultural use have motivated some current studies in order to evaluate the salinization risk in this zone [33,34,35].
This region encounters environmental problems in terms of water resources scarcity, overexploitation of groundwater for irrigation and poor quality of irrigated waters. Nevertheless, Southern Tunisia offers a favorable microclimate for oasis agriculture [36], a modern agriculture created by the country policies in order to enhance the economical development of the country by maximizing the production and exportation of dates [36].
Among others, the modern Oasis of Segdoud in Southern Tunisia with a surface of 160 ha, plays an important role in this economic development. It has been, however, ignored in the actual researches in relation to the characterization of water flow and salt precipitation dynamics. So far, only few studies have been done related to this area [33,36,37,38]. In these studies, Askri, Bouhlila and Job focused mainly on a model analysis to understand the mechanisms of secondary salinization driven by irrigation practices. This was realized by the development of a hydrologic model enabling to predict soil salinity, groundwater level and drain discharge at the oasis parcel scale. This analysis is based on daily irrigation water depth, rainfall and evapotranspiration [39]. Moreover, Bouhlila [40] developed a coupled flow and transport geochemical model able to reproduce sequences of salt dissolution-precipitation under a constant evaporation rate from a soil profile from the oasis area.
So far, reference [41] suggested a numerical model which provides insights into the evaporation-driven mixed-salt precipitation processes in homogeneous and heterogeneous porous media. In [41] the main objective has been the modeling of reactive evaporation-inducing halite and gypsum co-precipitation with a focus on the effects of the porous medium heterogeneitis on the processes dynamics. The model developed in [41], has not been, however, used for real applications. Hence, the study presented in ths paper builds upon the previous studies and is considered as an extension of the findings presented in [41]. The aim of this study is to provide a better understanding of the physicochemical processes related to evaporation-driven salt precipitation under realistic climatic conditions characterizing a Tunisian oasis field. The objective of this study is to reproduce the natural system in relation to evaporative salt precipitation in order to be able to predict the space and time evolution of these processes. We present in this paper a numerical model developed in this aim and which accounts for evaporation inducing multiple salt precipitation. We performed numerical tests with the developed model for a soil profile typical of the oasis parcel and using realistic climatic data provided by the meteorological station corresponding to the region subject of this work. In what follows, the formulation of the mathematical and geochemical models is detailed. The simulation results related to the model application are discussed in the last part of this paper.
2. Model Formulation
2.1. Model Assumptions and Conceptualization
The processes of evaporation driven salt precipitation in porous media are influenced by the initial chemical composition of the evaporating solution leading to favorize the precipitation or dissolution of one salt type in disregard of the other. Hence, to be able to describe the real field system, a good understanding of the brine chemistry is required for the model conceptualization.
The chemical composition of the brine solution is given in Table 1. It results from the equilibrium between irrigated and drainage waters chemistry. This equilibrium indicates that ions are eliminated in drainage water. Moreover, reference [40] indicated that the irrigation water used for Segdoud oasis is very deep water which brine is very poor in bicarbonate ions. Hence, our first assumption in the model concept is to avoid in the chemical system. As can be seen from Table 2, the Segdoud oasis groundwater is enriched. The concentrations of and are very low compared to the other ions. For that reason, our second assumption is to ignore the presence of and and to consider a four-ions based chemistry with a correction of the electro-neutrality of the solution.

Table 1.
Chemical composition (in mg/L) of Segdoud brine (March 1995) taken from [42].
Table 2.
List of minerals prior to precipitate after evaporation of Segdoud brine.
Based on this assumption, we did preliminar batch reaction calculations with the geochemical model PHREEQC [43]. These calculations are helpful for problems where the possibility of mineral dissolution or precipitation needs to be known and analyzed, which is the case in this work. From a brine solution analysis, PHREEQC calculates the distribution of the ionic species and provides saturations indices for minerals indicating whether a mineral should precipitate or dissolve.
In the case of Segdoud brine which composition is given in Table 1, different minerals can be formed. These are listed in Table 2. The sequence of precipitation of these salts by evaporating the initial solution is shown in Figure 1. It depicts the evolution of the molality of the ionic species as well as the formed minerals as a function of the concentration factor of the initial solution during evaporation.
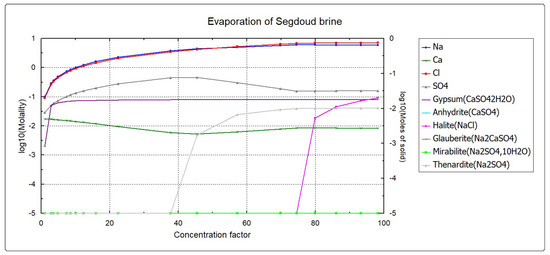
Figure 1.
PHREEQC Batch reaction calculations.
According to the batch reaction calculation results shown in Figure 1, it is shown that only three minerals (salts) should precipitate during the evaporation of the initial brine characterizing the oasis of Segdoud. These salts are gypsum, thenardite and halite, respectively. Therefore, the model concept developed for the modeling of real evaporation driven salt precipitation from the soil profile representing the oasis of Segdoud should take into account the simultaneous precipitation of these salts. The model concept developed in this aim is described by Figure 2.
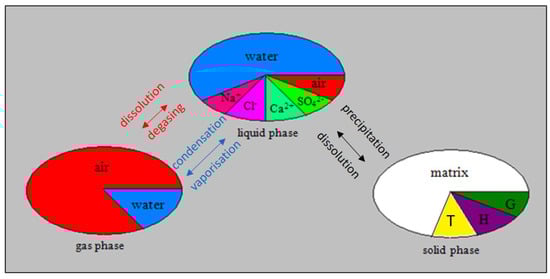
Figure 2.
Three-phase (solid, liquid and gas)—multiple components porous medium model. The liquid phase consists of dissolved air and ionic species (). There is exchange of dissolved ions between liquid and solid phase through precipitation and formation of Gypsum (G), Halite (H) and Thenardite (T).
2.2. Geochemical Modeling
The chemical system considered for the developed model concept accounts for the precipitation of gypsum, halite and thenardite. The developed model concept is an extension of the model developed by E.Mejri and described in [41] with the required components and equations. Hence, we give here the description of the geochemical processes related to the precipitation of thenardite. All details describing the kinetics of gypsum and halite formation can be found in [41].
Thenardite (anhydrous) is one of two widely known forms of sodium sulphate, the other one being mirabilite (). According to the literature [19,44,45,46], sodium sulphate is considered one of the most harmful salts causing the degradation of porous building materials. It is widely used in laboratory experiments dealing with rock weathering problems. Thenardite forms according to the following chemical reaction:
with an equilibrium constant given as:
where [i] is the activity of the ionic species i, calculated using the Truesdell and Jones model [41]. At 25 C and constant ph, the solubility of thenardite in water is 160 g/L.
The chemical processes are described following the kinetic approach. This suggests that thenardite forms with a precipitation rate calculated as follows:
The parameters of this equation are found in [41]. The key parameter in this equation which indicates if thenardite should precipitate or dissolve in the liquid solution is the saturation index . It is calculated as:
where the solubility product of thenardite is equal to .
Combined with the evaporation dynamics, the analysis of this multiple salt precipitation system is of great interest because the considered salts have different characteristics (anhydrous and not, solubility, ...) and the dissolved ions participate in more than one chemical reaction. This would create a competition between the formation of the different salts. These processes are discussed later on with the help of the numerical simulations.
2.3. Mathematical Modeling
The reactive transport model developed in this paper is an extension of the model developed in [41]. While the same existing transport equations of the components were reused here, an additional equation was needed to describe the transport of thenardite. It is given as follows:
where corresponds to the volume occupied by the precipitated thenardite (solidity). Moreover, the source/sink terms of the transport equations describing the coupling between transport and chemical processes must be modified taking into consideration the common-ion salt precipitation. Table 3 summarizes the source/sink terms of the transport equations for each component of the multiphase-multicomponent system, where and are defined in [41].
Table 3.
Source/sink terms of the transport equations of each component.
The ionic species dissolved in the brine solution are subject to transport in the porous media and during the course of evaporation, their concentration increases leading after some time to the formation of salt crystals within the void space of the porous medium. The decrease of the initial porosity of the modeled porous structure is evaluated with the following equation:
where is the solidity of the precipitated mineral m, m ∈ and . Besides, the same equation accounting for the reduction of the permeability of the porous medium resulting from the reduction of its porosity is used. The solidity of thenardite is added to the previously considered primary variables to solve the non-isothermal multicomponent reactive transport model. No modifications were done on the numerical methods used to discretize the system of equations [41].
3. Description of the Study Area
3.1. Location
The study area is the Oasis of Segdoud located in the southwest of Tunisia (3414 N; 810 E), 30 Km north-east of Tozeur and 70 Km south-west of Gafsa (see Figure 3). Segdoud is limited to the north by the Negueb and Chouabine mountains and to the south by chott el Gharsa. The Oasis of Segdoud is a modern oasis which has been created in 1989 by the country policies in order to enhance the economical development of the country by maximizing the production and exportation of dates. The oasis covers a surface of 160 ha and is subdivided into 107 plots, each covers an area of 1.5 ha. The oases of Segdoud are continental with a mean planting space of m [47]. The date palm is the principal vegetation in these oases with the preference of Deglet el Nour variety.
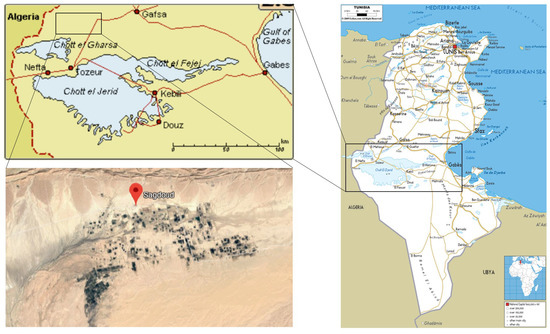
Figure 3.
Location map of the oasis of Segdoud.
3.2. Climatic Conditions
The oasis of Segdoud belongs to the bioclimatic saharan zone. The weather is characterized by an annual average temperature of 20 C. The warmest month is July with a mean temperature of 30.6 C while the coolest month is January, with a mean temperature of 10.6 C. We plot in Figure 4 the evolution of the mean temperature during the year 2012. The data are obtained from the National Institute of Meteorology and collected at a daily time step from the meteorological station located in Tozeur.
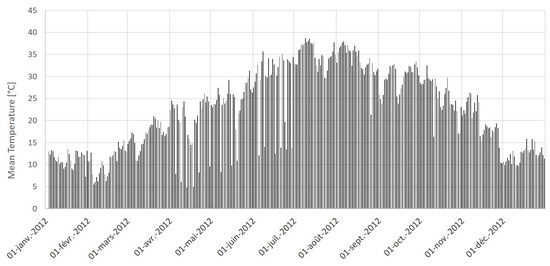
Figure 4.
Daily mean temperature (in ) in Tozeur during 2012.
In Tozeur, the precipitations are low and irregular with an annual amount of 96 mm on a total of 29 days. March is the month with the most precipitations with a mean value of 20.3 mm per year. The month with the least precipitation is July with an average of 0 mm yearly.
The weather in Tozeur is hot and dry during summer and is characterized by a high evaporation rate. The annual reference evapotranspiration in Tozeur is equal to about 1643 mm. Figure 5 depicts the evolution of the evapotranspiration in Tozeur during 2012. These calculations are done with the refererence evapotranspiration calculator ET0 using the FAO (Food and Agriculture Organization) Penman-Monteith Equation [48]. They are based only on weather data and depend neither on crop characteristics nor on soil parameters. The FAO Penman-Monteith equation is given as follows:
where is the evapotranspiration [mm/day],
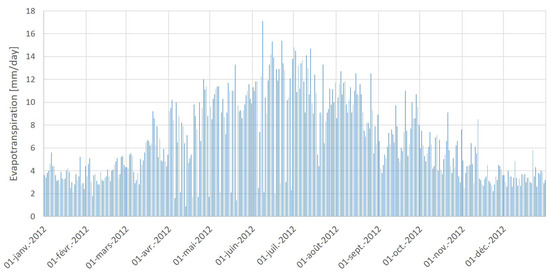
Figure 5.
Daily evapotranspiration (mm/day) during 2012 calculated with ET0 calculator.
- net radiation at the crop surface ,
- G soil heat flux density ,
- T mean daily air temperature at 2 m height [C],
- wind speed at 2 m height ,
- saturation vapour pressure [KPa],
- actual vapour pressure [KPa],
- saturation vapour pressure deficit [KPa],
- slope vapour pressure curve ,
- psychometric constant .
Each of these equation parameters are calculated intermediarly based on climatic data (minimum, maximum and mean temperature , maximum and minimum air humidity [%], wind velocity [m/s] and radiation ).
3.3. Chemical Composition
The soils in the oasis of Segdoud are 96% of sandy type. The variability of the soil texture is very low from one soil layer to the other [42]. The saturated hydraulic conductivity of the oasis soil varies between 0.2 and 30 and its measured electric conductivity lies between 8 and 30 . Such a value allows to classify the oasis soil within the saline soils [42].
Hydrographically, the oasis of Segdoud is connected to Chott el Gharsa, which contains three superposed aquifers: The Complex Terminal (CT), the Continental Intercalaire (CI) and the shallow groundwater aquifer.
Based on experimental investigations, reference [42] showed that the depth of the shallow groundwater table varies from 0.9 to 1.8 m. Water flows in the oasis from north to south and from east to west with a mean infiltration rate of 2.2 m/day and a hydraulic gradient lying between 0.7% and 1.5%. The salinity of the oasis groundwater is high and results from an equilibrium between the salinity supply from irrigation water and salinity removing by the drainage and groundwater lateral flow. These waters are rich on different ionic species, namely , , , , , and [42].
3.4. Management of the Oasis of Segdoud
The water management in the oasis of Segdoud started in 1989 after its creation. At that time, the effective irrigated area was about 10 ha from the total area of 160 ha. This irrigated surface has increased to reach 20 ha in May 1995 [38].
The irrigation method is a traditional system of pipes, concretes and earthen canals. The irrigation water is of poor quality and often very saline, as reported by Askri [36]. In Table 4, the chemical composition of water used for irrigation in October 1995 is given. Irrigation water is pumped from two deep wells Segdoud CT2 and Segdoud CT3 and is conducted to the basins in which the palm trees are [36]. The total water inflow by irrigation is 76 L/s.
Table 4.
Chemical composition (in mg/L) of irrigation water (October 1995) taken from [42].
The duration of irrigation is 3.3 h of water per hectare with a frequency which depends on the season: Every 7 days in spring and summer and every 15 days in autumn and winter [36].
Near to the irrigation system, a drainage system was also installed in the oasis in order to discharge the surplus of saline water from the water table [38].
4. Modeling of Salt Precipitation Sequences under Evaporation of a Soil Profile Typical of the Oasis of Segdoud
4.1. Problem Setup
In the work of [36], it has been reported that, in the oasis of Segdoud different processes take place at the oasis parcel scale. These processes consist in evapotranspiration, rainfall, irrigation, infiltration, percolation to groundwater, groundwater lateral flow and drainage. In our numerical experiment, we do not consider, however, all these processes to avoid complex calculations and long calculation time. The first focus point of our analysis is the evaporative multiple salt precipitation. The other processes will be considered in future investigations.
To do so, we considered a two-dimentional homogeneous porous column of 1.1 m of height and 0.5 m of width and meshed with a grid, as schown in Figure 6, which also depicts the simulation setup and the initial and boundary conditions. The properties of the porous medium are typical of the Segdoud oasis soil. These are given in Table 5. The bottom and sides of the column were closed. Within the porous medium, a water table level is set at 0.5 m, above which the saturation in the domain corresponds to a hydrostatic pressure distribution. The chemical composition of the initial brine solution is the one given in Table 2, but converted into mass fractions.
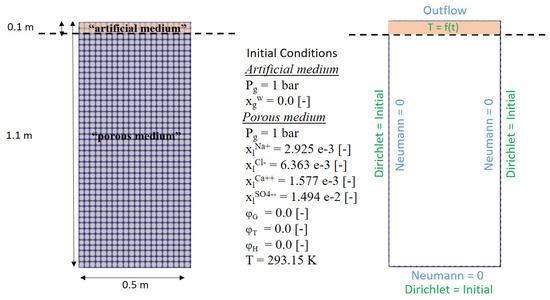
Figure 6.
Left: Problem setup; right: Initial and boundary conditions for the simulated problem.
Table 5.
Porous medium properties for the simulated setup.
At the top of the porous medium, an artificial domain was introduced in which we defined the time dependent boundary conditions. These are given for the temperature in order to calculate the evaporation from the soil profile. The values of temperature are hourly data related to the month of July from the year 2012 with the most complete climatic data. This choice is explained by the fact that July is the warmest month during which the evaporation is the most important in the year. These values are plotted in Figure 7 and introduced as boundary condition at hourly calculation time steps. The first value corresponds to 00:00 AM and the fluctuations are explained by diurnal variations of the temperature.
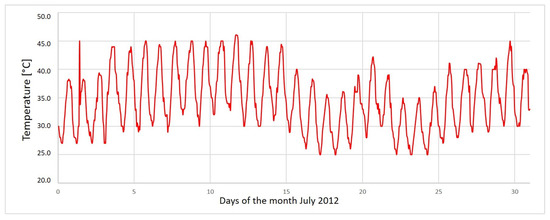
Figure 7.
Hourly temperature in Segdoud during the month of July 2012 (National Institute of Meteorology).
4.2. Simulation Results and Discussion
We discuss in this section the results of the numerical experiment carried out with the previously described setup. The results shown here are limited to 10 days simulation time. In Figure 8, the spatial distribution of the water saturation in the soil profile for different simulation times is given. The dashed line separates the porous medium from the artificial domain.
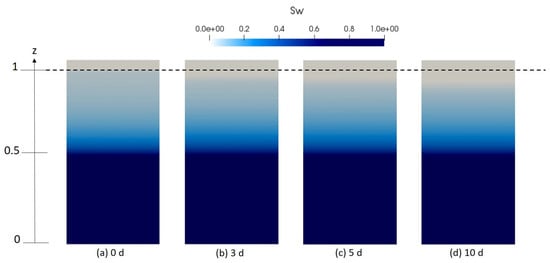
Figure 8.
Numerical results depicting the spatial distribution of water saturation in the sand column for different time intervals (a) initially and after (b) 3 days, (c) 5 days, (d) 10 days.
As it can be clearly seen in this figure, the water level decreases progressively and homogeneously in the unsaturated zone, which is explained by the evaporation from the porous medium driven by the temperature and vapor gradients. A longer simulation time would be needed for the drying front to reach the water table level set in the middle of the porous column.
As long as the porous column dries out, the liquid solution is transported from deeper level to the evaporating surface. Influenced by the decrease of water content, the concentration of ions in the liquid moisture increases consequently. This can be clearly seen in Figure 9 which illustrates the temporal evolution of the ions concentration along a vertical cross section of the domain.
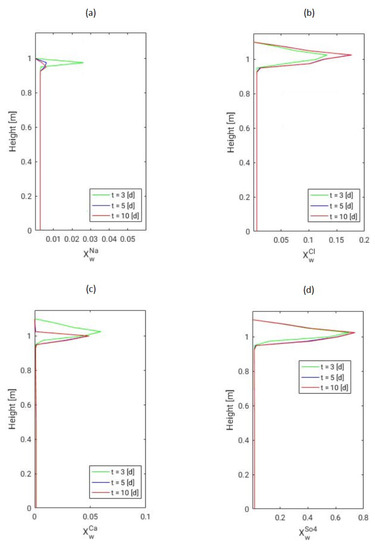
Figure 9.
Mass fraction distribution of different ionic species (a) Na, (b) Cl, (c) Ca and (d) SO dissolved in the saline water. The concentration distributions are depicted along a vertical section in the top region of the porous medium domain and are plotted after several days for each ionic species.
Analyzing this figure, we see that the concentration of all ions is the highest at the top of the porous column, where water evaporates, compared to the lower part of the domain. Moreover, it is observed that the concentration of and decreases between 3 and 10 simulation days. This decrease is explained by the supersaturation of the solution with respect to the solubility concentration of the dissolved minerals indicating the beginning of their formation. Since is a common ion in two precipitation reactions, the decrease of its concentration will be the most notified. Furthermore, the initial concentrations of and are higher than for and which explains that the solution remains concentrated in these two ions despite the beginning of salts precipitation.
Figure 10, Figure 11 and Figure 12 describe the spatial distribution of the volume fraction of the formed gypsum, thenardite and halite, respectively, for different simulation times. Here, it is important to mention that the initial brine solution was oversaturated in dissolved gypsum with an initial saturation index . This results in the presence of precipitated gypsum already everywhere in the domain even before drying starts. After some time, the volume fraction of the precipitated gypsum at the top of the domain becomes lower compared to the rest of the domain. This is because of the simultaneous formation of thenardite and therefore the consumption of for that reaction.
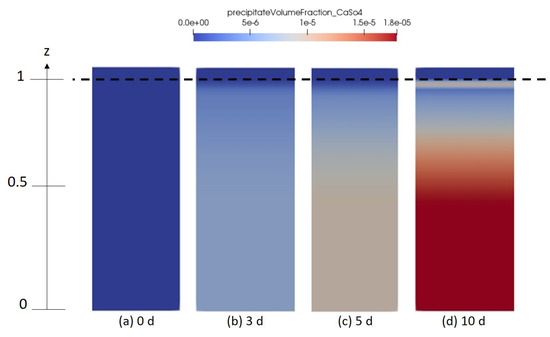
Figure 10.
Numerical results depicting the spatial distribution of gypsum solidity in the porous medium domain for different time intervals (a) 0 days, (b) 3 days, (c) 5 days and (d) 10 days.
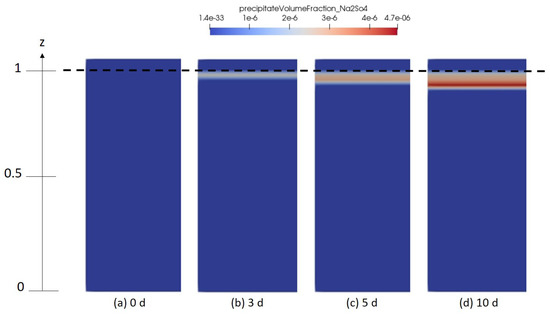
Figure 11.
Numerical results depicting the spatial distribution of thenardite solidity in the porous medium domain for different time intervals (a) 0 days, (b) 3 days, (c) 5 days and (d) 10 days.
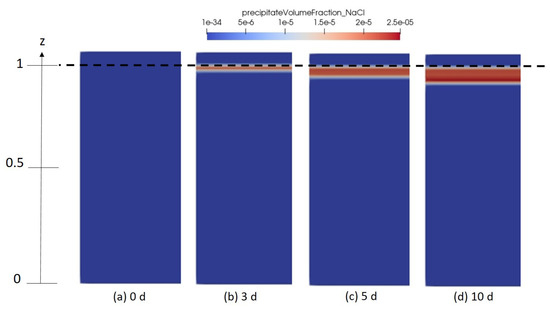
Figure 12.
Numerical results depicting the spatial distribution of halite solidity in the porous medium domain for different time intervals (a) 0 days, (b) 3 days, (c) 5 days and (d) 10 days.
As for thenardite and halite, they start forming at the evaporating surface where the ions concentration is the highest. This is driven by the drying of the porous column. Since the evaporation driven multiple salt precipitation mainly takes place at the top of the domain, we focus in what follows on the analysis of the processes at a chosen point situated in the middle of the evaporating surface, since the processes are homogeneous horizontally.
It is important to mention, that in Figure 10 and Figure 11, no salt fingering is observed in comparison to what has been reported in other presious studies [49,50,51]. This is explained by the absence of density effect considerations in the developed numerical model. This will, however, be taken into account in future work, where density variation related to salt concentrations change will be involved in the model.
In Figure 13, we plotted the time evolution of the precipitated volume fraction of the given salts at that representation point. We clearly see, that gypsum started forming from t = 0, as explained previously. The gypsum formation is followed after a while by halite and thenardite crystallization.
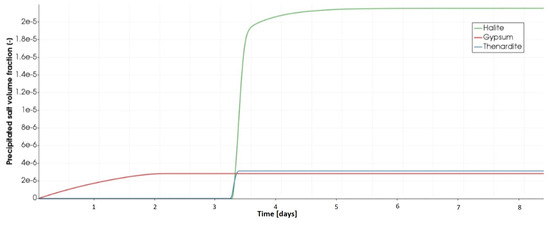
Figure 13.
Variation of the volume of the precipitated salts at the evaporating surface at the top of the porous medium.
The results provided by this analysis are not, however, comparable to those calculated using PHREEQC calculator in terms of the time of apparition of the first crystals of halite and thenardite. In fact, the batch reaction calculations performed with PHREEQC are based on the equilibrium approach and not the kinetic one used in our model. This latter supposes that, the higher the precipitation rate constant of a mineral is, the faster would this mineral precipitate under drying conditions. In this numerical example, we used kinetic rate constants for halite and gypsum of the same order of magnitude. Hence, the simultaneous beginning of their crystallization was expected.
Salts precipitation has a direct consequence in clogging the void space of the porous material and, therefore, the reduction of its initial porosity. Such a result is clearly seen in Figure 14. This figure shows the temporal evolution of the initial porosity at the same representation point used previously. The sharp decrease of the porosity occuring at is explained not only by the beginning of formation of halite and thenardite, but also due to the higher volume fraction of halite (reaching ) compared to gypsum ().
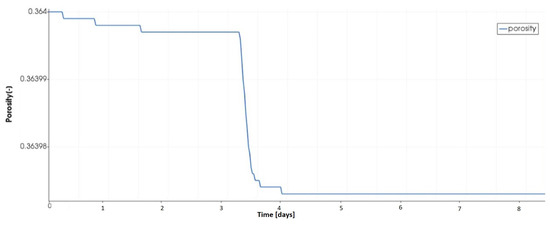
Figure 14.
Evolution of the initial porosity at the top of the porous medium.
In Figure 15, the temporal evolution of the real evaporation rate simulated with the developed model is given and compared to the evaporation rate profile obtained from the work of [29]. Initially, the evaporation rate increases due to the temperature and water vapor gradients between the porous medium and the artificial domain. This is similar to the first stage SS1 of evaporation of saline water. The transition to stage SS2 is marked by the increase of the evaporation rate. Two curve slopes are observed: A first sharp decrease, called here D1 followed by a second lower decrease, called D2. At t = 0.5 day, the evaporation rate drops.
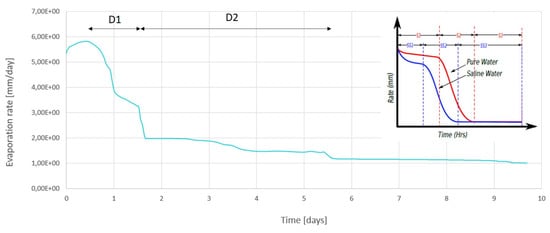
Figure 15.
Variation of the evaporation rate during 10 days simulation time.
From the one hand, at that time, the porosity decrease is not high enough to cause the decrease of the evaporation rate. From the other hand, as long as the porous column dries out, the ions concentration increases. This results in the increase of the osmotic potential of the solution, which in turn leads to the decrease of the saturated vapor pressure and therefore the potential of water molecules to move from liquid to gas phase. Hence, the increase of ions concentration in the brine solution is high enough to cause the sharp decrease of the evaporation rate during D1.
The second decrease D2 is less important and caused by the clogging of the pores filled with the precipitated salts, which causes the reduction of the evaporating surface. From the end time of the second decrease D2 on, the evaporation rate is maintained low and constant. This indicates that the water vapor flow is diffusion driven. This result matches pretty well with the profile given in the upper corner of Figure 15 [29].
Furthermore, the evaporation rate obtained from these simulations is compared with the calculations done with the calculator ET0 using the same initial climatic conditions (in terms of temperature and humidity). This comparison is given in Figure 16. We clearly notice from this figure, that at the beginning the results are in good agreement with each other. At that time, the water saturation at the top of the simulated porous medium is high and the evaporation is driven only by the temperature and vapor pressure gradient. From the second day on, water saturation decreases and salt concentration increases leading to the decrease of the simulated evaporation rate while the evaporation rate calculated by ET0 is maintained high.
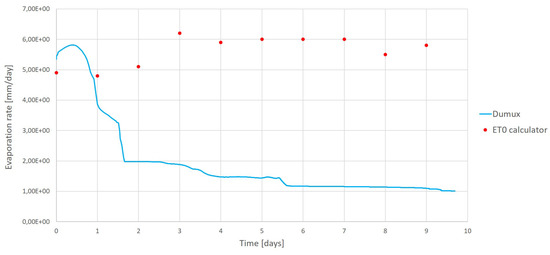
Figure 16.
Variations of the evaporation rate obtained from Dumux simulations and from ET0 calculator.
So far, the developed model enables a good description of the evaporation driven mutiple salt precipitation processes taking place in the soil profile characterizing the oasis of Segdoud. Apart from that, the depth of the water table and its seasonnal fluctuations play an important role in the soil salinization of the oasis of Segdoud, as reported in [36]. Hence, we performed a sensitivity analysis on this parameter to provide a better understanding of the influence of the water table level on the evaporative salt precipitation inducing soil salinization. We performed in this aim numerical examples with two water table levels: m and m as shown in Figure 17.
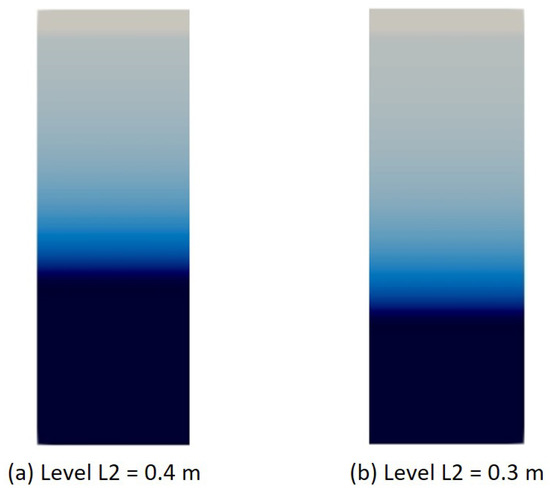
Figure 17.
Comparison of the evaporation rate for different water table levels.
In Figure 18, we plot the simulation results in terms of the temporal evolution of the evaporation rate for the given three water table levels (level m corresponds to the first simulation test). Based on these plots, we observe that the evaporation rate is the highest for the higher water table level. Actually, the nearest is the water table to the evaporating surface, the more water is available and exposed to atmospheric conditions. The evaporation rate is maintained the longuest time constant for the deepest water table level.
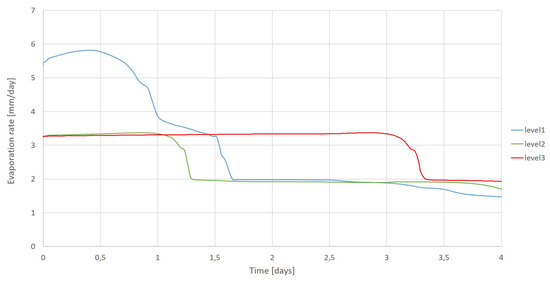
Figure 18.
Comparison of the evaporation rate for different water table levels.
This result is supported by the results depicted in Figure 19 which describes the evolution of the initial porosity of the porous medium at the evaporating surface for the tested water table levels. We see that the porosity decrease becomes important as the water table gets closer to the evaporating surface. This indicates that soil precipitation is more important when the water table is not deep, which confirms the results given by [42].
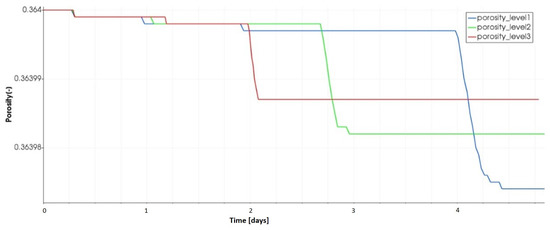
Figure 19.
Evolution of the initial porosity for different water table levels.
5. Summary and Outlook
In this paper, we presented the model developed to simulate and analyze evaporation driven salt precipitation processes at the soil profile scale and under real climatic conditions related to the oasis field of Segdoud (Southern Tunisia). The developed model is based on the existing model [41] and has been extended to simulate the dynamics and kinetics of drying and mixed salt precipitation processes.
The issue of evaporation salt precipitation cases where more than one salt is precipitating, is lack of treatement in the literature [7,26,29]. This work is, hence, considered a novelty in this direction since it provides a good description of processes dealing with evaporative multiple salt precipitation in porous media. In fact, Several simulations have been performed with the developed model. In all simulations, far field boundary conditions in temperature were used and taken from the National Institute of Meteorology (INM, Tunis). The model reproduces very good the different processes related to the soil evaporative salinization of the oasis of Segdoud.
Besides, the simulation results given in terms of the evaporation rate curve and the effects of water table leven on the evaporated water, are in good agreement with results published in [33,37,42,52].
So far, the developed model concept is restricted to the porous media at the top of which an artificial domain was introduced to define boundary conditions of temperature and water vapor. Many works existing in the literature, demonstrated, however, that the evaporation processes are highly influenced by different weather conditions. These are e.g wind velocity, turbulence, relative humidity and radiation. Therefore, a coupling of the developed porous medium model with a free-flow model has to be considered to describe the evaporation processes with more accuracy.
Furthermore, for the sake of simplicity, the implemented geochemical model accounts for the simultaneous precipitation of three salts. In reality, there exist cycles of evaporation leading to dissolution and recrystallization of the salts resulting in more complex precipitation phenomena and competition between the precipitated salts. The precipitated salts themselves, can react with the solid matrix causing its dissolution and fracturing. These phenomena have not been taken into account in this work but need to be investigated in future research. Moreover, the processes investigated in this paper are density dependant because of the variations in water saturation and dissolved minerals concentration. Hence, it would be interesting to point out in future work the processes of density recirculation in the simulated soil profile.
Author Contributions
Conceptualization, E.M.; Methodology, E.M., R.B. and R.H.; Software, E.M.; Formal Analysis, E.M.; Investigation, E.M., R.H. and R.B.; Resources, E.M.; Writing—Original Draft Preparation, E.M.; Writing—Review and Editing, E.M.; Supervision, R.H. and R.B. All authors have read and agreed to the published version of the manuscript.
Funding
This research received DAAD funding.
Acknowledgments
The authors are grateful to the German Academic Exchange Service (DAAD) for funding the research work subject of this paper. The authors would also like to thank the National Institute for Meteorology for providing us with the required climatic data.
Conflicts of Interest
The author declare no conflict of interest
References
- Bonn, N.S.; Desarnaud, J.; Bertr, F.; Chateau, X.; Bonn, D. Damage in porous media due to salt crystallization. Phys. Rev. E 2010, 81, 066110. [Google Scholar] [CrossRef] [PubMed]
- Bryant, R.G. Application of AVHRR to monitoring a climatically sensitive playa. Case study: Chott el Djerid, Southern Tunisia. Earth Surf. Process. Landforms 1999, 24, 283–302. [Google Scholar] [CrossRef]
- Bryant, R.G.; Sellwood, B.W.; Millington, A.C.; Drake, N.A. Marine-like postash evaporite formation on a continental playa: Case study from Chott el Djerid, southern Tunisia. Sedimentory Geol. 1994, 90, 269–291. [Google Scholar] [CrossRef]
- Nassar, I.N.; Horton, R. Salinity and compaction effects on soil water evaporation and water and solute distribution. Soil Sci. Soc. Am. J. 1999, 63, 752. [Google Scholar] [CrossRef]
- Peyson, Y.; Bazin, B.; Magnier, C.; Kohler, E.; Youssef, S. Permeability alteration due to salt precipitation driven by drying in the context of CO2 injection. Energy Procedia 2011, 4, 4387–4394. [Google Scholar] [CrossRef]
- Eloukabi, H.; Sghaier, N.; Nasrallah, S.B.; Prat, M. Experimental study of the effect of sodium chloride on drying of porous media: The crusty-patchy efflorescence transition. Int. J. Heat Transf. 2013, 56, 80–93. [Google Scholar] [CrossRef]
- Hidri, F. Evaporation from a Porous Medium Containing a Dissolved Salt. Influence of Heterogeneities at Darcy’s Scale on the Distribution of Ions at the Evaporative Surface. Ph.D. Thesis, University of Toulouse, Toulouse, France, 2013. [Google Scholar]
- Veran-Tissoires, S.; Prat, M. Evaporation of a sodium chloride solution from a saturated porous medium with efflorescence formation. J. Fluid Mech. Camb. Univ. Press 2014, 749, 701–749. [Google Scholar] [CrossRef]
- Bernabé, Y.; Mok, U.; Evans, B. Permeability-porosity Relationships in Rocks Subjected to Various Evolution Processes. Pure Appl. Geophys. 2003, 160, 937–960. [Google Scholar] [CrossRef]
- Fujimaki, H.; Shimano, T.; Inoue, M.; Nakane, K. Effect of a salt crust on evaporation from a bare saline soil. Vadose Zone J. 2006, 5, 1246–1256. [Google Scholar] [CrossRef]
- Le, D.; Hoang, H.; Mahadevan, J. Impact of Capillary-Driven Liquid Films on Salt Crystallization. Transp. Porous Media 2009, 80, 229–252. [Google Scholar] [CrossRef]
- Nachshon, U.; Weisbrod, N.; Dragila, M.I.; Grader, A. Combined evaporation and salt precipitation in homogeneous and heterogeneous porous media. Water Resour. Res. 2011, 47. [Google Scholar] [CrossRef]
- Shimojima, F.; Yoshioka, R.; Tamagawa, I. Salinization owing to evaporation from bare soil surfaces and its influences on the evaporation. J. Hydrol. 1996, 176, 109–136. [Google Scholar] [CrossRef]
- Tsypkin, G.; Woods, A.W. Precipitate formation in a porous rock through evaporation of saline water. J. Fluid Mech. 2005, 537, 35–53. [Google Scholar] [CrossRef]
- Battistelli, A.; Calore, C.; Pruess, K. Analysis of salt effects on the depletion of fractured reservoir blocks. In Proceedings of the World Geothermal Congress, Florence, Italy, 18–31 May 1995. [Google Scholar]
- Batzle, M.L.; Wang, Z. Seismic properties of pore fluids. Geophysics 1992, 57, 1396–1408. [Google Scholar] [CrossRef]
- Brooks, R.H.; Corey, A.T. Hydraulic Properties of Porous Media; Hydrology Papers; Colorado State University: Fort Collins, CO, USA, 1964. [Google Scholar]
- Colon, F.; Oelkers, E.H.; Schott, J. Experimental investigation of the effect of dissolution on sandstone permeability, porosity and reactive surface area. Geomech. Cosmochim. Acta 2004, 68, 805–817. [Google Scholar] [CrossRef]
- Espinosa-Marzal, R.M.; Scherer, G.W. Impact of in-pore salt crystallization on transport properties. Environ. Earth Sci. 2013, 69, 2657–2669. [Google Scholar] [CrossRef]
- Lai, K.H.; Chen, J.S.; Liu, C.W.; Yang, S.Y. Effect of permeability-porosity functions on simulated morphological evolution of a chemical dissolution front. Hydrol. Process. 2012. [Google Scholar] [CrossRef]
- Laabidi, E.; Bouhlila, R. Impact of mixing induced calcite precipitation on the flow and transport. Carbonates Evaporites 2017, 32, 473–485. [Google Scholar] [CrossRef]
- Pape, H.; Clauser, C.; Iffl, J. Permeability prediction based on fractal pore-space geometry. Geophysics 1997, 64, 1447–1460. [Google Scholar] [CrossRef]
- Xu, T.; Ontoy, Y.; Molling, P.; Spycher, N.; Parini, M.; Pruess, K. Reactive transport modeling of injection well scaling and acidizing at Tiwi, Philippines. Geothermics 2004, 33, 447–491. [Google Scholar] [CrossRef]
- Bechtold, M.; Haber-Pohlmeier, S.; Vanderborght, J.; Pohlmeier, A.; Ferre, T.P.A.; Vereecken, H. Near-Surface solute redistribution during evaporation. Geophys. Res. Lett. 2011, 38. [Google Scholar] [CrossRef]
- Van Dam, J.C.; Feddes, R.A. Numerical simulations of infiltration, evaporation and shallow groundwater levels with the Richards equation. J. Hydrol. 2000, 233, 72–85. [Google Scholar] [CrossRef]
- Jambhekar, V.A.; Helmig, R.; Schröder, N.; Shokri, N. Free-flow-porous-media coupling for evaporation-driven transport and precipitation of salt. Transp. Porous Media 2015, 110, 251–280. [Google Scholar] [CrossRef]
- Sghaier, N.; Prat, M. Effect of efflorescence formation on drying kinetics of porous media. Transp. Porous Media 2009, 80, 441–454. [Google Scholar] [CrossRef]
- Shokri, N.; Lehman, P.; Or, D. Liquid-phase continuity and solute concentration dynamics during evaporation from porous media: Pore scale processes near vaporization surface. Phys. Rev. E 2010, 81 Pt 2, 046308. [Google Scholar] [CrossRef]
- Lehmann, P.; Or, D. Evaporation and capillary coupling across vertical textural contrasts in porous media. Phys. Rev. E 2009, 80, 046318. [Google Scholar] [CrossRef]
- Nachshon, U.; Shahraeeni, E.; Or, D.; Dragila, M.; Weisbrod, N. Infrared thermography of evaporative fluxes and dynamics of salt deposition on heterogeneous porous surfaces. Water Resour. Res. 2011, 47. [Google Scholar] [CrossRef]
- Veran-Tissoires, S.; Marcoux, M.; Prat, M. Salt crystallization at the surface of a heterogeneous porous medium. Letters 2012, 98, 34005. [Google Scholar]
- Barbieri, R.; Stivaletta, N.; Marinangeli, L.; Ori, G.G. Microbial signatures in sabkha evaporite deposits of Chott el Gharsa (Tunisia) and their astrobiological implications. Planet. Space Sci. 2006, 54, 726–736. [Google Scholar] [CrossRef]
- Askri, B.; Bouhlila, R. The water and salt budget of an irrigated plot in an oasis in southern Tunisia. Irrig. Water Resour. Manag. 2001, 272, 431–478. [Google Scholar]
- Attia-Essaies, S.; Zayani, L.; Chehimi, D.B.; Adad, R.C.; Ariguib, N.K.; Trabelsi-Ayadi, M. Simulation of Crystallization sequence during the evaporation of Chott El Jerid brine (South Tunisia). Thermochim. Acta 2010, 503–504, 8–11. [Google Scholar] [CrossRef]
- Shofield, R.; Thomas, D.S.G.; Kirkby, M.J. Causal processes of soil salinization in Tunisia, Spain and Hungary. Land Degrad. Dev. 2001, 12, 163–181. [Google Scholar] [CrossRef]
- Askri, B.; Bouhlila, R.; Job, J.O. Development and application of a conceptual hydrologic model to predict soil salinity within modern Tunisian oases. J. Hydrol. 2010, 380, 45–61. [Google Scholar] [CrossRef]
- Askri, B.; Bouhlila, R. Evolution de la salinité dans une oasis moderne de la Tunisie. Etude et Gestion des Sols 2010, 17, 197–212. [Google Scholar]
- Askri, B.; Bouhlila, R.; Job, J.O. A conceptual hydrologic model for studies of salinisationa in Tunisian oases. Int. J. Water Resour. Arid. Environ. 2011, 6, 428–439. [Google Scholar]
- Askri, B.; Ahmed, A.T.; Abichou, T.; Bouhlila, R. Effects of shallow water table, salinity and frenquency of irrigation water on the date palm water use. J. Hydrol. 2014, 513, 81–90. [Google Scholar] [CrossRef]
- Bouhlila, R. Ecoulement, Transport et Réactions géOchimiques Couplés dans Les Milieux Poreux. Cas des sels et Des Saumures. Ph.D. Thesis, Université Tunis el Manar (ENIT), Tunis, Tunisia, 1999. [Google Scholar]
- Mejri, E.; Bouhlila, R.; Helmig, R. Heterogeneity Effects on Evaporation-Induced Halite and Gypsum Co-precipitation in Porous Media. Transp. Porous Media 2017, 118, 39–64. [Google Scholar] [CrossRef]
- Askri, B. La Modélisation des Processus de Salinisation des sols Irrigués en Zones Arides: Cas de l’Oasis de Segdoud. Ph.D. Thesis, Ecole Nationale d’Ingénieurs de Tunis, Tunis, Tunisia, 2002. [Google Scholar]
- Parkhurst, D.; Appelo, C. Description of Input and Examples for Phreeqc Version 3-a Computer Program for Speciation, Batch-Reaction, One Dimentional Transport, and Inverse Geochemical Calculations; U.S. Geological Survey: Denver, CO, USA, 2013.
- Derluyn, H.; Saidov, T.; Espinosa-Maezar, R.; Pel, L.; Scherer, G. Sodium sulfate heptahydrate i: The growth of single crystals. J. Cryst. Growth 2011, 329, 44–51. [Google Scholar] [CrossRef]
- Saidov, T.; Pel, L.; van der Heijden, G. Crystallization of sodium sulphate in porous media by drying at a constant temperature. Int. J. Heat Mass Transf. 2015, 83, 621–628. [Google Scholar] [CrossRef]
- Steiger, M.; Asmussen, S. Crystallization of sodium sulfate phases in porous materials: The phase diagram Na2SO4—H2O and the generation of stress. Geochim. Cosmochim. Acta 2008, 72, 4291–4306. [Google Scholar] [CrossRef]
- Ben Chaaban, S.; Chermiti, I.; Kreiter, S. Oligonychus afrasiaticus and phytoseiid predators seasonal occurence on date palm Phoenix dactylifera (Deglet Noor cultivar) in Tunisian oases. Bull. Insectol. 2011, 64, 15–21. [Google Scholar]
- Allen, R.; Pereira, L.S.; Raes, D.; Smith, M. Crop Evapotranspiration—Guidelines for Computing Crop Water Requirements; FAO Irrigation and Drainage Paper N°56; FAO: Rome, Italy, 1998. [Google Scholar]
- Wooding, R.A.; Scott, W.T.; White, I. Convection in groundwater below an evaporating salt lake: 1. Onset of instability. Water Resour. Res. 1997, 33, 1199–1217. [Google Scholar] [CrossRef]
- Geng, X.; Boufadel, M.C. Numerical modeling of water flow and salt transport in bare saline soil subjected to evaporation. J. Hydrol. 2015, 524, 427–438. [Google Scholar] [CrossRef]
- Geng, X.; Boufadel, M.C. The influence of evaporation and rainfall on supratidal groundwater dynamics and salinity structure in a sandy beach. Water Resour. Res. 2017, 53, 6218–6238. [Google Scholar] [CrossRef]
- Jambhekar, V.A.; Mejri, E.; Schröder, N.; Helmig, R.; Shokri, N. Kinetic approach to model reactive transport and mixed salt precipitation in a coupled free-flow-porous-media system. Transp. Porous Media 2016, 114, 341–369. [Google Scholar] [CrossRef]
© 2020 by the authors. Licensee MDPI, Basel, Switzerland. This article is an open access article distributed under the terms and conditions of the Creative Commons Attribution (CC BY) license (http://creativecommons.org/licenses/by/4.0/).