Impacts of Triple Factors on Flash Flood Vulnerability in Egypt: Urban Growth, Extreme Climate, and Mismanagement


Abstract
1. Introduction
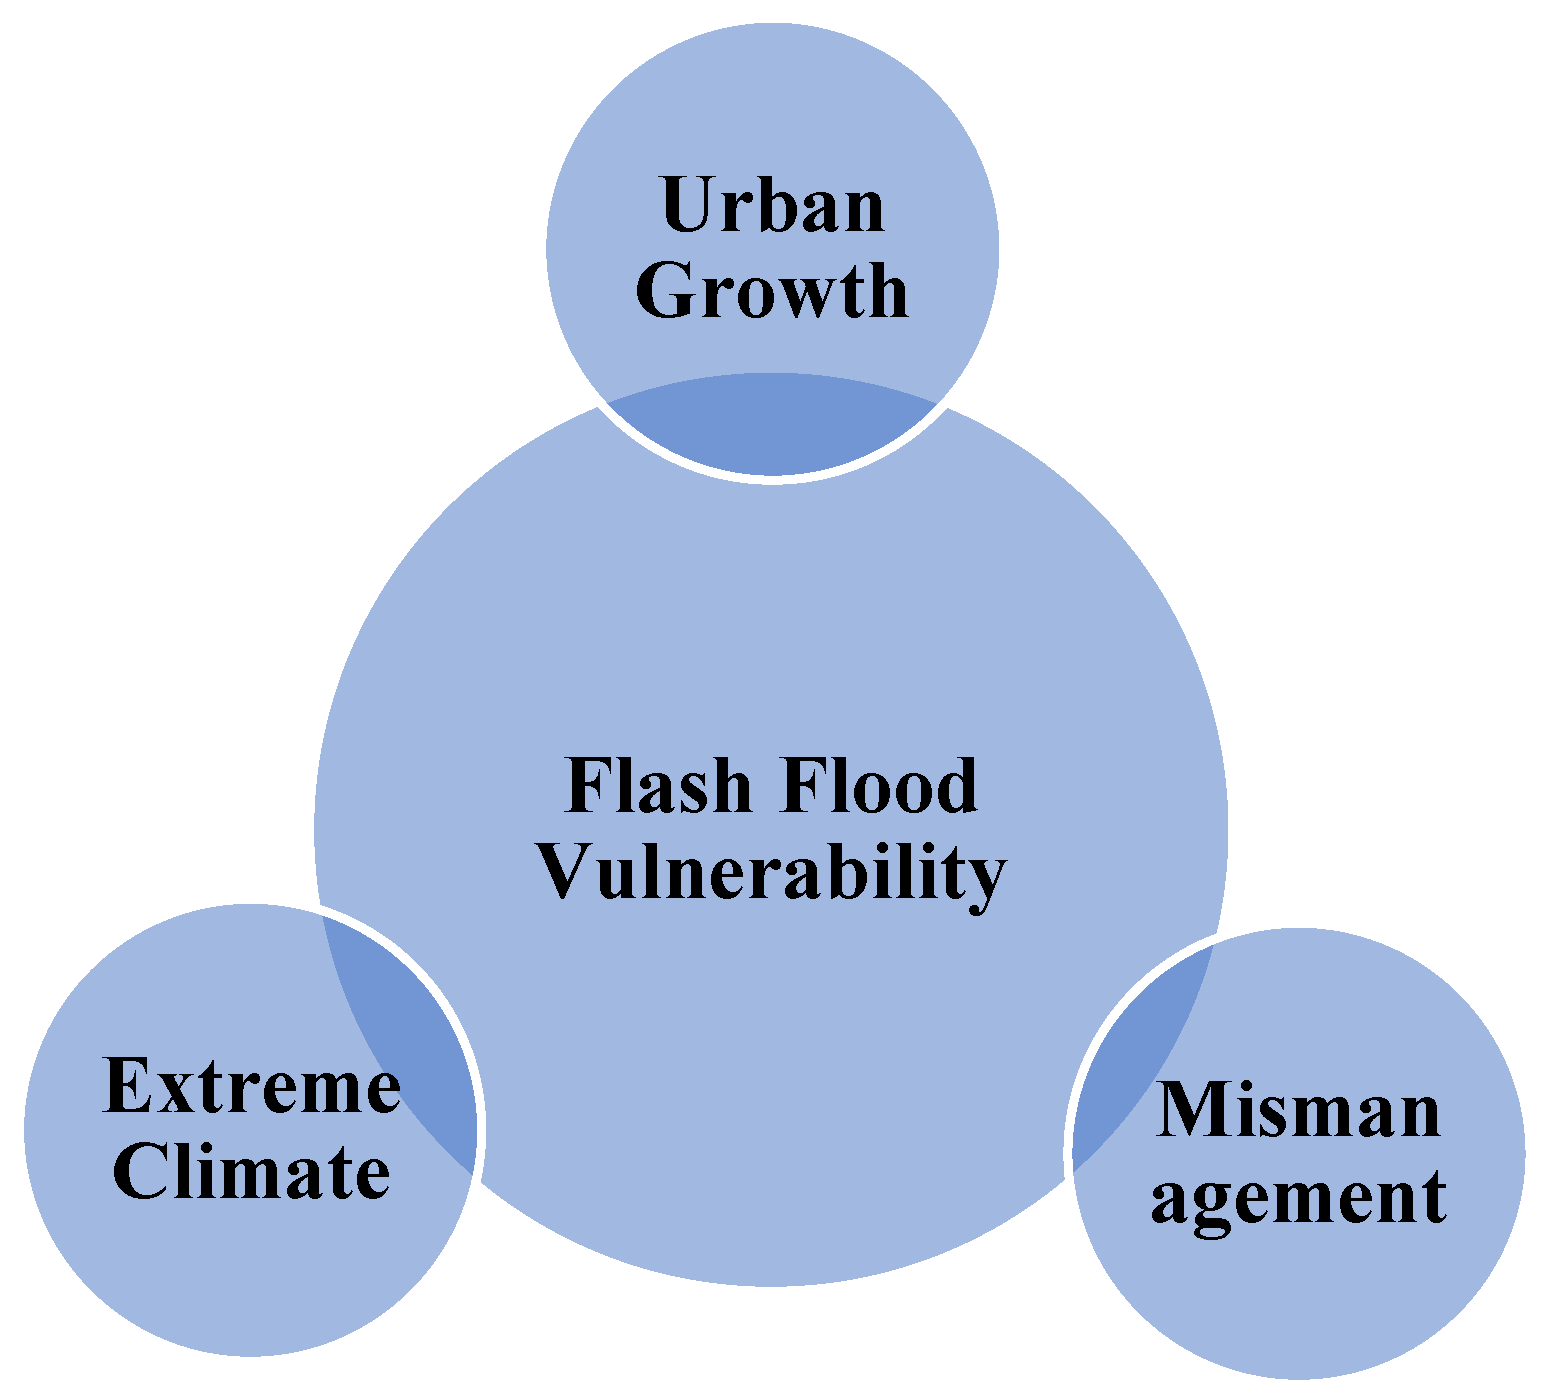
2. Motivation and Rationale for the Study
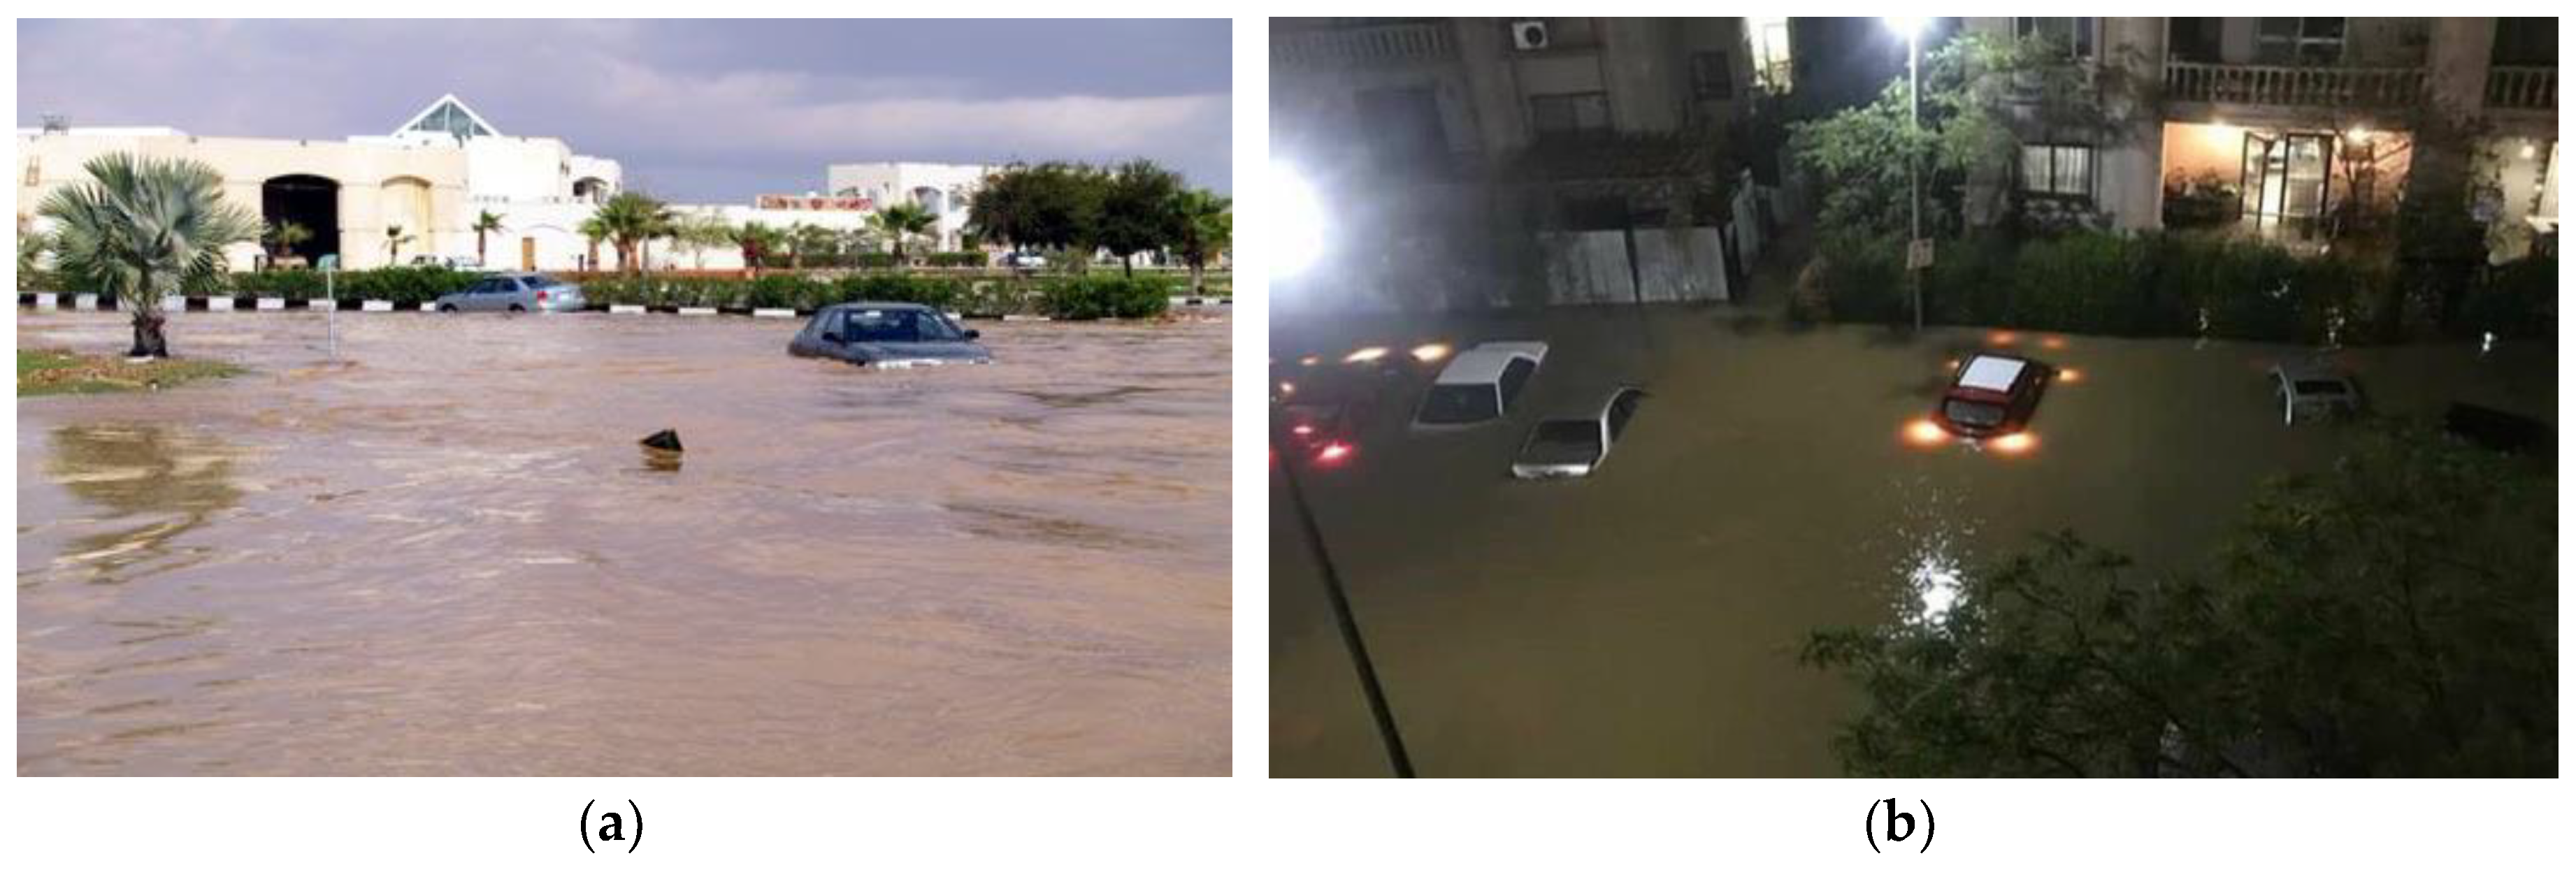
2.1. Extreme Climate and Flash Flood Disasters
2.2. Urban Growth
2.3. Mismanagement
- Lack of specialized cadres in the central administration for the climate;
- Lack of an effective coordination mechanism ensuring the engagement of all relevant stakeholders;
- Weak participation of the civil society and the private sector;
- Lack of administrations, in many organizations, that specialize in climate changes, which leads to a lack of integration of environmental dimensions, especially in regard to climate change, into the country’s socioeconomic development plans;
- Lack of a national climate change mitigation and adaptation strategy;
- Inflexibility of legislative and administrative frameworks and weakness of funding frameworks;
- No optimum use of scientific research and technology capabilities;
- Lack of a mechanism to put into action creative and innovative ideas in the field of climate change;
- Lack of a database encompassing information on activities, researches, and studies conducted in the field of climate change and lack of a network responsible for monitoring climate change information;
- Lack of awareness and training activities targeting employees working in the field of climate change;
- Lack of societal and professional awareness about dealing with disasters, which requires more awareness programs on the importance of adherence to behaviors and regulations during a disaster to reduce overcrowding and stampedes, and adherence to planned out paths, which reduces the loss of life and property;
- Limited collaboration between the research institutes, private sectors, and governmental sectors lead to an increase in the severity of disasters;
- Lack of clear guidelines for urban planning, as well as scarcity of well-planned cities by the local government.
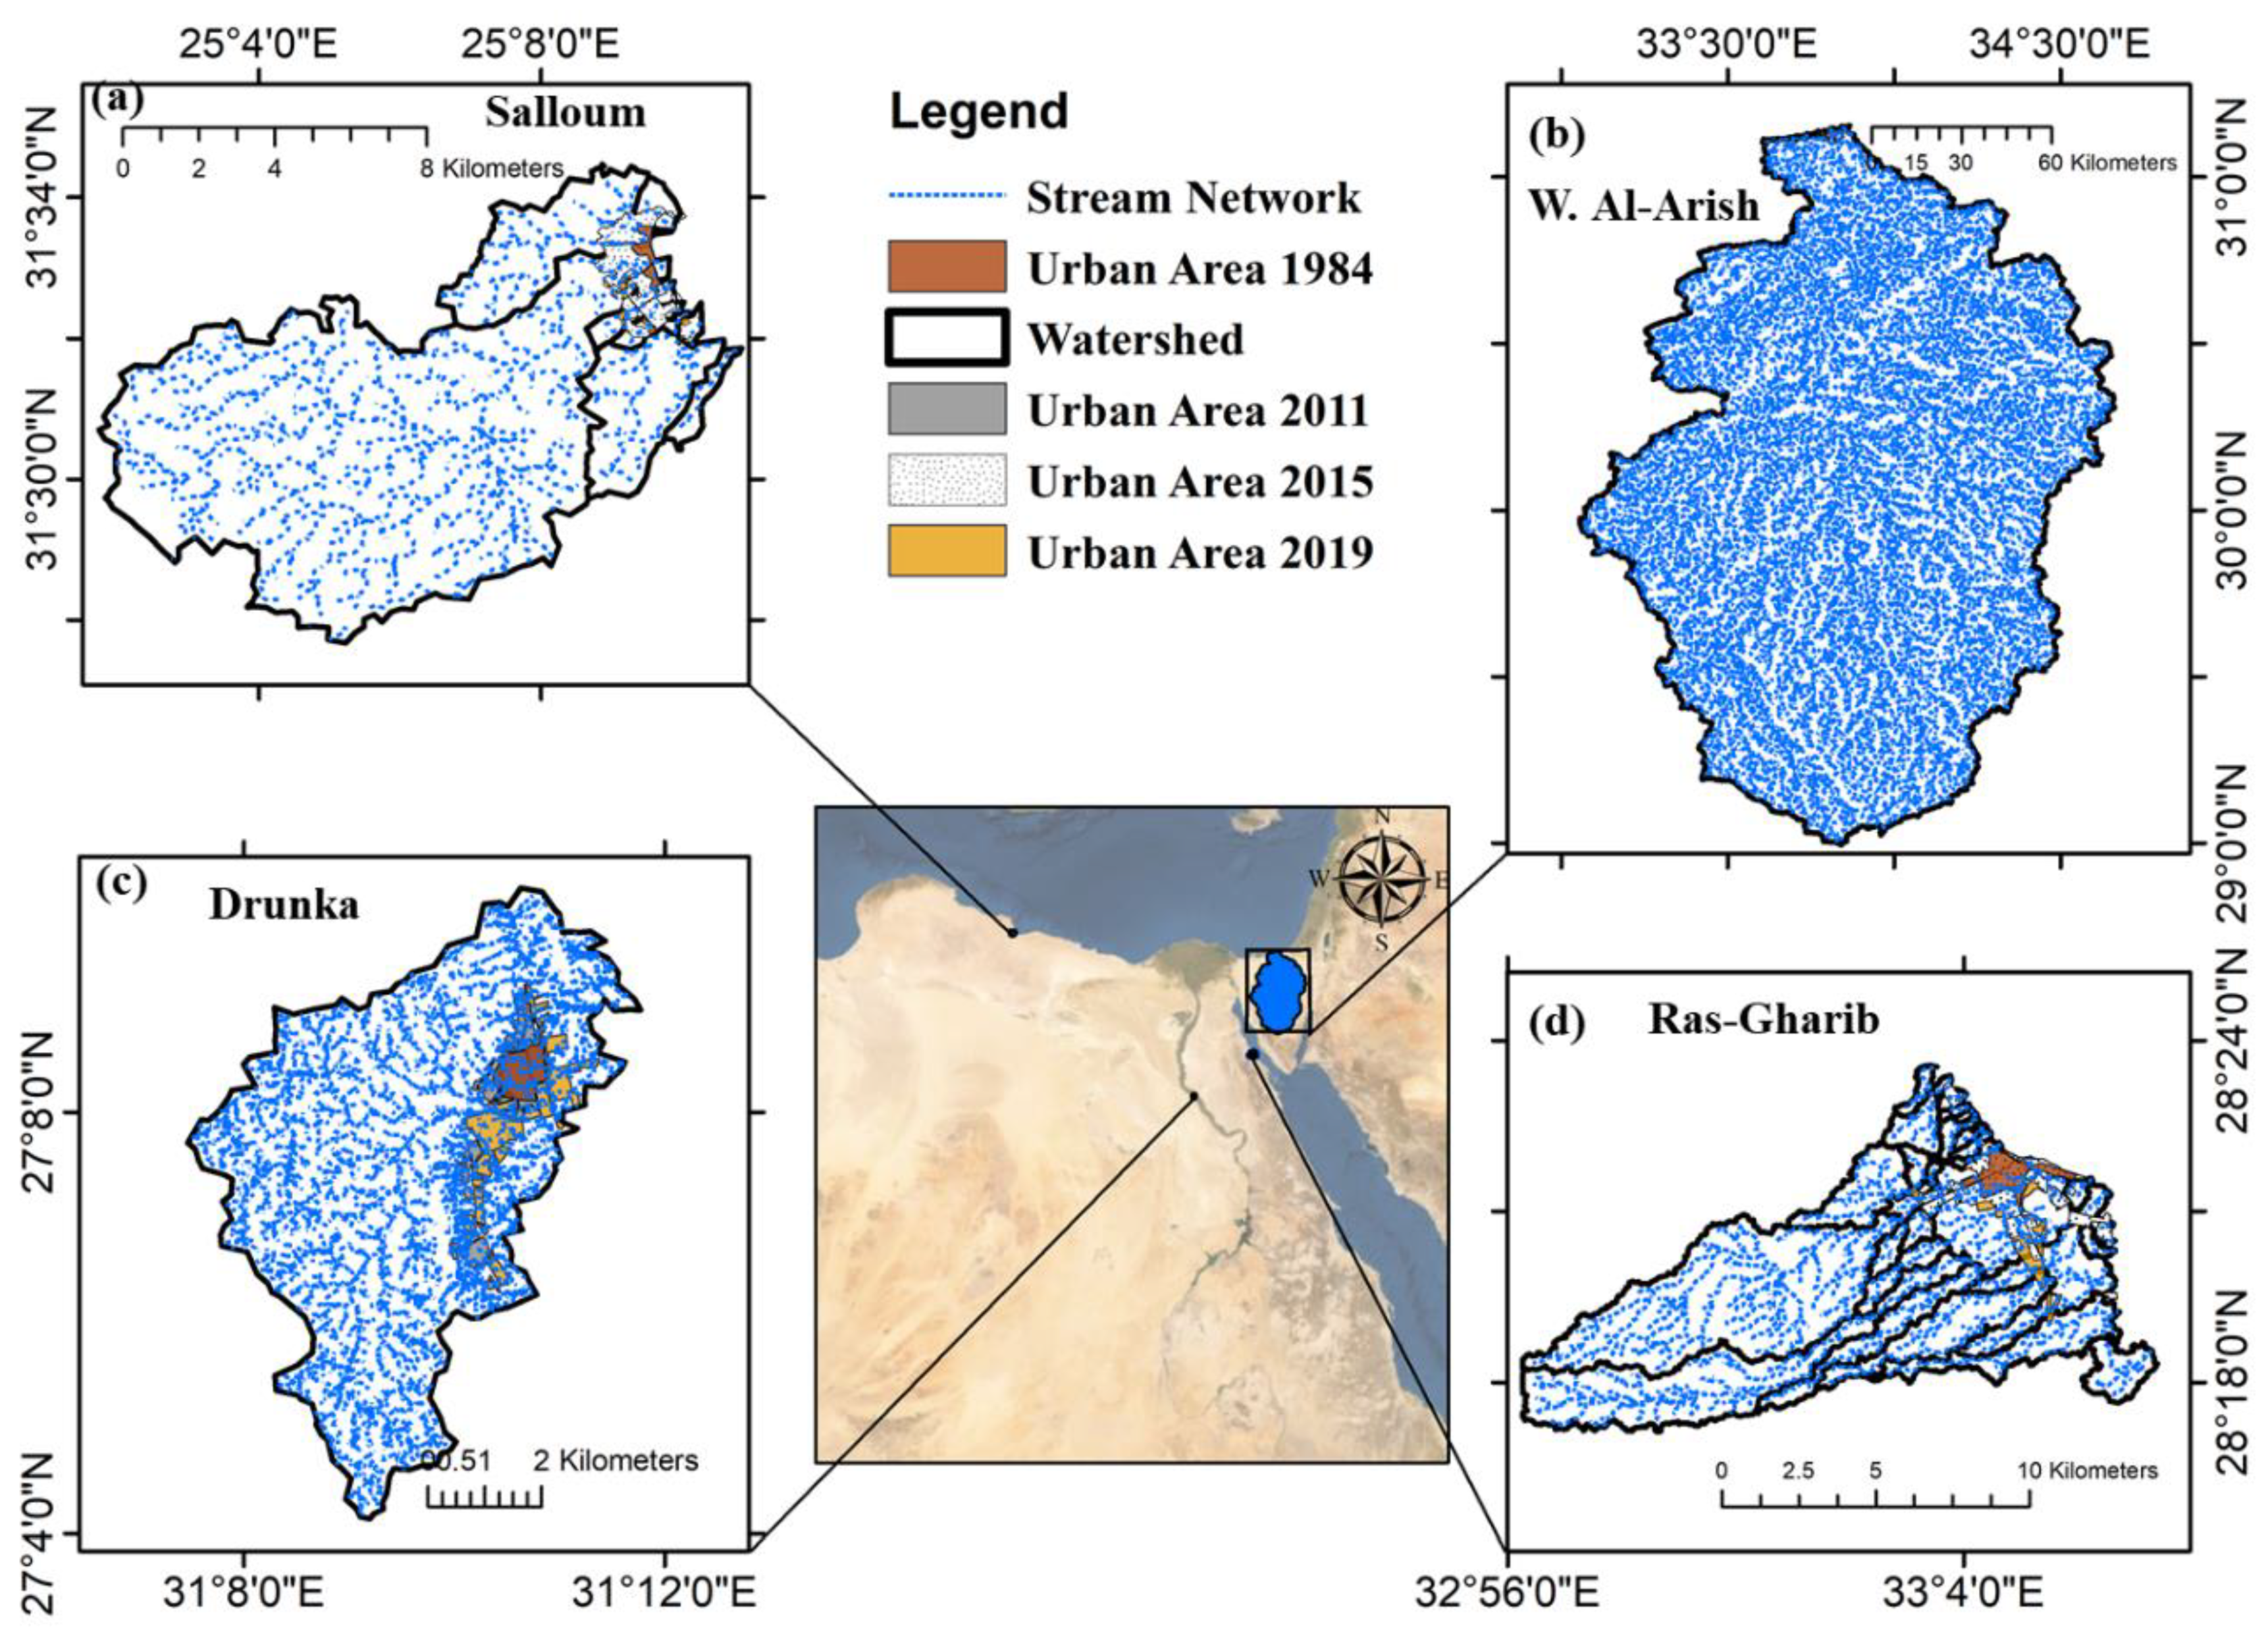
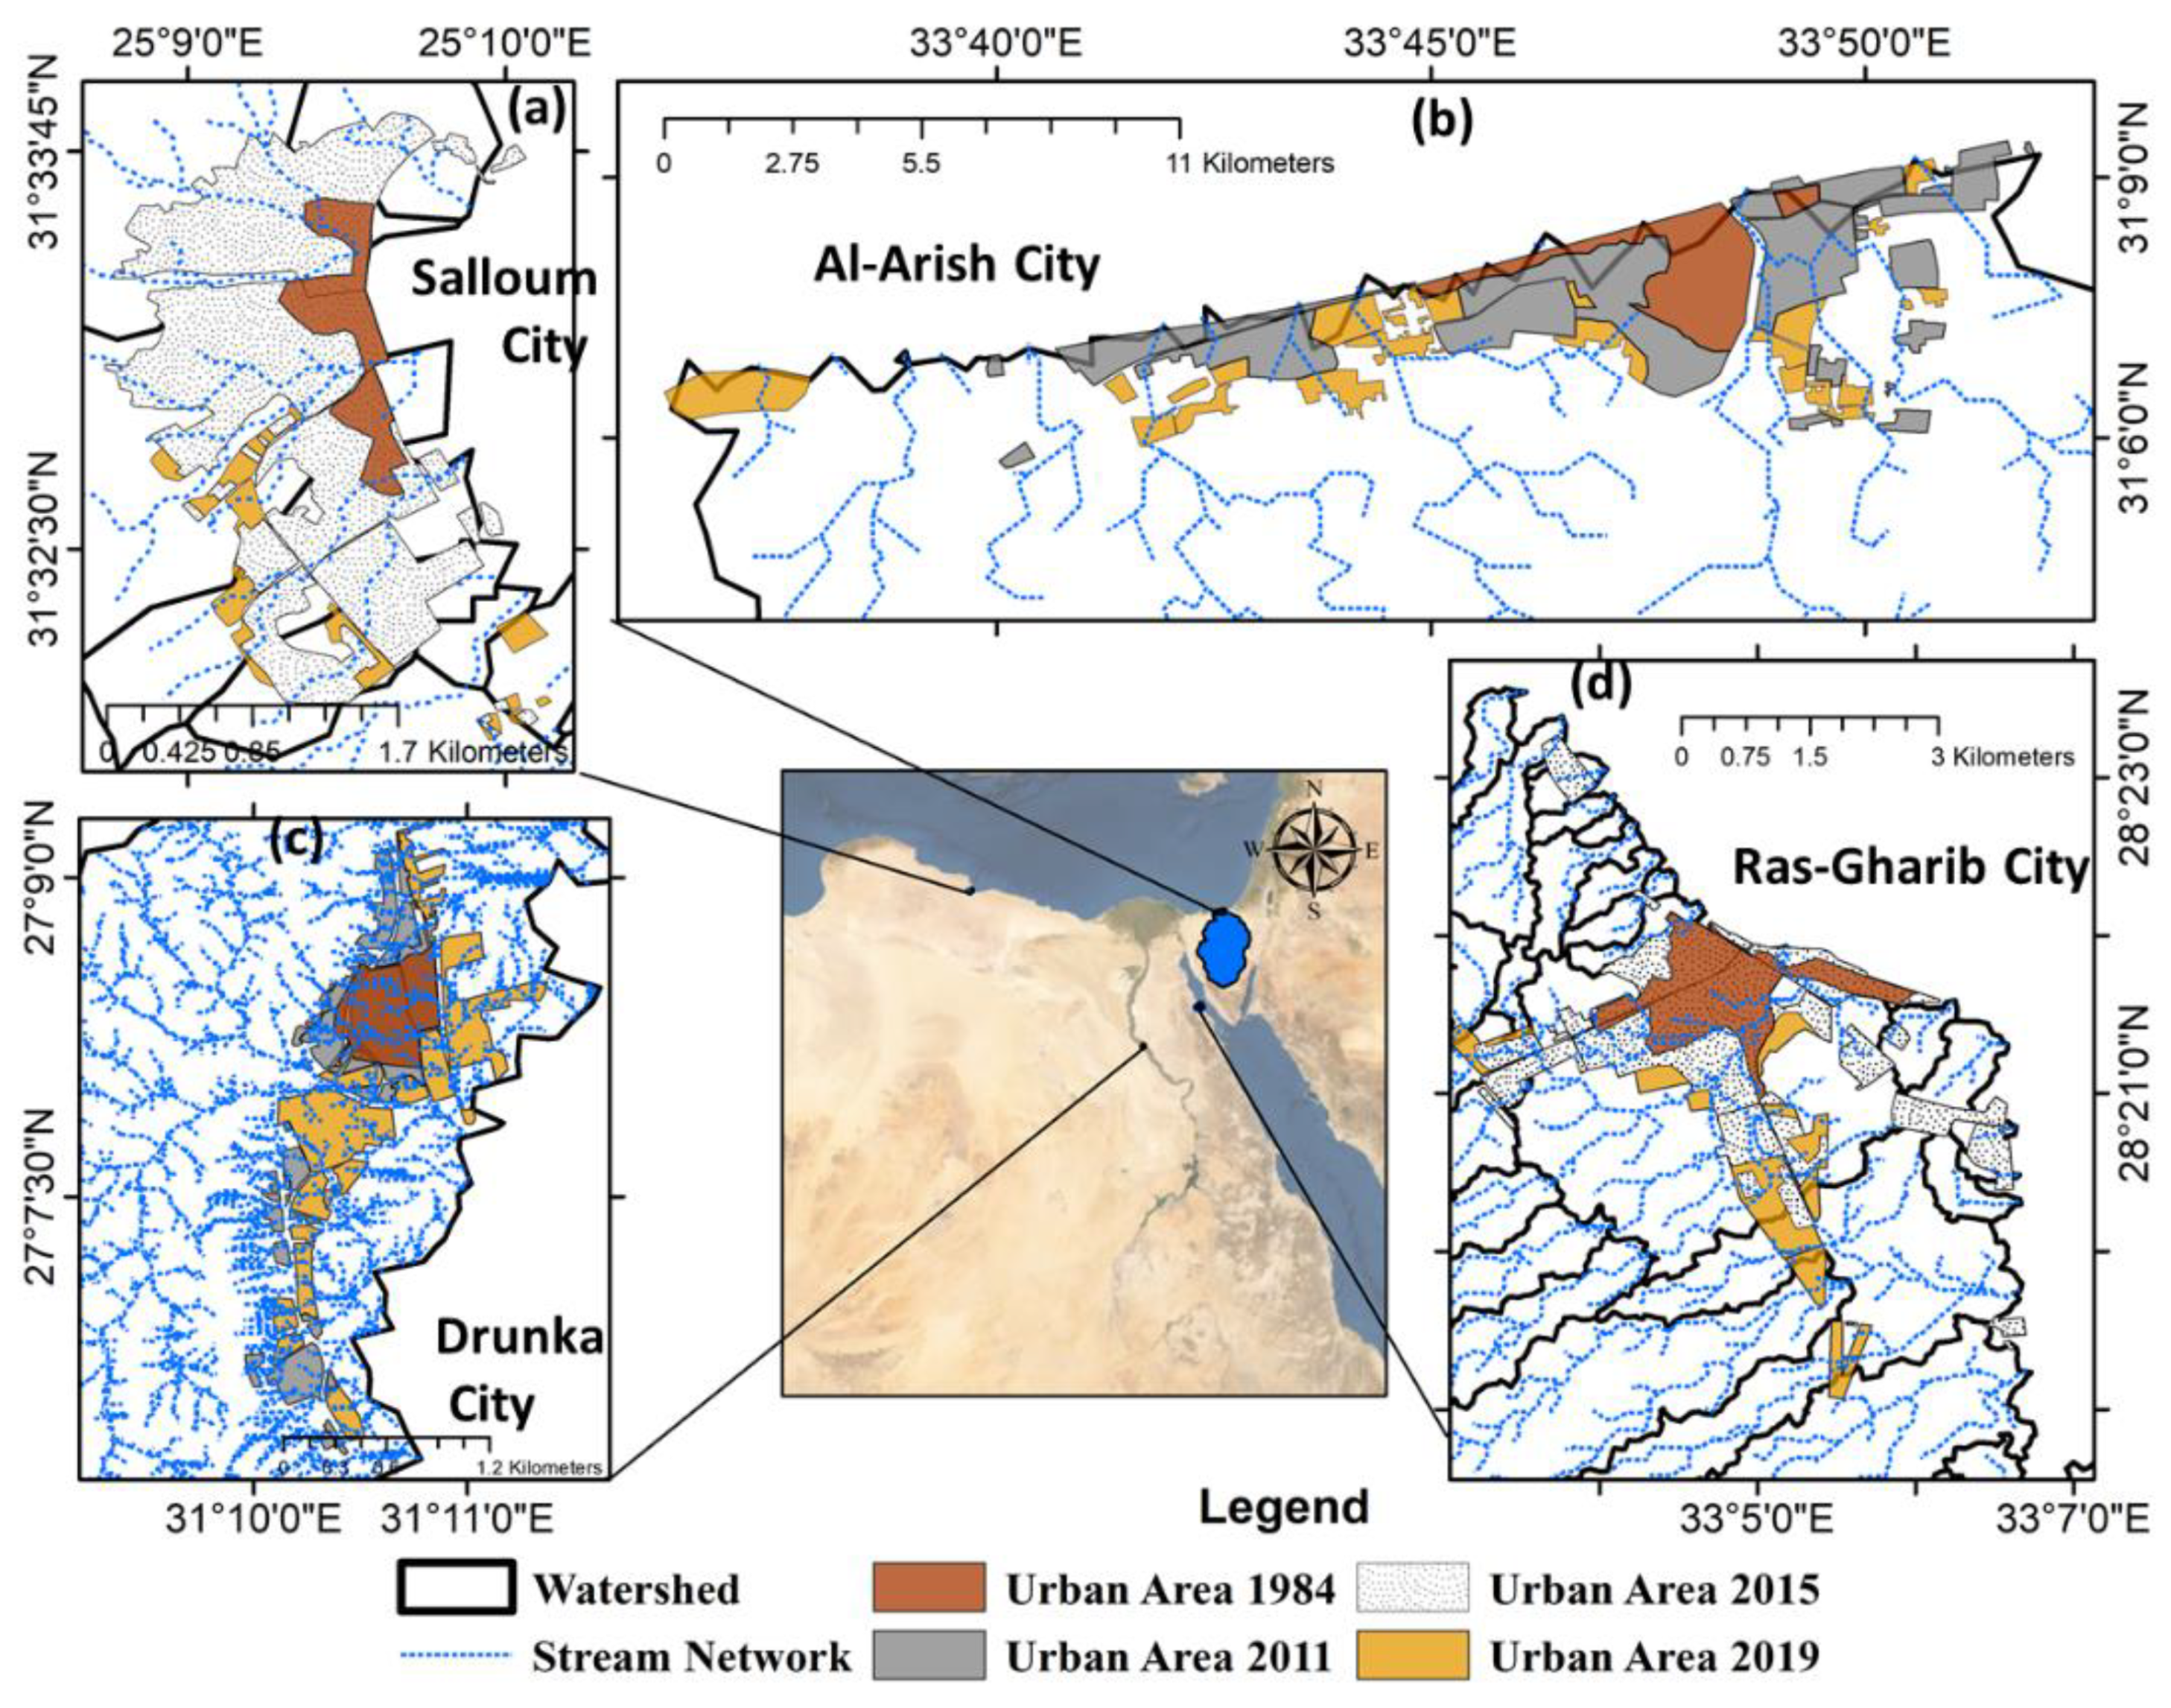
3. Study Area
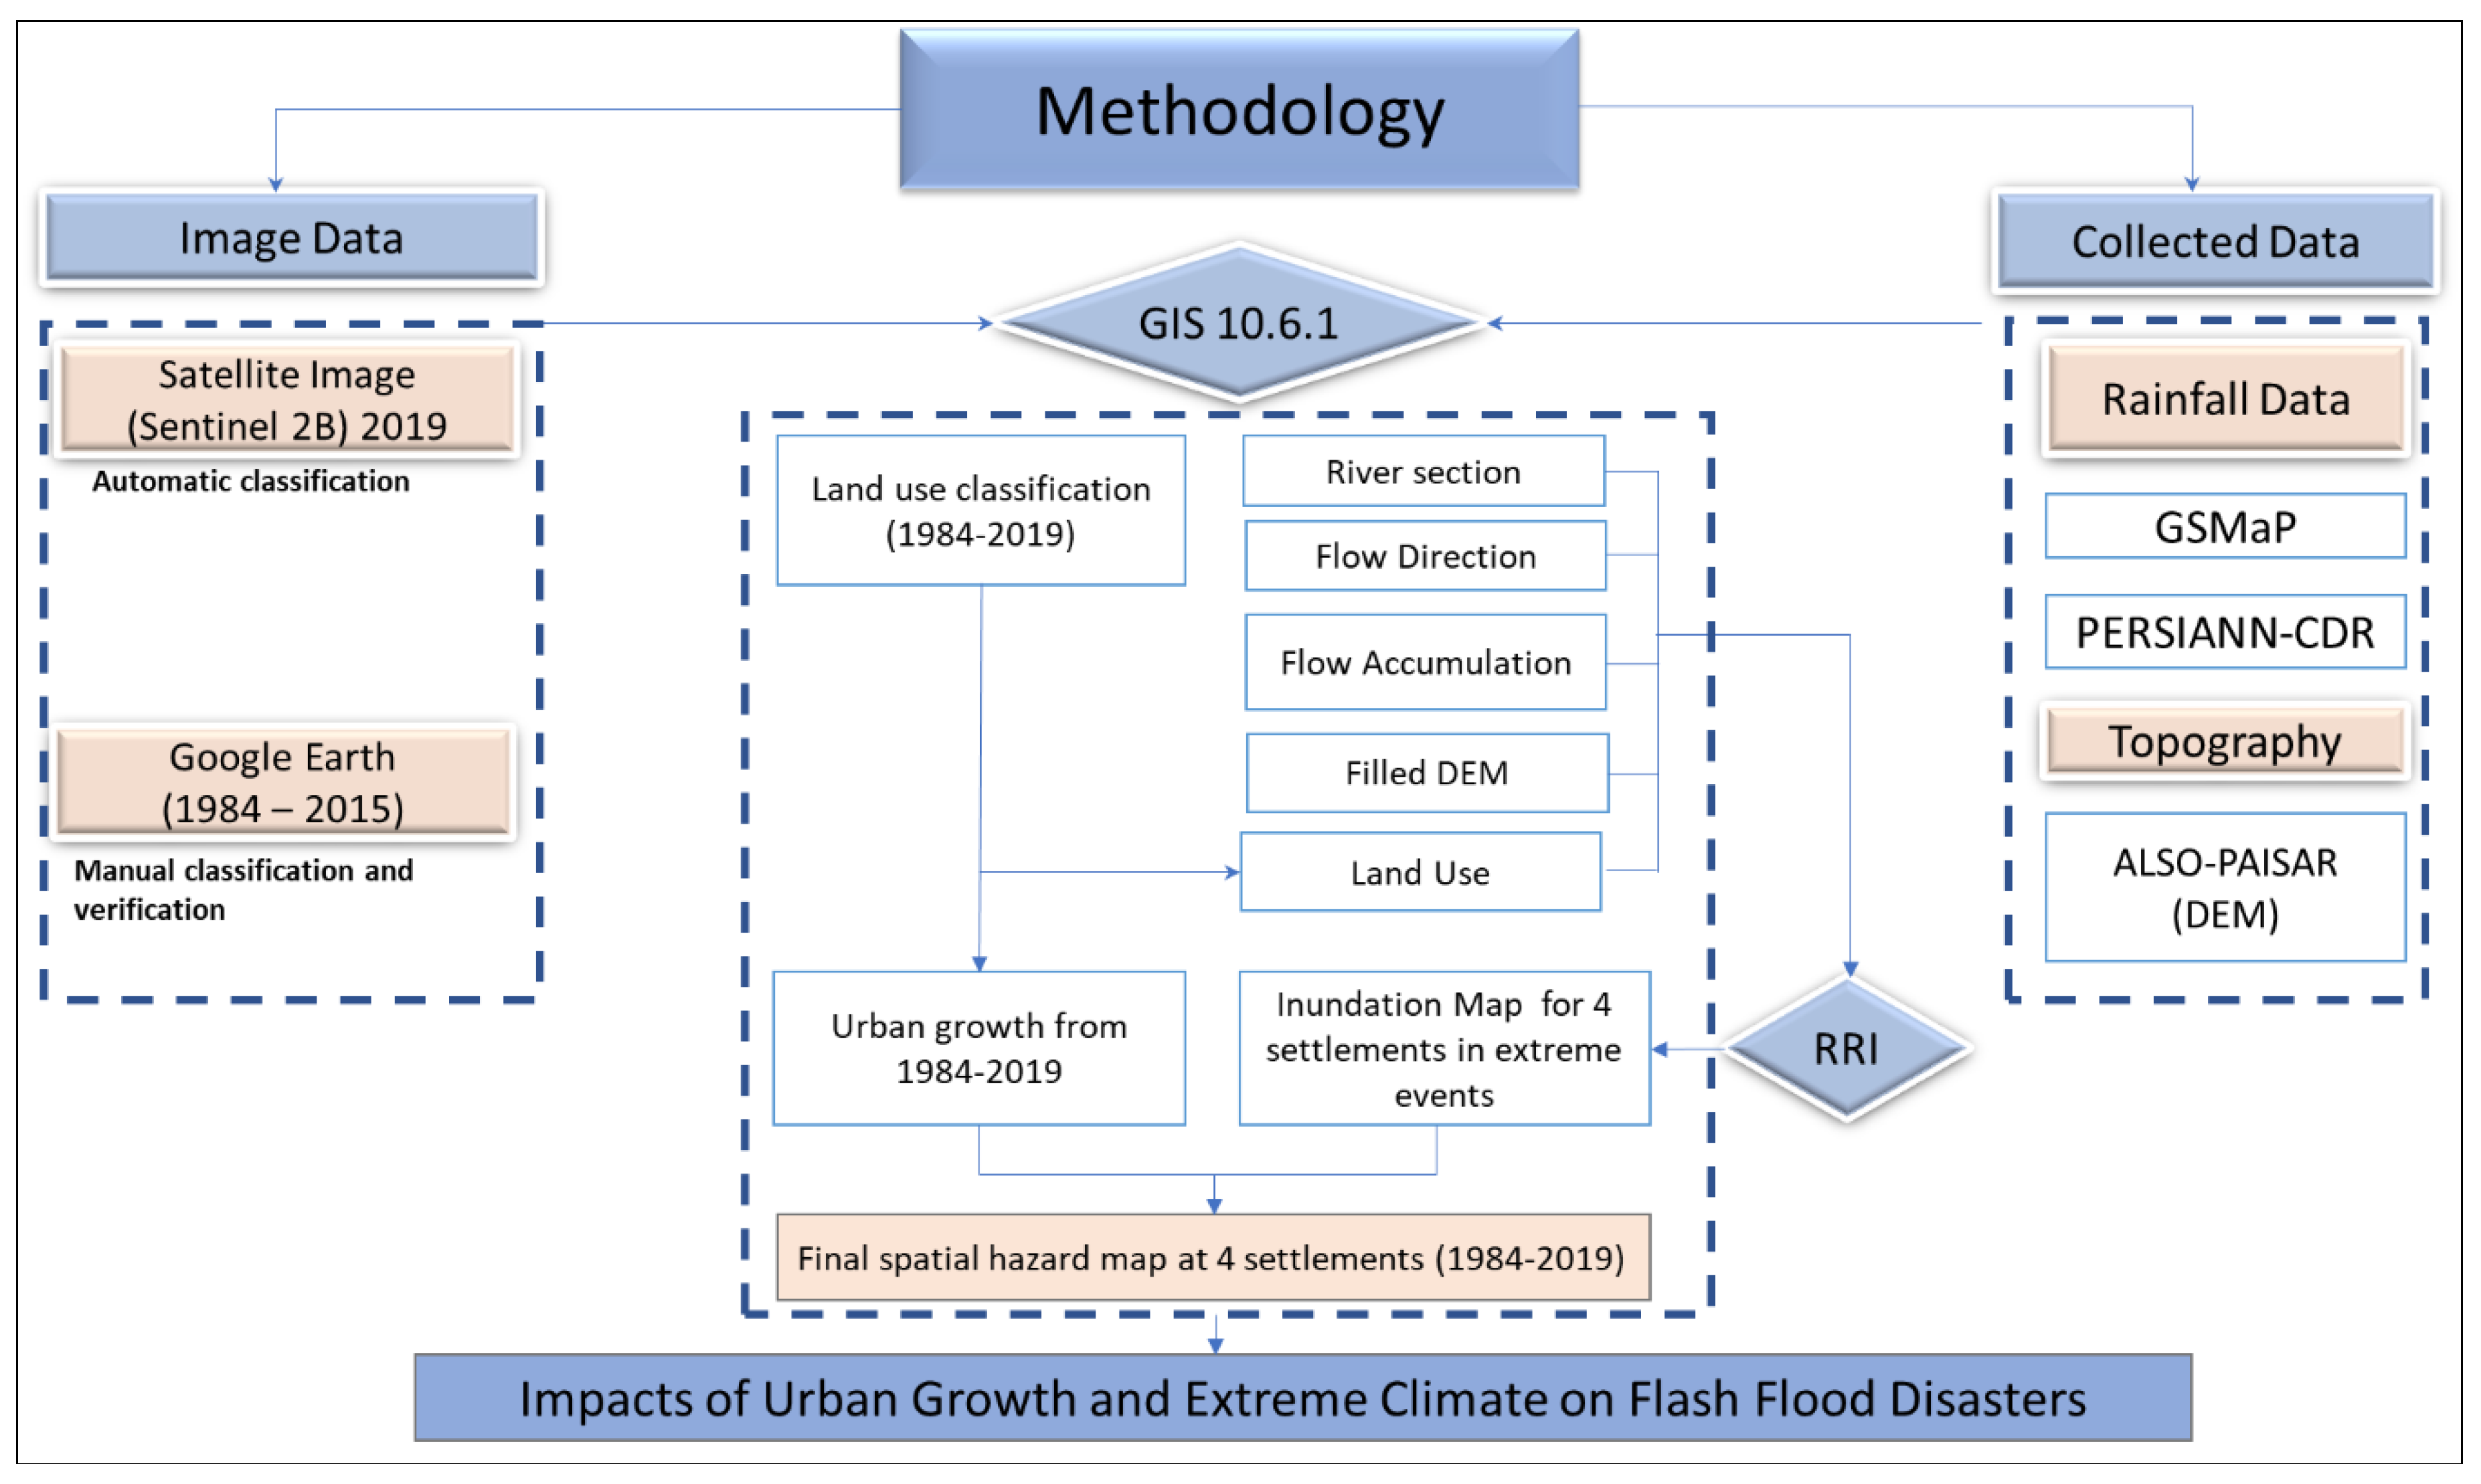
4. Data and Methodology
4.1. Urban Growth Mapping
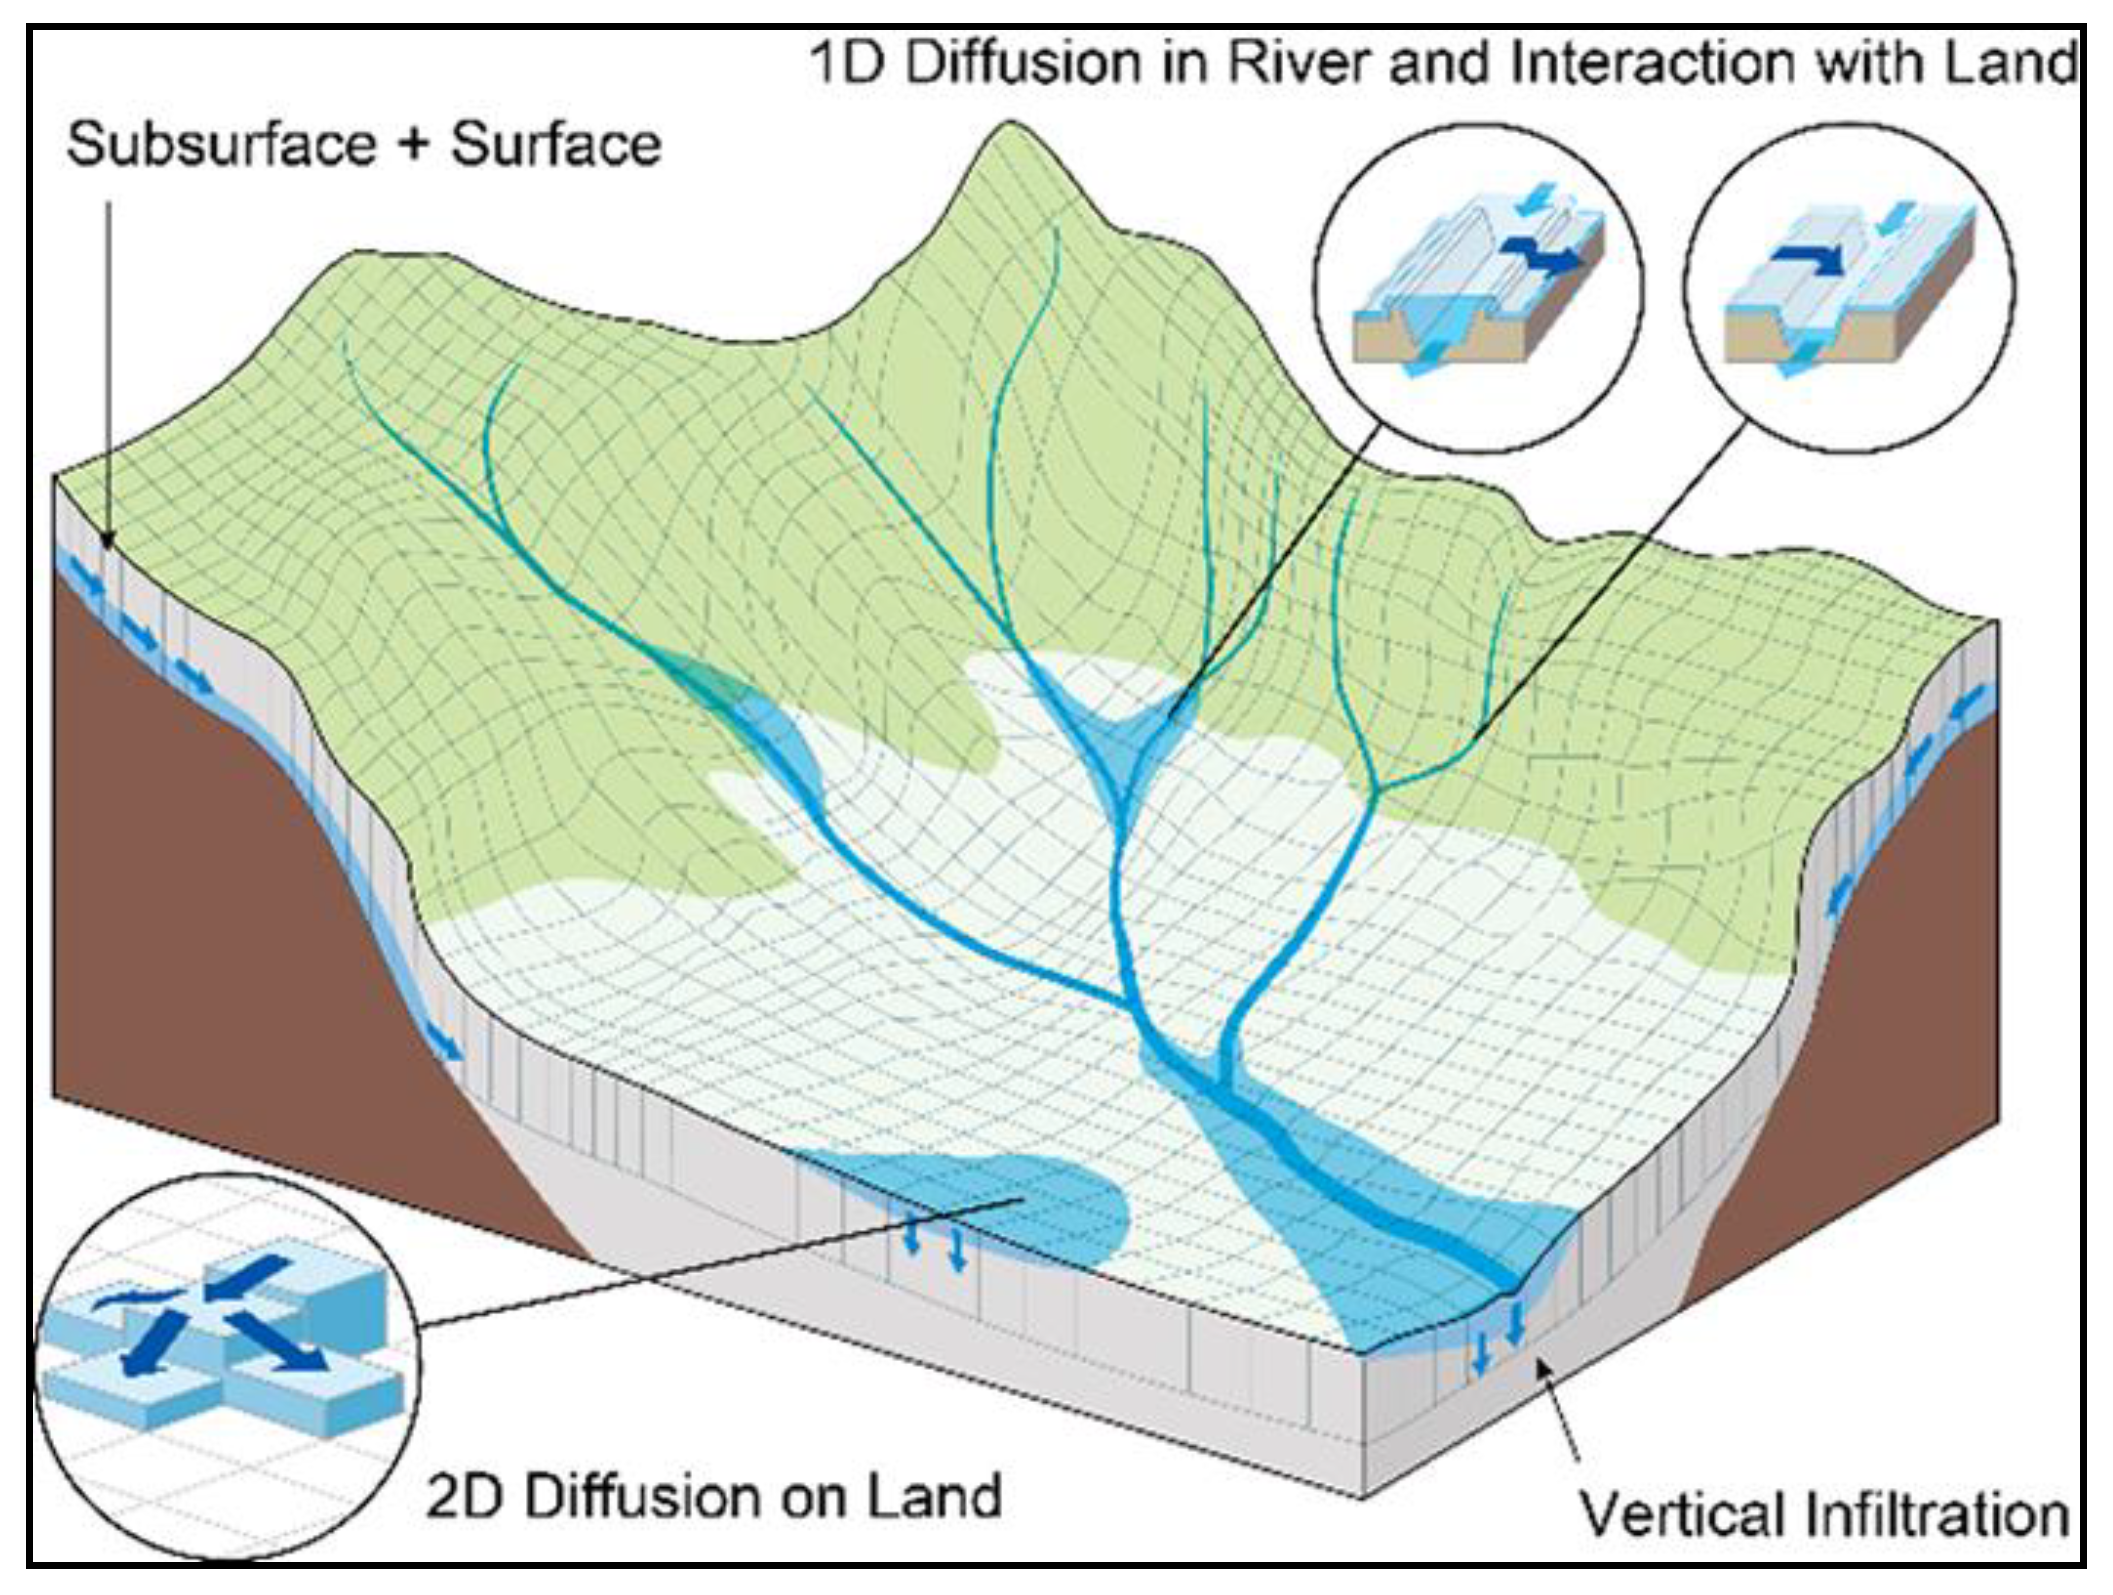
4.2. Rainfall-Runoff-Inundation Model
5. Results and Discussions
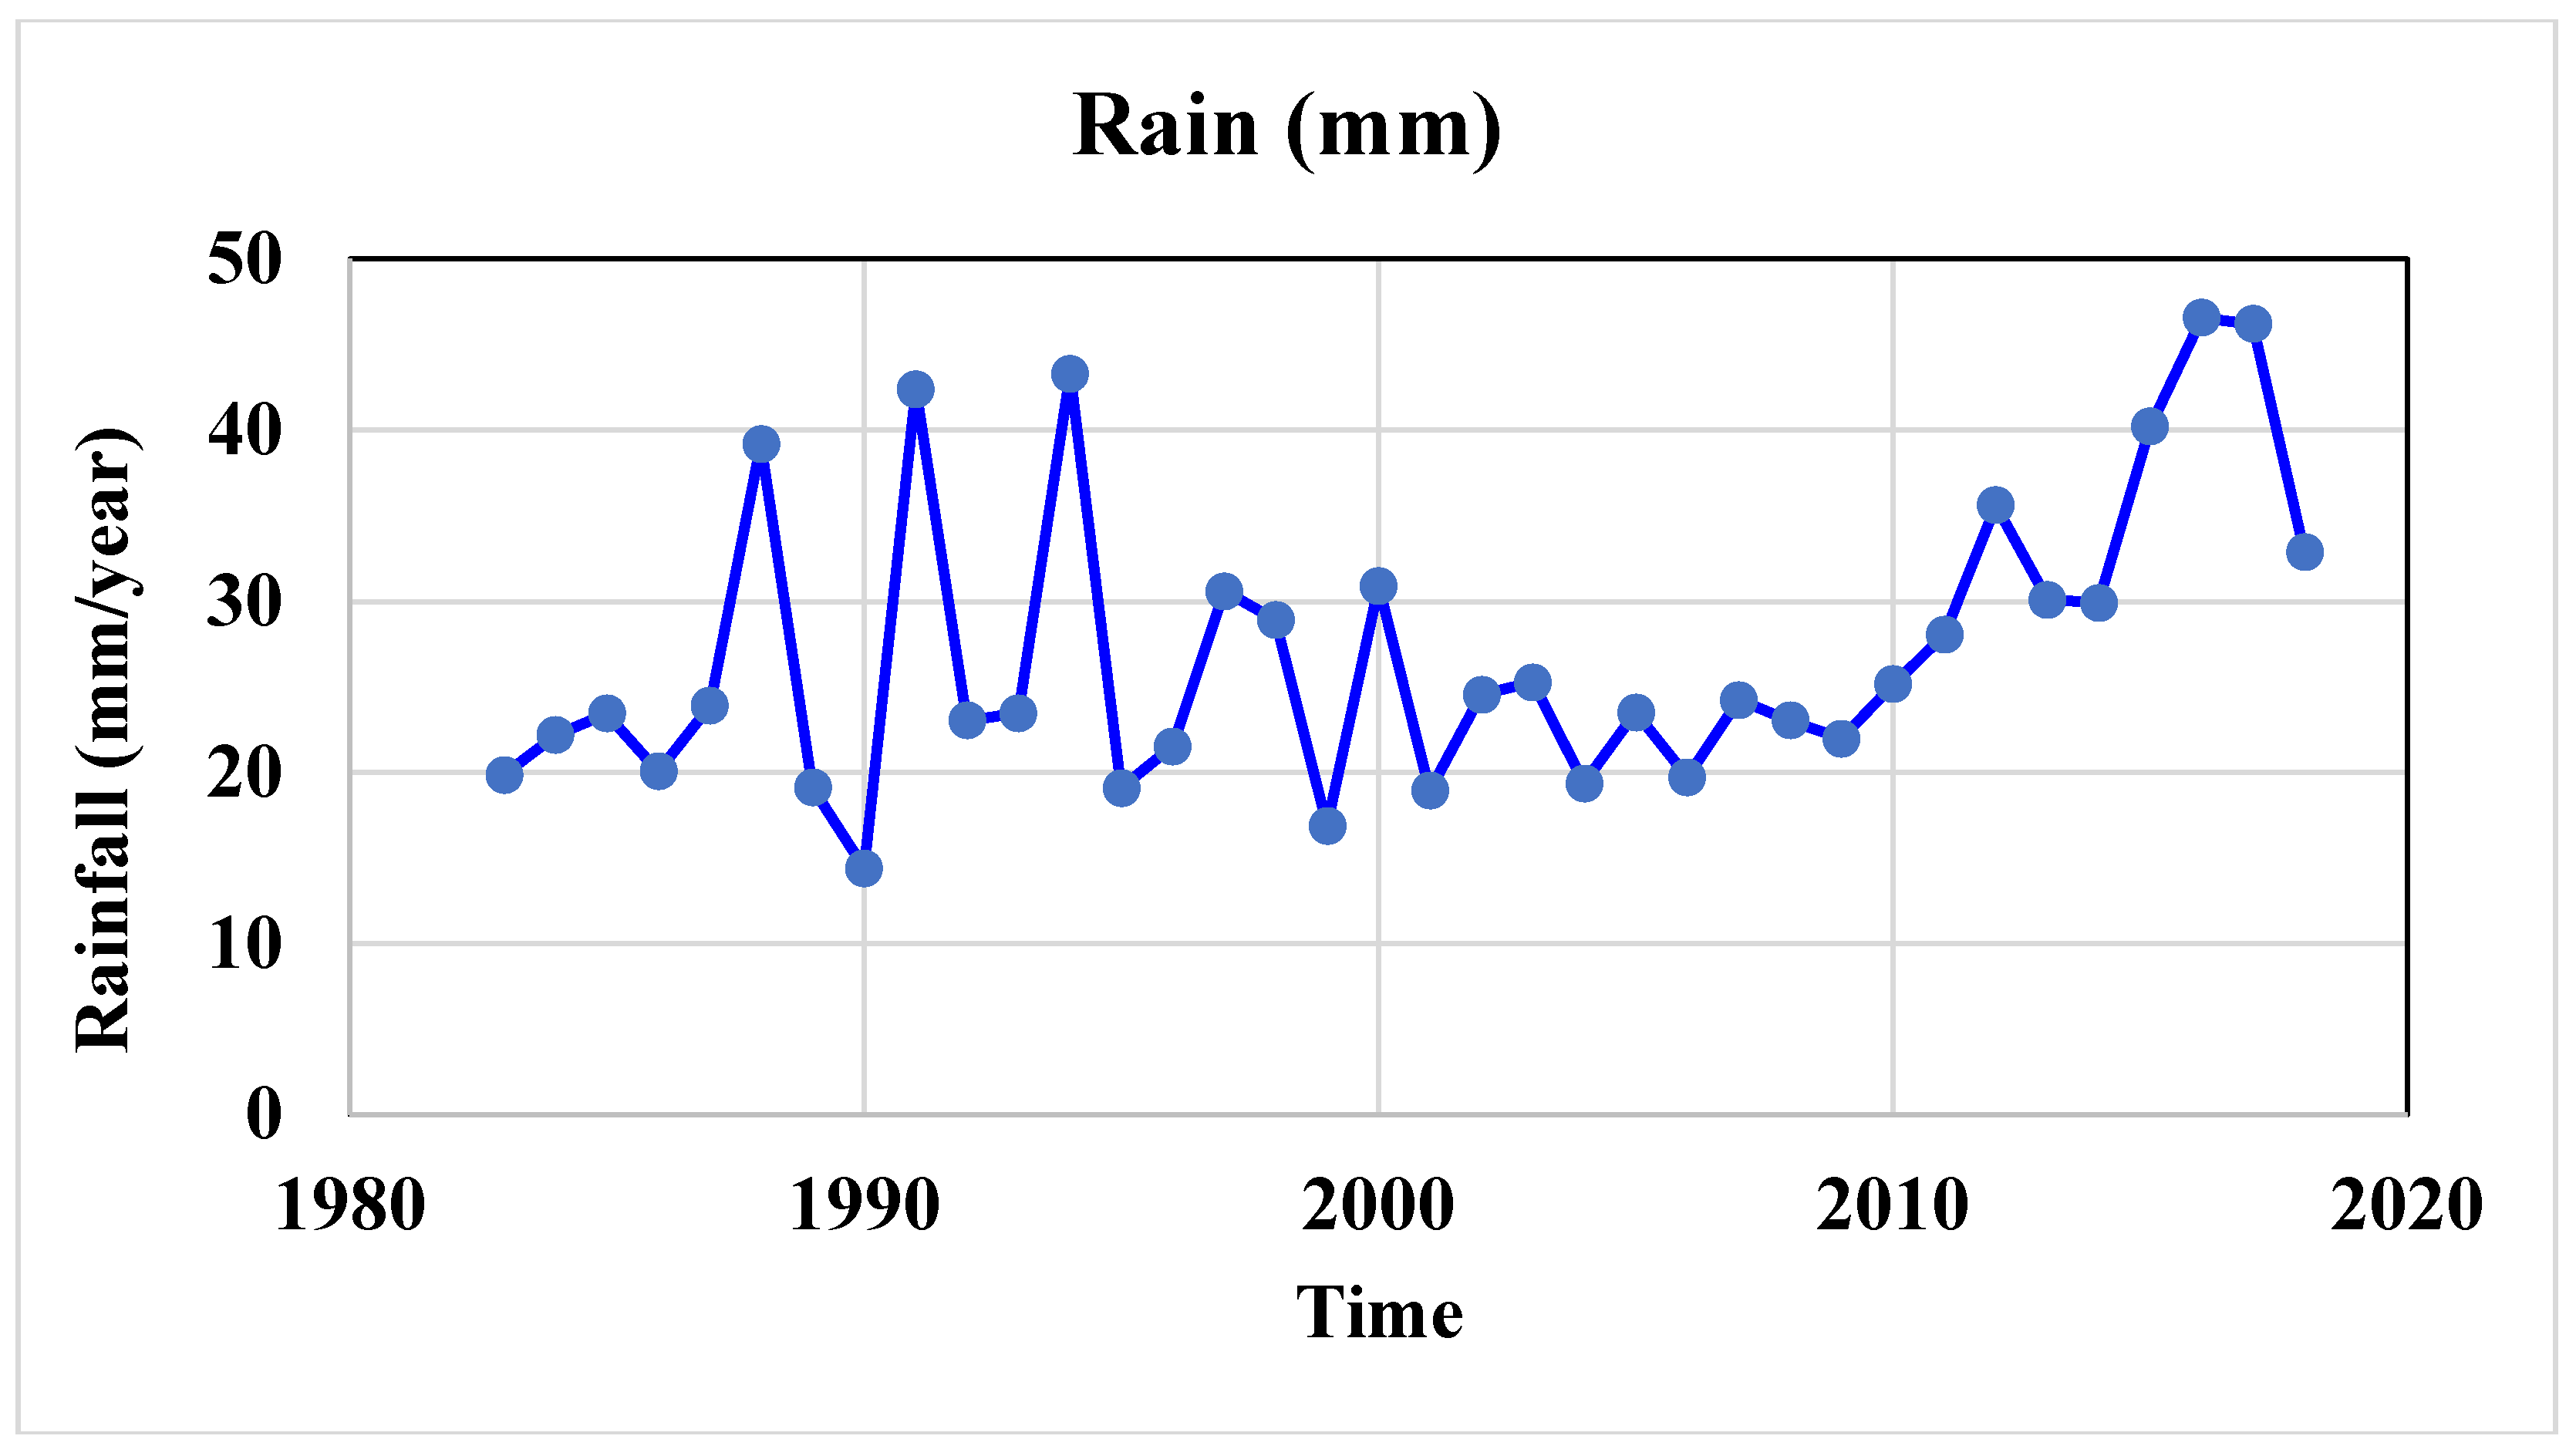
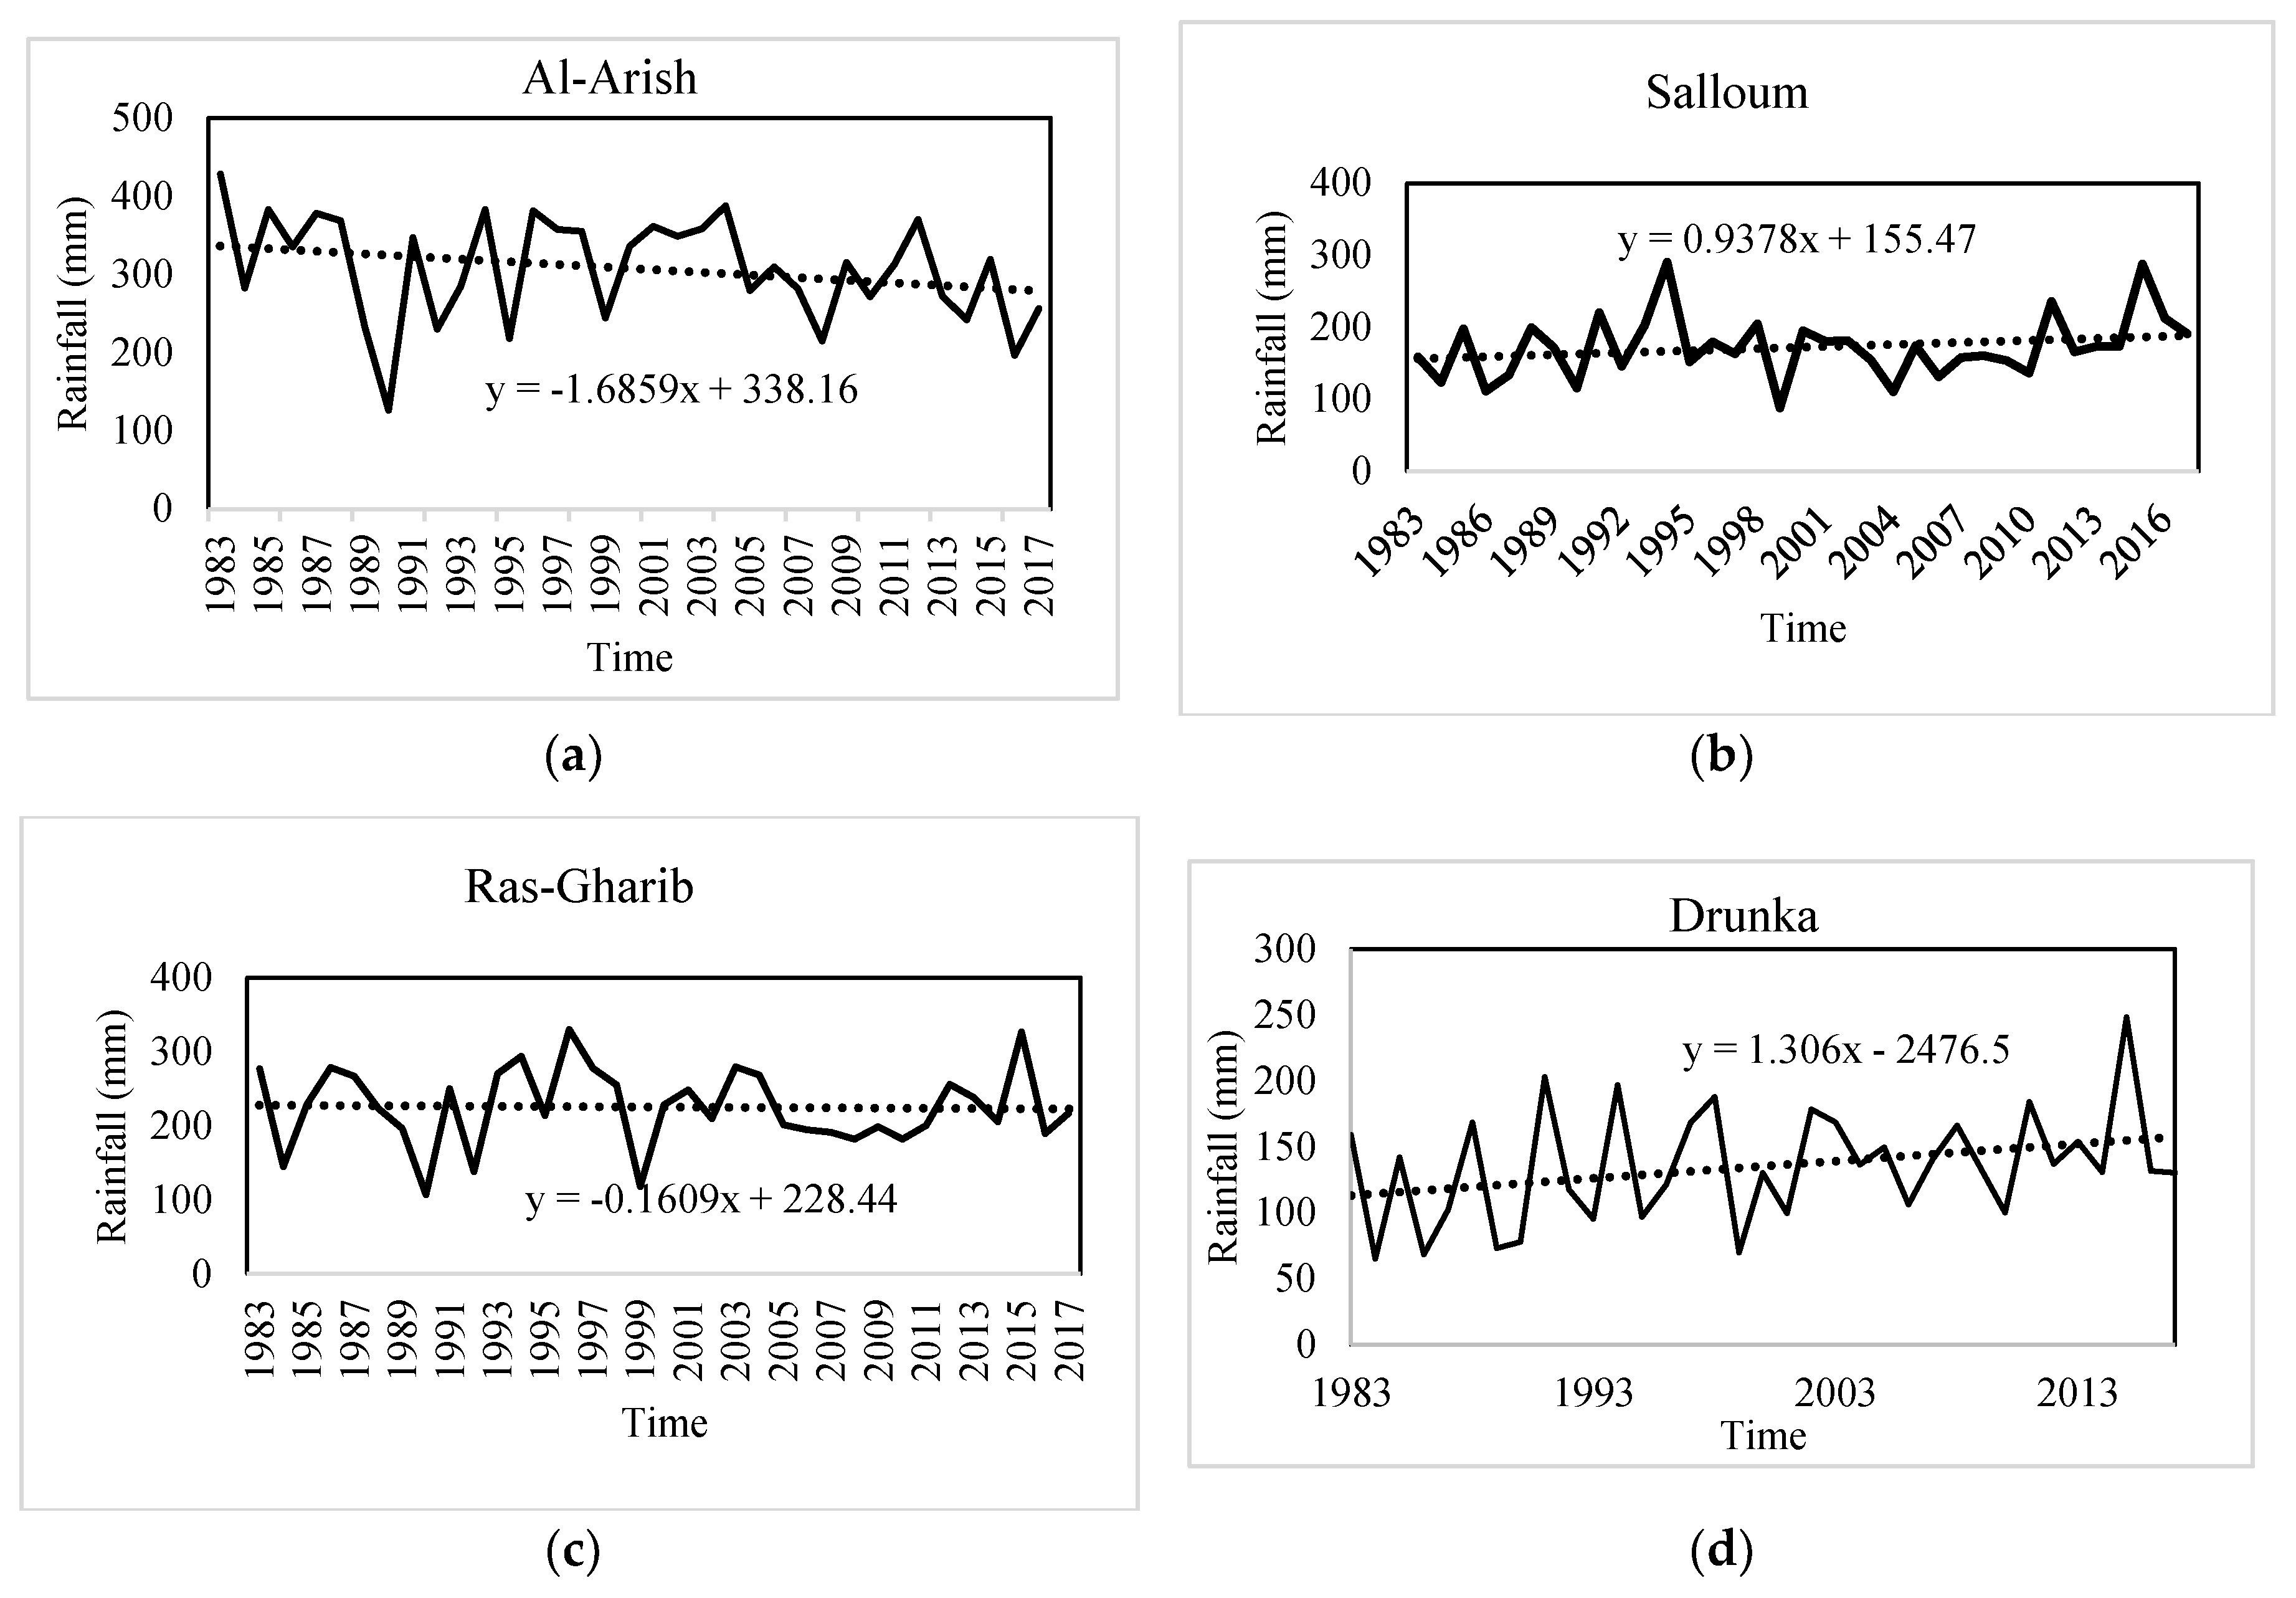
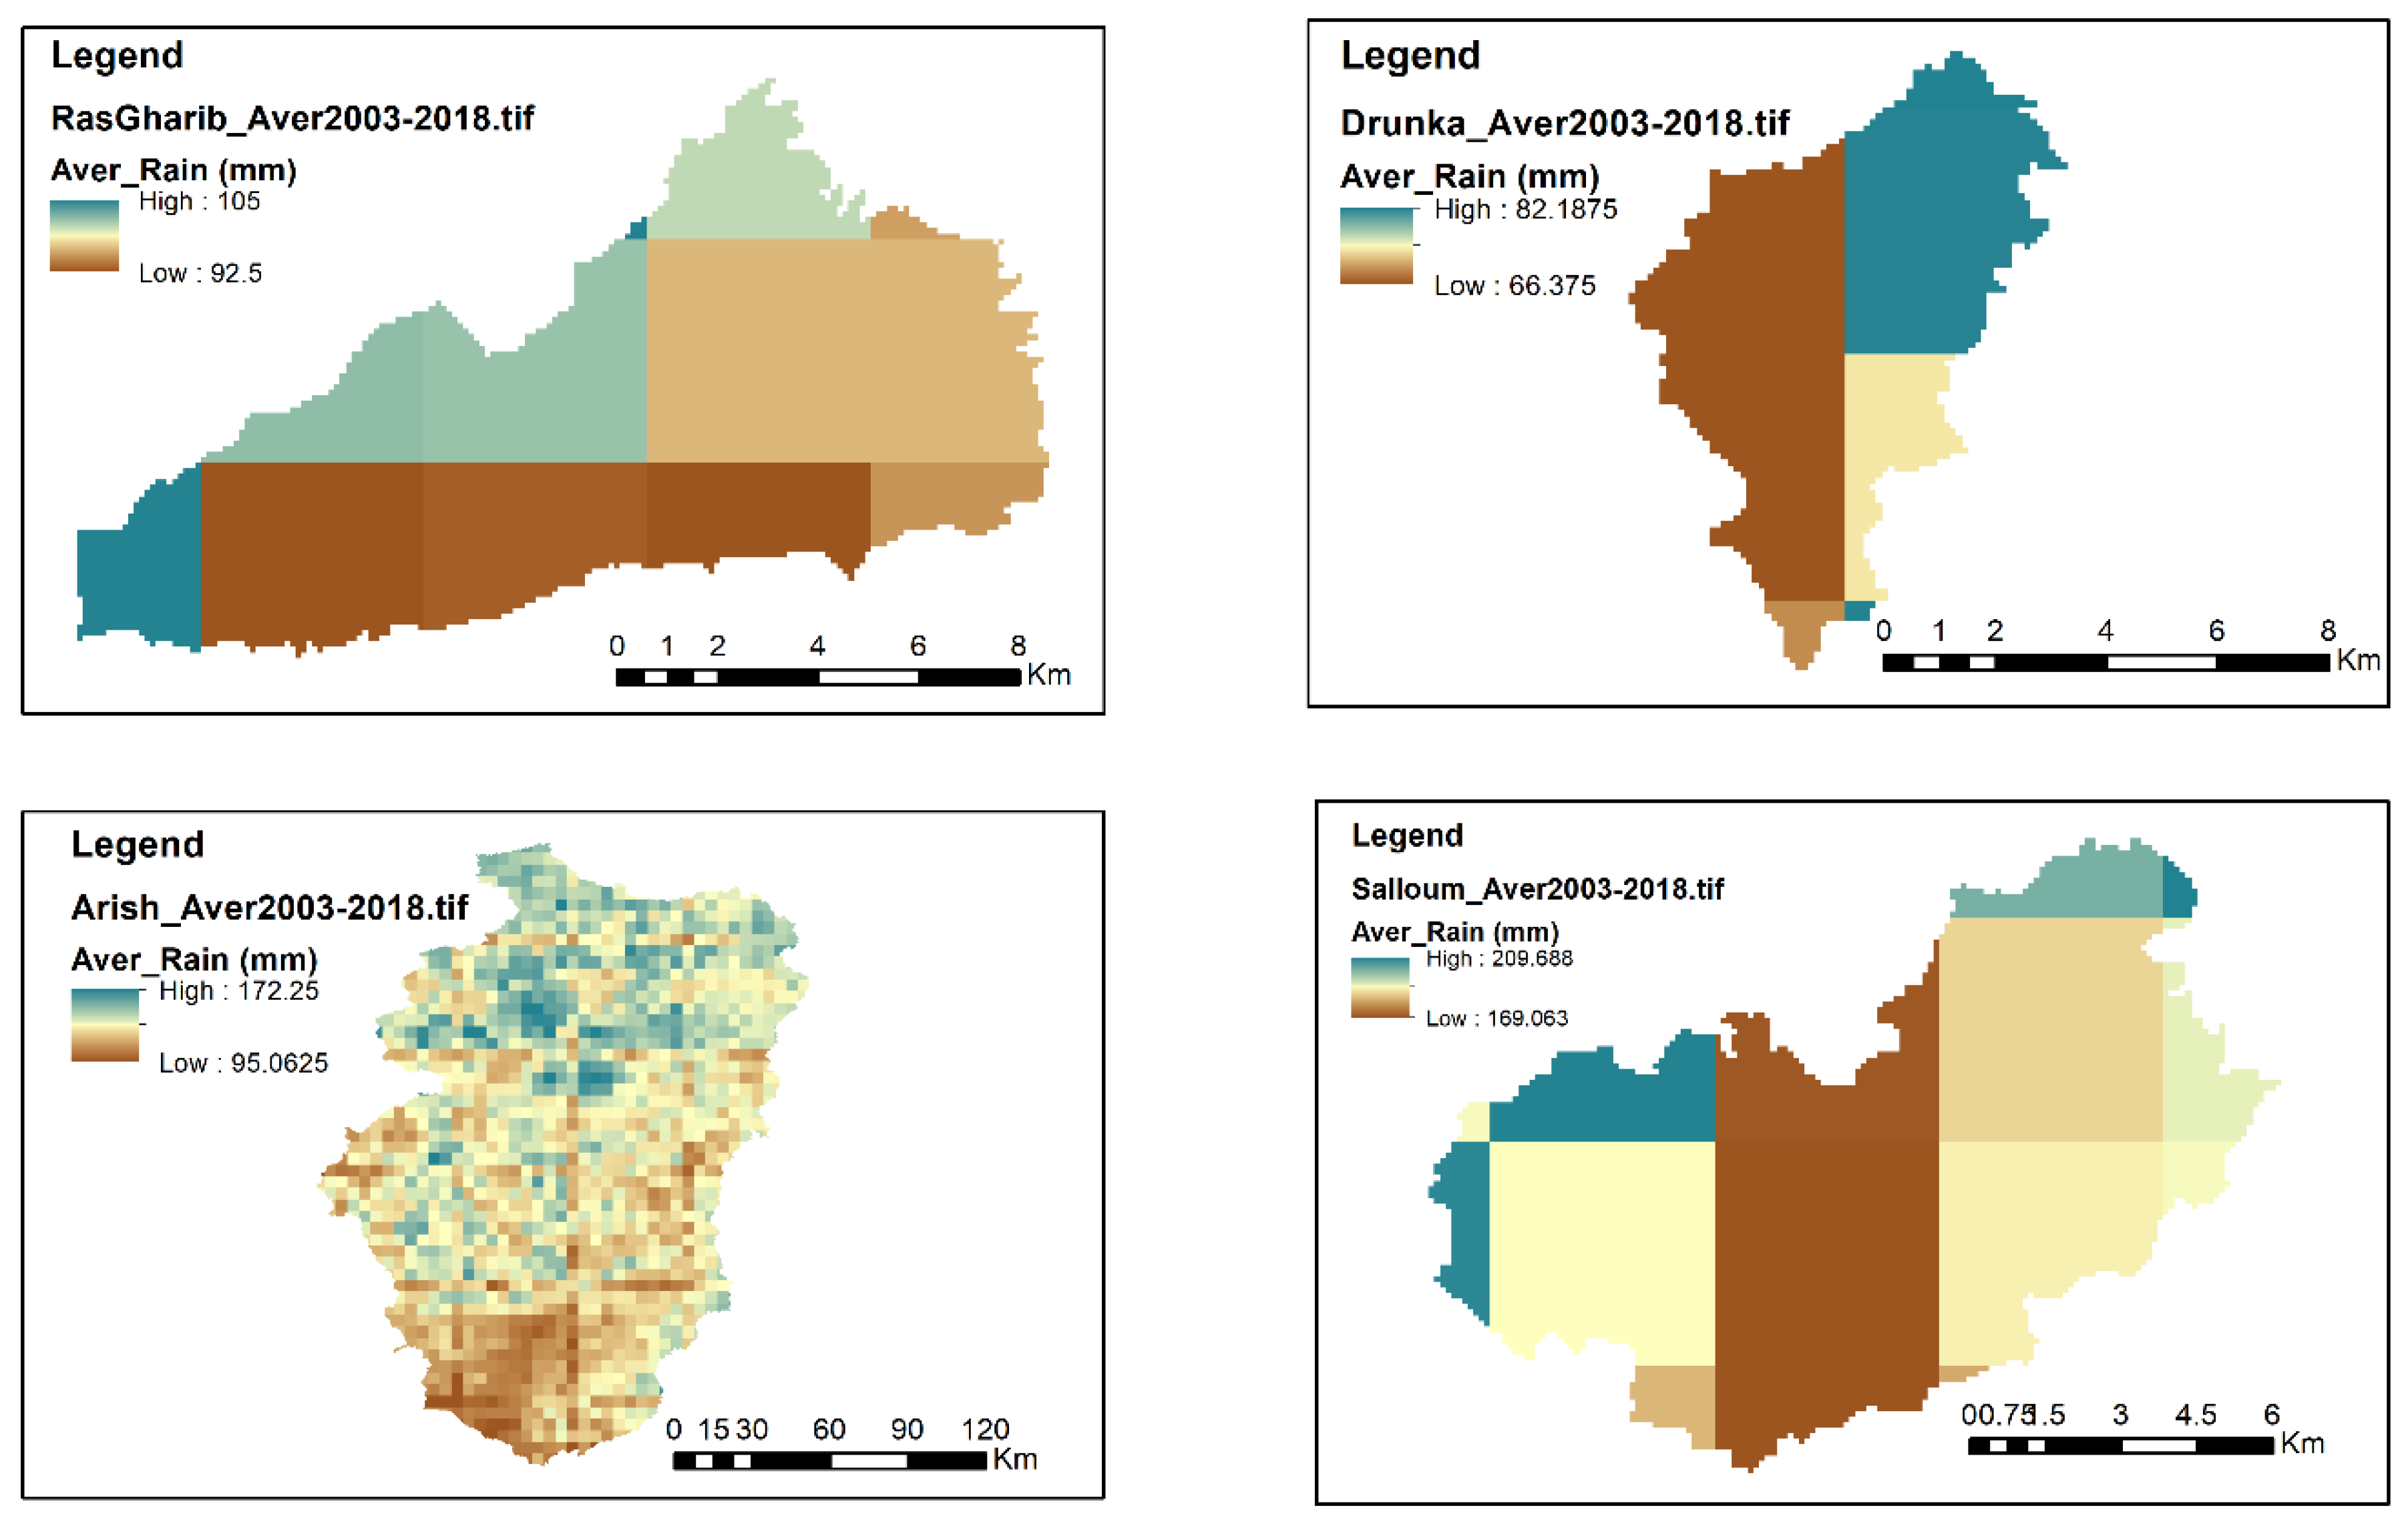
5.1. Rainfall Trend Analysis
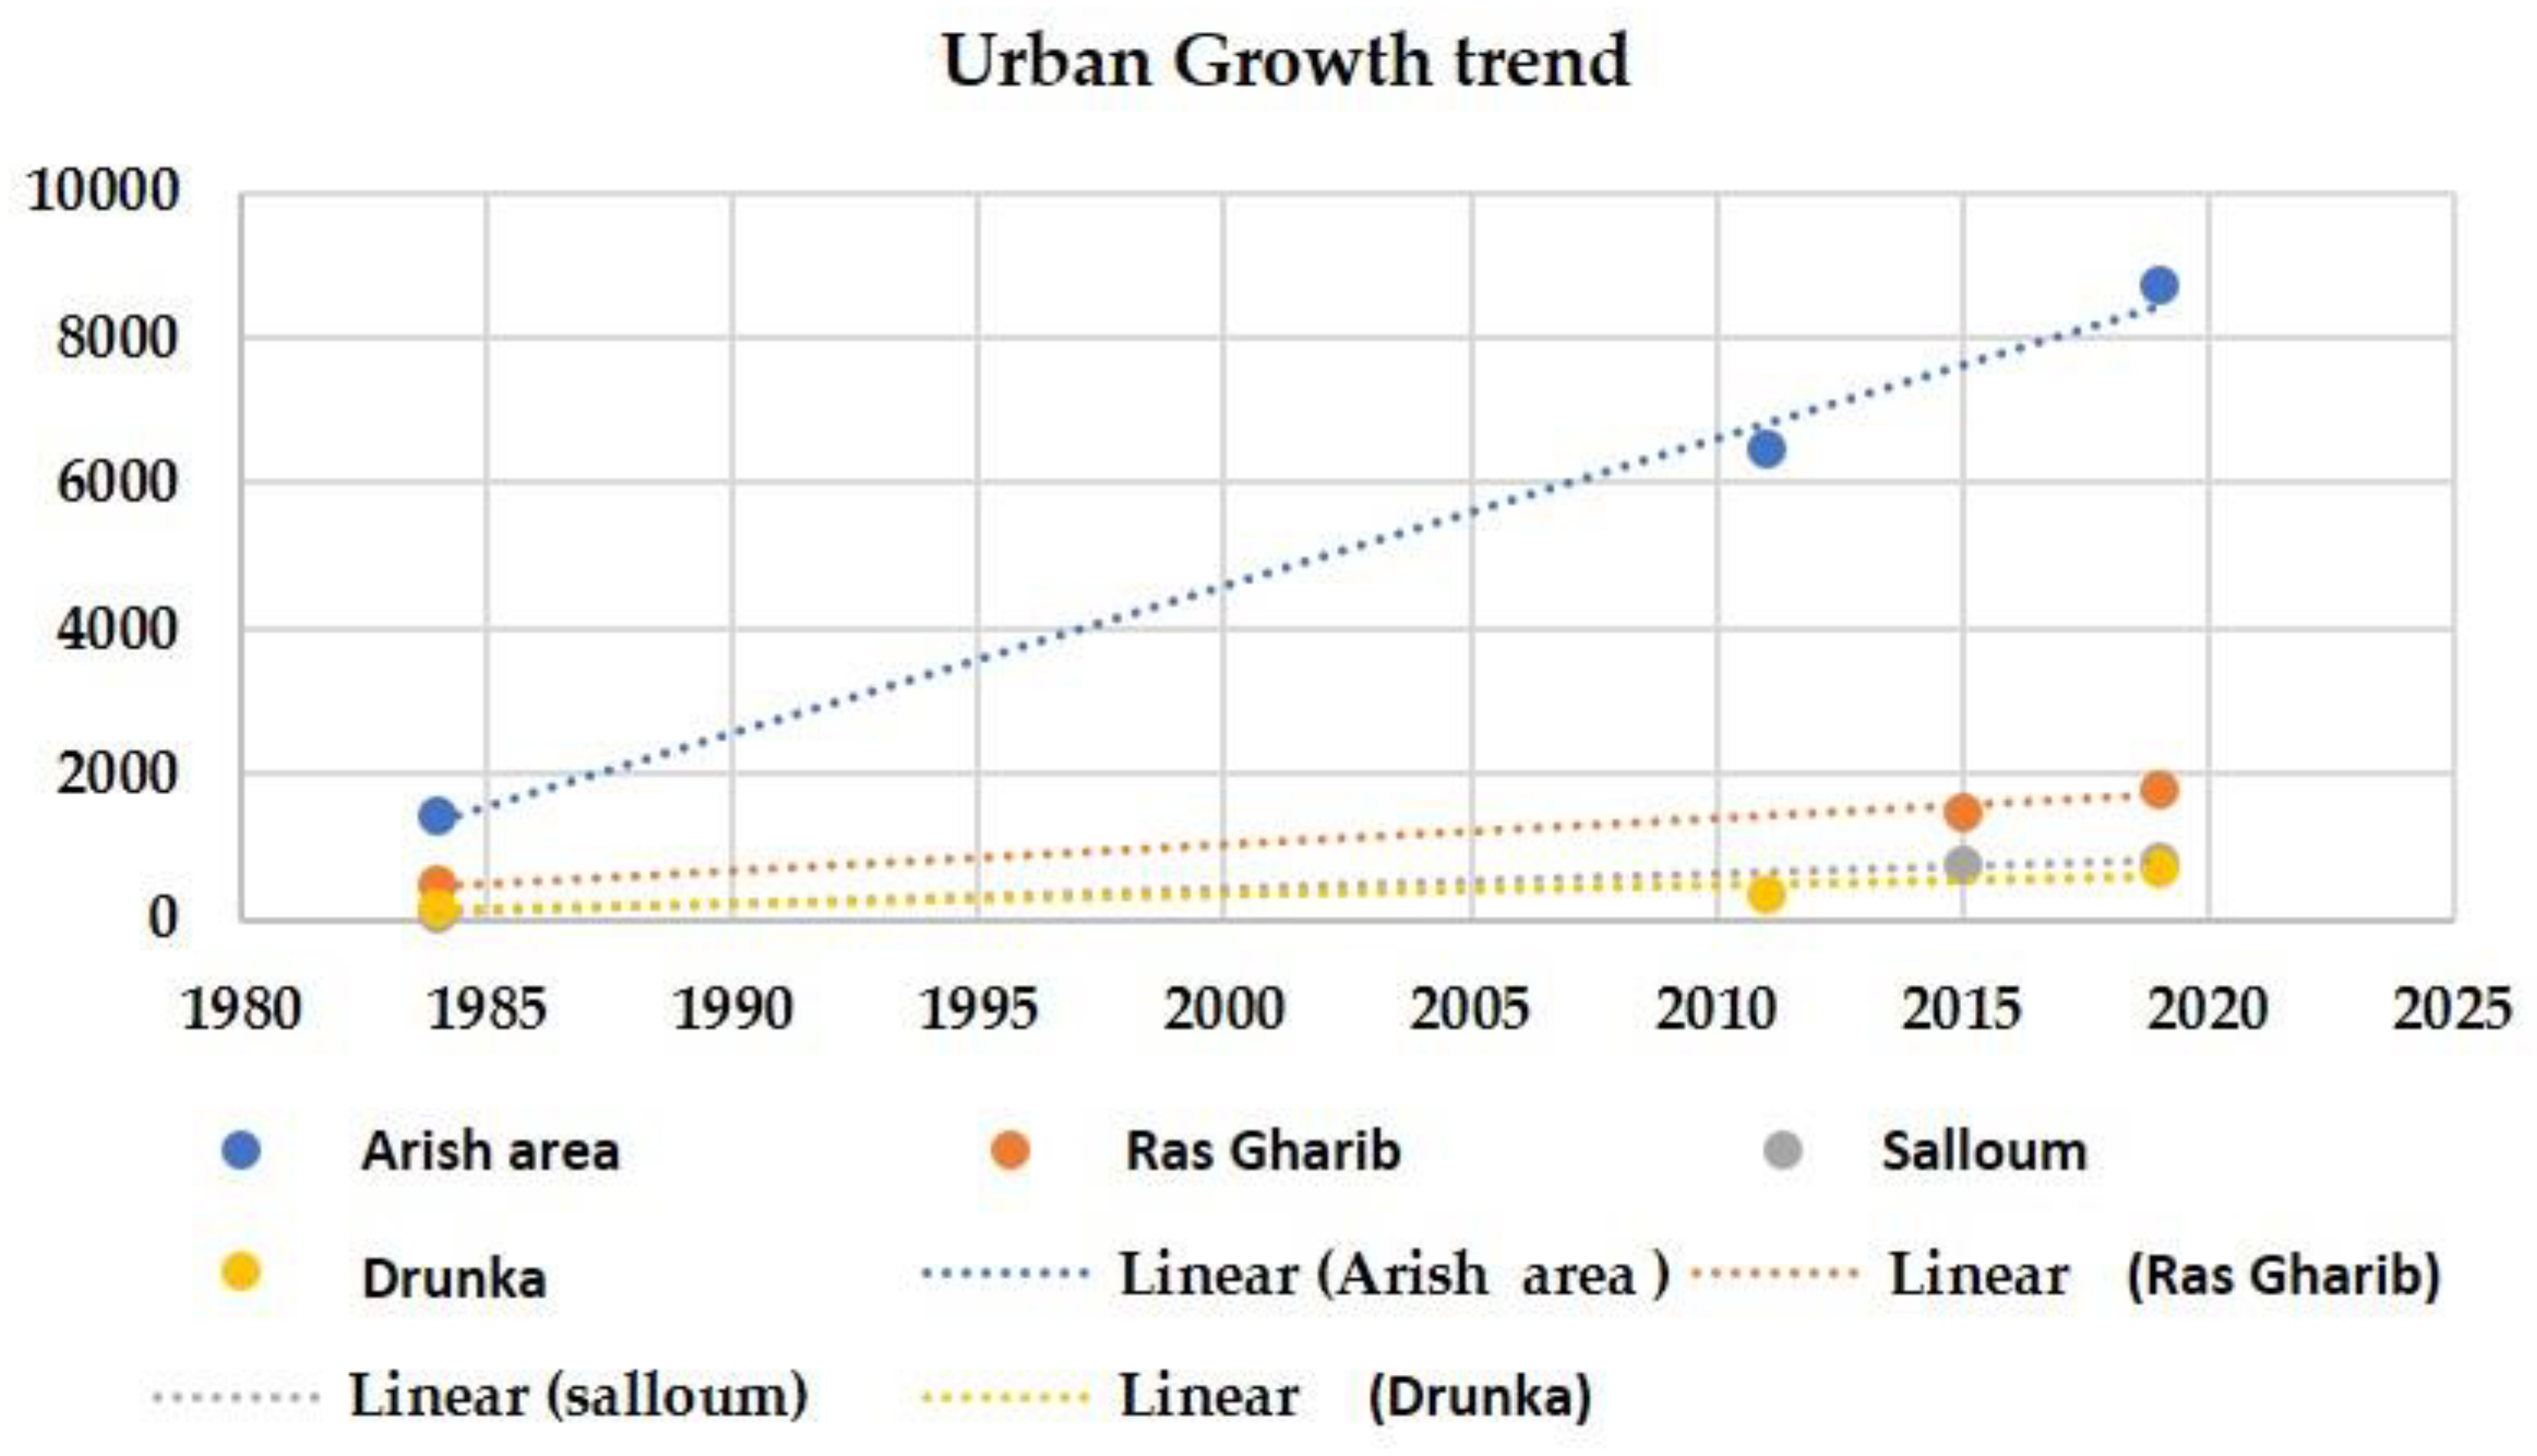
5.2. Assessment of Urban Growth from 1984 to 2019
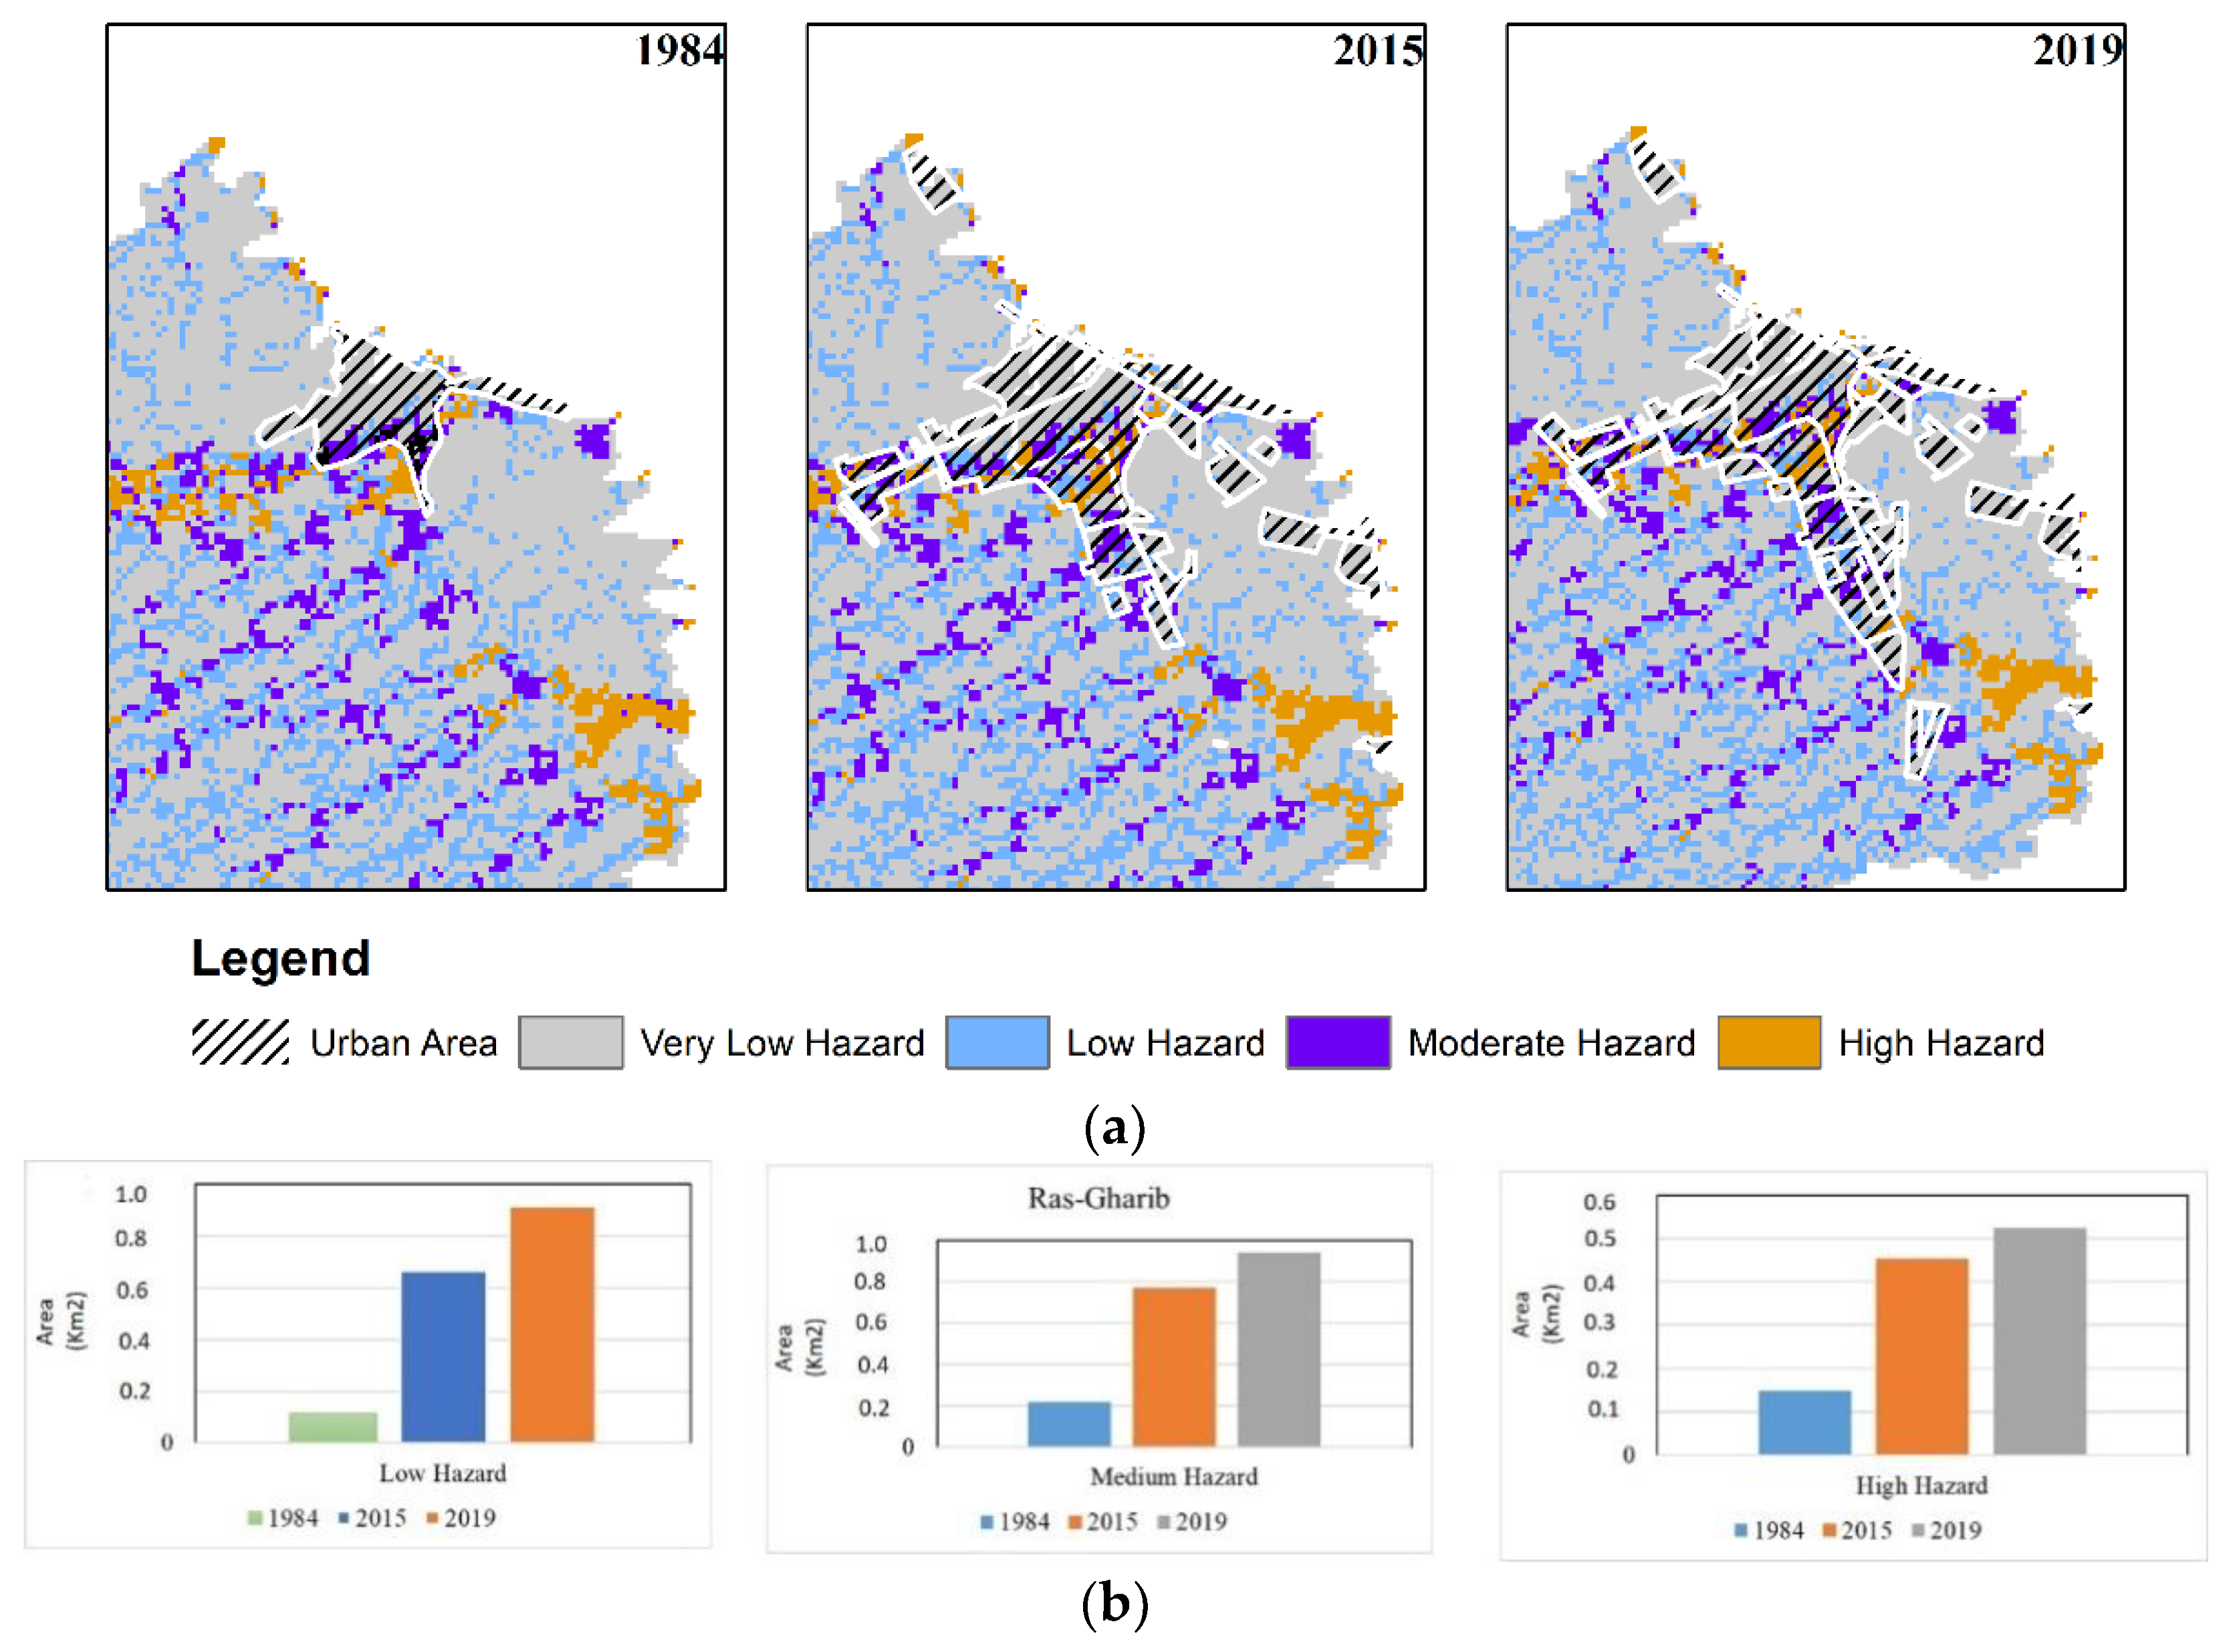
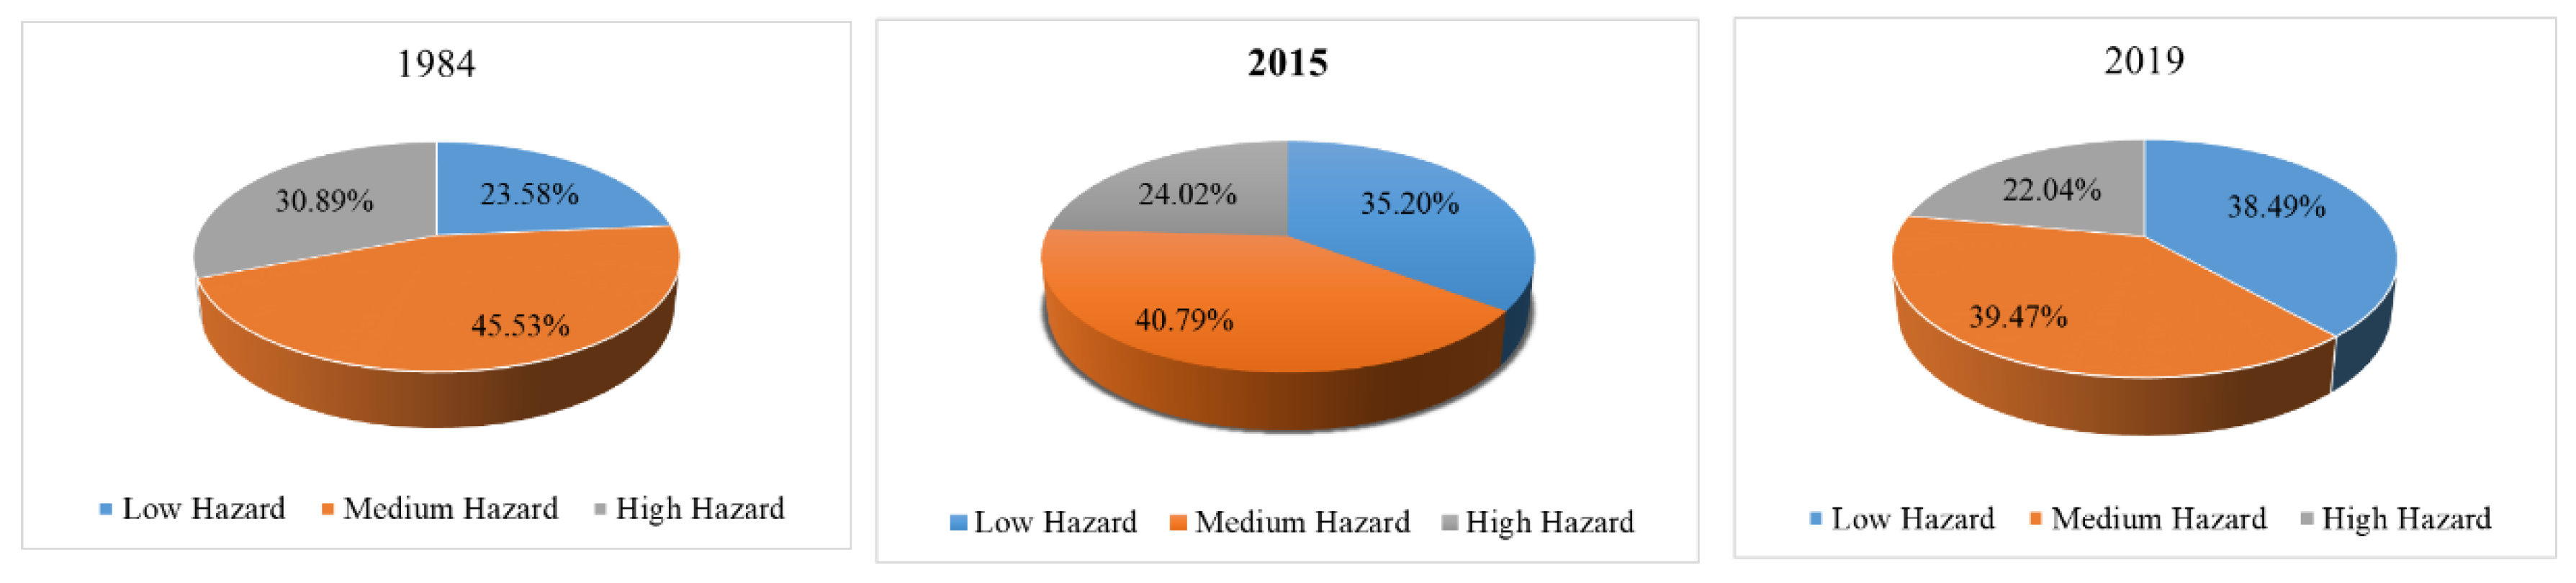
5.3. Flood Inundation Mapping
5.3.1. Ras Gharib
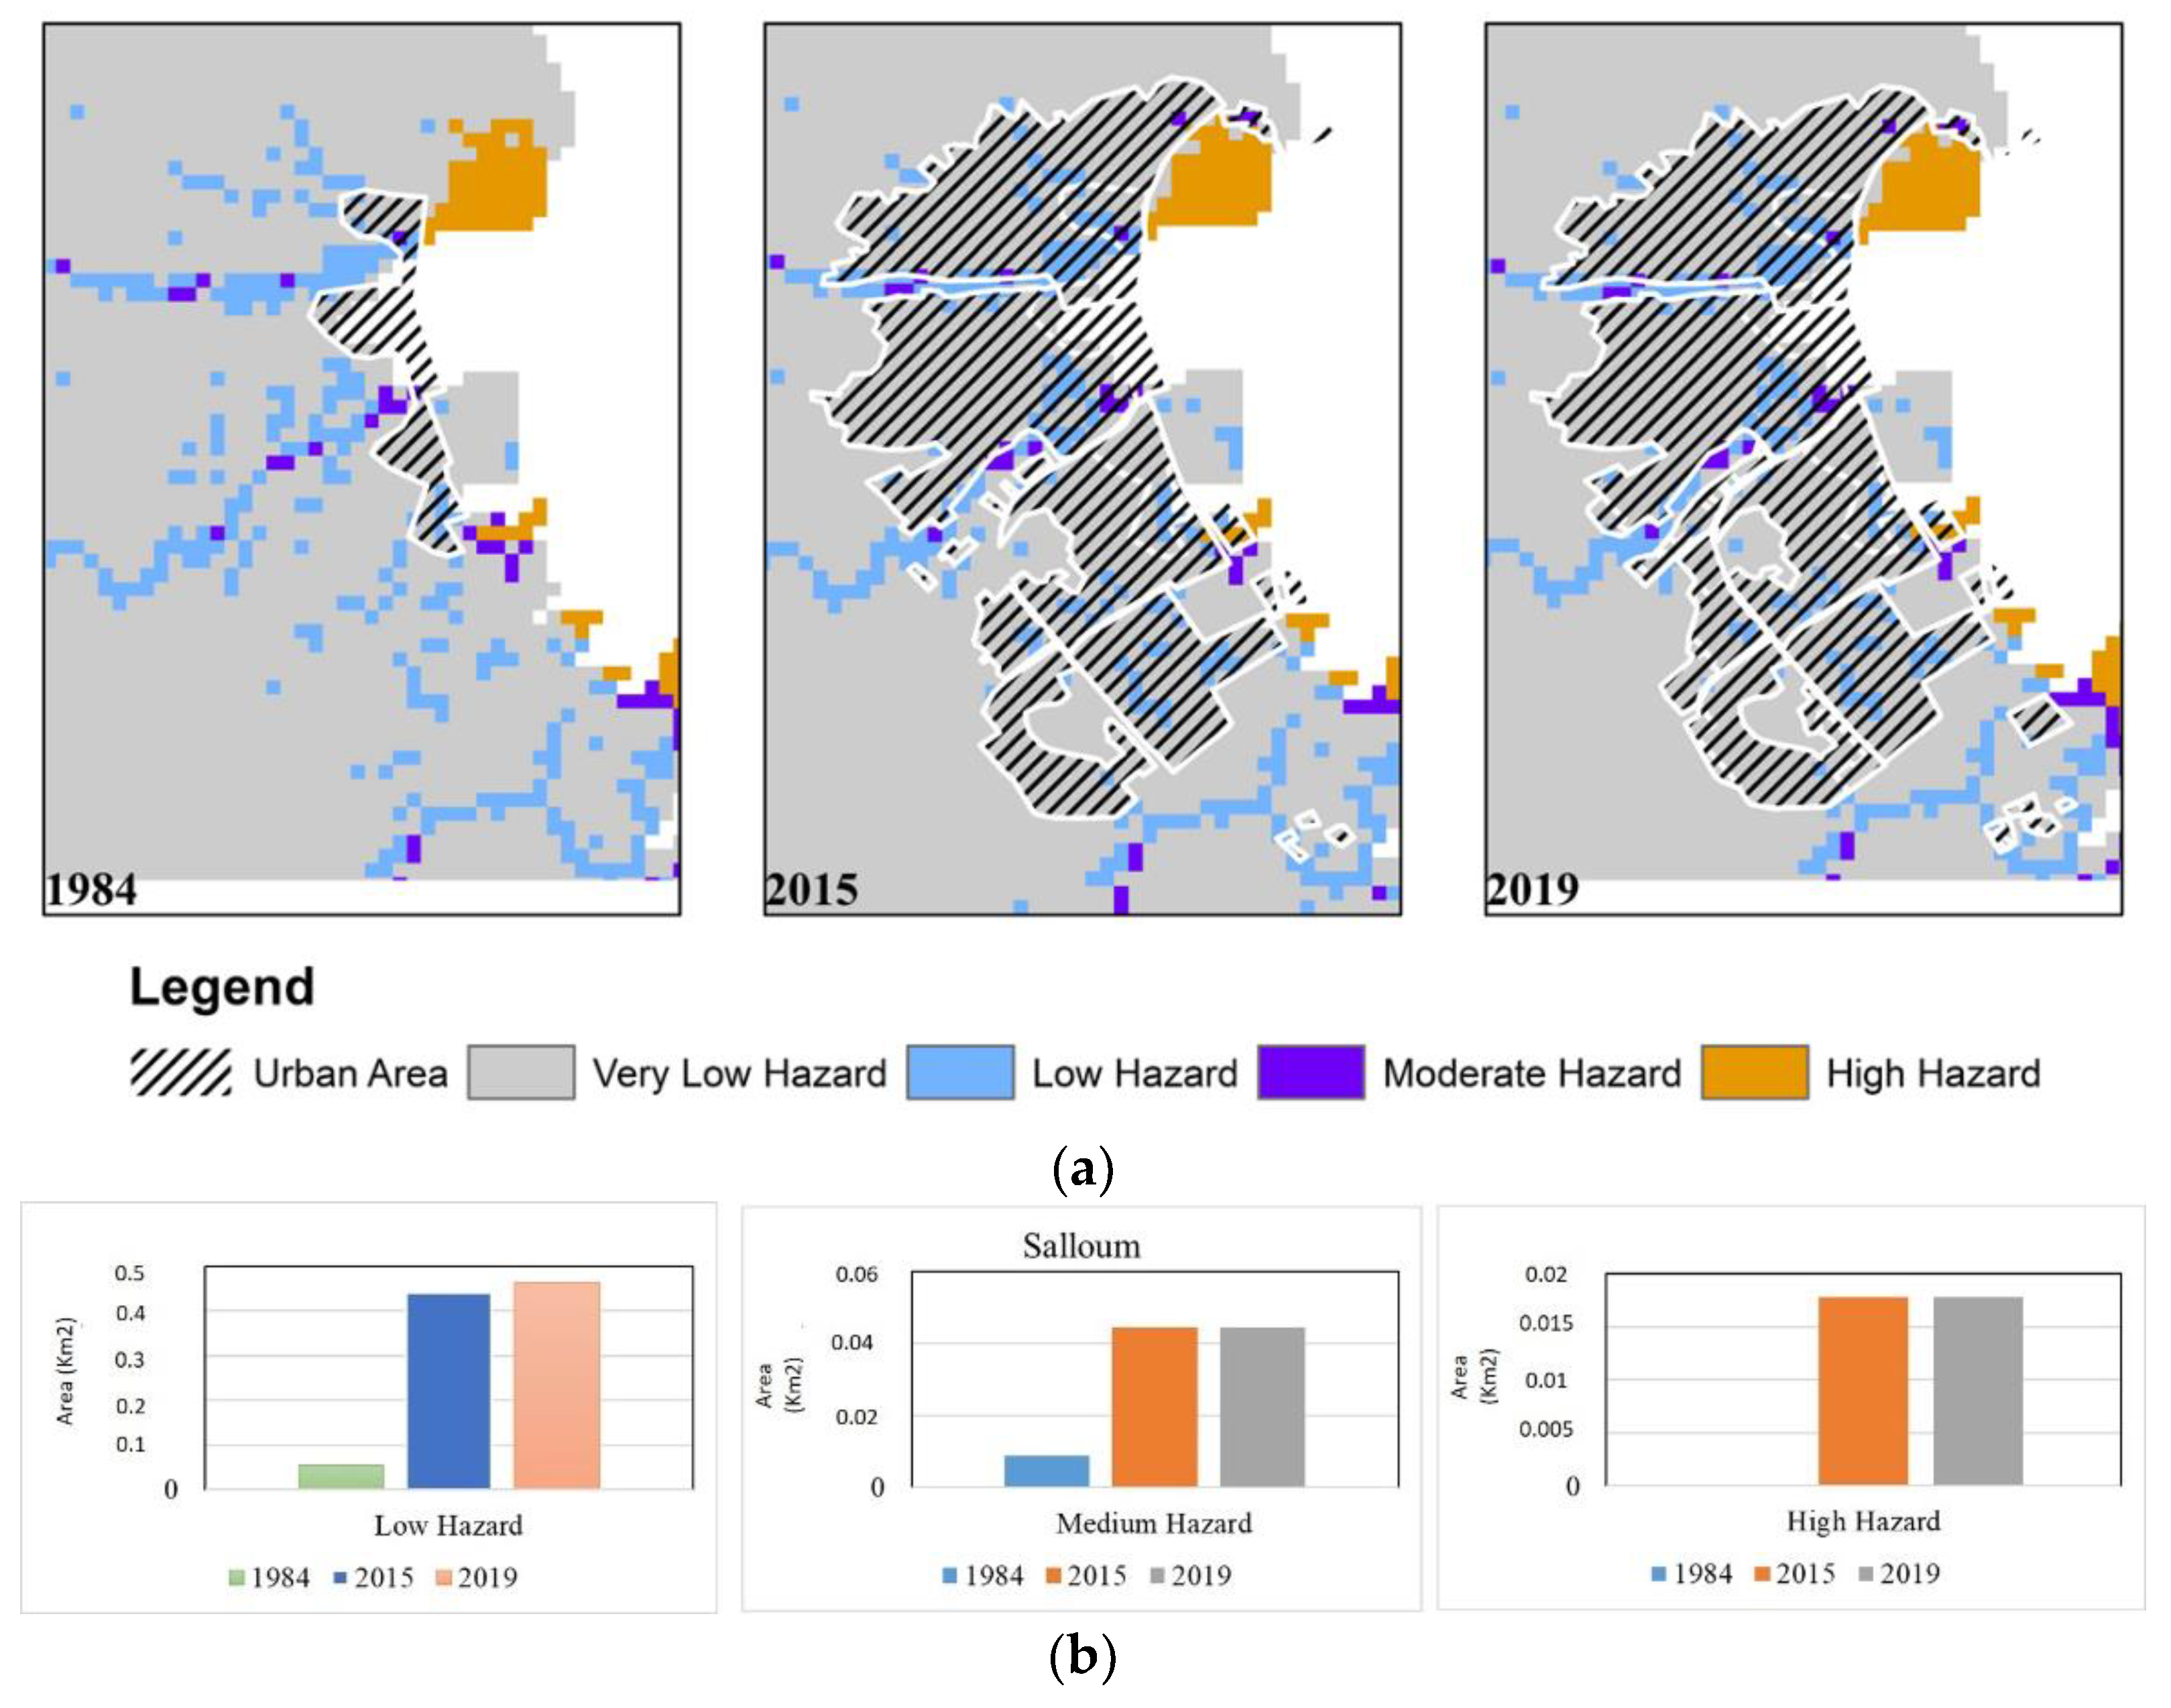
5.3.2. Salloum
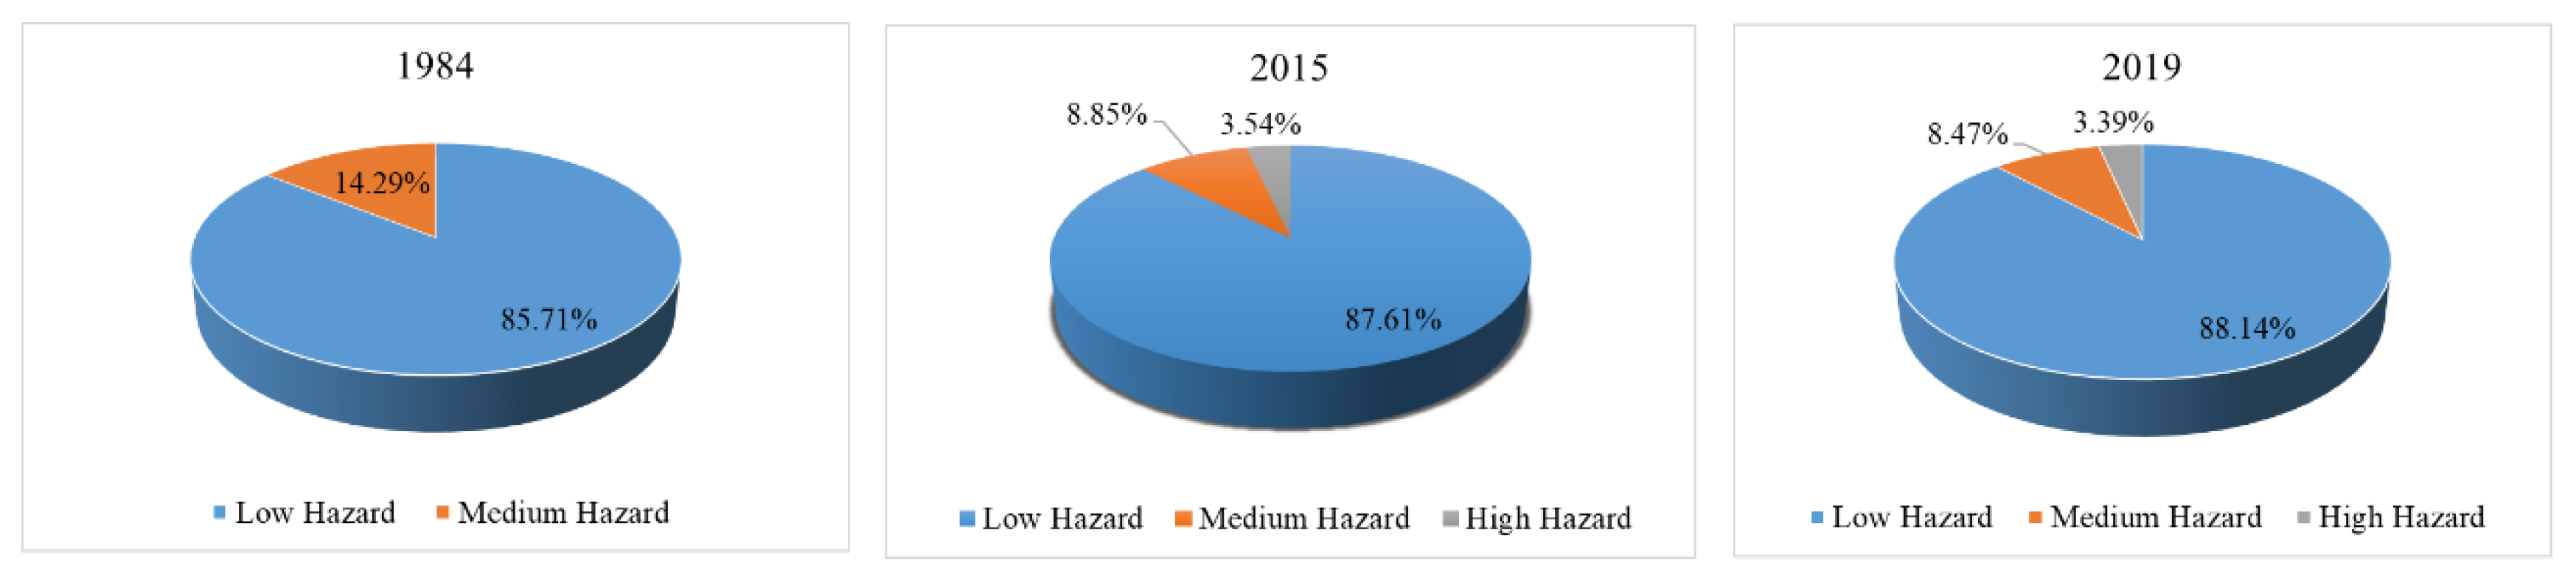
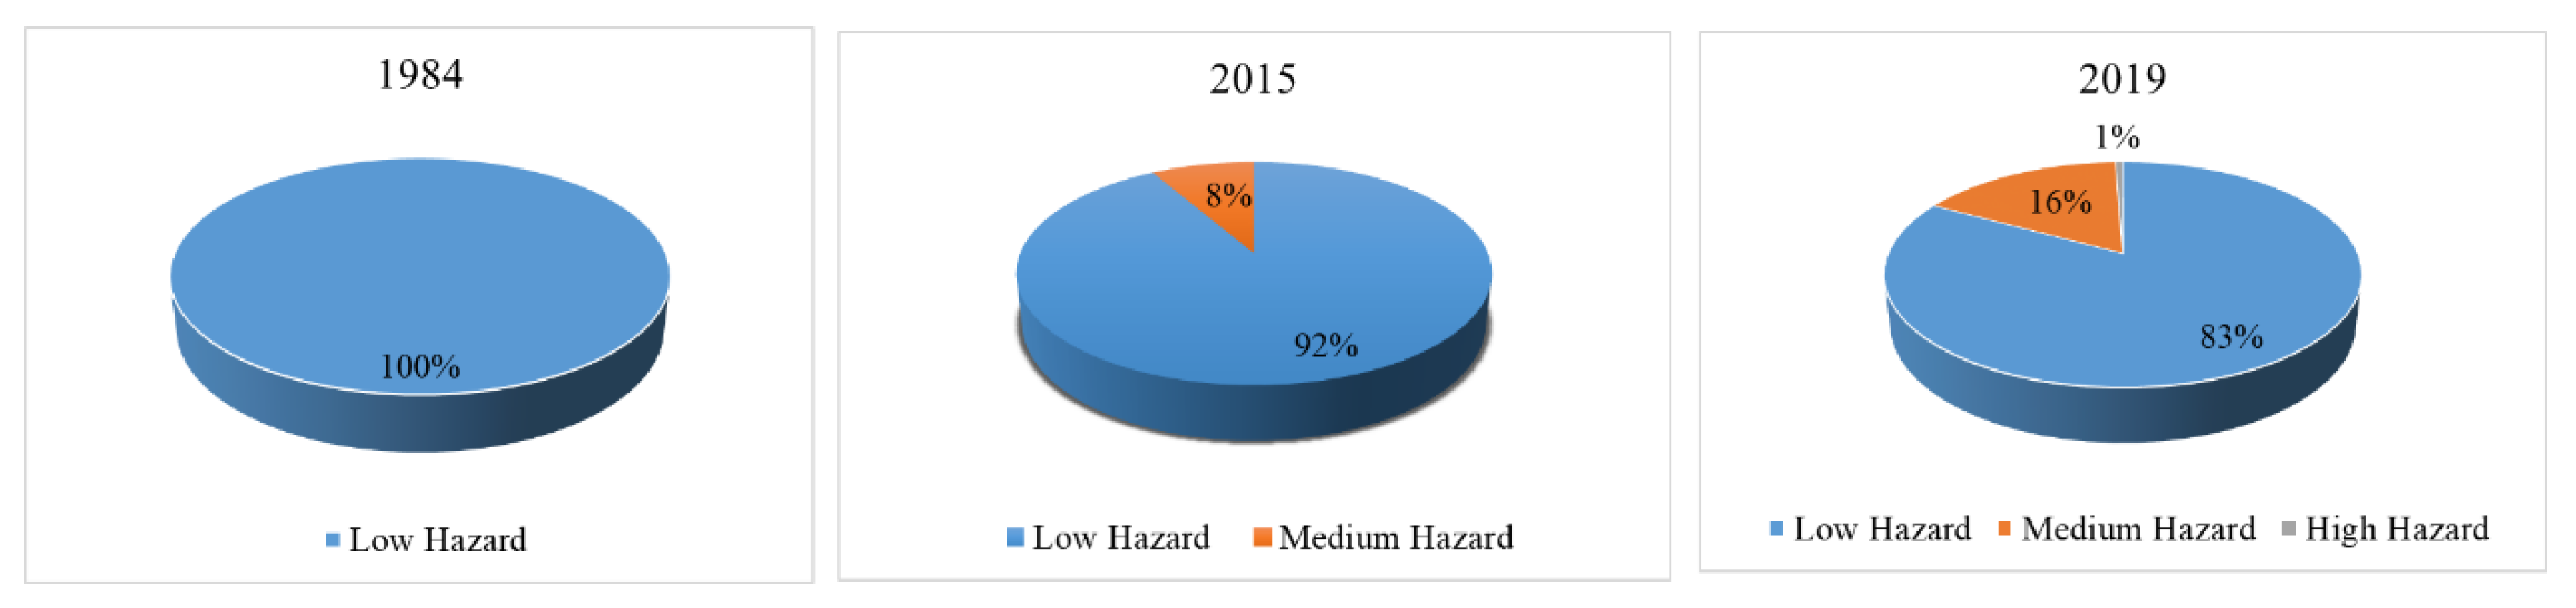
5.3.3. Drunka
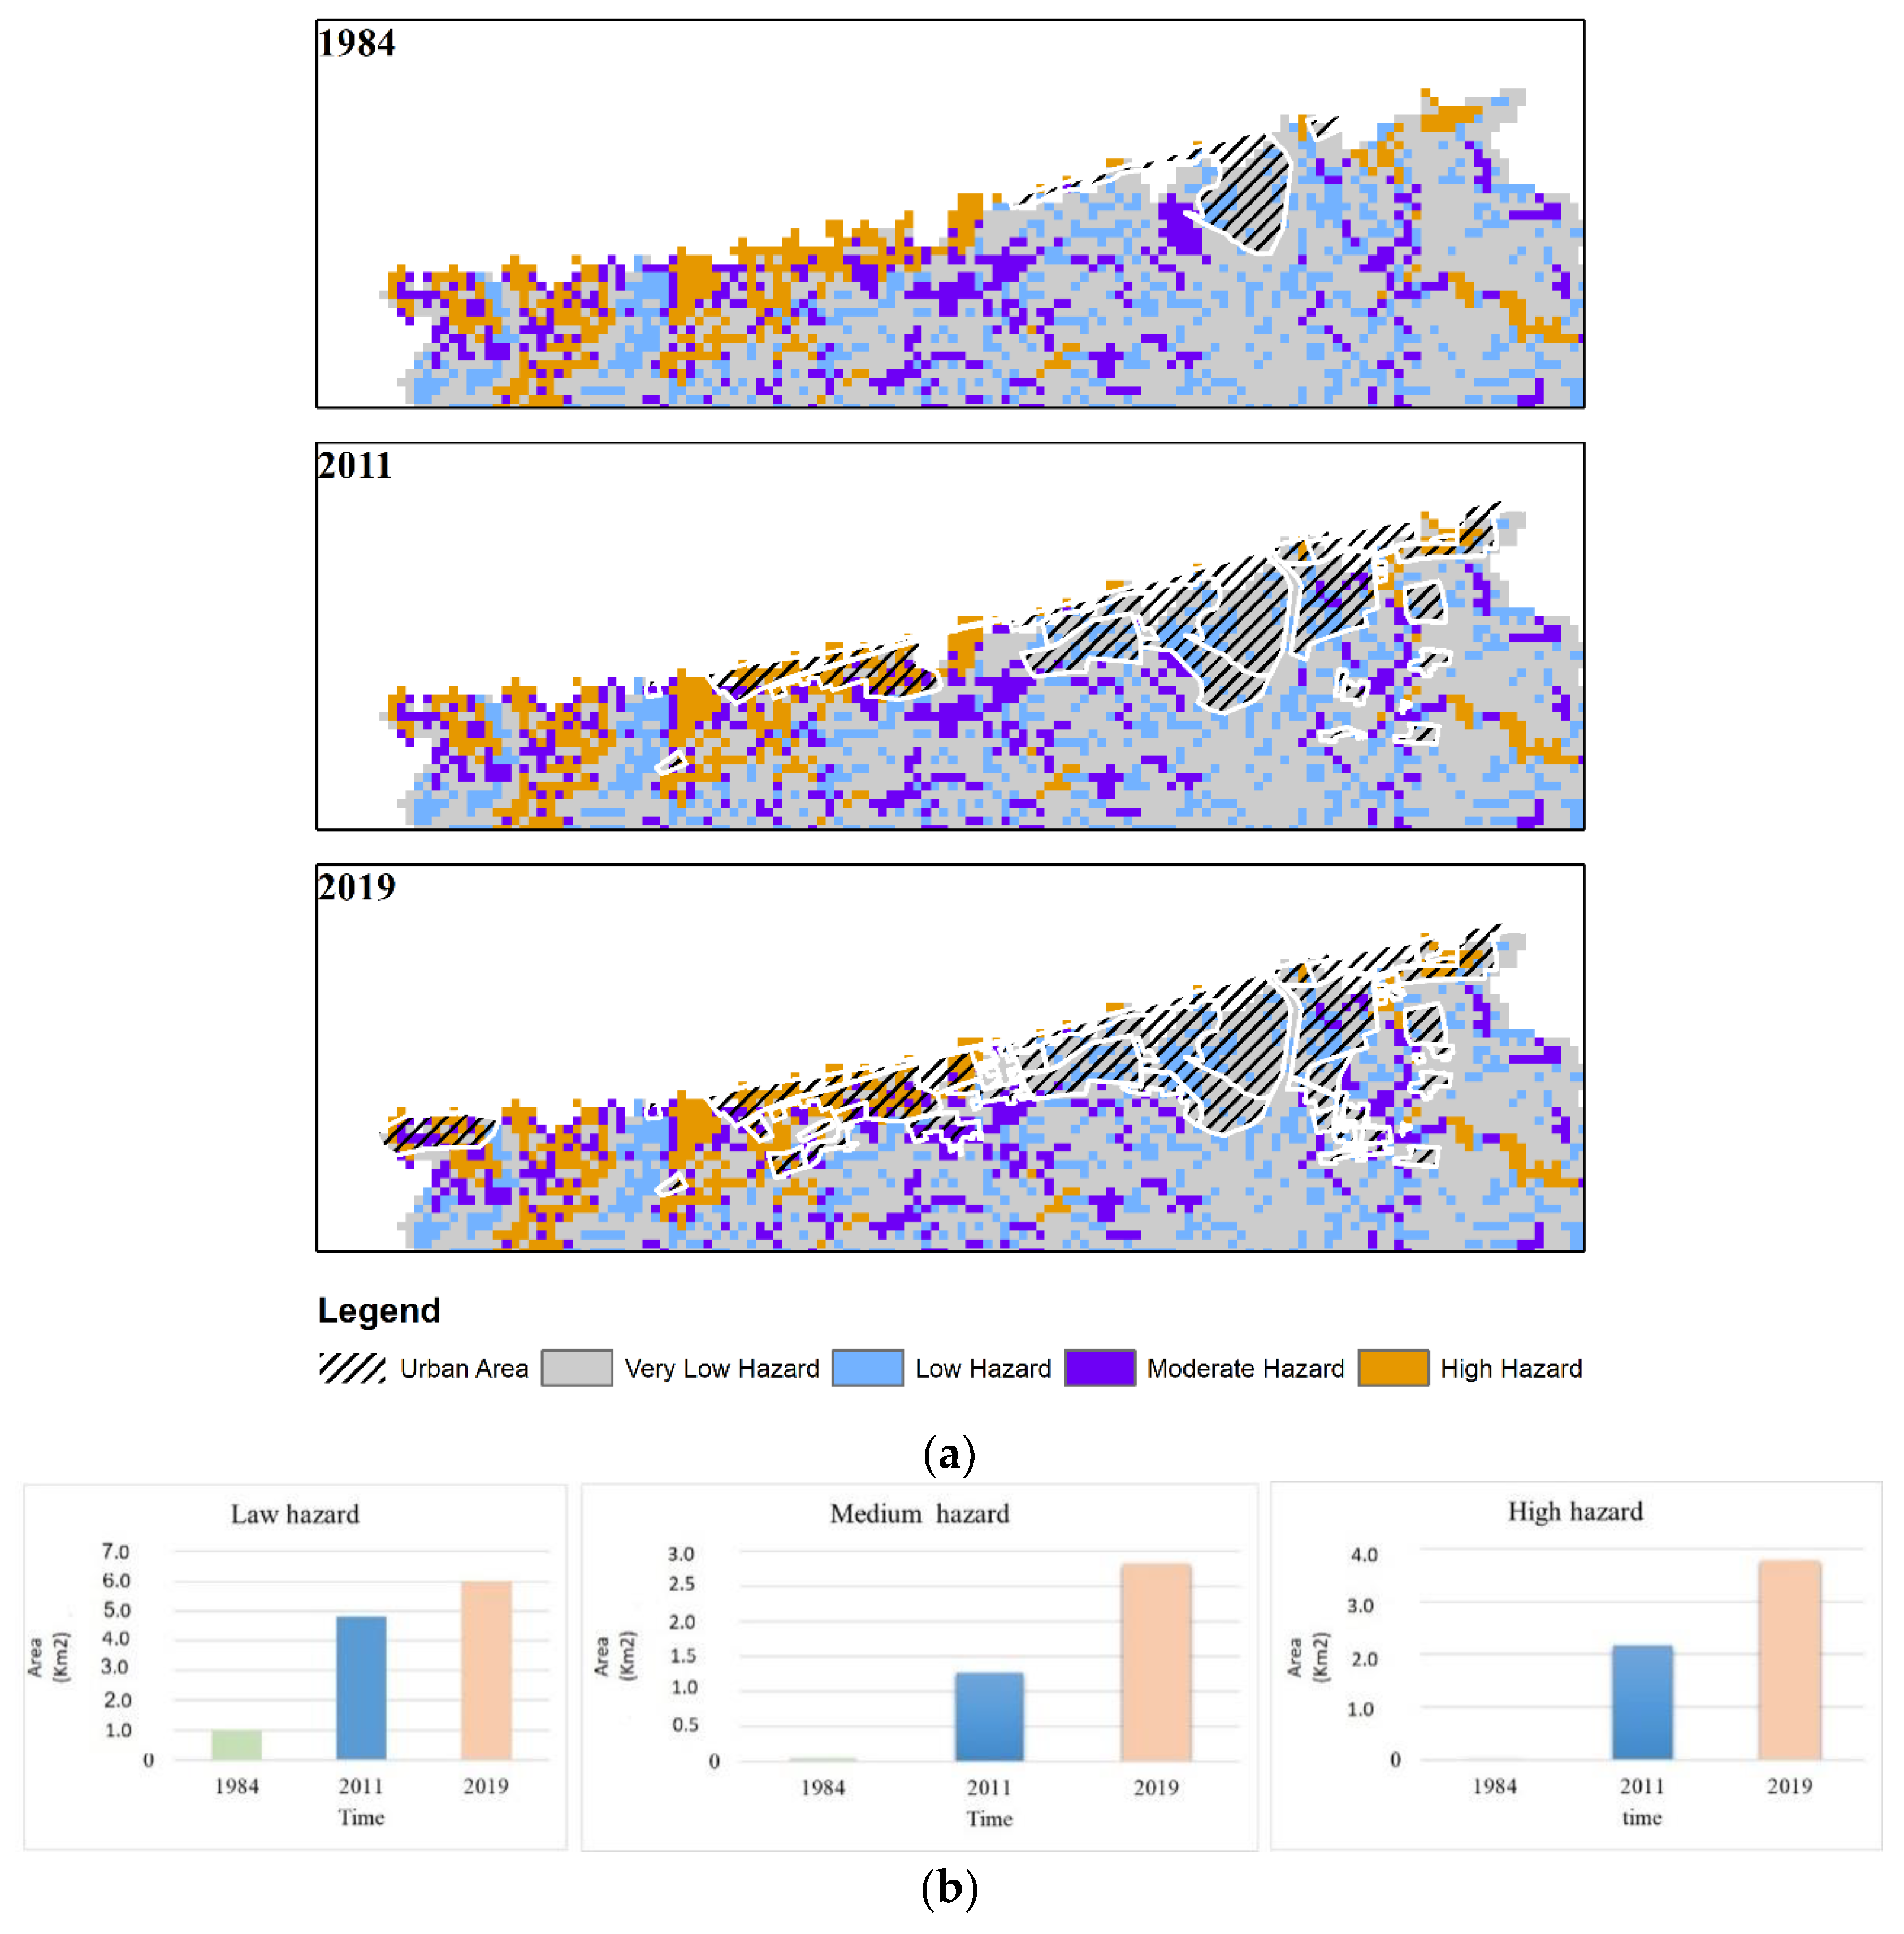
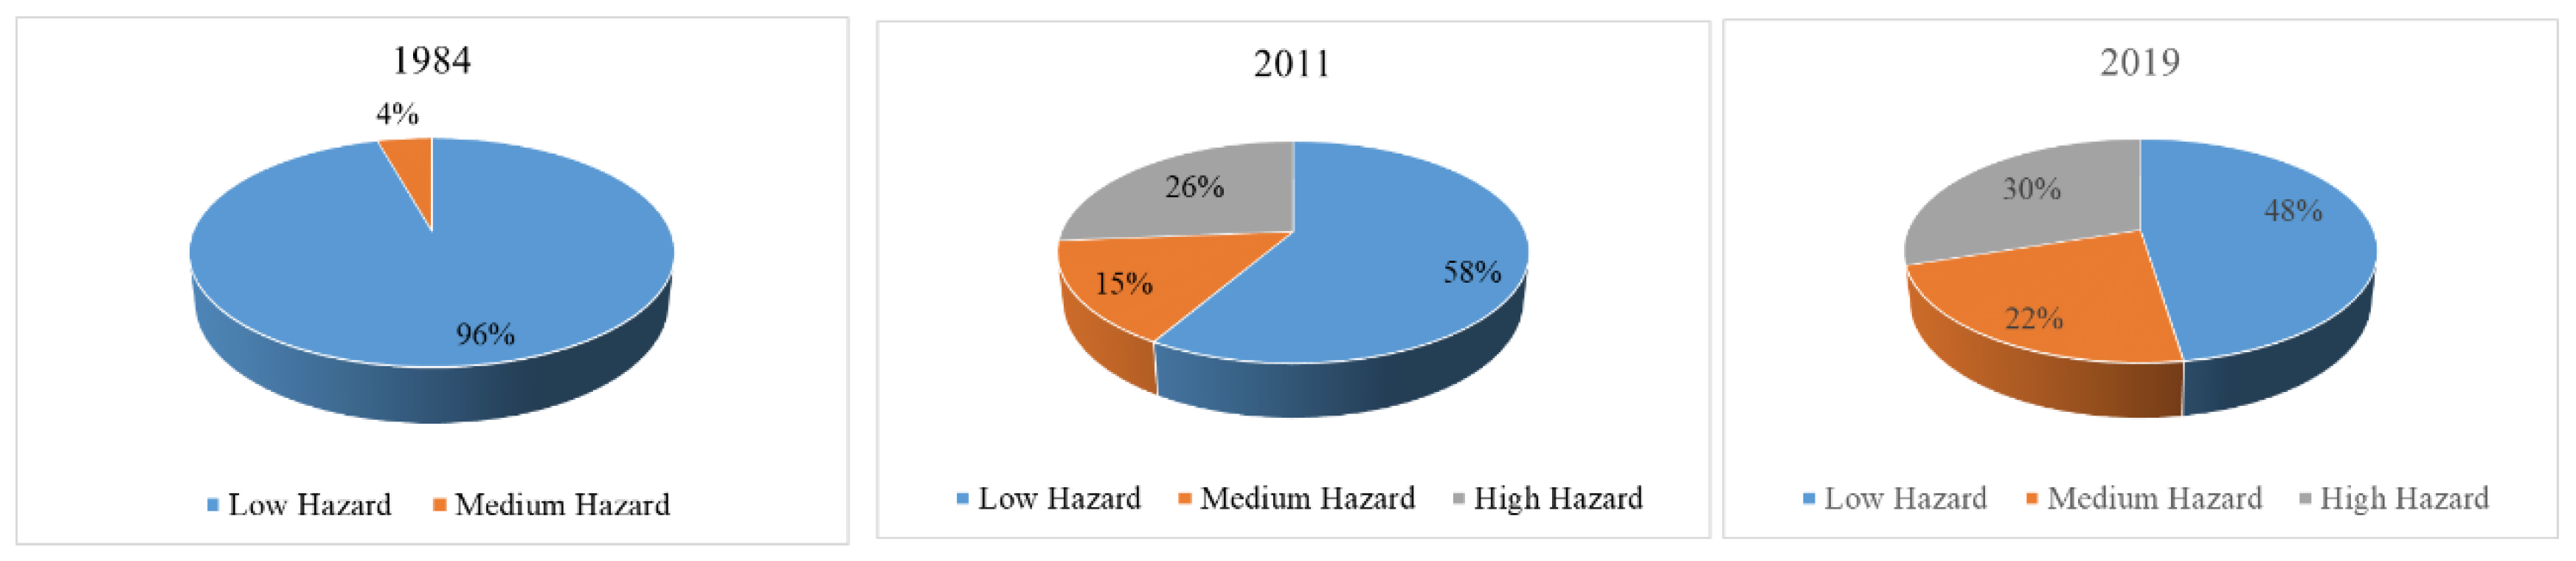
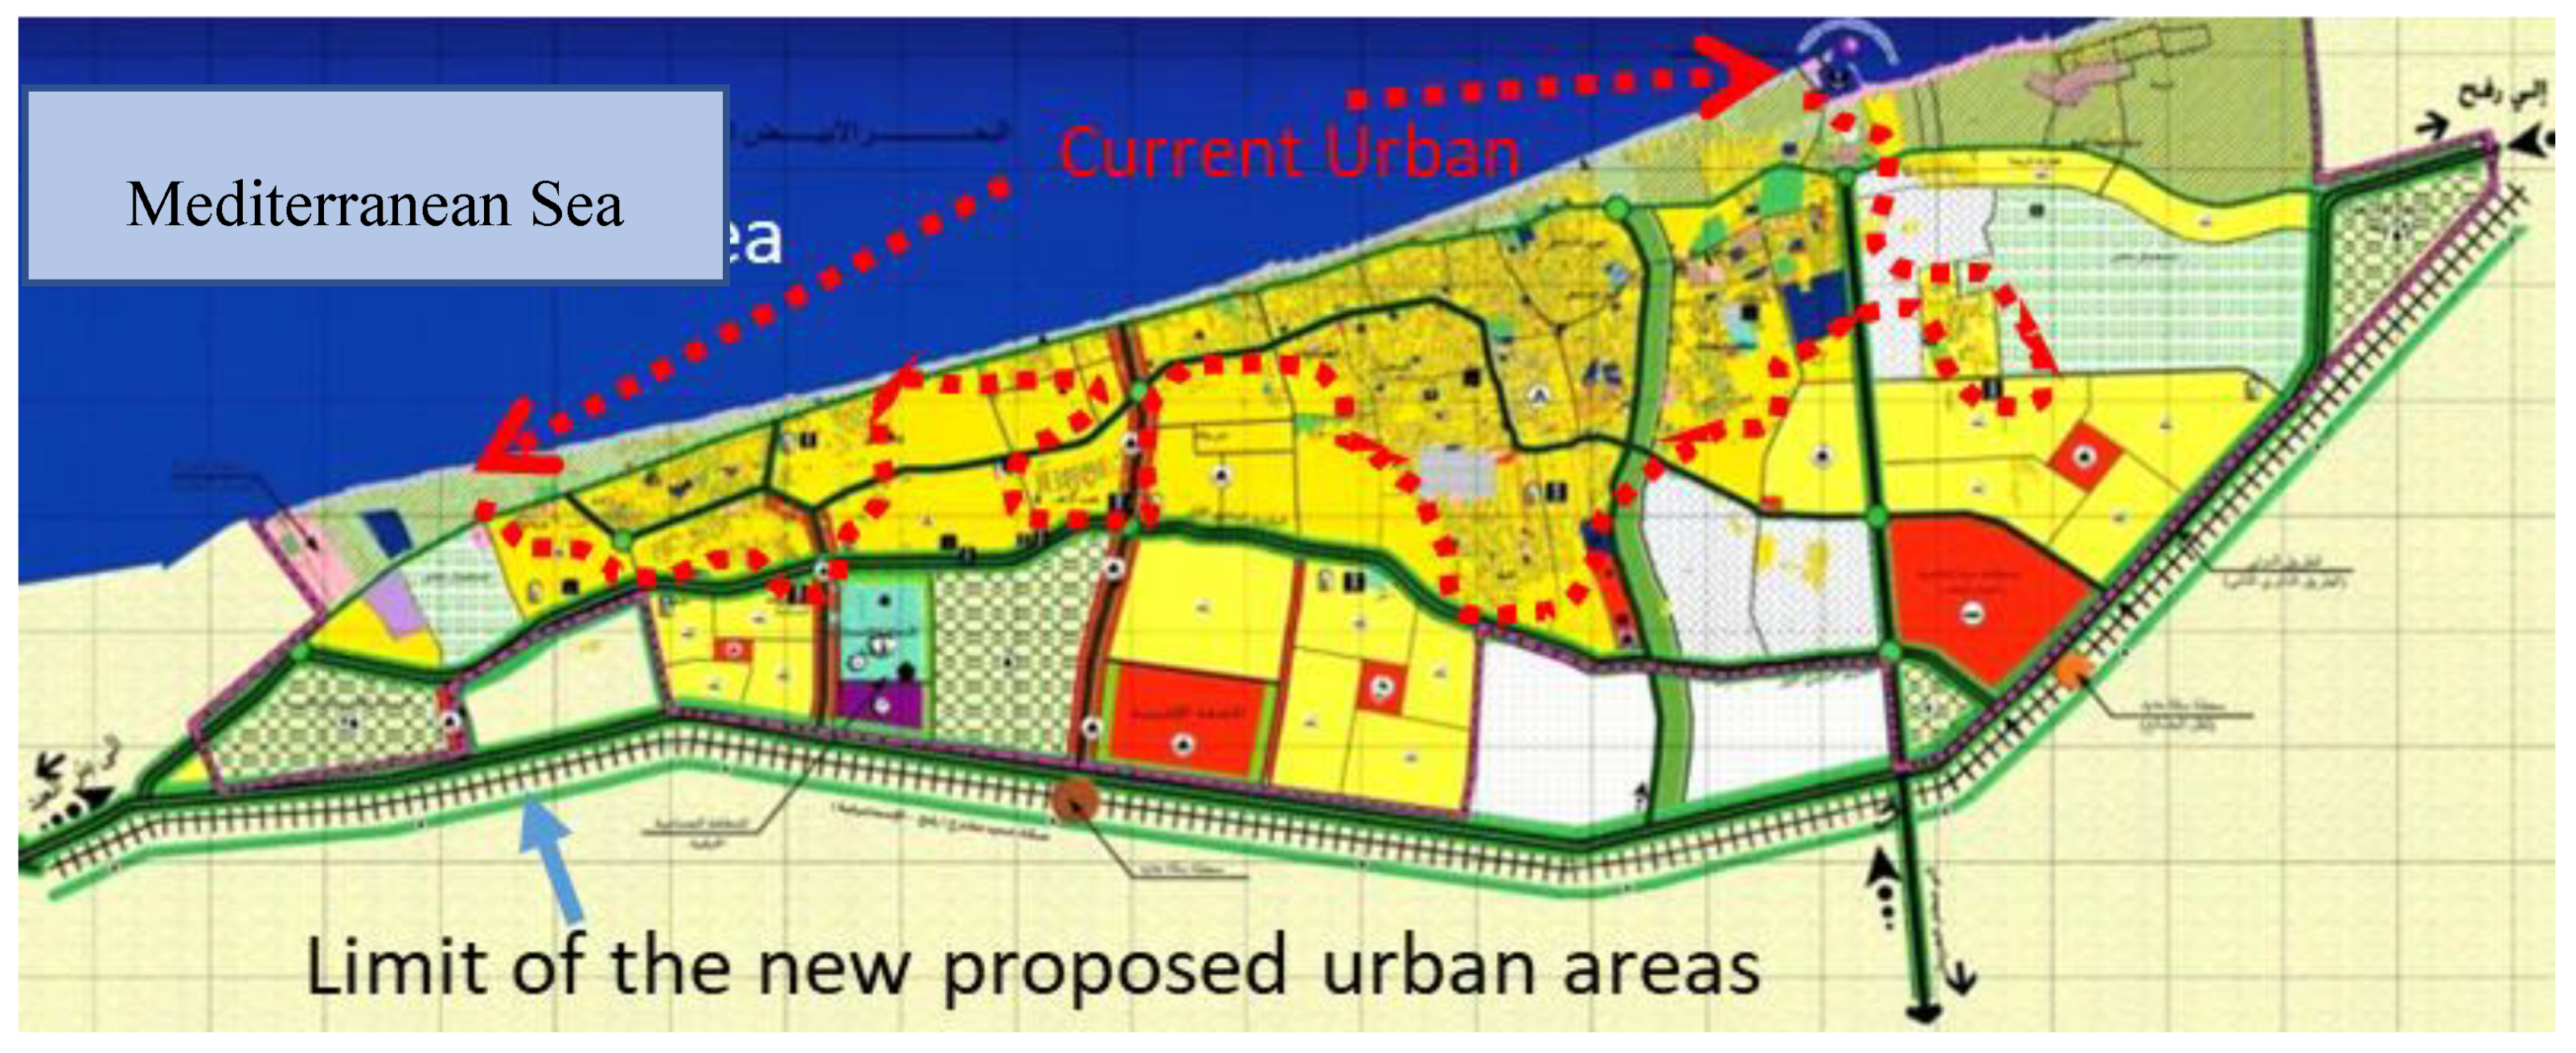
5.3.4. Al-Arish
5.4. Assessment and Evaluation of the Triple Impacts
6. Conclusions
- The results show a significant increase in the urban growth resulting in an increase of the areas prone to flood hazard within the period from 1984 to 2019;
- The urban growth could contribute to increasing or decreasing the flood hazard depending on two factors, namely the size of the urban growth and the direction of this growth;
- The rainfall trend variability is not the only controlling factor increasing or decreasing the areas vulnerable to flood hazard in the urban regions. In addition, there is no clear relationship between the rainfall and the flood-vulnerable areas in the four areas, revealing that the areas prone to flooding were not significantly affected by the difference in rainfall intensity and frequency as much as by the size of urban growth;
- There is mismanagement affecting the size and type of vulnerable areas to the flood hazard from two main sides, i.e., loss of control over unplanned growth and deficiencies in approved plans resulting from neglecting the flood hazard layer in planning.
Author Contributions
Funding
Conflicts of Interest
Appendix A

| Date | Affected Area | Recorded Damages |
|---|---|---|
| October 2019 | Cairo, Alexandria, meet Ghamr and new Cairo | 12 Deaths, road damages |
| April 2018 | Al ain Alshokhna, Fifth settlement “New Cairo” | Road damage, damaged vehicles, 10 million EGP loss |
| October 2016 | Ras sedr, Sharm Elshekh, Hurghada, and Qena | Road damage, water pipe damage |
| 2015 | Assuit, Sohag, Qena, Luxor, and Aswan | Destroyed houses |
| 2015 | Alexandria, Al-bhera, and Matrouh Governorates | 35 Deaths, 180 destroyed houses, dozens injured thousands of acres drowned |
| February, October 2015 | North and south of Sinai, Red Sea region | Road damages, loading and unloading area of Hurghada International Airport drowned |
| March, May 2014 | Taba, Sohag, Aswan, Kom Ombo | Dam failure at Sohag, road damages |
| 2013 | South Sanai & Sohag, and Assuit | 2 Deaths, road damage, 750 million EGP loss |
| 2012 | W. Dahab, Catherine area | Dam failure, destroyed houses |
| January 2010 | Aswan, Sinai, and Al Arish | 8 Deaths, 1381 damaged houses, roads and infrastructure |
| 2009 | Along the Red Sea coast, Aswan, Sinai | 12 Deaths, damaged houses and roads and 37 injuries |
| October 2004 | W. Watier | Road damage |
| May 1997 | Safaga, El-Qusier | 200 Deaths, destroy roads, demolished houses damaged vehicles |
| November 1996 | Hurghada, Marsa Alam | |
| September, November 1994 | Dhab, Sohage, Qena, Safaga, El-Qusier | |
| March, August 1991 | Marsa Alam, W. Aawag | 3200 Destroyed houses |
| October 1990 | W. El-Gemal, Marsa Alam | |
| January 1988 | W. Sudr | 5 Deaths |
| October 1987 | South Sanai | 1 Death, roads damage, 27 injuries |
| 1985 | Qena Governorate | 32 Deaths, dam failure |
| February 1982 | South Giza | Demolished 180 houses |
| April 1981 | Aswan Governorate | Roads damage and demolished houses |
| February, November, and December 1980 | Aswan Governorate, W. Elarish, Qena And Sohag | Roads damage, demolished houses and farms |
| May, October 1979 | Aswan, Kom Ombo, Idfu, Assiut, Marsa Alam, El-Qusier | 5619 Deaths, demolished houses |
| 1975 | Minia, Assuit, and Sohag | Drowning of 10 villages, 180 houses destroyed, and 1500 citizens displaced. |
| February 1975 | W. El-Arish | 17 Deaths, road problems, and 200 houses destroyed |
| 1972 | Giza | Destroyed houses, roads, and farms |
| 1954 | Qena Governorate | 500 Houses destroyed |
| 1947 | W. Al Arish | Demolished houses, destroyed roods, and dam failure |
References
- Tingsanchali, T. Urban flood disaster management. Procedia Eng. 2012, 32, 25–37. [Google Scholar] [CrossRef]
- Pachauri, R.K.; Allen, M.R.; Barros, V.R.; Broome, J.; Cramer, W.; Christ, R.; Church, J.A.; Clarke, L.; Dahe, Q.; Dasgupta, P.; et al. Climate Change 2014: Synthesis Report. Contribution of Working Groups I, II and III to the Fifth Assessment Report of the Intergovernmental Panel on Climate Change; IPCC: Geneva, Switzerland, 2014; p. 151. [Google Scholar]
- Kaspersen, P.S.; Ravn, N.H.; Arnbjerg-Nielsen, K.; Madsen, H.; Drews, M. Comparison of the impacts of urban development and climate change on exposing european cities to pluvial flooding. Hydrol. Earth Syst. Sci. 2017, 21, 4131–4147. [Google Scholar] [CrossRef]
- Mahmood, M.I.; Elagib, N.A.; Horn, F.; Saad, S.A. Lessons learned from khartoum flash flood impacts: An integrated assessment. Sci. Total Environ. 2017, 601, 1031–1045. [Google Scholar] [CrossRef]
- Wu, X.; Wang, Z.; Guo, S.; Liao, W.; Zeng, Z.; Chen, X. Scenario-based projections of future urban inundation within a coupled hydrodynamic model framework: A case study in Dongguan city, China. J. Hydrol. 2017, 547, 428–442. [Google Scholar] [CrossRef]
- Arnone, E.; Pumo, D.; Francipane, A.; La Loggia, G.; Noto, L.V. The role of urban growth, climate change, and their interplay in altering runoff extremes. Hydrol. Process. 2018, 32, 1755–1770. [Google Scholar] [CrossRef]
- Bates, B.; Kundzewicz, Z.; Wu, S. Climate Change and Water; Intergovernmental Panel on Climate Change Secretariat: Geneva, Switzerland, 2008. [Google Scholar]
- Unisdr, C. The Human Cost of Natural Disasters: A Global Perspective; Centre for Research on the Epidemiology of Disaster: Brussels, Belgium, 2015. [Google Scholar]
- Güneralp, B.; Güneralp, İ.; Liu, Y. Changing global patterns of urban exposure to flood and drought hazards. Glob. Environ. Chang. 2015, 31, 217–225. [Google Scholar] [CrossRef]
- Gaillard, J.C.; Texier, P. Floods in jakarta: When the extreme reveals daily structural constraints and mismanagement. Disaster Prev. Manag. Int. J. 2008. [Google Scholar] [CrossRef]
- Winchester, P. Power, Choice and Vulnerability: A Case Study in Disaster Mismanagement in South India; Routledge: New York, NY, USA, 2014. [Google Scholar]
- Budd, L.; Gottdiener, M. Key Concepts in Urban Studies; Sage: California, CA, USA, 2005; pp. 4–11. [Google Scholar]
- Almalah, F. Report on the Arab Region Consultations on the Post-2015 Framework for Disaster Risk Reduction; United Nations Office for Disaster Risk Reduction—Regional Office for Arab States (UNDRR ROAS): Sharm El-shekh, Egypt, 2014. [Google Scholar]
- Ahmad, T.; Pandey, A.C.; Kumar, A. Evaluating urban growth and its implication on flood hazard and vulnerability in srinagar city, kashmir valley, using geoinformatics. Arab. J. Geosci. 2019, 12, 308. [Google Scholar] [CrossRef]
- Devi, N.N.; Sridharan, B.; Kuiry, S.N. Impact of urban sprawl on future flooding in chennai city, india. J. Hydrol. 2019, 574, 486–496. [Google Scholar] [CrossRef]
- Zhou, Q.; Leng, G.; Su, J.; Ren, Y. Comparison of urbanization and climate change impacts on urban flood volumes: Importance of urban planning and drainage adaptation. Sci. Total Environ. 2019, 658, 24–33. [Google Scholar] [CrossRef]
- Pathirana, A.; Denekew, H.B.; Veerbeek, W.; Zevenbergen, C.; Banda, A.T. Impact of urban growth-driven landuse change on microclimate and extreme precipitation—A sensitivity study. Atmos. Res. 2014, 138, 59–72. [Google Scholar] [CrossRef]
- Darabi, H.; Choubin, B.; Rahmati, O.; Haghighi, A.T.; Pradhan, B.; Kløve, B. Urban flood risk mapping using the garp and quest models: A comparative study of machine learning techniques. J. Hydrol. 2019, 569, 142–154. [Google Scholar] [CrossRef]
- Gasper, R.; Blohm, A.; Ruth, M. Social and economic impacts of climate change on the urban environment. Curr. Opin. Environ. Sustain. 2011, 3, 150–157. [Google Scholar] [CrossRef]
- Djordjević, S.; Butler, D.; Gourbesville, P.; Mark, O.; Pasche, E. New policies to deal with climate change and other drivers impacting on resilience to flooding in urban areas: The corfu approach. Environ. Sci. Policy 2011, 14, 864–873. [Google Scholar] [CrossRef]
- Liao, K.-H. A theory on urban resilience to floods—A basis for alternative planning practices. Ecol. Soc. 2012, 17. [Google Scholar] [CrossRef]
- Goonetilleke, A.; Thomas, E.; Ginn, S.; Gilbert, D. Understanding the role of land use in urban stormwater quality management. J. Environ. Manag. 2005, 74, 31–42. [Google Scholar] [CrossRef]
- Zevenbergen, C.; van Herk, S.; Rijke, J.; Kabat, P.; Bloemen, P.; Ashley, R.; Speers, A.; Gersonius, B.; Veerbeek, W. Taming global flood disasters. Lessons learned from dutch experience. Nat. Hazards 2013, 65, 1217–1225. [Google Scholar] [CrossRef]
- Vetter, T.; Huang, S.; Aich, V.; Yang, T.; Wang, X.; Krysanova, V.; Hattermann, F. Multi-model climate impact assessment and intercomparison for three large-scale river basins on three continents. Earth Syst. Dyn. 2015, 6, 17–43. [Google Scholar] [CrossRef]
- Miller, J.D.; Hutchins, M. The impacts of urbanisation and climate change on urban flooding and urban water quality: A review of the evidence concerning the United Kingdom. J. Hydrol. Reg. Stud. 2017, 12, 345–362. [Google Scholar] [CrossRef]
- Aragón-Durand, F. Urbanisation and flood vulnerability in the peri-urban interface of mexico city. Disasters 2007, 31, 477–494. [Google Scholar] [CrossRef]
- Booth, D.B. Urbanization and the Natural Drainage System-Impacts, Solutions, and Prognoses; University of Washington Water Center: Seattle, WA, USA, 1991. [Google Scholar]
- Saber, M. Hydrological Approaches of Wadi System Considering Flash Floods in Arid Regions; Kyoto University: Kyoto, Japan, 2010. [Google Scholar]
- Abdel-Fattah, M.; Saber, M.; Kantoush, S.A.; Khalil, M.F.; Sumi, T.; Sefelnasr, A.M. A hydrological and geomorphometric approach to understanding the generation of wadi flash floods. Water 2017, 9, 553. [Google Scholar] [CrossRef]
- Saber, M.; Habib, E. Flash floods modelling for wadi system: Challenges and trends. In Landscape Dynamics, Soils and Hydrological Processes in Varied Climates; Springer: Berlin, Germany, 2015; pp. 317–339. [Google Scholar]
- Abdel-Fattah, M.; Kantoush, S.A.; Saber, M.; Sumi, T. Rainfall-runoff modeling for extreme flash floods in wadi samail, oman. J. Jpn. Soc. Civ. Eng. Ser. B1 Hydraul. Eng. 2018, 74, I691–I696. [Google Scholar] [CrossRef]
- Saber, M.; Kantoush, S.; Sumi, T.; Abdel-fattah, M.; Alharrasi, T.; Koshiba, T.; Ogiso, Y.; Almamari, M. Field investigation on wadi system in arid regions: Flash flood indicators and sedimentation impacts. Disaster Prev. Res. Inst. Annu. 2018, 61, 722–731. [Google Scholar]
- Saber, M.; Yilmaz, K.K. Bias correction of satellite-based rainfall estimates for modeling flash floods in semi-arid regions: Application to karpuz river, turkey. Nat. Hazards Earth Syst. Sci. Discuss 2016, 2016, 1–35. [Google Scholar] [CrossRef]
- Sumi, T.; Saber, M.; Kantoush, S.A. Japan-egypt hydro network: Modern methodologies for integrated water resources management in egypt. J. Disaster Res. 2013, 8, 177–178. [Google Scholar]
- Merz, B.; Kreibich, H.; Thieken, A.; Schmidtke, R. Estimation uncertainty of direct monetary flood damage to buildings. Nat. Hazards Earth Syst. Sci. 2004, 4, 153–163. [Google Scholar] [CrossRef]
- Apel, H.; Aronica, G.; Kreibich, H.; Thieken, A. Flood risk analyses—How detailed do we need to be? Nat. Hazards 2009, 49, 79–98. [Google Scholar] [CrossRef]
- Förster, S.; Kuhlmann, B.; Lindenschmidt, K.-E.; Bronstert, A. Assessing Flood Risk for a Rural Detention Area. Available online: https://hal.archives-ouvertes.fr/hal-00299508/ (accessed on 9 January 2020).
- Ologunorisa, T.E. A review of the effects of gas flaring on the niger delta environment. Int. J. Sustain. Dev. World Ecol. 2001, 8, 249–255. [Google Scholar] [CrossRef]
- Abdel-Fattah, M.; Kantoush, S.; Sumi, T. Integrated management of flash flood in wadi system of egypt: Disaster prevention and water harvesting. Disas. Prev. Res. Inst. Annu. 2015, 58, 485–496. [Google Scholar]
- Mohamed, W.M.E. Planning and urban policies and mechanisms for environmental disasters. In Environmental Planning and Infrastructure; Un published: Cairo, Egypt, 2019; p. 234. [Google Scholar]
- Harvey, R.O.; Clark, W.A. The nature and economics of urban sprawl. Land Econ. 1965, 41, 1–9. [Google Scholar] [CrossRef]
- Cheng, J.; Masser, I. Urban growth pattern modeling: A case study of wuhan city, pr china. Landsc. Urban Plan. 2003, 62, 199–217. [Google Scholar] [CrossRef]
- Alhazmi, N.A.J.-R. Observing and monitoring the urban expansion of makkah al-mukarramah using the remote sensing and gis. J. Eng. Sci. Inf. Technol. 2017, 1, 103–125. [Google Scholar]
- Ayoub, A. State Land Recovery Committee. Available online: http://www.estrdad.gov.eg/Videos.aspx (accessed on 28 December 2019).
- Hilal, H. Land Recovery: The Time for Hand-Over and Encroachment on State Land Is Over. Available online: https://www.shorouknews.com/news/view.aspx?cdate=27102019&id=a5dd5114-c42f-4a08-80bc-8ef708d9c9c8 (accessed on 16 November 2019).
- Cutter, S.L.; Boruff, B.J.; Shirley, W.L. Social vulnerability to environmental hazards. Soc. Sci. Q. 2003, 84, 242–261. [Google Scholar] [CrossRef]
- Pradhan-Salike, I.; Pokharel, J.R. Impact of urbanization and climat e change on urban flooding: A case of the kathmandu valley. J. Nat. L Resour. Dev. 2017, 7, 56–66. [Google Scholar] [CrossRef]
- Sörensen, J.; Mobini, S. Pluvial, urban flood mechanisms and characteristics–assessment based on insurance claims. J. Hydrol. 2017, 555, 51–67. [Google Scholar] [CrossRef]
- Sanyal, J.; Lu, X. Application of remote sensing in flood management with special reference to monsoon asia: A review. Nat. Hazards 2004, 33, 283–301. [Google Scholar] [CrossRef]
- Mishra, A.K. A study on the occurrence of flood events over jammu and kashmir during september 2014 using satellite remote sensing. Nat. Hazards 2015, 78, 1463–1467. [Google Scholar] [CrossRef]
- Cools, J.; Vanderkimpen, P.; El Afandi, G.; Abdelkhalek, A.; Fockedey, S.; El Sammany, M.; Abdallah, G.; El Bihery, M.; Bauwens, W.; Huygens, M. An early warning system for flash floods in hyper-arid egypt. Nat. Hazards Earth Syst. Sci. 2012, 12, 443–457. [Google Scholar] [CrossRef]
- Arish Flash Floods. Available online: https://www.albawabhnews.com/2917098 (accessed on 14 November 2019).
- New Cairo Urban Floods. Available online: https://www.aljazeera.net/news/trends/2018/4/26/%D8%A3%D9%85%D8%B7%D8%A7%D8%B1-%D8%A7%D9%84%D9%82%D8%A7%D9%87%D8%B1%D8%A9-%D8%AA%D8%BA%D8%B1%D9%82-%D8%A3%D8%AD%D9%8A%D8%A7%D8%A1%D9%87%D8%A7-%D9%88%D8%AA%D9%81%D8%B6%D8%AD-%D9%85%D8%B4%D8%A7%D8%B1%D9%8A%D8%B9%D9%87%D8%A7 (accessed on 14 November 2019).
- Zhang, G.; Wu, Y.; Wang, L.; Zhang, K.; Daemen, J.J.K.; Liu, W. Time-dependent subsidence prediction model and influence factor analysis for underground gas storages in bedded salt formations. Eng. Geol. 2015, 187, 156–169. [Google Scholar] [CrossRef]
- Smith, J.; Deck, L.; McCarl, B.; Kirshen, P.; Malley, J.; Abdrabo, M. Potential Impacts of Climate Change on the Egyptian Economy, a Report Prepared for the United Nations Development Program (Undp); United Nations: Cairo, Egypt, 2013. [Google Scholar]
- Mohamed, E.S.; Saleh, A.; Belal, A. Sustainability indicators for agricultural land use based on gis spatial modeling in north of sinai-egypt. Egypt. J. Remote Sens. Space Sci. 2014, 17, 1–15. [Google Scholar] [CrossRef]
- Phien-wej, N.; Giao, P.H.; Nutalaya, P. Land subsidence in bangkok, thailand. Eng. Geol. 2006, 82, 187–201. [Google Scholar] [CrossRef]
- Baldi, P.; Casula, G.; Cenni, N.; Loddo, F.; Pesci, A. Gps-based monitoring of land subsidence in the po plain (northern italy). Earth. Planet. Sci. Lett. 2009, 288, 204–212. [Google Scholar] [CrossRef]
- Ferronato, M.; Gambolati, G.; Teatini, P.; Baù, D. Stochastic poromechanical modeling of anthropogenic land subsidence. Int. J. Solids Struct. 2006, 43, 3324–3336. [Google Scholar] [CrossRef]
- Clark, M.L.; Aide, T.M. Virtual interpretation of earth web-interface tool (view-it) for collecting land-use/land-cover reference data. Remote Sens. 2011, 3, 601–620. [Google Scholar] [CrossRef]
- Taylor, J.R.; Lovell, S.T. Mapping public and private spaces of urban agriculture in chicago through the analysis of high-resolution aerial images in google earth. Landsc. Urban Plan. 2012, 108, 57–70. [Google Scholar] [CrossRef]
- Sayama, T.; Ozawa, G.; Kawakami, T.; Nabesaka, S.; Fukami, K. Rainfall–runoff–inundation analysis of the 2010 pakistan flood in the kabul river basin. Hydrol. Sci. J. 2012, 57, 298–312. [Google Scholar] [CrossRef]
- Nastiti, K.D.; Kim, Y.; Jung, K.; An, H. The application of rainfall-runoff-inundation (RRI) model for inundation case in upper citarum watershed, west java-indonesia. Procedia Eng. 2015, 125, 166–172. [Google Scholar] [CrossRef]
- Bhagabati, S.S.; Kawasaki, A. Consideration of the rainfall-runoff-inundation (RRI) model for flood mapping in a deltaic area of myanmar. Hydrol. Res. Lett. 2017, 11, 155–160. [Google Scholar] [CrossRef]
- Abdel-Fattah, M.; Kantoush, S.; Saber, M.; Sumi, T. Hydrological modelling of flash flood at wadi samail, oman. Disas. Prev. Res. Inst. Annu. 2016, 59, 533–541. [Google Scholar]
- General Organization for Physical Planning. Preparation of the General Strategic Plan and the Detailed Plan (2027) for the City of el Arish, North Sinai 2011; General Organization for Physical Planning: Cairo, Egypt, 2011. [Google Scholar]


| Settlement | Event Date | Source | Event Rainfall (Mm/Event) |
|---|---|---|---|
| Drunka | 31st of Oct & 1st to 5th of Nov 1994 | PERSIANN-CDR | 64.5 |
| Al-Arish | 17th and 18th of January 2010 | GSMaP | 42.6 |
| Ras Gharib | 27th and 28th of October 2016 | GSMaP | 119.47 |
| Salloum | 7th and 8th of Jan 2014 | PERSIANN-CCS | 22.59 |
| 9 | 1984 | 2011 | 2015 | 2019 | Urban Growth Rate (km2/year) | Urban Growth % (1984–2019) | |
|---|---|---|---|---|---|---|---|
| Arish | Area Km2 | 5.78 | 26.11 | 35.26 | 0.84 | 609% | |
| Ras Gharib | 1.89 | 6 | 7.27 | 0.15 | 385% | ||
| Salloum | 0.36 | 2.99 | 3.23 | 0.082 | 904% | ||
| Drunka | 0.67 | 1.37 | 2.84 | 0.062 | 423% |
© 2020 by the authors. Licensee MDPI, Basel, Switzerland. This article is an open access article distributed under the terms and conditions of the Creative Commons Attribution (CC BY) license (http://creativecommons.org/licenses/by/4.0/).
Share and Cite
Saber, M.; Abdrabo, K.I.; Habiba, O.M.; Kantosh, S.A.; Sumi, T. Impacts of Triple Factors on Flash Flood Vulnerability in Egypt: Urban Growth, Extreme Climate, and Mismanagement. Geosciences 2020, 10, 24. https://doi.org/10.3390/geosciences10010024
Saber M, Abdrabo KI, Habiba OM, Kantosh SA, Sumi T. Impacts of Triple Factors on Flash Flood Vulnerability in Egypt: Urban Growth, Extreme Climate, and Mismanagement. Geosciences. 2020; 10(1):24. https://doi.org/10.3390/geosciences10010024
Chicago/Turabian StyleSaber, Mohamed, Karim I. Abdrabo, Omar M. Habiba, Sameh A. Kantosh, and Tetsuya Sumi. 2020. "Impacts of Triple Factors on Flash Flood Vulnerability in Egypt: Urban Growth, Extreme Climate, and Mismanagement" Geosciences 10, no. 1: 24. https://doi.org/10.3390/geosciences10010024
APA StyleSaber, M., Abdrabo, K. I., Habiba, O. M., Kantosh, S. A., & Sumi, T. (2020). Impacts of Triple Factors on Flash Flood Vulnerability in Egypt: Urban Growth, Extreme Climate, and Mismanagement. Geosciences, 10(1), 24. https://doi.org/10.3390/geosciences10010024