Abstract
Urban growth, extreme climate, and mismanagement are crucial controlling factors that affect flood vulnerability at wadi catchments. Therefore, this study attempts to understand the impacts of these three factors on the flash flood vulnerability in different climatic regions in Egypt. An integrated approach is presented to evaluate the urban growth from 1984 to 2019 by using Google Images and SENTINEL-2 data, and to develop hazard maps by using a rainfall-runoff-inundation model (RRI). Annual rainfall trend analysis was performed to evaluate the temporal variability trend. The hazard maps that were created were classified into three categories (low, medium, and high) and integrated with the urban growth maps to evaluate the impacts on the flood-vulnerable areas. The results show a significant increase in urban growth resulting in an increase of prone areas for flood hazards over time. However, the degree of this hazard is mainly related to growth directions. Mismanagement affects urban growth directions in both planned and unplanned growth, whether by loss of control over unplanned growth or by deficiencies in approved plans. The rainfall analysis showed that there is no explicit relationship to increases or decreases in the flood vulnerable areas. An urban planning approach is recommended for risk reduction management based on a comprehensive study considering such factors.
Keywords:
flood vulnerability; hazard maps; urban growth; mismanagement; urban flood; extreme events 1. Introduction
The trigger factors of flooding disaster impacts are not only natural, such as extreme rainfall events, high floods, and high tides, but also anthropogenic, such as land use change (LUC), deforestation in upstream regions, and urbanization [1]. Climate change and urbanization are among the various factors that contribute to increased flood disaster risks which hinder the current and future urban flood management strategies [2,3,4,5,6]. Climate change is expected to change the hydrological cycle, prompting a greater likelihood of an extreme climate, including floods and dry seasons [7]. Floods that occur in urban cities usually result in negative consequences for human lives and properties. The United Nations [8] pointed out that 43% of natural disasters that occurred from 1995 to 2015 were water-related disasters, affecting more than half (56%) of all people. Flood hazard is the probability of occurrence of an event. Its related consequences depend on the flood’s magnitude and system’s vulnerability. Additionally, vulnerability is controlled by social, economic, physical, and environmental issues [1]. The exposure of urban land to both flood and drought is likely to increase over 250% [9].
Mismanagement and lack of proper mitigation strategies for the flood disaster is one of the important factors increasing the flood risk in many regions over the world, especially in the developing countries [10,11]. Urban sprawl is associated with a range of social and environmental problems which include flooding, erosion, social isolation, health issues, the death of small farms, wildlife extinction, and lessening of natural balance [12]. The most challenging factors that increase the risk of the disasters in the Arabian countries are ineffectiveness of political action regarding the flood disaster risk reduction, deficiency of management, public awareness, and lack of funding and stakeholder assistance [13].
Several previous studies have addressed the flood impact on the built environment [14]. The importance of urban sprawl and changes in rainfall, evaluating the worst possible consequences of flooding of an urban cities, was demonstrated in [15], showing that on an average of 1.7 times per year, a greater number of buildings are exposed to flood hazard under the worst-case combined scenario as compared with the baseline scenario. A study by [16] focused on comparing the impacts of urbanization and climate change on urban runoff and flood volumes, taking into account the role of urban drainage. The research outcomes featured the significance of reassessing the performance of present and future drainage networks in adapting to the climate changing and urban improvement.
Flood hazard and urban growth have been discussed in many studies that focused on investigating the impact of urban growth-driven land use change on the extreme rainfall variability in and around cities, by means of sensitivity studies [17]. The results have exhibited that extensive urbanization can cause changes in rainfall in and around cities, and also that these changes concentrate around extreme rainfall quantities as compared with small rains. Flood hazard mapping in different regions of the world that are vulnerable to floods is discussed in [18]. The social and economic impacts of climate change on the urban environment were investigated by [19] and the results included recommendations and solutions that the government should implement to manage the urban extension [20]. Many other studies have indicated that a flood risk study should be included as part of the urban planning process [16,21], and have also stated that urbanized floodplains are human-natural systems, where climate, socioeconomic trends, built systems, and riverine processes affect flood hazards and consequent disasters.
The extensive land-use modifications accompanying urban growth have led to an increase in changes in the surface runoff [22]. As stated in the Collaborative Research on Flood Resilience in Urban Areas (CORFU) project, urban expansion plays a focal role in the evaluation of flood risk [23]. Previous studies have provided valuable insights into hydrological impacts of climate change and urbanization on a relatively large spatial scale. A study by [24] stated that land use changes and climate variability contribute equally to increases in river flooding in the Sahel zone. Other studies have reported that flood risk increases significantly by transitioning from rural to peri-urban areas and further to urban areas [25,26,27].
The quantitative assessment of urban growth effects on the flood vulnerability in arid environments is rare. In most developing countries, the flooding risk impacts are higher than in the developed countries due to a lack of knowledge, as well as mismanagement [4]. Therefore, this study focuses on examining the impacts of three factors of urban growth and extreme climates along with mismanagement on the flash flood vulnerability in arid environments such as Egypt. Four representative case studies were selected for two reasons as follows: (1) To represent the four climatic regions of Egypt and (2) the cities most exposed to flash flood events in Egypt according to Table 1 (see the Appendix A). These cities are (Al-Arish in Sinai Peninsula, Ras Gharib in the Red-Sea coast, Salloum along the Mediterranean Sea, and Drunka along the River Nile).

Table 1.
Flash flood events used for the rainfall-runoff-inundation (RRI) model.
The main objectives of this research are as follows: (1) To understand the controlling factors that increase the vulnerable flood areas in arid regions, (2) to evaluate the interrelation between the urban growth and flood vulnerability quantitatively, and (3) to propose some recommendations based on the flood hazard maps for future mitigation and adaptation strategies under nonstationary conditions. The resulting hazard maps could be useful to decision makers for better urban planning, which could reduce the risk to residents resulting from flash floods.
2. Motivation and Rationale for the Study
This study attempts to understand the triple impacts of three main factors on the flood disaster risk impacts in the urban wadi basins. The first factor is mismanagement (including lack of knowledge, missing warning systems, and mitigation of floods), the second factor is extreme climate, and the third factor is the urbanization growth (Figure 1).
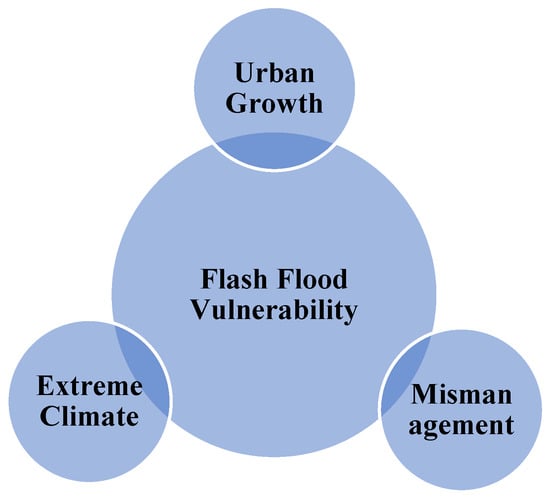
Figure 1.
Triple impacts of urban growth, extreme climate, and mismanagement on flash flood disasters.
2.1. Extreme Climate and Flash Flood Disasters
A flash flood can be generated due to a short rainfall event with high intensity and steep slopes along with impermeable soils and sparse vegetation. Flash flooding modeling in wadi catchments has been examined in many previous studies [28,29,30,31,32,33,34]. The flood risk is usually determined by the product of hazard (the statistical and physical aspects of the actual flooding along with extent and depth of inundation) and vulnerability (the exposure of people as well as assets to floods) [35,36]. It can also be described as the coupling of possible damage and flood probability [37], or more specifically, as the product of hazard and vulnerability [38].
Egypt is one of the arid and semi-arid Arabian countries that faces flash floods in the coastal and Nile wadi systems. Recently, flash floods have occurred extensively in Egypt, and several flood events have occurred in the Sinai Peninsula and Eastern Desert; Red Sea wadis such as Safaga, Ambagi, and El-Baroud; and Upper Egypt locations such as Assiut, Sohag, Qena and Aswan. Some records report that severe floods affected Egypt from 1975 to 2014 with an estimated total economic damage of approximately 1.2 billion USD/year [39]. Floods, although infrequent (two or three occurrences every decade), can be extremely damaging, and represent a threat to life as well as property. Due to climate change impacts, such threats are likely to increase. In Egypt, most of the practicable routes for highways, roads, and other infrastructures are constructed across wadi. The rapid increase of population, urbanization, economic, and touristic developments have pushed people toward construction in zones at high risk for disaster, such as on wadi flood plains.
Recently, flash floods have become more frequent, causing life losses and significant damages in Egypt. Hazardous flash floods occurred frequently in Egypt between 1947 to 2018, as shown in Table A1 [39,40]. The long-term rainfall of PERSIAN-CDR satellite rainfall data showed that the trend is increasing over all of Egypt (Figure 2).
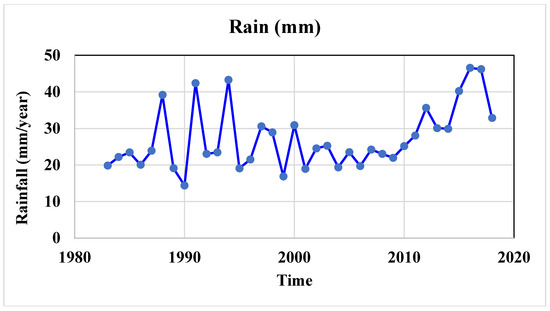
Figure 2.
Rainfall estimates from the Precipitation Estimation from Remotely Sensed Information using Artificial Neural Networks—Climate Data Record (PERSIANN-CDR) satellite data from 1983 to 2018 over Egypt, showing an increasing trend of annual rainfall over all of Egypt.
However, although there are many previous studies that have focused on the urban growth and flood disasters, the rationale behind this study is to examine the triple interrelation between mismanagement, extreme rainfall events, and urban growth in Egypt. The previous studies are still limited in Egypt due to the lack of datasets. Therefore, we raised two key questions in this research. What are the trigger factors to increase the flash flood impacts in the urbanized settlements? Which one of the three factors (increasing of rainfall events, urban growth, or mismanagement) is the main contributing factor? The answers to these questions are presented in this paper.
2.2. Urban Growth
Urban growth is a notable issue all over the world, and there are many factors that influence it, such as population increase, good prospects for livelihood, availability of facilities, and expanding expressways and highways that are responsible for rapid outgrowth in the city [41]. Roads serve as a significant catalyst in the extension of urban sprawl, and thus can be used as an extensive factor in modeling and forecasting uncontrolled expansion of urban areas [42]. The urban expansion is also the result of a combination of social factors (e.g., invasion, social mobility, and isolation) and economic factors (e.g., the movement of activities and jobs, and the change of land values in the central areas of the city).
The Egyptian urban pattern experiences rapid growth, especially in the mega cities. Urban growth patterns are divided into two main types, natural growth (“unplanned”) and planned growth [43]. On one hand, the first type, “unplanned growth” can be obviously observed in the informal areas on agricultural lands. Resulting from growing rural-to-urban migration, various societal problems within the city structure have occurred. One of the most important issues that faces the residents is high prices of land. This has led to informal growth on agricultural or desert lands owned by them or by the state, without taking into account the vulnerability of these areas to floods or any other risks. According to reports prepared by the Egyptian Ministry of Agriculture in 2010 [44], encroachments on state lands in the desert roads amounted to about 5787 km2, including 4451.5 km2 in the desert lands in Upper Egypt, 1032 km2 on the Cairo-Alexandria desert road, seventy thousand acres on the Egypt-Suez road, and 242.8 km2 along the Ismaili-Egypt road in favor of mostly residential use, followed by services use [45].
Densification has been known as a crucial factor that statistically boosts social exposure to risk [46]. The consequence is, in the case of flooding, that a relatively large number of people are possibly affected, although the location of buildings serves a fundamental role in attracting developers and people to certain areas such as riversides and coastal areas. However, not only due to their proximity to water but also because of the soil condition, these areas are usually more vulnerable to flooding [47]. Urban densification is increasing rapidly, and together with inadequate urban drainage design and aging of infrastructure, people and their property are endangered to flood risks [25,48]. On the other hand, there is the “planned” growth, where the state intervenes directly or indirectly by directing the urban construction and organization and equipping it with public utilities. In the face of many problems of indiscriminate growth, there has been a need to put an end to such growth through urban planning and legislation rules. However, due to the lack of considering the environmental aspect, especially the risk of floods, it can be said that even planned urban growth could be exposed to the risk of flooding due to the failure to take into account the environmental factors in planning, such as we have witnessed in the New Cairo 2018 flash flood events.
Several studies have been carried out to evaluate the impact of land use changes on the amount of runoffs. In addition, many authors have acknowledged the fact that increasing urban activities in flood plain areas increases peak discharge, decreases the time to peak, and increases runoff volume [49,50].
2.3. Mismanagement
The Egyptian government has adopted several measures for flash flood mitigation as a combination of storage dams, obstacle dams, artificial lakes, diversion dikes, embankments, artificial drainage channel [39] and an early warning system (EWS) for part of the Sinai Peninsula of Egypt [51]. However, in light of substantial centralization, the situation of municipalities has been exacerbated, and the role of the private sectors has become inadequate. There have been insufficient efforts made regarding prevention and reduction of disasters caused by flash and urban floods in Egypt. The governance system at the national and local levels has suffered from many deficiencies that have made it unable to provide the necessary monitoring, evaluation, transparency, or accountability mechanisms [13].
Despite the existence of the Crises Management and Disaster Risk Reduction (DRR) Sector within the Cabinet, in addition to some institutional entities at the local, ministries, and institutions levels, there is still a need for well-trained and highly qualified personnel to design plans, to predict disasters and crises, and to determine ways to deal with them. Egypt has suffered from a limited ability concerning natural disaster prevention, and its response capacity has been constrained by a highly centralized decision-making structure. The Information and Decision Support Center (IDSC) that reports to the Cabinet cannot count on significant decentralized response capacities. Recent flash flood disasters (e.g., Sinai flash floods in 2010 and Cairo flash floods in 2018) have shown that the government response has been inadequate (Figure 3). Furthermore, flood disaster losses are exacerbated by the lack of risk information and data, and the lack of resources, weakness, or unavailability of early warning systems along with fragile infrastructure increase the magnitude of disaster losses in terms of lives, livelihoods, assets, the economy, and the environment. Governance systems also affect disaster management and have a negative impact on resilience, especially with the scarcity of living options for the poor. According to the Report of the Arab Region Consultations [13], the mismanagement can be summarized as follows:
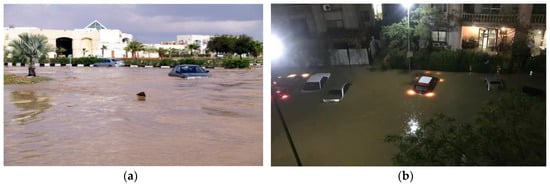
Figure 3.
The disaster impacts of the flash floods in Al-Arish city in 2010 [52] (a), and urban floods at new Cairo City 2018 [53] (b).
- Lack of specialized cadres in the central administration for the climate;
- Lack of an effective coordination mechanism ensuring the engagement of all relevant stakeholders;
- Weak participation of the civil society and the private sector;
- Lack of administrations, in many organizations, that specialize in climate changes, which leads to a lack of integration of environmental dimensions, especially in regard to climate change, into the country’s socioeconomic development plans;
- Lack of a national climate change mitigation and adaptation strategy;
- Inflexibility of legislative and administrative frameworks and weakness of funding frameworks;
- No optimum use of scientific research and technology capabilities;
- Lack of a mechanism to put into action creative and innovative ideas in the field of climate change;
- Lack of a database encompassing information on activities, researches, and studies conducted in the field of climate change and lack of a network responsible for monitoring climate change information;
- Lack of awareness and training activities targeting employees working in the field of climate change;
- Lack of societal and professional awareness about dealing with disasters, which requires more awareness programs on the importance of adherence to behaviors and regulations during a disaster to reduce overcrowding and stampedes, and adherence to planned out paths, which reduces the loss of life and property;
- Limited collaboration between the research institutes, private sectors, and governmental sectors lead to an increase in the severity of disasters;
- Lack of clear guidelines for urban planning, as well as scarcity of well-planned cities by the local government.
All of the above indicate the existence of mismanagement for natural disaster resilience in the Arab Republic of Egypt, which increases the vulnerable areas exposed to environmental risks, especially flash floods.
3. Study Area
In Egypt, about half of the yearly precipitation falls from December to March according to the World Bank Climate Change Knowledge Portal [54]. Precipitation is generally very low throughout the country, although along the Mediterranean coastline it averages more than 200 mm/year [55]. Most of Egypt is a desert and is classified as arid, except for the Mediterranean coast, which is semi-arid. There are the following four climate regions in Egypt: Nile Valley (from Cairo to Assiut, from Assiut to Edfu, and from Edfu to Nasser Lake), Eastern Desert (Red Sea Region), Sinai Peninsula (South Sinai and North Sinai), and Matrouh Governorate (Salloum Plateau). Our goal is to generalize the results for the whole country. Therefore, representative samples with different climatic regions in Egypt and the selection of case studies were conducted based on two factors, the history of hazardous flash floods (Table 1A) and climatic conditions. Accordingly, the selected cities are the city of “Ras Gharib” representing the Red Sea and Eastern Desert region, the city of “Al-Arish” representing the region of the Sinai Peninsula, “Drunka village” in Assiut governorate representing the Nile Valley and Delta region, and the city of “Salloum” that is representative of the Mediterranean region.
Ras Gharib is the second-largest city in the Red Sea Governorate and the most important Egyptian city in oil production. It is located 150 km to the north of Hurghada on the Red Sea coast (Figure 4d). Ras Gharib is considered to have a desert climate. During the year, there is virtually no rainfall, with an average of about 5 mm. The average annual temperature is about 22.2 °C.
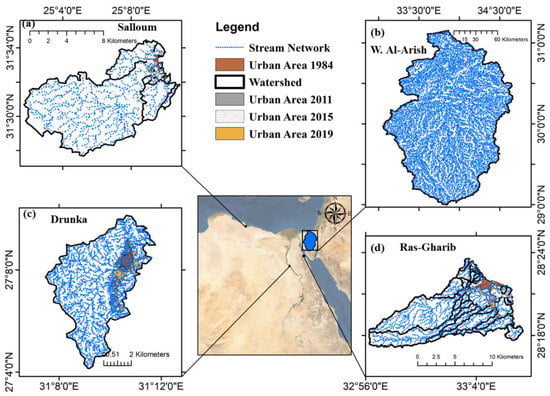
Figure 4.
Location maps showing the target cities and related wadi catchments and stream network developed from the digital elevation model (DEM) (Sentinel-2) by GIS: (a) Salloum, (b) Wadi Al-Arish, (c) Drunka, and (d) Ras Gharib.
Sinai Peninsula is located in the northeast of Egypt between latitudes 27°43′ to 29°55′ and longitude 32°39′ to 34°52′ [56]. Al-Arish (Figure 4b) is located on the coast of the Mediterranean Sea. It has a tropical climate with a rainfall average of about 3262 mm, even during the driest months. The average annual temperature is 23.8 °C [57].
Salloum is a small Egyptian border city near the western border of Egypt with Libya. It is located on the Mediterranean coast (Figure 4d). The climate in Salloum is considered a desert climate. The average annual temperature is 19.6 °C, and the average annual rainfall is 150 mm [58].
Drunka is one of the villages of Asyut Center in Asyut Governorate in Egypt (Figure 4c). The climate in Asyut is called a desert climate, with a precipitation average of about 2 mm, and the average annual temperature is 22.6 °C [59].
4. Data and Methodology
Due to the limitation of data in arid regions, we attempt to integrate different datasets to evaluate the relationship of urban growth, extreme climate, and mismanagement with flash flood vulnerability. The integrated approach and methodology consist of three main parts, the first of which is to analyze the long-term rainfall data over the selected areas to understand the variability and trend of the rainfall by using the PERSIANN-CDR satellite data from 1983 to 2018. The second part is using ArcGIS techniques to analyze historical imagery from Google Earth and satellite images from SENTINEL-2 data to produce urban growth maps at different time periods for the four sites. SENTINEL-2 is a new and high-resolution product used only for the current situation of the urban mass, but for the old urban mapping (1984 and 2015), we used Google Earth maps. Google Earth pro 7.3 maps has 30 m resolution imagery through Landsat 8 satellite which offers many important features for land-use and land-cover (LULC) mapping and their accuracy have been proven [60]. The third part is using the rainfall-runoff-inundation (RRI) model to develop the inundation hazard map based on the most extreme flash flood events. Figure 5 summarizes the research methodology to assess the impacts of urban growth and extreme climate on flash flood disasters at four settlements as representative samples for Egypt.
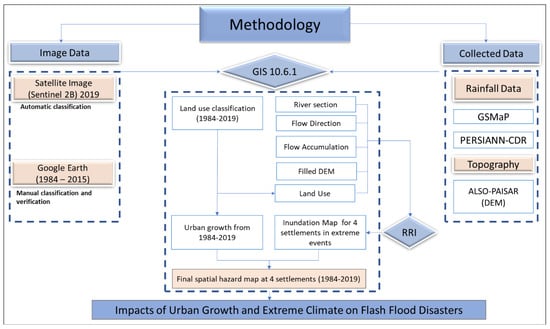
Figure 5.
Flow chart for the data processing and methods.
4.1. Urban Growth Mapping
Manual photointerpretation has the advantage of identifying real objects rather than those extracted by object-based classification approaches [60]. Many recent studies have used visual interpretation of high-resolution imagery to provide low-cost and reasonably accurate reference data, both for producing land-cover maps and testing their accuracy [61]. Therefore, we used historical images of Google Earth to develop the urban maps by using ArcGIS. The selected dates were 1984, 2005, 2019 (Ras Gharib); 1984, 2015, 2019 (Salloum); 1984, 2011, 2019 (Al-Arish); and 1984, 2011, 2019 (Drunka). For the current urban condition, we also used high-resolution images of SENTINEL-2 by using automatic classification, and we confirmed that the manual digitizing of mapping from Google Images are, in some cases, much more accurate than SENTINEL-2, which needs post-corrections of the final urban maps.
4.2. Rainfall-Runoff-Inundation Model
The rainfall-runoff-inundation (RRI) model is a two-dimensional (2D) model capable of simultaneously simulating runoff and flood inundation [61,62]. Figure 6 shows a schematic diagram of the RRI model. The model has been successfully applied to simulate flooding events with great performance in several regions in the world [62,63,64]. Moreover, the model was chosen based on its significant performance in arid regions. The model was applied to Wadi Samail in Oman [65]. It has also been applied for flash flood extreme events in the four study areas. Flash flood estimation was performed based on daily time series data due to the lack of hourly observations.
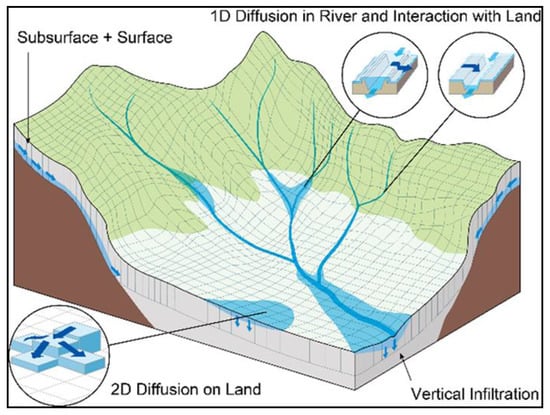
Figure 6.
Schematic diagram of the rainfall-runoff-inundation (RRI) model [62].
The rainfall data and topographic data are the most important input parameters for the RRI model. The daily rainfall intensity and distribution were obtained based on satellite data of Global Satellite Mapping of Precipitation (GSMaP) and on Precipitation Estimation from Remotely Sensed Information using Artificial Neural Networks—Climate Data Record (PERSIANN-CDR) for the events and are listed in Table 1. These extreme events were selected as the most hazardous and available events that hit the regions based on the historical records. The digital elevation model (DEM) data were obtained from ALOS-PALSAR DEM with 12.5 m resolution (reference), downloaded from Alaska Satellite Facility (ASF) Distributed Active Archive Center (DAAC). ArcGIS was used later to identify and extract the drainage features in the study areas required as inputs for the RRI model, such as flow direction, flow accumulation, stream networks, and watershed delineation. The land cover map was made based on the Google Earth satellite image and SENTINEL-2 satellite data. The parameters were chosen based on the parameters used in the RRI model, calibrated and validated for Wadi Samail in Oman [65].
5. Results and Discussions
5.1. Rainfall Trend Analysis
Long-term rainfall data of PERSIANN-CDR was used to determine the trend of increasing or decreasing annual rainfall over the four study areas. At Al-Arish, there is a noticeable declining trend from 1983 to 2019 at a regression linear rate of 1.6859 mm/year (Figure 7a). The annual rainfall shows a slight increase from 1983 to 2019 by 0.937 mm/year at the city of Salloum (Figure 7b). In Ras Gharib, there is an insignificant increasing trend from 1983 to 2019 at a rate of 0.12 mm/year (Figure 7c). The analysis also shows a remarkable increase from 1983 to 2019 at a rate of 1.306 mm/year observed at the village of Drunka, Assiut City (Figure 7d). The results agree with the reports and previous studies conducted by our research group that reported that the extreme events of flash floods recently became more frequent and devastating. Such increasing trends are not only recorded in these four selected areas, but also observed over all of Egypt (Figure 3). The spatial average of the rainfall at the different study areas was highly variable (Figure 8).
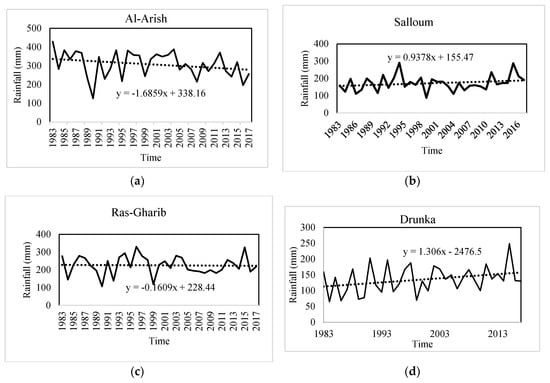
Figure 7.
The trend analysis of the annual rainfall data from 1983 to 2018 using the PERSSIAN-CDR long-term rainfall data over the four selected regions (a–d).
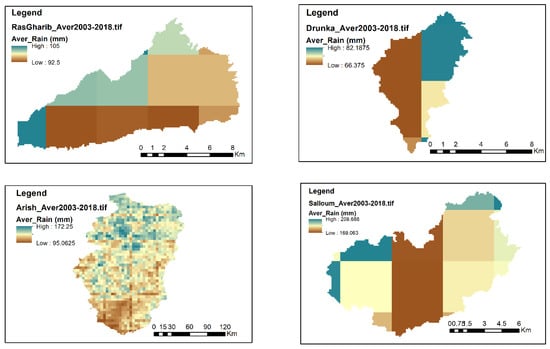
Figure 8.
Spatial map showing the total rainfall average (2003 to 2018) using the PERSSIAN-CDR long-term rainfall data over the four selected regions and Egypt.
5.2. Assessment of Urban Growth from 1984 to 2019
The urban growth maps were developed by processing SENTINEL-2 data and Google Images (Figure 9 and Figure 10) over time from 1984 to 2019. The results showed a remarkable increase in the total urban mass over the four settlements.
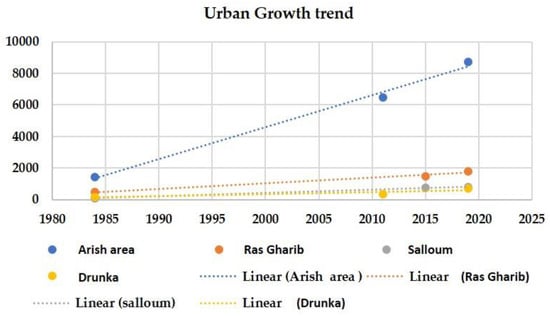
Figure 9.
The urban growth changes over the time from 1984 to 2019.
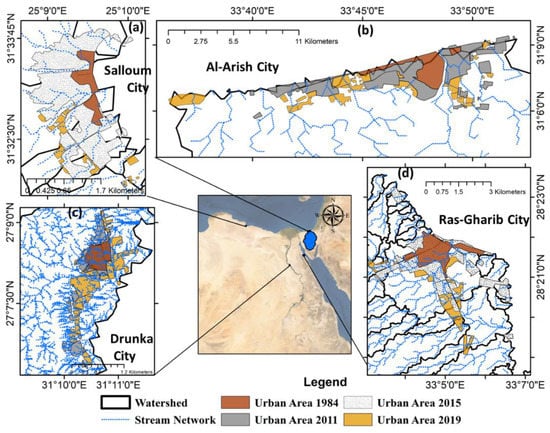
Figure 10.
Spatial maps of urbanization extension at four cities at different time periods from 1984 to 2019.
The total urban mass of the city of Al-Arish in 1984 was 5.78 km2, while in 2011 it amounted to about 26.11 km2, an increase of up to 35.26 km2, equivalent to 186 acres/year, while the total urban mass of the city in 2019 was 35.26 km2 with an increase of about 9.15 km2 for the year 2011 and a growth rate of 1.14 km2/year. The average growth rate of the urban mass from 1984 to 2019 was about 0.84 km2/year, and the mass increased by 609% during the same period.
The results of urban growth maps showed that the urban mass of the city of Salloum totaled 0.537 km2 in 1984, while in 2015 it reached about 2.99 km2, an increase of up to 2.639 km2, equivalent to 0.085 km2/year, while the total urban mass of the city in 2019 reached 3.23 km2 with an increase of about 0.23 km2 in 2015 and a growth rate of 0.058 km2/year. The average growth rate of the urban mass from 1984 to 2019 was about 0.08 km2/year, and the urban mass increased by 904% during the same period.
The total urban mass of Ras Gharib in 1984 reached 1.89 km2, while in 2015 it reached about 6.0 km2 with an increase of 3.92 km2, equivalent to 0.187 km2/year. The total urban mass of the city in 2019 reached 7.27 km2 with an increase of about 1.45 km2 since 2015 and a growth rate of 0.36 km2/year. The average growth rate of the urban mass from 1984 to 2019 was about 0.15 km2/year, and the urban mass increased by 385% during the same period.
The total urban mass of the village of Drunka was 0.67km2 in 1984, while the total urban mass of the city in 2011 reached 1.37 km2, an increase of 0.7 km2. The total urban mass in 2019 reached 2.84 km2, an increase of about 1.47 km2 from 2011 with a growth rate of 0.183 km2/year. The average growth rate of the urban mass from 1984 to 2019 was about 0.062 km2/year, and the urban mass increased by 423% during the same period (Table 2).

Table 2.
The urban growth changes over the time from 1984 to 2019.
5.3. Flood Inundation Mapping
The RRI model was used to simulate the most hazardous and extreme events at the different cities, Ras Gharib, Salloum, Drunka, and Al-Arish. The main outcomes of the model were inundation maps, which we followed to classify the hazard based on the inundation depth to three levels (high, medium, and low) and, then, these levels were compared with the affected urban areas to evaluate the relationship with the urban growth.
The results and discussion for each city are listed as follows:
5.3.1. Ras Gharib
The results showed that the percentage of the area exposed to flood hazard in all categories from 1984 to 2019 has increased. The area affected by the low hazard increased by 586% between 1984 and 2015, while in 2019 it was 807% higher than in 1984. The affected areas exposed to the medium hazard increased by 352% between 1984 and 2015, while this ratio reached 429% in 2019 as compared to in 1984, and the exposed area to high risk increased by 305% in the period between 1984 and 2015 and 353% in 2019 as compared to in 1984, as shown in Figure 11.
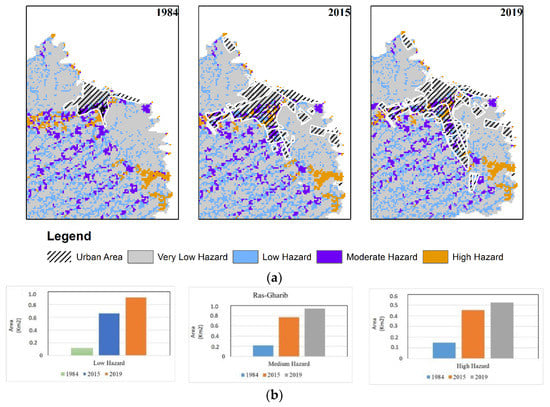
Figure 11.
Inundation maps showing the hazard levels affecting the urban areas (a) and estimates of the vulnerable areas for flood hazard categories (b) over time from 1984 to 2019 in Ras Gharib.
We found a remarkable increase in the percentage of areas exposed to low risk of the total urban cluster over time, which reached 23.58% in 1984, 35.2% in 2015, and 38.49% in 2019, which is consistent with the increase in the percentage of exposed areas. The percentage of areas exposed to medium risk of total urban mass decreased from 45.53% in 1984 to 40.79% in 2015 and, then, to 39.47% in 2019. Likewise, the percentage of high-risk areas decreased from 30.89% in 1984 to 24.02% in 2015 and then to 22.04% in 2019, as shown in Figure 12. In 2015 and 2019, urban growth expanded more toward medium and high hazard areas than low hazard areas.

Figure 12.
The exposed percentage areas for the flood hazard levels over time from 1984 to 2019.
5.3.2. Salloum
The results showed that the percentage of exposed areas to flood inundation hazard increased in Salloum from 1984 to 2019. The area exposed to the low hazard increased by 825% between 1984 and 2015, while in 2019 it was 867%. The percentage of exposed urban areas to medium hazard increased by 500% between 1984 and 2015, and the same percentage has been established in 2019, which indicates that the areas exposed to medium risk have not increased in the period from 2015 to 2019, as shown in Figure 13 and Figure 14. The maps also showed the urban area was not exposed to high hazard in 1984, and covered a total area of about 0.0178 km2 in 2015, while no change occurred in high hazard-vulnerable areas from 2015 to 2019.
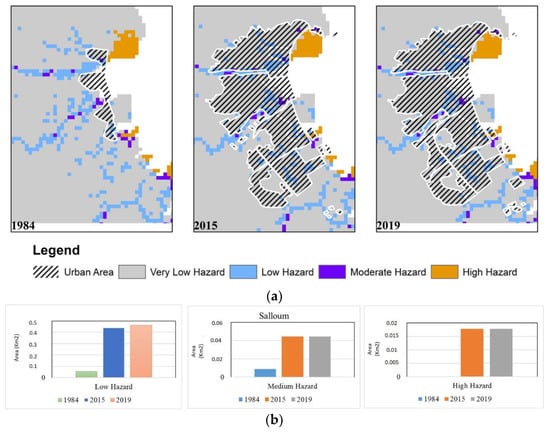
Figure 13.
Inundation maps showing the hazard levels affecting the urban areas (a) and estimates of the vulnerable areas for flood hazard categories (b) over time from 1984 to 2019 in Salloum.

Figure 14.
The exposed percentage areas for the flood hazard levels over time from 1984 to 2019 in Salloum.
A slight increase was recorded in the percentage of areas exposed to both low and high hazard by 2% to 4%, but there was a decrease in the same rate in the areas exposed to medium hazard of the total urban cluster over time, where this ratio of low hazard areas reached 85.71% in 1984, 87.61% in 2015, and 88.14% in 2019. The areas exposed to medium hazard were 14.29% in 1984 and decreased to about 8.85% in 2015 and, then, decreased again by a small amount to 8.47% in 2019, while the proportion of high hazard areas increased from 0% in 2014 to 3.54% in 2015 and, then, decreased slightly to 3.39% in 2019, as shown in Figure 14. The urban growth was toward the three levels of hazards, where some of these areas came under the threat of high hazard only from 2015 to 2019.
5.3.3. Drunka
The results illustrated that the percentage of areas exposed to the flood hazard increased at Drunka over time from 1984 to 2019. The area affected by the low hazard increased about 147% from 1984 to 2011, while this percentage reached 907% from 1984 to 2019, which indicates that the high urban growth rate was in this period from 2011 to 2019. The integrated map of inundation and urban growth showed that the areas exposed to medium hazard were about 0.0077 km2 and 0.1 km2 in 2011 and 2019, respectively. These areas were not recorded in the urban map of 1984, revealing that the urban areas expanded to the hazard areas. Additionally, new urban areas appeared in the high hazard level in 2019 with a surface area of about 0.003 km2 (Figure 15).
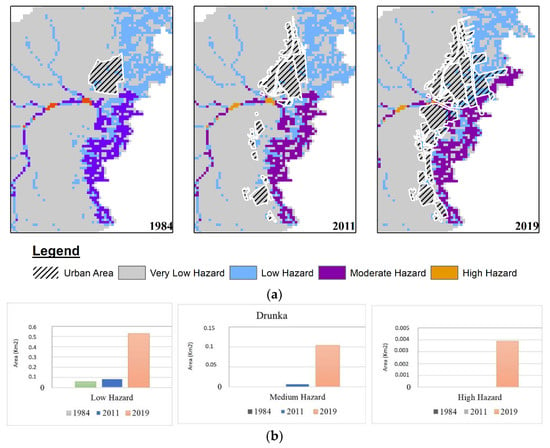
Figure 15.
Inundation maps showing the hazard levels affecting the urban areas (a) and estimates of the vulnerable areas for flood hazard categories (b) over time from 1984 to 2019 in Drunka.
The percentage of areas exposed to medium and high hazard increased by 8% to 16%, while a declining rate was observed for the low hazard areas from the total urban cluster. In 1984, the whole urban area was at only low hazard, but in 2011 and 2019, the urban area increased, with emerging impacts of medium and high hazards. The rate in 2011 was 8% and increased to 16% in 2019 for medium hazard areas, while the percentage of high hazard areas increased from 0% between 1984 and 2011 to 1% in 2019, indicating that urban growth was toward medium- and high-risk areas (Figure 15 and Figure 16).

Figure 16.
The exposed percentage areas for the flood hazard levels over time from 1984 to 2019 in Drunka.
5.3.4. Al-Arish
All urban areas exposed to hazard increased in Al-Arish. For instance, the area affected by low hazard increased by 505% from 1984 to 2011, and by 627% from 1984 to 2019. The percentage of exposed areas to medium hazard increased very significantly (about 2900%) from 1984 to 2011, while this ratio reached 6500% in 2019, which reveals the potential of rapid urban growth in the period from 1984 to 2019 toward the vulnerable areas for flood hazard. Due to the urban growth over time, newly exposed areas to high hazard with a total area of about 2.17 km2 appeared in 2011, increasing about 174% in 2019. This implies that most of the urban growth was expanding toward the medium and high hazard areas (Figure 17 and Figure 18).
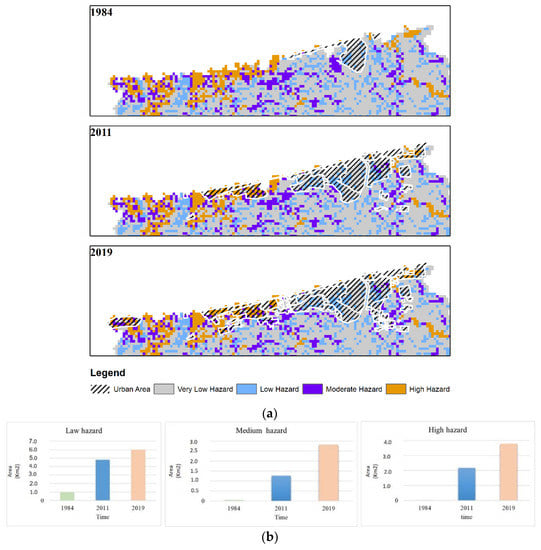
Figure 17.
Inundation maps showing the hazard levels affecting the urban areas (a) and estimates of the vulnerable areas for flood hazard categories (b) over time from 1984 to 2019 in Al-Arish.

Figure 18.
The percentage of exposed areas for the flood hazard levels over time from 1984 to 2019 in Drunka.
Along with the urban growth over time, there are also variations in the hazard categories over the area. A remarkable decrease of about 48% in the percentage of areas exposed to low hazard was recorded, associated with an increase in exposed areas to medium and high hazard over time, where the percentage of areas exposed was 96% in 1984, 58% in 2011, and 48% in 2019. The medium hazard increased from 4% in 1984, to 15% and 22% in 2011 and 2019, respectively. The high hazard areas increased from 0% in 1984, to 26% in 2011, and 30% in 2019. What is important here is that the urban growth is dramatically increasing, and the exposed area for the medium and high risk is increasing as well by 52% of the total urban mass (Figure 18).
5.4. Assessment and Evaluation of the Triple Impacts
The urban mass of the four cities (Al-Arish, Ras Gharib, Salloum, and Drunka) increased dramatically in 2019 as compared to in 1984, by about six times (609%), 3.85 times (385%), nine times (904%), and four times (423%), with an average urban growth rate of about 0.84, 0.15, 0.082, and 0.062 km2/year, respectively.
The final results of the three elements of rainfall, urban growth, and mismanagement are integrated and discussed to determine their relationship to the urban areas exposed to the flood hazard. We found that rainfall cannot be considered as the main factor for changing the areas exposed to hazard, as rainfall over time from 1983 to 2018 was highly variable. On the one hand, the results of the trend analysis showed that, although the annual rainfall is decreasing in Al-Arish and Ras Gharib with an average rate of about 1.6 mm and 0.1 mm, respectively, the areas exposed to medium and low hazard is increasing over time in Al-Arish but decreasing in Ras Gharib. To explain, despite the annual rainfall declining, the flash flood disasters became more hazardous due to the urban growth. On the other hand, the annual rainfall was increasing in Drunka and Salloum at rates of about 1.3 mm and 0.93 mm, respectively, and the areas exposed to medium and high hazard increased with time in Drunka. Conversely, in Salloum, the areas exposed to medium and high hazard are declining continuously over time. Therefore, the study stated that the rainfall frequency and intensity are not the only controlling factors for increasing or decreasing the flood hazard in the urban areas.
This study shows that the percentage of areas exposed to the flood hazard is directly proportional to the growth rate in the urban mass in all case studies. Interestingly, we found that the directions of urban growth affect the hazard category. For example, the growth of the urban mass in Ras Gharib is close to the rates in the village of Drunka. However, the percentage of areas exposed to medium and high hazard is low in Ras Gharib, but high in Drunka. This finding means that the urban growth could contribute to increasing or decreasing the flood hazard depending mainly on two factors, namely the size of the urban growth and the direction of this growth.
This study shows that there is mismanagement affecting the size and degree of areas vulnerable to the flood hazard from two main sides, i.e., loss of control over unplanned growth and deficiencies in approved plans. As a proof for losing control over the growth, see the random extensions on agricultural land and areas exposed to medium and high hazard in Drunka. The proof for the second case is that, despite the existence of strategic and detailed plans authorized by the government for Al-Arish until 2027 (Figure 19), the vulnerable areas for the medium and high hazard have increased by almost 48% in 2019 as compared to in 1984. This confirms the mismanagement impacts on increasing the flood hazard, especially in developing countries.
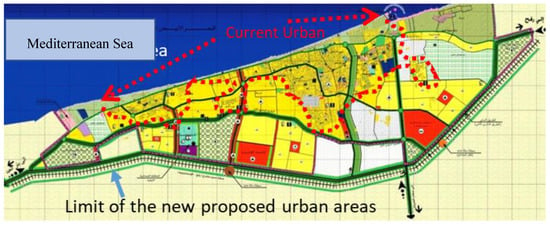
Figure 19.
General strategic plan of 2027 for proposed future urbanization area for the city of Al-Arish, North Sinai-2011 [66].
6. Conclusions
This study aimed to understand the linkage between three main factors (urban growth, extreme climate, and mismanagement) on the exposed area of flood hazards in several sites in Egypt. The research methodology consists of the followingthree main parts: (1) Rainfall analysis using the available long-term PERSIANN-CDR data, to understand the linear trend of the rainfall over the study areas; (2) urban growth mapping by using Google Images, SENTINEL-2, and higher-resolution images to analyze the urban change over time from 1984 to 2019 by using ArcGIS techniques; and (3) rainfall-runoff-inundation modeling by using the RRI model for the most hazardous and extreme events that hit the selected four settlements (Al-Arish, Ras Gharib, Salloum, and Drunka) to produce the hazard inundation maps. The main challenges in this study are the lack of observational data for the flood inundation and flow discharges and the lack of high-resolution images for the historical urban maps. The results of the triple factors are integrated and discussed with the following summary of the outcomes and findings:
- The results show a significant increase in the urban growth resulting in an increase of the areas prone to flood hazard within the period from 1984 to 2019;
- The urban growth could contribute to increasing or decreasing the flood hazard depending on two factors, namely the size of the urban growth and the direction of this growth;
- The rainfall trend variability is not the only controlling factor increasing or decreasing the areas vulnerable to flood hazard in the urban regions. In addition, there is no clear relationship between the rainfall and the flood-vulnerable areas in the four areas, revealing that the areas prone to flooding were not significantly affected by the difference in rainfall intensity and frequency as much as by the size of urban growth;
- There is mismanagement affecting the size and type of vulnerable areas to the flood hazard from two main sides, i.e., loss of control over unplanned growth and deficiencies in approved plans resulting from neglecting the flood hazard layer in planning.
On the basis of findings from this study, a basic solution is recommended to decision makers at the national level for the problem of increasing areas vulnerable to the risk of floods due to the increase of urban growth and its direction towards hazard areas. Ensuring that any new roads (the main factor for guiding urban growth direction) are built away from hazard areas will help to avoid the risk areas for both planned and unplanned urban growth. This could be a first step of risk reduction, especially for those living in areas at risk from flash flooding. It is essential to have an integrated urban planning approach to reduce the impact of floods by creating a more concrete relationship between the natural and built environments, improving the population’s quality of life. It is also crucial to develop maps of vulnerable areas for flash floods based on a solid integrated and multidisciplinary vulnerability index used for preparation of urban plans in developing countries, especially Egypt. The findings from this study would be useful to urban planners and government officials to help them make informed decisions on urban development to benefit the community, especially those living in areas vulnerable to flash flooding.
Author Contributions
M.S. and K.I.A. developed the approach, conducted the analysis, and wrote the manuscript; O.M.H. conducting the simulation of rainfall-runoff modeling; M.S., K.I.A., O.M.H., S.A.K., and T.S. contributed to the discussion of the results and writing the manuscript. All authors have read and agreed to the published version of the manuscript.
Funding
This research was funded by the International Collaborative Research, grant number 30W-01, and the General Collaborative Research, grant number 30A-01, internal funds of the Disaster Prevention Research Institute (DPRI) at the Kyoto University, Japan. Additionally, the research was funded by the Egyptian governmental scholarship from the high education ministry for K.A.
Conflicts of Interest
The authors declare no conflict of interest.
Appendix A

Table A1.
The historical records of the hazardous flash floods that hit Egypt [39,40].
Table A1.
The historical records of the hazardous flash floods that hit Egypt [39,40].
| Date | Affected Area | Recorded Damages |
|---|---|---|
| October 2019 | Cairo, Alexandria, meet Ghamr and new Cairo | 12 Deaths, road damages |
| April 2018 | Al ain Alshokhna, Fifth settlement “New Cairo” | Road damage, damaged vehicles, 10 million EGP loss |
| October 2016 | Ras sedr, Sharm Elshekh, Hurghada, and Qena | Road damage, water pipe damage |
| 2015 | Assuit, Sohag, Qena, Luxor, and Aswan | Destroyed houses |
| 2015 | Alexandria, Al-bhera, and Matrouh Governorates | 35 Deaths, 180 destroyed houses, dozens injured thousands of acres drowned |
| February, October 2015 | North and south of Sinai, Red Sea region | Road damages, loading and unloading area of Hurghada International Airport drowned |
| March, May 2014 | Taba, Sohag, Aswan, Kom Ombo | Dam failure at Sohag, road damages |
| 2013 | South Sanai & Sohag, and Assuit | 2 Deaths, road damage, 750 million EGP loss |
| 2012 | W. Dahab, Catherine area | Dam failure, destroyed houses |
| January 2010 | Aswan, Sinai, and Al Arish | 8 Deaths, 1381 damaged houses, roads and infrastructure |
| 2009 | Along the Red Sea coast, Aswan, Sinai | 12 Deaths, damaged houses and roads and 37 injuries |
| October 2004 | W. Watier | Road damage |
| May 1997 | Safaga, El-Qusier | 200 Deaths, destroy roads, demolished houses damaged vehicles |
| November 1996 | Hurghada, Marsa Alam | |
| September, November 1994 | Dhab, Sohage, Qena, Safaga, El-Qusier | |
| March, August 1991 | Marsa Alam, W. Aawag | 3200 Destroyed houses |
| October 1990 | W. El-Gemal, Marsa Alam | |
| January 1988 | W. Sudr | 5 Deaths |
| October 1987 | South Sanai | 1 Death, roads damage, 27 injuries |
| 1985 | Qena Governorate | 32 Deaths, dam failure |
| February 1982 | South Giza | Demolished 180 houses |
| April 1981 | Aswan Governorate | Roads damage and demolished houses |
| February, November, and December 1980 | Aswan Governorate, W. Elarish, Qena And Sohag | Roads damage, demolished houses and farms |
| May, October 1979 | Aswan, Kom Ombo, Idfu, Assiut, Marsa Alam, El-Qusier | 5619 Deaths, demolished houses |
| 1975 | Minia, Assuit, and Sohag | Drowning of 10 villages, 180 houses destroyed, and 1500 citizens displaced. |
| February 1975 | W. El-Arish | 17 Deaths, road problems, and 200 houses destroyed |
| 1972 | Giza | Destroyed houses, roads, and farms |
| 1954 | Qena Governorate | 500 Houses destroyed |
| 1947 | W. Al Arish | Demolished houses, destroyed roods, and dam failure |
References
- Tingsanchali, T. Urban flood disaster management. Procedia Eng. 2012, 32, 25–37. [Google Scholar] [CrossRef]
- Pachauri, R.K.; Allen, M.R.; Barros, V.R.; Broome, J.; Cramer, W.; Christ, R.; Church, J.A.; Clarke, L.; Dahe, Q.; Dasgupta, P.; et al. Climate Change 2014: Synthesis Report. Contribution of Working Groups I, II and III to the Fifth Assessment Report of the Intergovernmental Panel on Climate Change; IPCC: Geneva, Switzerland, 2014; p. 151. [Google Scholar]
- Kaspersen, P.S.; Ravn, N.H.; Arnbjerg-Nielsen, K.; Madsen, H.; Drews, M. Comparison of the impacts of urban development and climate change on exposing european cities to pluvial flooding. Hydrol. Earth Syst. Sci. 2017, 21, 4131–4147. [Google Scholar] [CrossRef]
- Mahmood, M.I.; Elagib, N.A.; Horn, F.; Saad, S.A. Lessons learned from khartoum flash flood impacts: An integrated assessment. Sci. Total Environ. 2017, 601, 1031–1045. [Google Scholar] [CrossRef]
- Wu, X.; Wang, Z.; Guo, S.; Liao, W.; Zeng, Z.; Chen, X. Scenario-based projections of future urban inundation within a coupled hydrodynamic model framework: A case study in Dongguan city, China. J. Hydrol. 2017, 547, 428–442. [Google Scholar] [CrossRef]
- Arnone, E.; Pumo, D.; Francipane, A.; La Loggia, G.; Noto, L.V. The role of urban growth, climate change, and their interplay in altering runoff extremes. Hydrol. Process. 2018, 32, 1755–1770. [Google Scholar] [CrossRef]
- Bates, B.; Kundzewicz, Z.; Wu, S. Climate Change and Water; Intergovernmental Panel on Climate Change Secretariat: Geneva, Switzerland, 2008. [Google Scholar]
- Unisdr, C. The Human Cost of Natural Disasters: A Global Perspective; Centre for Research on the Epidemiology of Disaster: Brussels, Belgium, 2015. [Google Scholar]
- Güneralp, B.; Güneralp, İ.; Liu, Y. Changing global patterns of urban exposure to flood and drought hazards. Glob. Environ. Chang. 2015, 31, 217–225. [Google Scholar] [CrossRef]
- Gaillard, J.C.; Texier, P. Floods in jakarta: When the extreme reveals daily structural constraints and mismanagement. Disaster Prev. Manag. Int. J. 2008. [Google Scholar] [CrossRef]
- Winchester, P. Power, Choice and Vulnerability: A Case Study in Disaster Mismanagement in South India; Routledge: New York, NY, USA, 2014. [Google Scholar]
- Budd, L.; Gottdiener, M. Key Concepts in Urban Studies; Sage: California, CA, USA, 2005; pp. 4–11. [Google Scholar]
- Almalah, F. Report on the Arab Region Consultations on the Post-2015 Framework for Disaster Risk Reduction; United Nations Office for Disaster Risk Reduction—Regional Office for Arab States (UNDRR ROAS): Sharm El-shekh, Egypt, 2014. [Google Scholar]
- Ahmad, T.; Pandey, A.C.; Kumar, A. Evaluating urban growth and its implication on flood hazard and vulnerability in srinagar city, kashmir valley, using geoinformatics. Arab. J. Geosci. 2019, 12, 308. [Google Scholar] [CrossRef]
- Devi, N.N.; Sridharan, B.; Kuiry, S.N. Impact of urban sprawl on future flooding in chennai city, india. J. Hydrol. 2019, 574, 486–496. [Google Scholar] [CrossRef]
- Zhou, Q.; Leng, G.; Su, J.; Ren, Y. Comparison of urbanization and climate change impacts on urban flood volumes: Importance of urban planning and drainage adaptation. Sci. Total Environ. 2019, 658, 24–33. [Google Scholar] [CrossRef]
- Pathirana, A.; Denekew, H.B.; Veerbeek, W.; Zevenbergen, C.; Banda, A.T. Impact of urban growth-driven landuse change on microclimate and extreme precipitation—A sensitivity study. Atmos. Res. 2014, 138, 59–72. [Google Scholar] [CrossRef]
- Darabi, H.; Choubin, B.; Rahmati, O.; Haghighi, A.T.; Pradhan, B.; Kløve, B. Urban flood risk mapping using the garp and quest models: A comparative study of machine learning techniques. J. Hydrol. 2019, 569, 142–154. [Google Scholar] [CrossRef]
- Gasper, R.; Blohm, A.; Ruth, M. Social and economic impacts of climate change on the urban environment. Curr. Opin. Environ. Sustain. 2011, 3, 150–157. [Google Scholar] [CrossRef]
- Djordjević, S.; Butler, D.; Gourbesville, P.; Mark, O.; Pasche, E. New policies to deal with climate change and other drivers impacting on resilience to flooding in urban areas: The corfu approach. Environ. Sci. Policy 2011, 14, 864–873. [Google Scholar] [CrossRef]
- Liao, K.-H. A theory on urban resilience to floods—A basis for alternative planning practices. Ecol. Soc. 2012, 17. [Google Scholar] [CrossRef]
- Goonetilleke, A.; Thomas, E.; Ginn, S.; Gilbert, D. Understanding the role of land use in urban stormwater quality management. J. Environ. Manag. 2005, 74, 31–42. [Google Scholar] [CrossRef]
- Zevenbergen, C.; van Herk, S.; Rijke, J.; Kabat, P.; Bloemen, P.; Ashley, R.; Speers, A.; Gersonius, B.; Veerbeek, W. Taming global flood disasters. Lessons learned from dutch experience. Nat. Hazards 2013, 65, 1217–1225. [Google Scholar] [CrossRef]
- Vetter, T.; Huang, S.; Aich, V.; Yang, T.; Wang, X.; Krysanova, V.; Hattermann, F. Multi-model climate impact assessment and intercomparison for three large-scale river basins on three continents. Earth Syst. Dyn. 2015, 6, 17–43. [Google Scholar] [CrossRef]
- Miller, J.D.; Hutchins, M. The impacts of urbanisation and climate change on urban flooding and urban water quality: A review of the evidence concerning the United Kingdom. J. Hydrol. Reg. Stud. 2017, 12, 345–362. [Google Scholar] [CrossRef]
- Aragón-Durand, F. Urbanisation and flood vulnerability in the peri-urban interface of mexico city. Disasters 2007, 31, 477–494. [Google Scholar] [CrossRef]
- Booth, D.B. Urbanization and the Natural Drainage System-Impacts, Solutions, and Prognoses; University of Washington Water Center: Seattle, WA, USA, 1991. [Google Scholar]
- Saber, M. Hydrological Approaches of Wadi System Considering Flash Floods in Arid Regions; Kyoto University: Kyoto, Japan, 2010. [Google Scholar]
- Abdel-Fattah, M.; Saber, M.; Kantoush, S.A.; Khalil, M.F.; Sumi, T.; Sefelnasr, A.M. A hydrological and geomorphometric approach to understanding the generation of wadi flash floods. Water 2017, 9, 553. [Google Scholar] [CrossRef]
- Saber, M.; Habib, E. Flash floods modelling for wadi system: Challenges and trends. In Landscape Dynamics, Soils and Hydrological Processes in Varied Climates; Springer: Berlin, Germany, 2015; pp. 317–339. [Google Scholar]
- Abdel-Fattah, M.; Kantoush, S.A.; Saber, M.; Sumi, T. Rainfall-runoff modeling for extreme flash floods in wadi samail, oman. J. Jpn. Soc. Civ. Eng. Ser. B1 Hydraul. Eng. 2018, 74, I691–I696. [Google Scholar] [CrossRef]
- Saber, M.; Kantoush, S.; Sumi, T.; Abdel-fattah, M.; Alharrasi, T.; Koshiba, T.; Ogiso, Y.; Almamari, M. Field investigation on wadi system in arid regions: Flash flood indicators and sedimentation impacts. Disaster Prev. Res. Inst. Annu. 2018, 61, 722–731. [Google Scholar]
- Saber, M.; Yilmaz, K.K. Bias correction of satellite-based rainfall estimates for modeling flash floods in semi-arid regions: Application to karpuz river, turkey. Nat. Hazards Earth Syst. Sci. Discuss 2016, 2016, 1–35. [Google Scholar] [CrossRef]
- Sumi, T.; Saber, M.; Kantoush, S.A. Japan-egypt hydro network: Modern methodologies for integrated water resources management in egypt. J. Disaster Res. 2013, 8, 177–178. [Google Scholar]
- Merz, B.; Kreibich, H.; Thieken, A.; Schmidtke, R. Estimation uncertainty of direct monetary flood damage to buildings. Nat. Hazards Earth Syst. Sci. 2004, 4, 153–163. [Google Scholar] [CrossRef]
- Apel, H.; Aronica, G.; Kreibich, H.; Thieken, A. Flood risk analyses—How detailed do we need to be? Nat. Hazards 2009, 49, 79–98. [Google Scholar] [CrossRef]
- Förster, S.; Kuhlmann, B.; Lindenschmidt, K.-E.; Bronstert, A. Assessing Flood Risk for a Rural Detention Area. Available online: https://hal.archives-ouvertes.fr/hal-00299508/ (accessed on 9 January 2020).
- Ologunorisa, T.E. A review of the effects of gas flaring on the niger delta environment. Int. J. Sustain. Dev. World Ecol. 2001, 8, 249–255. [Google Scholar] [CrossRef]
- Abdel-Fattah, M.; Kantoush, S.; Sumi, T. Integrated management of flash flood in wadi system of egypt: Disaster prevention and water harvesting. Disas. Prev. Res. Inst. Annu. 2015, 58, 485–496. [Google Scholar]
- Mohamed, W.M.E. Planning and urban policies and mechanisms for environmental disasters. In Environmental Planning and Infrastructure; Un published: Cairo, Egypt, 2019; p. 234. [Google Scholar]
- Harvey, R.O.; Clark, W.A. The nature and economics of urban sprawl. Land Econ. 1965, 41, 1–9. [Google Scholar] [CrossRef]
- Cheng, J.; Masser, I. Urban growth pattern modeling: A case study of wuhan city, pr china. Landsc. Urban Plan. 2003, 62, 199–217. [Google Scholar] [CrossRef]
- Alhazmi, N.A.J.-R. Observing and monitoring the urban expansion of makkah al-mukarramah using the remote sensing and gis. J. Eng. Sci. Inf. Technol. 2017, 1, 103–125. [Google Scholar]
- Ayoub, A. State Land Recovery Committee. Available online: http://www.estrdad.gov.eg/Videos.aspx (accessed on 28 December 2019).
- Hilal, H. Land Recovery: The Time for Hand-Over and Encroachment on State Land Is Over. Available online: https://www.shorouknews.com/news/view.aspx?cdate=27102019&id=a5dd5114-c42f-4a08-80bc-8ef708d9c9c8 (accessed on 16 November 2019).
- Cutter, S.L.; Boruff, B.J.; Shirley, W.L. Social vulnerability to environmental hazards. Soc. Sci. Q. 2003, 84, 242–261. [Google Scholar] [CrossRef]
- Pradhan-Salike, I.; Pokharel, J.R. Impact of urbanization and climat e change on urban flooding: A case of the kathmandu valley. J. Nat. L Resour. Dev. 2017, 7, 56–66. [Google Scholar] [CrossRef]
- Sörensen, J.; Mobini, S. Pluvial, urban flood mechanisms and characteristics–assessment based on insurance claims. J. Hydrol. 2017, 555, 51–67. [Google Scholar] [CrossRef]
- Sanyal, J.; Lu, X. Application of remote sensing in flood management with special reference to monsoon asia: A review. Nat. Hazards 2004, 33, 283–301. [Google Scholar] [CrossRef]
- Mishra, A.K. A study on the occurrence of flood events over jammu and kashmir during september 2014 using satellite remote sensing. Nat. Hazards 2015, 78, 1463–1467. [Google Scholar] [CrossRef]
- Cools, J.; Vanderkimpen, P.; El Afandi, G.; Abdelkhalek, A.; Fockedey, S.; El Sammany, M.; Abdallah, G.; El Bihery, M.; Bauwens, W.; Huygens, M. An early warning system for flash floods in hyper-arid egypt. Nat. Hazards Earth Syst. Sci. 2012, 12, 443–457. [Google Scholar] [CrossRef]
- Arish Flash Floods. Available online: https://www.albawabhnews.com/2917098 (accessed on 14 November 2019).
- New Cairo Urban Floods. Available online: https://www.aljazeera.net/news/trends/2018/4/26/%D8%A3%D9%85%D8%B7%D8%A7%D8%B1-%D8%A7%D9%84%D9%82%D8%A7%D9%87%D8%B1%D8%A9-%D8%AA%D8%BA%D8%B1%D9%82-%D8%A3%D8%AD%D9%8A%D8%A7%D8%A1%D9%87%D8%A7-%D9%88%D8%AA%D9%81%D8%B6%D8%AD-%D9%85%D8%B4%D8%A7%D8%B1%D9%8A%D8%B9%D9%87%D8%A7 (accessed on 14 November 2019).
- Zhang, G.; Wu, Y.; Wang, L.; Zhang, K.; Daemen, J.J.K.; Liu, W. Time-dependent subsidence prediction model and influence factor analysis for underground gas storages in bedded salt formations. Eng. Geol. 2015, 187, 156–169. [Google Scholar] [CrossRef]
- Smith, J.; Deck, L.; McCarl, B.; Kirshen, P.; Malley, J.; Abdrabo, M. Potential Impacts of Climate Change on the Egyptian Economy, a Report Prepared for the United Nations Development Program (Undp); United Nations: Cairo, Egypt, 2013. [Google Scholar]
- Mohamed, E.S.; Saleh, A.; Belal, A. Sustainability indicators for agricultural land use based on gis spatial modeling in north of sinai-egypt. Egypt. J. Remote Sens. Space Sci. 2014, 17, 1–15. [Google Scholar] [CrossRef]
- Phien-wej, N.; Giao, P.H.; Nutalaya, P. Land subsidence in bangkok, thailand. Eng. Geol. 2006, 82, 187–201. [Google Scholar] [CrossRef]
- Baldi, P.; Casula, G.; Cenni, N.; Loddo, F.; Pesci, A. Gps-based monitoring of land subsidence in the po plain (northern italy). Earth. Planet. Sci. Lett. 2009, 288, 204–212. [Google Scholar] [CrossRef]
- Ferronato, M.; Gambolati, G.; Teatini, P.; Baù, D. Stochastic poromechanical modeling of anthropogenic land subsidence. Int. J. Solids Struct. 2006, 43, 3324–3336. [Google Scholar] [CrossRef]
- Clark, M.L.; Aide, T.M. Virtual interpretation of earth web-interface tool (view-it) for collecting land-use/land-cover reference data. Remote Sens. 2011, 3, 601–620. [Google Scholar] [CrossRef]
- Taylor, J.R.; Lovell, S.T. Mapping public and private spaces of urban agriculture in chicago through the analysis of high-resolution aerial images in google earth. Landsc. Urban Plan. 2012, 108, 57–70. [Google Scholar] [CrossRef]
- Sayama, T.; Ozawa, G.; Kawakami, T.; Nabesaka, S.; Fukami, K. Rainfall–runoff–inundation analysis of the 2010 pakistan flood in the kabul river basin. Hydrol. Sci. J. 2012, 57, 298–312. [Google Scholar] [CrossRef]
- Nastiti, K.D.; Kim, Y.; Jung, K.; An, H. The application of rainfall-runoff-inundation (RRI) model for inundation case in upper citarum watershed, west java-indonesia. Procedia Eng. 2015, 125, 166–172. [Google Scholar] [CrossRef]
- Bhagabati, S.S.; Kawasaki, A. Consideration of the rainfall-runoff-inundation (RRI) model for flood mapping in a deltaic area of myanmar. Hydrol. Res. Lett. 2017, 11, 155–160. [Google Scholar] [CrossRef]
- Abdel-Fattah, M.; Kantoush, S.; Saber, M.; Sumi, T. Hydrological modelling of flash flood at wadi samail, oman. Disas. Prev. Res. Inst. Annu. 2016, 59, 533–541. [Google Scholar]
- General Organization for Physical Planning. Preparation of the General Strategic Plan and the Detailed Plan (2027) for the City of el Arish, North Sinai 2011; General Organization for Physical Planning: Cairo, Egypt, 2011. [Google Scholar]
© 2020 by the authors. Licensee MDPI, Basel, Switzerland. This article is an open access article distributed under the terms and conditions of the Creative Commons Attribution (CC BY) license (http://creativecommons.org/licenses/by/4.0/).