1. Introduction
The recent tragic earthquakes which have occurred in Italy during the last decades are a living testimony of the bad seismic behaviour of the historical centres of many municipalities. This is due to a series of hazardous factors, such as the age of buildings, the poor quality of materials and the insufficient maintenance of constructions, which lead towards the high seismic vulnerability of several built-up areas. In fact, the seismic vulnerability of a given built area indicates the expected amount of damage triggered by an earthquake of a specific magnitude [
1]. Therefore, the seismic vulnerability assessment of an urban environment is devoted to estimating the capacity of the built-up area to withstand without failures a series of seismic events, which are responsible for huge economic losses and casualties.
Generally, in an overall perspective, the Vulnerability (V), through a multi-factorial combination with other two parameters, namely Exposure (E) and Hazard (H), leads towards the definition of the seismic risk, which can have direct or indirect influence on a specific area.
Reducing the seismic risk requires researchers to assess the seismic behaviour of buildings towards earthquakes (Vulnerability), the amount of human and material resources that could be lost in the case of seismic events (Exposure) and the intensity and recurrence of earthquakes (Hazard).
In fact, focusing on the urban scale, rapid urbanization has dramatically increased the vulnerabilities and risks of urban dwellers in densely populated areas. The high population, combined with the presence of numerous buildings that do not comply with seismic regulations, significantly increase the problem of seismic safety in urbanized areas [
2,
3].
At urban-scale, the management of a large number of variables, such as different types of buildings, people, roads, etc., is an important issue to accomplish, since the expected damage probability must be foreseen.
The identification of the most vulnerable buildings in an urban context is not a simple task due to their heterogeneity and complexity. In general, the predisposition of a building to be damaged by a seismic impact depends upon many aspects that are mainly concerned with the type of construction, the quality of the materials used, the construction methods and the preservation state. Many studies [
4,
5,
6] have shown that the lack of these features make structures ineffective against earthquakes. In fact, masonry buildings especially, which are located within historic centres, are very often characterized by a static inadequacy, mainly due to antiquated and unsuitable construction techniques, which do not guarantee an adequate security level. To this purpose, an inventory of buildings is an essential procedure for the acquisition of data aiming at evaluating the large-scale seismic vulnerability [
7,
8].
The available strategies usually take into consideration survey forms [
9,
10] to collect information on historical centre buildings mainly based on several seismic parameters, i.e., the seismic-resistant system type to lateral loading, the structural regularity, the maintenance conditions and the presence of existing damages. The application of these survey forms allows us to fully understand the various structural types located within heterogeneous urban centres [
11].
Thus, in this perspective, the impact of an earthquake can be assessed in terms of expected losses. Therefore, the formulation of an earthquake loss model in a given region is not only of interest for the economic impact of future earthquakes, but it is also important for risk mitigation. A specific loss model makes possible to predict damage to the built environment for a specific data scenario, in the framework of a deterministic approach model, and can be particularly important for responding to emergencies planning with targeted actions in order to safeguard people and the historical heritage of a given area [
12,
13,
14].
Nowadays, the evaluation of the geological effects has been taken into consideration in the framework of risk assessment in order to have a better and correct forecast of the expected damage [
15]. In this circumstance, the soil layers amplify or reduce the seismic waves on the crustal surface. Site effects are thus dangerous when the amplification of seismic waves in surface geological layers occurs. In fact, surface motion can be strongly amplified if geological conditions are unfavourable [
16].
Generally, specific geological, geomorphologic and geo-structural settings of restricted areas can induce a high level of shaking on the ground surface even in occasions of low-intensity/magnitude earthquakes. This effect is called site or local amplification. Furthermore, the characterization of site effects can be carried out considering the ground model as a one-dimensional (1D) or two-dimensional (2D) half-space. The substantial difference between the two ground models is that in a 1D analysis, only the depth of the half-space is taken into consideration, neglecting the lateral confinement effect. On the other hand, the more accurate 2D analysis takes into account the significant volume of the soil in the longitudinal and vertical directions. The study of site effects can be conducted using two distinct approaches, namely time domain or frequency domain. In the first case, the local amplification factor is estimated by means of the time sequence (time history) at the bedrock with respect to the amplification at the ground surface. In the second case, the amplification coefficient is achieved considering the Fourier amplitude spectra or the response spectrum [
17].
A reliable and easy method for large scale analysis developed by Giovinazzi [
15] and Chieffo and Formisano [
18] allows us to estimate the macroseismic intensity increment derived from specific soil category, so as to properly define, taking into account the local amplification factors, the global vulnerability of building stocks according to the EMS-98 scale.
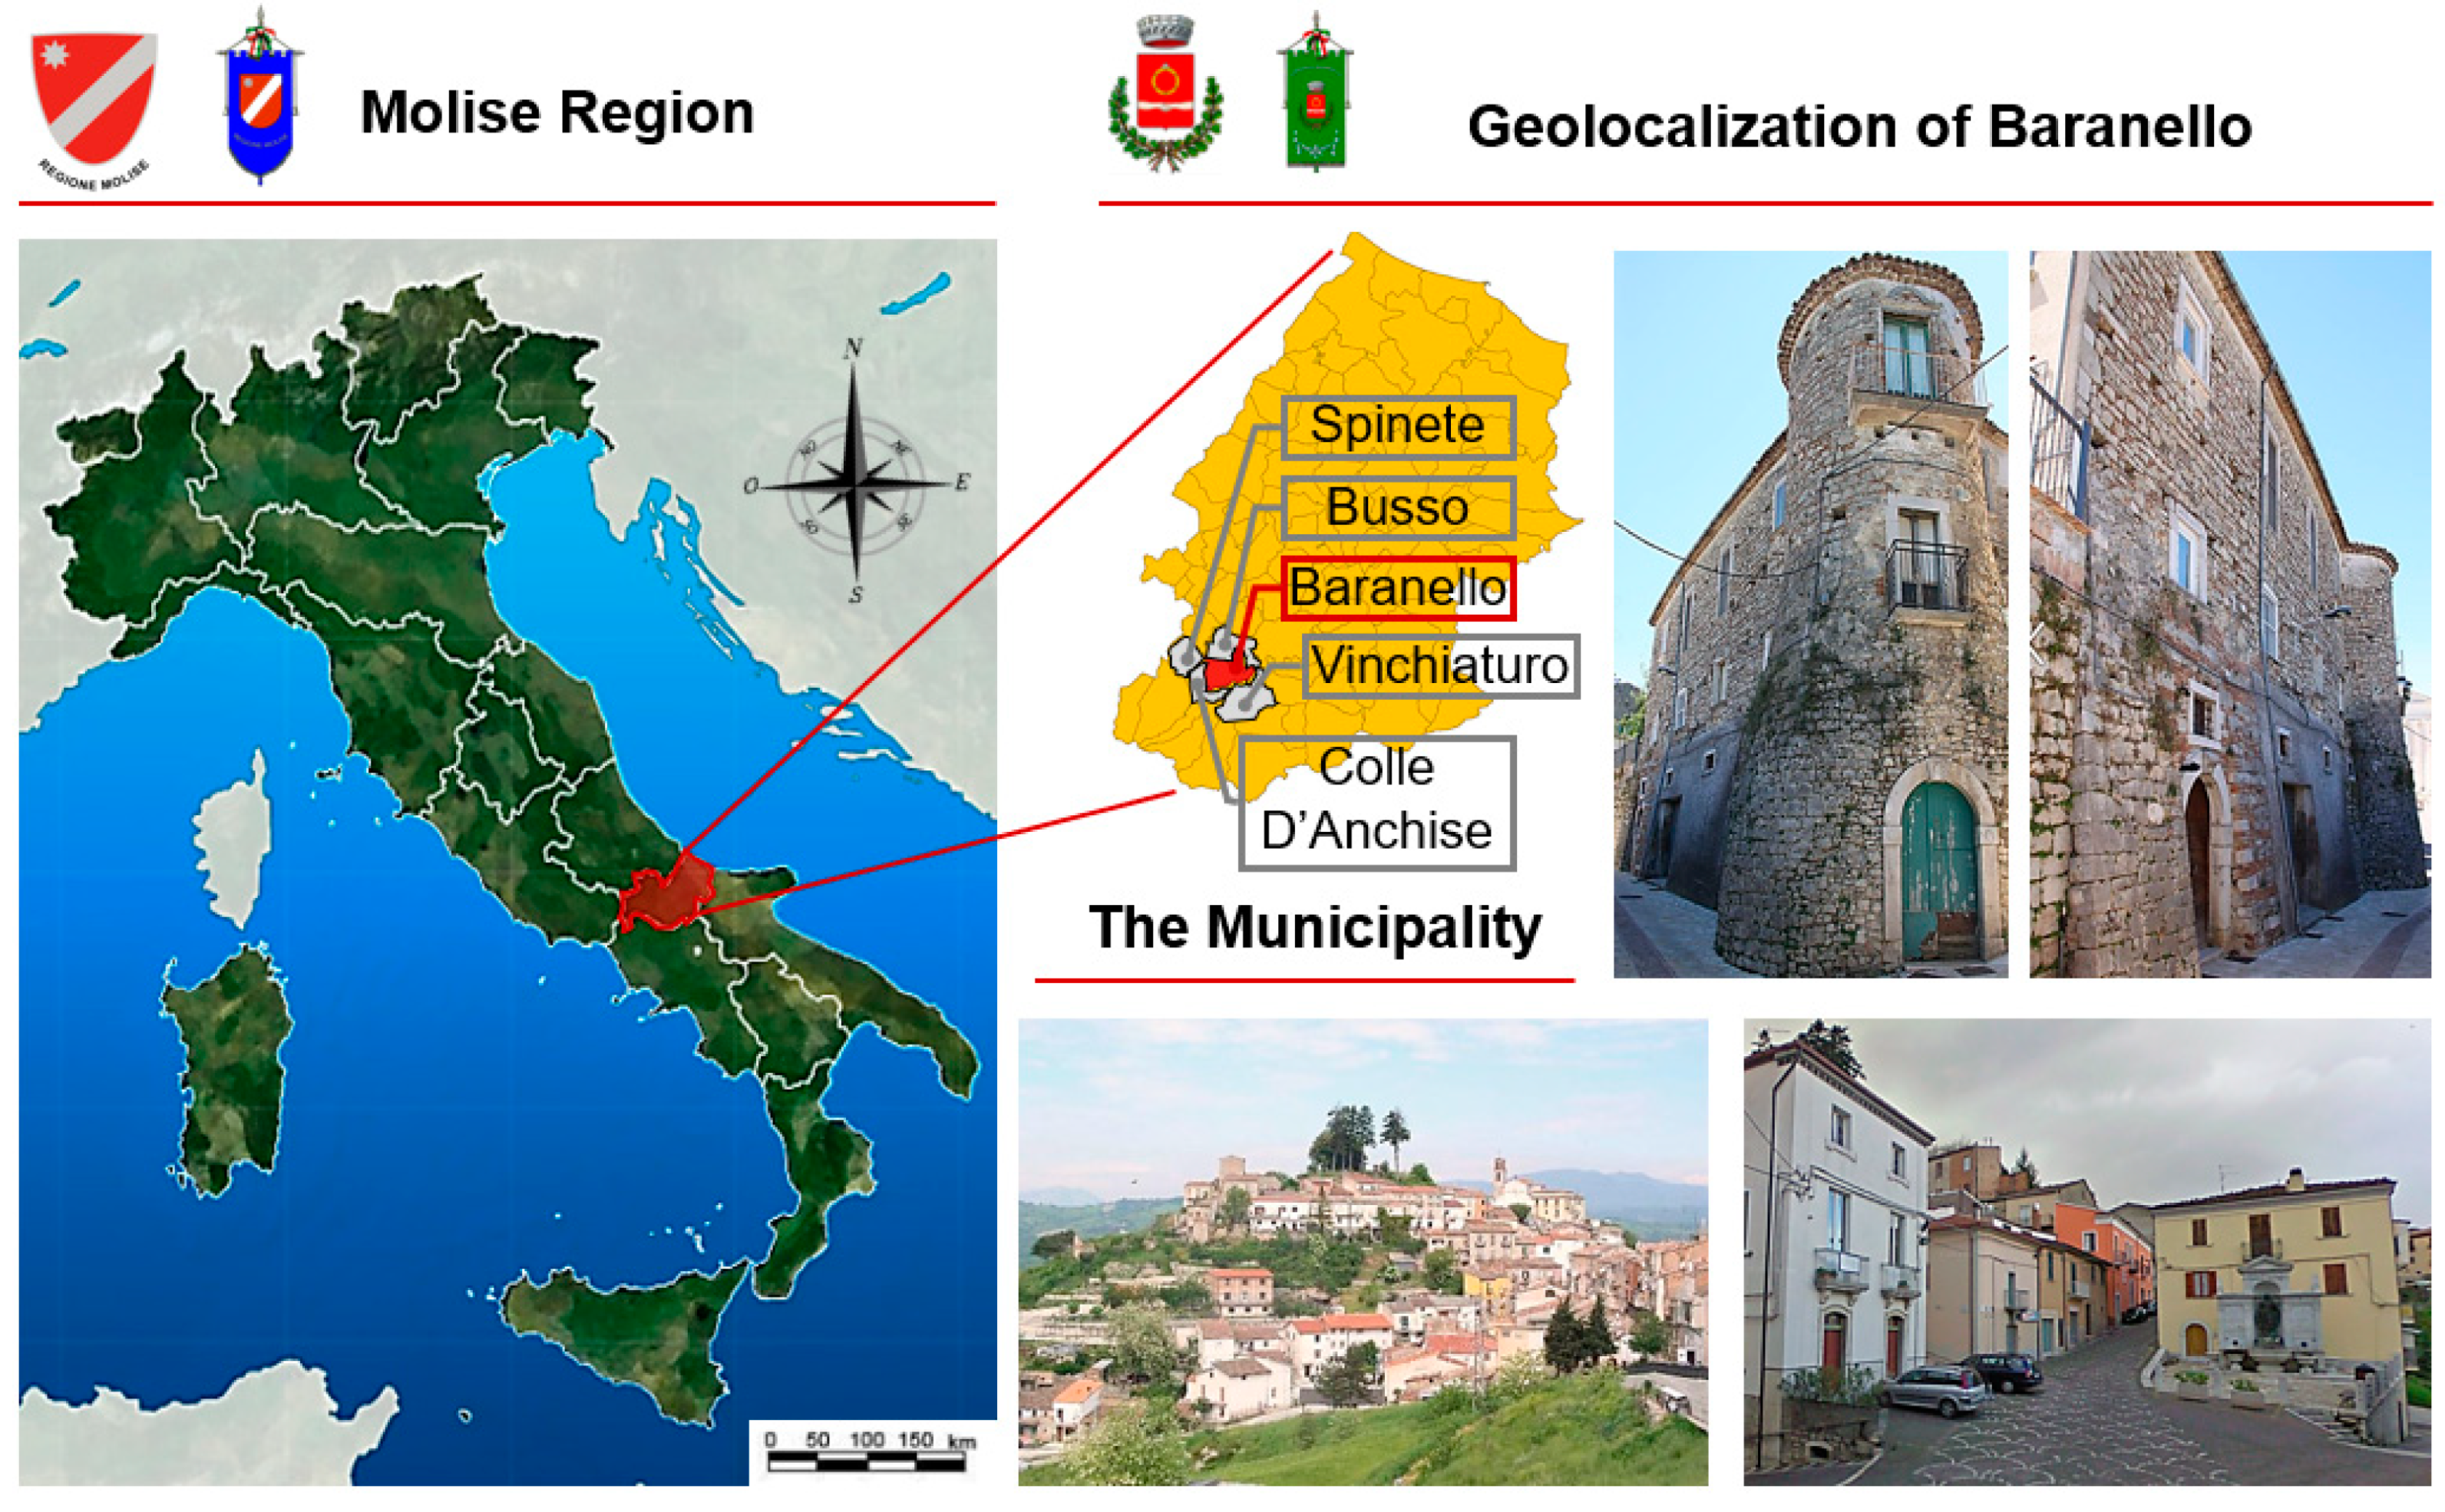
Based on these considerations, the municipality of Baranello, in the province of Campobasso, has been selected as a case study to evaluate the possible damages under seismic events.
The proposed work aims to evaluate the local amplification effects considering the time domain of a 1D half-space ground model. The main goal of this work is to investigate the influence of soil amplification on the seismic behaviour of typical masonry aggregates with the final target to plot the damage scenarios expected under different earthquake moment magnitudes and site–source distances.
3. Typological and Structural Survey of the Built Area
3.1. The CARTIS Form
The structural and typological characterization is to be considered indispensable for the census of the buildings exposed at risk, which is used for classification purposes into typological classes.
In particular, the CARTIS form has been herein used in order to detect the prevalent ordinary building typologies in municipal or submunicipal territorial parts, called urban sectors, characterized by typological and structural homogeneity.
The CARTIS form has been conceived by the PLINIVS research centre of the University of Naples “Federico II” during the ReLUIS 2014–2016 project “Development of a systematic methodology for the assessment of exposure on a territorial scale based on the typological/structural characteristics of buildings”, in collaboration with the Italian Civil Protection Department [
26].
The form is divided into four sections: Section 0, for the identification of the municipality and the sectors identified therein; Section 1, for the recognition of each of the relevant typologies characterizing the generic sub-sector of the assigned municipality; Section 2, for the detection of the general characteristics of each typology of constructions; Section 3, for the characterization of structural elements of all individuated construction typologies.
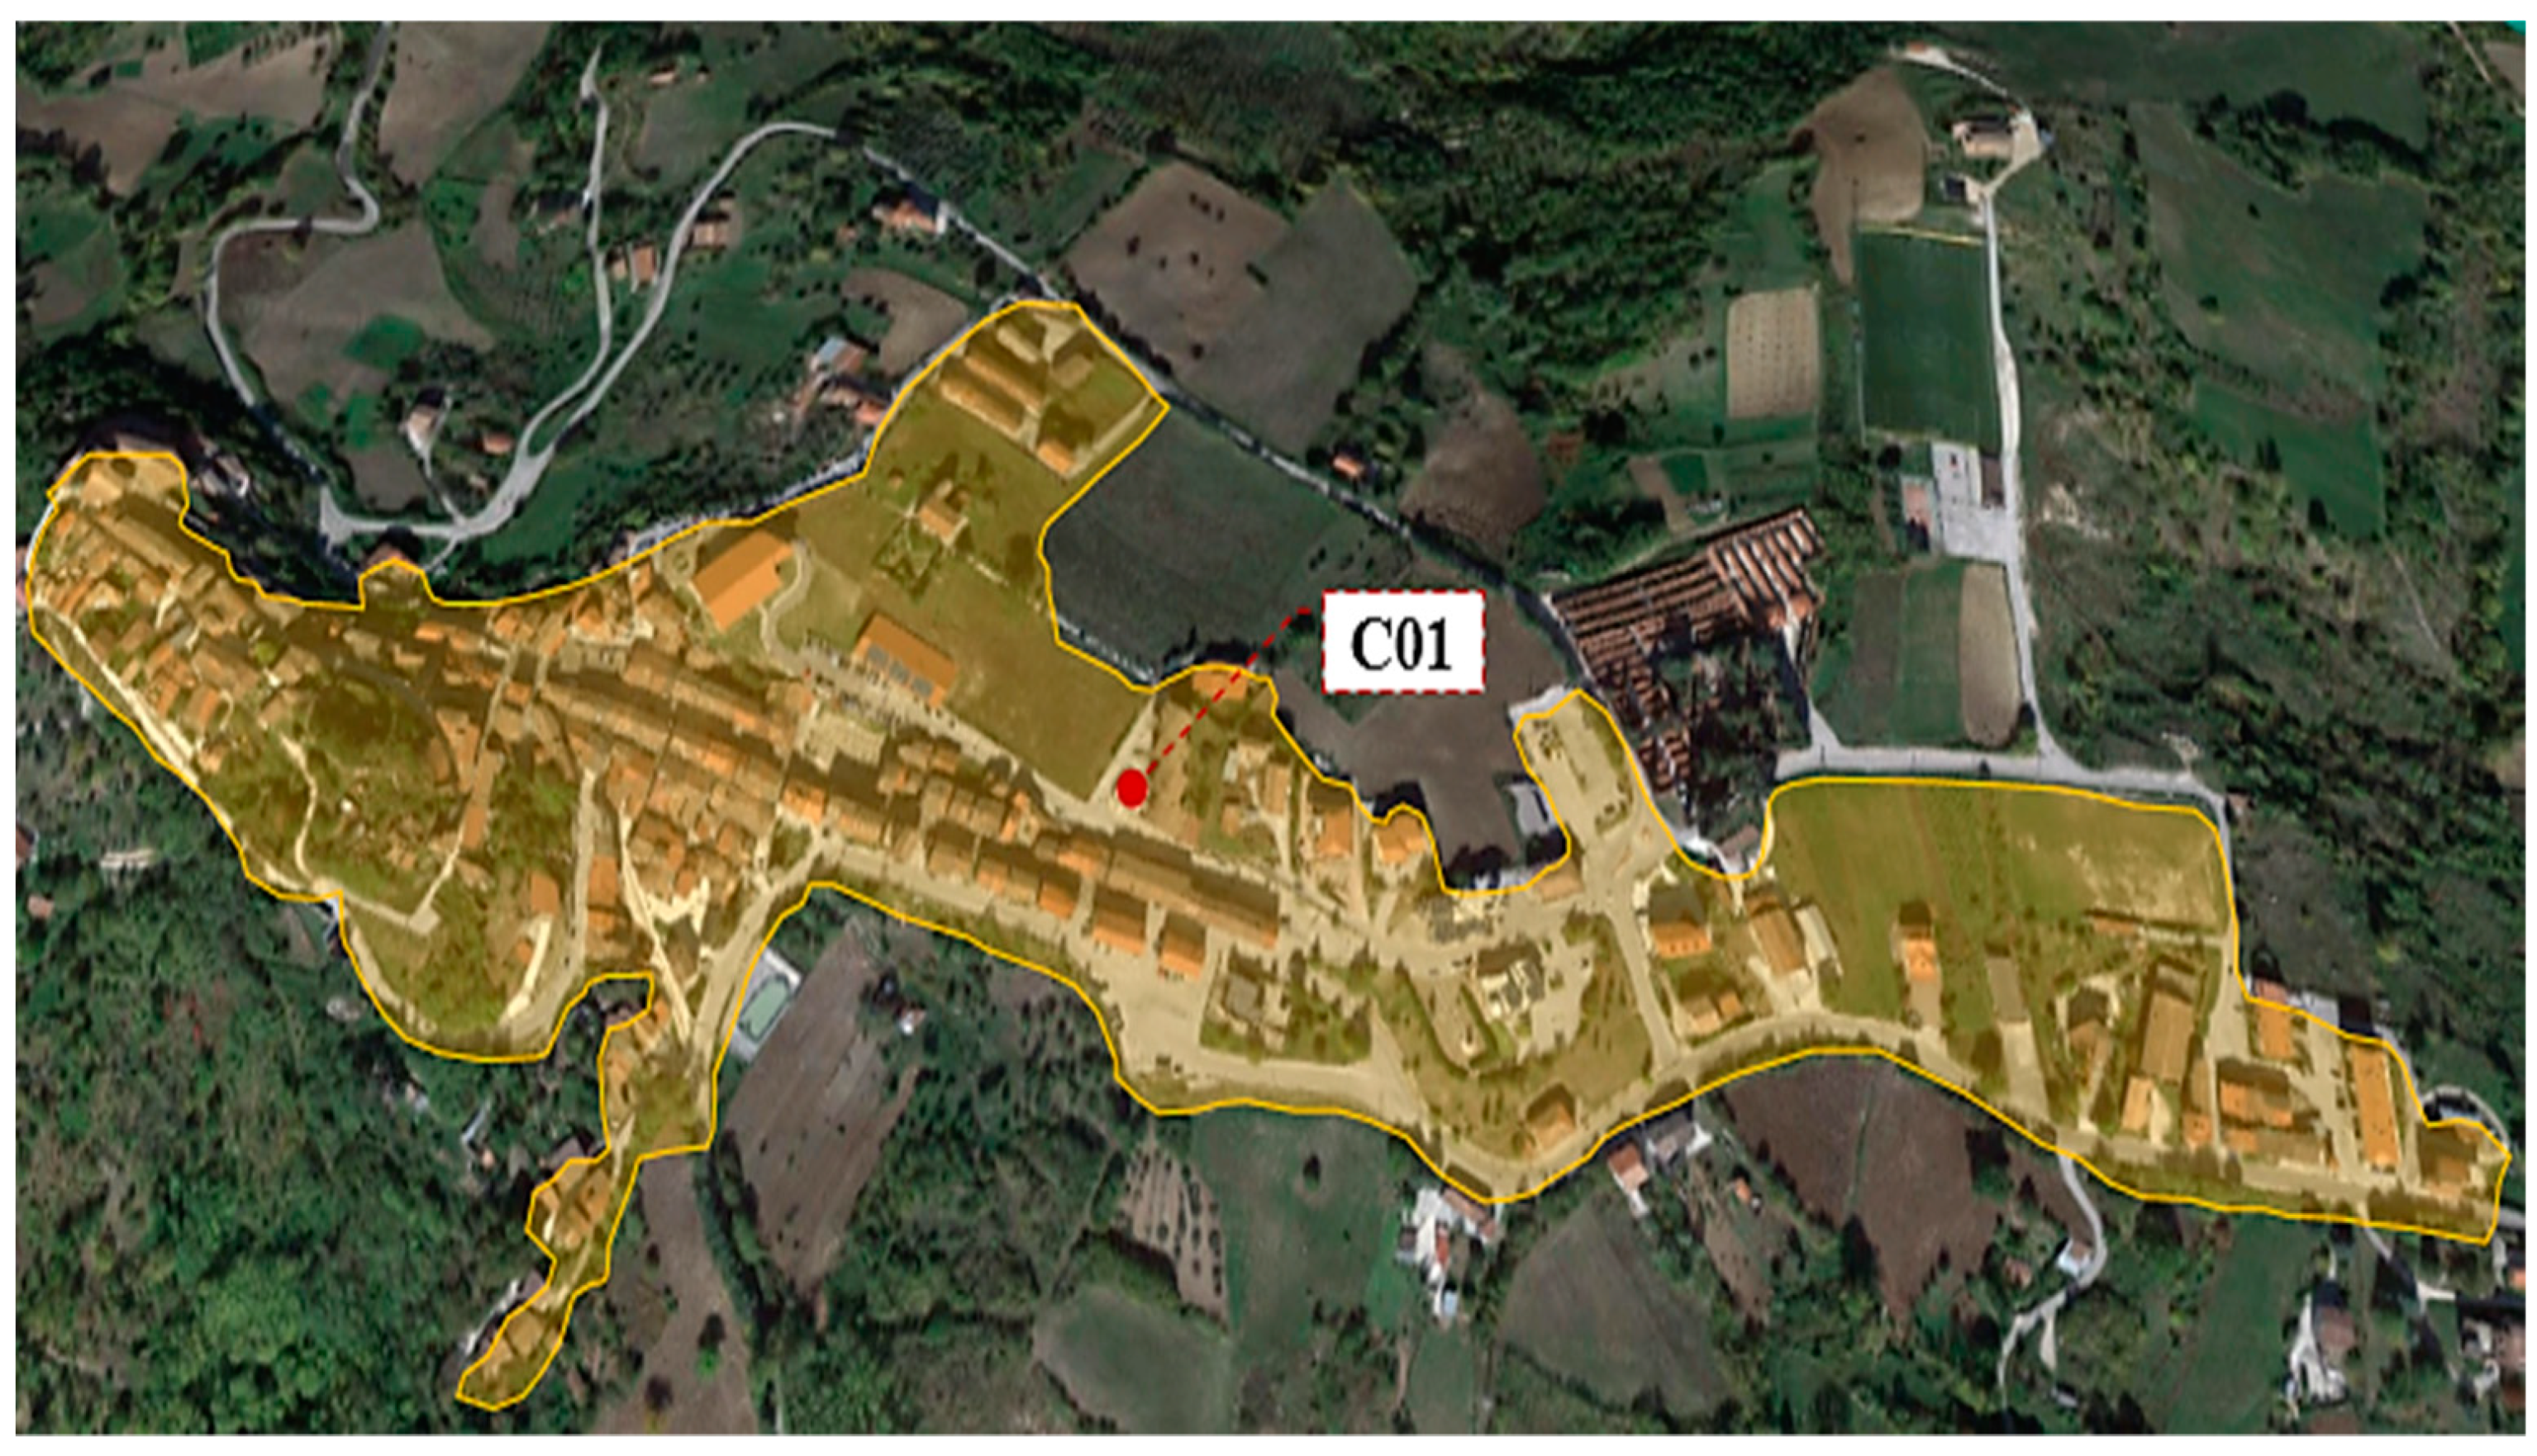
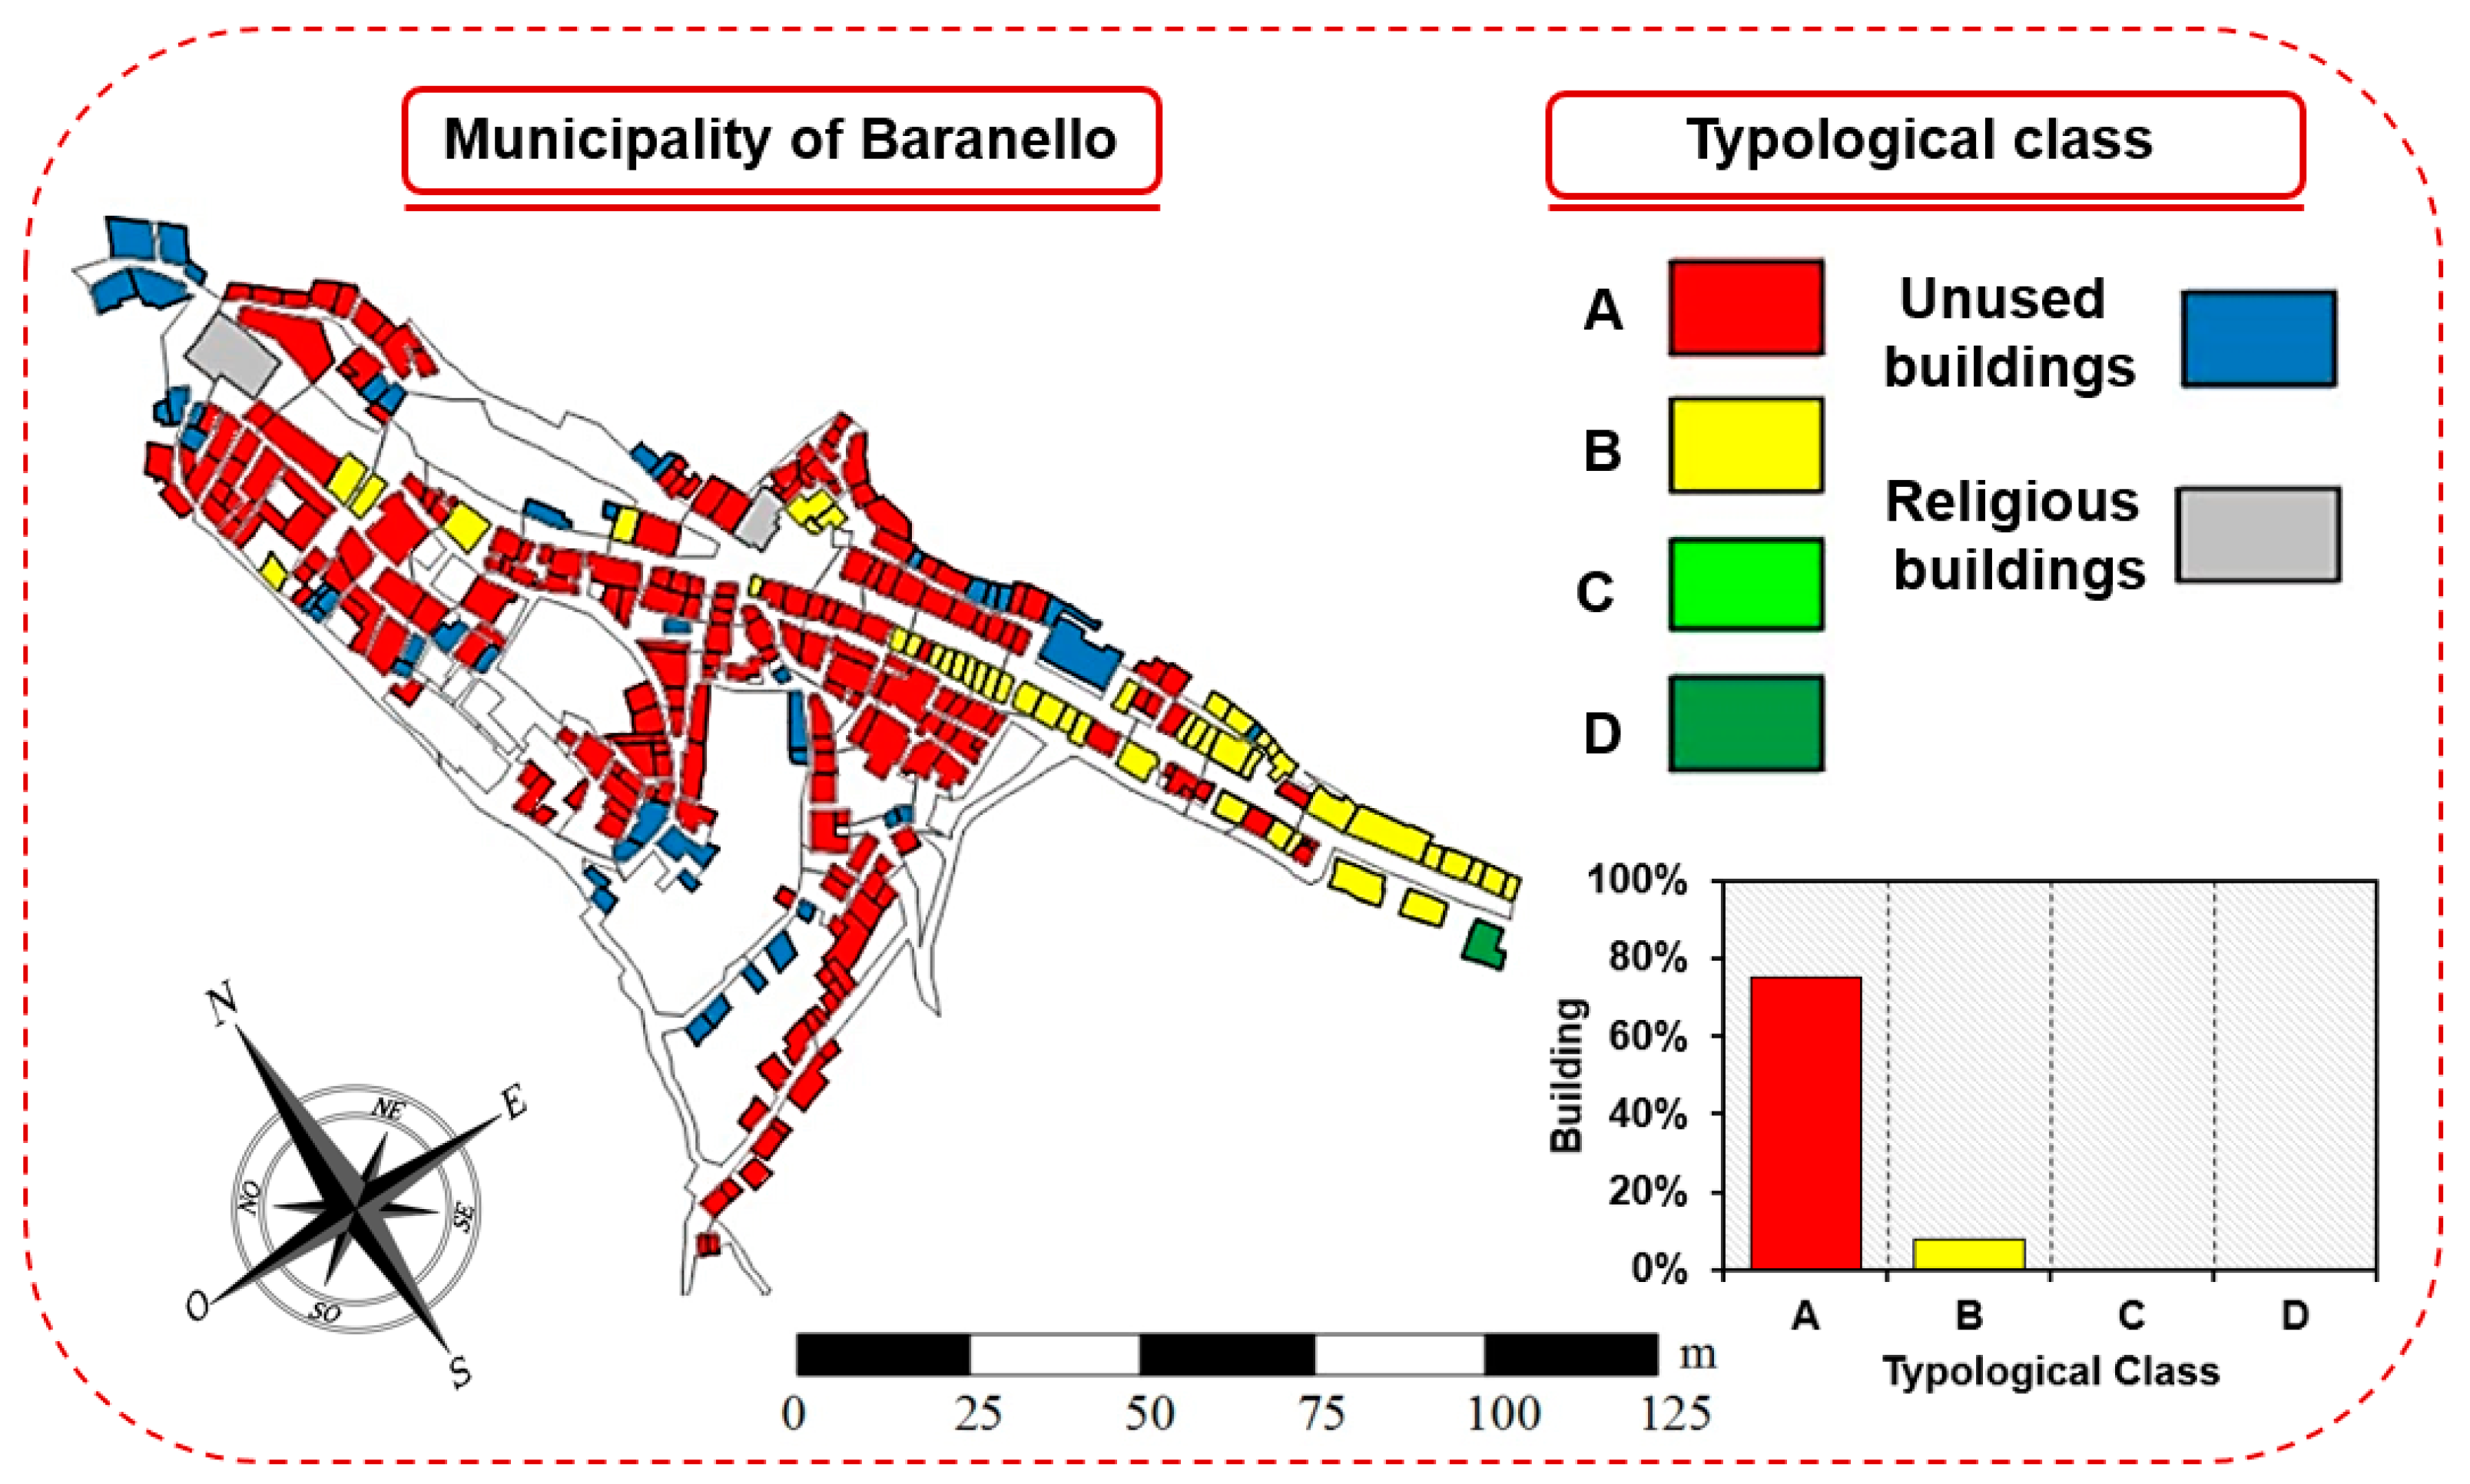
Focusing on the case study, the historical centre of Baranello is composed by one unique compartment, indicated as C01, made of 300 buildings (
Figure 5).
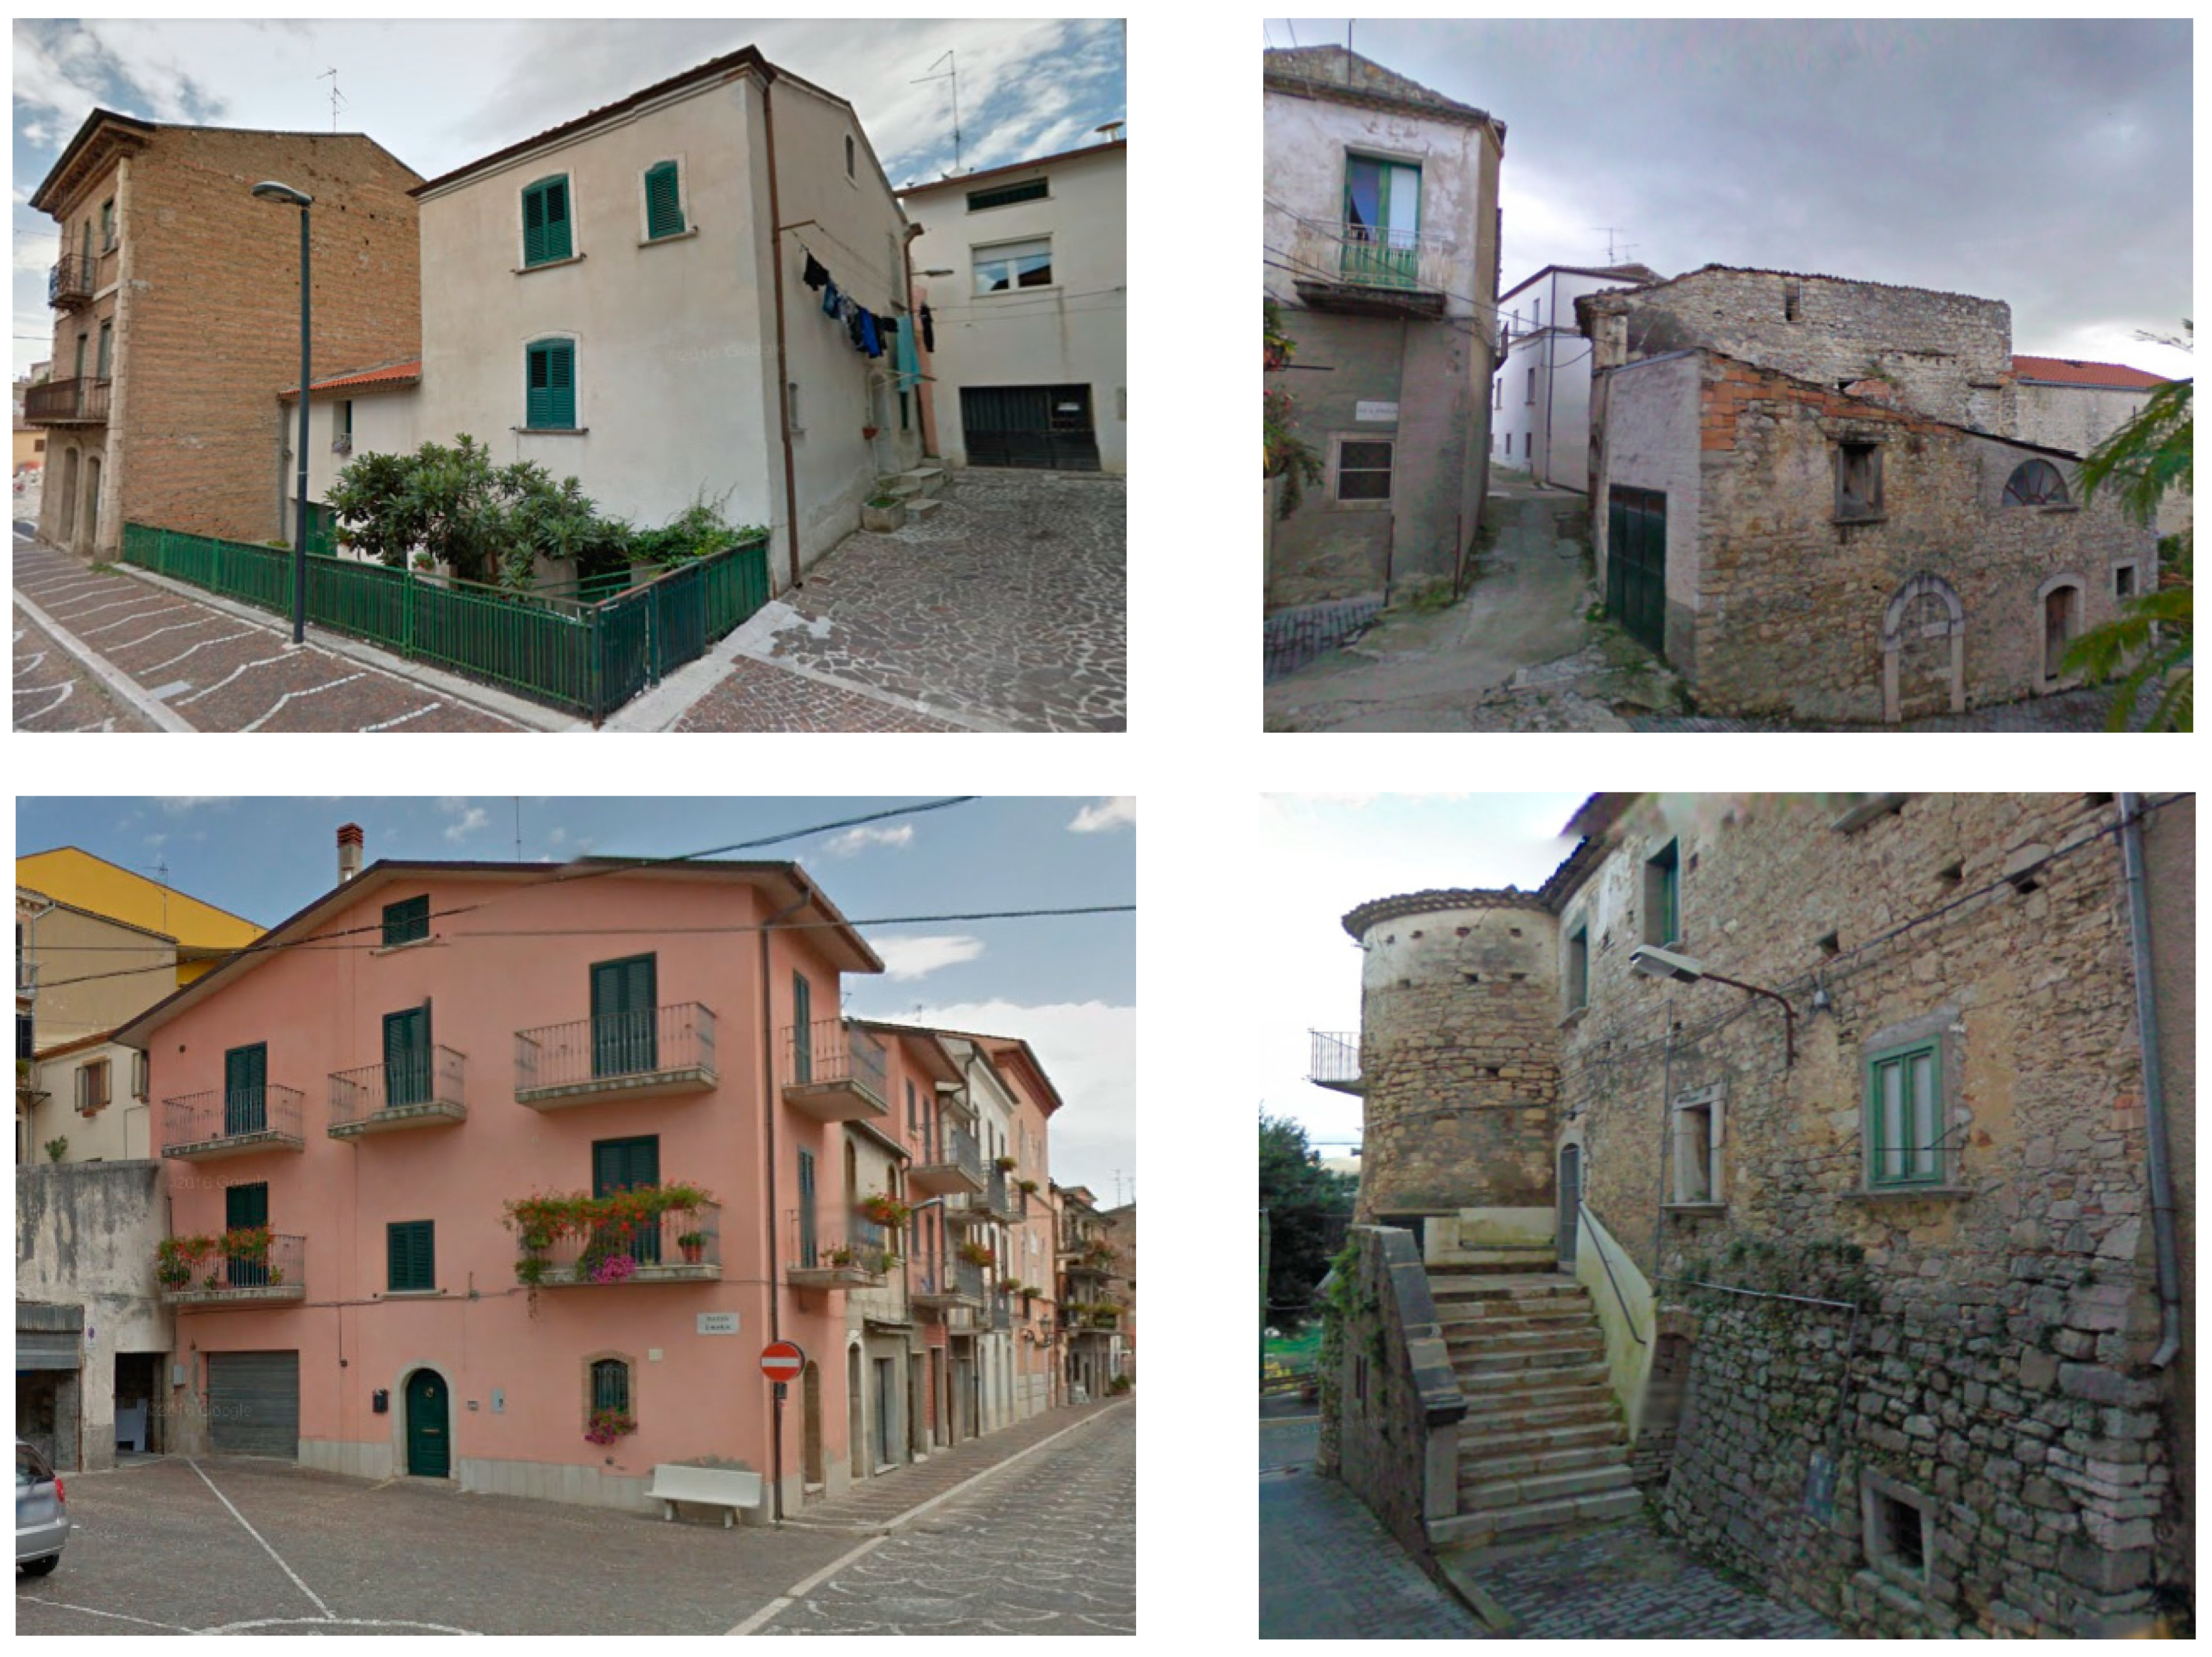
From the historical point of view, the analysed municipality is characterized by the presence of construction techniques that over the centuries have maintained their original “asset”, dating back to the fourteenth century.
Most of the buildings have been built using rough-hewn stones assembled according to the technique of sack or mixed walls, which in some cases have greatly affected the characteristics and quality of constructions, resulting in substantial deficiencies in terms of global response towards seismic actions.
The houses characterising the historical centre are composed of walls with an average thickness of 0.65 m and an average inter-storey height of 3.50 m. Except for the masonry vaults, the horizontal structures, as well as roofs, are generally made of timber or steel beams (
Figure 6).
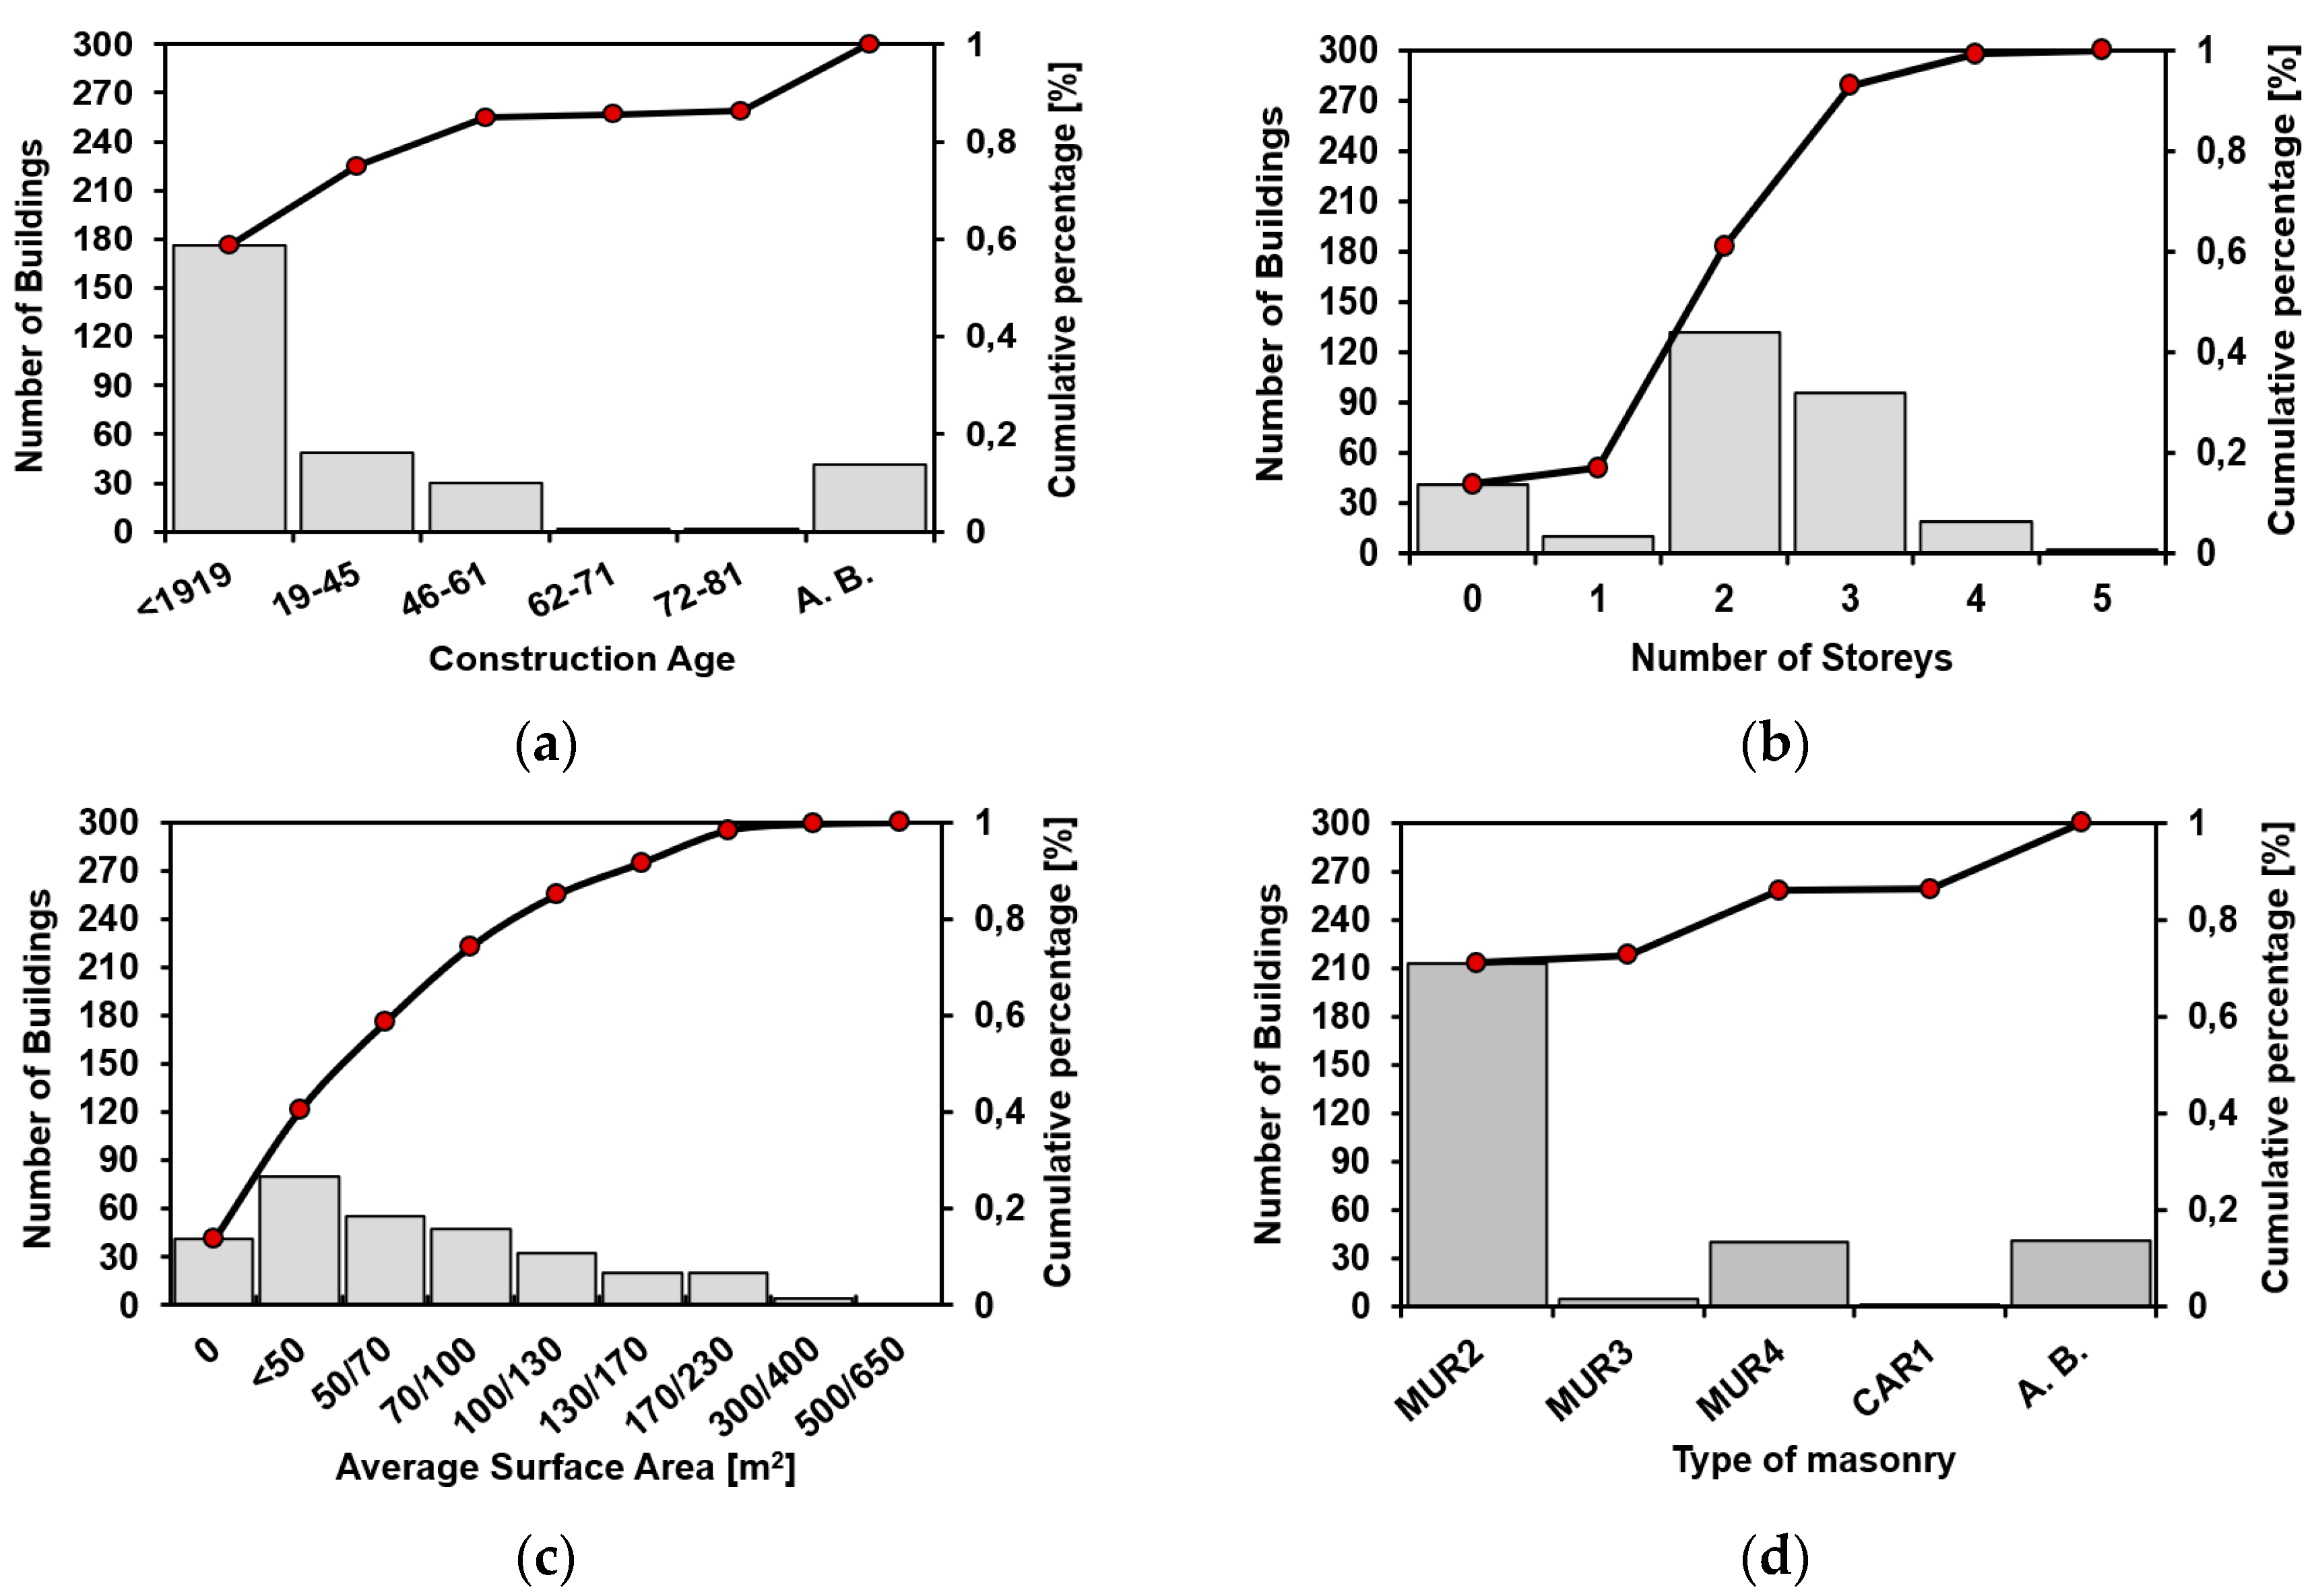
The data collected through the CARTIS form has allowed, through statistical elaborations, to provide indications on the constructive age, number of storeys, average surface area and wall type of the sample of buildings surveyed within the municipality examined. The results obtained are summarized in the cumulative distributions reported in
Figure 7.
From the data surveyed on the 300 inspected buildings, the prevailing typological class is the MUR2 (rough-hewn stone) one, which has been detected in 73% of the cases (220 buildings). Moreover, the other classes detected in the study area are: MUR3 (rough-hewn masonry stone or pseudo-regular stone, 2% of the sample), MUR4 (regular masonry with squared or brick stones, 13%) and A. B. (unused buildings, 12%).
3.2. The Observed Damage Assessment
Since the 1976 Friuli earthquake (il Terremoto del Friuli, Thursday 6 May 1976 (N.S.)), the investigation of post-earthquake damage to ordinary buildings has become a crucial necessity for emergency management and the recovery phase of Italian historical towns and cities. The visual inspection methods, based upon in situ investigations, have been subjected to substantial changes over time mainly induced by the growth of technical and scientific knowledge in the field of seismic vulnerability.
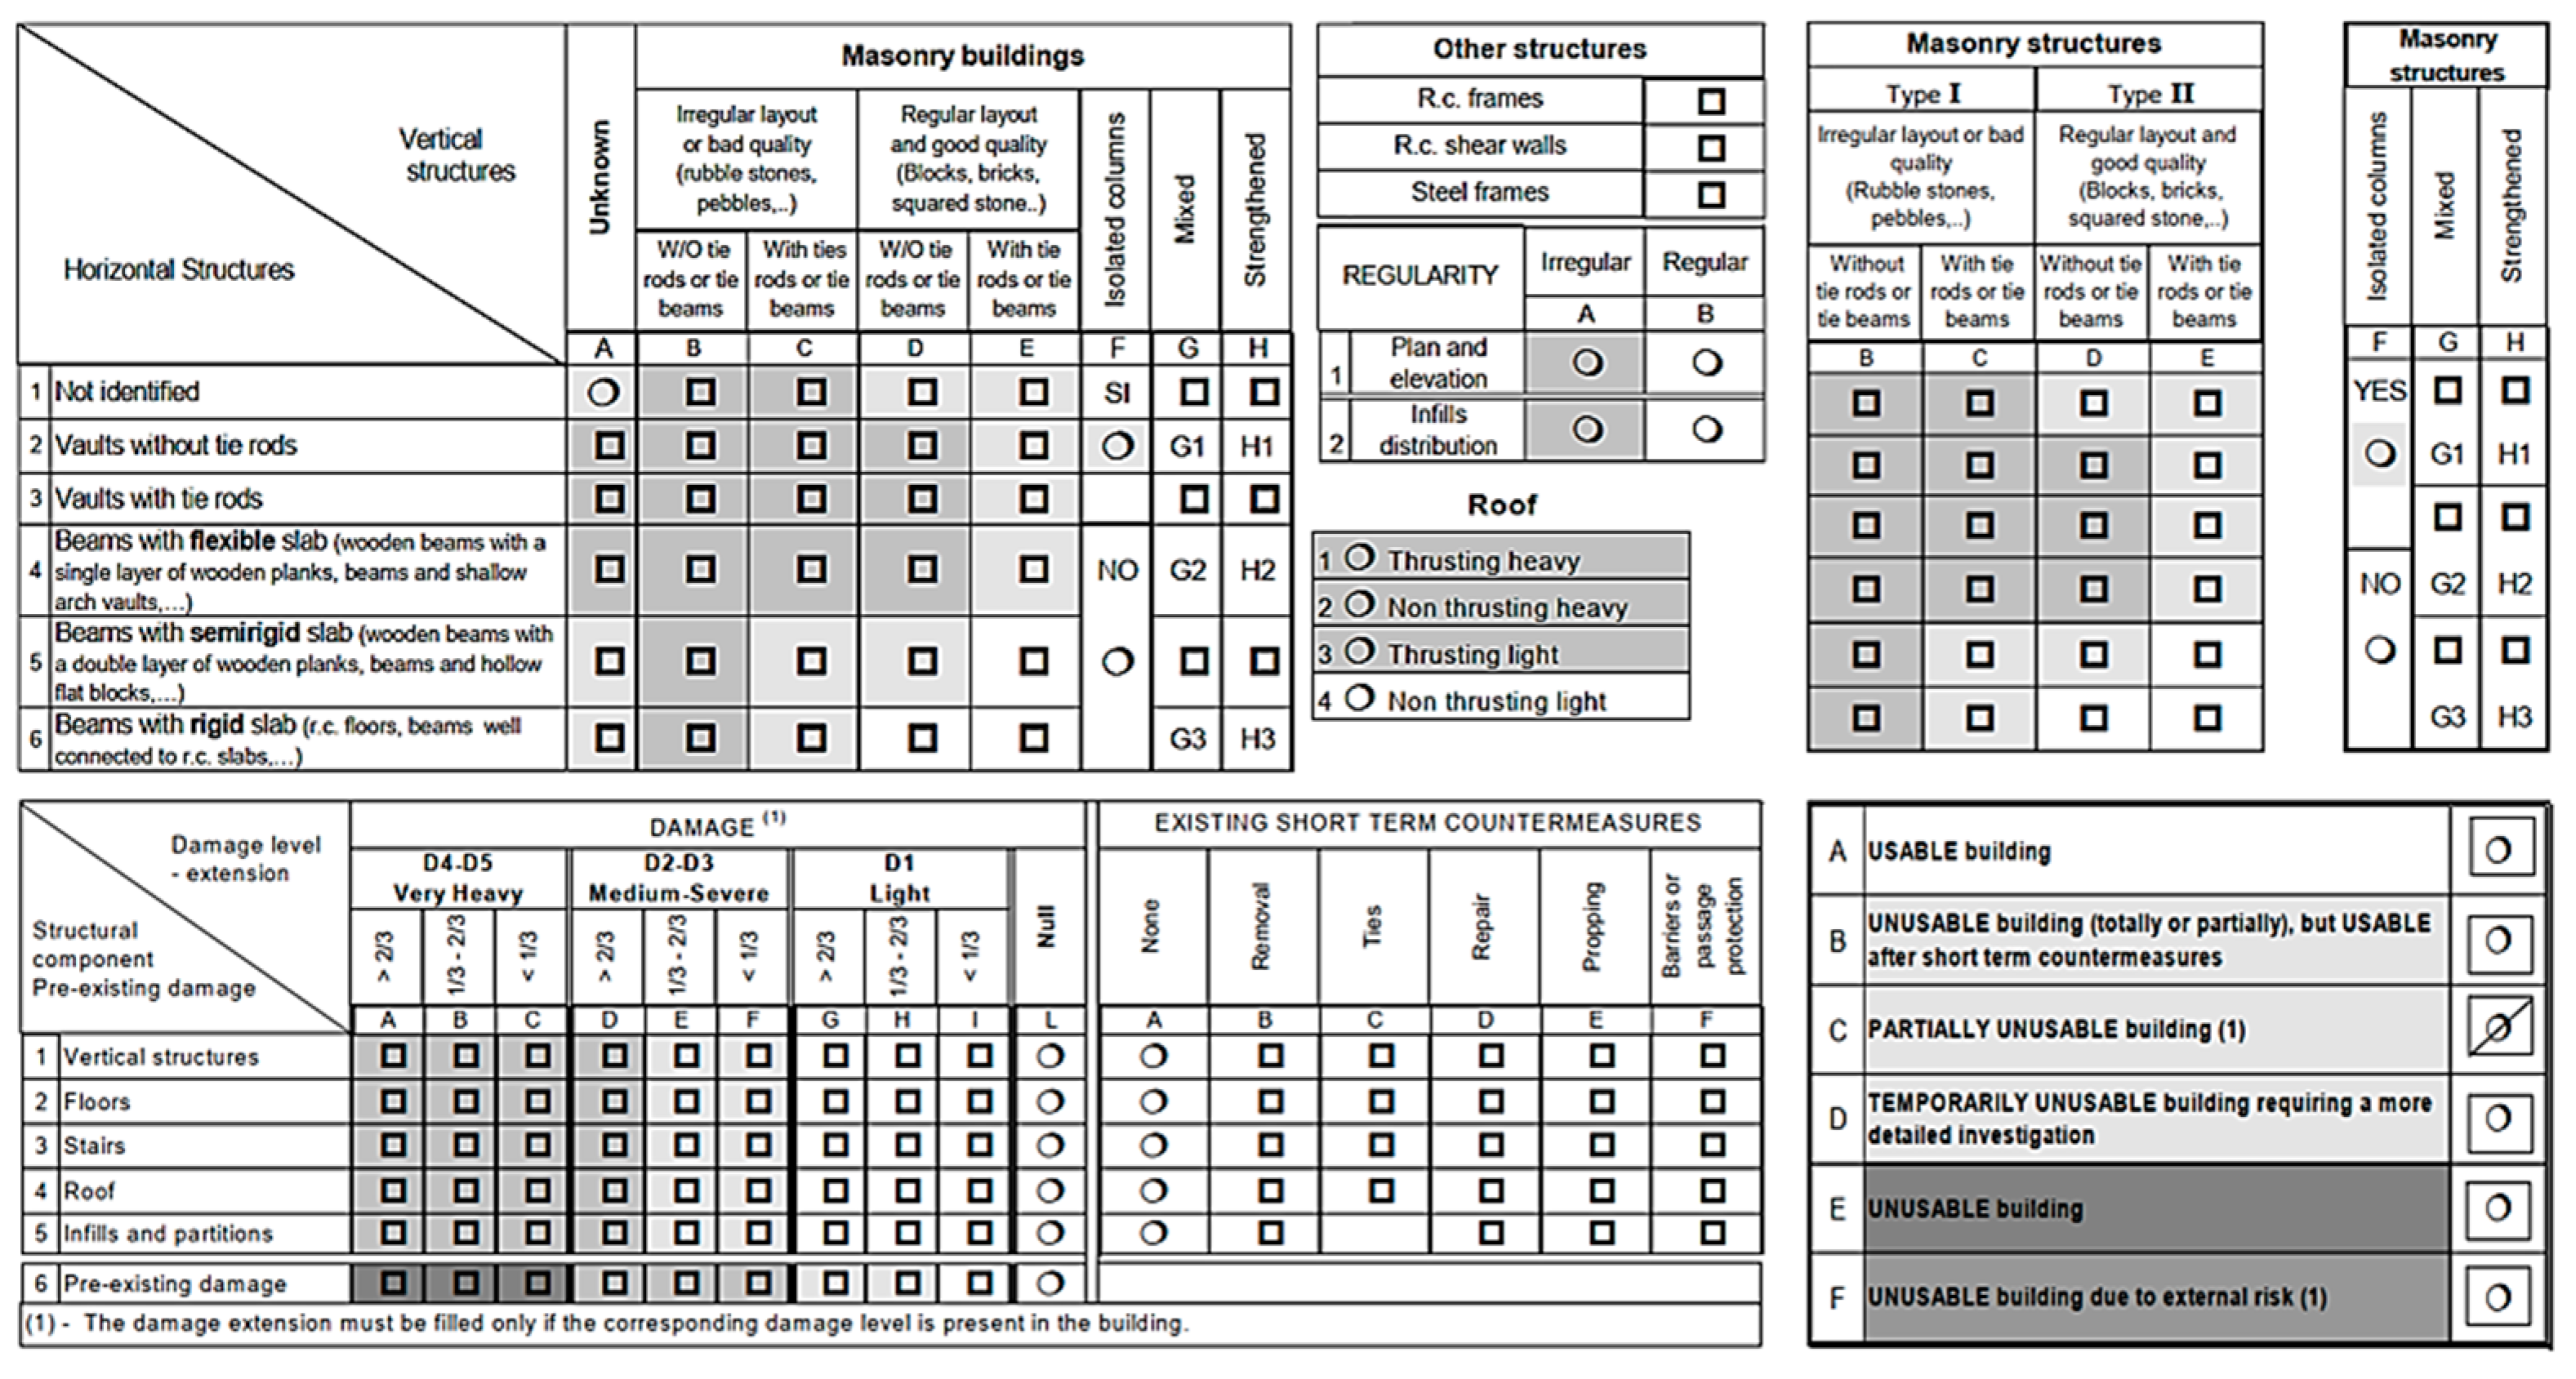
First of all, the Post-Earthquake Damage and Safety Assessment (AeDES) form was introduced in 1997 as an operational tool, recognized by the Italian Civil Protection Department for the detection and management of post-earthquake emergencies (
Figure 8) [
27].
Subsequently, in 2014, the Italian Civil Protection Department promoted a new scientific project with the aim of creating a new database at the national level to simulate seismic risk scenarios. The project, in collaboration with the Eucentre Foundation (European Centre for the training and research of Earthquake Engineering), led to the development of the Web-GIS platform called Da.D.O (Observed Damage Database) [
28].
This tool is of support to the scientific community, since it collects and catalogues the data related to the damages which occurred in the past nine earthquakes (Friuli 1976, Irpinia 1980, Abruzzo 1984, Umbria and Marche 1997, Pollino 1998, Molise and Puglia 2002, Emilia-Romagna 2003, L’Aquila 2009 and Emilia-Romagna 2012), surveyed through the AeDES form, as well as the structural characteristics of inspected buildings.
Thus, for the quantification of the observed damage, using the Da.D.O database and exploiting the information collected in the linked AeDES forms, the Damage Probability Matrices (DPM) have been statistically processed using the binomial distribution function according to the following equation [
29]:
where k denotes the damage threshold variable from 0 to 5 according to the EMS-98 scale and µ
D represents the weighted average of damages.
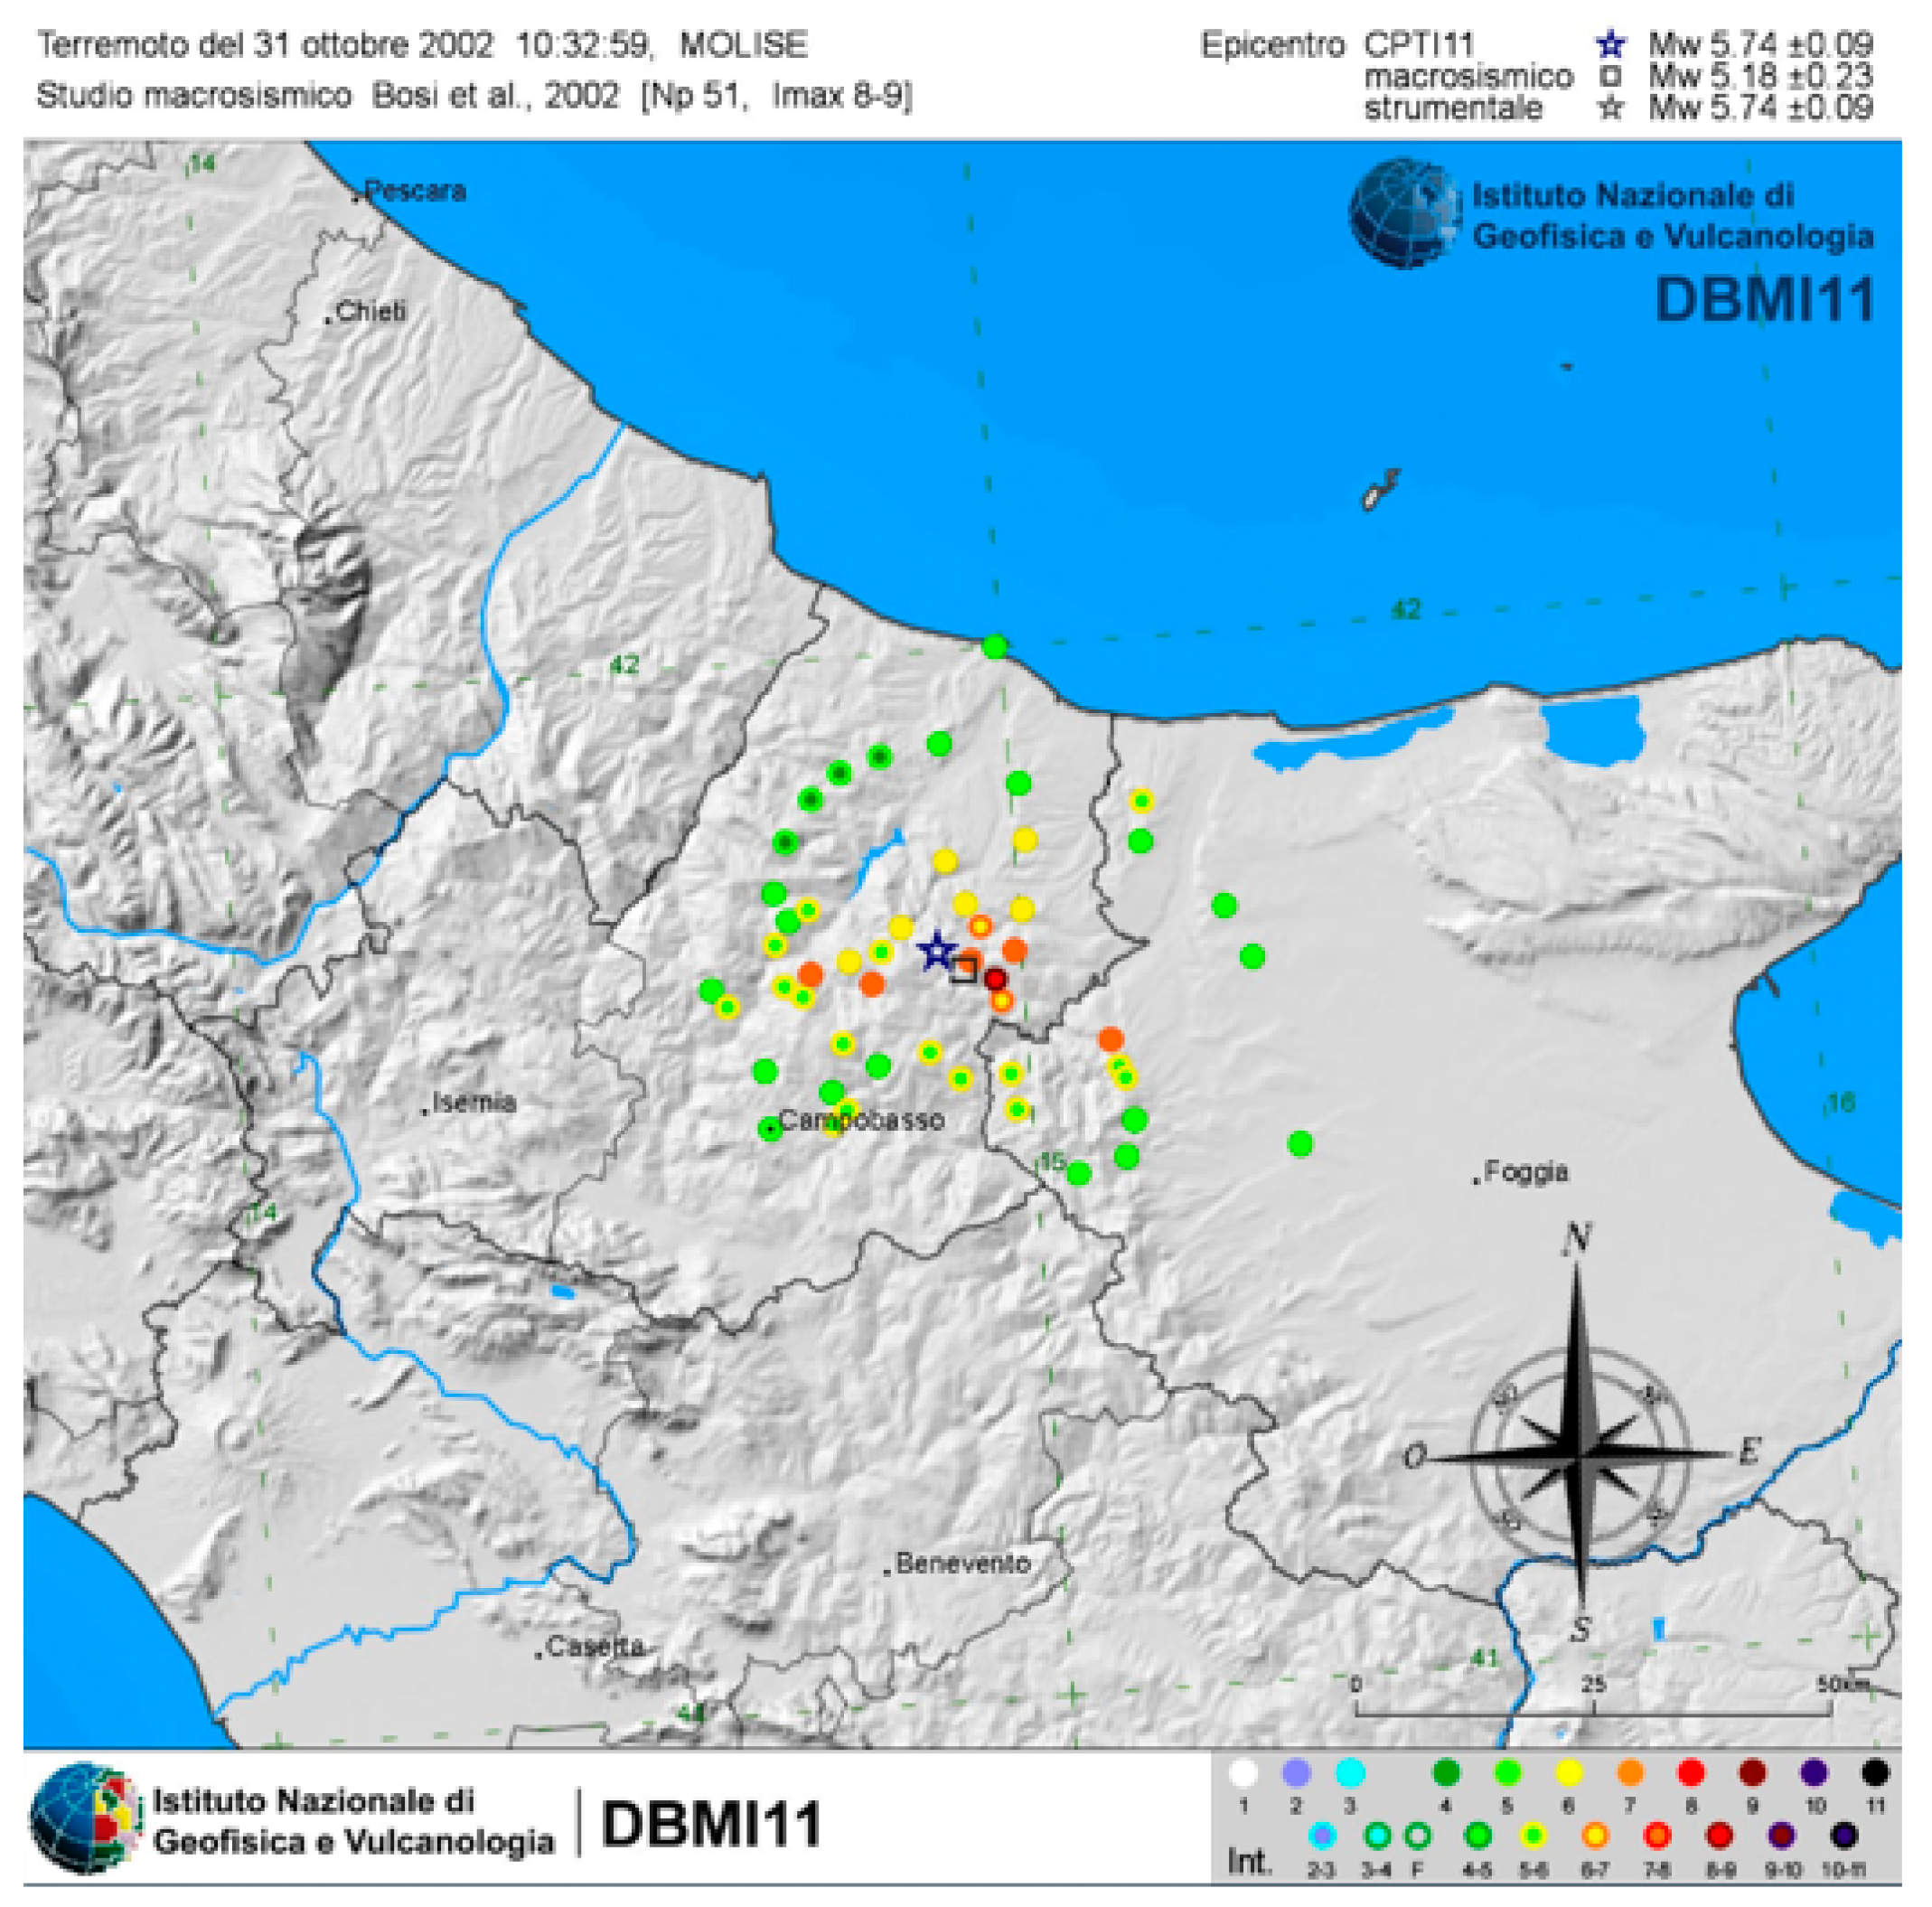
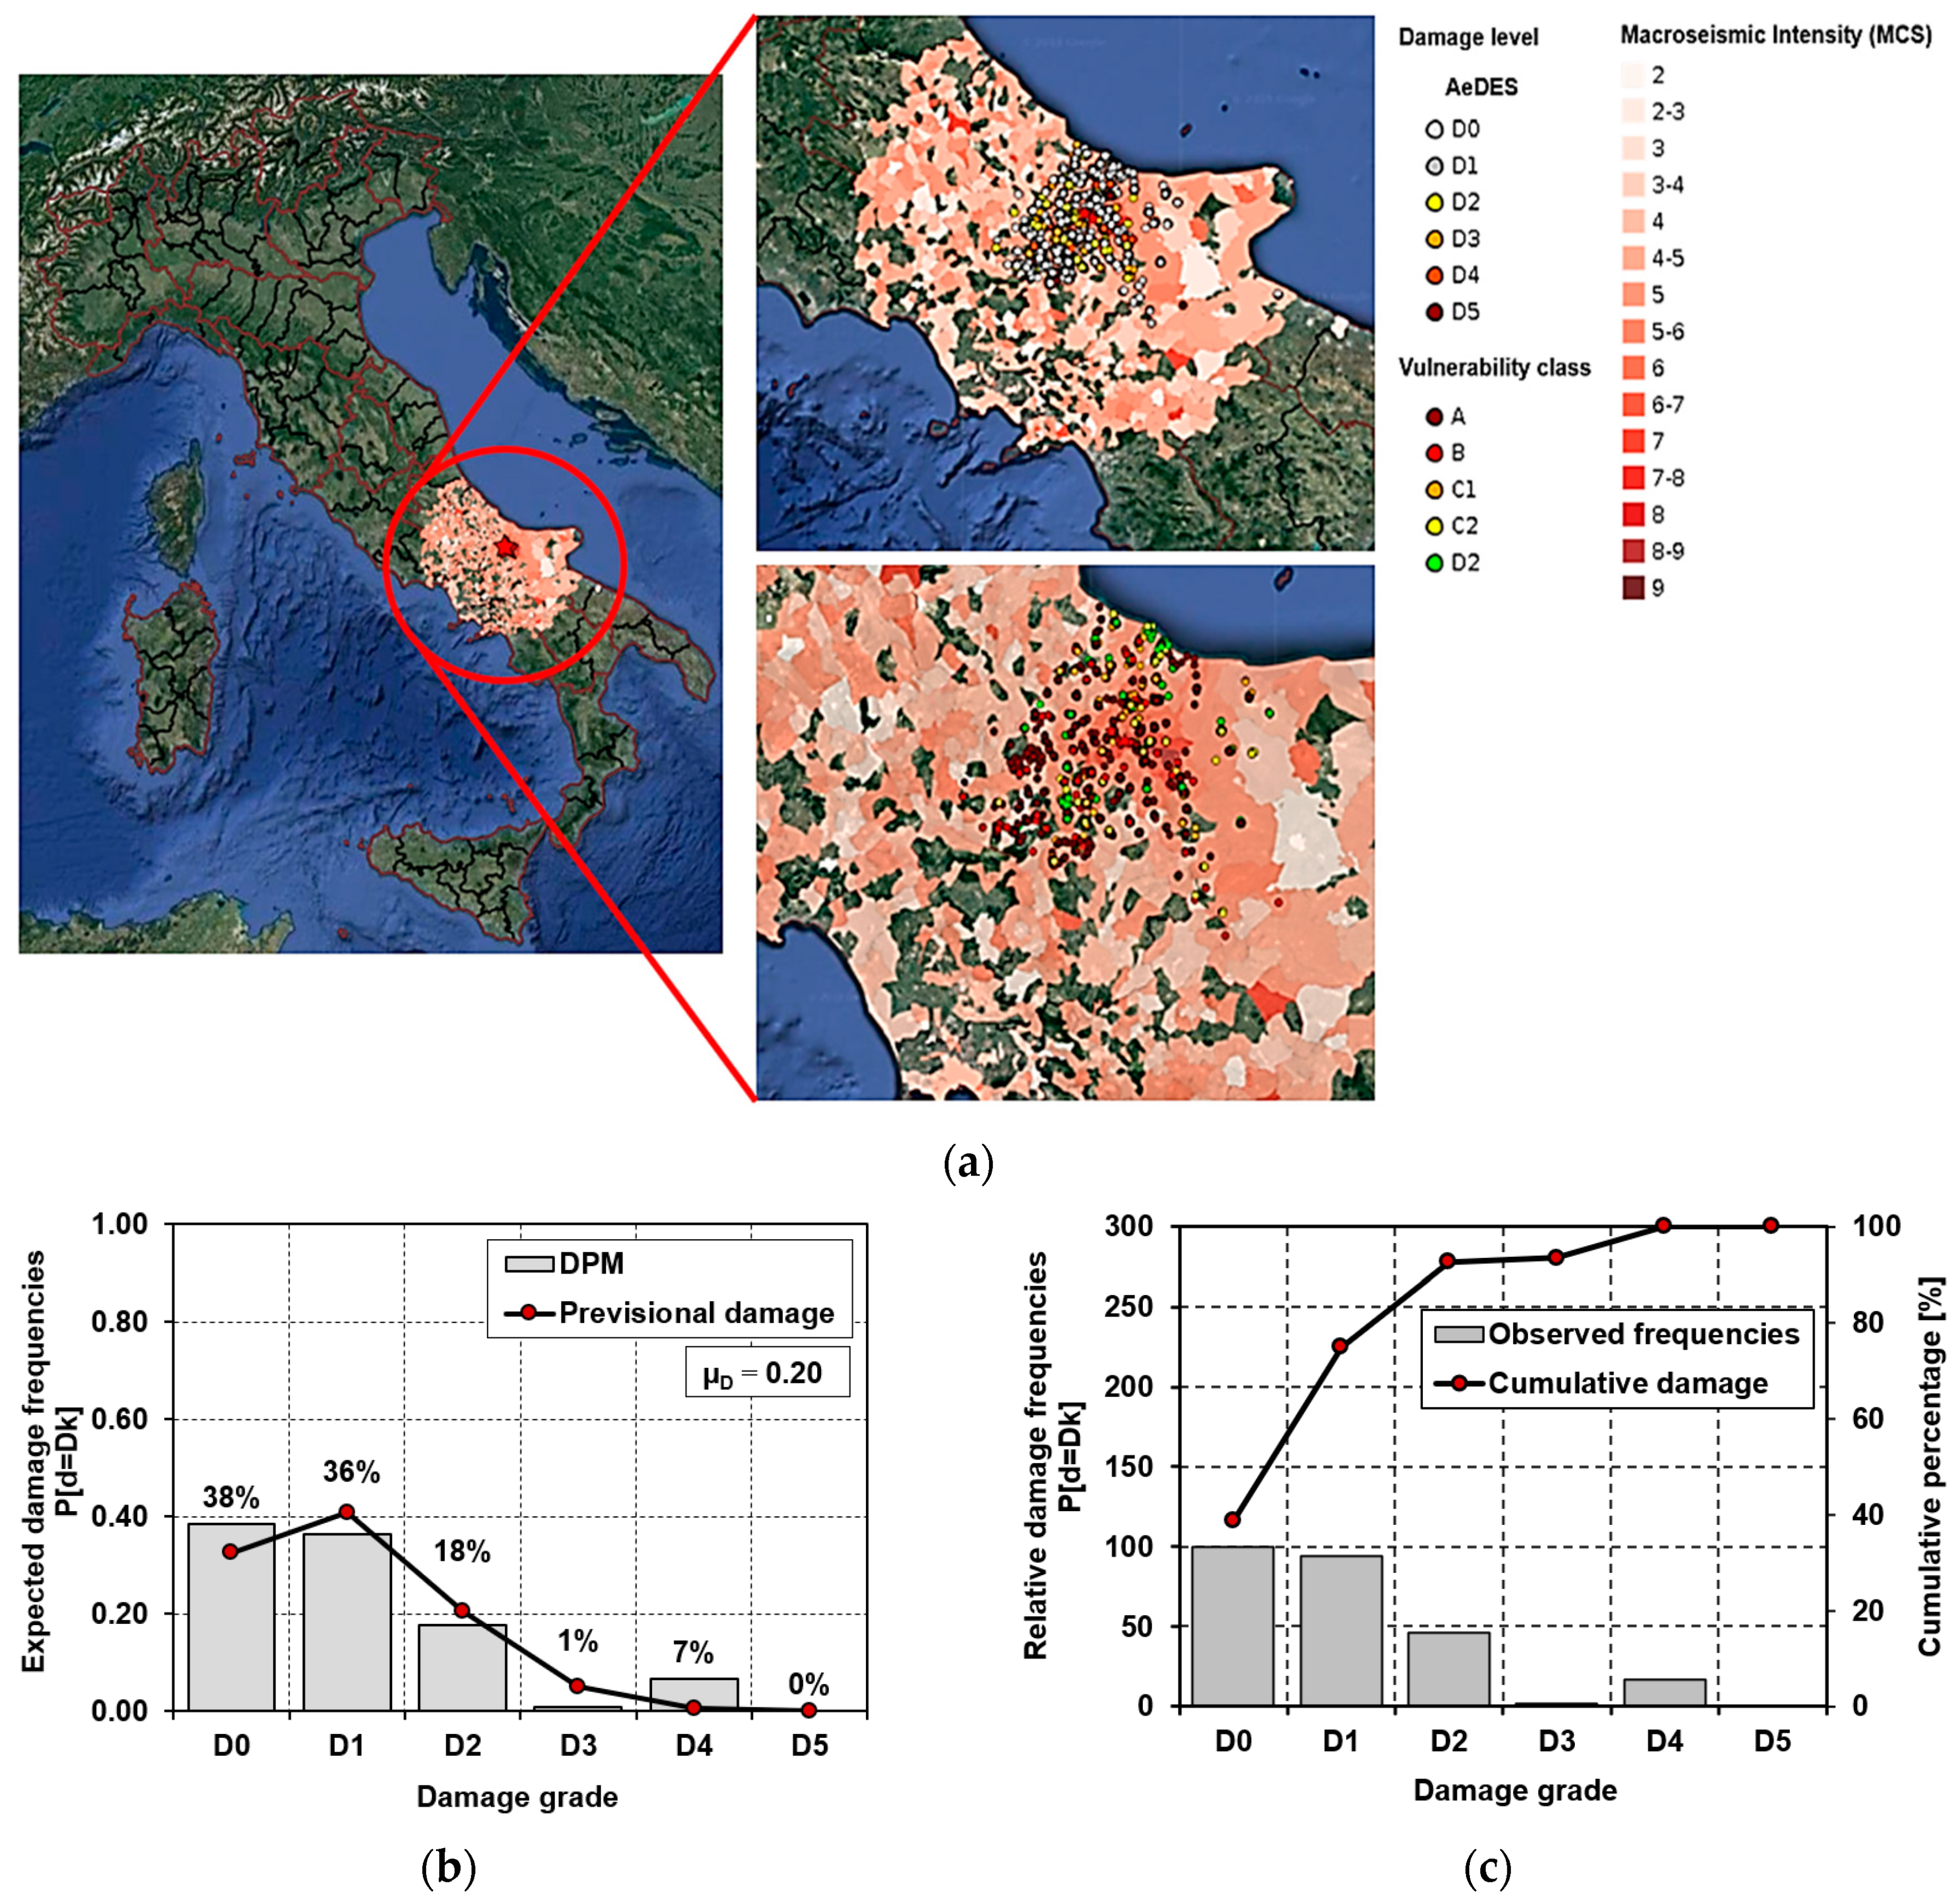
Moreover, selecting the event which occurred in Molise in 2002, with the epicentre located in Bonefro, it has been possible to deduce the typological classes, the damage levels and the macroseismic intensity of the study area. Subsequently, the graphical representation of DPM has been done, as shown in
Figure 9 [
28].
Furthermore, for the typological classification of the surveyed buildings, a parallelism has been conducted between the CARTIS, Da.D.O and EMS-98 methods, as illustrated in
Table 1, in order to contextualize the prevalent typological vulnerability classes.
In
Table 1, it is noticed that the vulnerability classes are identified on the basis of the vertical structure features. In particular, the compared methods use the vertical structures typologies as a common prerogative for classification purposes, which sees the vulnerability level reduction from MUR1 (irregular stones) masonry buildings to RC framed structures. Likewise, the other methods, which use acronyms or definitions to identify the vertical structure materials, the EMS-98 macroseismic method adopts four classes for their definition from A (the worst) to E (the best).
According to the European Macroseismic Scale (EMS-98), the typological vulnerability classes of the investigated urban area are shown in
Figure 10.
3.3. Large Scale Seismic Vulnerability Assessment
A seismic vulnerability assessment at the urban scale has been implemented in order to evaluate the propensity for the damage of buildings exposed to earthquakes. In this context, a vulnerability index-based method has been adopted.
The peculiarity of this method, proposed by Formisano et al. (2015) [
30] and Formisano et al. (2018) [
31], is the possibility of investigating the seismic vulnerability of buildings grouped in compounds through the vulnerability form depicted in
Table 2.
This form, based on the method proposed by Benedetti and Petrini many decades ago [
32,
33], is appropriate for masonry building aggregates, and uses five new parameters, additional with respect to the original form ten parameters proposed by the above-mentioned researchers, which take into account the effects of mutual interaction under earthquakes among aggregated Structural Units (S.Us). With regard to the five new added parameters, in order to obtain a form totally homogeneous with the previous one, the scores and weights assigned were calibrated numerically on the basis of the results of specific numerical parametric non-linear analyses. These analyses were performed by the 3MURI software, which uses the Frame by the Macro-Elements (FME) computational method. Further information on how scores and classes were determined are found in the aforementioned work by Formisano et al. (2015) [
30].
Methodologically, the vulnerability index, I
V, for each S.U., is intended as the weighted sum of the class selected for each of the 15 parameters listed in
Table 2 multiplied by the respective weight. The estimated parameters are grouped into four vulnerability classes (A, B, C and D, from the best to the worst), characterised by a specific score (also with a negative sign in case of a vulnerability reduction), to which a correspondent weight, W
i, is assigned, this weight being variable from a minimum of 0.25 for the less important parameters, and up to a maximum of 1.50 for the most important one.
Thus, the vulnerability index, I
V, is calculated according to the following equation:
where, S
i, are the specific scores associated with each parameter, and W
i are the assigned weights. Subsequently, the vulnerability index value I
V is normalized in the range [0–1] by means of Equation (3), assuming, from this moment, the notation V
I:
where I
V is the vulnerability index deriving from the previously form; (S
min · W
i), equal to −125.50, represents the sum of scores associated to the vulnerability class A of each parameter multiplied by respective weights; (S
max · W
i), equal to 495.00, represents the sum of scores associated with the vulnerability class D of each parameter multiplied by the respective weights; and the denominator, equal to 620.50, represents the vulnerability total interval.
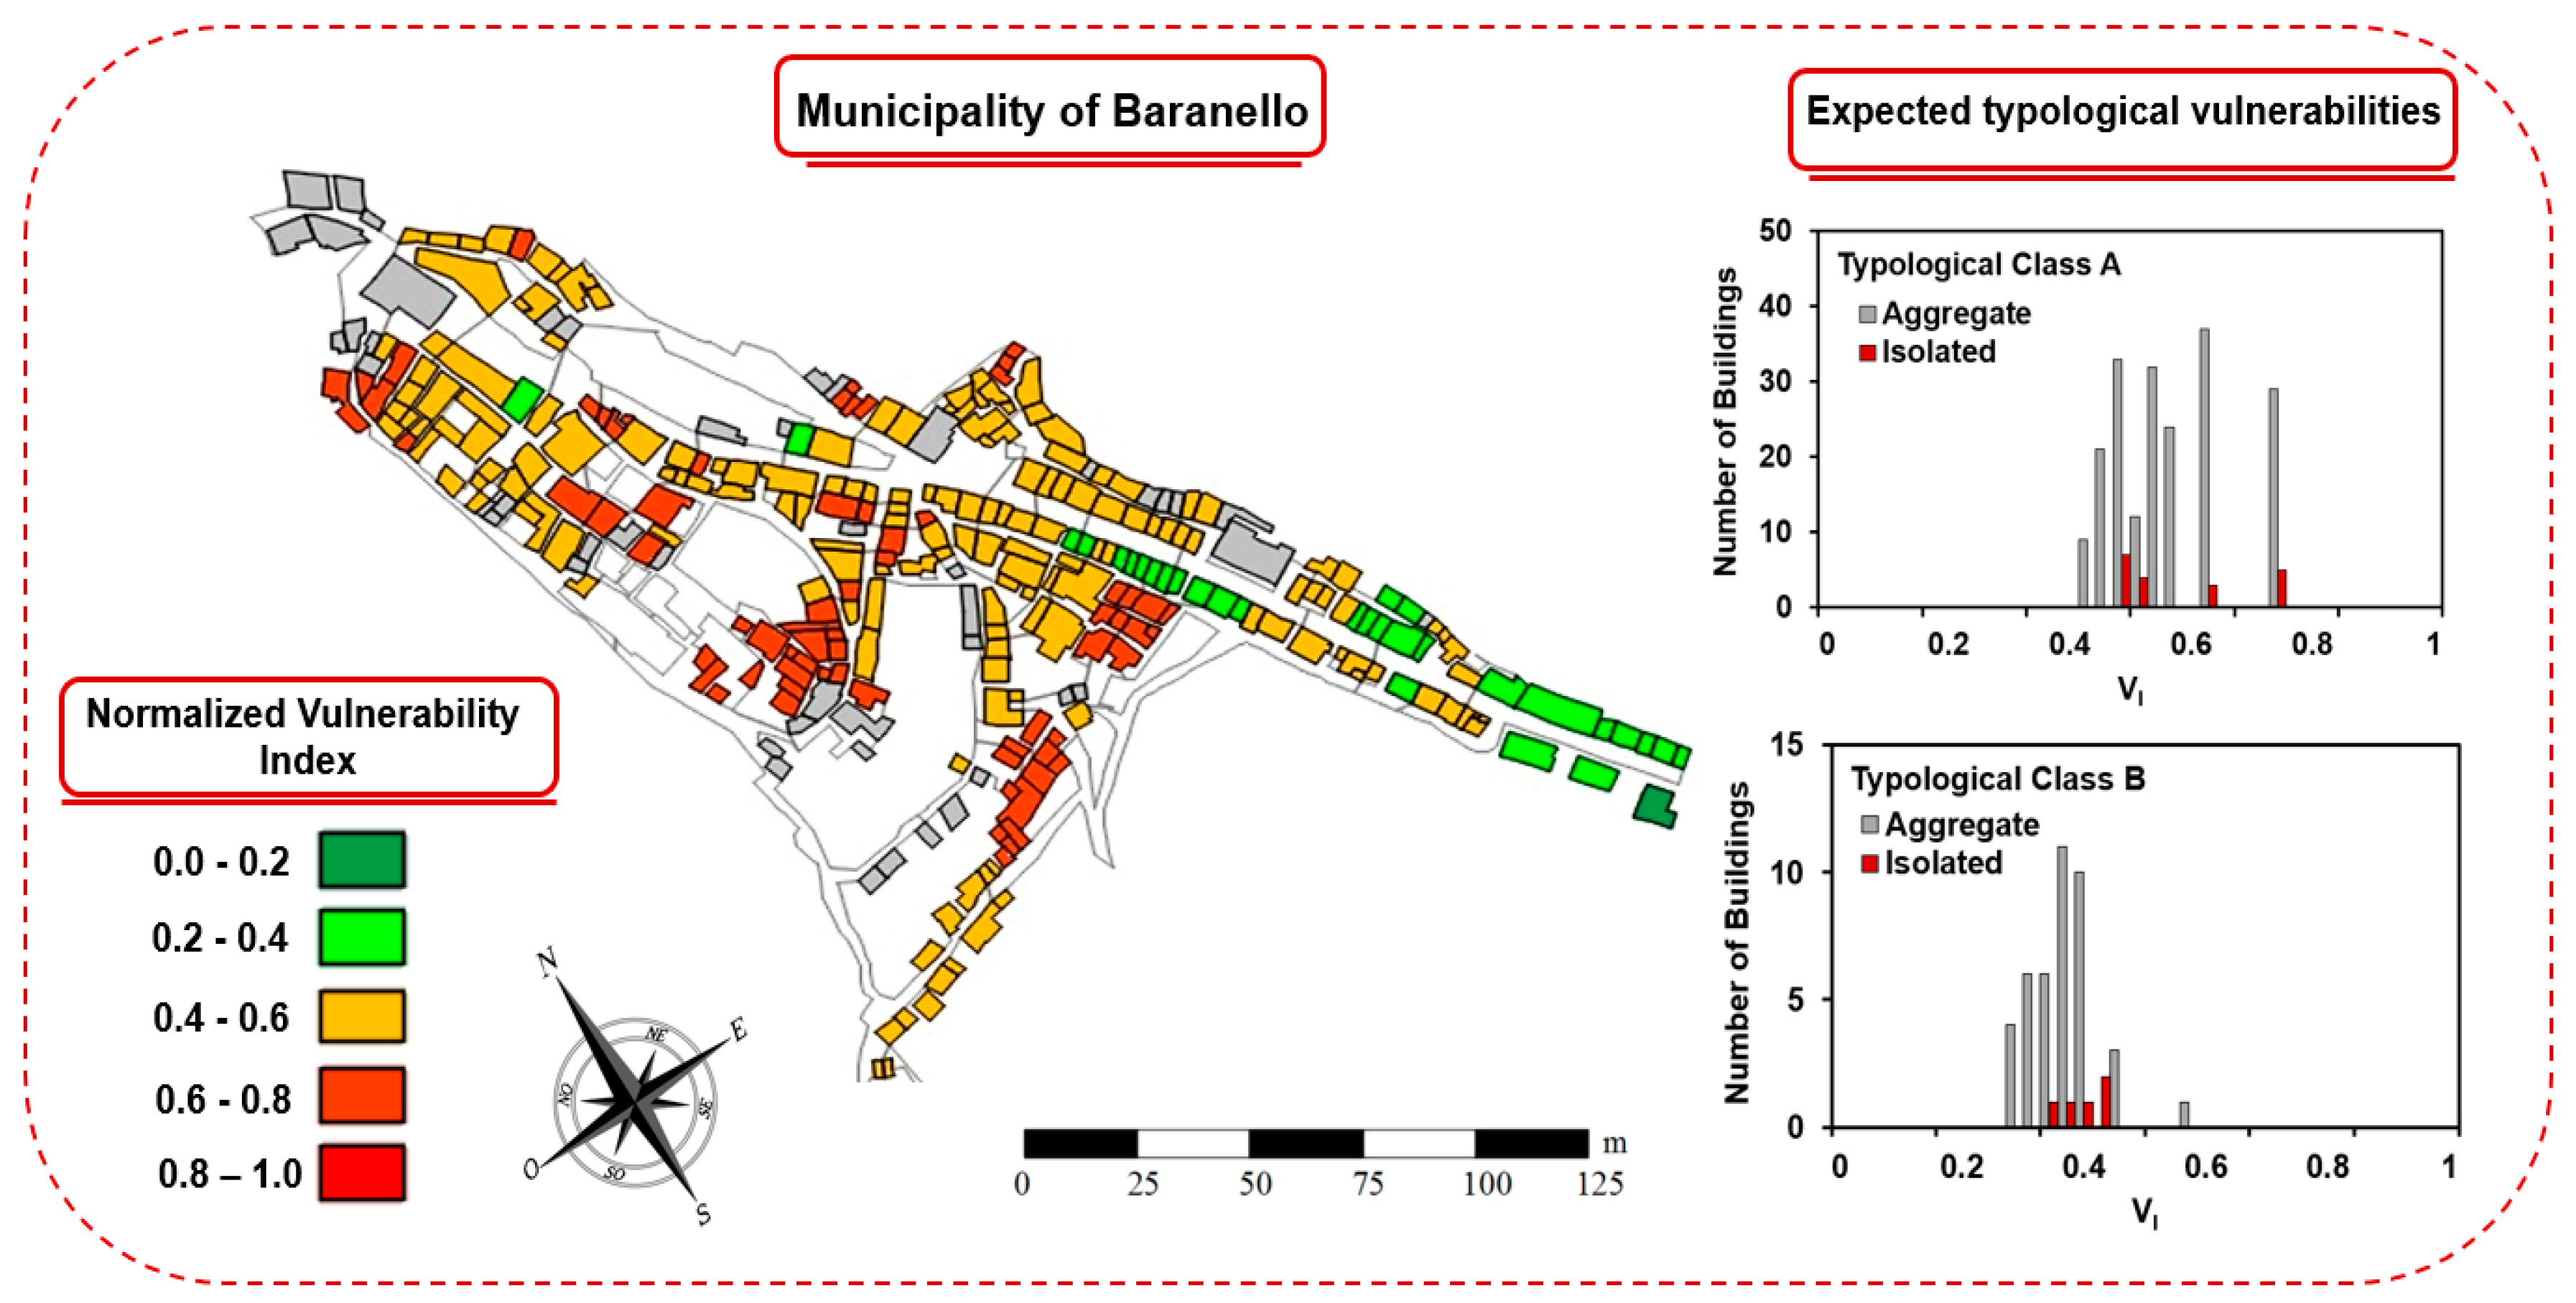
According to what has been above specified, the distribution of the typological vulnerability is represented in
Figure 11.
As it is seen in the previous figure, the distribution of the vulnerability results is quite homogeneous, with an expected medium–high vulnerability enclosed in the range [0.4–0.6] for typological class A, while only 30% of the samples have a vulnerability index (VI) equal to 0.76. Moreover, for the analysed typological class B, the expected frequency is in the range [0.2–0.4], which corresponds to a moderate vulnerability level.
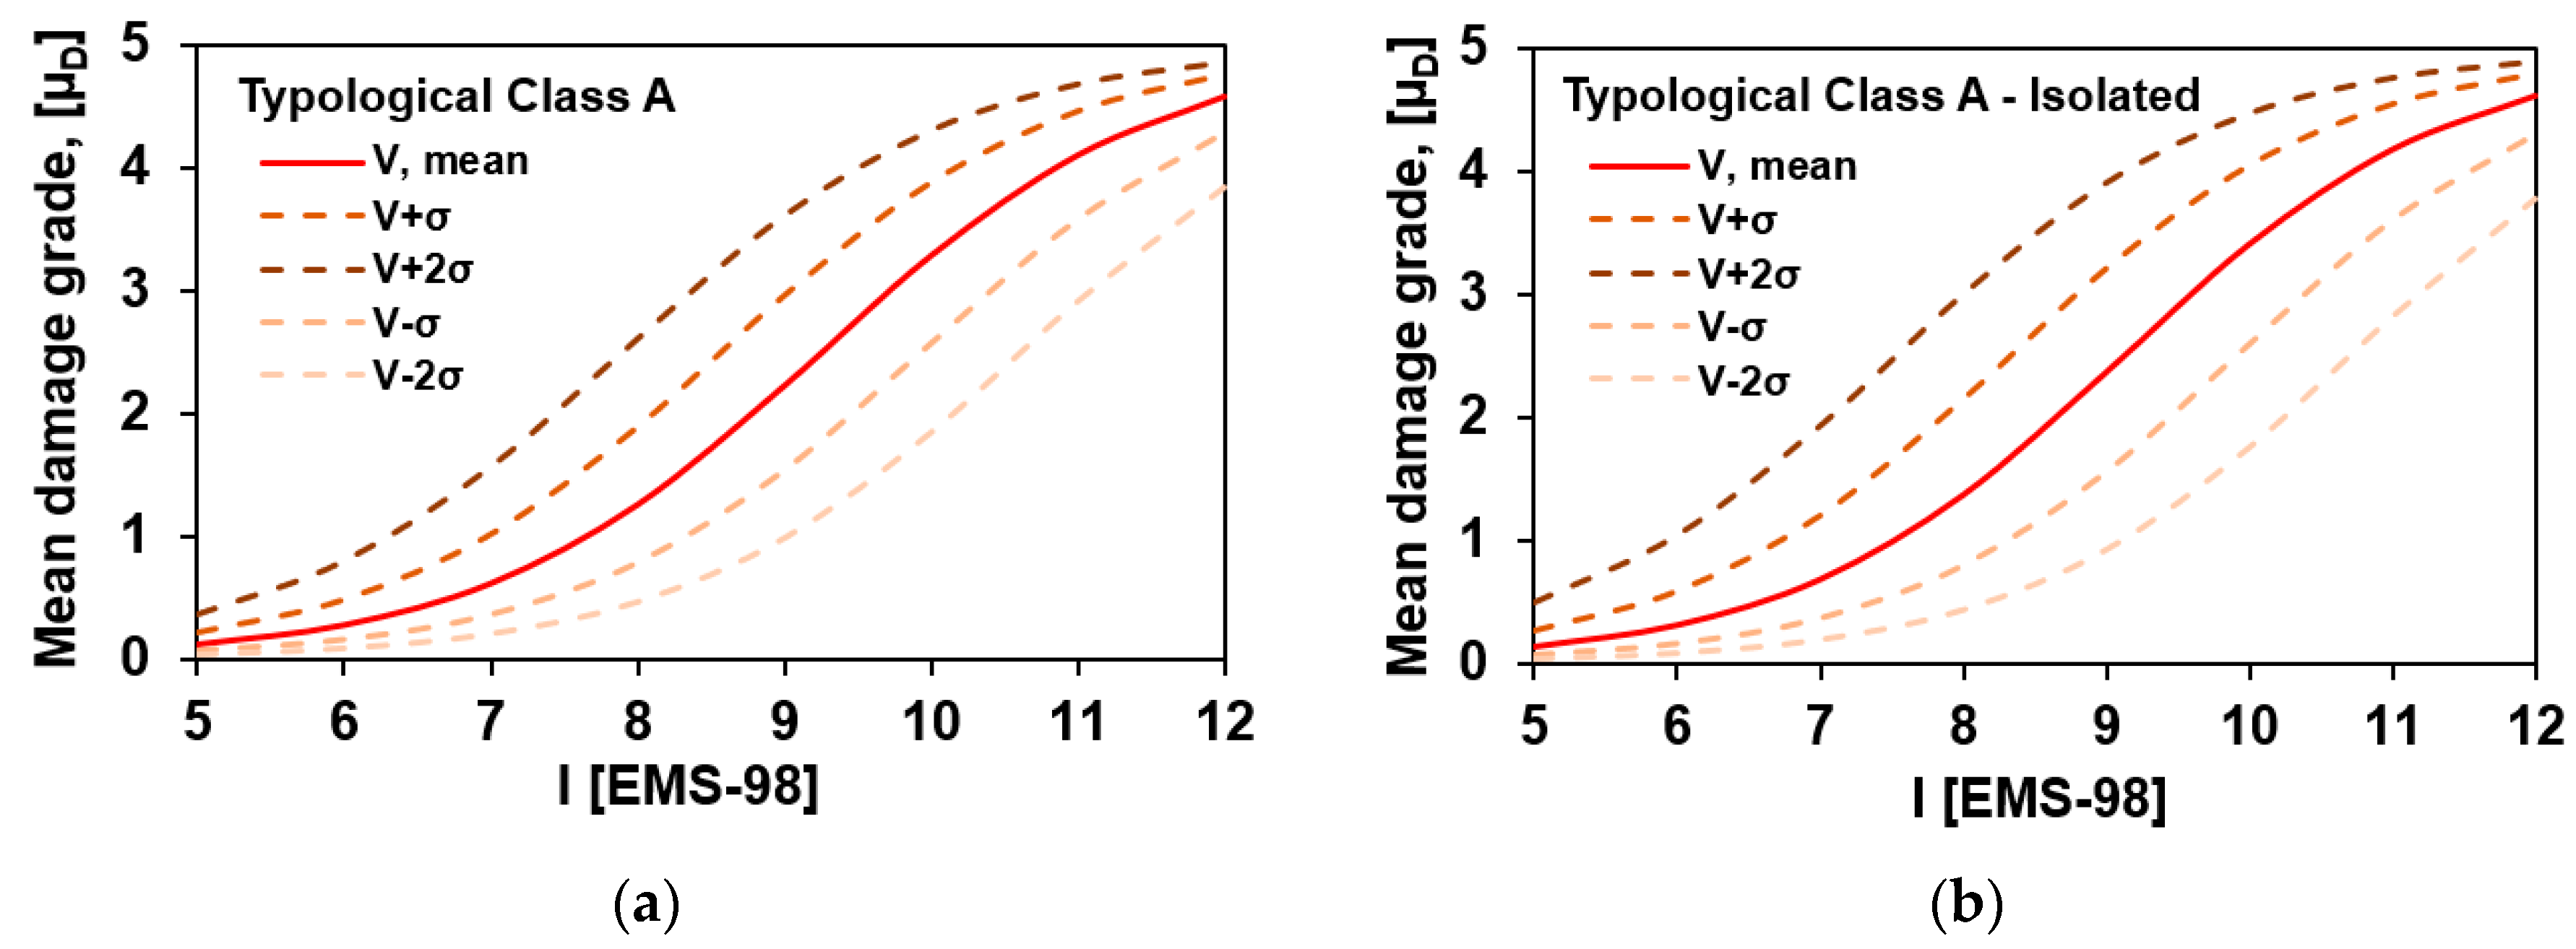
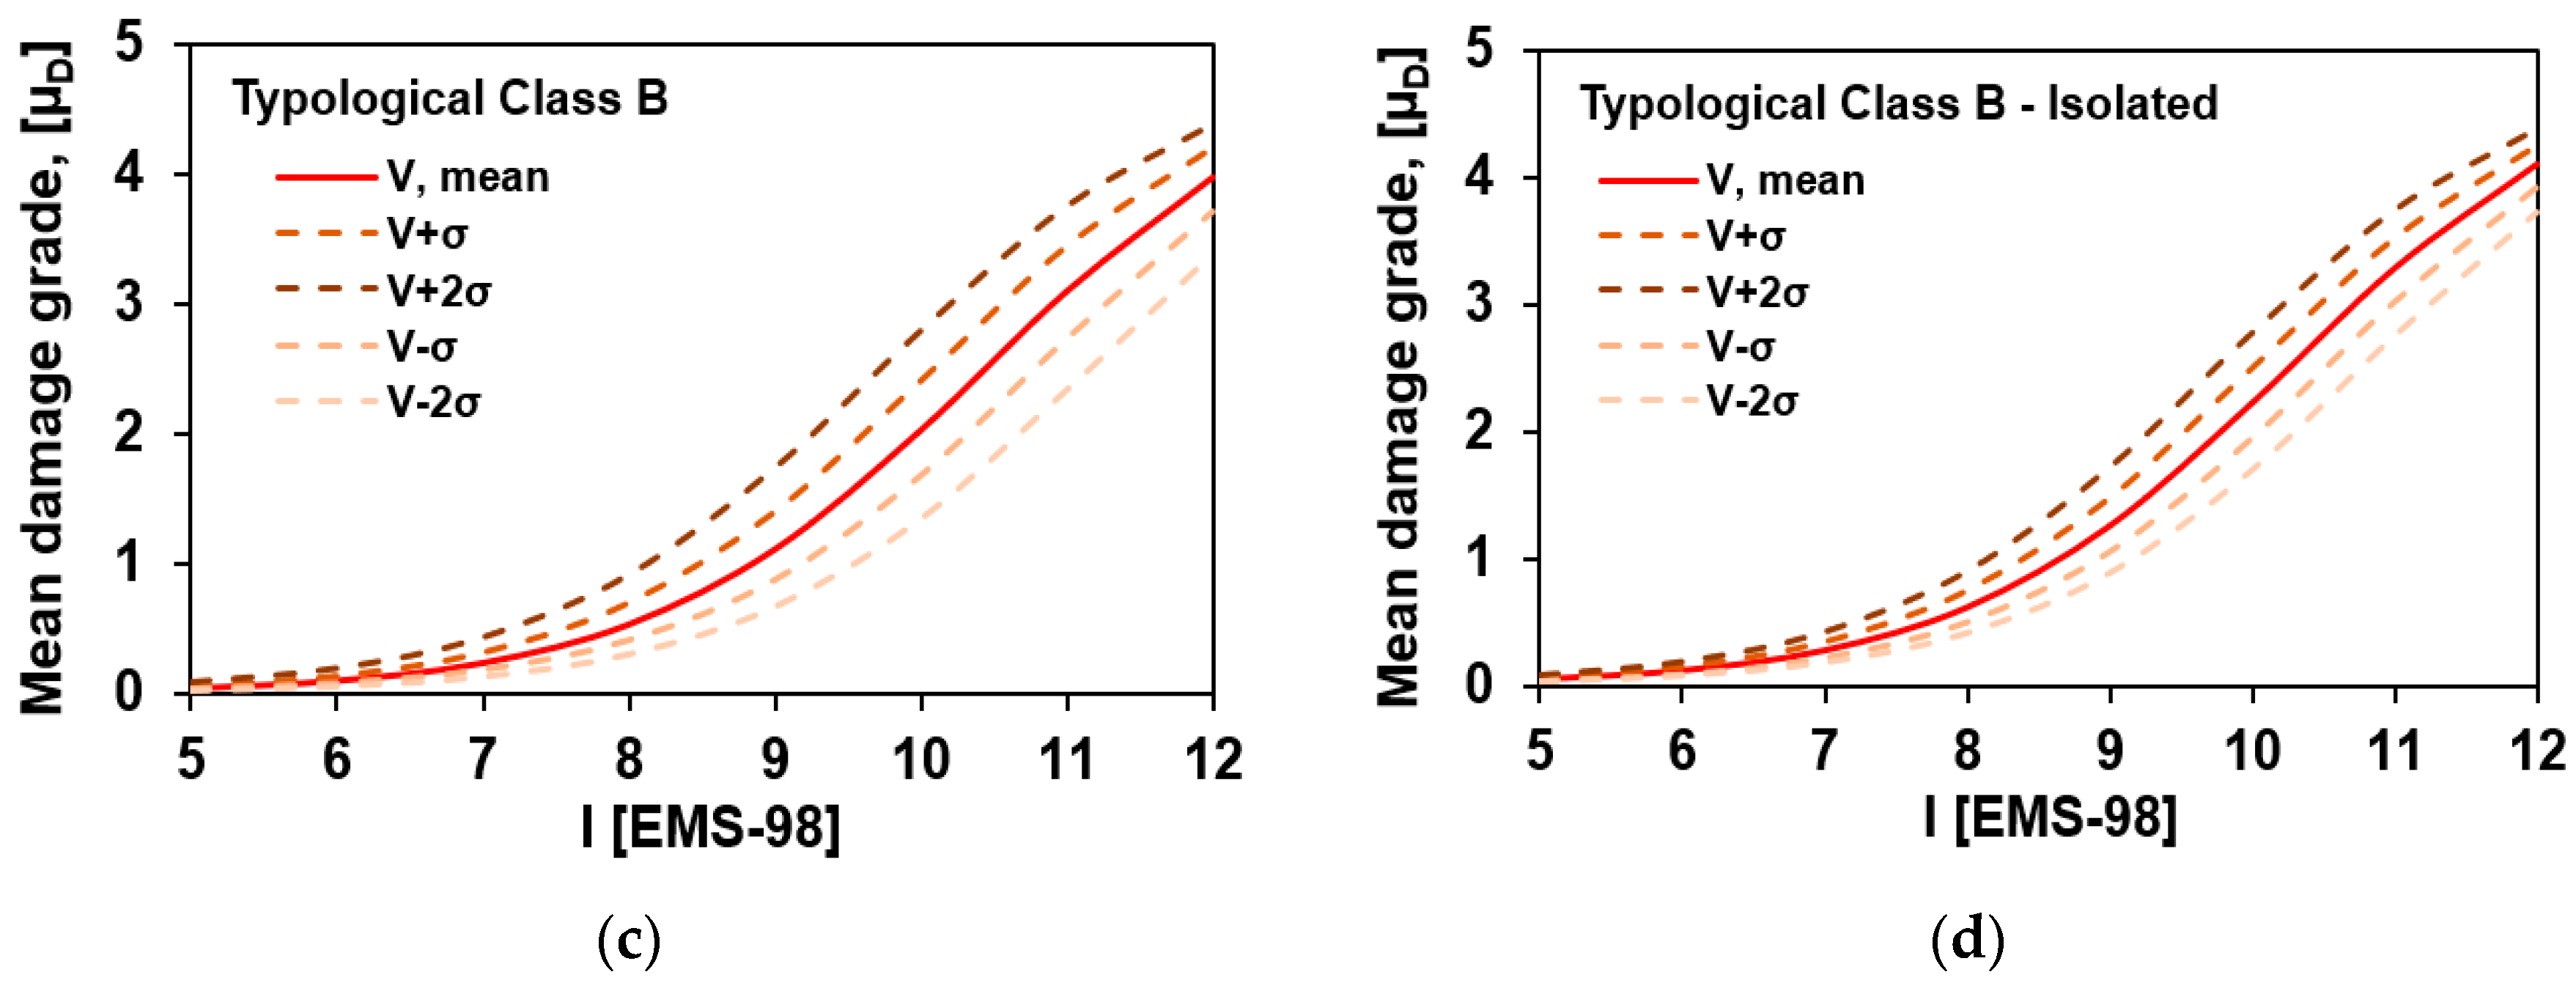
Subsequently, vulnerability curves [
34,
35,
36] have been obtained to estimate the propensity for the damage of the analysed building stock (
Figure 12).
More in detail, these curves express the level of damage achieved as a function of macroseismic intensity “IEMS-98”, which is defined according to the European macroseismic scale EMS-98.
In particular, as shown in Equation (4), the vulnerability curves depend upon the vulnerability index (V
I), on the seismic hazard, expressed in terms of macroseismic intensity (I
EMS-98) and the ductility factor Q, which describes the ductility of a certain typological class, and assumes, in the case under study, the value of 2.3 [
36].
As reported in the previous
Figure 12, the vulnerability curves are derived for a sample of buildings representative of the construction types found in the inspected area. However, for a more accurate representation of the expected damage, the mean typological vulnerability curves have been represented together with other curves, taking into account the statistical variability of damage in the vulnerability range (V
m − σ, V
m + σ; V
m + 2σ, V
m − 2σ) [
2,
36,
37,
38].
3.4. Estimation of Seismic Impact Scenarios
The evaluation of possible seismic damage scenarios is essential when planning a strategic measure to mitigate the risk. Basically, the earthquake is a natural phenomenon generated by the accumulation of stresses in particular points of the lithosphere, among the surfaces in contact with ancient faults or in other areas. The energy is released under the form of P-waves and S-waves, which radiate at different velocities in all directions with roughly spherical wavefronts. There is, therefore, an attenuation of the seismic wave energy from the epicentre to the different sites where earthquake effects are felt, since the amplitude of the volume waves decreases according to 1/D (D is the site–source distance), whereas for the surface waves the amplitude decreases about 1/√(D).
The prediction of the seismicity of a specific site can be evaluated by adopting appropriate seismic attenuation laws, which are empirical formulations calibrated on the statistical data (instrumental or macroseismic) analysis of earthquakes occurred. Generally, these laws are based on simplified models in order to represent seismic propagation. In practice, an empirical relationship is established between some simple factors (energy released at the source through the magnitude (Mw), distance (D) or hypocentre (h) distances between the epicentre and the site) and some synthetic parameters (a, b, c and d) that better reproduce the set of instrumental or macroseismic observations.
Other research activities [
39,
40] were conducted to develop attenuation laws, generated in terms of spectral accelerations (S
a) and peak ground accelerations (PGA), or in terms of seismic intensity (MMI), from instrumental recordings of past earthquakes which occurred.
In the current research, the severity of the seismic effects has been analysed by predictive analyses using the following three seismic attenuation laws:
which were implemented by Crespellani et al. [
41], Cauzzi et al. [
42] and Esteva and Harris [
43], respectively, using the moment magnitude M
w and the site–source distance R (measured in km).
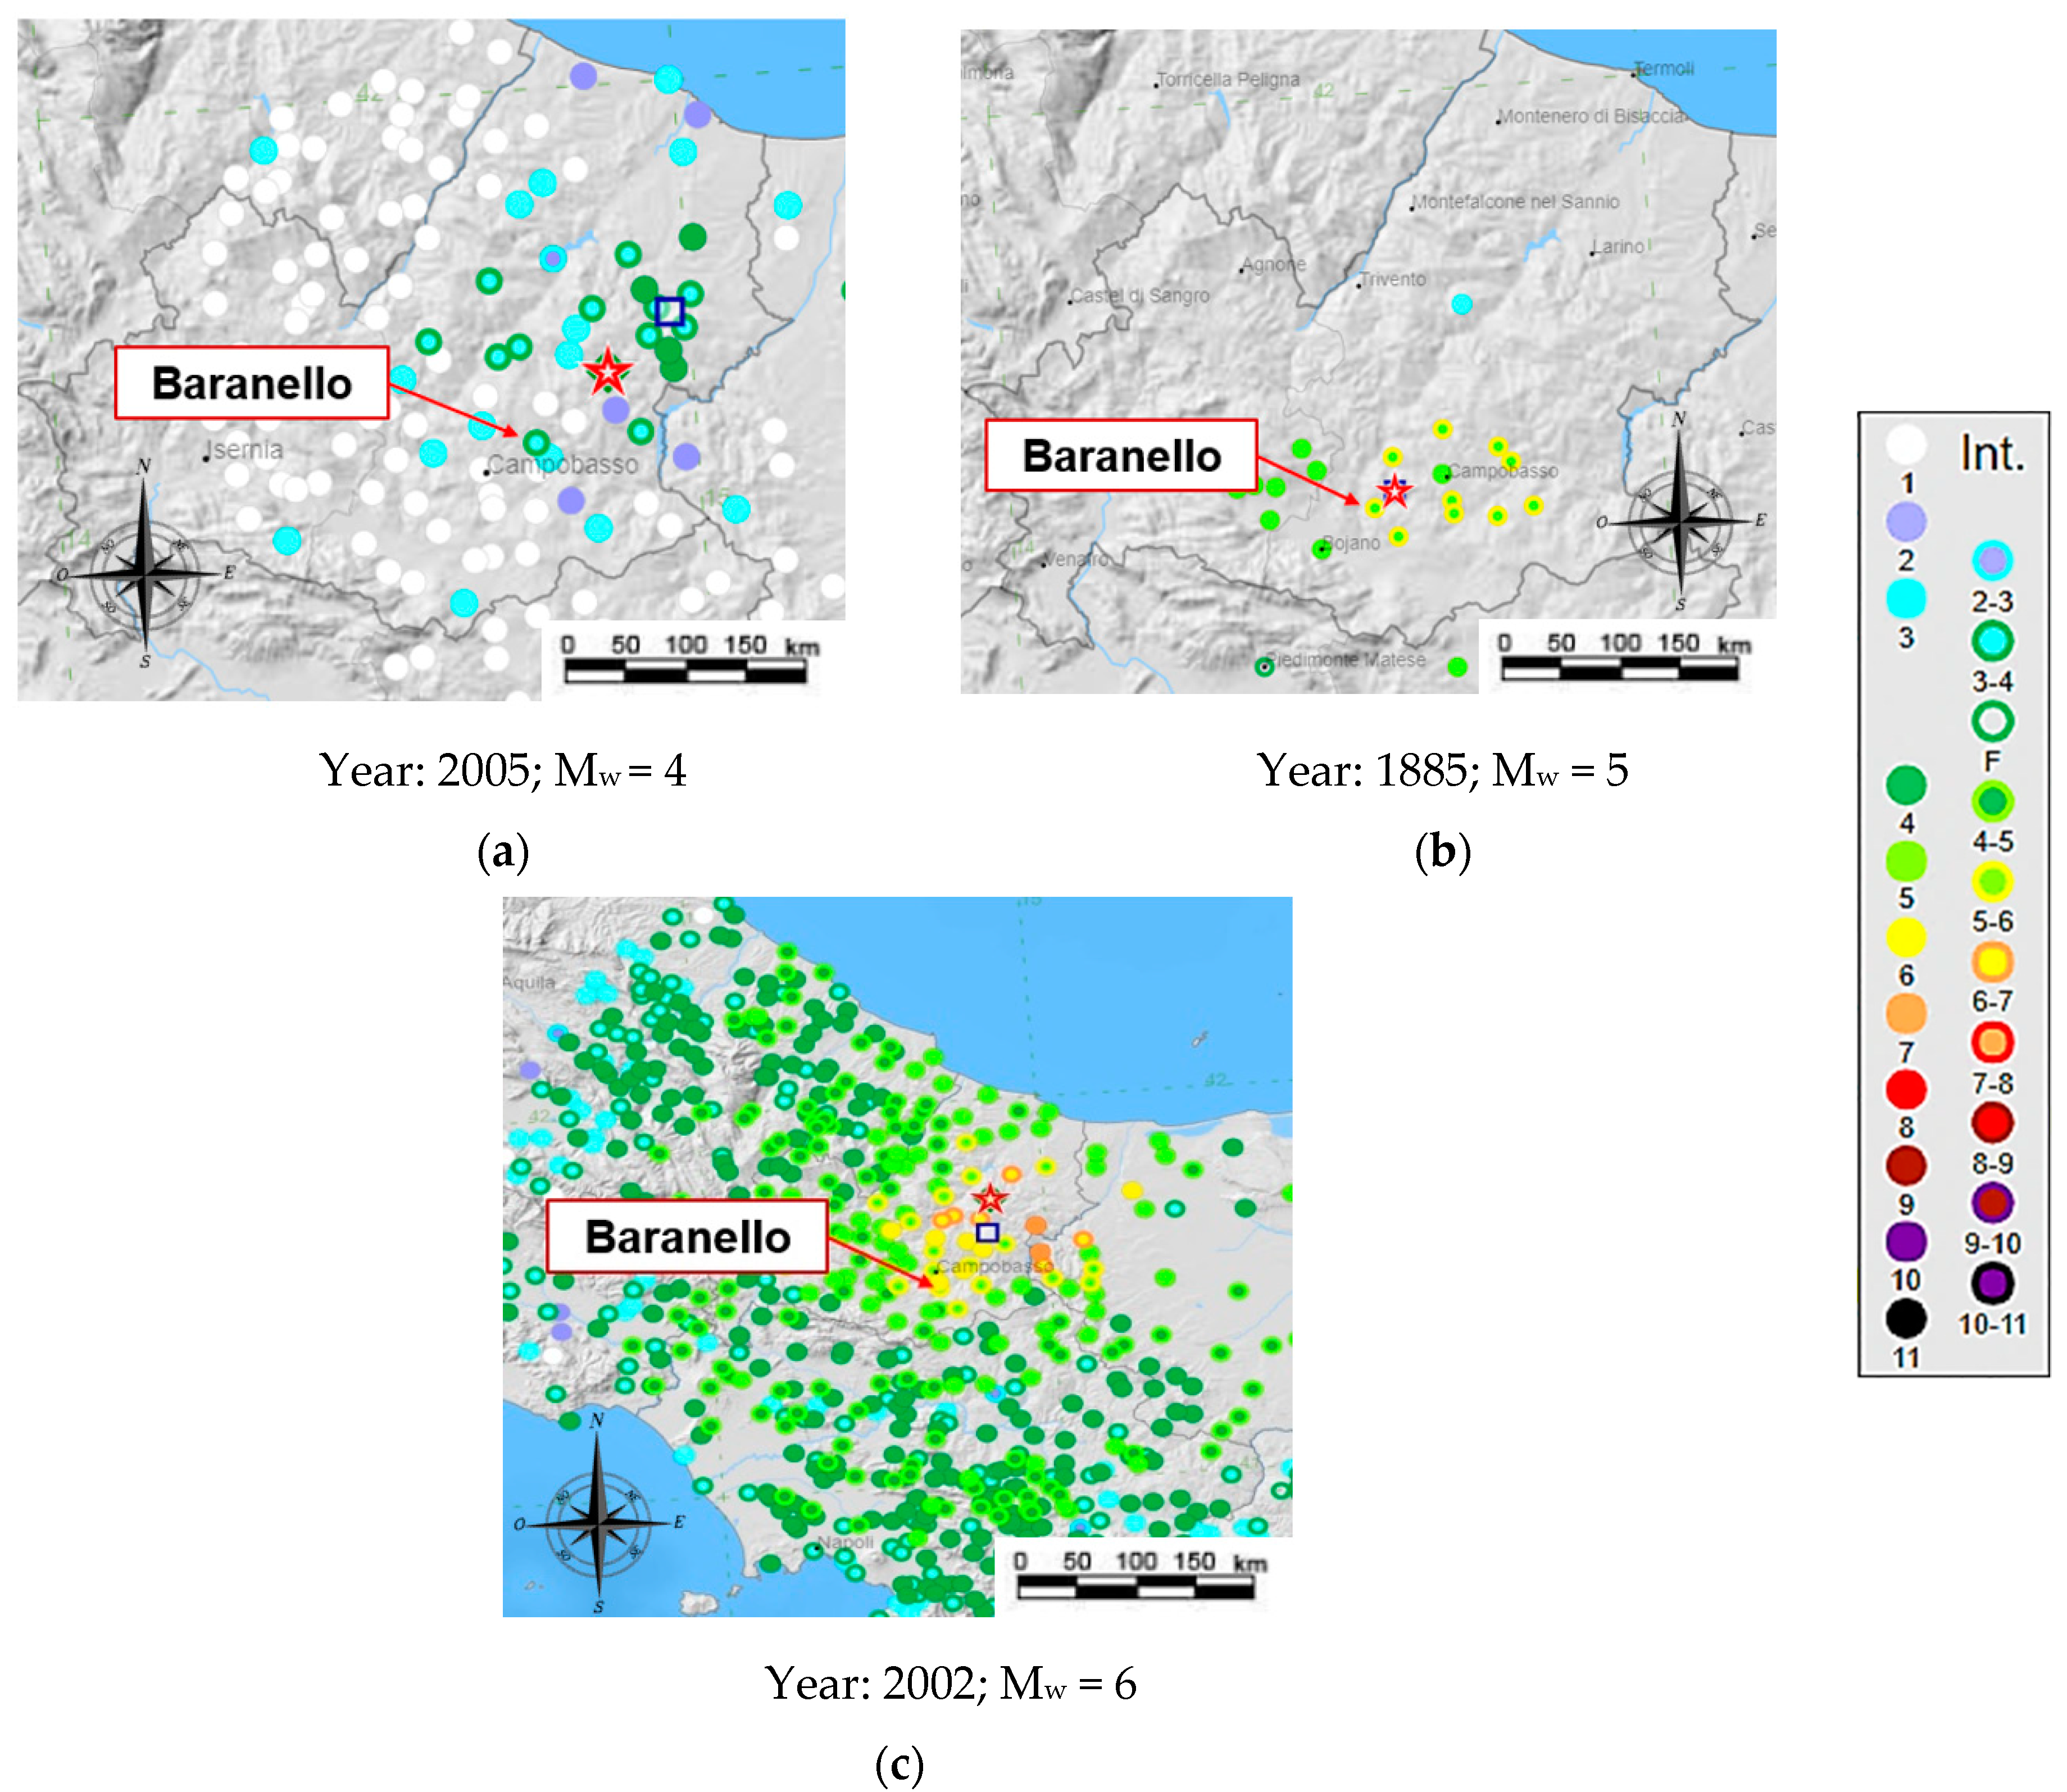
Therefore, the analysis conducted is based on an empirical-forecast method, where the probable damage scenarios are estimated by the disaggregation of the seismic risk obtained combining n-sources. In detail, a deterministic approach has been used by selecting as its reference earthquakes, according to the Parametric Catalogue of Italian Earthquakes (CPTI15) [
44], three events of increasing magnitude (4, 5 and 6) having occurred in the past in the Molise Region. After these moment magnitudes have been selected, the definition of different epicentre distances (in the range from 5 to 35 km) has allowed us to plot the expected damage scenarios (
Figure 13).
In particular, based on the three attenuation laws above mentioned, the macroseismic intensities have been correlated to the earthquake magnitudes on the basis of Equations (5)–(7), leading towards the 27 damage scenarios reported in
Table 3.
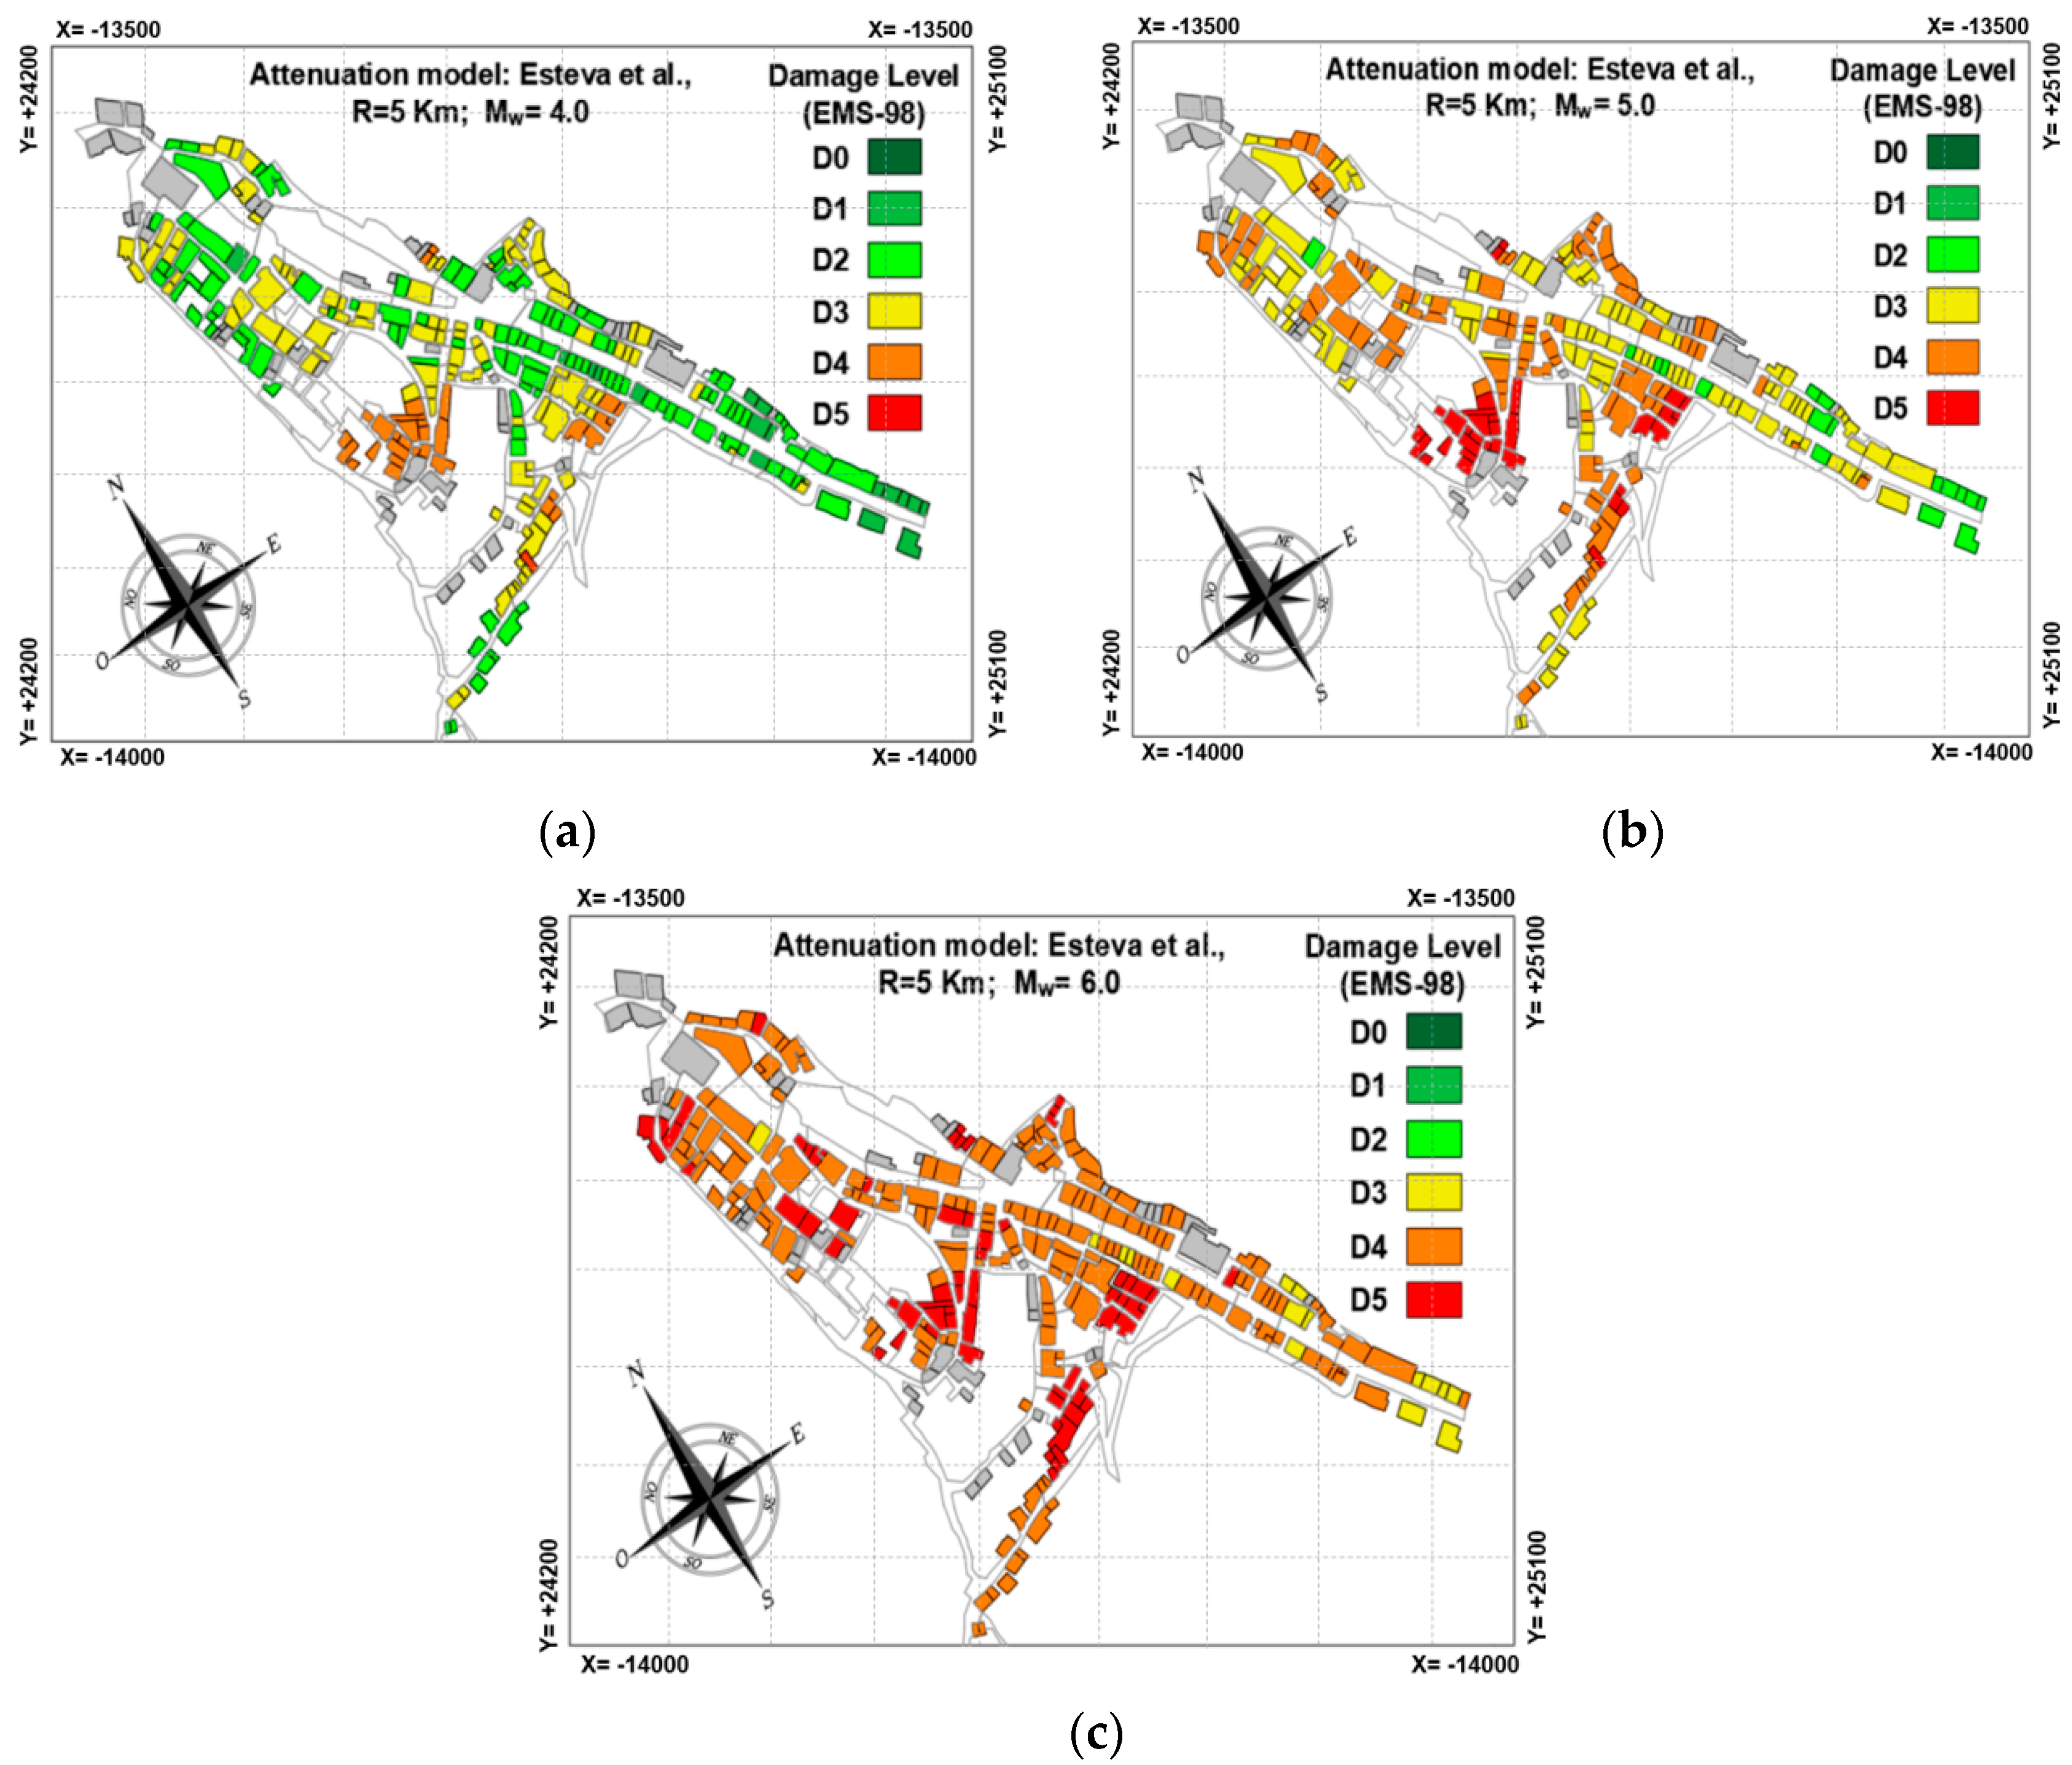
According to analysis results derived from the previous table, it is possible to notice how the attenuation model proposed by Esteva and Harris [
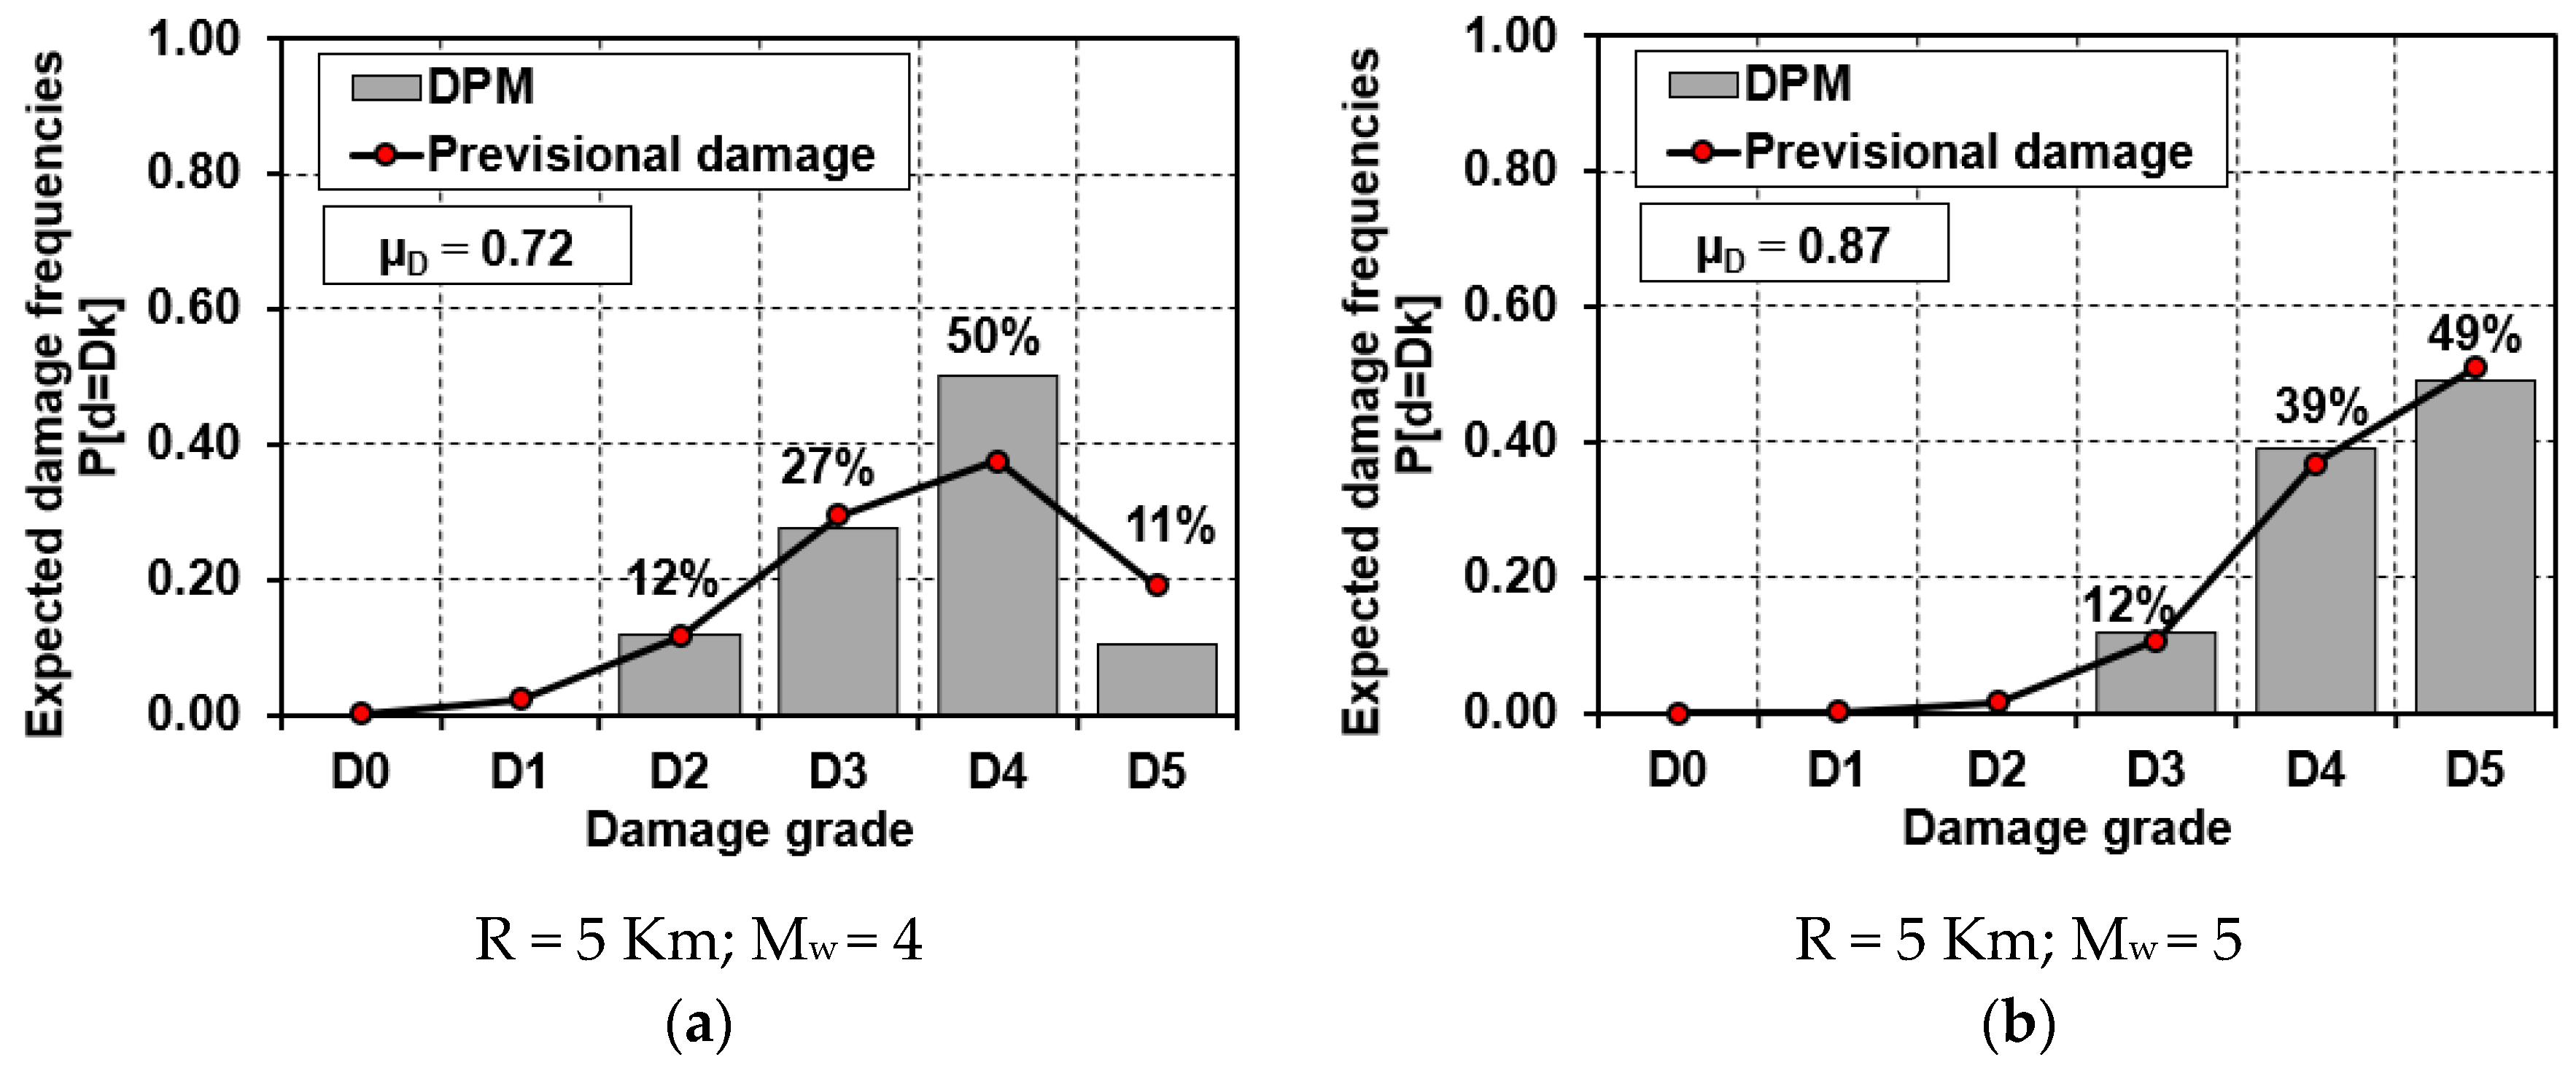
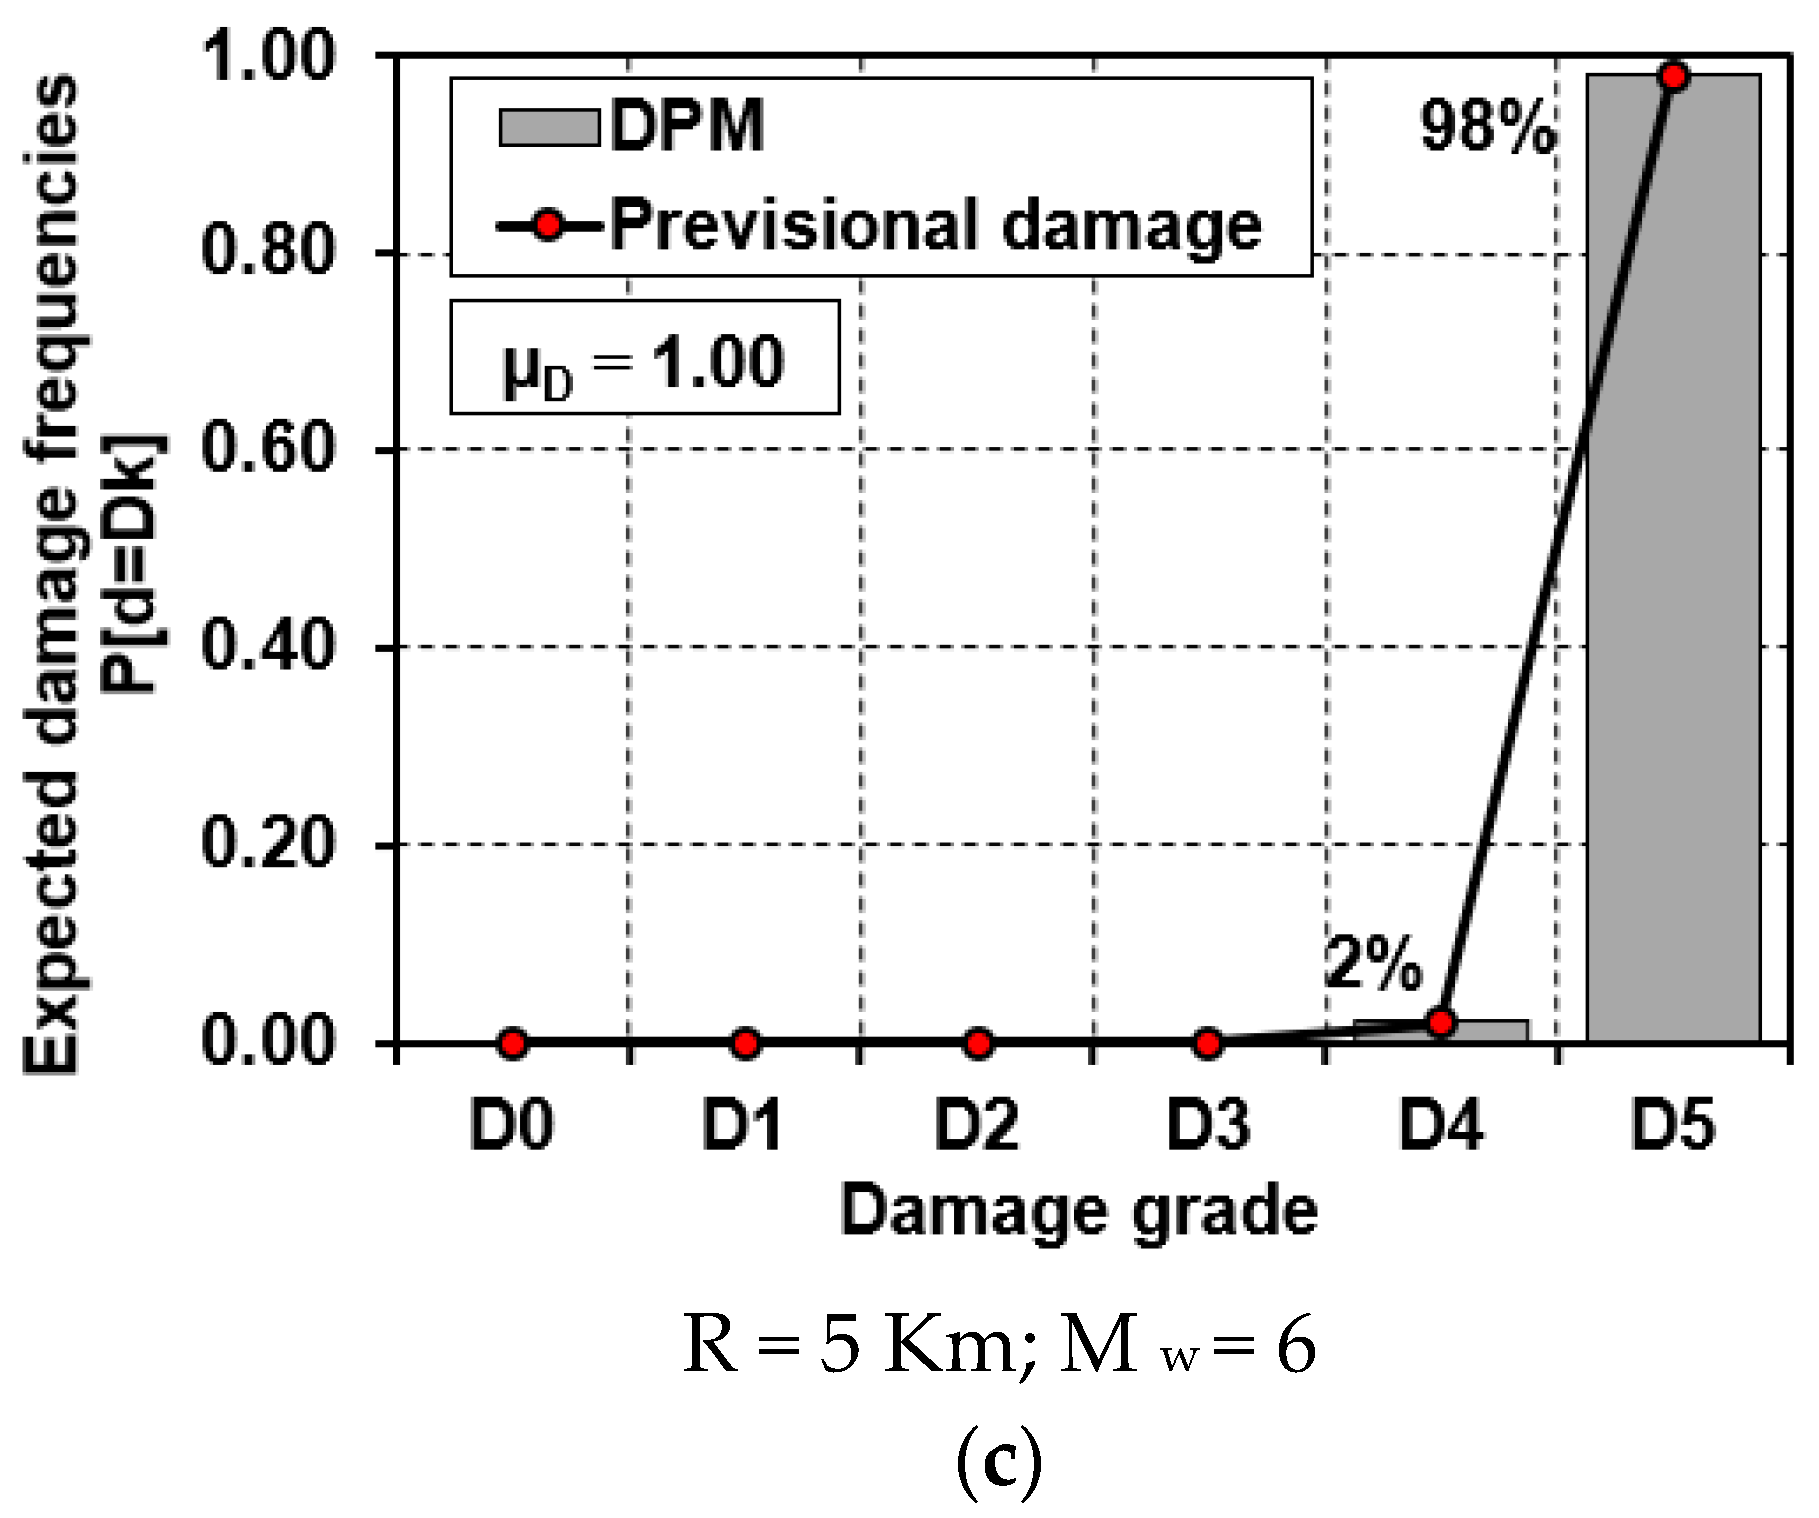
43] is the worst case, since, unlike the other laws, it provides the highest macroseismic intensities. Therefore, the damage scenarios achieved according to Esteva and Harris’ attenuation law considering R = 5 Km have been adopted to represent the most conservative risk assessment case, as shown in
Figure 14.
Then, the correlation between the mean damage grade, µ
D, and the damage thresholds, D
K, have been developed according to the EMS-98 scale (
Figure 15) [
45,
46].
From the analysis results, it appears that for Mw = 4 about 61% of the building suffers damage D2, while for Mw = 6, damage thresholds D4 (near-collapse) and D5 (collapse) are attained in 68% and 25% of the cases, respectively. Contrarily, when Mw = 5, a more variable damage distribution is achieved.
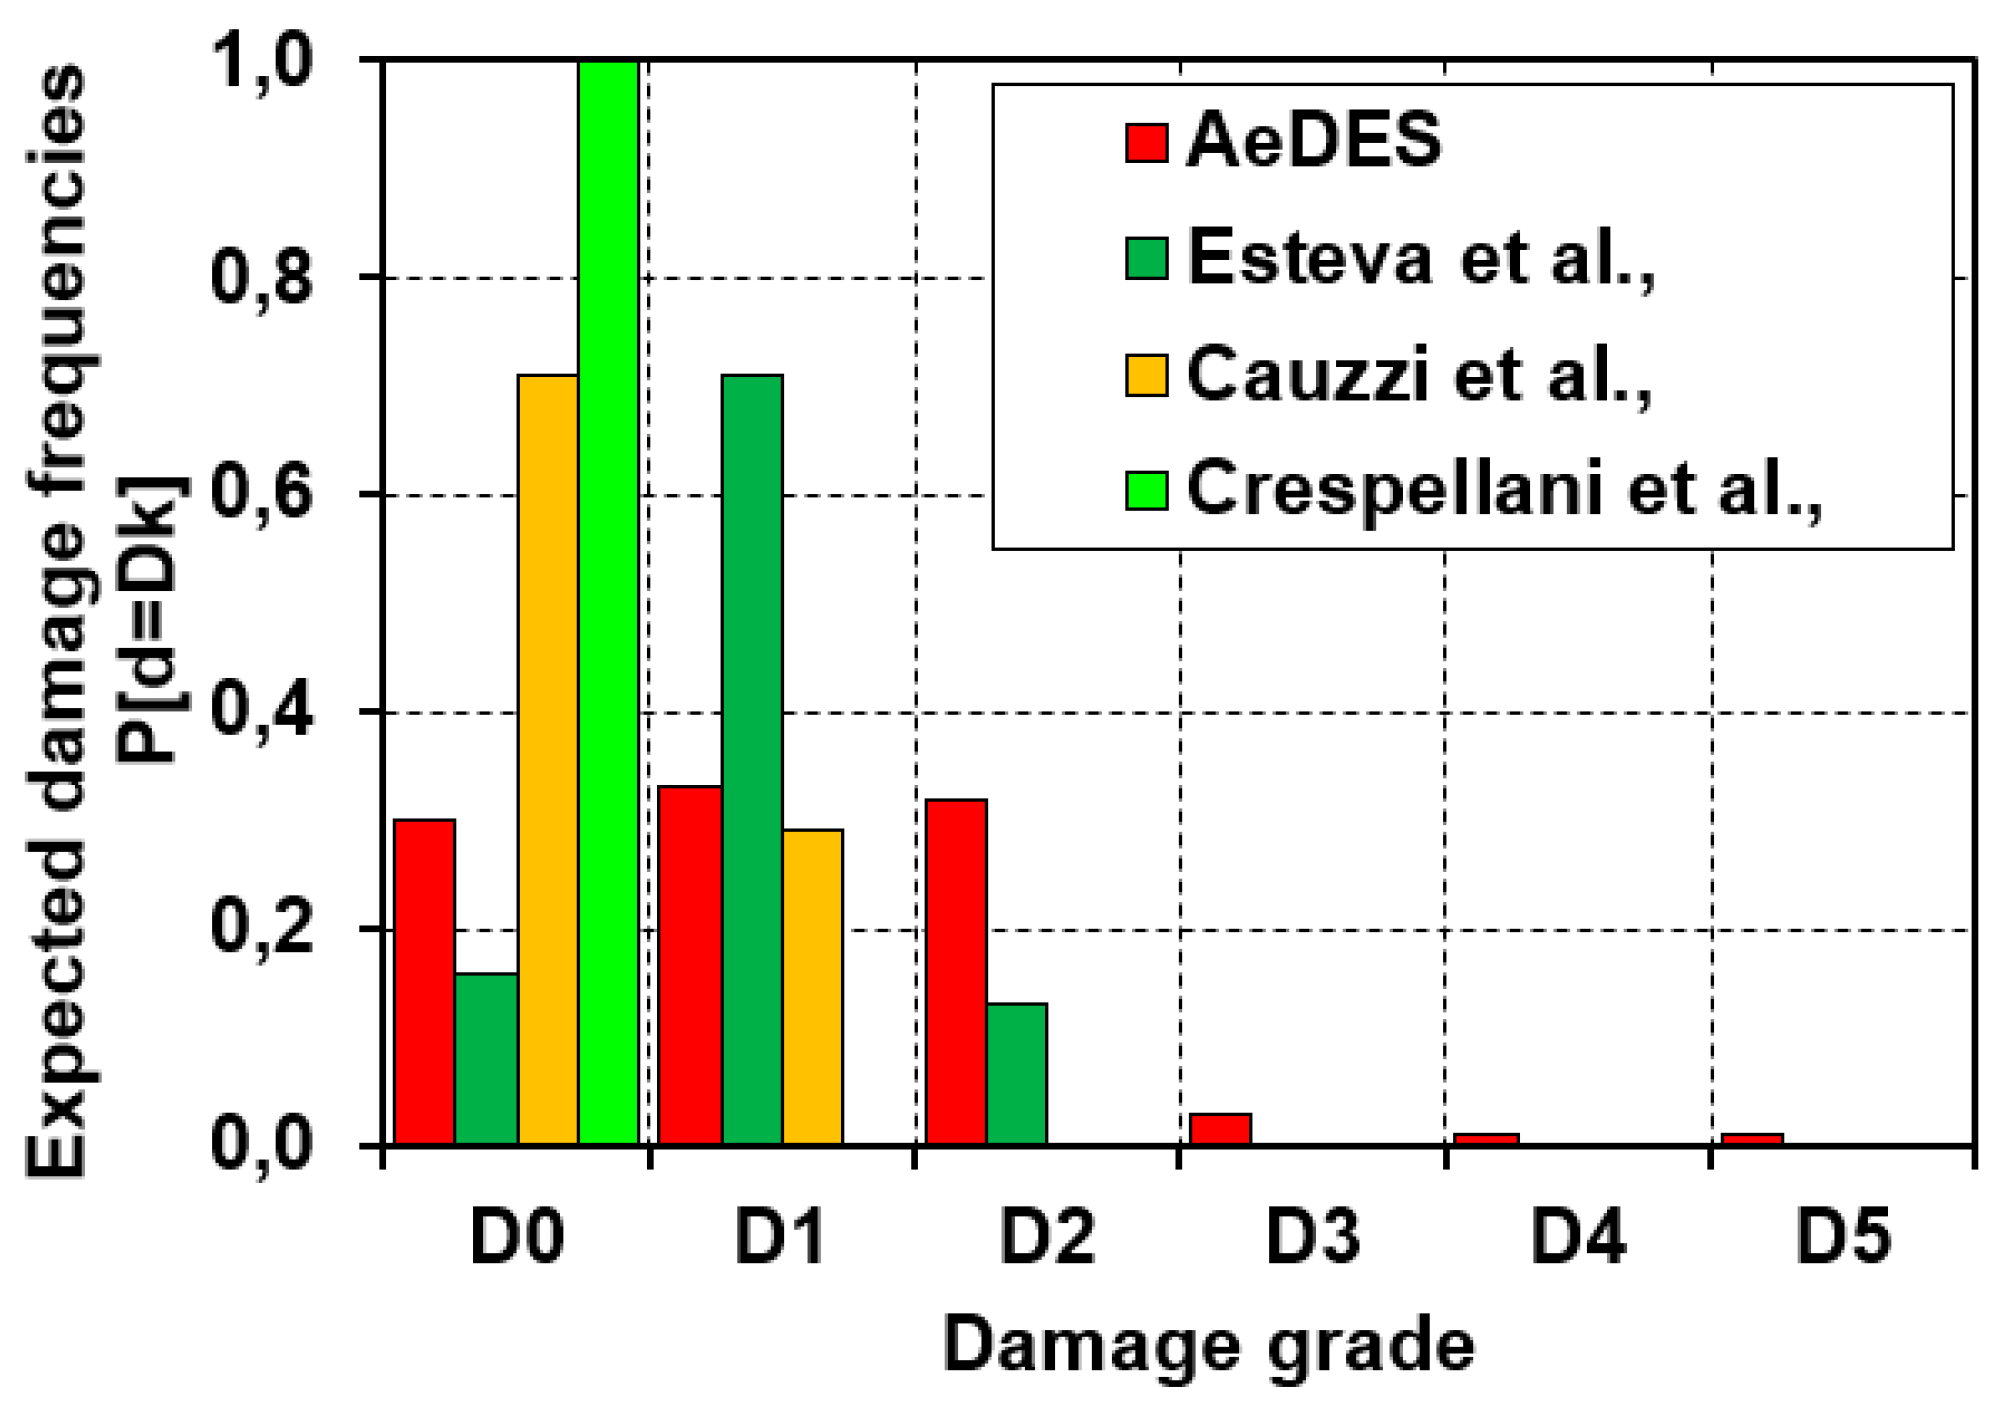
Consequently, having defined the damage distributions, a comparison has been made between the damage obtained through the proposed attenuation models and the corresponding damage achieved from the AeDES survey forms (
Figure 16).
From results obtained it is noted that Esteva and Harris’ seismic attenuation law [
43] allows us to better estimate the damage effectively found on site. Nevertheless, it should be observed that this seismic attenuation law tends to underestimate the damage thresholds D0 and D2, while overestimating the damage level D1.
3.5. Calibration of Typological Vulnerability Curves
Once we applied the vulnerability index methodology, and after having derived the damage scenarios for the whole building stock of the city centre of Baranello, it is possible to calibrate the typological vulnerability curves based on the events which occurred in the examined area.
The proposed method aims at calibrating the typological vulnerability curves based on the macroseismic data collected after the 2002 earthquake. The use of these curves is desirable, since they represent a useful tool for the evaluation of the vulnerability induced by a seismic event through a synthetic parameter, i.e., the mean damage grade (µD).
Furthermore, to take into account the variability of seismic motion in terms of macroseismic intensity, using the database Da.D.O, three macroseismic intensity thresholds, recorded after the 2002 Molise earthquake, have been considered. To this purpose, three municipalities of the province of Campobasso have been selected as reference cases. In particular, the municipality of Baranello, with an intensity of V (the starting point of the function), and the cities of San Giuliano di Puglia and Bonefro, with intensity equal to VII and IX, respectively, have been selected, they being considered as homogeneous from typological and structural points of view.
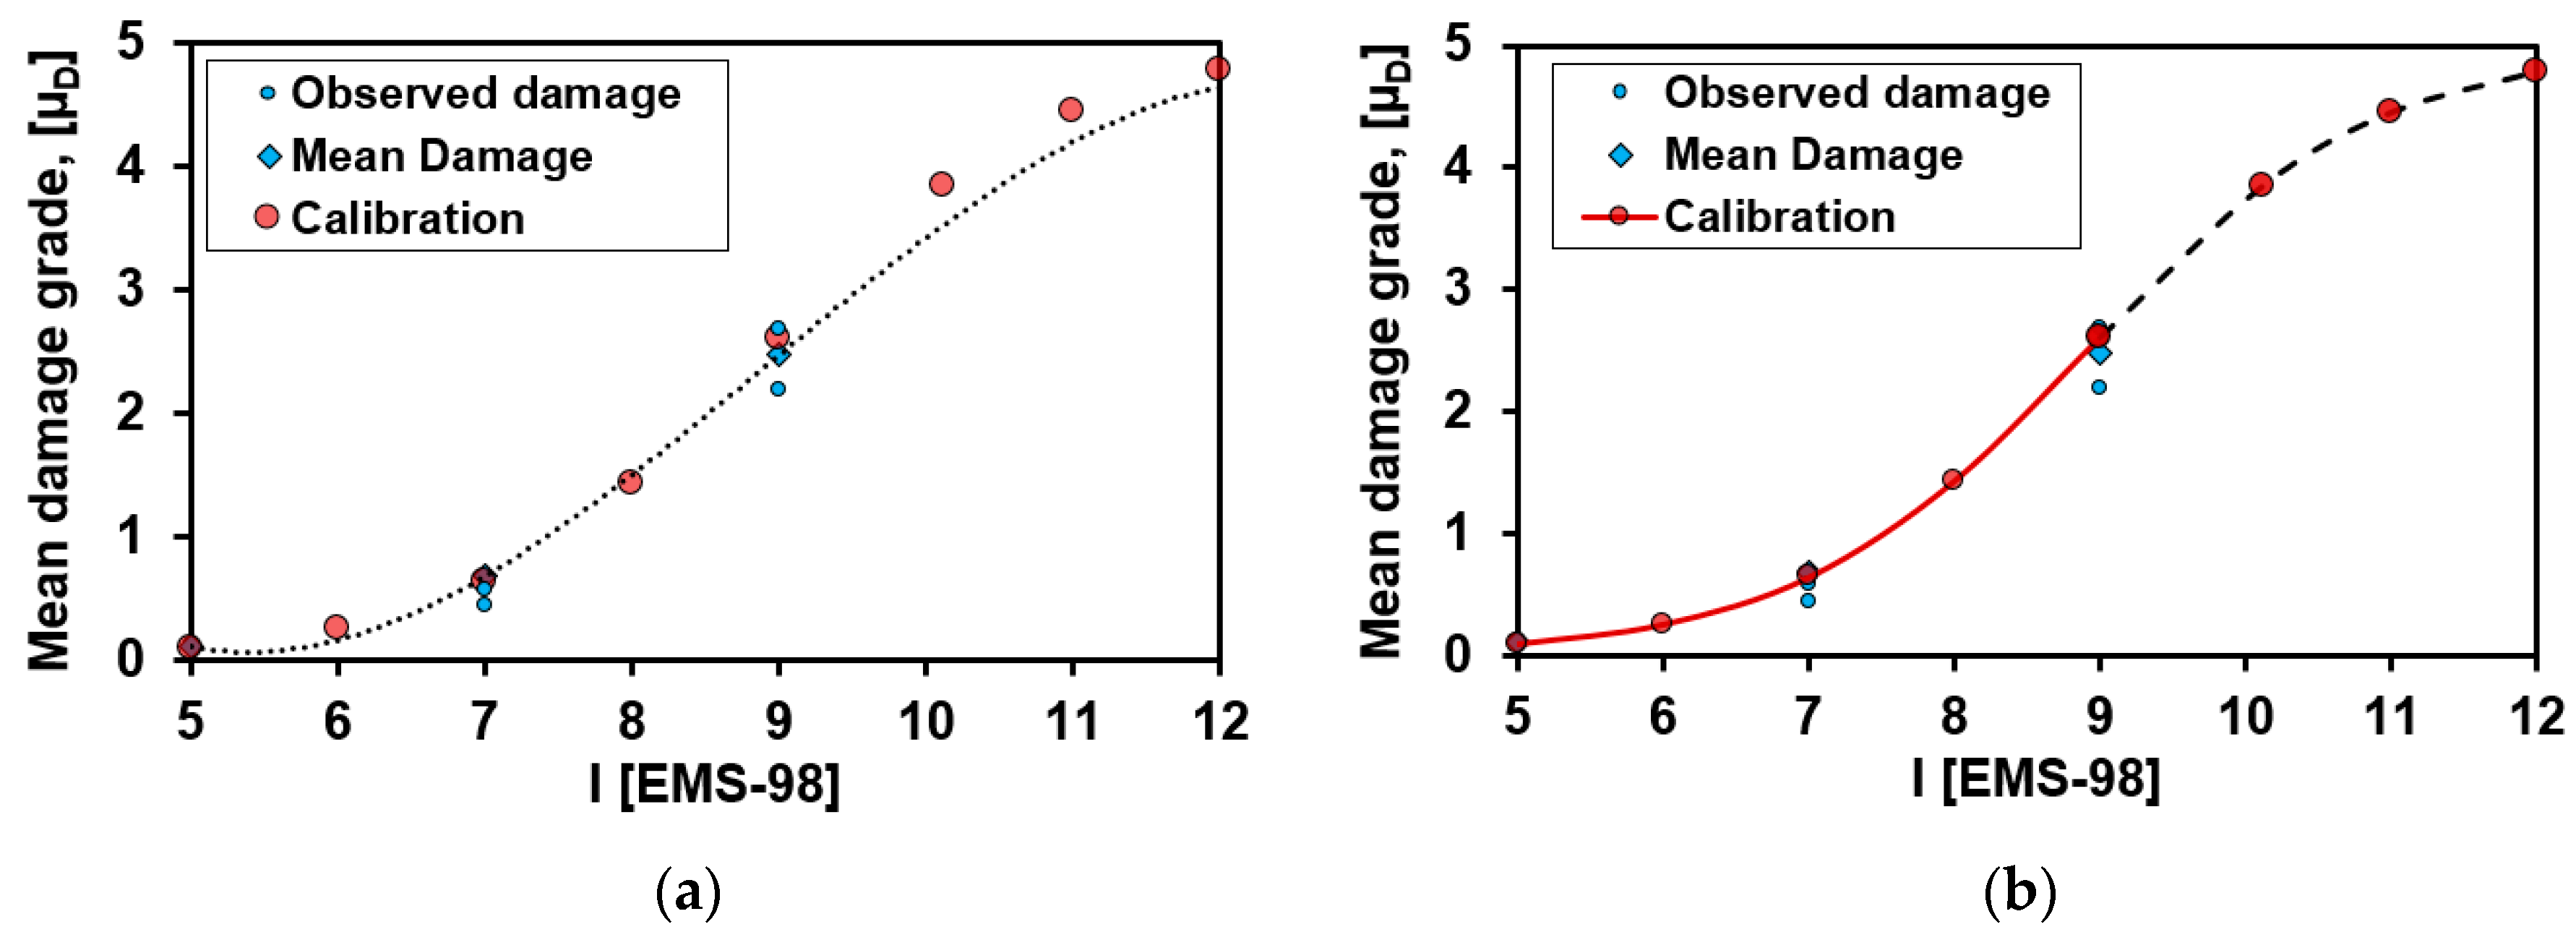
Thus, based on these considerations, a first trial representation of the damage–intensity curve has been provided, as illustrated in
Figure 17 [
47].
Figure 17a shows a third-degree interpolation function able to associate the observed damage grade, achieved by means of the AeDES form, to the mean damage grade, calculated for the V, VII and IX macroseismic intensities. In
Figure 17b is shown the mathematical representation of the curve proposed to calibrate the observed damages. In this latter figure, it is worth noting that, since intensities I
EMS-98 > IX were not detected in the study area, the curve has a dashed part, corresponding to undetected damages, leading probably towards a threshold damage D5 (collapse).
The mathematic expression of the proposed law is given by the following equation:
where ψ and Q have assumed the values of 12.35 and 2.00 (the latter analogous to the ductility factor suggested by Eurocode 8 for masonry buildings), respectively, in order to have the mathematical (red) curve perfectly superimposable to the third-degree interpolation relationship.
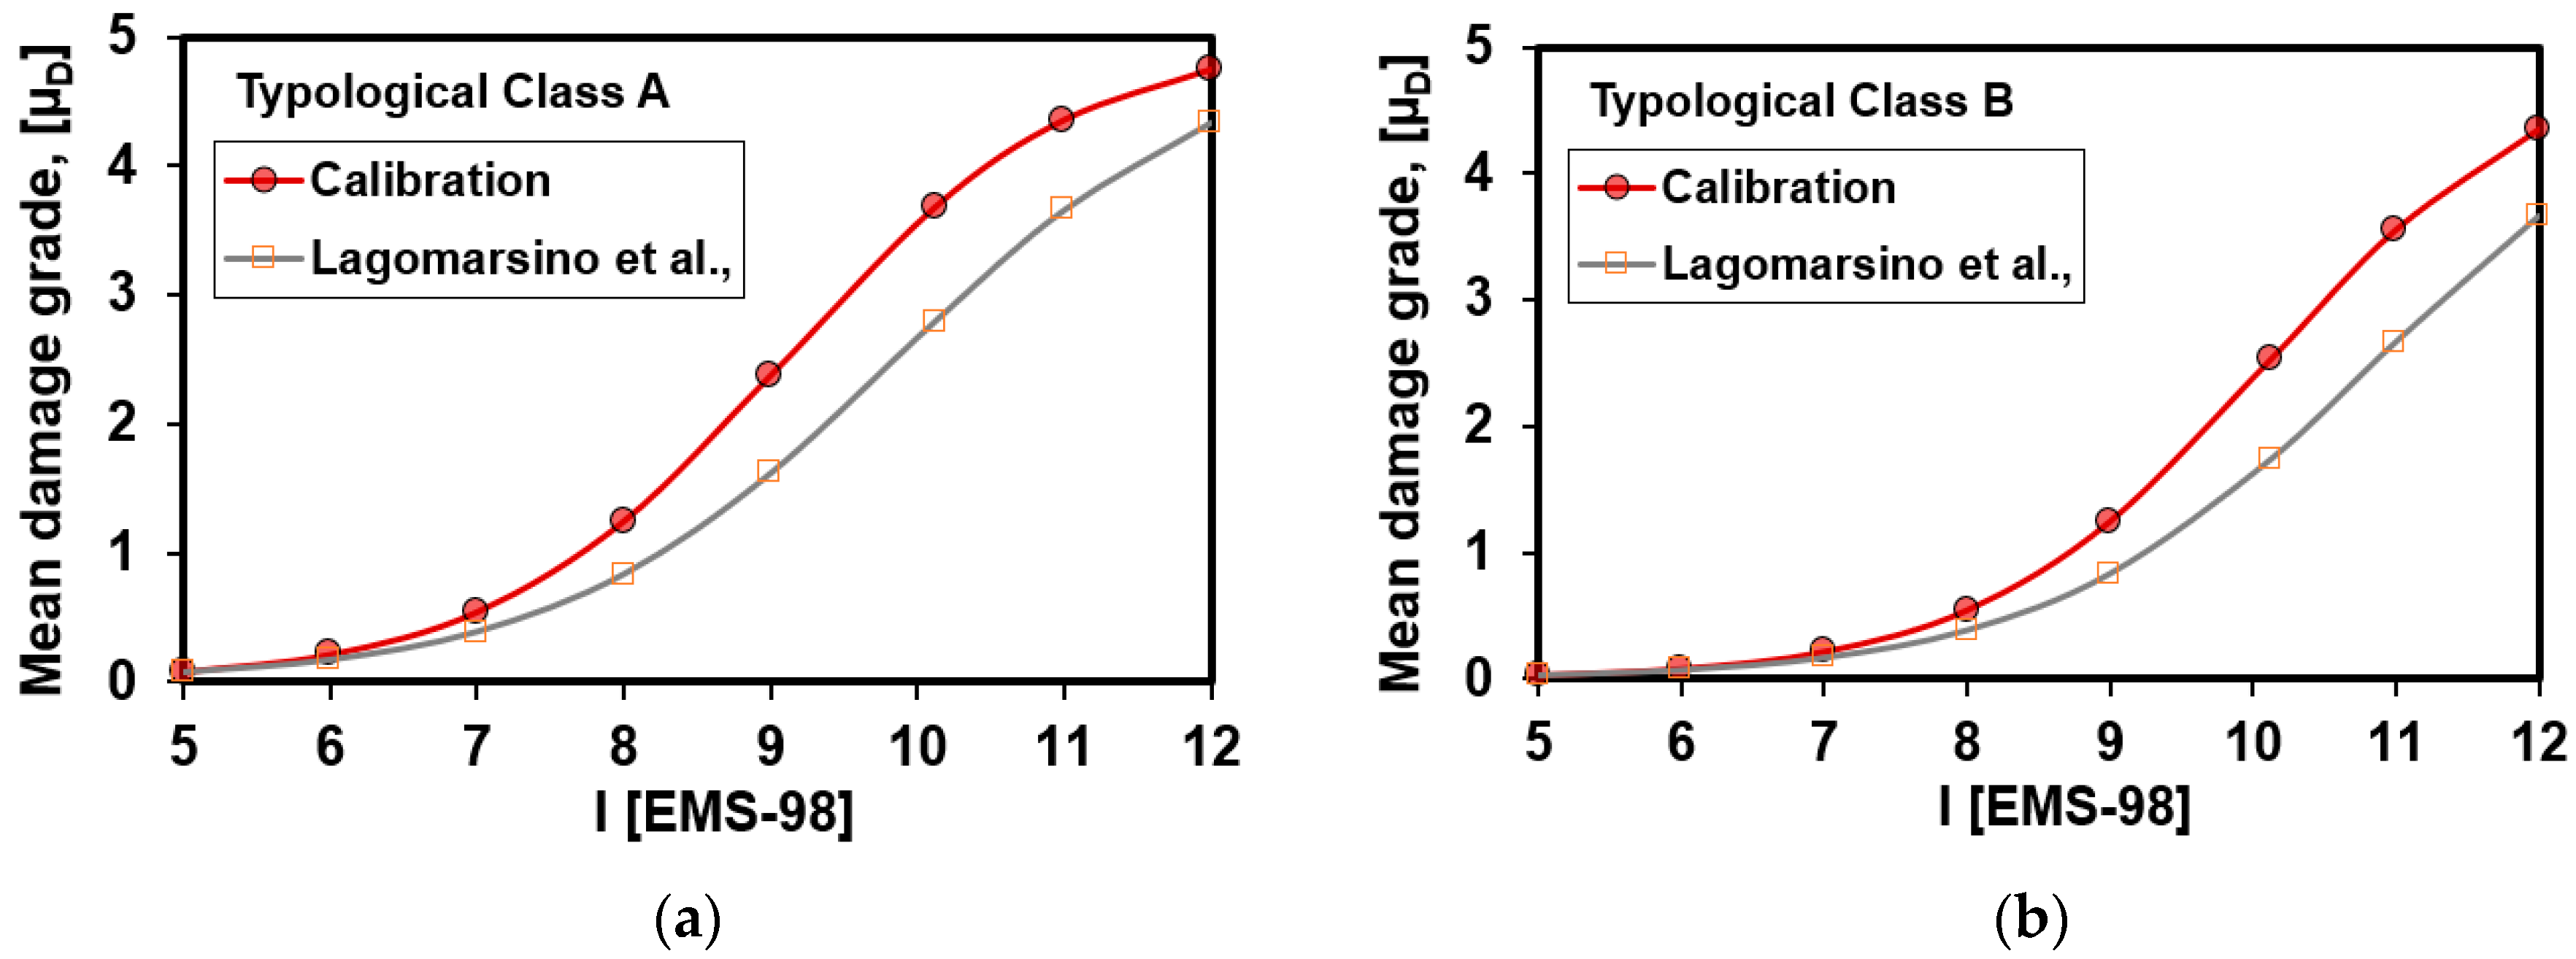
Finally,
Figure 18 shows the comparison between the proposed curve and that deriving from the method presented by Lagomarsino and Giovinazzi [
34] for the typological classes A and B, which are characterised by an average vulnerability index of 0.55 and 0.34, respectively.
It can be seen how the proposed curve provides expected damage values higher than the ones derived from the other method, which is based on the empirical–mechanical procedure developed in the framework of the Risk-UE project for different samples of buildings belonging to several European Countries. In particular, for Class A buildings, the proposed formulation provides, for macroseismic intensities V, VII and IX, damage percentage increases equal to 12%, 41% and 46%, respectively, in comparison to those foreseen by Lagomarsino. On the other hand, for Class B buildings these increments, corresponding to macroseismic intensities VII and IX only, are equal to 26% and 48%, respectively.
Definitely, from the above
Table 4, it appears that the proposed formulation, if compared to the Lagomarsino and Giovinazzi method, provides results on the safe side in predicting the possible expected damages in the examined area.
4. Influence of the Geological Conditions on the Ground Motion
4.1. Local Site Effects
In the framework of large-scale vulnerability analysis, the evaluation of site effects plays a fundamental role for a correct prediction of the expected damage, and therefore, to implement suitable risk mitigation measures to safeguard people’s life and to preserve the integrity of historical heritage constructions.
From the physical point of view, the local seismic response can be intended as a set of changes in amplitude, duration and frequency content that a seismic motion, relative to a bedrock basement, undergoes through the overlying layers of soil up to the surface. In other words, the ground layers can increase the amplitude of the seismic motion at some frequencies and reduce it for other ones.
The schematization of seismic motion can be represented both in the domain of time and frequencies. In particular, considering the time domain, the parameters most frequently used to describe the earthquake characteristics are the peak value of the acceleration, the velocity, the displacements, and finally, the duration. In the second case (frequency domain), the parameters of seismic motion are characterized by either the Fourier spectrum or the response spectrum. The quantitative evaluation of the local seismic response can, therefore, be carried out on the basis of the comparison between different quantities representative of the surface seismic motion and the reference one (bedrock).
The problem of geo-hazard effects has been already contemplated by two works of Chieffo and Formisano (both 2019) [
18,
48], where, under a macroseismic approach, and on the basis of macroelement numerical analysis on clustered buildings, the site effects were taken into account through a local amplification coefficient, f
PGA, defined as the ratio between the maximum recorded acceleration at the ground surface (a
max,s) and that at the bedrock (a
max,r), as reported in Equation (9).
4.2. Geological Conditions of the Study Area
Focusing on the case study, the historic centre area of Baranello is characterized by a geological structure mainly derived from covering tectonics related to the formation of the Apennine chain and sub-Apennine reliefs.
The sedimentary series, variously displaced and dismembered, were poured into the Molise basin causing anomalous overlaps and outcropping of very different units both for facies and for age and paleogeographic genesis.
The territory is characterised by the presence of a heterogeneous soil constituted by a basal interval formed in large part by outcrops found along the middle-basal bands of the local slopes. Two lithofacies have been distinguished. The first, namely the dominant pelitic–flysch of St. Bartolomeo, is characterized by a cohesive behaviour type, represented by silt–sand clays and clay–silt marls of different colours, from gray–blue to brown, with sporadic intercalations of a calcareous and arenaceous nature. The clayey lithotypes are characterized by a modest technical quality, that tends to significantly reduce in the superficial layers more exposed to exogenous degradation, and in particular, to the erosive and plasticizing action produced by the corrosive and infiltration waters. The resistance characteristics are, therefore, globally linked to the clay component, and under the conditions of short-term periods, they are essentially regulated by the undrained cohesion parameter. Moreover, the permeability degree could be considered practically null, since there is no interstitial water circulation. On the other hand, the second lithofacies, mainly made of stones, are due to an irregularly stratified marly–limestone–arenaceous succession, in which layers of limestones and coarse sandstones are identified with centimetric alternations of arenaceous and silt–marly levels and dense, stratified, clay–silt layers.
Finally, the formations described previously are generally surmounted by extensive coverings of both secondary genesis and areal thickness, represented essentially by colluvial deposits or by the localized accumulations of carryovers, whose presence is substantially connected to the local infrastructural development of the area.
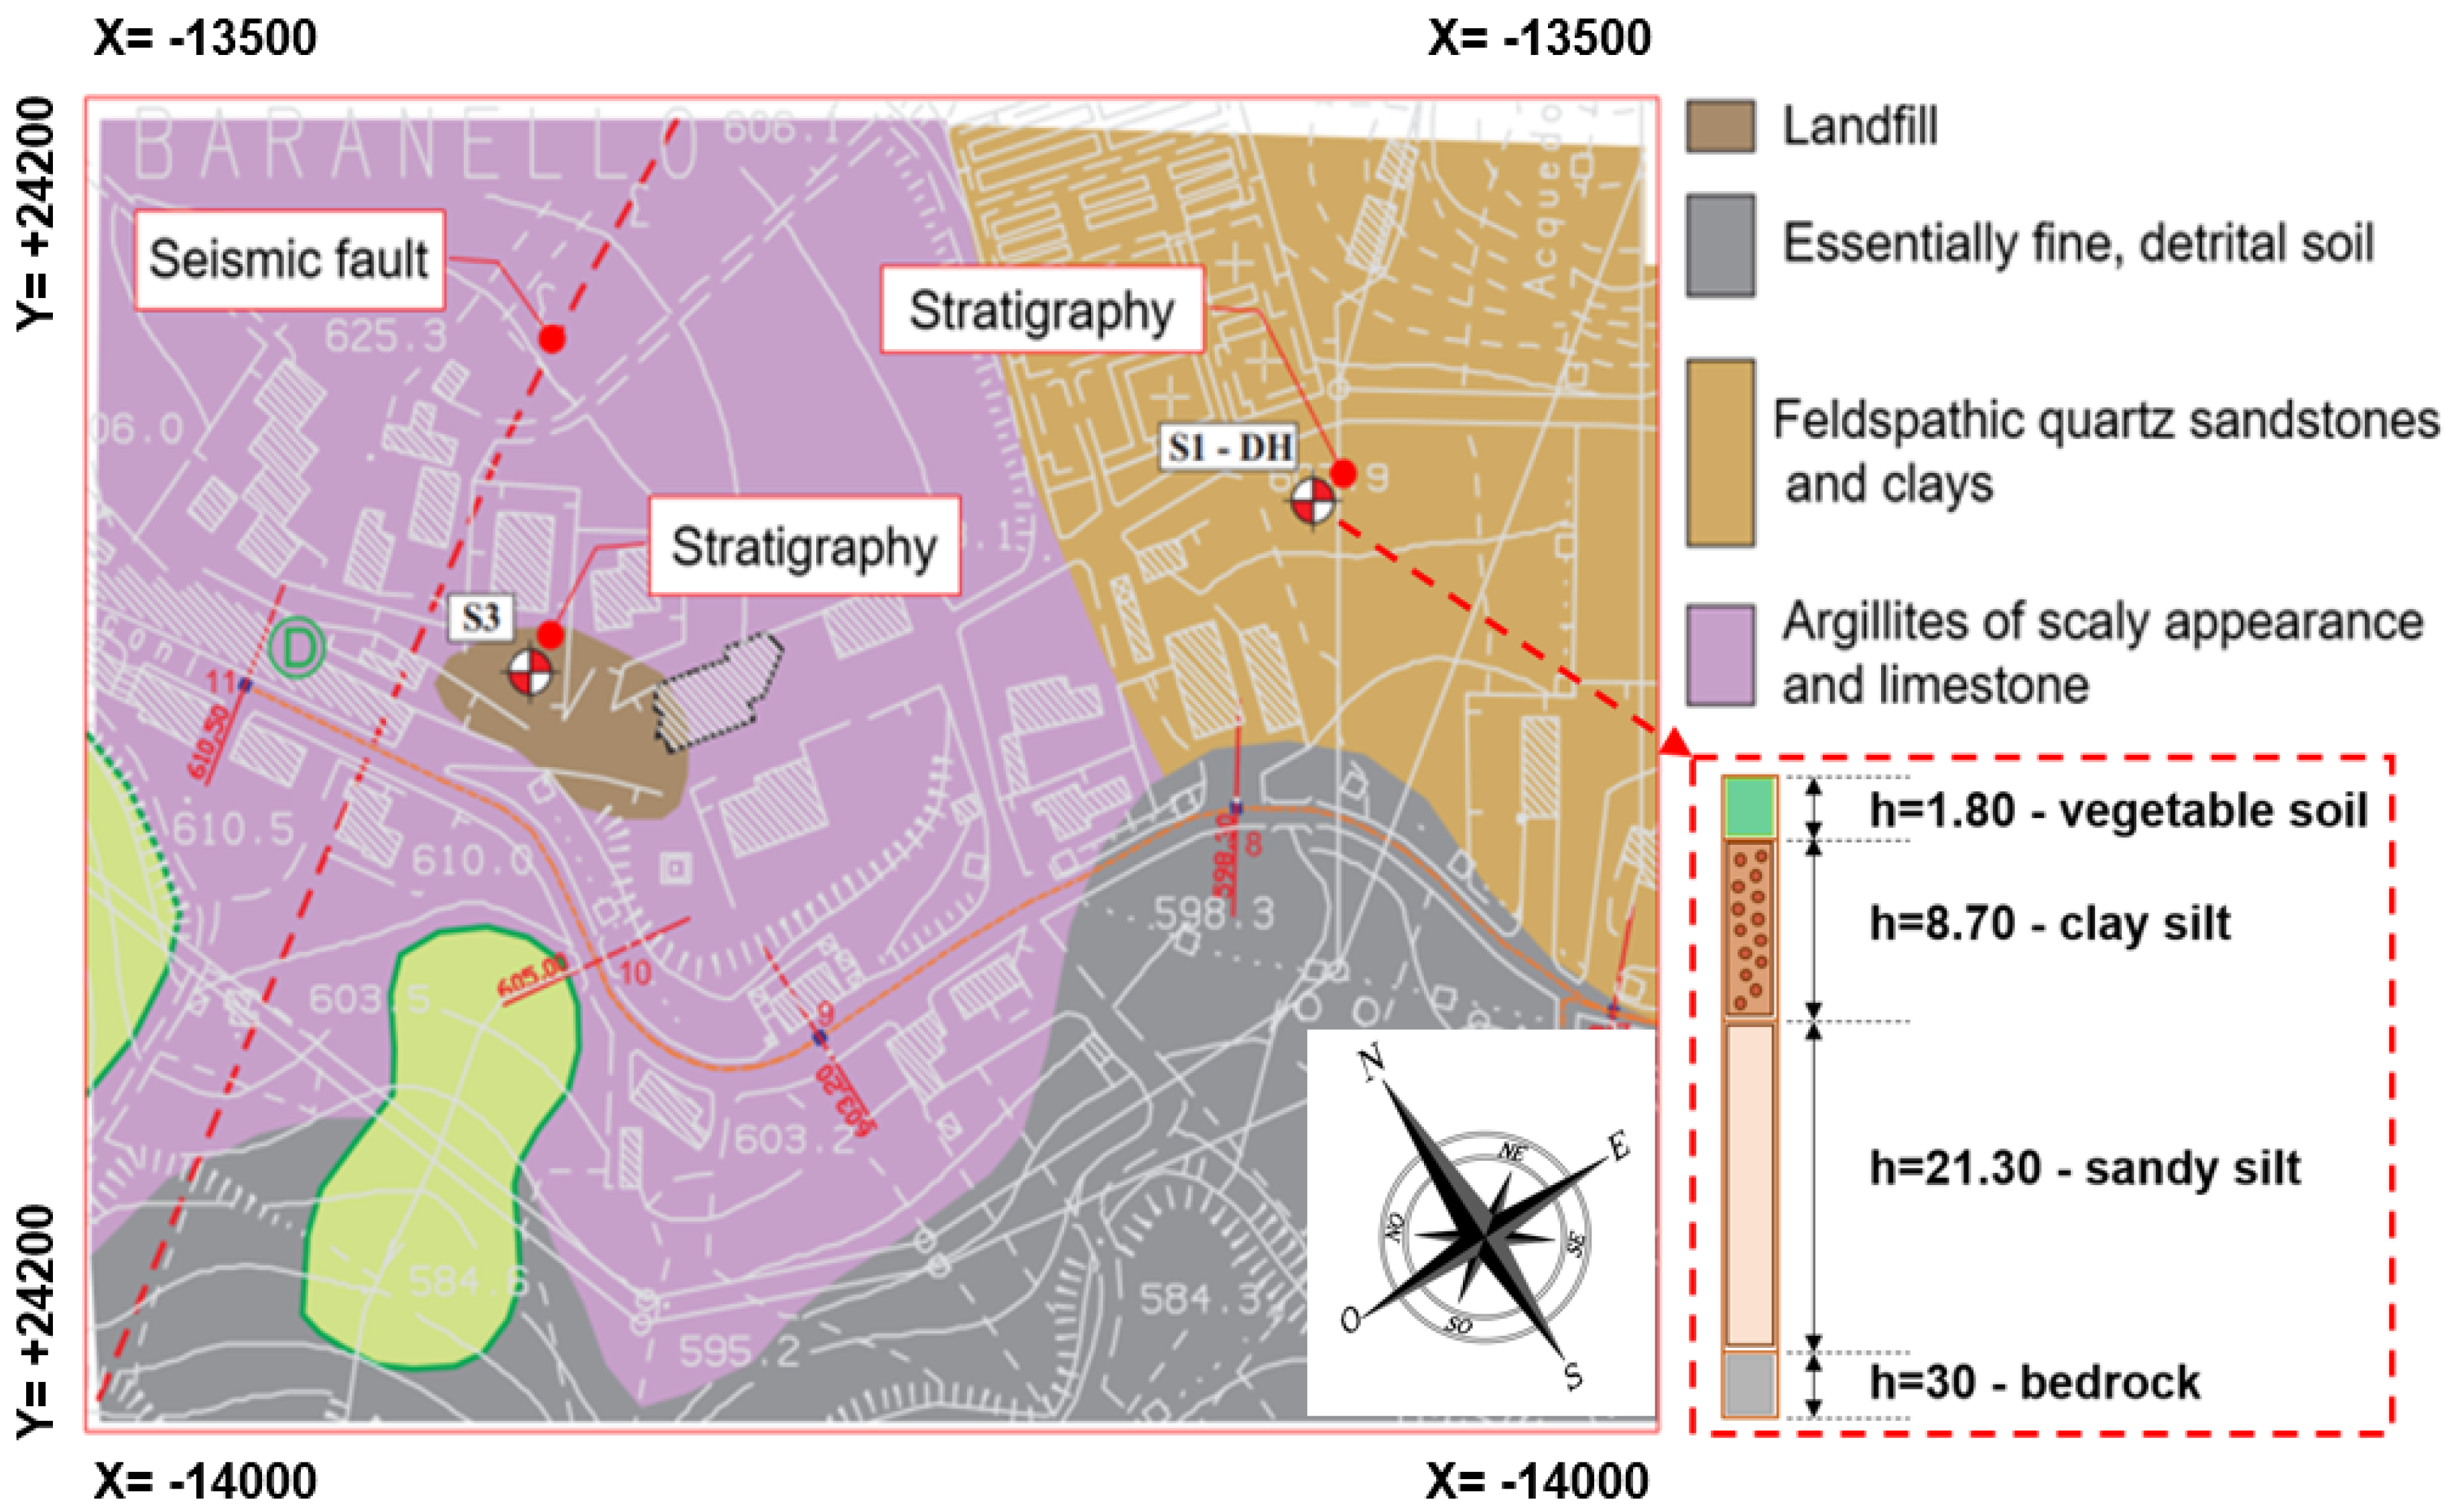
For the seismic microzonation of this historic centre, data from in situ surveys made available by the Municipal Administration of Baranello are used. Furthermore, in situ tests were carried out to identify the stratigraphy.
Figure 19 shows the areas where the Down-Hole geological characterization tests were carried out. These tests provide the velocity of the propagation of seismic waves, compression and shear, at different depths.
Thus, measuring the time these waves go from the source (on the surface) to the receiver (located inside a properly prepared hole), it is possible to derive the parameters of the soils traversed.
The positions of tests, indicated with S1 and S3 in
Figure 19, give back the ground stratigraphy consisting of deposits of clay silt and silty sand with a bedrock basement located at 30 m of depth. The seismic subsoil category associated with this ground type is the B one according to the Italian technical standard NTC18 [
49].
4.3. Evaluation of the Geological Amplification Factor
The evaluation of the local amplification coefficient has been estimated according to a time domain, since the main purpose of the work is to characterize the maximum ground amplification deriving from local site effects to correctly predict damage scenarios. Therefore, the accelerogram of the event which occurred in Molise in 2002 with its epicentre located in Bonefro. has been used. The event was characterized by a magnitude, Mw, equal to 6 with a maximum PGA = 0.55 g.
To this purpose, STRATA 1.0 software [
50], developed at the University of Texas, was used for simplified 1D numerical modelling of the geological conditions of seismic motion at bedrock. More precisely, noting the accelerogram at the crustal surfaces, it is possible to “transport” the seismic input to the bedrock. In this case, once the soil stratigraphy is defined, the software implicitly takes into account the “filter” effect of the soil layers.
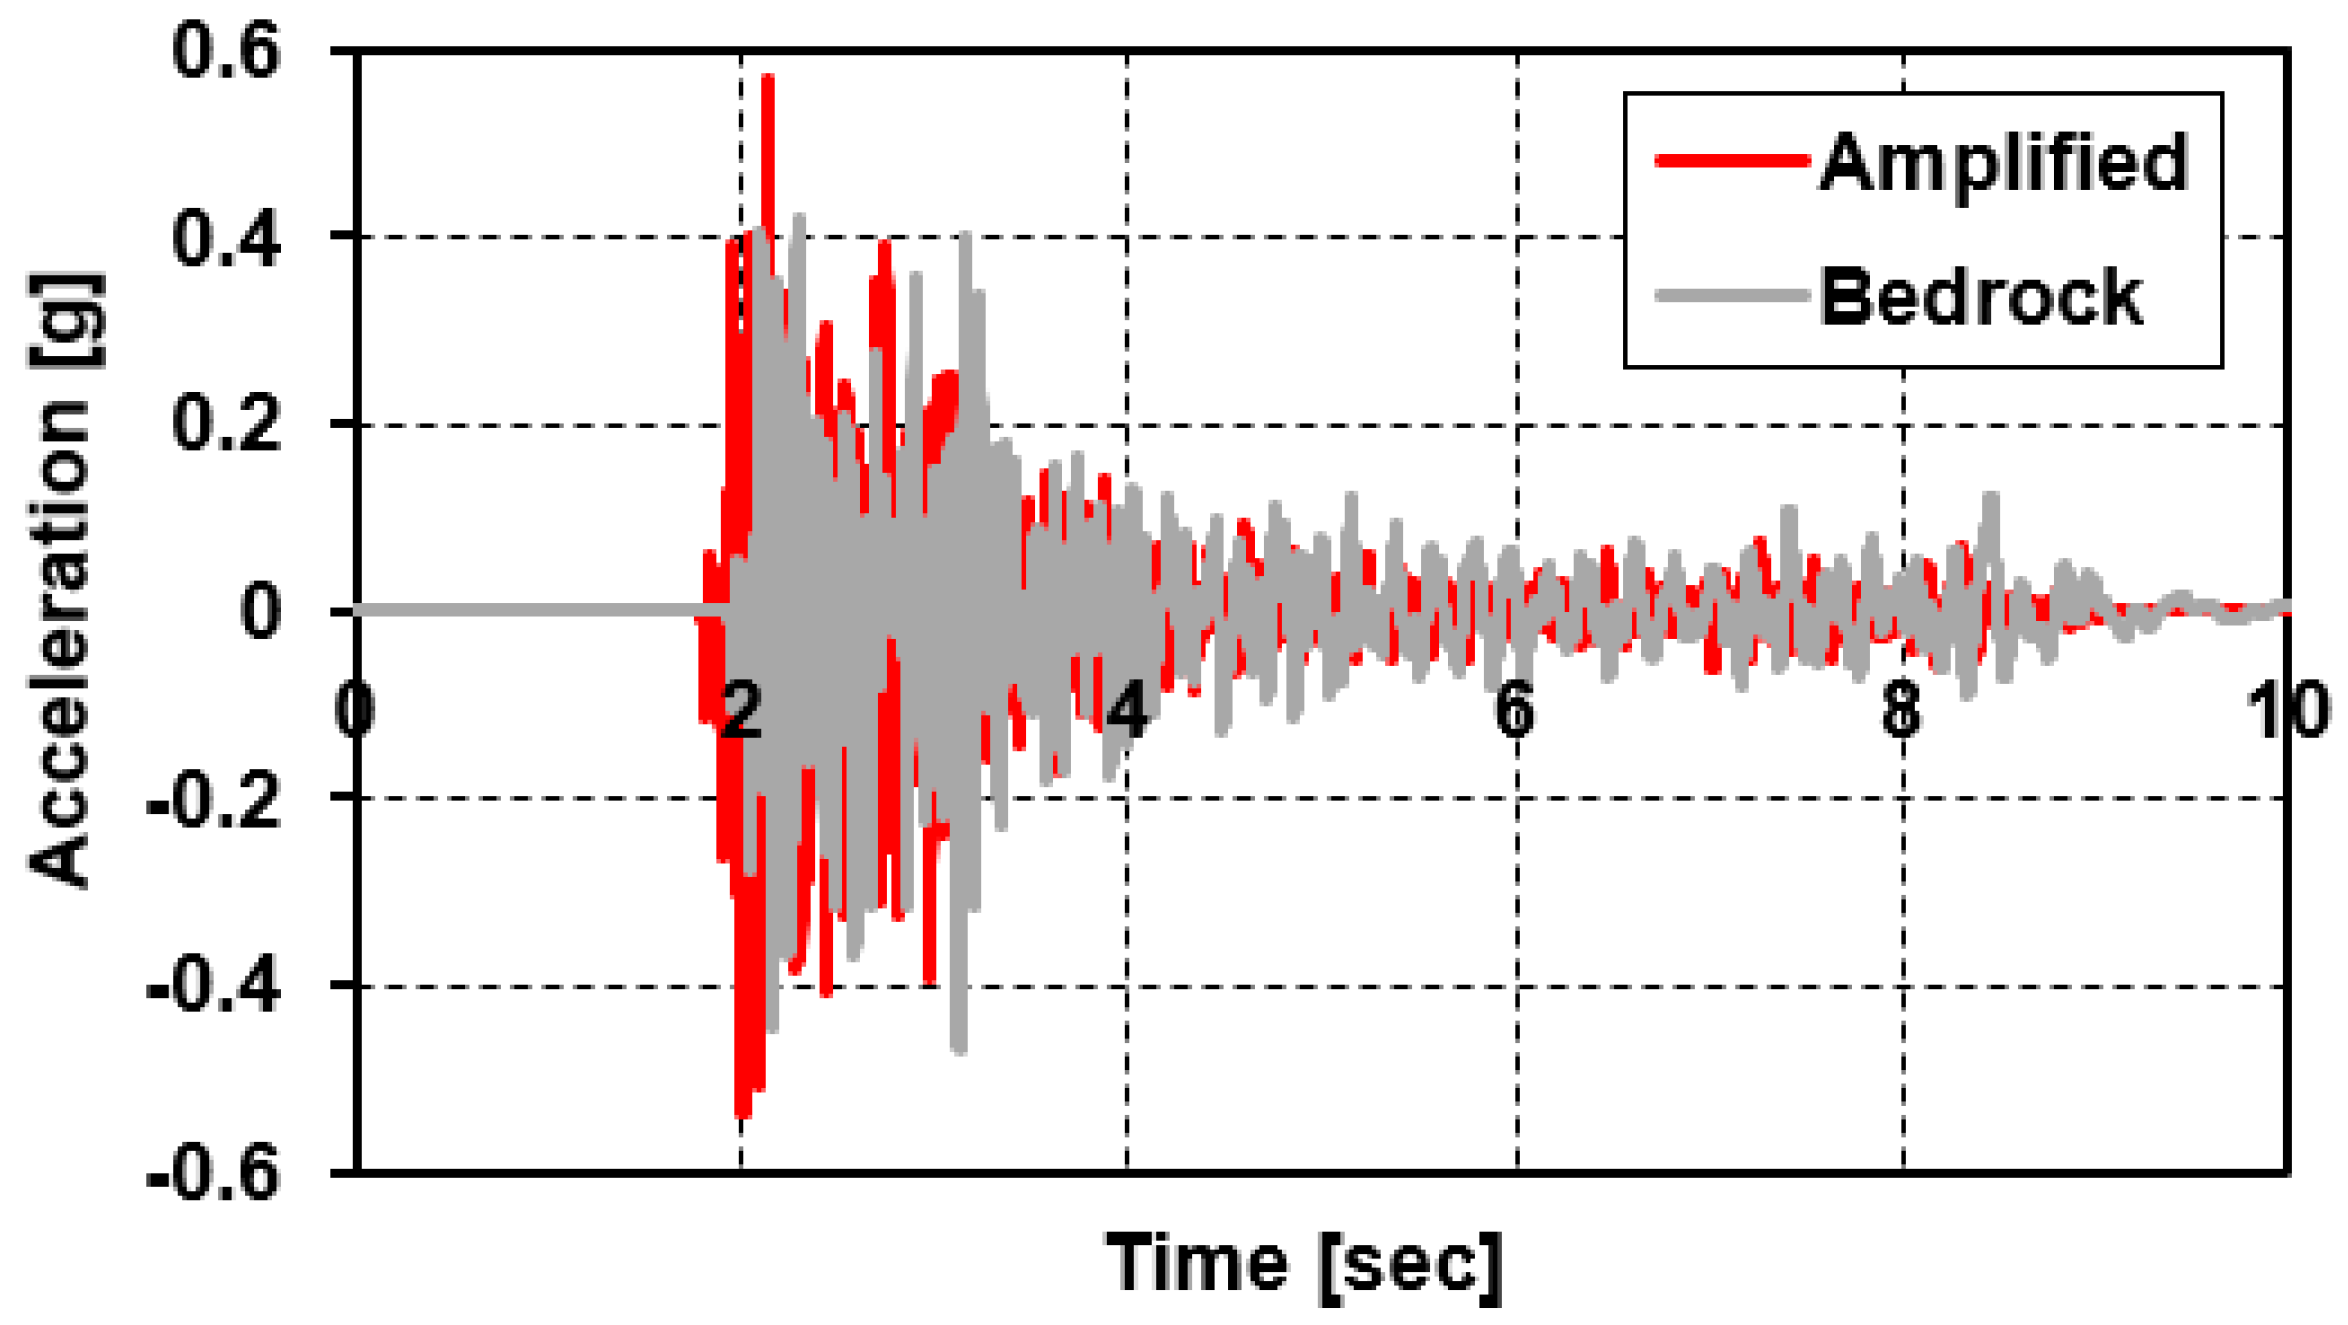
The evaluation of the local seismic amplification factor, therefore, provides a clear and effective representation of the filtering effect of a soil deposit on seismic waves. Thus, based on these considerations, starting from the accelerogram recorded after the Molise earthquake, in
Figure 20 the accelerogram at the bedrock and the corresponding amplified on the crustal-surface have been derived and graphically depicted.
As it is seen in the previous figure, local site effects provide an increase of accelerations detected at the bedrock. In particular, the amplification factor f
PGA computed according to Equation (9) provides the results illustrated in
Table 5.
In the presented table, the recorded amplification coefficient is equal to 1.33, which means that the increment of the seismic motion from the bedrock basement to the crustal surface is equal to 33%.
From these obtained results, and depending on the geologic conditions detected for the case study area, the mean damage degree, µ
D, of the investigated structural units determined in
Section 3.3 can be amplified by the above f
PGA factor, leading to a more correct expected damage grade µ
D,s [
43]:
Finally, a synthetic representation of the new damages achieved has been shown in
Figure 21 for the already considered combinations of magnitudes and site–source distances.
Comparing the new damage scenario to that reported in
Section 3.4 (
Figure 15), it is possible to estimate the damage increase due to site effects, as reported in
Figure 22.
As observed in the above figure, the local site effects produce a very high increase of the expected damage. In particular, it is noted that, for an epicentre distance of 5 km, the damage distribution tends to increase towards higher levels of damage. This result is much more evident when Mw = 6 is considered, since the D4 damage level is drastically reduced, while the D5 one is strongly increased.
5. Concluding Remarks
This study proposes a simplified methodology to analyse the seismic vulnerability of masonry building aggregates located in historic centres considering the influence of geo-hazard conditions. An urban sector of 300 buildings in the historical centre of Baranello, in the district of Campobasso (Italy), has been identified as study area for the application of the proposed analysis method.
Firstly, the characterisation of the typological classes of the urban sector examined has been done by means of the CARTIS form, which has allowed us to classify the building compounds from the structural point of view. From on-site recognition, it has been detected that the prevailing typological class of masonry buildings is the MUR2 (rough-stone) one, which represents 75% of the building stock examined. Timber or steel beams and masonry vaults have been detected in the inspected buildings as the main horizontal structures. For the quantification of the observed damage, the AeDES formed conjunctly with the Da.D.O database have been adopted to statistically derive the damage probability matrices. The gotten results have shown that 38% of the buildings have damage D0 (null), while 36% of them reached a damage level D1 (negligible to slight damage).
Subsequently, the seismic vulnerability of the inspected urban sector has been estimated through a vulnerability index method conceived for building aggregates. In the urban area, two distinct typological classes, namely A and B, have been identified according to the EMS-98 scale. It is worth noting that the distribution of vulnerability results for typological class A is quite homogeneous, with an expected medium-high vulnerability enclosed in the range [0.4–0.6], while only 30% of the building sample has a vulnerability index equal to 0.76. Contrarily, for the analysed typological class B, the expected frequency is in the range [0.2–0.4], which corresponds to a moderate vulnerability level.
The damage scenarios of the investigated urban sector, based on a specific seismic attenuation law, have been estimated for different moment magnitudes and site–source distances. The results obtained have shown how Esteva and Harris’ attenuation model, if compared to the other attenuation laws, provides the most unfavourable condition in terms of expected damage. In fact, from the statistical processing of expected damages for a moment magnitude equal to 6, a damage threshold D4 (near-collapse) has been attained in 68% of the cases, whereas only 25% of buildings has reached a damage D5 (collapse).
Furthermore, once the damage scenarios have been derived for the whole building stock, the typological vulnerability curves, based on the macroseismic data collected after the 2002 earthquake, have been calibrated on the basis of the seismic damages detected in the examined area. More in detail, three hazard-levels expressed in terms of macroseismic intensity have been considered. In particular, according to the Molise seismic event which occurred in 2002, for the Municipality of Baranello an intensity of V has been considered, whereas for the cities of San Giuliano di Puglia and Bonefro the intensities recorded have been VII and IX, respectively. Thus, the classical formulation of the mean damage grade has been slightly modified in order to calibrate the experimental evidences in terms of damage. To this purpose, a value equal to 12.35 has been associated with the coefficient ψ, that affects the slope of the curve, whereas the ductility factor, Q, has been assumed equal to 2, according to the provisions of Eurocode 8 for masonry buildings. Considering the typological class, A, the proposed curve provides, considering the aforementioned hazard thresholds, a damage percentage increase of 12%, 41% and 46% for seismic intensities V, VII and IX, respectively. On the other hand, the class B buildings have damage increments of 26% and 48% for seismic intensities VII and IX, respectively.
Finally, a local seismic amplification factor has been defined according to the time-domain method. To this purpose, a simplified 1D numerical modelling of the geological conditions of seismic motion has been considered. More precisely, noting the accelerogram at the crustal surfaces, it has been possible to “transport” the seismic input to the bedrock. In this case, once the soil stratigraphy has been defined, the used software implicitly has taken into account the “filter” effect of the soil layers. The evaluation of the local seismic amplification factor has, therefore, provided a clear and effective representation of the filtering effect of soil deposits on seismic waves.
Looking at the analysis results, the esteemed amplification factor has been found as equal to 1.33, which means that the seismic motion increment from the bedrock basement to the crustal surface is equal to 33%. From the new damage scenarios considering local effects, it has been detected as a considerable damage increment. In particular, it has been noted that for the epicentre distance of 5 km and moment magnitude of 4, damage thresholds D2 and D3 have been attained with a damage occurrence probability less than that of the basic case in which the soil influence has been neglected. Contrary to this, the D4 and D5 damage levels significantly increase due to the site effects. On the other hand, considering the worst scenario (R = 5 km and Mw = 6), the site effects have reduced drastically the damage levels D3 and D4, but they have increased the D5 threshold with the collapse of 98% of the buildings in the analysed area.
In conclusion, the proposed work has represented an important starting point for large-scale vulnerability and risk analysis considering site effects, so providing a comprehensive method to predict more precisely damage scenarios into historical centres. In this context, the applicability and feasibility of the proposed research can be considered extendable also to other seismic regions characterized by different types of masonry buildings. To this purpose, the characterization of the sample of buildings is an essential tool for large-scale analysis, since it allows us to evaluate the distribution and frequency of expected vulnerabilities.
This issue is of fundamental importance, since the proposed approach, which will allow us to take into account in a simplified way the influence of site effects on the overall response of buildings, can be used for planning effective seismic risk mitigation interventions.


