Uncertainty Assessment of Ice Discharge Using GPR-Derived Ice Thickness from Gourdon Glacier, Antarctic Peninsula
Abstract
1. Introduction
- (1)
- describing new ice thickness measurements on JRI;
- (2)
- assessing the influence of different ice thickness interpolation and reconstruction methods;
- (3)
- evaluating uncertainties in ice discharge of Gourdon Glacier in dependence on the location of the flux gate;
- (4)
- integrating the mass input by ice avalanches from the plateau into one ice thickness reconstruction method.
2. Study Site
3. Materials and Methods
3.1. In Situ Ice Thickness Measurements
3.2. Processing of GPR Data
3.3. Estimation of Surface Velocities from Satellite Data
3.4. Ice Thickness Interpolation and Reconstruction
3.5. Calculation of Ice Discharge
3.6. Error Estimation
3.6.1. Ice Thickness Measurements
3.6.2. Surface Velocity and Direction
3.6.3. Ice Discharge
4. Results
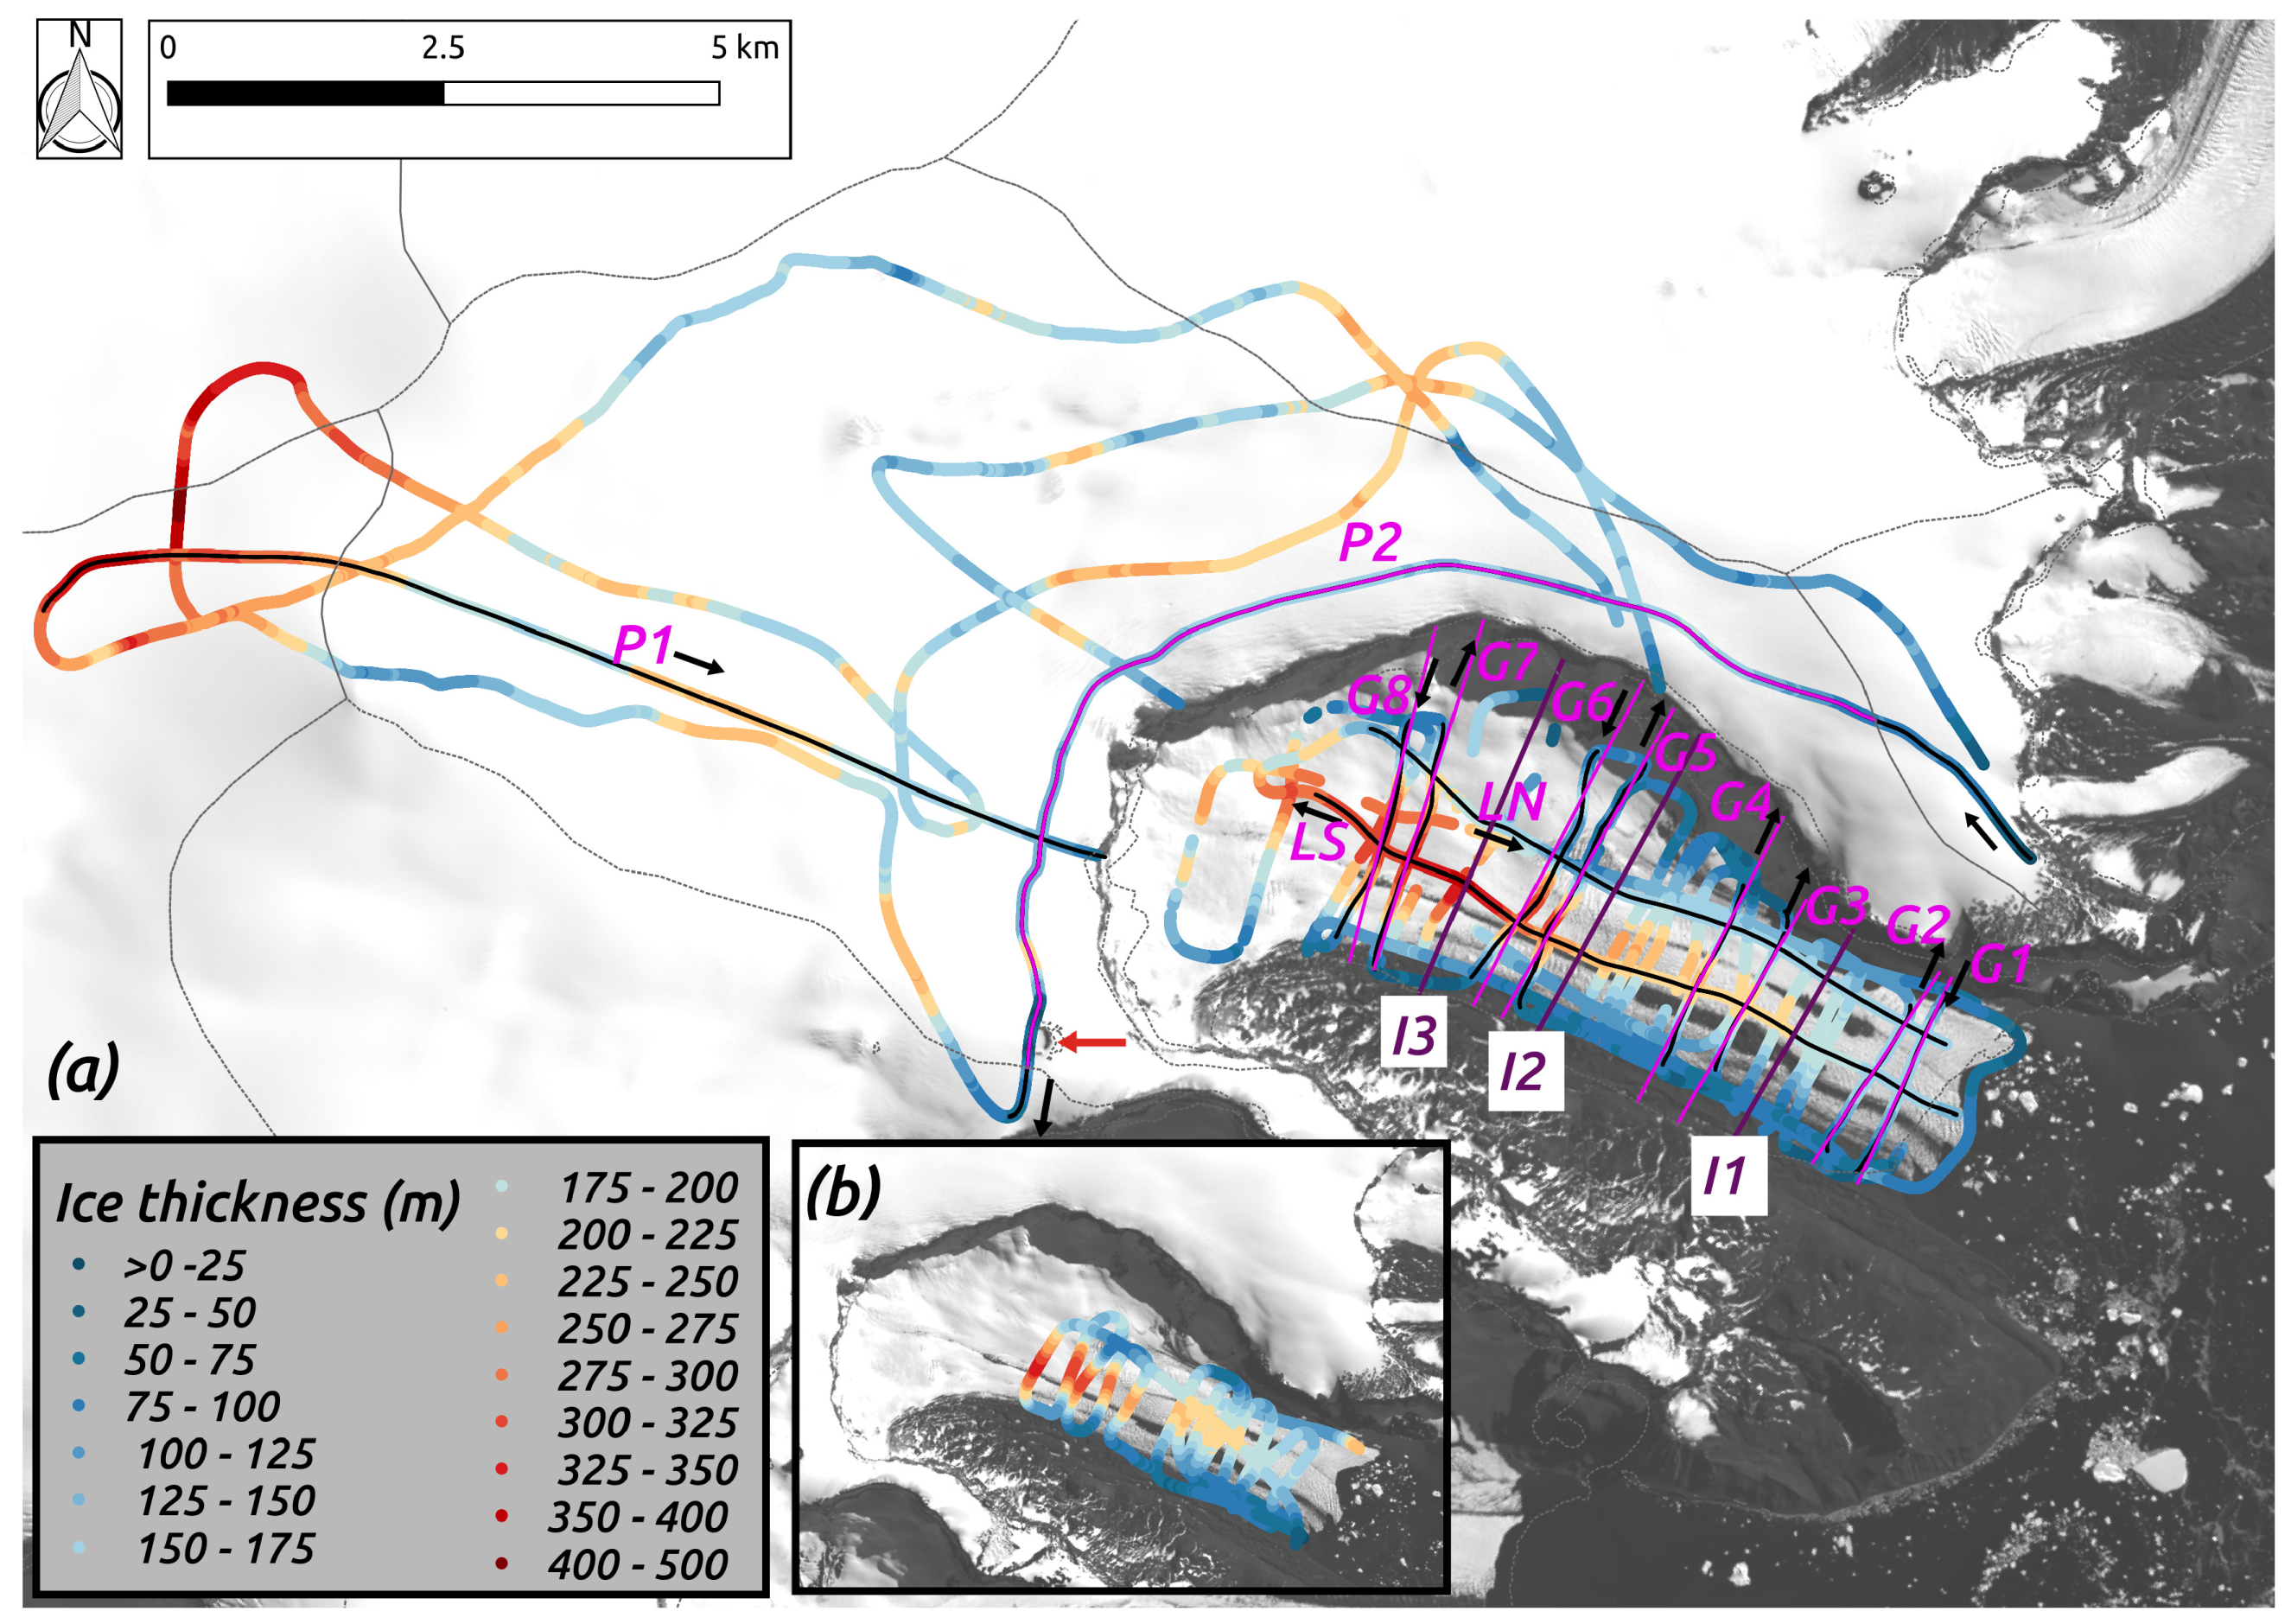
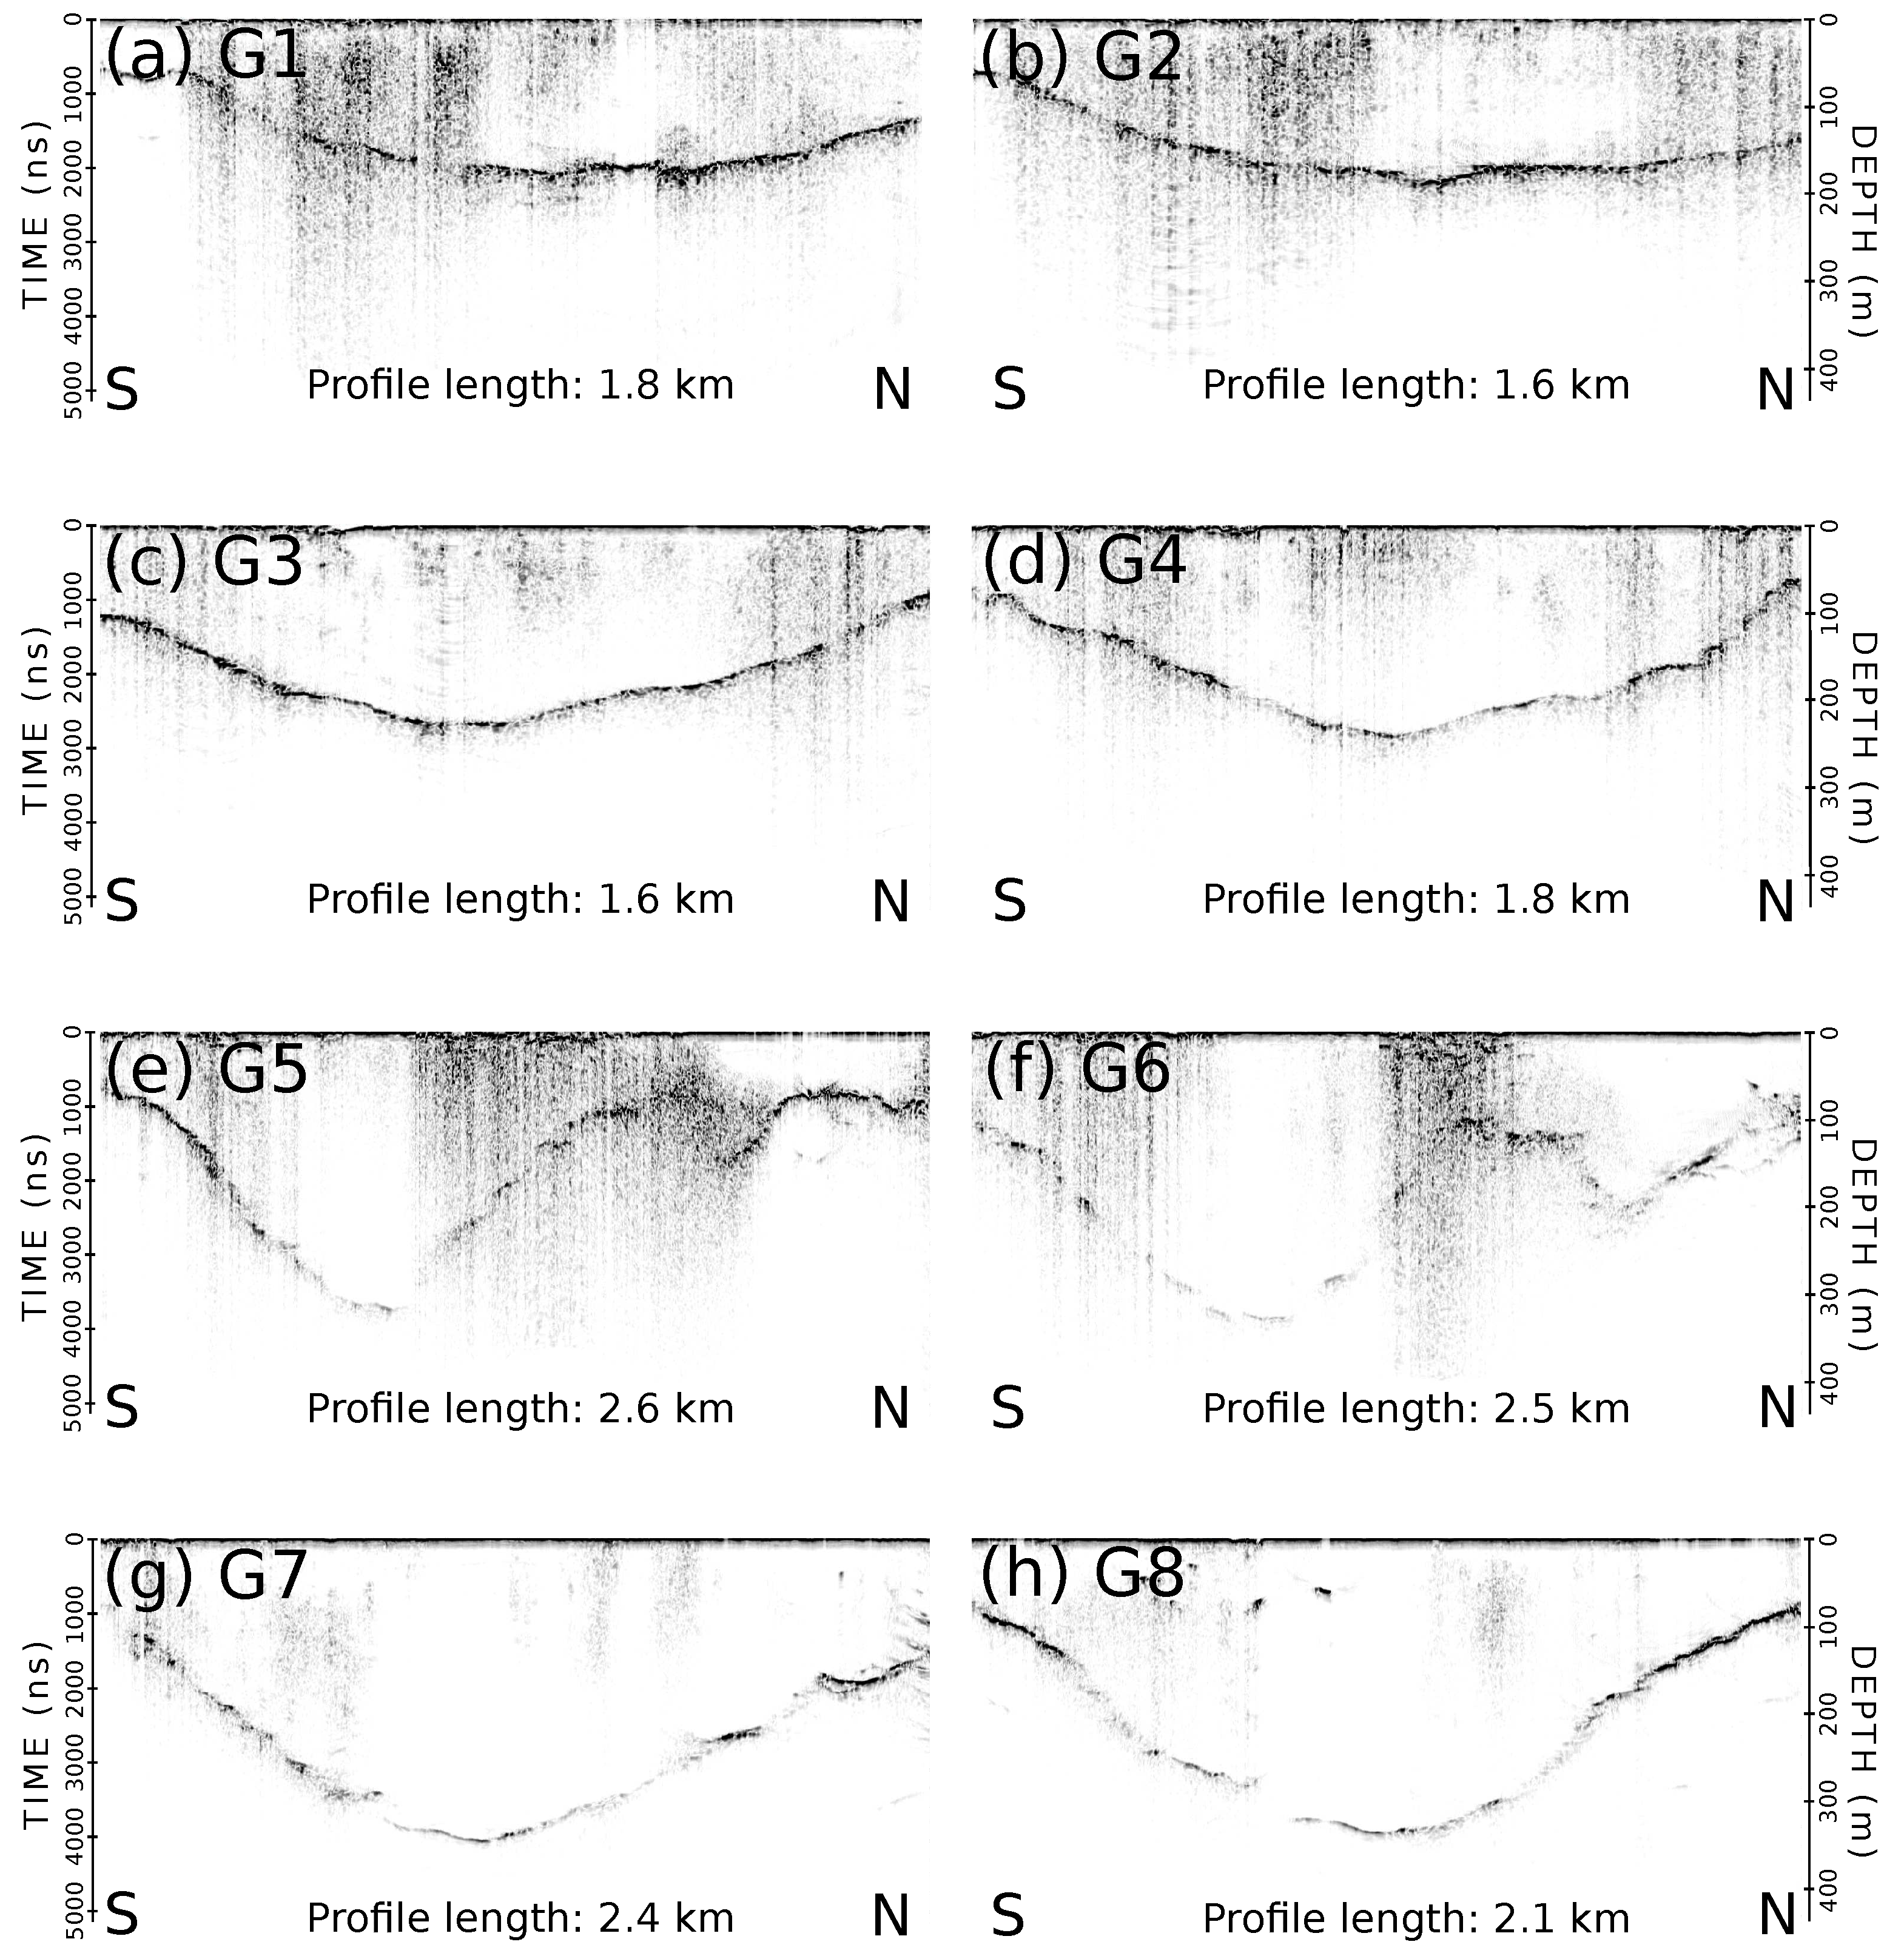
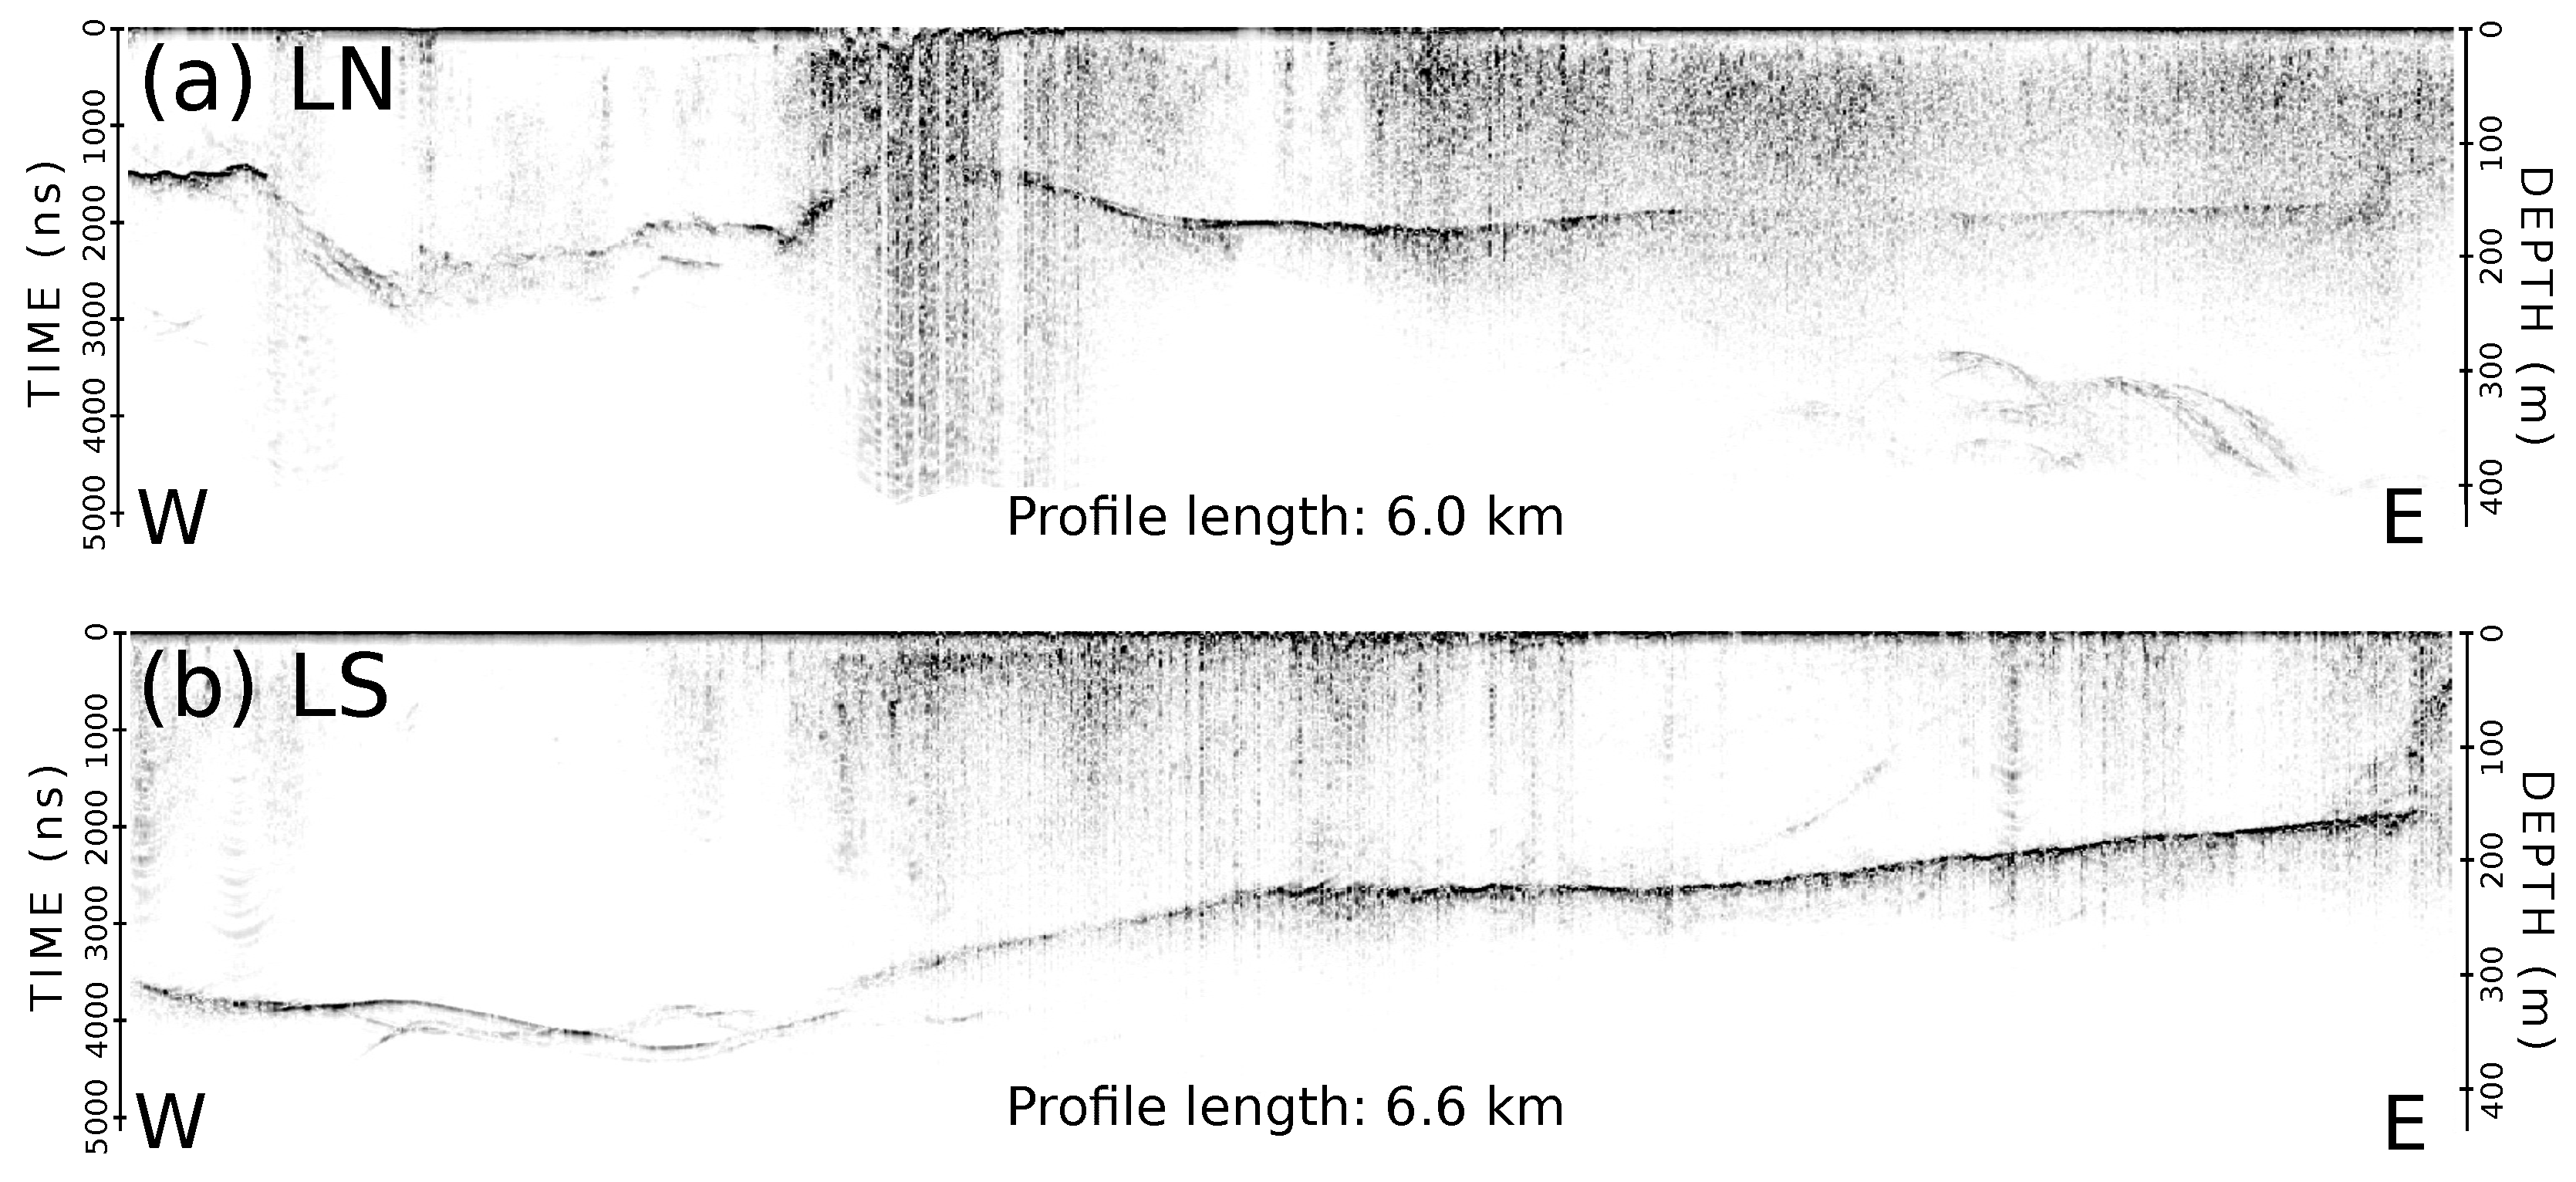
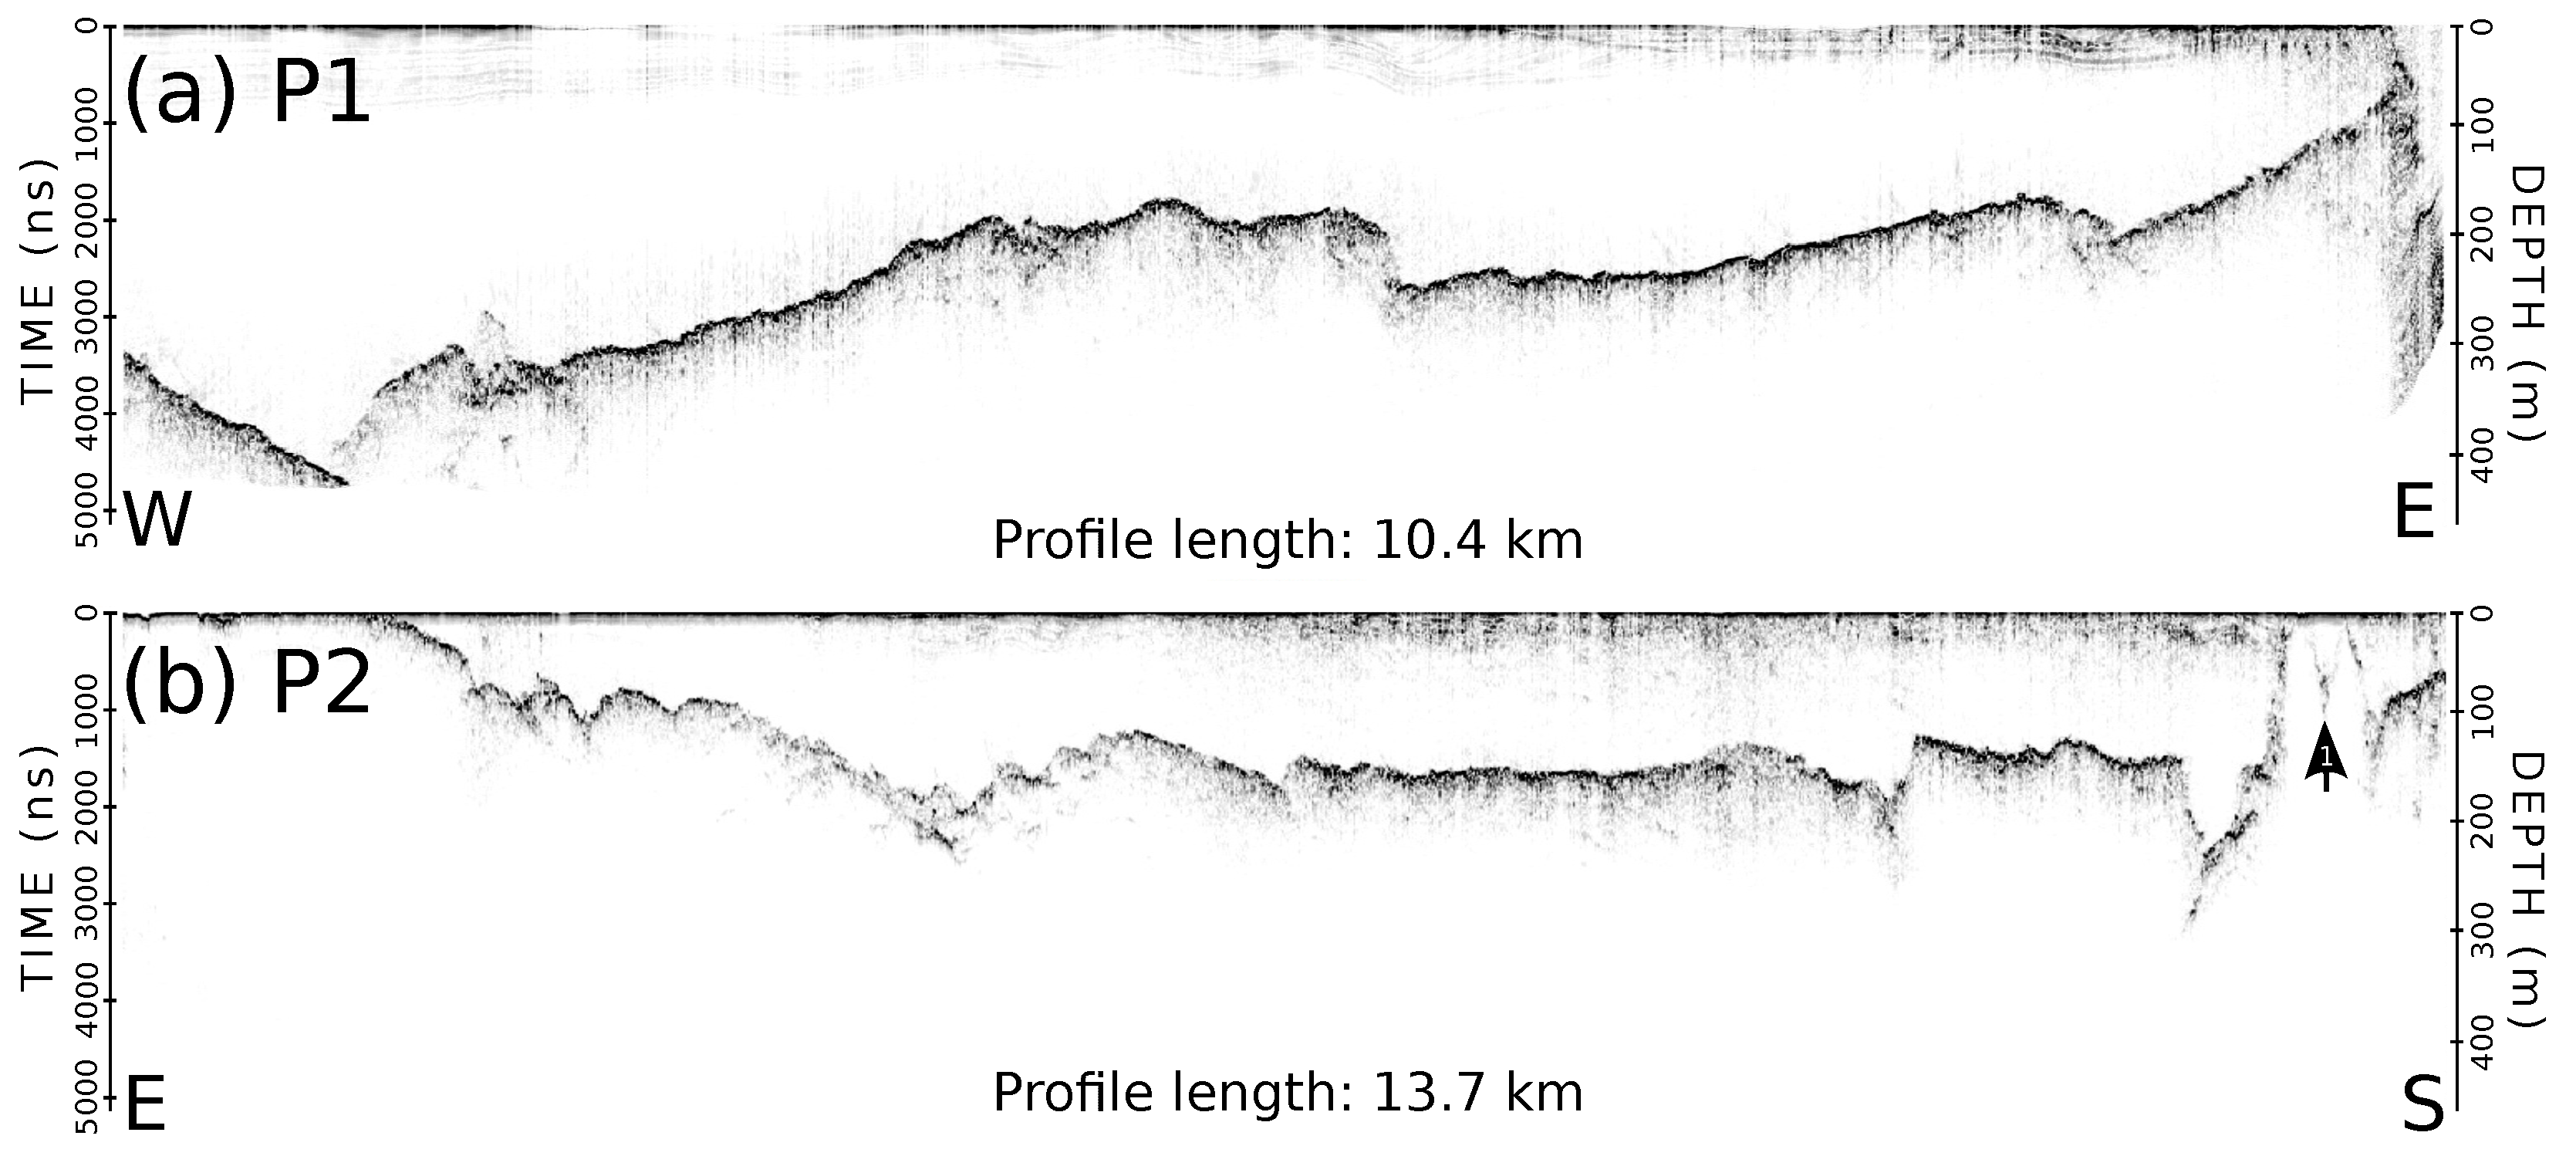
4.1. Report of Ice Thickness Measurements
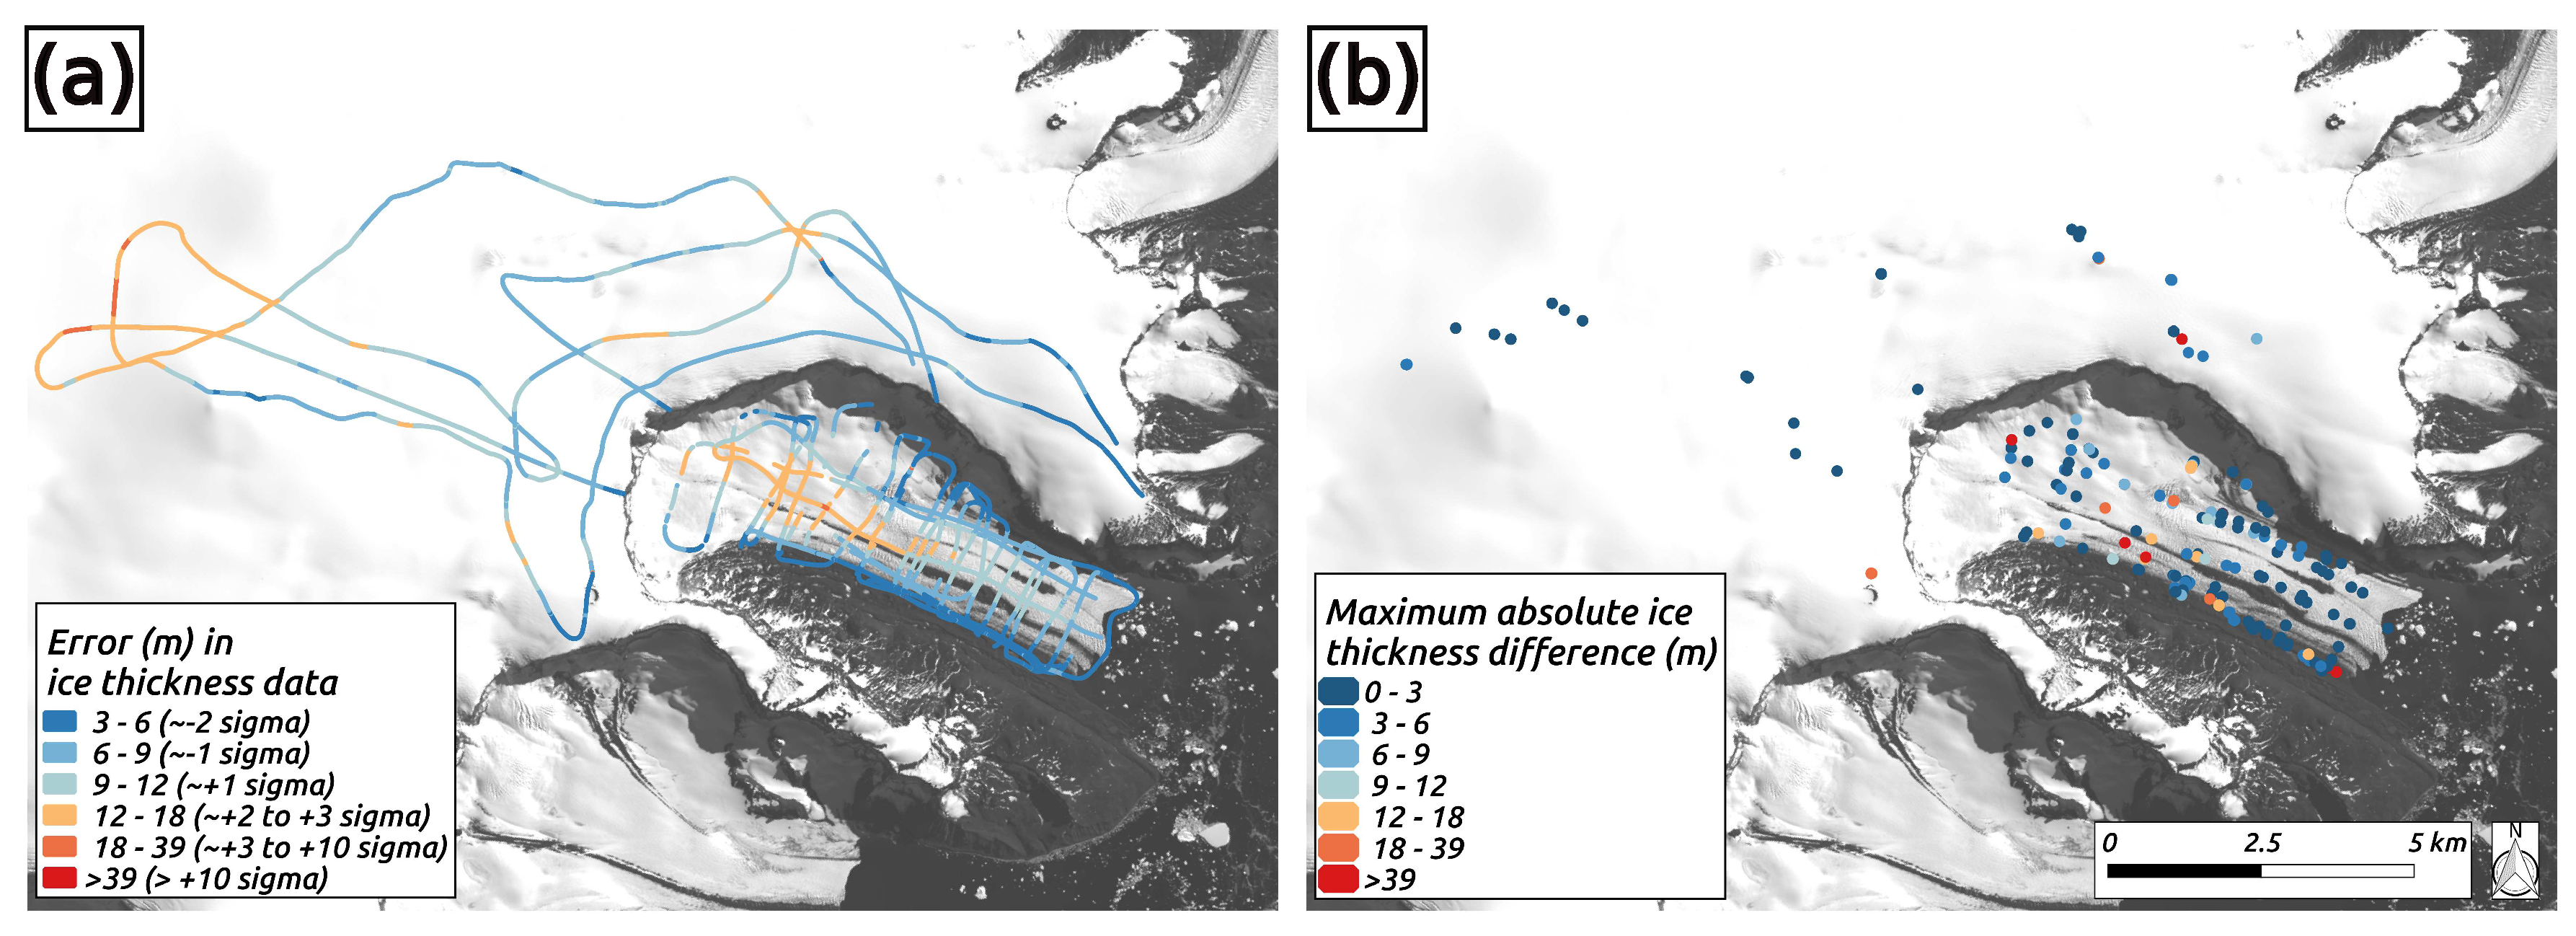
4.2. Error Estimation for Ice Thickness Measurements
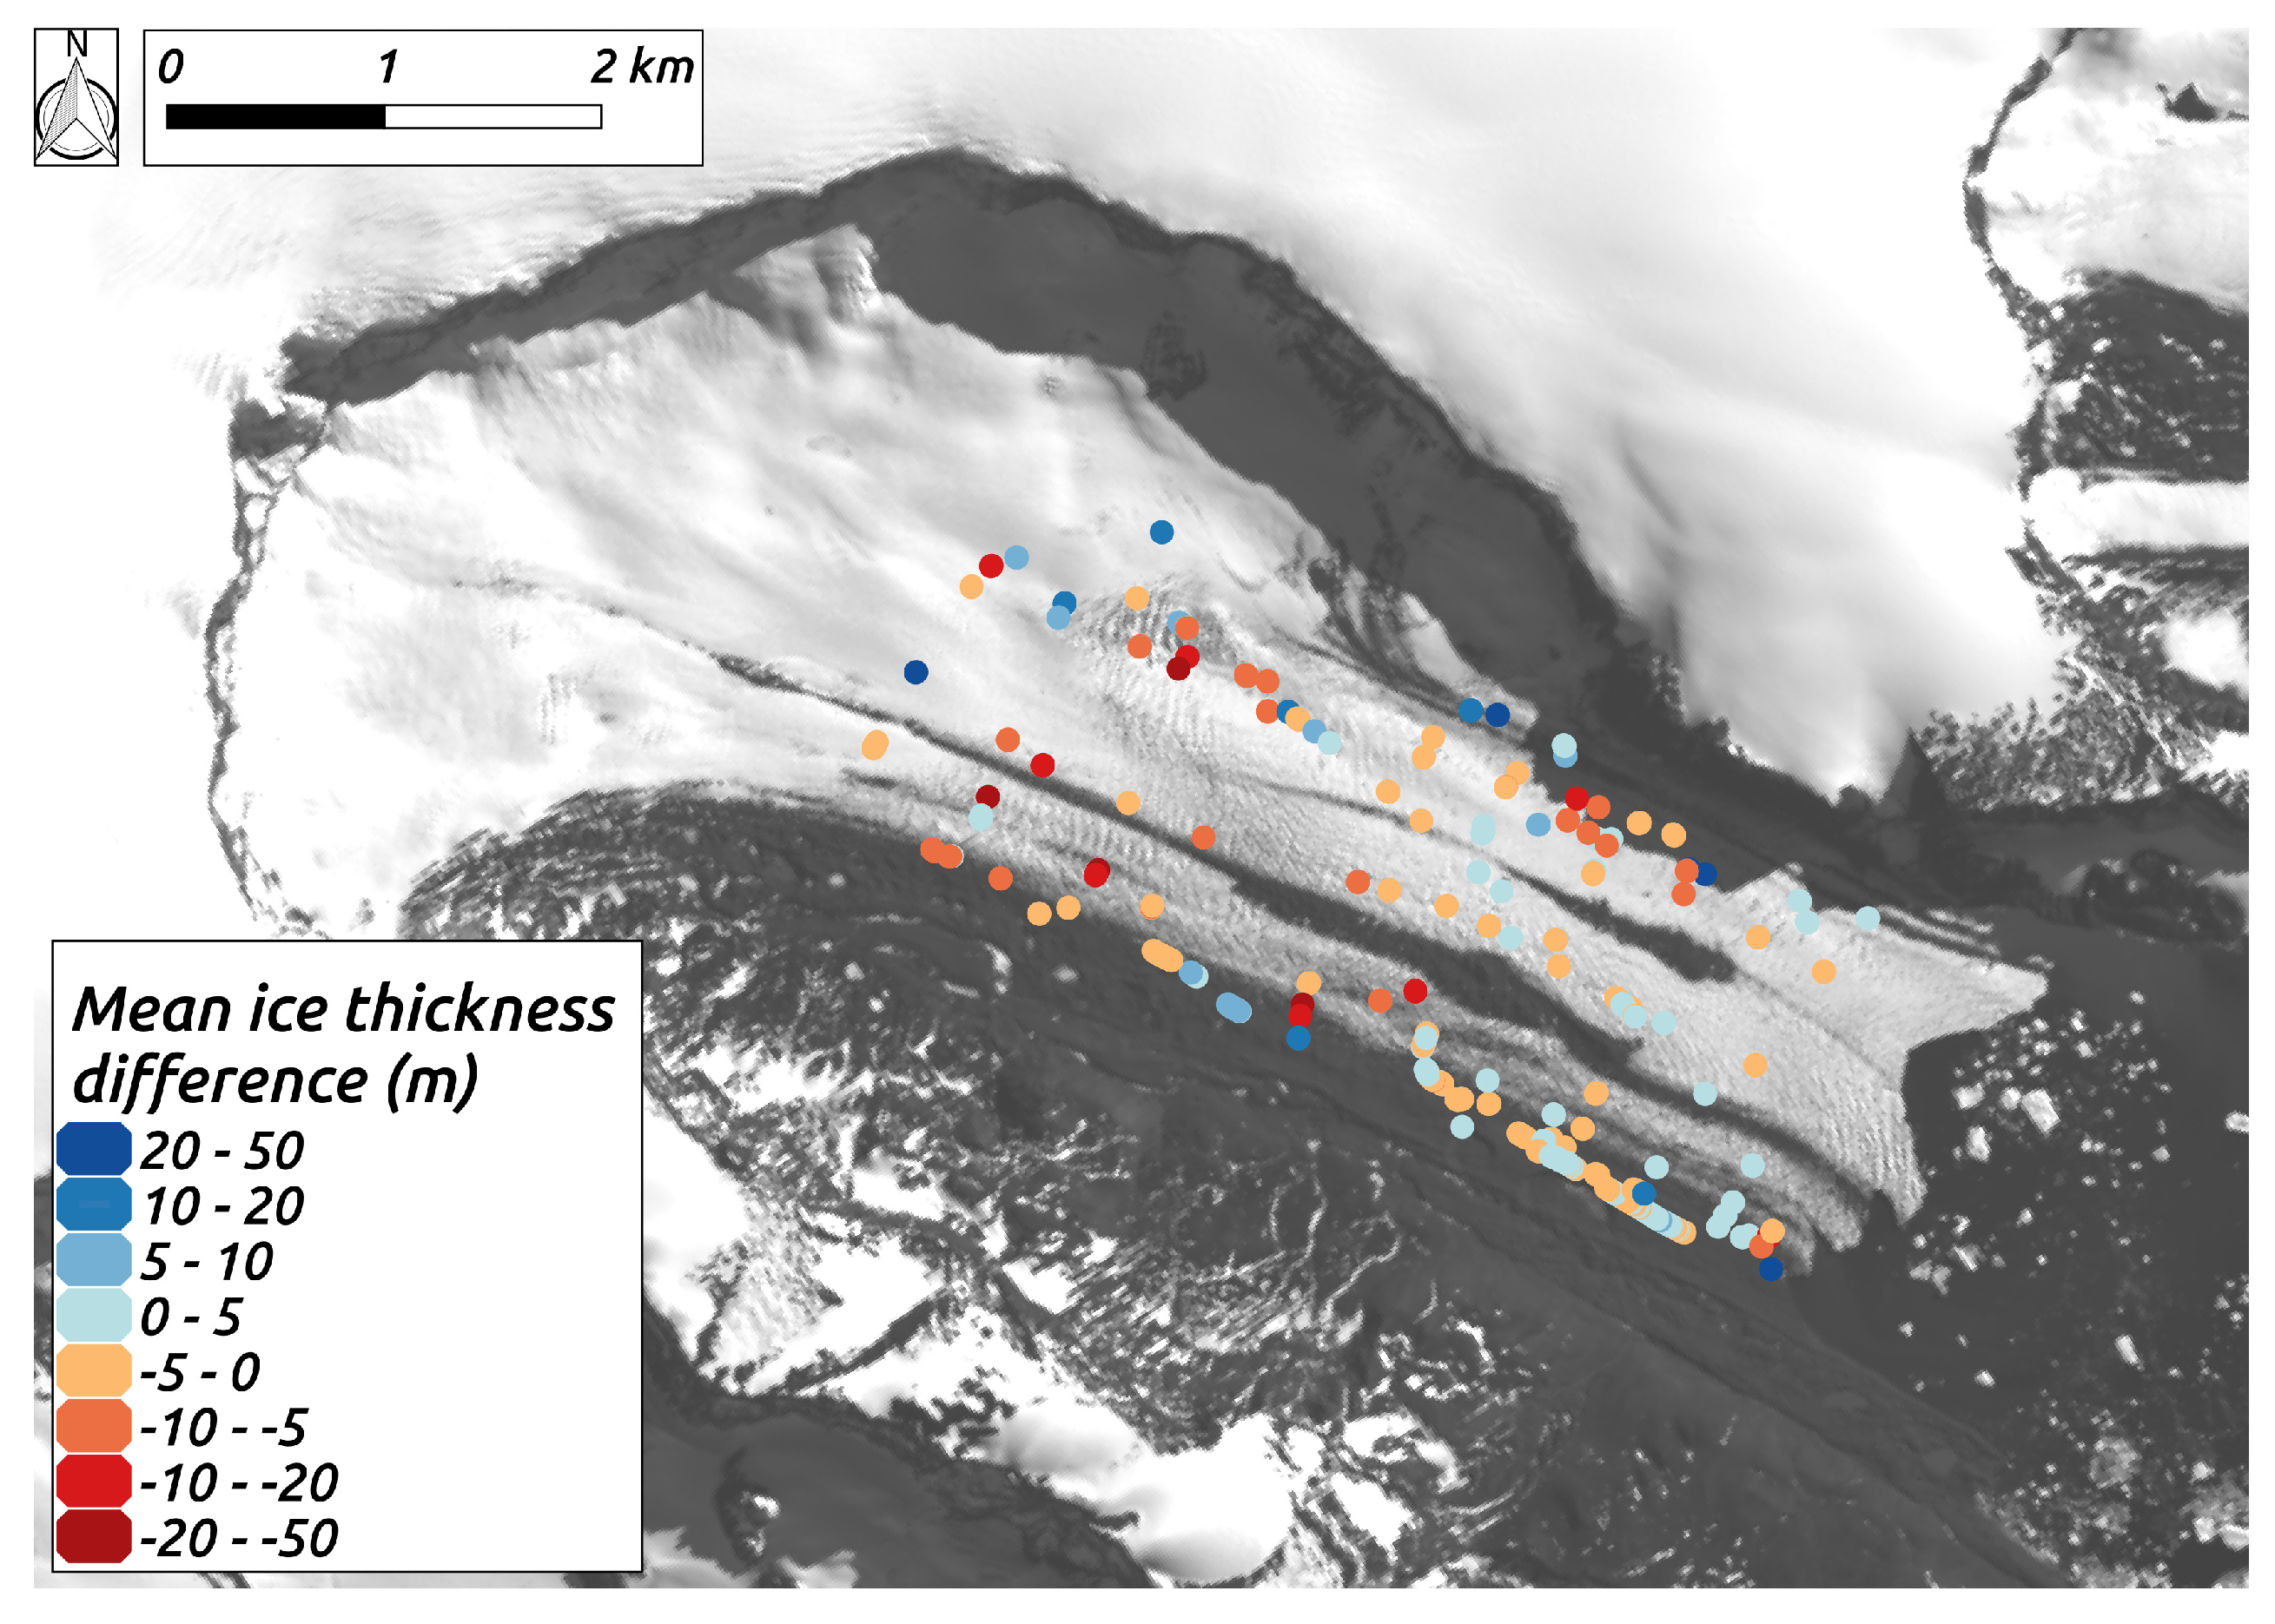
4.3. Comparison with Data from 2017
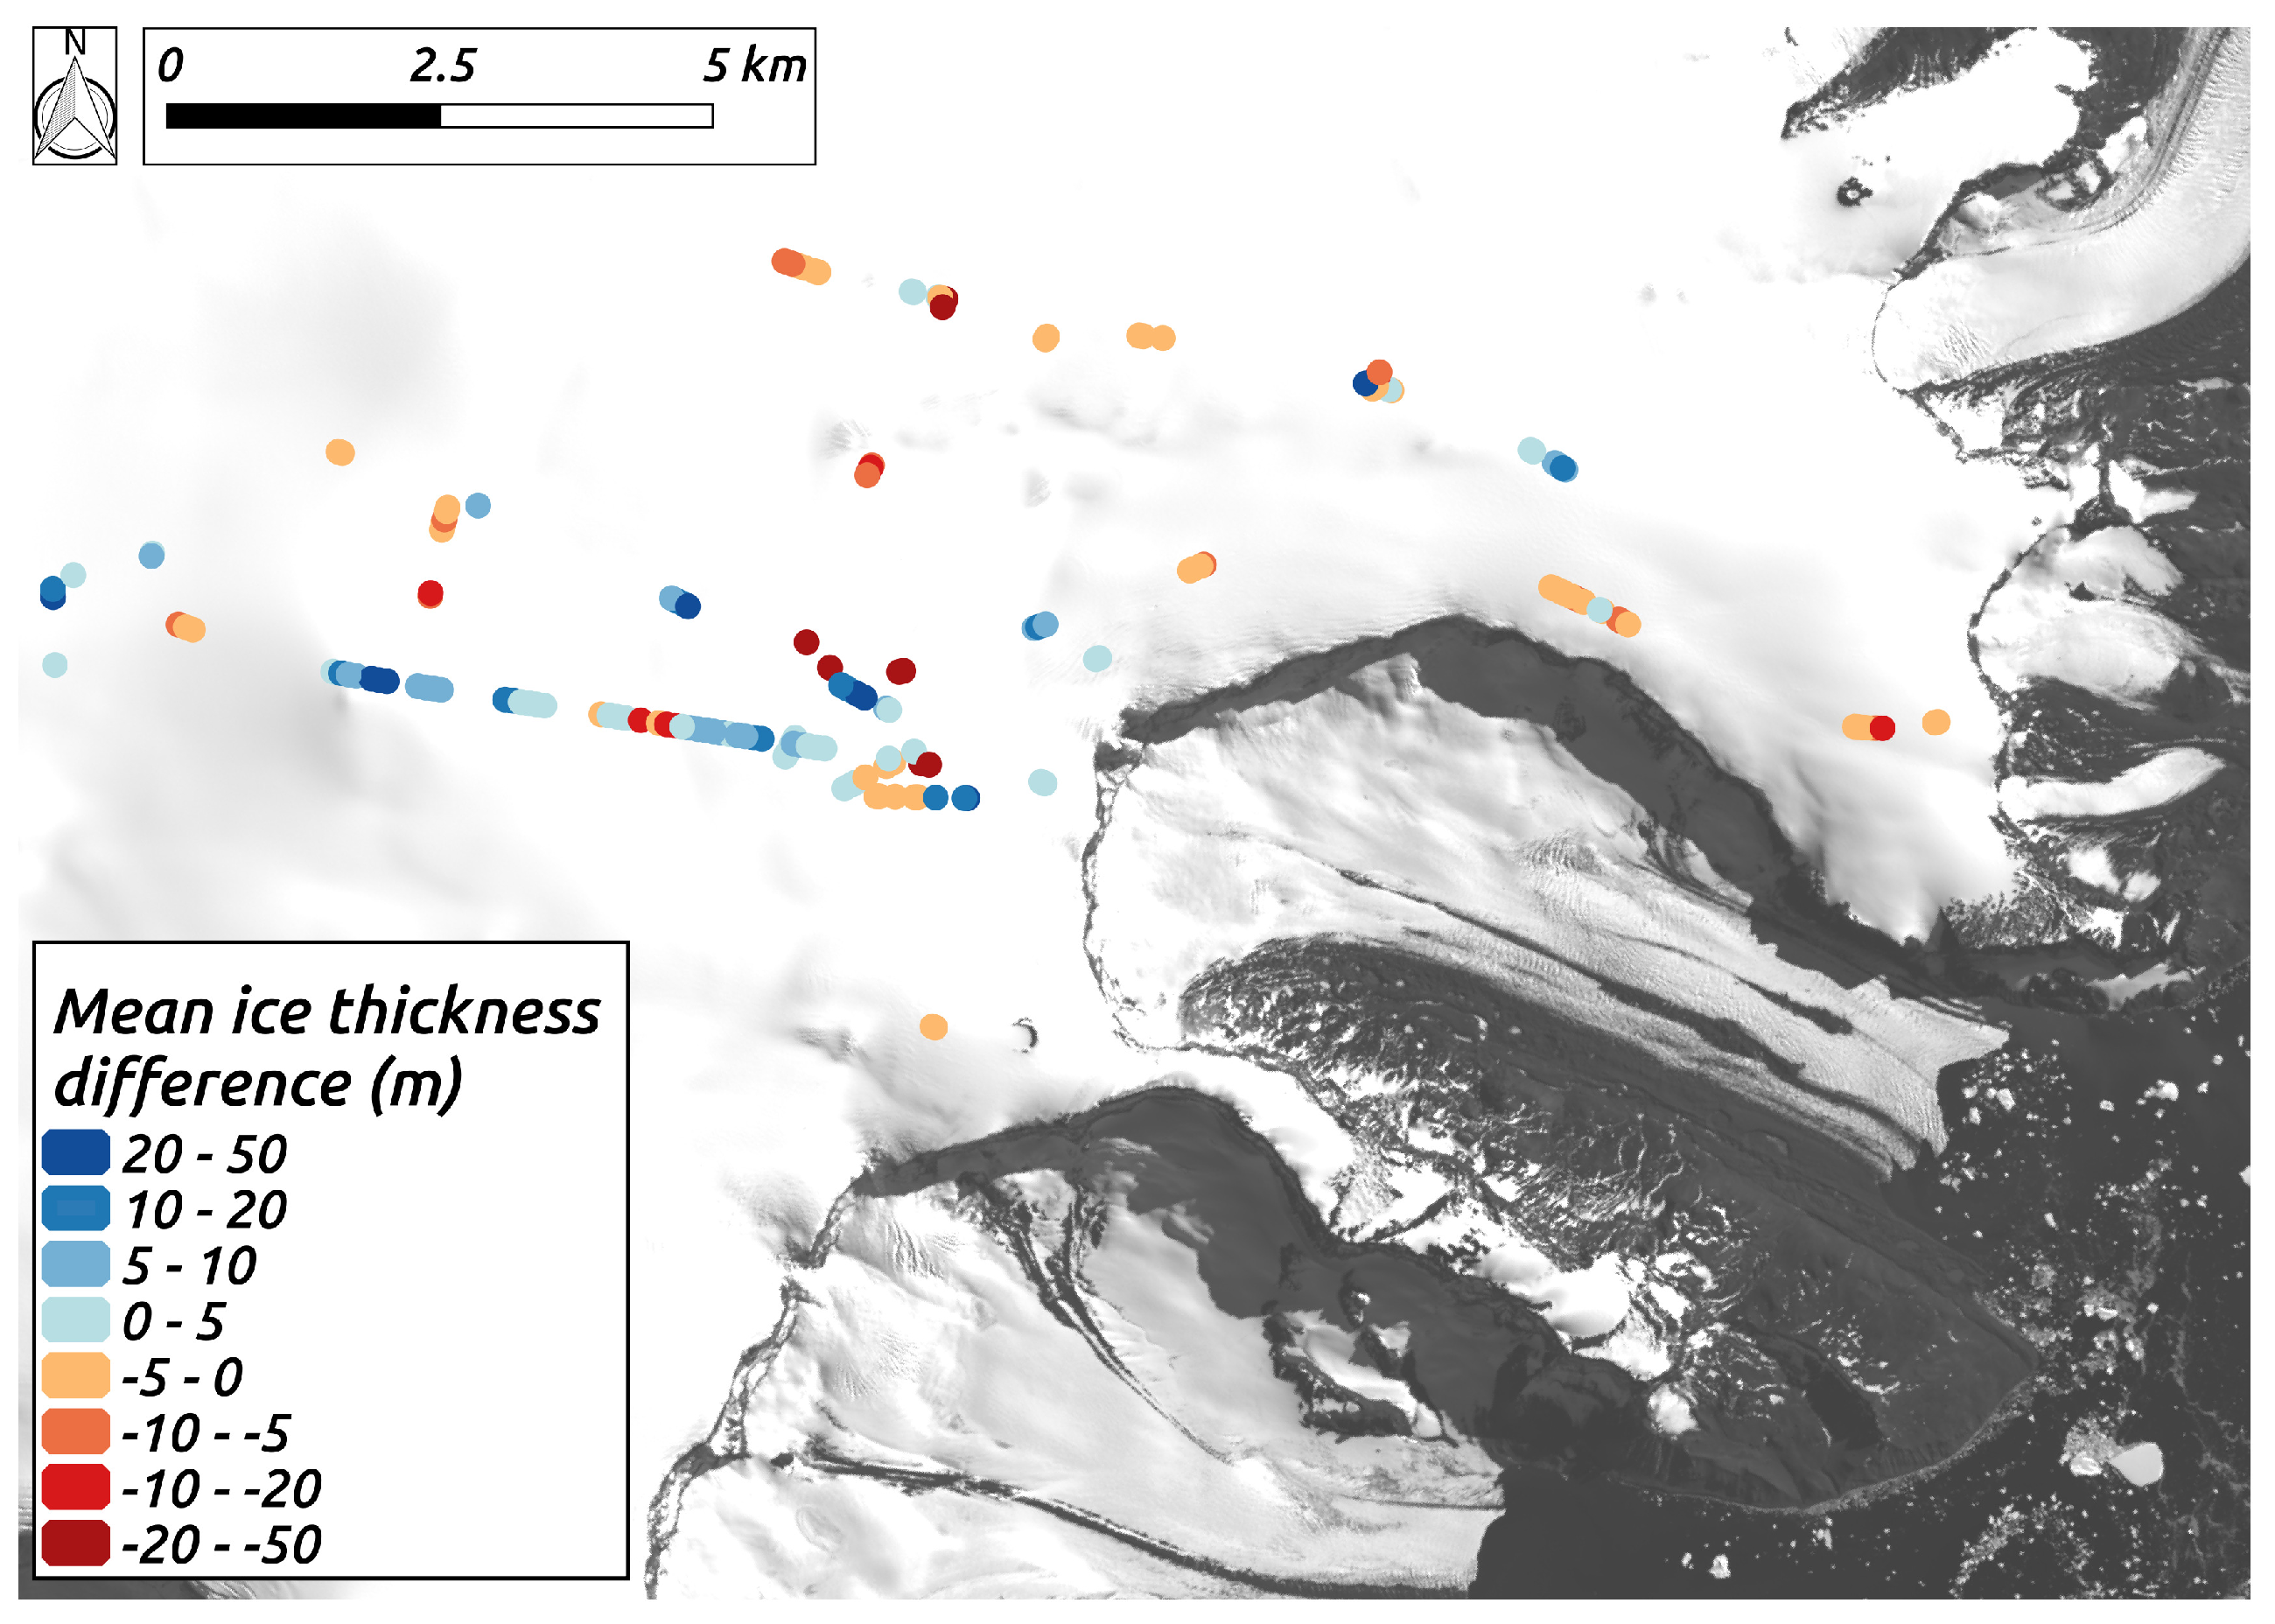
4.4. Comparison with Data from 1995–1998
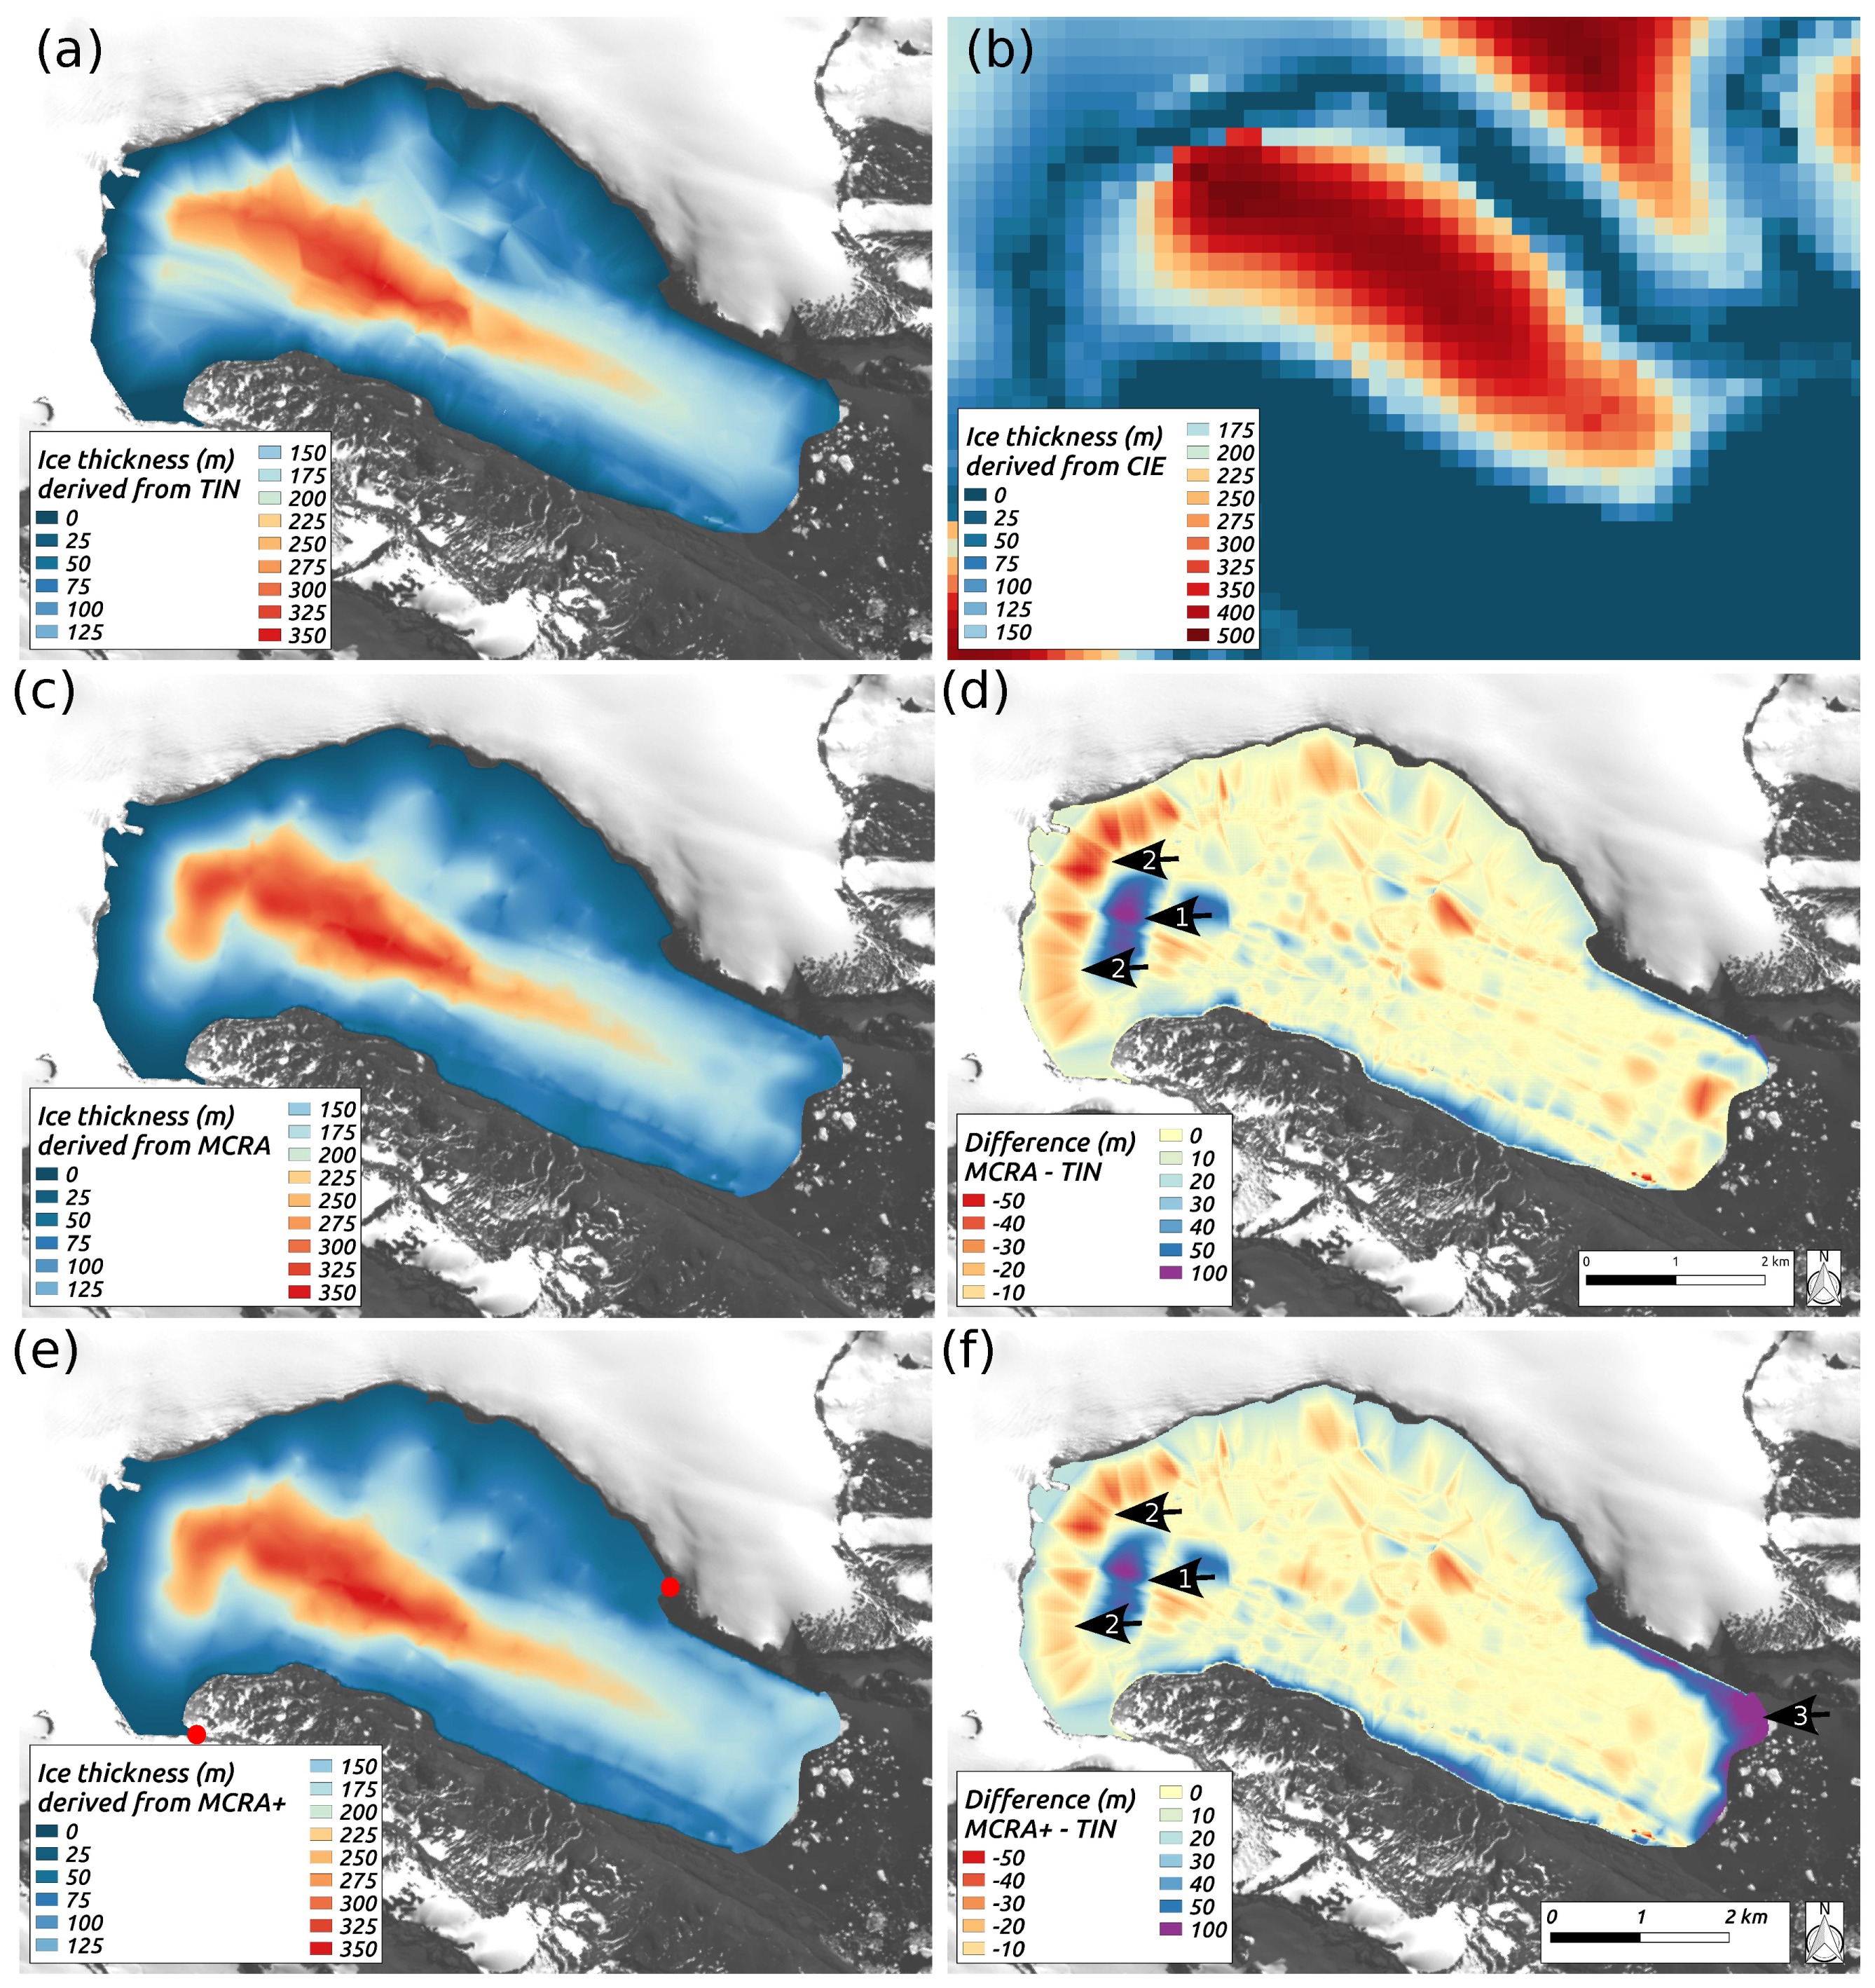
4.5. Interpolation and Reconstruction
4.6. Estimation of Ice Discharge
5. Discussion
5.1. Ice Thickness Measurements
5.2. Ice Thickness Interpolation
5.3. Ice Discharge
6. Conclusions
Author Contributions
Funding
Conflicts of Interest
Abbreviations
| CIE | consensus ice thickness estimate |
| GNSS | Global Navigation Satellite System |
| GPR | ground penetrating radar |
| GPS | Global Positioning System (in the context of this paper single frequency GPS measurements) |
| ITMIX | Ice Thickness Models Intercomparison eXperiment |
| JRI | James Ross Island |
| MAR | Modèle Atmosphérique Régional |
| MCRA | mass-conserving reconstruction approach |
| MCRA+ | mass-conserving reconstruction approach with additional mass input from the plateau |
| RGI | Randolph Glacier Inventory |
| RMSE | root-mean-square error |
| SAR | synthetic aperture radar |
| SMB | surface mass balance |
| TIN | triangular irregular networks |
Appendix A
| Sensor Scene 1 | Path | Date Scene 1 | Abs. Orbit Scene 1 | Date Scene 2 | Abs. Orbit Scene 2 | Time Step (days) | (m d) | (m d) | (m d) |
|---|---|---|---|---|---|---|---|---|---|
| TSX | 0140-014 | 13 August 2014 | 22,989 | 7 October 2014 | 23,824 | 55 | 0.005 | 0.009 | 0.010 |
| TDX | 0140-014 | 7 October 2014 | 23,824 | 29 October 2014 | 24,158 | 22 | 0.011 | 0.014 | 0.018 |
| TDX | 0140-014 | 29 October 2014 | 24,158 | 1 December 2014 | 24,659 | 33 | 0.008 | 0.021 | 0.022 |
| TSX | 0140-014 | 1 December 2014 | 24,659 | 3 January 2015 | 41,890 | 33 | 0.008 | 0.010 | 0.013 |
| TSX | 0140-014 | 3 January 2015 | 41,890 | 16 February 2015 | 42,558 | 44 | 0.006 | 0.022 | 0.023 |
| TSX | 0140-014 | 16 February 2015 | 42,558 | 1 April 2015 | 43,226 | 44 | 0.006 | 0.003 | 0.007 |
| TSX | 0140-014 | 1 April 2015 | 43,226 | 26 May 2015 | 44,061 | 55 | 0.005 | 0.007 | 0.008 |
| TSX | 0140-014 | 26 May 2015 | 44,061 | 28 June 2015 | 44,562 | 33 | 0.008 | 0.010 | 0.013 |
| TSX | 0140-014 | 28 June 2015 | 44,562 | 11 August 2015 | 45,230 | 44 | 0.006 | 0.010 | 0.011 |
| TSX | 0140-014 | 11 August 2015 | 45,230 | 24 September 2015 | 45,898 | 44 | 0.006 | 0.007 | 0.009 |
| TSX | 0140-014 | 24 September 2015 | 45,898 | 18 November 2015 | 46,733 | 55 | 0.005 | 0.018 | 0.018 |
| TSX | 0140-014 | 18 November 2015 | 46,733 | 18 March 2016 | 48,570 | 121 | 0.002 | 0.018 | 0.018 |
| TSX | 0140-014 | 18 March 2016 | 48,570 | 1 May 2016 | 49,238 | 44 | 0.006 | 0.009 | 0.011 |
| TSX | 0140-014 | 1 May 2016 | 49,238 | 25 June 2016 | 50,073 | 55 | 0.005 | 0.006 | 0.007 |
| TSX | 0140-014 | 25 June 2016 | 50,073 | 8 August 2016 | 50,741 | 44 | 0.006 | 0.006 | 0.008 |
| TDX | 0140-014 | 8 August 2016 | 50,741 | 21 September 2016 | 34,679 | 44 | 0.006 | 0.009 | 0.010 |
| TDX | 0140-014 | 21 September 2016 | 34,679 | 4 November 2016 | 35,347 | 44 | 0.006 | 0.105 | 0.105 |
| TDX | 0140-014 | 4 November 2016 | 35,347 | 29 December 2016 | 36,182 | 55 | 0.005 | 0.166 | 0.166 |
| TDX | 0140-014 | 29 December 2016 | 36,182 | 20 January 2017 | 36,516 | 22 | 0.011 | 0.059 | 0.061 |
| TDX | 0140-014 | 20 January 2017 | 36,516 | 22 February 2017 | 37,017 | 33 | 0.008 | 0.020 | 0.022 |
| TDX | 0140-014 | 22 February 2017 | 37,017 | 27 March 2017 | 37,518 | 33 | 0.008 | 0.007 | 0.010 |
| TDX | 0140-014 | 27 March 2017 | 37,518 | 10 May 2017 | 38,186 | 44 | 0.006 | 0.008 | 0.010 |
| TDX | 0140-014 | 10 May 2017 | 38,186 | 1 June 2017 | 38,520 | 22 | 0.011 | 0.011 | 0.016 |
| TDX | 0140-014 | 1 June 2017 | 38,520 | 15 July 2017 | 39,188 | 44 | 0.006 | 0.007 | 0.009 |
| TDX | 0140-014 | 15 July 2017 | 39,188 | 28 August 2017 | 39,856 | 44 | 0.006 | 0.011 | 0.012 |
| TSX | 0140-014 | 28 August 2017 | 39,856 | 11 October 2017 | 57,254 | 44 | 0.006 | 0.013 | 0.014 |
| TSX | 0140-014 | 11 October 2017 | 57,254 | 24 November 2017 | 57,922 | 44 | 0.006 | 0.072 | 0.072 |
| TSX | 0140-014 | 24 November 2017 | 57,922 | 7 January 2018 | 58,590 | 44 | 0.006 | 0.007 | 0.009 |
| TSX | 0140-014 | 7 January 2018 | 58,590 | 20 February 2018 | 59,258 | 44 | 0.006 | 0.006 | 0.009 |
| TSX | 0140-014 | 20 February 2018 | 59,258 | 5 April 2018 | 59,926 | 44 | 0.006 | 0.053 | 0.053 |
| TSX | 0140-014 | 5 April 2018 | 59,926 | 19 May 2018 | 60,594 | 44 | 0.006 | 0.008 | 0.010 |
| Data Set | Mean | Std | Min | Max | Figure |
|---|---|---|---|---|---|
| 2018 Gourdon | 8.30 | 3.36 | 3.62 | 18.08 | |
| 2018 Plateau | 9.50 | 3.01 | 3.37 | 20.21 | |
| 2018 Gourdon (Radius ) | 0.49 | 2.12 | 0 | 217.06 | |
| 2018 Plateau (Radius ) | 0.29 | 0.83 | 0 | 76.57 | |
| 2018 Plateau (Radius ) | 0.42 | 0.49 | 0 | 14.28 | |
| 2018 Gourdon | 8.36 | 3.87 | 3.62 | 217.58 | Figure 6a |
| 2018 Plateau | 9.53 | 3.07 | 3.37 | 76.64 | Figure 6a |
| 2018-2018 Gourdon (Radius ) | 5.74 | 12.09 | 0 | 100.49 | Figure 6b |
| 2018-2018 Plateau (Radius ) | 12.88 | 14.86 | 0 | 72.88 | Figure 6b |
| 2018-2017 Gourdon (Radius ) | 4.10 | 6.05 | 0 | 54.14 | Figure 7 |
| 2018-BAS Plateau (Radius 10m) | 7.11 | 9.06 | 0.01 | 46.2 | |
| 2018-BAS Plateau (Radius 50m) | 8.00 | 8.77 | 0.07 | 51.80 | Figure 8 |
| 2018-BAS Plateau (Radius 100m) | 8.33 | 8.76 | 0.04 | 49.87 |
| Date Scene 1 | Date Scene 1 | G1 | G1 | G2 | G2 | G3 | G3 | G4 | G4 | G5 | G5 | G6 | G6 | G7 | G7 | G8 | G8 | PF | PF |
|---|---|---|---|---|---|---|---|---|---|---|---|---|---|---|---|---|---|---|---|
| Mag | Dir | Mag | Dir | Mag | Dir | Mag | Dir | Mag | Dir | Mag | Dir | Mag | Dir | Mag | Dir | Mag | Dir | ||
| 13 August 2014 | 7 October 2014 | 14.0 | 0.7 | 18.7 | 4.8 | 19.9 | 0.0 | 19.4 | 6.6 | 5.7 | 0.0 | 5.8 | 0.7 | 17.3 | 12.0 | 21.5 | 23.1 | 1.8 | 1.8 |
| 7 October 2014 | 29 October 2014 | 12.9 | 0.0 | 18.7 | 4.8 | 19.6 | 0.0 | 15.1 | 0.0 | 13.8 | 12.2 | 5.8 | 0.0 | 19.0 | 15.2 | 20.2 | 17.8 | 0.0 | 0.0 |
| 29 October 2014 | 1 December 2014 | 12.9 | 0.0 | 19.4 | 5.5 | 19.6 | 6.6 | 15.1 | 3.6 | 9.2 | 6.9 | 7.1 | 1.6 | 19.5 | 14.7 | 26.8 | 27.8 | 5.8 | 5.8 |
| 1 December 2014 | 3 January 2015 | 14.0 | 1.5 | 33.9 | 5.9 | 20.5 | 0.9 | 18.2 | 7.9 | 46.2 | 16.6 | 23.9 | 9.2 | 66.3 | 27.7 | 61.7 | 24.7 | 7.6 | 7.6 |
| 3 January 2015 | 16 February 2015 | 43.5 | 5.5 | 24.9 | 5.2 | 19.9 | 0.0 | 15.1 | 1.3 | 34.9 | 10.3 | 8.0 | 4.5 | 31.1 | 30.1 | 29.1 | 27.8 | 14.4 | 14.4 |
| 16 February 2015 | 1 April 2015 | 13.3 | 0.0 | 18.7 | 16.3 | 19.6 | 0.0 | 15.3 | 3.1 | 51.5 | 17.0 | 38.8 | 18.3 | 69.9 | 26.3 | 71.7 | 47.2 | 24.8 | 24.8 |
| 1 April 2015 | 26 May 2015 | 14.0 | 0.7 | 18.7 | 4.8 | 22.4 | 3.8 | 15.1 | 0.0 | 13.1 | 9.4 | 9.2 | 4.7 | 20.5 | 15.4 | 19.2 | 16.0 | 5.1 | 5.1 |
| 26 May 2015 | 28 June 2015 | 12.5 | 0.0 | 18.7 | 4.8 | 23.3 | 4.7 | 15.1 | 0.0 | 6.0 | 0.2 | 6.7 | 3.6 | 18.1 | 11.8 | 19.4 | 16.0 | 6.3 | 6.3 |
| 28 June 201 | 11 August 2015 | 13.3 | 0.4 | 18.7 | 4.8 | 19.2 | 5.0 | 17.1 | 4.6 | 7.6 | 1.8 | 6.5 | 5.8 | 17.8 | 13.0 | 19.2 | 16.0 | 2.4 | 2.4 |
| 11 August 2015 | 24 September 2015 | 14.0 | 4.4 | 19.7 | 4.8 | 19.9 | 0.3 | 15.1 | 0.0 | 9.4 | 4.8 | 5.8 | 0.9 | 17.3 | 11.8 | 19.2 | 16.8 | 0.0 | 0.0 |
| 24 September 2015 | 18 November 2015 | 12.9 | 0.0 | 18.7 | 4.8 | 19.6 | 0.0 | 15.1 | 0.0 | 13.1 | 9.4 | 12.3 | 7.8 | 20.0 | 17.6 | 19.4 | 17.1 | 4.3 | 4.3 |
| 18 November 2015 | 18 March 2016 | 14.4 | 2.6 | 18.7 | 4.8 | 20.8 | 2.2 | 17.1 | 5.9 | 5.5 | 0.0 | 10.5 | 8.7 | 18.1 | 12.5 | 21.3 | 20.2 | 9.3 | 9.3 |
| 18 March 2016 | 1 May 2016 | 12.5 | 0.0 | 18.7 | 4.8 | 19.6 | 0.0 | 15.1 | 0.0 | 11.3 | 10.3 | 6.9 | 3.3 | 18.3 | 11.8 | 20.7 | 17.6 | 8.8 | 8.8 |
| 1 May 2016 | 25 June 2016 | 12.9 | 0.0 | 18.7 | 4.8 | 19.6 | 0.0 | 17.6 | 2.8 | 12.0 | 9.9 | 8.9 | 5.1 | 19.5 | 17.6 | 22.3 | 20.7 | 11.4 | 11.4 |
| 25 June 2016 | 8 August 2016 | 14.0 | 0.7 | 18.7 | 4.8 | 19.6 | 2.2 | 15.1 | 0.0 | 16.3 | 5.7 | 13.6 | 8.0 | 21.2 | 16.1 | 19.4 | 17.3 | 2.4 | 2.4 |
| 8 August 2016 | 21 September 2016 | 13.3 | 0.0 | 18.7 | 4.8 | 19.2 | 0.0 | 15.3 | 0.3 | 5.7 | 0.0 | 5.6 | 0.0 | 17.3 | 11.8 | 19.2 | 16.3 | 5.2 | 5.2 |
| 21 September 2016 | 4 November 2016 | 12.5 | 0.0 | 18.7 | 4.8 | 19.9 | 0.0 | 15.1 | 0.8 | 44.8 | 5.1 | 37.9 | 1.1 | 20.5 | 18.3 | 32.5 | 31.8 | 4.3 | 4.3 |
| 4 November 2016 | 29 December 2016 | 12.9 | 0.0 | 18.7 | 4.8 | 19.6 | 7.9 | 15.1 | 0.0 | 8.0 | 4.1 | 5.8 | 0.0 | 25.3 | 20.5 | 25.7 | 25.7 | 8.0 | 8.0 |
| 29 December 2016 | 20 January 2017 | 12.9 | 0.0 | 18.7 | 4.8 | 19.6 | 0.0 | 15.3 | 1.0 | 5.5 | 0.2 | 5.8 | 0.0 | 53.5 | 15.2 | 73.8 | 25.7 | 1.1 | 1.1 |
| 20 January 2017 | 22 February 2017 | 12.9 | 0.0 | 18.7 | 4.8 | 19.6 | 0.0 | 15.1 | 0.0 | 5.5 | 0.0 | 5.8 | 0.0 | 19.8 | 11.8 | 19.4 | 16.0 | 7.5 | 7.5 |
| 22 February 2017 | 27 March 2017 | 12.5 | 0.0 | 18.7 | 4.8 | 19.6 | 0.0 | 15.1 | 0.0 | 15.6 | 1.8 | 12.9 | 2.9 | 70.4 | 32.8 | 74.8 | 26.0 | 2.6 | 2.6 |
| 27 March 2017 | 10 May 2017 | 12.9 | 0.0 | 18.7 | 4.8 | 19.9 | 0.0 | 15.1 | 0.0 | 31.0 | 17.2 | 32.6 | 12.1 | 52.5 | 14.7 | 61.4 | 27.6 | 3.6 | 3.6 |
| 10 May 2017 | 1 June 2017 | 12.9 | 0.0 | 18.7 | 4.8 | 19.6 | 0.0 | 15.1 | 0.0 | 9.0 | 3.9 | 8.9 | 4.0 | 19.3 | 14.7 | 19.4 | 17.6 | 0.0 | 0.0 |
| 1 June 2017 | 15 July 2017 | 15.5 | 3.0 | 18.7 | 4.8 | 19.9 | 0.0 | 15.1 | 0.8 | 10.6 | 6.7 | 7.4 | 1.8 | 18.6 | 13.0 | 24.4 | 21.5 | 0.4 | 0.4 |
| 15 July 2017 | 28 August 2017 | 12.5 | 0.0 | 18.7 | 4.8 | 19.6 | 0.0 | 15.1 | 2.8 | 13.6 | 9.4 | 5.6 | 1.3 | 21.7 | 16.4 | 19.4 | 16.5 | 5.0 | 5.0 |
| 28 August 2017 | 11 October 2017 | 12.9 | 0.0 | 18.7 | 4.8 | 19.6 | 0.0 | 15.1 | 0.0 | 5.5 | 0.0 | 7.6 | 3.6 | 24.6 | 20.0 | 20.5 | 18.1 | 0.3 | 0.3 |
| 11 October 2017 | 24 November 2017 | 12.5 | 0.0 | 18.7 | 4.8 | 19.6 | 0.9 | 15.1 | 0.0 | 15.2 | 10.6 | 6.9 | 4.2 | 26.5 | 20.2 | 20.5 | 18.6 | 5.7 | 5.7 |
| 24 November 2017 | 7 January 2018 | 12.5 | 0.0 | 21.5 | 6.2 | 19.6 | 0.0 | 35.5 | 0.0 | 37.7 | 23.7 | 23.2 | 10.0 | 62.2 | 39.8 | 68.0 | 41.2 | 4.7 | 4.7 |
| 7 January 2018 | 20 February 2018 | 12.5 | 0.0 | 21.5 | 9.3 | 19.6 | 0.0 | 15.1 | 0.0 | 8.7 | 3.0 | 5.1 | 0.0 | 18.3 | 11.8 | 19.4 | 17.1 | 5.8 | 5.8 |
| 20 February 2018 | 5 April 2018 | 13.7 | 0.0 | 20.8 | 9.3 | 50.2 | 0.0 | 17.1 | 0.0 | 33.1 | 3.0 | 36.4 | 0.0 | 91.6 | 11.8 | 91.3 | 17.1 | 3.6 | 5.8 |
| 5 April 2018 | 19 May 2018 | 13.3 | 0.0 | 18.7 | 4.8 | 19.6 | 0.0 | 15.1 | 2.0 | 7.4 | 4.4 | 8.5 | 6.7 | 21.4 | 17.8 | 20.5 | 19.7 | 4.3 | 4.3 |
References
- Gabbi, J.; Farinotti, D.; Bauder, A.; Maurer, H. Ice volume distribution and implications on runoff projections in a glacierized catchment. Hydrol. Earth Syst. Sci. 2012, 16, 4543–4556. [Google Scholar] [CrossRef]
- Huss, M.; Hock, R. A new model for global glacier change and sea-level rise. Front. Earth Sci. 2015, 3. [Google Scholar] [CrossRef]
- GlaThiDa. Consortium: Glacier Thickness Database 3.0.1; World Glacier Monitoring Service: Zurich, Switzerland, 2019. [Google Scholar] [CrossRef]
- Farinotti, D.; Huss, M.; Fürst, J.J.; Landmann, J.; Machguth, H.; Maussion, F.; Pandit, A. A consensus estimate for the ice thickness distribution of all glaciers on Earth. Nat. Geosci. 2019, 12, 168–173. [Google Scholar] [CrossRef]
- Radić, V.; Hock, R. Regional and global volumes of glaciers derived from statistical upscaling of glacier inventory data. J. Geophys. Res. Earth Surf. 2010, 115, F01010. [Google Scholar] [CrossRef]
- Grinsted, A. An estimate of global glacier volume. Cryosphere 2013, 7, 141–151. [Google Scholar] [CrossRef]
- Gantayat, P.; Kulkarni, A.V.; Srinivasan, J.; Schmeits, M.J. Numerical modelling of past retreat and future evolution of Chhota Shigri glacier in Western Indian Himalaya. Ann. Glaciol. 2017, 58, 136–144. [Google Scholar] [CrossRef][Green Version]
- Paul, F.; Linsbauer, A. Modeling of glacier bed topography from glacier outlines, central branch lines, and a DEM. Int. J. Geogr. Inf. Sci. 2012, 26, 1173–1190. [Google Scholar] [CrossRef]
- Linsbauer, A.; Paul, F.; Haeberli, W. Modeling glacier thickness distribution and bed topography over entire mountain ranges with GlabTop: Application of a fast and robust approach. J. Geophys. Res. Earth Surf. 2012, 117, F03007. [Google Scholar] [CrossRef]
- Frey, H.; Machguth, H.; Huss, M.; Huggel, C.; Bajracharya, S.; Bolch, T.; Kulkarni, A.; Linsbauer, A.; Salzmann, N.; Stoffel, M. Estimating the volume of glaciers in the Himalayan–Karakoram region using different methods. Cryosphere 2014, 8, 2313–2333. [Google Scholar] [CrossRef]
- Carrivick, J.L.; Davies, B.J.; James, W.H.M.; Quincey, D.J.; Glasser, N.F. Distributed ice thickness and glacier volume in southern South America. Glob. Planet. Chang. 2016, 146, 122–132. [Google Scholar] [CrossRef]
- Farinotti, D.; Huss, M.; Bauder, A.; Funk, M.; Truffer, M. A method to estimate the ice volume and ice-thickness distribution of alpine glaciers. J. Glaciol. 2009, 55, 422–430. [Google Scholar] [CrossRef]
- Huss, M.; Farinotti, D. A high-resolution bedrock map for the Antarctic Peninsula. Cryosphere 2014, 8, 1261–1273. [Google Scholar] [CrossRef]
- Maussion, F.; Butenko, A.; Champollion, N.; Dusch, M.; Eis, J.; Fourteau, K.; Gregor, P.; Jarosch, A.H.; Landmann, J.; Oesterle, F.; et al. The Open Global Glacier Model (OGGM) v1.1. Geosci. Model Dev. 2019, 12, 909–931. [Google Scholar] [CrossRef]
- Morlighem, M.; Rignot, E.; Seroussi, H.; Larour, E.; Dhia, H.B.; Aubry, D. A mass conservation approach for mapping glacier ice thickness. Geophys. Res. Lett. 2011, 38, L19503. [Google Scholar] [CrossRef]
- Brinkerhoff, D.J.; Aschwanden, A.; Truffer, M. Bayesian Inference of Subglacial Topography Using Mass Conservation. Front. Earth Sci. 2016, 4. [Google Scholar] [CrossRef]
- Fürst, J.J.; Gillet-Chaulet, F.; Benham, T.J.; Dowdeswell, J.A.; Grabiec, M.; Navarro, F.; Pettersson, R.; Moholdt, G.; Nuth, C.; Sass, B.; et al. Application of a two-step approach for mapping ice thickness to various glacier types on Svalbard. Cryosphere Discuss. 2017, 2017, 1–43. [Google Scholar] [CrossRef]
- Farinotti, D.; Brinkerhoff, D.J.; Clarke, G.K.C.; Fürst, J.J.; Frey, H.; Gantayat, P.; Gillet-Chaulet, F.; Girard, C.; Huss, M.; Leclercq, P.W.; et al. How accurate are estimates of glacier ice thickness? Results from ITMIX, the Ice Thickness Models Intercomparison eXperiment. Cryosphere 2017, 11, 949–970. [Google Scholar] [CrossRef]
- Farinotti, D.; Huss, M.; Fürst, J.J.; Marian, L.J.; Machguth, H.; Maussion, F.; Pandit, A. A Consensus Estimate for the Ice Thickness Distribution of All Glaciers on Earth-Dataset. 2019. Available online: https://doi.org/10.3929/ethz-b-000315707 (accessed on 26 February 2019).
- RGI. Consortium. Randolph Glacier Inventory—A Dataset of Global Glacier Outlines: Version 6.0; Technical Report; Global Land Ice Measurements from Space: Boulder, CO, USA, 2017. [Google Scholar]
- Kittel, C.; Amory, C.; Agosta, C.; Delhasse, A.; Doutreloup, S.; Huot, P.V.; Wyard, C.; Fichefet, T.; Fettweis, X. Sensitivity of the current Antarctic surface mass balance to sea surface conditions using MAR. Cryosphere 2018, 12, 3827–3839. [Google Scholar] [CrossRef]
- Agosta, C.; Amory, C.; Kittel, C.; Orsi, A.; Favier, V.; Gallée, H.; van den Broeke, M.R.; Lenaerts, J.T.M.; van Wessem, J.M.; van de Berg, W.J.; et al. Estimation of the Antarctic surface mass balance using the regional climate model MAR (1979–2015) and identification of dominant processes. Cryosphere 2019, 13, 281–296. [Google Scholar] [CrossRef]
- Lippl, S.; Friedl, P.; Kittel, C.; Marinsek, S.; Seehaus, T.C.; Braun, M.H. Spatial and Temporal Variability of Glacier Surface Velocities and Outlet Areas on James Ross Island, Northern Antarctic Peninsula. Geosciences 2019, 9, 374. [Google Scholar] [CrossRef]
- Davies, B.J.; Carrivick, J.L.; Glasser, N.F.; Hambrey, M.J.; Smellie, J.L. Variable glacier response to atmospheric warming, northern Antarctic Peninsula, 1988–2009. Cryosphere 2012, 6, 1031–1048. [Google Scholar] [CrossRef]
- Smellie, J.L.; Johnson, J.S.; McIntosh, W.C.; Esser, R.; Gudmundsson, M.T.; Hambrey, M.J.; van Wyk de Vries, B. Six million years of glacial history recorded in volcanic lithofacies of the James Ross Island Volcanic Group, Antarctic Peninsula. Palaeogeogr. Palaeoclimatol. Palaeoecol. 2008, 260, 122–148. [Google Scholar] [CrossRef]
- Blindow, N. The University of Münster Airborne Ice Radar (UMAIR): Instrumentation and first results of temperate and polythermal glaciers. In Proceedings of the 2009 5th International Workshop on Advanced Ground Penetrating Radar (IWAGPR), Vienna, Austria, 19–24 April 2009; Volume 11, p. 13619. [Google Scholar]
- Blindow, N.; Salat, C.; Gundelach, V.; Buschmann, U.; Kahnt, W. Performance and calibration of the helicoper GPR system BGR-P30. In Proceedings of the 2011 6th International Workshop on Advanced Ground Penetrating Radar (IWAGPR), Aachen, Germany, 22–24 June 2011; pp. 1–5. [Google Scholar] [CrossRef]
- Forte, E.; Bondini, M.B.; Bortoletto, A.; Dossi, M.; Colucci, R.R. Pros and Cons in Helicopter-Borne GPR Data Acquisition on Rugged Mountainous Areas: Critical Analysis and Practical Guidelines. PApGe 2019, 176, 4533–4554. [Google Scholar] [CrossRef]
- Johari, G.P.; Charette, P.A. The Permittivity and Attenuation in Polycrystalline and Single-Crystal Ice Ih at 35 and 60 MHz. J. Glaciol. 1975, 14, 293–303. [Google Scholar] [CrossRef][Green Version]
- Strozzi, T.; Luckman, A.; Murray, T.; Wegmuller, U.; Werner, C.L. Glacier motion estimation using SAR offset-tracking procedures. IEEE Trans. Geosci. Remote Sens. 2002, 40, 2384–2391. [Google Scholar] [CrossRef]
- Seehaus, T.; Cook, A.J.; Silva, A.B.; Braun, M. Changes in glacier dynamics in the northern Antarctic Peninsula since 1985. Cryosphere 2018, 12, 577–594. [Google Scholar] [CrossRef]
- Blindow, N.; Salat, C.; Casassa, G. Airborne GPR sounding of deep temperate glaciers—Examples from the Northern Patagonian Icefield. In Proceedings of the 2012 14th International Conference on Ground Penetrating Radar (GPR), Shanghai, China, 4–8 June 2012; pp. 664–669. [Google Scholar] [CrossRef]
- LEE, J. Comparison of existing methods for building triangular irregular network, models of terrain from grid digital elevation models. Int. J. Geogr. Inf. Syst. 1991, 5, 267–285. [Google Scholar] [CrossRef]
- Wu, C.; Wu, J.; Luo, Y.; Zhang, H.; Teng, Y.; DeGloria, S.D. Spatial interpolation of severely skewed data with several peak values by the approach integrating kriging and triangular irregular network interpolation. Environ. Earth Sci. 2011, 63, 1093–1103. [Google Scholar] [CrossRef]
- Hutter, K. Theoretical Glaciology: Material Science of Ice and the Mechanics of Glaciers and Ice Sheets; Mathematical Approaches to Geophysics; Springer Netherlands: Dordrecht, The Netherlands, 2017. [Google Scholar]
- Howat, I.M.; Porter, C.; Smith, B.E.; Noh, M.J.; Morin, P. The Reference Elevation Model of Antarctica. Cryosphere 2019, 13, 665–674. [Google Scholar] [CrossRef]
- Sánchez-Gámez, P.; Navarro, F.J. Ice discharge error estimates using different cross-sectional area approaches: A case study for the Canadian High Arctic, 2016/17. J. Glaciol. 2018, 64, 595–608. [Google Scholar] [CrossRef]
- Lapazaran, J.J.; Otero, J.; Martín-Español, A.; Navarro, F.J. On the errors involved in ice-thickness estimates I: Ground-penetrating radar measurement errors. J. Glaciol. 2016, 62, 1008–1020. [Google Scholar] [CrossRef]
- Seehaus, T.; Marinsek, S.; Helm, V.; Skvarca, P.; Braun, M. Changes in ice dynamics, elevation and mass discharge of Dinsmoor–Bombardier–Edgeworth glacier system, Antarctic Peninsula. Earth Planet. Sci. Lett. 2015, 427, 125–135. [Google Scholar] [CrossRef]
- Cuffey, K.M.; Paterson, W.S.B. The Physics of Glaciers, 4th ed.; Butterworth-Heinemann/Elsevier: Burlington, MA, USA, 2010. [Google Scholar]
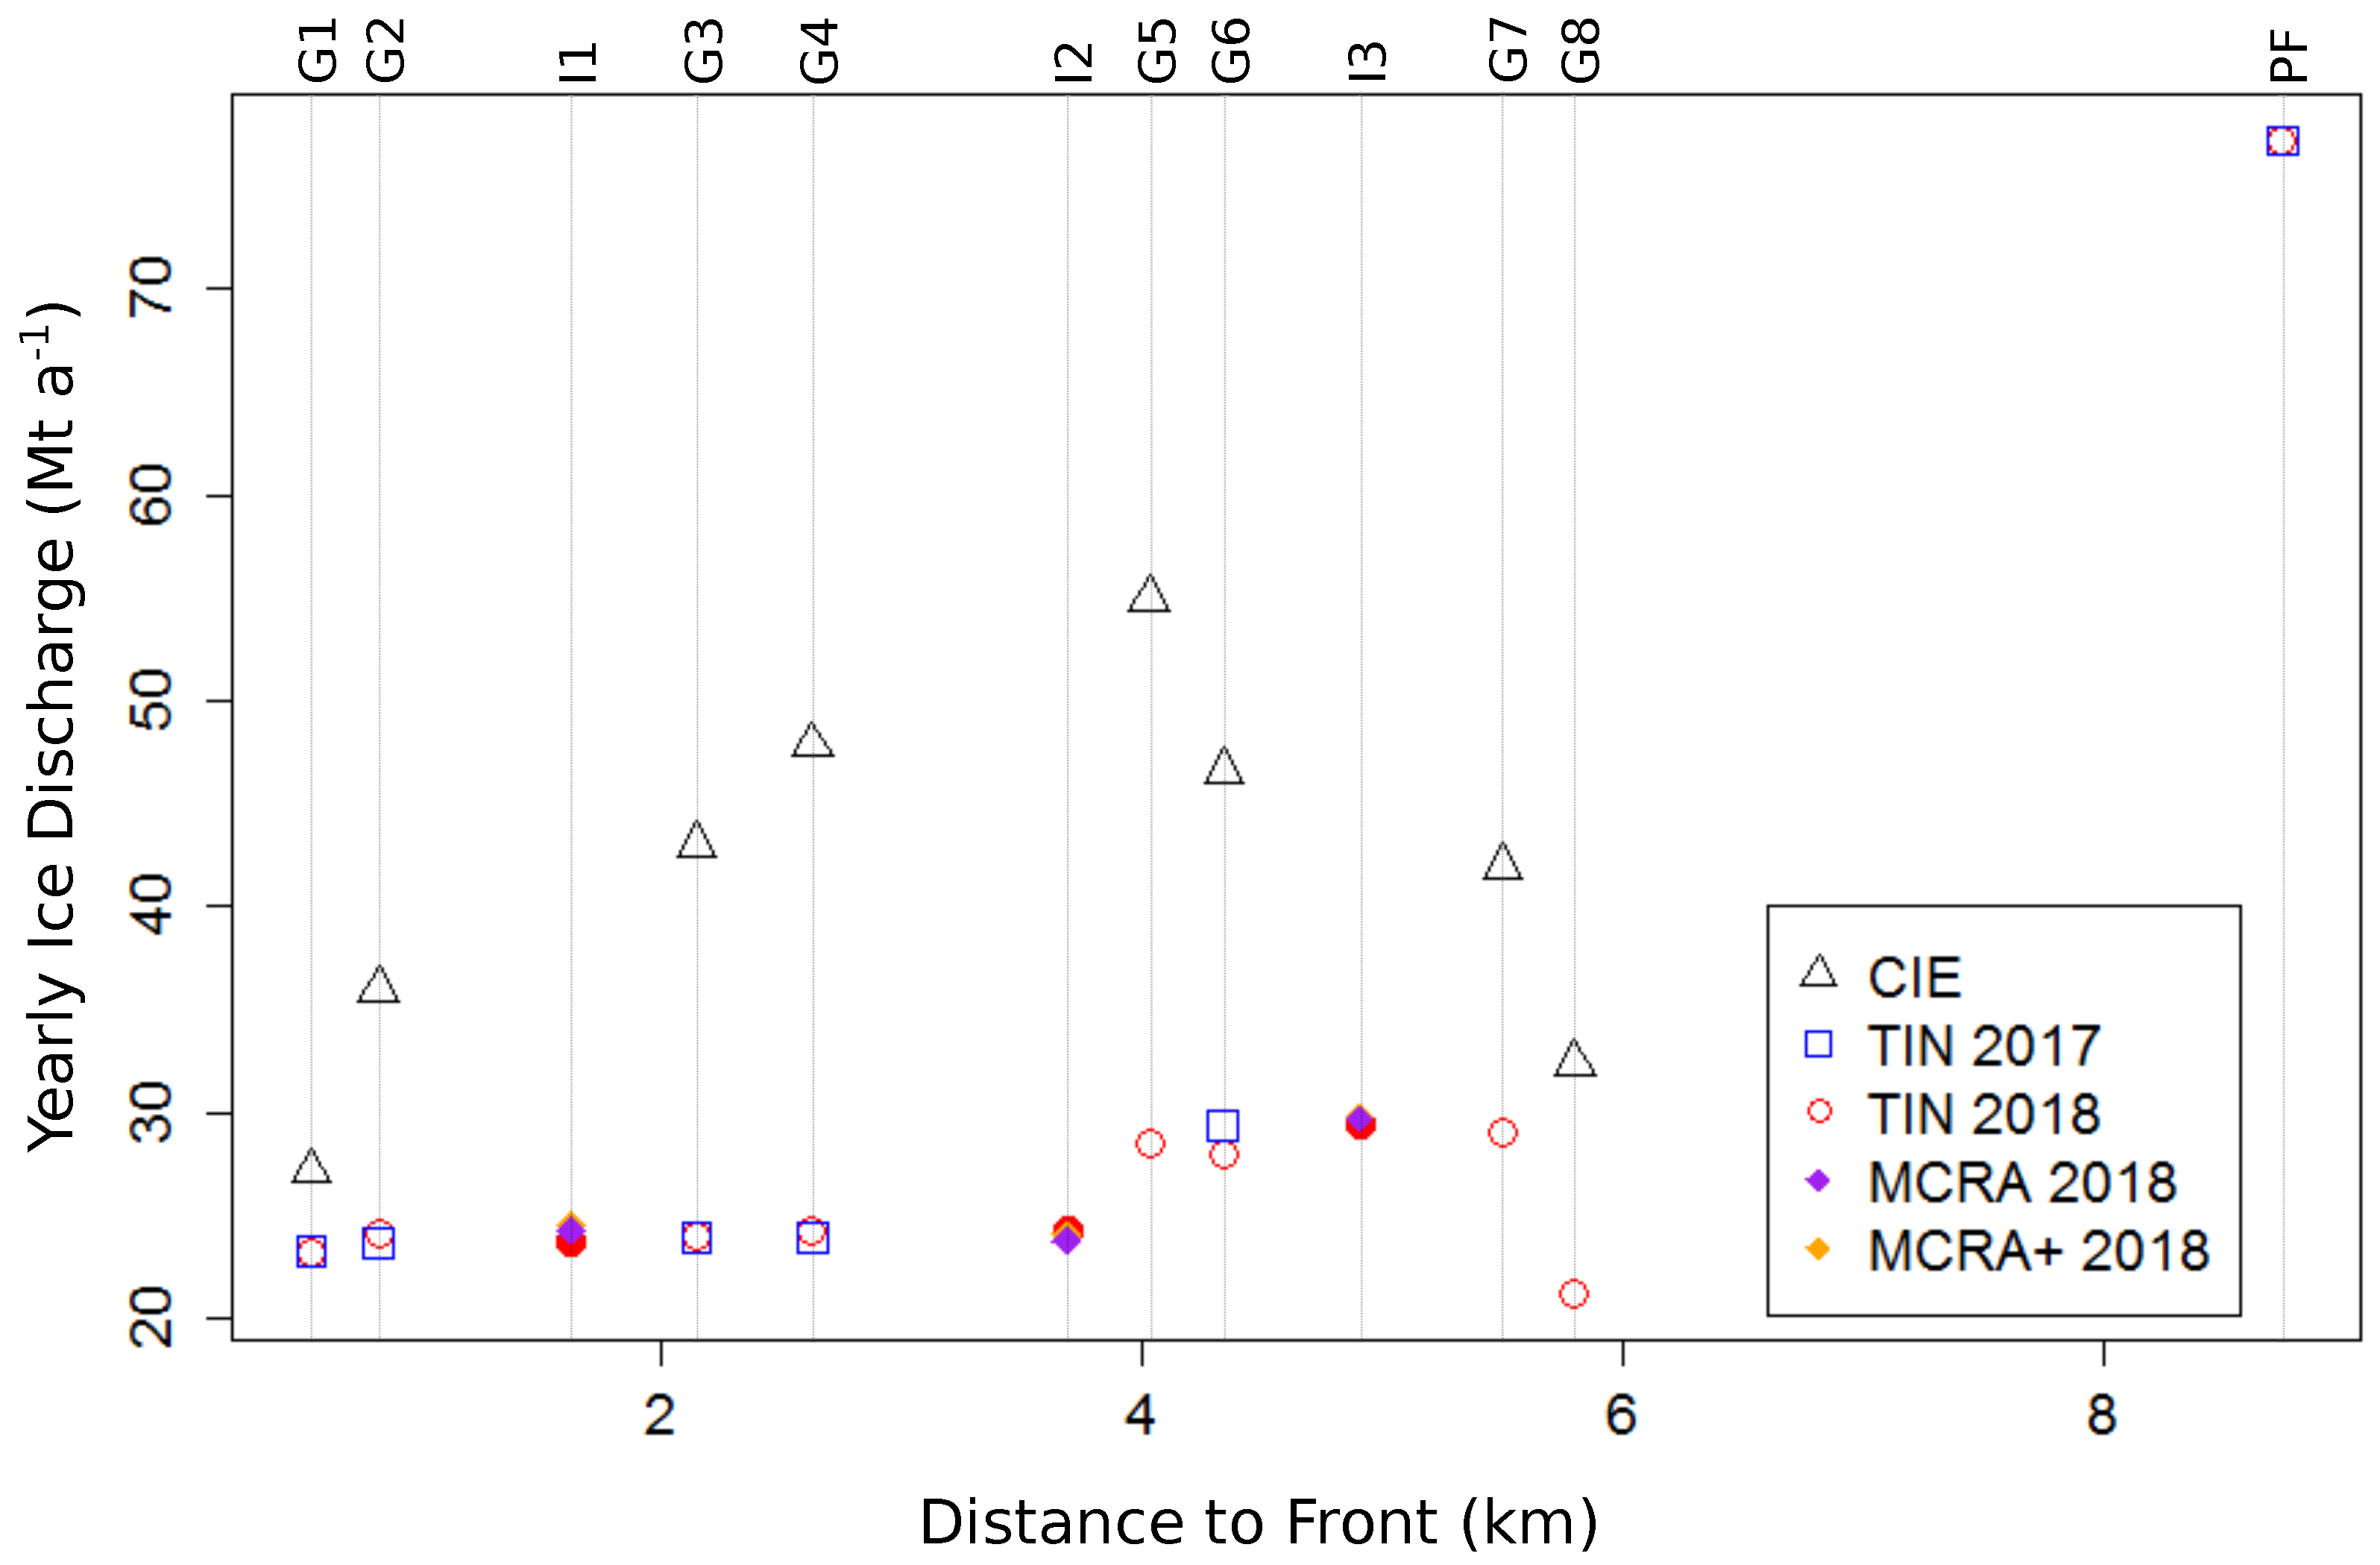
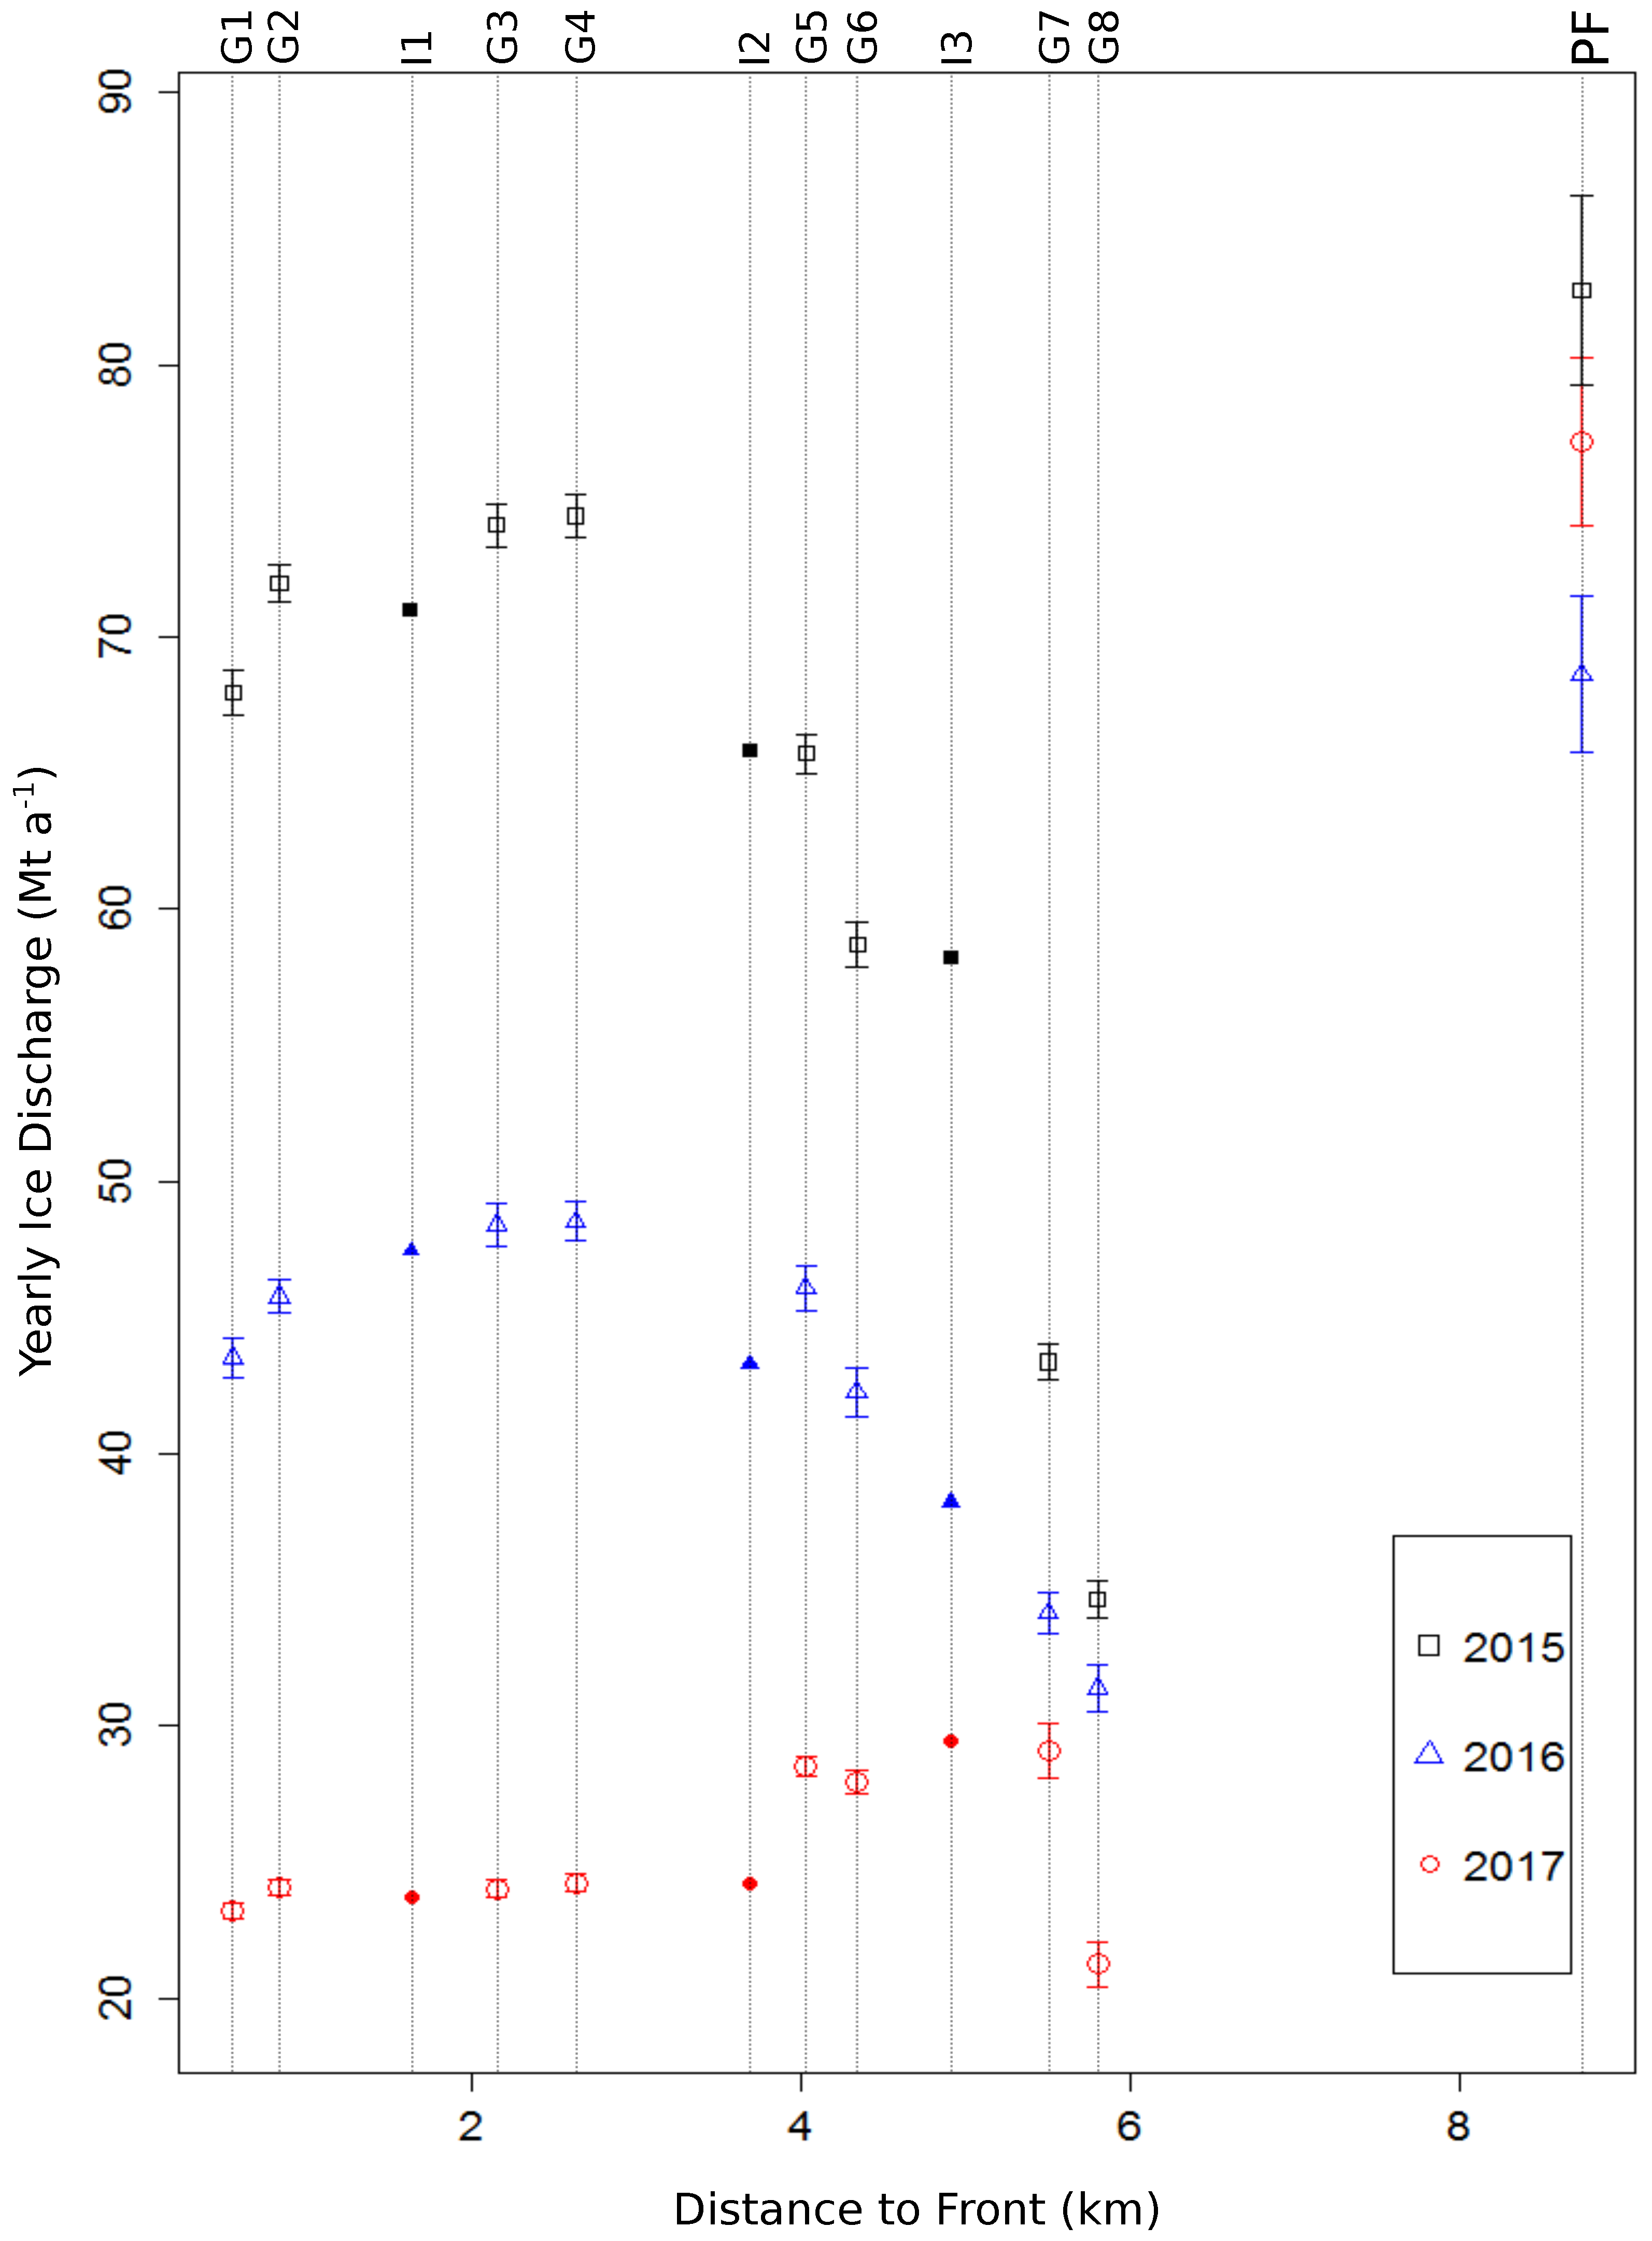
| Year | (Mt a) | (Mt a) | (Mt a) | (Mt a) | (Mt a) | (Mt a) |
|---|---|---|---|---|---|---|
| G1 | ||||||
| 2015 | 0.091 | 0.537 | 0.266 | 0.082 | 0.466 | 0.838 |
| 2016 | 0.060 | 0.353 | 0.174 | 0.293 | 0.270 | 0.730 |
| 2017 | 0.031 | 0.180 | 0.089 | 0.140 | 0.011 | 0.266 |
| G2 | ||||||
| 2015 | 0.094 | 0.553 | 0.273 | 0.086 | 0.154 | 0.665 |
| 2016 | 0.061 | 0.358 | 0.177 | 0.303 | 0.117 | 0.622 |
| 2017 | 0.031 | 0.179 | 0.089 | 0.144 | 0.025 | 0.270 |
| G3 | ||||||
| 2015 | 0.100 | 0.588 | 0.284 | 0.098 | 0.297 | 0.788 |
| 2016 | 0.065 | 0.383 | 0.185 | 0.344 | 0.288 | 0.806 |
| 2017 | 0.032 | 0.190 | 0.091 | 0.164 | 0.014 | 0.291 |
| G4 | ||||||
| 2015 | 0.099 | 0.580 | 0.279 | 0.102 | 0.350 | 0.799 |
| 2016 | 0.064 | 0.378 | 0.182 | 0.361 | 0.202 | 0.728 |
| 2017 | 0.033 | 0.193 | 0.092 | 0.173 | 0.028 | 0.302 |
| G5 | ||||||
| 2015 | 0.095 | 0.560 | 0.265 | 0.116 | 0.250 | 0.719 |
| 2016 | 0.066 | 0.389 | 0.185 | 0.407 | 0.310 | 0.807 |
| 2017 | 0.038 | 0.222 | 0.110 | 0.192 | 0.141 | 0.377 |
| G6 | ||||||
| 2015 | 0.084 | 0.497 | 0.233 | 0.125 | 0.424 | 0.835 |
| 2016 | 0.060 | 0.351 | 0.165 | 0.451 | 0.385 | 0.915 |
| 2017 | 0.037 | 0.218 | 0.103 | 0.217 | 0.152 | 0.402 |
| G7 | ||||||
| 2015 | 0.061 | 0.359 | 0.165 | 0.143 | 0.420 | 0.631 |
| 2016 | 0.047 | 0.279 | 0.129 | 0.515 | 0.273 | 0.759 |
| 2017 | 0.042 | 0.246 | 0.115 | 0.242 | 0.795 | 0.983 |
| G8 | ||||||
| 2015 | 0.050 | 0.296 | 0.138 | 0.135 | 0.495 | 0.678 |
| 2016 | 0.046 | 0.271 | 0.127 | 0.469 | 0.561 | 0.881 |
| 2017 | 0.033 | 0.196 | 0.092 | 0.200 | 0.710 | 0.829 |
| PF | ||||||
| 2015 | 0.074 | 0.433 | 0.198 | 0.160 | 3.422 | 3.465 |
| 2016 | 0.047 | 0.276 | 0.137 | 0.552 | 2.739 | 2.863 |
| 2017 | 0.061 | 0.359 | 0.165 | 0.258 | 3.016 | 3.069 |
© 2019 by the authors. Licensee MDPI, Basel, Switzerland. This article is an open access article distributed under the terms and conditions of the Creative Commons Attribution (CC BY) license (http://creativecommons.org/licenses/by/4.0/).
Share and Cite
Lippl, S.; Blindow, N.; Fürst, J.J.; Marinsek, S.; Seehaus, T.C.; Braun, M.H. Uncertainty Assessment of Ice Discharge Using GPR-Derived Ice Thickness from Gourdon Glacier, Antarctic Peninsula. Geosciences 2020, 10, 12. https://doi.org/10.3390/geosciences10010012
Lippl S, Blindow N, Fürst JJ, Marinsek S, Seehaus TC, Braun MH. Uncertainty Assessment of Ice Discharge Using GPR-Derived Ice Thickness from Gourdon Glacier, Antarctic Peninsula. Geosciences. 2020; 10(1):12. https://doi.org/10.3390/geosciences10010012
Chicago/Turabian StyleLippl, Stefan, Norbert Blindow, Johannes J. Fürst, Sebastián Marinsek, Thorsten C. Seehaus, and Matthias H. Braun. 2020. "Uncertainty Assessment of Ice Discharge Using GPR-Derived Ice Thickness from Gourdon Glacier, Antarctic Peninsula" Geosciences 10, no. 1: 12. https://doi.org/10.3390/geosciences10010012
APA StyleLippl, S., Blindow, N., Fürst, J. J., Marinsek, S., Seehaus, T. C., & Braun, M. H. (2020). Uncertainty Assessment of Ice Discharge Using GPR-Derived Ice Thickness from Gourdon Glacier, Antarctic Peninsula. Geosciences, 10(1), 12. https://doi.org/10.3390/geosciences10010012


