Animal Images Database: Validation of 120 Images for Human-Animal Studies


Simple Summary
Abstract
1. Introduction
1.1. Diversity in How We Perceive and Categorize Animals
1.2. Relevant Evaluative Dimensions in How Humans Perceive Non-Human Animals
1.2.1. Valence
1.2.2. Arousal
1.2.3. Familiarity
1.2.4. Similarity to Humans
1.2.5. Dangerousness
1.2.6. Cuteness
1.2.7. Capacity to Think and Capacity to Feel
1.2.8. Edibility
1.2.9. Acceptability to Kill for Human Consumption and Feelings of Care and Protection
1.3. The Current Study
2. Materials and Methods
2.1. Participants
2.2. Development of the Stimulus Set
2.3. Procedure and Measures
2.4. Statistical Analysis
3. Results
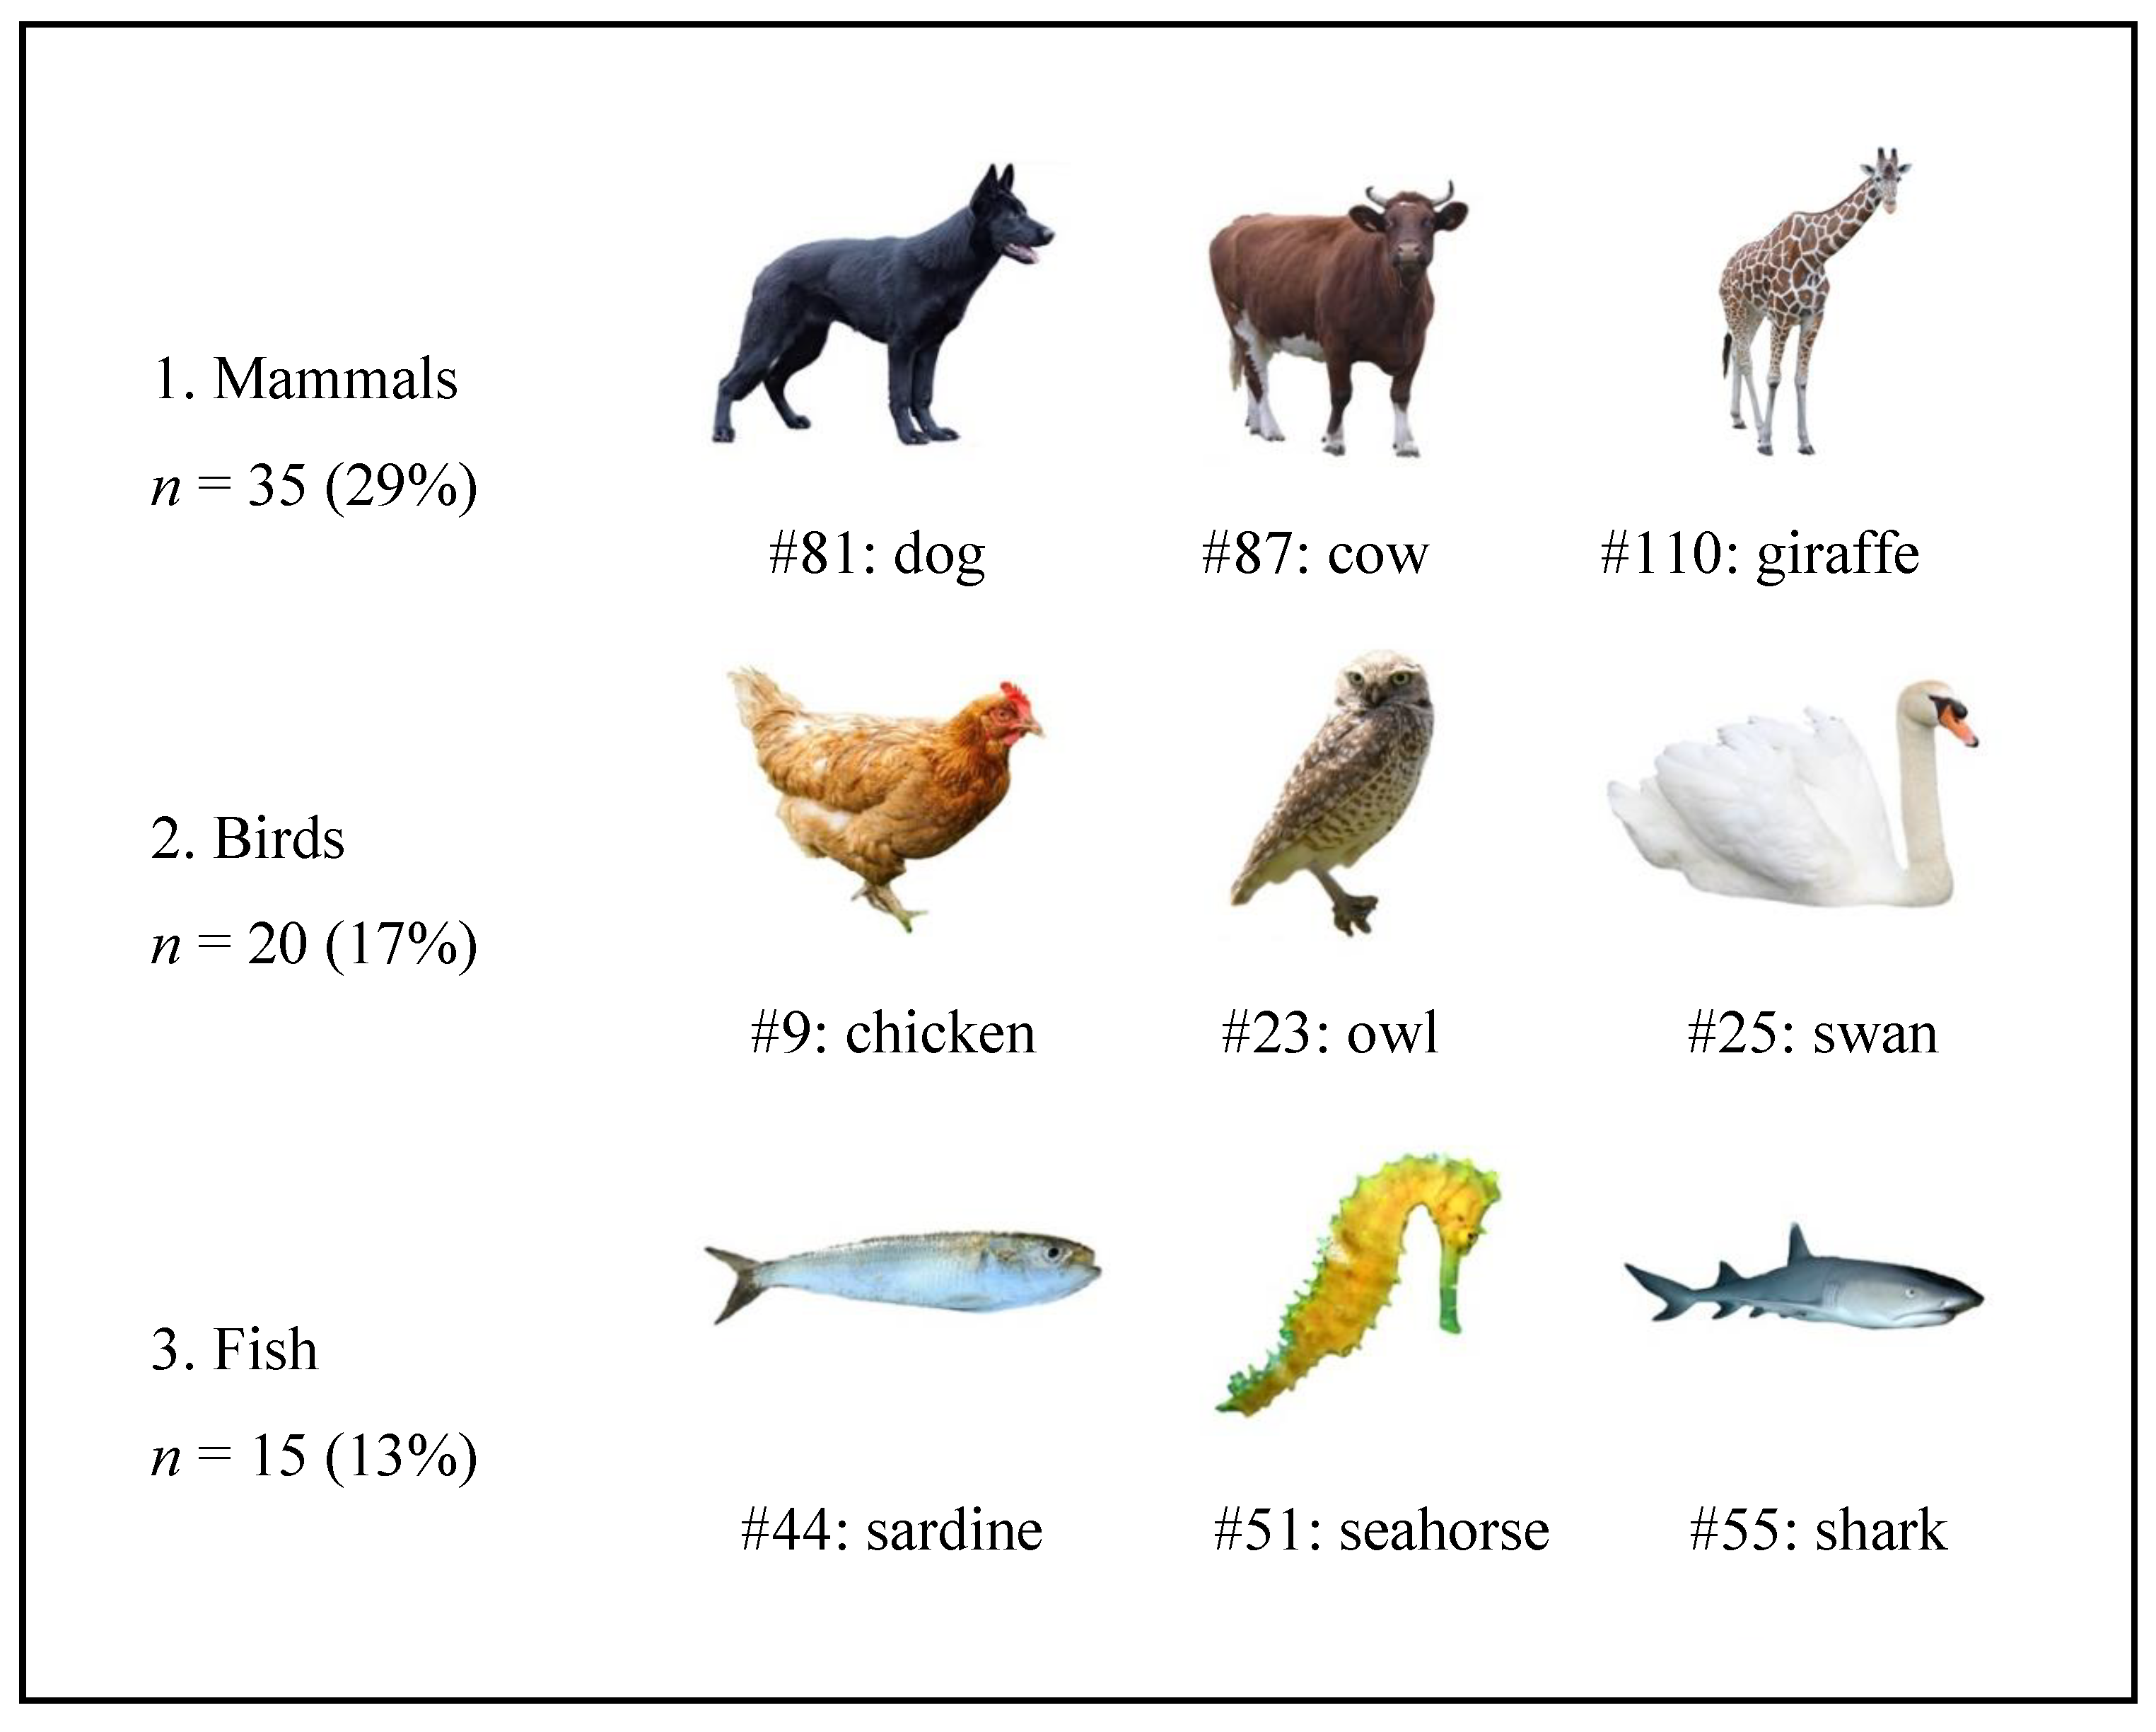
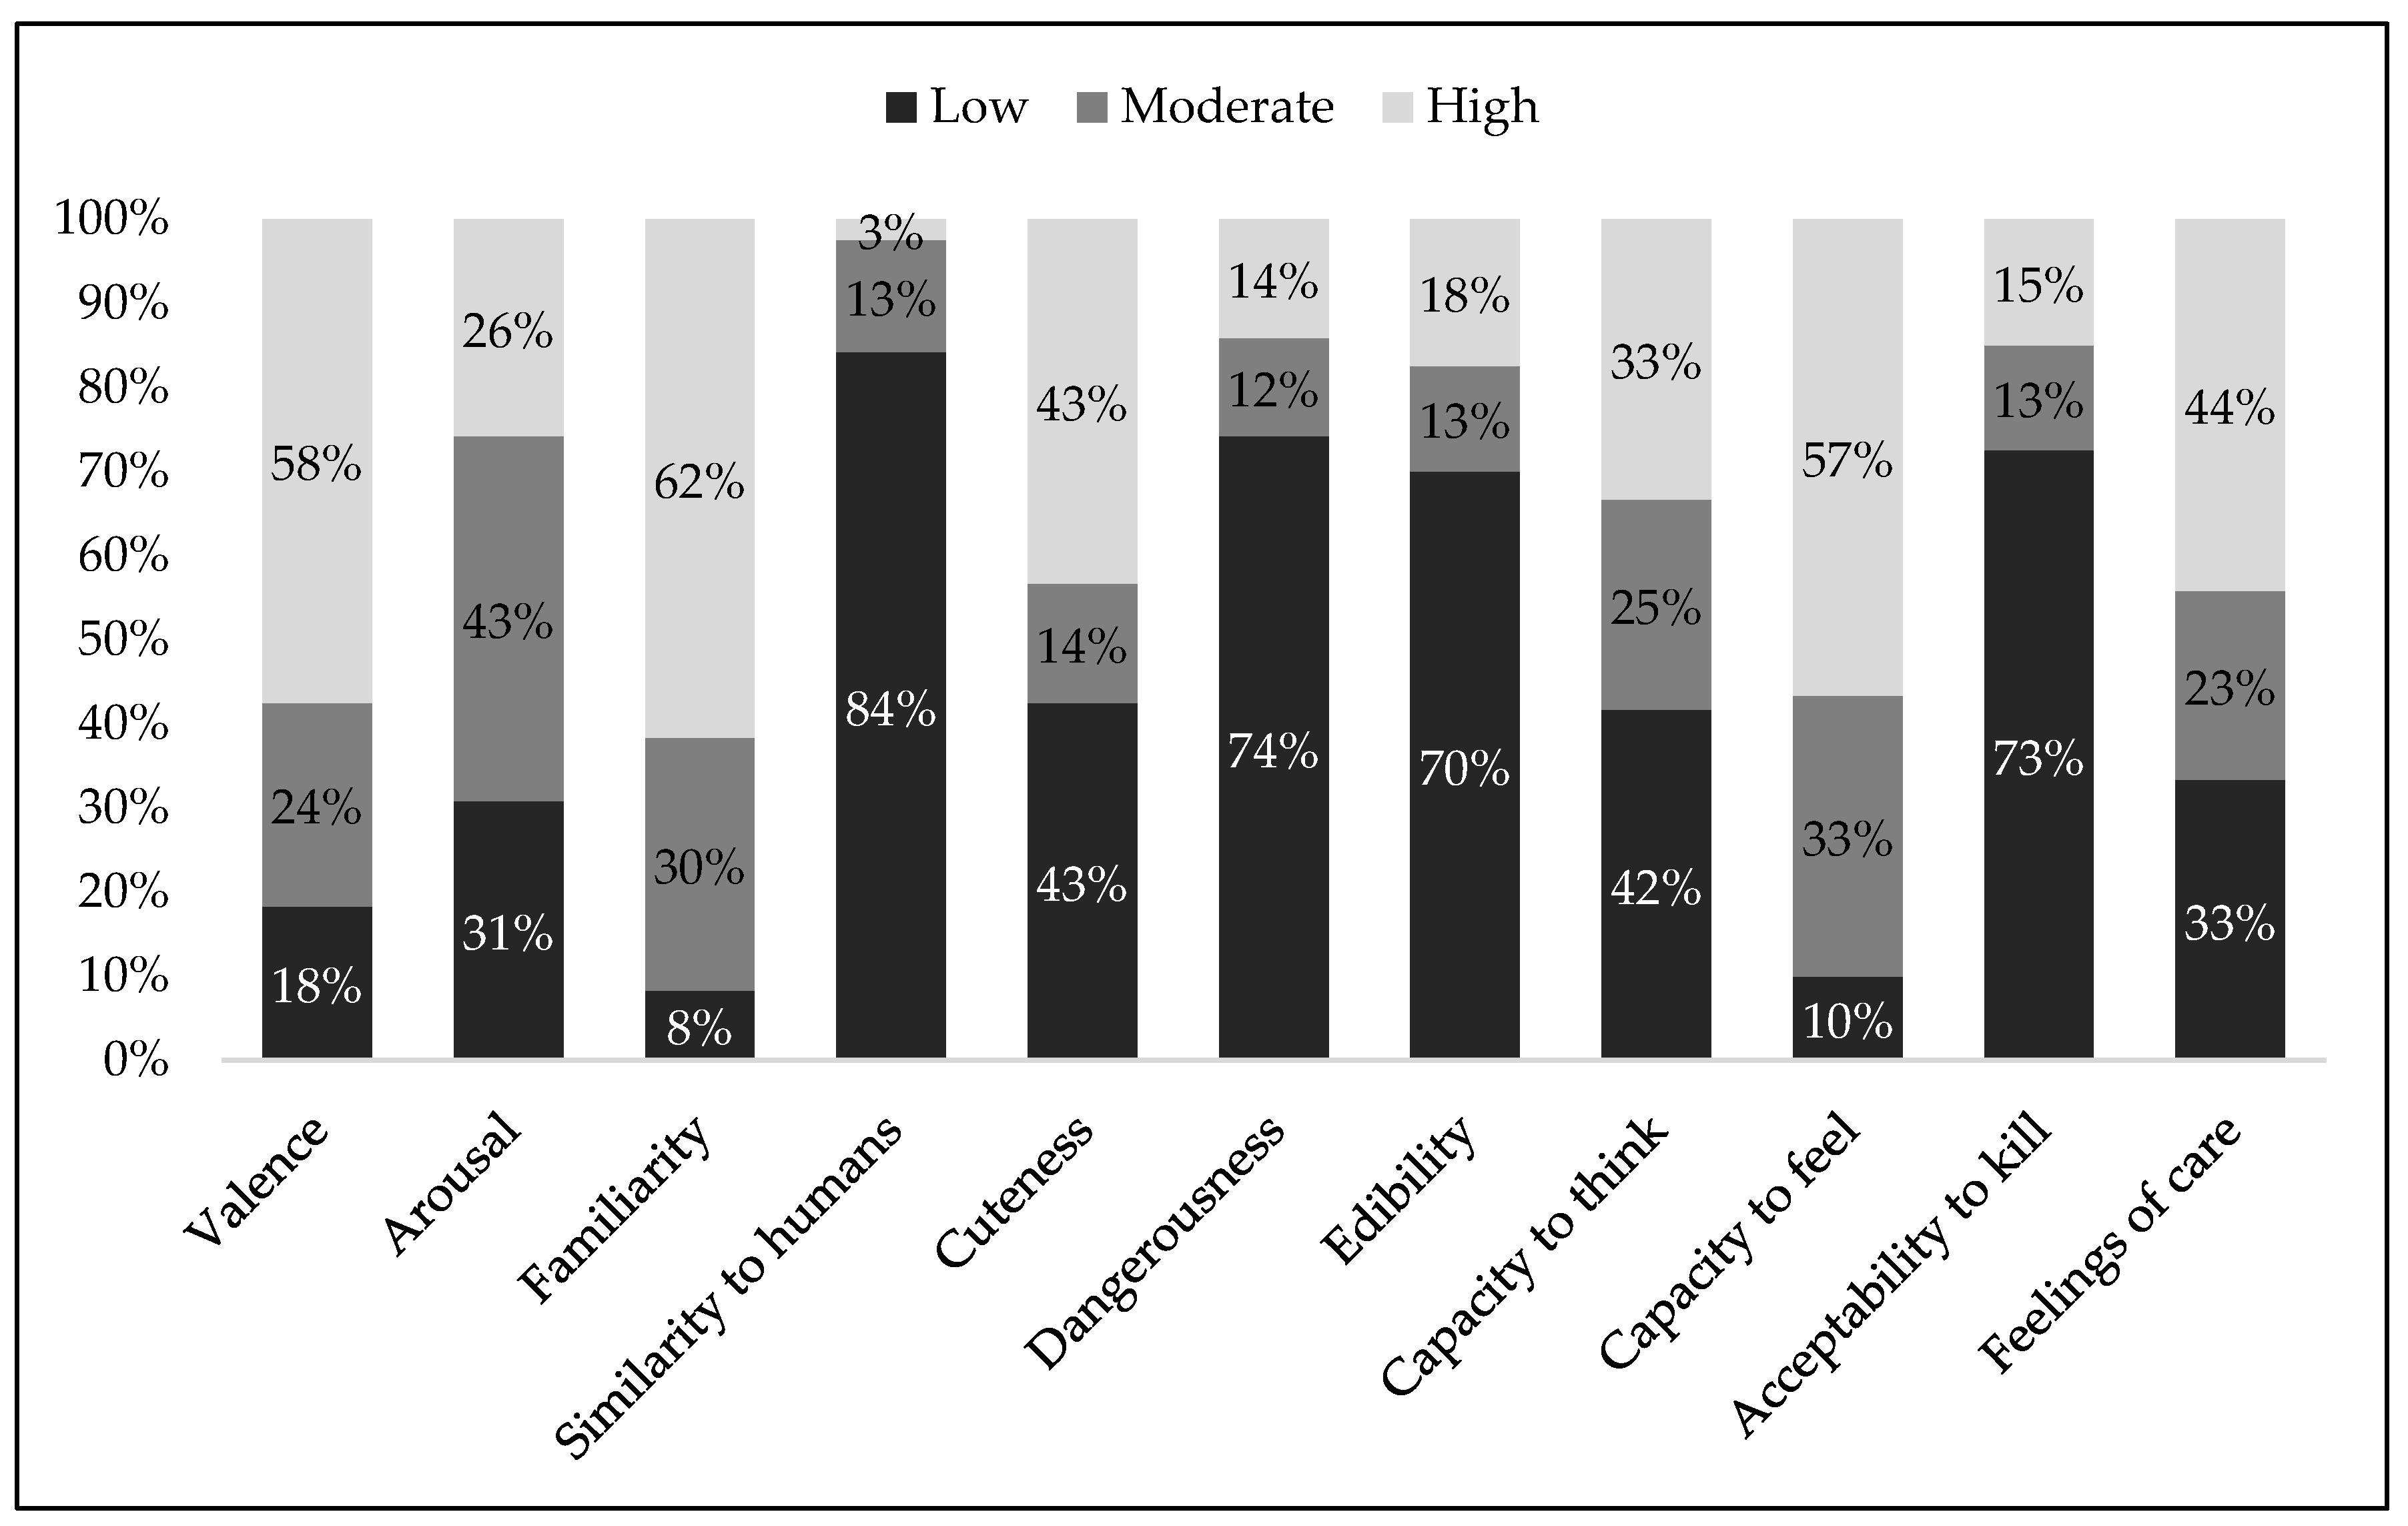
3.1. Frequency Distribution
3.2. Correlations between the Evaluative Dimensions
3.3. Differences in Ratings: Individual Characteristics
3.3.1. Gender
3.3.2. Age
3.3.3. Diet
3.3.4. Living Area
3.3.5. Companion Animal Ownership
3.4. Differences in Ratings: Animals’ Biological Categories
3.5. Evaluative Dimensions Predicting Moral Attitudes towards Animals
4. Discussion
4.1. Individual Differences in the Evaluation of Animals
4.2. Characteristics Predicting Moral Attitudes
4.3. Limitations and Future Directions
5. Conclusions
Supplementary Materials
Author Contributions
Funding
Conflicts of Interest
References
- Herzog, H. Some We Love, Some We Hate, Some We Eat: Why It’s So Hard to Think Straight About Animals; Harper Perennial: New York, NY, USA, 2010. [Google Scholar]
- Loughnan, S.; Bastian, B.; Haslam, N. The Psychology of Eating Animals. Curr. Dir. Psychol. Sci. 2014, 23, 104–108. [Google Scholar] [CrossRef]
- Mcdougall, S.J.P.; Curry, M.B.; de Bruijn, O. Measuring symbol and icon characteristics: Norms for concreteness, complexity, meaningfulness, familiarity, and semantic distance for 239 symbols. Behav. Res. Methods Instrum. Comput. 1999, 31, 487–519. [Google Scholar] [CrossRef]
- Prada, M.; Rodrigues, D.; Silva, R.R.; Garrido, M.V. Lisbon Symbol Database (LSD): Subjective norms for 600 symbols. Behav. Res. Methods 2016, 48, 1370–1382. [Google Scholar] [CrossRef] [PubMed]
- Rodrigues, D.; Prada, M.; Gaspar, R.; Garrido, M.V.; Lopes, D. Lisbon Emoji and Emoticon Database (LEED): Norms for emoji and emoticons in seven evaluative dimensions. Behav. Res. Methods 2018, 50, 392–405. [Google Scholar] [CrossRef] [PubMed]
- Lang, P.J.; Bradley, M.M.; Cuthbert, B.N. International Affective Picture System (IAPS): Affective Ratings of Pictures and Instruction Manual. Technical Report A-8; University of Florida: Gainesville, FL, USA, 2005. [Google Scholar]
- Blechert, J.; Meule, A.; Busch, N.A.; Ohla, K. Food-pics: An image database for experimental research on eating and appetite. Front. Psychol. 2014, 5. [Google Scholar] [CrossRef] [PubMed]
- Foroni, F.; Pergola, G.; Argiris, G.; Rumiati, R.I. The FoodCast research image database (FRIDa). Front. Hum. Neurosci. 2013, 7. [Google Scholar] [CrossRef] [PubMed]
- Prada, M.; Rodrigues, D.; Garrido, M.V.; Lopes, J. Food-pics-PT: Portuguese validation of food images in 10 subjective evaluative dimensions. Food Qual. Prefer. 2017, 61, 15–25. [Google Scholar] [CrossRef]
- Ebner, N.C.; Riediger, M.; Lindenberger, U. FACES-a database of facial expressions in young, middle-aged, and older women and men: Development and validation. Behav. Res. Methods 2010, 42, 351–362. [Google Scholar] [CrossRef]
- Garrido, M.V.; Lopes, D.; Prada, M.; Rodrigues, D.; Jerónimo, R.; Mourão, R.P. The many faces of a face: Comparing stills and videos of facial expressions in eight dimensions (SAVE database). Behav. Res. Methods 2017, 49, 1343–1360. [Google Scholar] [CrossRef]
- Janovcová, M.; Rádlová, S.; Polák, J.; Sedláčková, K.; Peléšková, Š.; Žampachová, B.; Frynta, D.; Landová, E. Human attitude toward reptiles: A relationship between fear, disgust, and aesthetic preferences. Animals 2019, 9, 238. [Google Scholar] [CrossRef]
- Kunst, J.R.; Hohle, S.M. Meat eaters by dissociation: How we present, prepare and talk about meat increases willingness to eat meat by reducing empathy and disgust. Appetite 2016, 105, 758–774. [Google Scholar] [CrossRef] [PubMed]
- Tian, Q.; Hilton, D.; Becker, M. Confronting the meat paradox in different cultural contexts: Reactions among Chinese and French participants. Appetite 2016, 96, 187–194. [Google Scholar] [CrossRef] [PubMed]
- Anderson, E.C.; Barrett, L.F. Affective beliefs influence the experience of eating meat. PLoS ONE 2016, 11, e0160424. [Google Scholar] [CrossRef] [PubMed]
- Piazza, J.; McLatchie, N.; Olesen, C. Are baby animals less appetizing? Tenderness toward baby animals and appetite for meat. Anthrozoos 2018, 31, 319–335. [Google Scholar] [CrossRef]
- Zickfeld, J.H.; Kunst, J.R.; Hohle, S.M. Too sweet to eat: Exploring the effects of cuteness on meat consumption. Appetite 2018, 120, 181–195. [Google Scholar] [CrossRef] [PubMed]
- Bastian, B.; Loughnan, S.; Haslam, N.; Radke, H.R.M. Don’t mind meat? the denial of mind to animals used for human consumption. Personal. Soc. Psychol. Bull. 2012, 38, 247–256. [Google Scholar] [CrossRef] [PubMed]
- Loughnan, S.; Haslam, N.; Bastian, B. The role of meat consumption in the denial of moral status and mind to meat animals. Appetite 2010, 55, 156–159. [Google Scholar] [CrossRef]
- Piazza, J.; Loughnan, S. When meat gets personal, animals’ minds matter less: Motivated use of intelligence information in judgments of moral standing. Soc. Psychol. Personal. Sci. 2016, 7, 867–874. [Google Scholar] [CrossRef]
- Borgi, M.; Cirulli, F. Attitudes toward animals among kindergarten children: Species preferences. Anthrozoos 2015, 28, 45–59. [Google Scholar] [CrossRef]
- Piazza, J.; Landy, J.F.; Goodwin, G.P. Cruel nature: Harmfulness as an important, overlooked dimension in judgments of moral standing. Cognition 2014, 131, 108–124. [Google Scholar] [CrossRef]
- Laham, S.M. Expanding the moral circle: Inclusion and exclusion mindsets and the circle of moral regard. J. Exp. Soc. Psychol. 2009, 45, 250–253. [Google Scholar] [CrossRef]
- Schuh, R.T.; Brower, A.V.Z. Biological Systematics. Principles and applications, 1st ed.; Cornell University Press: Ithaca, NY, USA, 2000. [Google Scholar]
- Czech, B.; Krausman, P.R.; Borkhataria, R. Social Construction, Political Power, and the Allocation of Benefits to Endangered Species. Conserv. Biol. 1998, 12, 1103–1112. [Google Scholar] [CrossRef]
- Batt, S. Human attitudes towards animals in relation to species similarity to humans: a multivariate approach. Biosci. Horizons 2009, 2, 180–190. [Google Scholar] [CrossRef]
- Colléony, A.; Clayton, S.; Couvet, D.; Saint Jalme, M.; Prévot, A.-C. Human preferences for species conservation: Animal charisma trumps endangered status. Biol. Conserv. 2017, 206, 263–269. [Google Scholar] [CrossRef]
- Amiot, C.E.; Lépine, O.; Zaky, J. Compartmentalization of animals: Toward an understanding of how we create cognitive distinctions between animals and their implications. Anal. Soc. Issues Public Policy 2019. [Google Scholar] [CrossRef]
- Driscoll, J.W. Attitudes toward Animals: Species ratings. Soc. Anim. 1995, 3, 139–150. [Google Scholar] [CrossRef]
- Herzog, H.A.; Betchart, N.S.; Pittman, R.B. Gender, sex role orientation, and attitudes toward animals. Anthrozoos 1991, 4, 184–191. [Google Scholar] [CrossRef]
- Herzog, H.; Grayson, S.; McCord, D. Brief measures of the animal attitude scale. Anthrozoos 2015, 28, 145–152. [Google Scholar] [CrossRef]
- Martens, P.; Hansart, C.; Su, B. Attitudes of young adults toward animals - The Case of high school students in Belgium and the Netherlands. Animals 2019, 9, 88. [Google Scholar] [CrossRef]
- Rothgerber, H. Real men don’t eat (vegetable) quiche: Masculinity and the justification of meat consumption. Psychol. Men Masc. 2013, 14, 363–375. [Google Scholar] [CrossRef]
- Ruby, M.B.; Heine, S.J. Meat, morals, and masculinity. Appetite 2011, 56, 447–450. [Google Scholar] [CrossRef] [PubMed]
- Graça, J.; Calheiros, M.M.; Oliveira, A. Attached to meat? (Un)Willingness and intentions to adopt a more plant-based diet. Appetite 2015, 95, 113–125. [Google Scholar] [CrossRef] [PubMed]
- Caviola, L.; Everett, J.A.C.; Faber, N.S. The moral standing of animals: Towards a psychology of speciesism. J. Pers. Soc. Psychol. 2018, 116, 1011–1029. [Google Scholar] [CrossRef] [PubMed]
- Bilewicz, M.; Imhoff, R.; Drogosz, M. The humanity of what we eat: Conceptions of human uniqueness among vegetarians and omnivores. Eur. J. Soc. Psychol. 2011, 41, 201–209. [Google Scholar] [CrossRef]
- Marsa-Sambola, F.; Muldoon, J.; Williams, J.; Lawrence, A.; Connor, M.; Currie, C. The short attachment to pets scale (SAPS) for children and young people: Development, psychometric qualities and demographic and health associations. Child Indic. Res. 2016, 9, 111–131. [Google Scholar] [CrossRef]
- Rothgerber, H.; Mican, F. Childhood pet ownership, attachment to pets, and subsequent meat avoidance. The mediating role of empathy toward animals. Appetite 2014, 79, 11–17. [Google Scholar] [CrossRef]
- Grandgeorge, M.; Hausberger, M. Human-animal relationships: from daily life to animal-assisted therapies. Ann. Ist. Super. Sanita 2011, 47, 397–408. [Google Scholar]
- Frijda, N.H.; Scherer, K.R. Emotion definitions (psychological perspectives). In The Oxford Companion to Emotion and the Affective Sciences; Sander, D., Scherer, K.R., Eds.; Oxford University Press: Oxford, UK, 2009; pp. 142–144. [Google Scholar]
- Charland, L. The heat of emotion: Valence and the demarcation problem. J. Conscious. Stud. 2005, 12, 82–102. [Google Scholar]
- Prada, M.; Fonseca, R.; Garcia-Marques, T.; Fernandes, A. Se correr o bicho pega Normas de avaliação de imagens de animais negativos. Laboratório Psicol. 2014, 12. [Google Scholar] [CrossRef]
- Dan-Glauser, E.S.; Scherer, K.R. The Geneva affective picture database (GAPED): A new 730-picture database focusing on valence and normative significance. Behav. Res. Methods 2011, 43, 468–477. [Google Scholar] [CrossRef]
- Kellert, S.R. The value of life: Biological diversity and human society; Island Press: Washington, DC, USA, 1996. [Google Scholar]
- Kidd, A.H.; Kidd, R.M. Seeking a theory of the human/companion animal bond. Anthrozoos 1987, 1, 140–145. [Google Scholar] [CrossRef]
- Osgood, C.E.; Suci, G.J.; Tannenbaum, P.H. The Measurement of Meaning; Univer. Illinois Press: Oxford, UK, 1957. [Google Scholar]
- Kurdi, B.; Lozano, S.; Banaji, M.R. Introducing the open affective standardized image set (OASIS). Behav. Res. Methods 2017, 49, 457–470. [Google Scholar] [CrossRef] [PubMed]
- Brosch, T.; Sander, D.; Scherer, K.R. That baby caught my eye... Attention capture by infant faces. Emotion 2007, 7, 685–689. [Google Scholar] [CrossRef] [PubMed]
- Portugal é um País Pet-Friendly. Estudo GfKTrack.2PETs. Available online: http://www.gfk.com/pt/insights/press-release/portugal-e-um-pais-petfriendly/ (accessed on 10 January 2019).
- Serpell, J.A. Factors influencing human attitudes to animals and their welfare. Anim. Welf. 2004, 13, 145–151. [Google Scholar]
- Plous, S. Psychological mechanisms in the human use of animals. J. Soc. Issues 1993, 49, 11–52. [Google Scholar] [CrossRef]
- Tisdell, C.; Wilson, C.; Swarna Nantha, H. Public choice of species for the “Ark”: Phylogenetic similarity and preferred wildlife species for survival. J. Nat. Conserv. 2006, 14, 97–105. [Google Scholar] [CrossRef]
- Knight, A.J. “Bats, snakes and spiders, oh my!” How aesthetic and negativistic attitudes, and other concepts predict support for species protection. J. Environ. Psychol. 2008, 28, 94–103. [Google Scholar] [CrossRef]
- Purkis, H.M.; Lipp, O.V. Are snakes and spiders special? Acquisition of negative valence and modified attentional processing by non-fear-relevant animal stimuli. Cogn. Emot. 2009, 23, 430–452. [Google Scholar] [CrossRef]
- Shuman, V.; Sander, D.; Scherer, K.R. Levels of valence. Front. Psychol. 2013, 4, 261. [Google Scholar] [CrossRef]
- Lorenz, K. Innate forms of potential experience. Z. Tierpsychol. 1943, 5, 235–409. [Google Scholar] [CrossRef]
- Glocker, M.L.; Langleben, D.D.; Ruparel, K.; Loughead, J.W.; Gur, R.C.; Sachser, N. Baby schema in infant faces induces cuteness perception and motivation for caretaking in adults. Ethology 2009, 115, 257–263. [Google Scholar] [CrossRef] [PubMed]
- Lobmaier, J.S.; Sprengelmeyer, R.; Wiffen, B.; Perrett, D.I. Female and male responses to cuteness, age and emotion in infant faces. Evol. Hum. Behav. 2010, 31, 16–21. [Google Scholar] [CrossRef]
- Weiss, E.; Miller, K.; Mohan-Gibbons, H.; Vela, C. Why did you choose this pet? Adopters and pet selection preferences in five animal shelters in the United States. Animals 2012, 2, 144–159. [Google Scholar] [CrossRef] [PubMed]
- Huddy, L.; Gunnthorsdottir, A.H. The persuasive effects of emotive visual imagery: Superficial manipulation or the product of passionate reason? Polit. Psychol. 2000, 21, 745–778. [Google Scholar] [CrossRef]
- Miesler, L.; Leder, H.; Herrmann, A. Isn’t it cute: An evolutionary perspective of baby-schema effects in visual product designs. Int. J. Des. 2011, 5, 17–30. [Google Scholar]
- Gray, H.M.; Gray, K.; Wegner, D.M. Dimensions of mind perception. Science (80-. ). 2007, 315, 619. [Google Scholar] [CrossRef] [PubMed]
- Piazza, J.; Ruby, M.B.; Loughnan, S.; Luong, M.; Kulik, J.; Watkins, H.M.; Seigerman, M. Rationalizing meat consumption. The 4Ns. Appetite 2015, 91, 114–128. [Google Scholar] [CrossRef] [PubMed]
- Morris, P.; Knight, S.; Lesley, S. Belief in animal mind: Does familiarity with animals influence beliefs about animal emotions? Soc. Anim. 2012, 20, 211–224. [Google Scholar] [CrossRef]
- Bratanova, B.; Loughnan, S.; Bastian, B. The effect of categorization as food on the perceived moral standing of animals. Appetite 2011, 57, 193–196. [Google Scholar] [CrossRef]
- Fallon, A.E.; Rozin, P. The psychological bases of food rejections by humans. Ecol. Food Nutr. 1983, 13, 15–26. [Google Scholar] [CrossRef]
- Hoffman, L.C.; Cawthorn, D.M. What is the role and contribution of meat from wildlife in providing high quality protein for consumption? Anim. Front. 2012, 2, 40–53. [Google Scholar] [CrossRef]
- Drury, R. Hungry for success: Urban consumer demand for wild animal products in Vietnam. Conserv. Soc. 2011, 9, 247. [Google Scholar] [CrossRef]
- Prada, M.; Garrido, M.V.; Camilo, C.; Rodrigues, D.L. Subjective ratings and emotional recognition of children’s facial expressions from the CAFE set. PLoS ONE 2018, 13, e0209644. [Google Scholar] [CrossRef] [PubMed]
- Borgi, M.; Cirulli, F. Pet Face: Mechanisms underlying human-animal relationships. Front. Psychol. 2016, 7. [Google Scholar] [CrossRef]
- Evans, J.D. Straightforward Statistics for the Behavioral Sciences; Brooks/Cole Pub. Co.: Pacific Grove, CA, USA, 1996. [Google Scholar]
- Bastian, B.; Loughnan, S. Resolving the meat-paradox: A motivational account of morally troublesome behavior and its maintenance. Personal. Soc. Psychol. Rev. 2017, 21, 278–299. [Google Scholar] [CrossRef] [PubMed]
- Loughnan, S.; Piazza, J. Thinking morally about animals. In Atlas of moral psychology; The Guilford Press: New York, NY, USA, 2018; pp. 165–174. [Google Scholar]
- Colman, A.M.; Best, W.M.; Austen, A.J. Familiarity and liking: Direct tests of the preference -feedback hypothesis. Psychol. Rep. 2011, 58, 931–938. [Google Scholar] [CrossRef]
- Sherman, G.D.; Haidt, J. Cuteness and disgust: The humanizing and dehumanizing effects of emotion. Emot. Rev. 2011, 3, 245–251. [Google Scholar] [CrossRef]
- Thorn, P.; Howell, T.J.; Brown, C.; Bennett, P.C. The canine cuteness effect: Owner-perceived cuteness as a predictor of human–dog relationship quality. Anthrozoos 2015, 28, 569–585. [Google Scholar] [CrossRef]
- Allen, M.W.; Hunstone, M.; Waerstad, J.; Foy, E.; Hobbins, T.; Wikner, B.; Wirrel, J. Human-to-animal similarity and participant mood influence punishment recommendations for animal abusers. Soc. Anim. 2002, 10, 267–284. [Google Scholar]
- Alvarez, L.; Jaffe, K. Narcissism guides mate selection: Humans mate assortatively, as revealed by facial resemblance, following an algorithm of “self seeking like.”. Evol. Psychol. 2004, 2, 177–194. [Google Scholar] [CrossRef]
- Balliet, D.; Wu, J.; De Dreu, C.K.W. Ingroup favoritism in cooperation: A meta-analysis. Psychol. Bull. 2014, 140, 1556–1581. [Google Scholar] [CrossRef] [PubMed]
- Everett, J.A.C.; Faber, N.S.; Crockett, M. Preferences and beliefs in ingroup favoritism. Front. Behav. Neurosci. 2015, 9. [Google Scholar] [CrossRef] [PubMed]
- Stephan, W.G.; Finlay, K. The role of empathy in improving intergroup relations. J. Soc. Issues 1999, 55, 729–743. [Google Scholar] [CrossRef]
- Child, K.R.; Darimont, C.T. Hunting for trophies: Online hunting photographs reveal achievement satisfaction with large and dangerous prey. Hum. Dimens. Wildl. 2015, 20, 531–541. [Google Scholar] [CrossRef]
- Knight, S.; Vrij, A.; Cherryman, J.; Nunkoosing, K. Attitudes towards animal use and animal mind. Anthrozoos 2004, 17, 43–62. [Google Scholar] [CrossRef]
- Graça, J.; Calheiros, M.M.; Oliveira, A.; Milfont, T.L. Why are women less likely to support animal exploitation than men? The mediating roles of social dominance orientation and empathy. Pers. Individ. Dif. 2018, 129, 66–69. [Google Scholar] [CrossRef]
- Kubberød, E.; Ueland, Ø.; Rødbotten, M.; Westad, F.; Risvik, E. Gender specific preferences and attitudes towards meat. Food Qual. Prefer. 2002, 13, 285–294. [Google Scholar] [CrossRef]
- Schösler, H.; de Boer, J.; Boersema, J.J.; Aiking, H. Meat and masculinity among young Chinese, Turkish and Dutch adults in the Netherlands. Appetite 2015, 89, 152–159. [Google Scholar] [CrossRef] [PubMed]
- Auger, B.; Amiot, C.E. Testing the roles of intergroup anxiety and inclusion of animals in the self as mechanisms that underpin the “pets as ambassadors” effect. Anthrozoos 2019, 32, 5–21. [Google Scholar] [CrossRef]
- Cowan, D.G.; Vanman, E.J.; Nielsen, M. Motivated empathy: The mechanics of the empathic gaze. Cogn. Emot. 2014, 28, 1522–1530. [Google Scholar] [CrossRef] [PubMed]
- Hall, J.K.; Hutton, S.B.; Morgan, M.J. Sex differences in scanning faces: Does attention to the eyes explain female superiority in facial expression recognition? Cogn. Emot. 2010, 24, 629–637. [Google Scholar] [CrossRef]


| Dimension | Instruction: Indicate to What Extent | Scale |
|---|---|---|
| 1. Valence (e.g., [8]) | … this animal is negative or positive. | 1 = Very negative to 7 = Very positive |
| 2. Arousal (e.g., [8]) | … this animal makes you feel activated or excited. | 1 = Does notat allmake me feelactivatedto 7 = Makes me feel very activated |
| 3. Familiarity (e.g., [8]) | … this animal is familiar. | 1 = Notat allfamiliar to 7 = Extremely familiar |
| 4. Similarity to humans [51,53] | … this animal is similar to humans. | 1 = Notat allsimilar to humansto 7 = Extremely similar to humans |
| 5. Cuteness [16,71] | … this animal is cute. | 1 = Notat allcute to 7 = Extremely cute |
| 6. Dangerousness [22] | … this animal is dangerous or harmful to humans. | 1 = Notat alldangerous to 7 = Extremely dangerous |
| 7. Edibility [18] | … youfind meat from this animaledible. | 1 = Not at alledibleto 7 = Extremelyedible |
| 8. Capacity to think [18] | … this animal has cognitive capacities, such as thought, imagination and memory. | 1 =Not at all capable of thinking, imagining, remembering to 7 = Very capableof thinking, imagining, remembering |
| 9. Capacity to feel [18] | … this animal is capable of feeling and experiencing sensations, such as pleasure and pain. | 1 = Notat allcapable of experiencing sensations, such as pleasure and pain.to 7 = Very capable of experiencing sensations, such as pleasure and pain. |
| 10. Acceptability to kill for human consumption [18] | … it isacceptable or unacceptable to kill this animal for human consumption | 1 = Completely unacceptable to kill the animal for human consumption to 7 = Completely acceptable to kill the animal for human consumption. |
| 11. Feelings of care and protection [22] | … you desire to care for or protect this animal. | 1 = I do not at all desire to care for/protect the animal to 7 = I strongly desire to care for/protect the animal |
| 1 | 2 | 3 | 4 | 5 | 6 | 7 | 8 | 9 | 10 | |
|---|---|---|---|---|---|---|---|---|---|---|
| 1. Valence | - | |||||||||
| 2. Arousal | 0.59 *** | - | ||||||||
| 3. Familiarity | 0.46 *** | 0.42 *** | - | |||||||
| 4. Similarity to humans | 0.26 *** | 0.39 *** | 0.14 *** | - | ||||||
| 5. Cuteness | 0.67 *** | 0.61 *** | 0.39 *** | 0.39 *** | - | |||||
| 6. Dangerousness | −0.25 *** | 0.01 | −0.16 *** | 0.10 ** | −0.10 ** | - | ||||
| 7. Edibility | −0.04 | 0.02 | 0.07 | 0.08 | −0.03 | 0.23 *** | - | |||
| 8. Capacity to feel | 0.50 *** | 0.48 *** | 0.31 *** | 0.28 *** | 0.45 *** | −0.06 | −0.05 | - | ||
| 9. Capacity to think | 0.45 *** | 0.52 *** | 0.22 *** | 0.48 *** | 0.48 *** | 0.01 | −0.07 | 0.66 *** | - | |
| 10. Acceptability to kill | −0.14 *** | −0.10 ** | 0.04 | 0.03 | −0.15 *** | 0.19 *** | 0.83 *** | −0.16 *** | 0.17 *** | - |
| 11. Feelings of care | 0.63 *** | 0.59 *** | 0.32 *** | 0.34 *** | 0.72 *** | −0.14 *** | −0.12 *** | 0.44 *** | 0.47 *** | 0.28 *** |
| Full Sample (n = 509) | Men (n = 228) | Women (n = 281) | ||||
|---|---|---|---|---|---|---|
| M | (SD) | M | SD | M | SD | |
| Valence | 4.43 * | (0.96) | 4.35 a | (0.93) | 4.51 a | (0.99) |
| Arousal | 3.90 * | (1.10) | 3.88 a | (1.02) | 3.91 a | (1.17) |
| Familiarity | 4.73 * | (1.31) | 4.60 a | (1.31) | 4.84 b | (1.29) |
| Similarity to humans | 2.51 * | (1.08) | 2.54 a | (1.00) | 2.49 a | (1.14) |
| Cuteness | 4.02 | (1.05) | 3.98 a | (0.99) | 4.06 a | (1.09) |
| Dangerousness | 3.09 * | (0.82) | 3.12 a | (0.82) | 3.08 a | (0.82) |
| Edibility | 2.99 * | (1.28) | 3.37 a | (1.32) | 2.69 b | (1.15) |
| Capacity to feel | 4.76 * | (1.33) | 4.58 a | (1.32) | 4.90 b | (1.32) |
| Capacity to think | 3.97 | (1.31) | 3.94 a | (1.17) | 3.99 a | (1.42) |
| Acceptability to kill | 2.93 * | (1.36) | 3.29 a | (1.44) | 2.63 b | (1.21) |
| Feelings of care | 4.17 * | (1.30) | 4.15 a | (1.18) | 4.18 a | (1.39) |
| Omnivores (n = 394) | Restricted Omnivores (n = 55) | Meat Avoiders (n = 35) | ||||
|---|---|---|---|---|---|---|
| M | SD | M | SD | M | SD | |
| Valence | 4.36 a | (0.86) | 4.58 a | (1.11) | 5.25 b | (1.09) |
| Arousal | 3.83 a | (1.06) | 3.96 a | (0.92) | 4.86 b | (1.11) |
| Familiarity | 4.74 a | (1.30) | 4.62 a | (1.35) | 5.22 a | (1.14) |
| Similarity to humans | 2.41 a | (0.99) | 2.54 a | (1.07) | 3.20 b | (1.39) |
| Cuteness | 3.94 a | (0.97) | 4.11 a | (1.15) | 4.69 b | (1.26) |
| Dangerousness | 3.14 a | (0.80) | 2.95 a,b | (0.83) | 2.58 b | (0.80) |
| Edibility | 3.11 a | (1.25) | 2.95 a | (1.19) | 2.02 b | (1.29) |
| Capacity to feel | 4.72 a | (1.30) | 4.73 a | (1.40) | 5.63 b | (1.29) |
| Capacity to think | 3.90 a | (1.29) | 3.88 a | (1.14) | 4.87 b | (1.43) |
| Acceptability to kill | 3.11 a | (1.35) | 2.64 b | (1.00) | 1.60 c | (1.06) |
| Feelings of care | 4.02 a | (1.20) | 4.49 b | (1.40) | 5.42 c | (1.28) |
| Current Companion Animal Ownership | ||||
|---|---|---|---|---|
| No (n = 142) | Yes (n = 366) | |||
| M | SD | M | SD | |
| Valence | 4.29 a | (0.82) | 4.49 a | (1.01) |
| Arousal | 3.68 a | (1.01) | 3.98 b | (1.13) |
| Familiarity | 4.75 a | (1.38) | 4.73 a | (1.28) |
| Similarity to humans | 2.48 a | (1.06) | 2.52 a | (1.09) |
| Cuteness | 3.79 a | (0.97) | 4.11 b | (1.06) |
| Dangerousness | 3.26 a | (0.82) | 3.03 b | (0.81) |
| Edibility | 3.22 a | (1.24) | 2.90 b | (1.28) |
| Capacity to feel | 4.51 a | (1.23) | 4.86 b | (1.36) |
| Capacity to think | 3.67 a | (1.13) | 4.08 b | (1.36) |
| Acceptability to kill | 3.20 a | (1.34) | 2.82 a | (1.35) |
| Feelings of care | 3.86 a | (1.18) | 4.29 b | (1.32) |
| Companion Animal Ownership in Childhood | ||||
|---|---|---|---|---|
| No (n = 64) | Yes (n = 444) | |||
| M | SD | M | SD | |
| Valence | 4.17 a | (0.84) | 4.47 b | (0.98) |
| Arousal | 3.57 a | (1.05) | 3.95 b | (1.11) |
| Familiarity | 4.63 a | (1.43) | 4.75 a | (1.29) |
| Similarity to humans | 2.45 a | (1.11) | 2.52 a | (1.06) |
| Cuteness | 3.65 a | (0.95) | 4.08 b | (1.05) |
| Dangerousness | 3.24 a | (0.70) | 3.07 a | (0.84) |
| Edibility | 3.19 a | (1.25) | 2.96 a | (1.28) |
| Capacity to feel | 4.59 a | (1.22) | 4.78 a | (1.35) |
| Capacity to think | 3.62 a | (1.32) | 4.02 b | (1.31) |
| Acceptability to kill | 3.18 a | (1.41) | 2.89 a | (1.34) |
| Feelings of care | 3.72 a | (1.22) | 4.23 b | (1.30) |
| Dimensions | Animal Category | ||||||||||||
|---|---|---|---|---|---|---|---|---|---|---|---|---|---|
| Amphibians | Arachnids | Birds | Bivalves | Cephalopods | Clitellates | Gastropods | Insects | Malacostrans | Mammals | Fish | Reptiles | F *** | |
| M (SD) | M (SD) | M (SD) | M (SD) | M (SD) | M (SD) | M (SD) | M (SD) | M (SD) | M (SD) | M (SD) | M (SD) | ||
| Valence | 3.43 | 2.65 | 4.73 | 4.23 | 4.29 | 2.76 | 4.10 | 3.49 | 3.99 | 5.27 | 4.49 | 3.95 | F(8.35,409.29) = 69.35, |
| (0.47) | (0.26) | (0.61) | (0.38) | (0.23) | (0.19) | (0.45) | (1.04) | (0.46) | (0.57) | (0.59) | (1.34) | ηp2 = 0.59 | |
| Arousal | 3.33 | 3.48 | 4.03 | 2.76 | 3.58 | 2.71 | 2.84 | 3.43 | 3.30 | 4.75 | 3.67 | 4.01 | F(7.25,355.30) = 24.77, |
| (0.47) | (0.30) | (0.39) | (0.13) | (0.40) | (0.13) | (0.47) | (0.52) | (0.52) | (0.54) | (0.41) | (0.38) | ηp2 = 0.34 | |
| Familiarity | 3.84 | 3.95 | 5.07 | 4.18 | 3.97 | 2.89 | 4.44 | 4.54 | 3.82 | 5.41 | 4.48 | 4.56 | F(8.28,405.51) = 28.52, |
| (0.46) | (0.79) | (0.55) | (0.79) | (0.91) | (0.64) | (0.98) | (0.61) | (1.16) | (0.59) | (0.69) | (0.55) | ηp2 = 0.37 | |
| Cuteness | 2.94 | 2.01 | 4.62 | 2.30 | 3.62 | 1.87 | 2.71 | 2.72 | 2.78 | 5.50 | 3.80 | 3.67 | F(9.34,457.55) = 125.56, |
| (0.82) | (0.07) | (0.94) | (0.34) | (0.44) | (0.04) | (0.71) | (1.27) | (0.39) | (0.79) | (1.07) | (1.28) | ηp2 = 0.72 | |
| Similarity humans | 1.76 | 1.76 | 2.56 | 1.43 | 2.10 | 1.50 | 1.59 | 1.71 | 1.70 | 3.72 | 2.15 | 2.17 | F(8.38,410.61) = 69.38 |
| (0.21) | (0.11) | (0.38) | (0.15) | (0.24) | (0.00) | (0.26) | (0.24) | (0.07) | (0.86) | (0.22) | (0.37) | ηp2 = 0.59 | |
| Dangerousness | 3.59 | 5.32 | 2.81 | 1.60 | 3.24 | 3.01 | 1.58 | 2.85 | 2.83 | 3.62 | 2.59 | 4.03 | F(6.45,316.15) = 120.40, |
| (0.56) | (0.46) | (0.74) | (0.30) | (0.56) | (0.32) | (0.22) | (1.15) | (0.65) | (1.25) | (1.24) | (2.08) | ηp2 = 0.71 | |
| Edibility | 1.85 | 1.93 | 3.10 | 4.38 | 4.19 | 1.61 | 3.66 | 1.82 | 4.12 | 2.71 | 4.20 | 2.21 | F(9.06,443.98) = 103.15, |
| (0.25) | (0.09) | (1.09) | (0.91) | (0.79) | (0.04) | (0.97) | (0.35) | (1.63) | (1.27) | (1.45) | (0.71) | ηp2 = 0.68 | |
| Capacity to think | 3.08 | 3.10 | 4.37 | 2.17 | 3.78 | 2.52 | 2.66 | 2.95 | 3.07 | 5.26 | 3.46 | 4.16 | F(7.65,374.80) = 64.25, |
| (0.49) | (0.12) | (0.41) | (0.25) | (0.69) | (0.06) | (0.44) | (0.36) | (0.08) | (0.58) | (0.45) | (0.40) | ηp2 = 0.57 | |
| Capacity to feel | 4.17 | 3.89 | 5.26 | 2.85 | 4.49 | 3.28 | 3.60 | 3.85 | 3.98 | 5.83 | 4.41 | 4.86 | F(8.12,397.68) = 49.70, |
| (0.42) | (0.31) | (0.27) | (0.31) | (0.50) | (0.0) | (0.50) | (0.42) | (0.15) | (0.43) | (0.39) | (0.59) | ηp2 = 0.50 | |
| Acceptability kill | 2.09 | 2.52 | 2.96 | 4.39 | 3.94 | 2.35 | 3.87 | 2.38 | 3.98 | 2.38 | 3.83 | 2.21 | F(7.88,385.95) = 47.241 |
| (0.17) | (0.17) | (0.90) | (0.69) | (0.67) | (0.36) | (0.68) | (0.29) | (1.14) | (1.07) | (1.20) | (0.66) | ηp2 = 0.49 | |
| Feelings of care | 3.20 | 2.44 | 4.65 | 2.89 | 3.72 | 2.45 | 3.23 | 3.0 | 3.32 | 5.34 | 4.07 | 4.0 | F(8.79,439.64) = 59.00, |
| (0.54) | (0.13) | (0.63) | (0.18) | (0.27) | (0.24) | (0.33) | (0.97) | (0.29) | (0.62) | (0.52) | (1.12) | ηp2 = 0.55 | |
© 2019 by the authors. Licensee MDPI, Basel, Switzerland. This article is an open access article distributed under the terms and conditions of the Creative Commons Attribution (CC BY) license (http://creativecommons.org/licenses/by/4.0/).
Share and Cite
Possidónio, C.; Graça, J.; Piazza, J.; Prada, M. Animal Images Database: Validation of 120 Images for Human-Animal Studies. Animals 2019, 9, 475. https://doi.org/10.3390/ani9080475
Possidónio C, Graça J, Piazza J, Prada M. Animal Images Database: Validation of 120 Images for Human-Animal Studies. Animals. 2019; 9(8):475. https://doi.org/10.3390/ani9080475
Chicago/Turabian StylePossidónio, Catarina, João Graça, Jared Piazza, and Marília Prada. 2019. "Animal Images Database: Validation of 120 Images for Human-Animal Studies" Animals 9, no. 8: 475. https://doi.org/10.3390/ani9080475
APA StylePossidónio, C., Graça, J., Piazza, J., & Prada, M. (2019). Animal Images Database: Validation of 120 Images for Human-Animal Studies. Animals, 9(8), 475. https://doi.org/10.3390/ani9080475